Characterization of Ultrasonic-Assisted Electrochemical Deposition of Ni-Co-ZrO2

School of Materials & Metallurgy, University of Science and Technology Liaoning, Anshan 114051, China
*
Author to whom correspondence should be addressed.
Coatings 2018, 8(6), 211; https://doi.org/10.3390/coatings8060211
Submission received: 18 April 2018
/
Revised: 18 May 2018
/
Accepted: 28 May 2018
/
Published: 1 June 2018
Abstract
:In order to evaluate the electrochemical behavior of nano-ZrO2 particles in the co-deposition process, revealing the electrocrystallization mechanism and electrodeposition parameters of composite coatings, cyclic voltammetry (CV), chronoamperometry (CA), and electrochemical impedance spectroscopy (EIS) techniques were used to offer a favorable reference for electrochemical studies in an acidic amino sulfonate bath, and the kinetic parameters were calculated by fitting the experimental curves. The CV results suggested that the co-deposition of nano-ZrO2 particles and matrix metal caused the initial deposition potential of Ni2+ and Co2+ to shift to more positive values (−0.80 V vs SCE) while the nano-ZrO2 inhibited the reduction of H+ and decreased the cathodic polarization in co-deposition. The electrocrystallization of Ni-Co and Ni-Co-ZrO2 sedimentary layer were governed by the Scharifker–Hill instantaneous nucleation model, and the nucleation rate of composite coatings was higher at potentials ranging from −1.10 to −1.15 V, and nano-ZrO2 absorbed on an electrode surface promoted the nucleation/growth of Ni2+ and Co2+. However, nano-ZrO2 particles hindered the nucleation/growth of Ni2+ and Co2+ at −1.20 and −1.25 V vs. SCE; the calculated results were consistent with the theoretical analysis of experimental curves. An EIS test indicated that the incorporation of nano-ZrO2 particles into the matrix did not obviously effect the electric double layer at the electrode/electrolyte interface, but the charged transfer resistance of the composite was decreased in the electrodeposition.
1. Introduction
Recently, metal/nano-particles composite coatings have been used in many engineering fields because of their superior mechanical and chemical properties [1]. Electrodeposition is a convenient and effective method of preparing multifunctional compound coatings. In the electrodeposition process, inert particles or hard oxide (ZrO2, SiC, CeO2, Al2O3, SiO2, etc.) fully suspended in a plating bath are co-deposited with a matrix metal layer and endow the coatings with characteristic functions of solid particles [2,3,4,5,6]. The preparation methods, experimental processes, performance characterization, and structural analysis of the coatings have been reported in many literatures [7,8,9]. It is generally accepted that the surface morphology and performances of multiple coatings are affected by the particle characteristics and particle concentrations of the plating bath [10], however, nanoparticles are easy to reunite in electrolyte solutions due to their large surface energy, which will lead to a nonuniform microstructure and unstable performance of the composite coatings and the dispersion strengthening effect of the nanoparticles cannot be brought fully into play. Therefore, some dispersion methods are often adopted to inhibit the agglomeration of nanoparticles in the electrodeposition process, such as mechanical agitation [11,12], ultrasonic vibration [13], sol enhanced [5,14], and the addition of surfactant [4]. The cavitation effect generated by ultrasonic waves is conductive to realize the uniform mesoscopic missing of the electrolyte, cleaning and activating the electrode’s surface. Moreover, the ultrasonic excitation promotes the separation of the nanoparticles and the diffusion processes, significantly reducing the negative effect of hydrogen evolution on the performance of the deposit [15]. Using the dispersion enhancement effect of oxide nanoparticles and ultrasonic assisted electrodeposition, we have successfully prepared lots of composite coatings [15,16].
Ni-Co alloy has attracted great attention because of their outstanding properties such as good resistance to friction and wear, corrosion resistance, thermal stability, and magnetism [17,18,19]. Ni-Co alloys is very convenient for widespread applications as a metallic matrix due to these special characteristics. Especially, it has been used as a three-dimensional material in recent years [20]. Also, various particles have been embedded in the Ni–Co matrix in order to achieve superior performance through electrodeposition techniques, such as SiC [21,22], Al2O3 [23], Cr2O3 [24], CNT [25], and so on. Zirconia (ceramic inert material) offers high hardness, high wear resistance, and chemical inertness [26,27], it would be expected that the incorporation of nano-ZrO2 particles into Ni-Co alloy maybe able to obtain composite materials with superior performance.
However, a few articles have reported on the preparation of Ni-Co-ZrO2 composite coatings. The nucleation kinetic parameters in the early electrocrystallization stage is more rarely studied. Exploring the electrochemical behavior of nano-ZrO2 particles in electrolyte solution and revealing the nucleation/growth mechanism of composite coatings so as to control the micro-structure and performance of composite coatings has important theoretical significance and practical application value. The chief aim of this work is to manufacture Ni-Co-ZrO2 composite coatings by electroplating under ultrasonic vibration, investigating the electrochemical behaviors of nano-ZrO2 particles, studying the nucleation/growth mechanism for Ni2+/Co2+-ZrO2 deposition in an acidic amino sulfonate plating bath. For this aim, using cyclic voltammetry (CV), chronoamperometry (CA), and electrochemical impedance spectroscopy (EIS) test techniques to offer favorable reference for composite coatings, scanning electron microscope (SEM) and X-ray diffraction (XRD) techniques were applied to observe surface morphology and the micro-structure of coatings.
2. Materials and Methods
The Ni-Co-ZrO2 composite coatings were prepared by ultrasonic assisted electrodeposition in acidic sulfonates. The agents used in the experiment are analytical reagent and deionized water as solvent. The composition of electroplating solution and electrodeposition parameters are shown in Table 1. For Ni-Co-ZrO2 composite coatings, the solution was stirred magnetically with 1200 rpm speed for 6 h in order to achieve a homogeneous dispersion and full suspension of nanoparticles before electrochemical experiments. The pH was adjusted to 4 by using H3BO3.
Pure copper (99.9%) plate in 2 mm thickness was cut into 20 mm × 20 mm pieces and used as the cathode plate. A pure nickel (99.9%) plate with 9 cm2 area was served for anode in the electrodeposition process. Before the electrodeposition experiment, the copper plate was ground with different metallographic sand papers, then clearing with anhydrous ethanol, the nickel plate was soaked with 10% HCl for 10 s and cleaned with ultrasonic in the deionized water for 5 min, then the electrodeposition process was carried out. Using a direct current power (model PS-618) for 40 min in the deposition. Ultrasound with a frequency of 35 kHz and an output power of 100 W was applied. After the electrodeposition, the coating was washed and dried immediately.
The three electrode system was used in the electrochemical experiment, the copper plate was a working electrode, a platinum plate was the counter electrode, and a saturated calomel electrode was the reference electrode. The CV experiments were carried out at 2 V vs. SCE in the negative direction, reversing at switching potentials (−2 V vs. SCE) to a positive direction, and the scan rate was 100 mV/s. The frequencies of EIS test were from 10−1 to 105 Hz at different deposition potentials. An autolab electrochemical workstation (AUT85731, Nova1.9, Metrohm, Herisau, Switzerland) was used for the CV, CA, and EIS tests. The X-ray diffraction technique (X’Pert Powder, PANalytical, Almelo, Holland) was used to study an average grain size and the preferred orientation of deposits (Cu Kα filtered radiation). The surface morphology of the coatings was complemented by SEM (Zeiss-ΣIGMA HD, Carl Zeiss, Oberkochen, Germany). The atomic percentage of each element in the deposits was investigated by energy-dispersive X-ray spectroscopy (EDS) in a SEM equipped with an OXFORD-X-Max 50 mm2 spectrometer (Oxford Instruments, Abingdon, UK).
3. Results
3.1. Cylic Voltammetry (CV) Studies
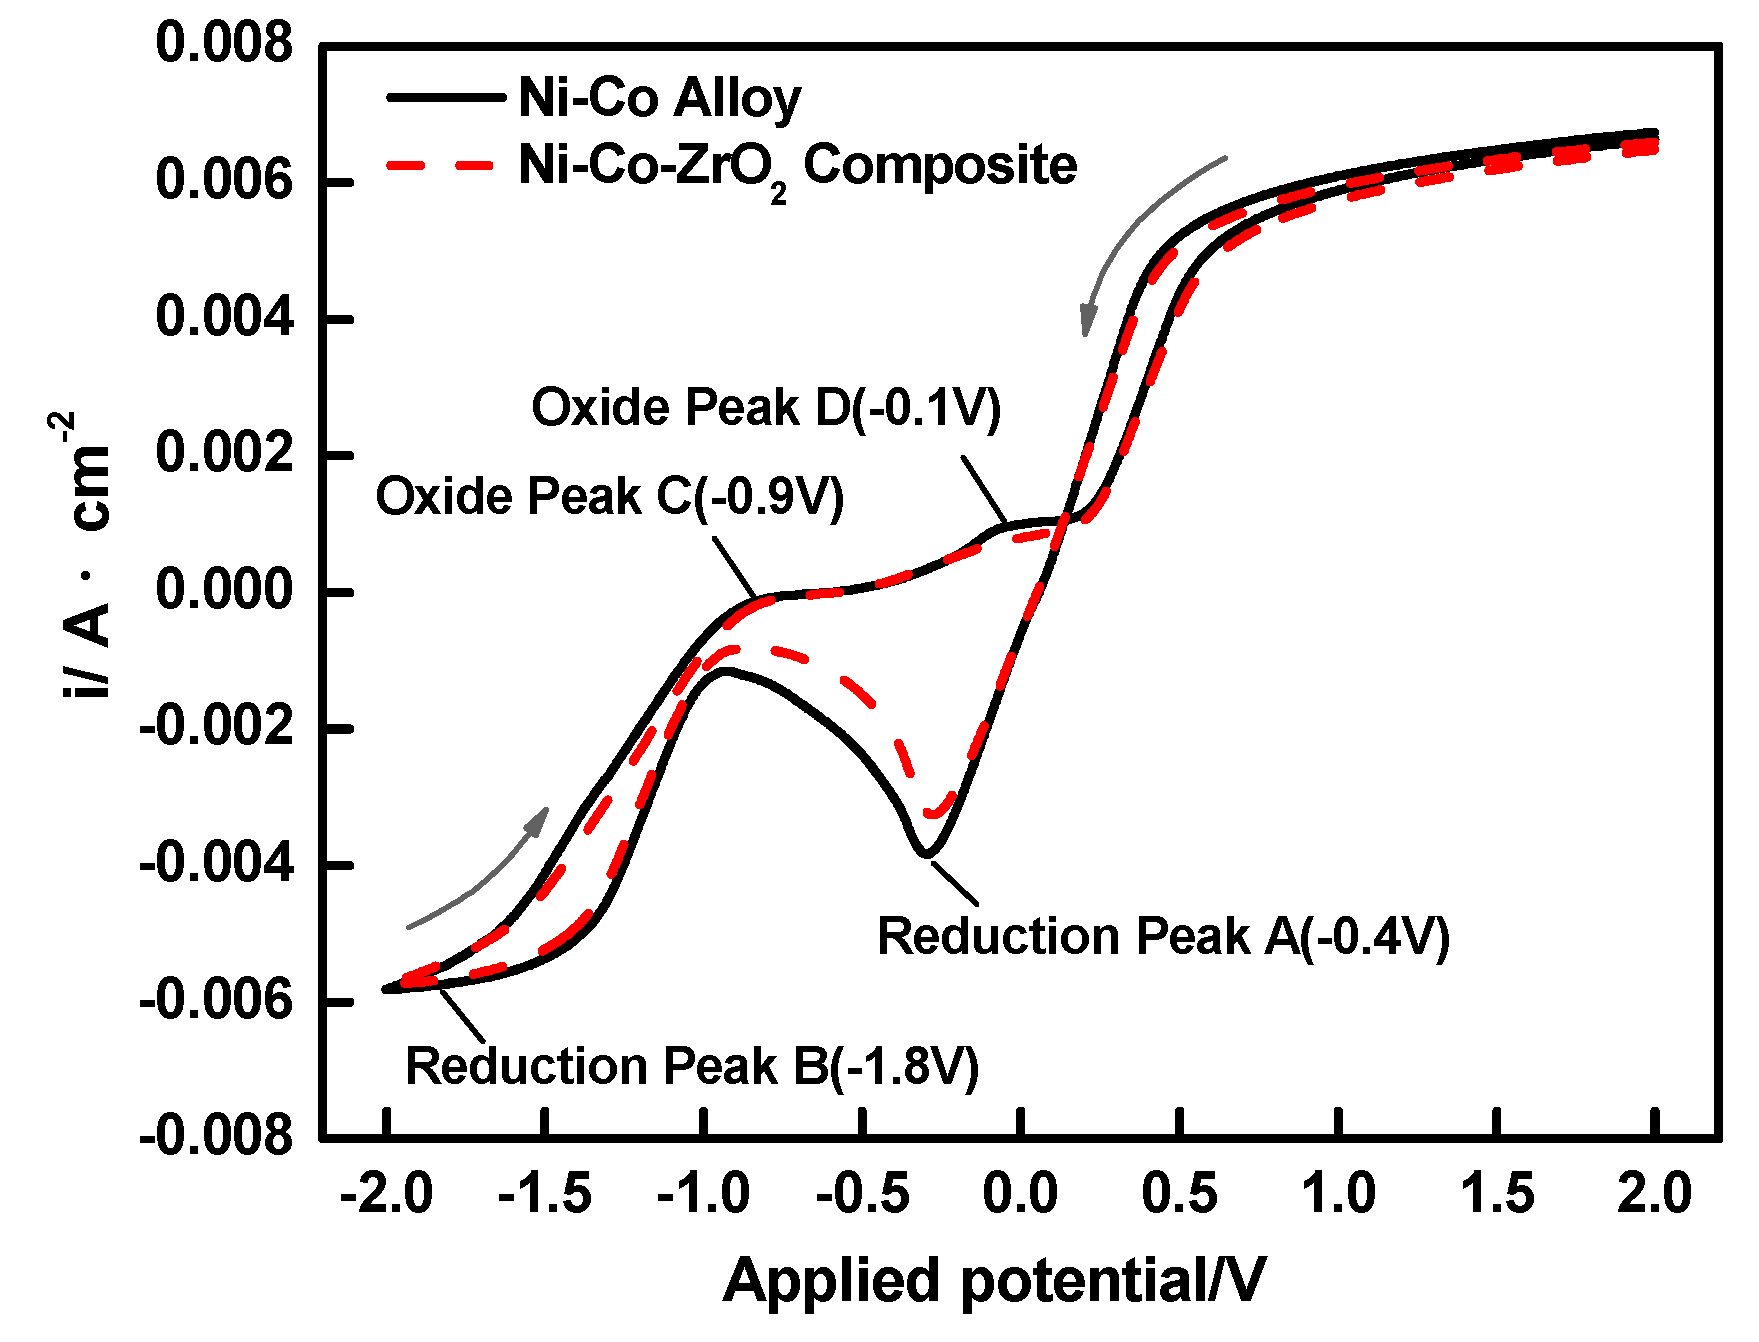
Cyclic voltammetry is an effective method to study the co-deposition potential range of Ni2+, Co2+, Ni2+-Co2+, and Ni2+-Co2+/nano-ZrO2. Figure 1 shows the CV curves of the Ni-Co and Ni-Co-ZrO2 deposits on a pure copper plate in the bath solution.
In the CV curves of both systems, four clear current peaks can be observed, including two reduction peask and two oxidation peaks. Peak A was firstly observed at the approximate potentials from −0.25 to −0.40 V (vs. SCE). It was a pre-peak of the hydrogen evolution reaction on the electrode surface that depends on the pH value of the plating solution as reported by Cao [28], which could be directly observed in experiment process. In this potential range, the change of the current density related to the increase in the hydrogen evolution rate, which would result in an increase of pH value in the cathode surface. Consequently, intermediate Co(OH)ads and Ni(OH)ads [23] formed on the copper surface and covered the active sites for hydrogen evolution reaction, which decreased the cathodic current density. The current density of peak A for the Ni-Co-ZrO2 composite system was lower than the Ni-Co alloy. This showed that the incorporation of nano-ZrO2 particles in electrolyte solution inhibited the hydrogen evolution reaction on the cathode surface. As shown in Figure 1, the reduction of Ni2+ and Co2+ took place at −0.90 V (vs. SCE), however, the initial deposition potential of Ni-Co-ZrO2 multiple coatings was about at −0.80 V (vs. SCE). The presence of zirconia particles in the electroplating solution made the electrodeposition overpotential of Ni-Co deposit shift to a more positive value. This can be attributed to a possible conformation change of the electric double layer owing to the adsorption of particles on the cathode surface [29]. Vathsala [30] reported that zirconia nanoparticles are positively charged when the pH value is below 4, so it would help them to move towards the cathode in virtue of electrophoresis. Accordingly, the matrix metal and nano-ZrO2 particles were co-deposited to refine the grains, forming dense composite coatings. Peak B (from −1.25 to −2.0 V) was the cathode current peak of co-deposition. In this potential range, a platform area appeared, the electrode surface was controlled by diffusion, and the current density was closer to a limited diffusion current density.
The scanning curves from the cathode to anode displayed two different dissolution peaks (peak C and D) concerned with the dissolution of the Ni and Co deposits. The corresponding potentials were about at −0.90 and −0.10 V, respectively. The peak current density of anode peaks for the composite coatings was lower than Ni-Co deposit, and the composite coatings had better stability.
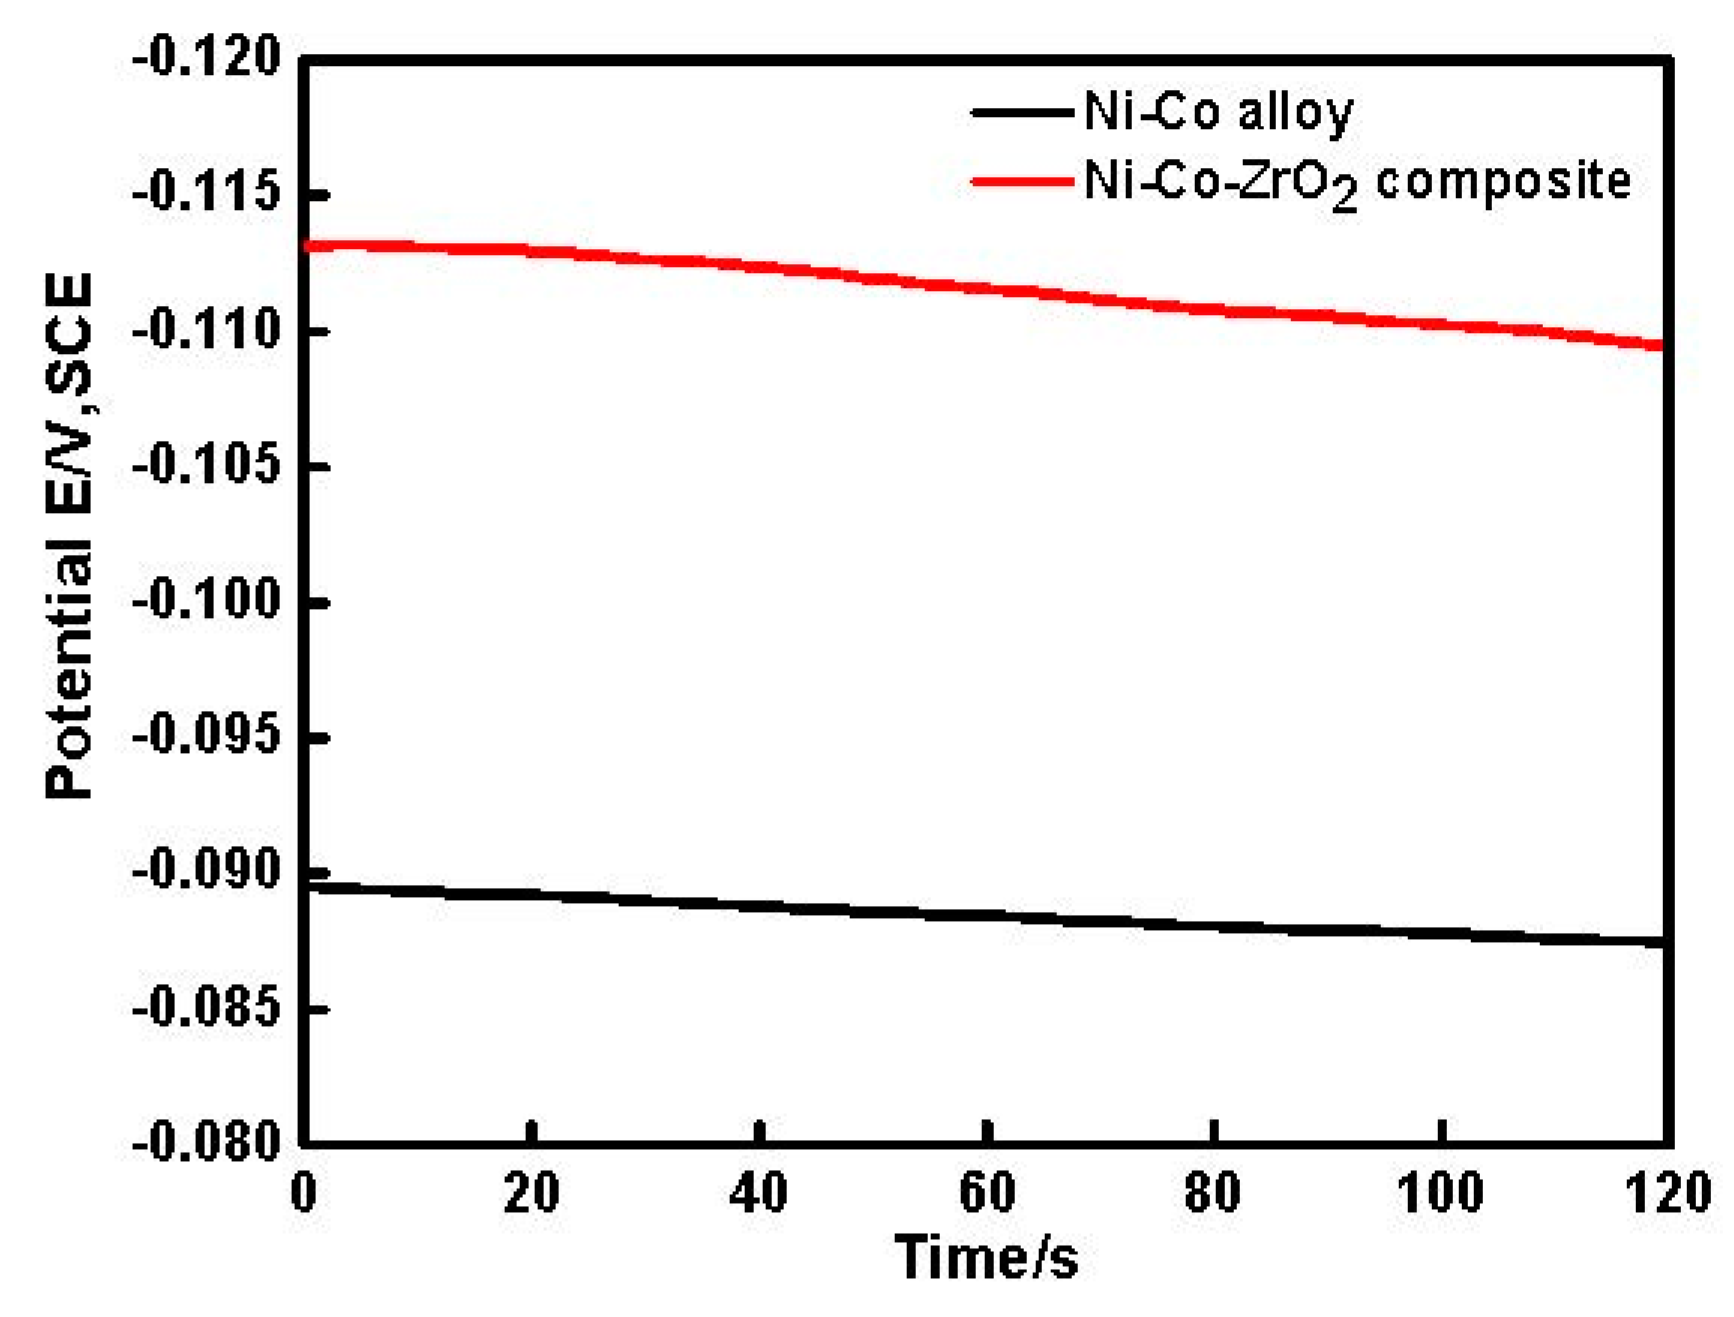
Figure 2 showed the open circuit potential (OCP) of Ni–Co and Ni–Co–ZrO2 depositing in the electrolyte. It could be seen that the OCP of the composite coating was more negative than the alloy, indicating that more energy was required for the composite electrodeposition. Accordingly, the cathodic current density measured in the composite electrolyte was lower than that recorded in the Ni2+ and Co2+ electrolyte, this result was consistent with Figure 1.
3.2. Chronoamperometry (CA) Studies
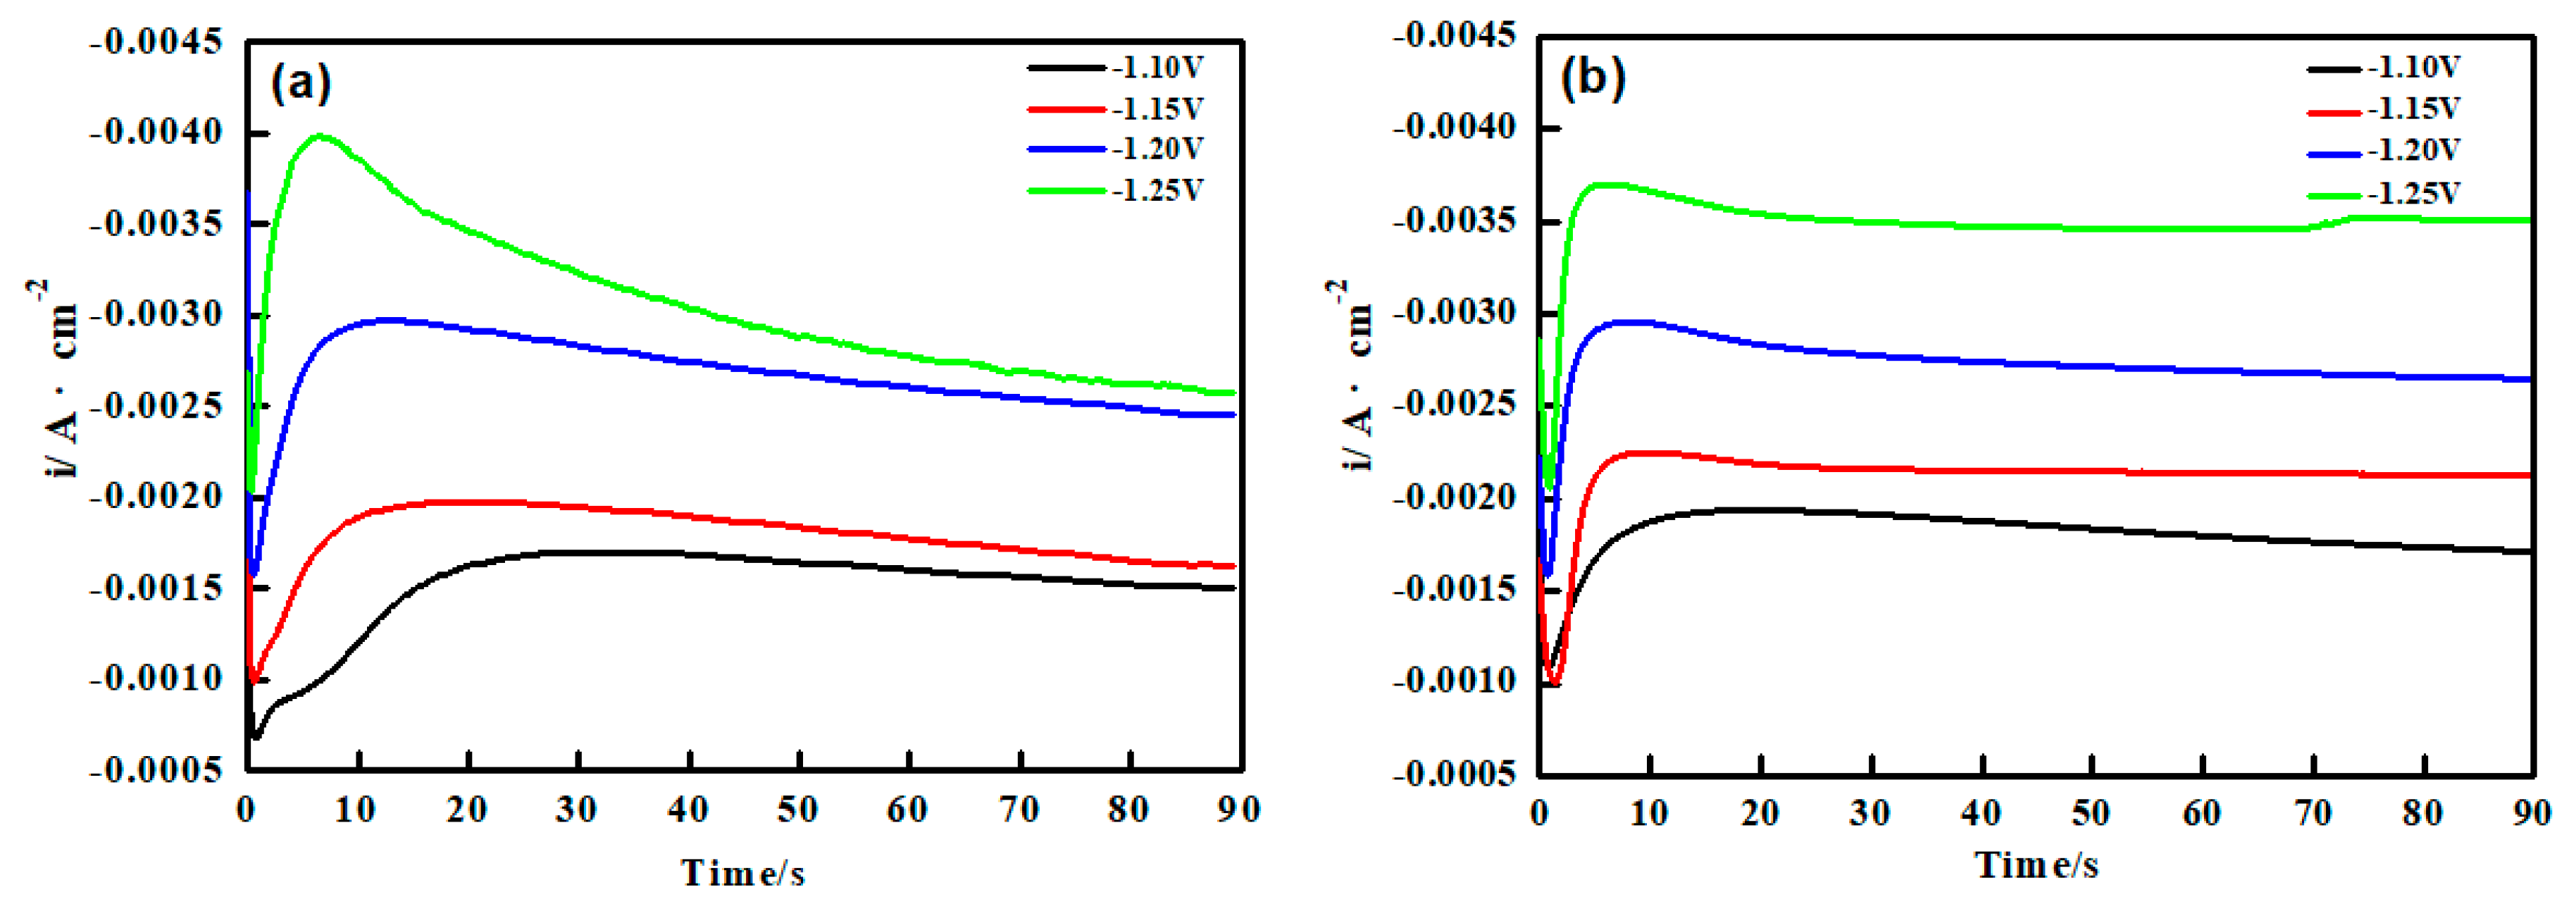
Chronoamperometry has proved to be an effective method to study the nucleation model in electrocrystallization [31]. Figure 3a,b showed the I~t curves of two depositions when the step potential was from −1.10 to −1.25 V(vs. SCE).
It can be seen that for both Figure 3a,b, the I~t curves have a quintessential diffusion controlled 3D nucleation feature [31]. This I~t curves could fall into three parts. The first part is near the longitudinal axis and corresponds to the decline of the current density, which is concerned with the charging of the electric double layer on the electrode surface. In the second part, the current density gradually increased and reached the maximum value, which was a typical crystal nucleation/growth process. During this period the nuclei grew around itself. The third part showed that current density decreased due to the diffusion of deposits from the electrolyte to the electrode/solution interface [31,32]. In the CA curves of Figure 3a,b, the current density maximum value increased gradually with the step potential more negative. It was noteworthy that as the step potential was more negative, the current density maximum appeared faster. This indicated that the nucleation relaxation time shortened and the nucleation rate increased. It may be because that the charging time of the double layer on the electrode surface was shortened with the step potential increasing, and the active nucleation sites increased, which promoted the crystallization process. It was noteworthy that the maximum peak current density (Im) of Ni-Co-ZrO2 was slightly higher than the Ni-Co alloy at lower potential (−1.10, −1.15 V), while the corresponding relaxation time (tm) was shorter. It indicated that the nano particles absorbed on the cathode surface enhanced the nucleation rate. The cause may be that the nano-ZrO2 particles adsorbed many metal ions in the bath. When the nano-ZrO2 particles collided with the electrode surface, these metal ions deposited on the copper plate and this part that the deposited metal ions only existed after the nano-ZrO2 particles were added. Altogether, nano-ZrO2 particles acted as an accelerator in the nucleation process at low potential. However, the experimental curves showed the opposite trend at a higher potential (−1.20, −1.25 V). The maximum peak current density (Im) of Ni-Co-ZrO2 was a little smaller than that of the Ni-Co alloy. This could attribute to that electrode surface was stable at this potential, however, the electrochemical reaction was hindered due to a significant steric effect of the nano-ZrO2 particles embedded in the matrix. Accordingly, the peak current value (Im) was obviously reduced.
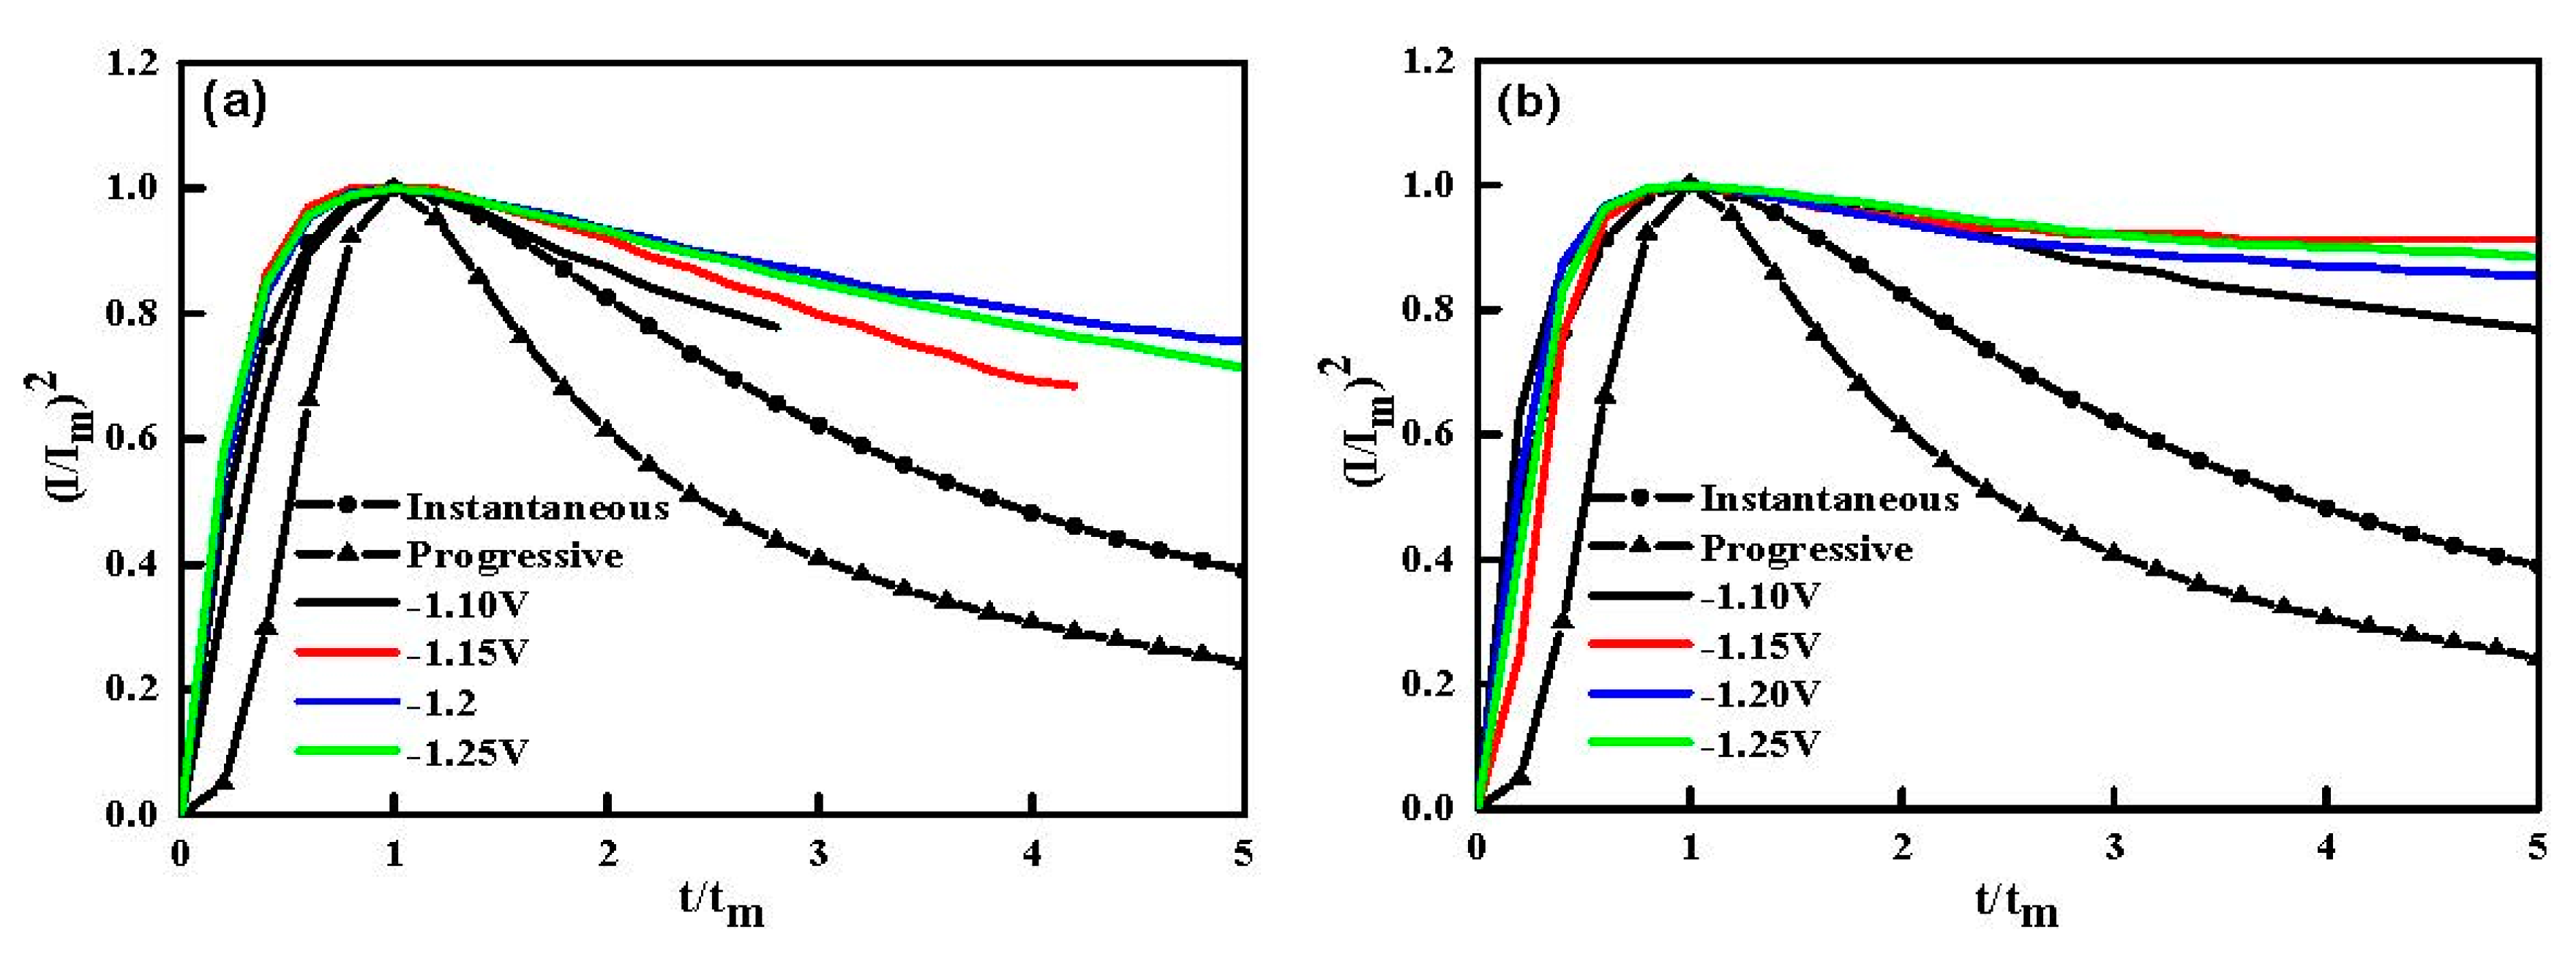
In the interest of exploration of the nucleation at the initial stage of electro-crystallization, the experimental current transients data were used by representing in a nondimensional curve (I/Im)2~(t/tm) as shown in Figure 3, comparing with the Scherifker–Hills theoretical nucleation/growth model [31] according to Equations (1) and (2).
Equations (1) and (2) represent several instantaneous nucleation and progressive nucleation, where I expresses current density, t is time, Im are the crest value of current density and tm is corresponding time. Figure 4a,b showed a slice of non-dimensional (I/Im)2 versus (t/tm) curves of Ni-Co and Ni-Co-ZrO2 depositions at diverse transient potentials.
In general, nucleation models for metal electrodeposition at initial stage are divided into two models: instantaneous nucleation and progressive nucleation according to three-dimensional (3D) nucleation/growth models [31]. It can be seen from Figure 4, dimensionless curves for the Ni-Co and Ni-Co-ZrO2 composite deposit at different step potentials were closer to the theoretical curve of instantaneous nucleation, which indicated that the code position of the nano-ZrO2 particles with matrix metal did not change the nucleation mode of the Ni-Co alloy at the early electro-crystallization stage, the nano-ZrO2 particles in the bath solution only have little effect on the nucleation rate. From Figure 4a,b, it was worth noticing that, when t/tm > 1 the experimental (I/Im)2 versus (t/tm) curves current density had a much larger value than that obtained by the Scherifker–Hills theoretical model calculation. This is because the precondition of the instantaneous and progressive nucleation theoretical model is that the electrochemical reduction reaction occurs on a very smooth electrode surface. However, there are some dislocations and scratches on the experimental copper electrode surface. These dislocations and scratches provided additional active nucleation sites for the electric crystallization process, consequently, the decay rate of the current versus time was lower than the theoretical value, which resulted in the deviation between the experimental curves and the theoretical curves. Furthermore, the reduction of matrix metal ions on the electrode surface in the acidic electrolyte follows the following mechanism [30,33].
In the form, M represents Ni, Co, and M2+ represents Ni2+ and Co2+. The metal ions in the electrolyte solution firstly receive an electron and combine it with the OH− of the cathode region to form the intermediate product M(OH)ads. The intermediates adsorbed on the cathode surface get secondary electrons to be a reduction of matrix metal. During the entire electrodeposition, the concentration of the metal ions on the electrode surface are basically unchanged. However, the concentration of metal ions on the deposit surface was less than that in the electrolyte solution. At the same time, according to Equations (3) and (4), the nucleation/growth of the metal ions at a more negative potential occurred simultaneously with the hydrogen evolution reaction. All these could lead to the migration between experimental curves and theoretical curves.
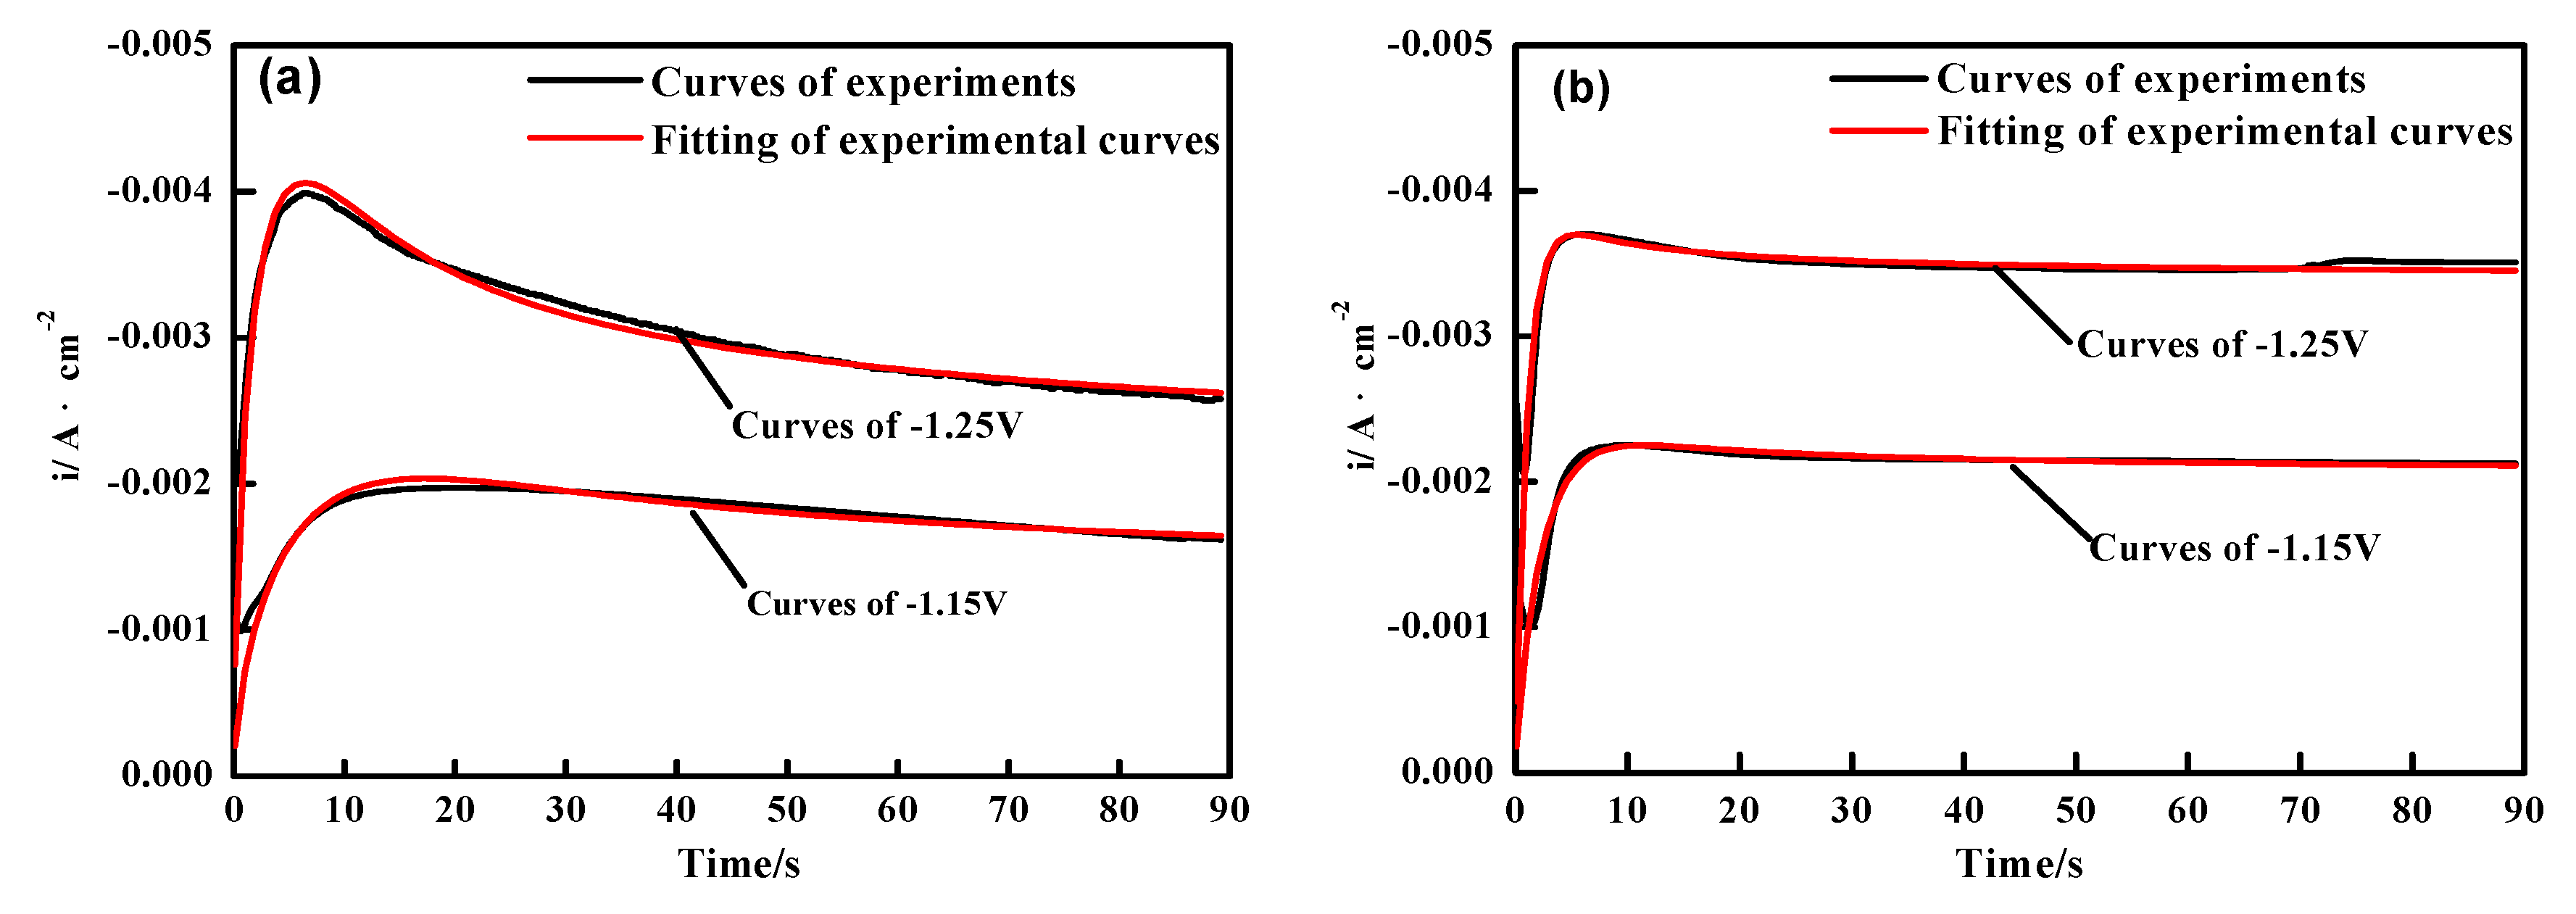
Therefore, the hydrogen evolution reaction in company with the nucleation process should be considered in the transient curves analysis. Palomar-Pardavé et al. [34] formed a nucleation/growth model accounting for the electro-deposition of matrix metal. The whole current density in the electrodeposition process was given by [34]:
where
and where ZPRF and KPR expresses the molar charge transfer and the rate constant in the hydrogen evolution reaction, N0 and A being the number density of the active sites for nucleation on the electrode surface and the rate of nucleation, respectively. D expresses the average value for the diffusion coefficient of metal ion, C expresses the concentration of the metal ion in the bulk of the plating solution, F expresses the faraday constant, and other parameters also indicate their common meanings.
Figure 5a,b shows a contrast of experimental plots and fitting curves obtained by using Equation (5). During the iterative fitting process, the parameters P1*, P2, P3 (nucleation rate), and P4 were allowed to vary freely and could be obtained [34], they provided a reliable reference for studying the electrochemical behaviors of nano-ZrO2 particles in the electrocrystallization at different potentials. The results of the non-linear fitting to the experimental data had a good agreement with the plot obtained by CA operations, and these parameters were shown in Table 2. The results indicated that the A value was higher in the presence of the nano-ZrO2 particles at low potential (E = ~−1.15 V). Thus, it could be considered that the adsorption of the nano-ZrO2 particles on the cathode surface provided additional nucleation sites for the deposition of the matrix metal, which promoted the nucleation process at the initial stage of eletrocrystallization. On the other hand, the nucleation rate of multiple coatings was slightly smaller than the Ni-Co alloy because of its spatial hindrance effect at a high potential (E = ~−1.25 V). The data calculated by the fitting curves coincided with the CA curves in Figure 3.
3.3. Electrochemical Impedance Spectroscopy (EIS) Studies
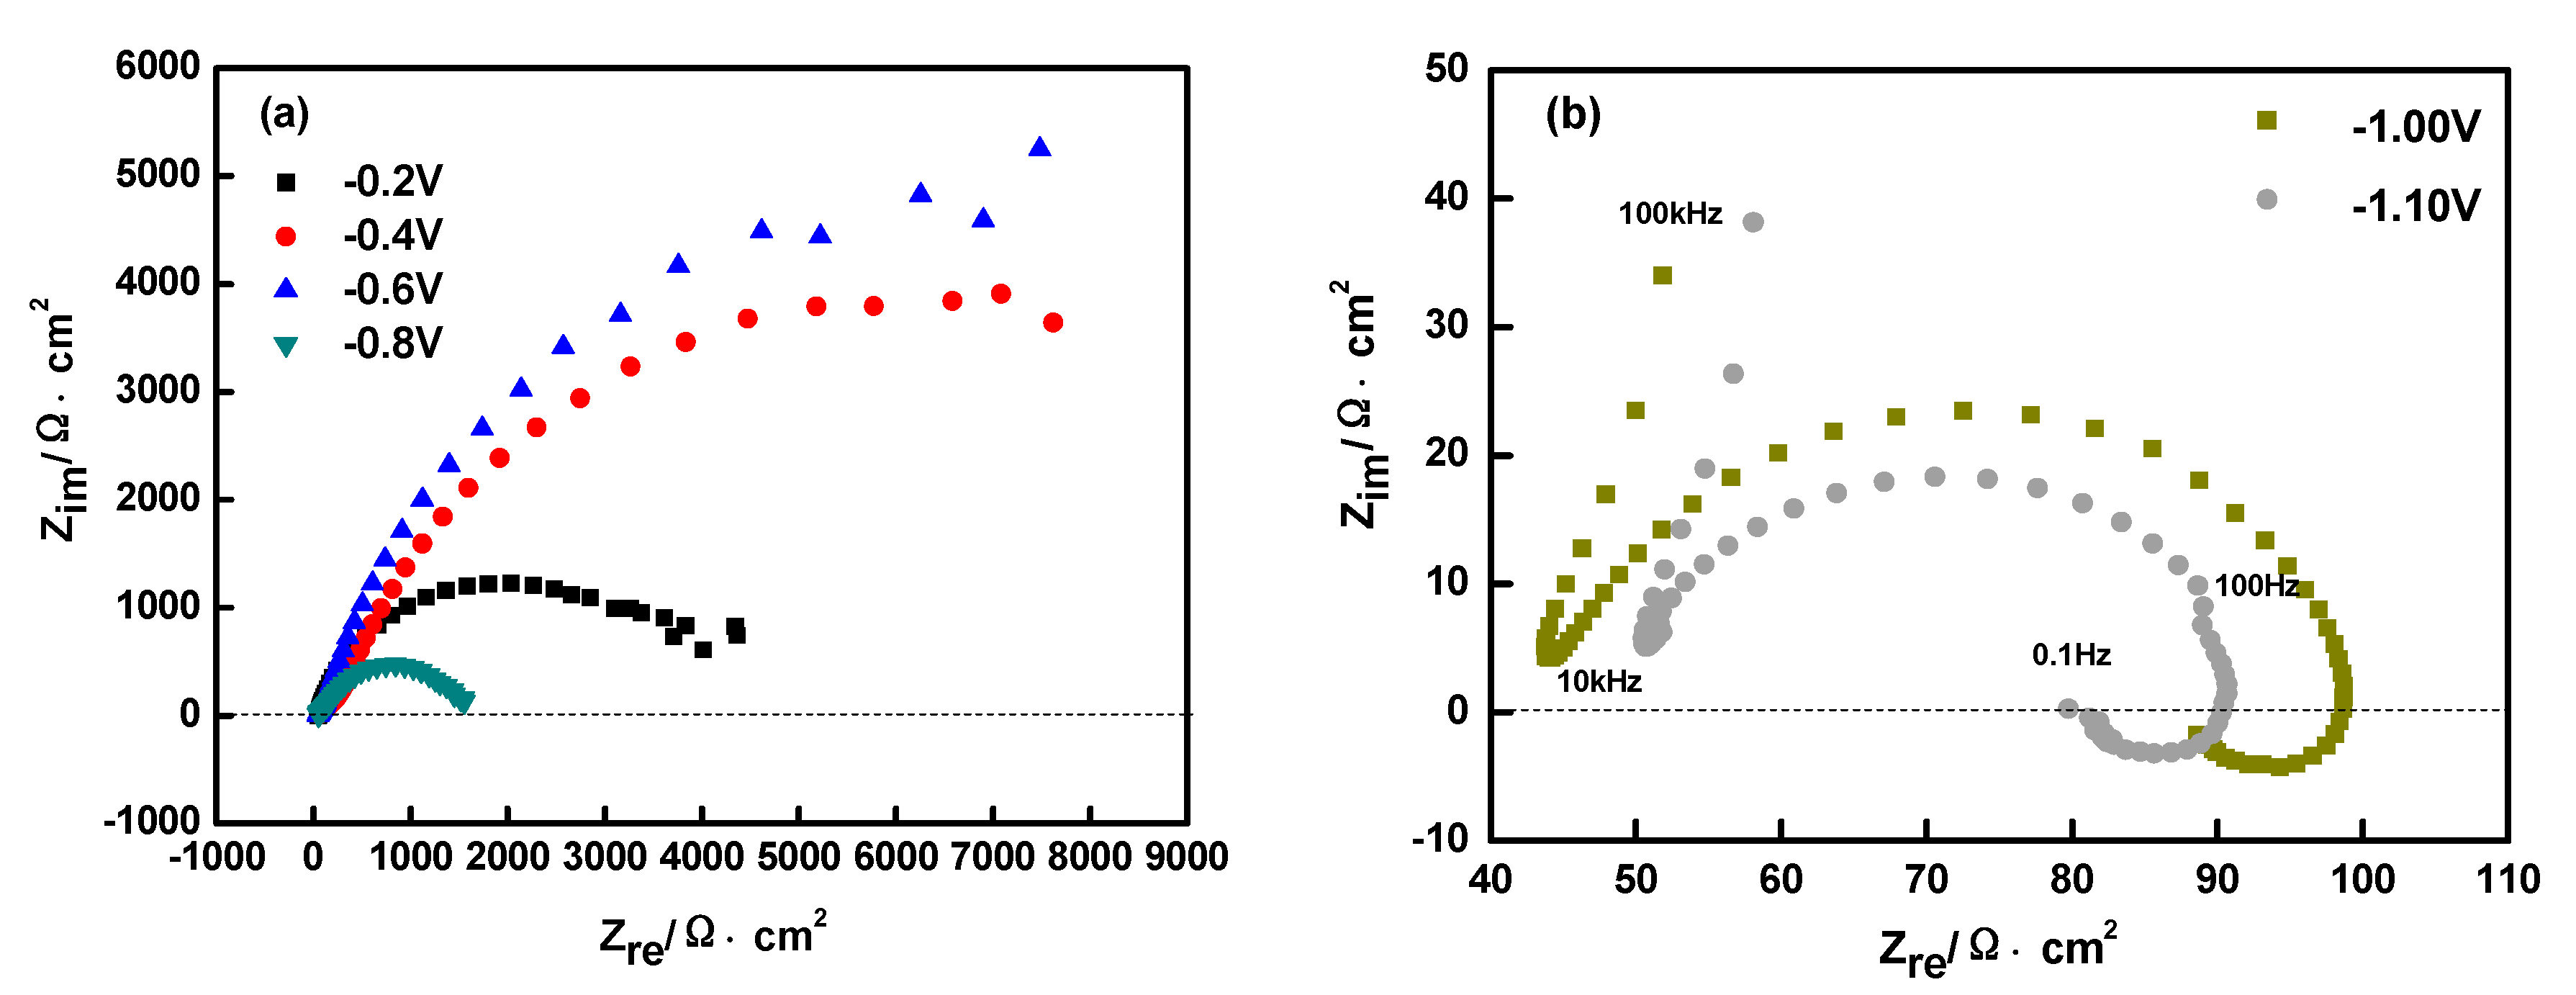
Figure 6 shows the Nyquist spectrum of the Ni-Co-ZrO2 composites co-deposited on the pure copper plate surface. According to Figure 6, the Nyquist spectra of Ni-Co-ZrO2 composites showed a less complete capacitive loop at potential from ~−0.20 to −0.60 V; the arc radius increased gradually and the appearance of scatter due to the hydrogen evolution reaction at the arc end.
The arc radius of the capacitive loop is related to the resistance of the electrochemical reactions, and the capacitive arc radius increased with the enlargement of the reaction resistance. The cause of this phenomenon may be that the complete deposition layer of the matrix metal had not yet formed in the potential range; therefore, the electrochemical reaction occurred in the pure copper surface at this moment and belonged to the heterogeneous “nucleation/growth” process where the electrochemical reactions required a larger activation energy, which resulted in an increase of reaction resistance and the capacitance arc radius. When the applied potential was −0.80 V, the capacitive loop had a tendency to be complete and the radius decreased. ~−0.80 V is the starting potential of the Ni-Co/ZrO2 composite electro-deposition corresponding to Figure 2 (CV curves). The electrochemical reaction mainly occurred in the matrix metal thin film formed by the electrodeposition, the “heterogeneous nucleation/growth” change for the “homogeneous nucleation/growth”, and the activation energy needed for the electrochemical reaction is lower. As a result, the reaction resistance and capacitance arc radius decrease. This is similar to the Song’s conclusion on the electrodeposition mechanism of the nano structure black nickel thin film [35]. When the potential range was from ~−1.00 to −1.10 V, two loops were included in the Nyquist of the Ni-Co-ZrO2 composites, including a semicircular capacitive arc in high-frequency concerned with a solution resistance (Rs), the parallel connection between the double-layer electric capacity (CPE) and the charge transfer resistance (Rt), and an inductive arc caused by the sorption and desorption of the deposits layer on the cathode surface in low-frequency [36]. It showed that the influence of the adsorbent on the electro-chemical reaction at the interface between the electrolyte solution and the electrode, and this curve proved that the intermediate produced by the two step reduction of the matrix metal exists on the electrode surface in this potential range.
Figure 7a and b shows the Nyquist plots (with bode) of the Ni-Co with and without the nano-ZrO2 particles deposition on the electrode surface at −1.10 V, and Figure 7c is the equivalent circuit diagram fitted by the ZVIW software. The correlation degree between the fitting results and the experimental curves was very high and the calculated data provides an accurate reference for the electrochemical process. These curves contained a capacitive loop and an inductive loop. It can be seen that the capacitance arc radius of the Ni-Co-ZrO2 composites was less than the Ni-Co alloy, this could have contributed to the nano-ZrO2 particles adsorption on the cathode surface and increased the active reaction area, accelerating the diffusion of the metal ions in the diffusion layer. Accordingly, the reaction resistance decreased. The inductive arc radius of the composite coating was slightly larger than the alloy; it showed that the intermediate formed by the electrochemical reaction corresponded to different time constants. The electrochemical reaction of the adsorbed intermediate formed corresponding to different time constants and the adsorption of the nano-ZrO2 particles had a significant impact on the deposition. According to the Bode diagram, the phase angle peak of the alloy and the composite deposit was only one. The addition of the nano-ZrO2 particles in the electrolyte solution did not change the electrodeposition of the Ni-Co alloy on the electrode surface. In Figure 7c, Rs indicates the solution resistance, Rt expresses the charge transfer resistance, and a constant phase original CPE is used to represent a double layer capacitance. R1 is a Faraday resistor in series with inductance L1, and the computational date was shown in Table 3. Table 3 shows that the electric double layer capacitors of the alloy and Ni-Co-ZrO2 composite deposits were similar, however, the charge transfer resistance of the Ni-Co-ZrO2 composite was significantly less than the alloy, which proved that the nano-ZrO2 particles in the electrolyte solution had no obvious influence on the electric double layer capacitors of the electrode/electrolyte solution the interface, however, its own weak adsorption on the electrode surface increased the reactive area at low potential and resulted in the decrease of the charge transfer resistance, accordingly, the mass transfer rate of Ni2+ and Co2+ to the electrode surface was accelerated. The results formed by the fitting calculation are in agreement with the theoretical analysis of the Nyquist spectrum.
3.4. X-ray Diffraction Texture and Surface Morphology of Coatings
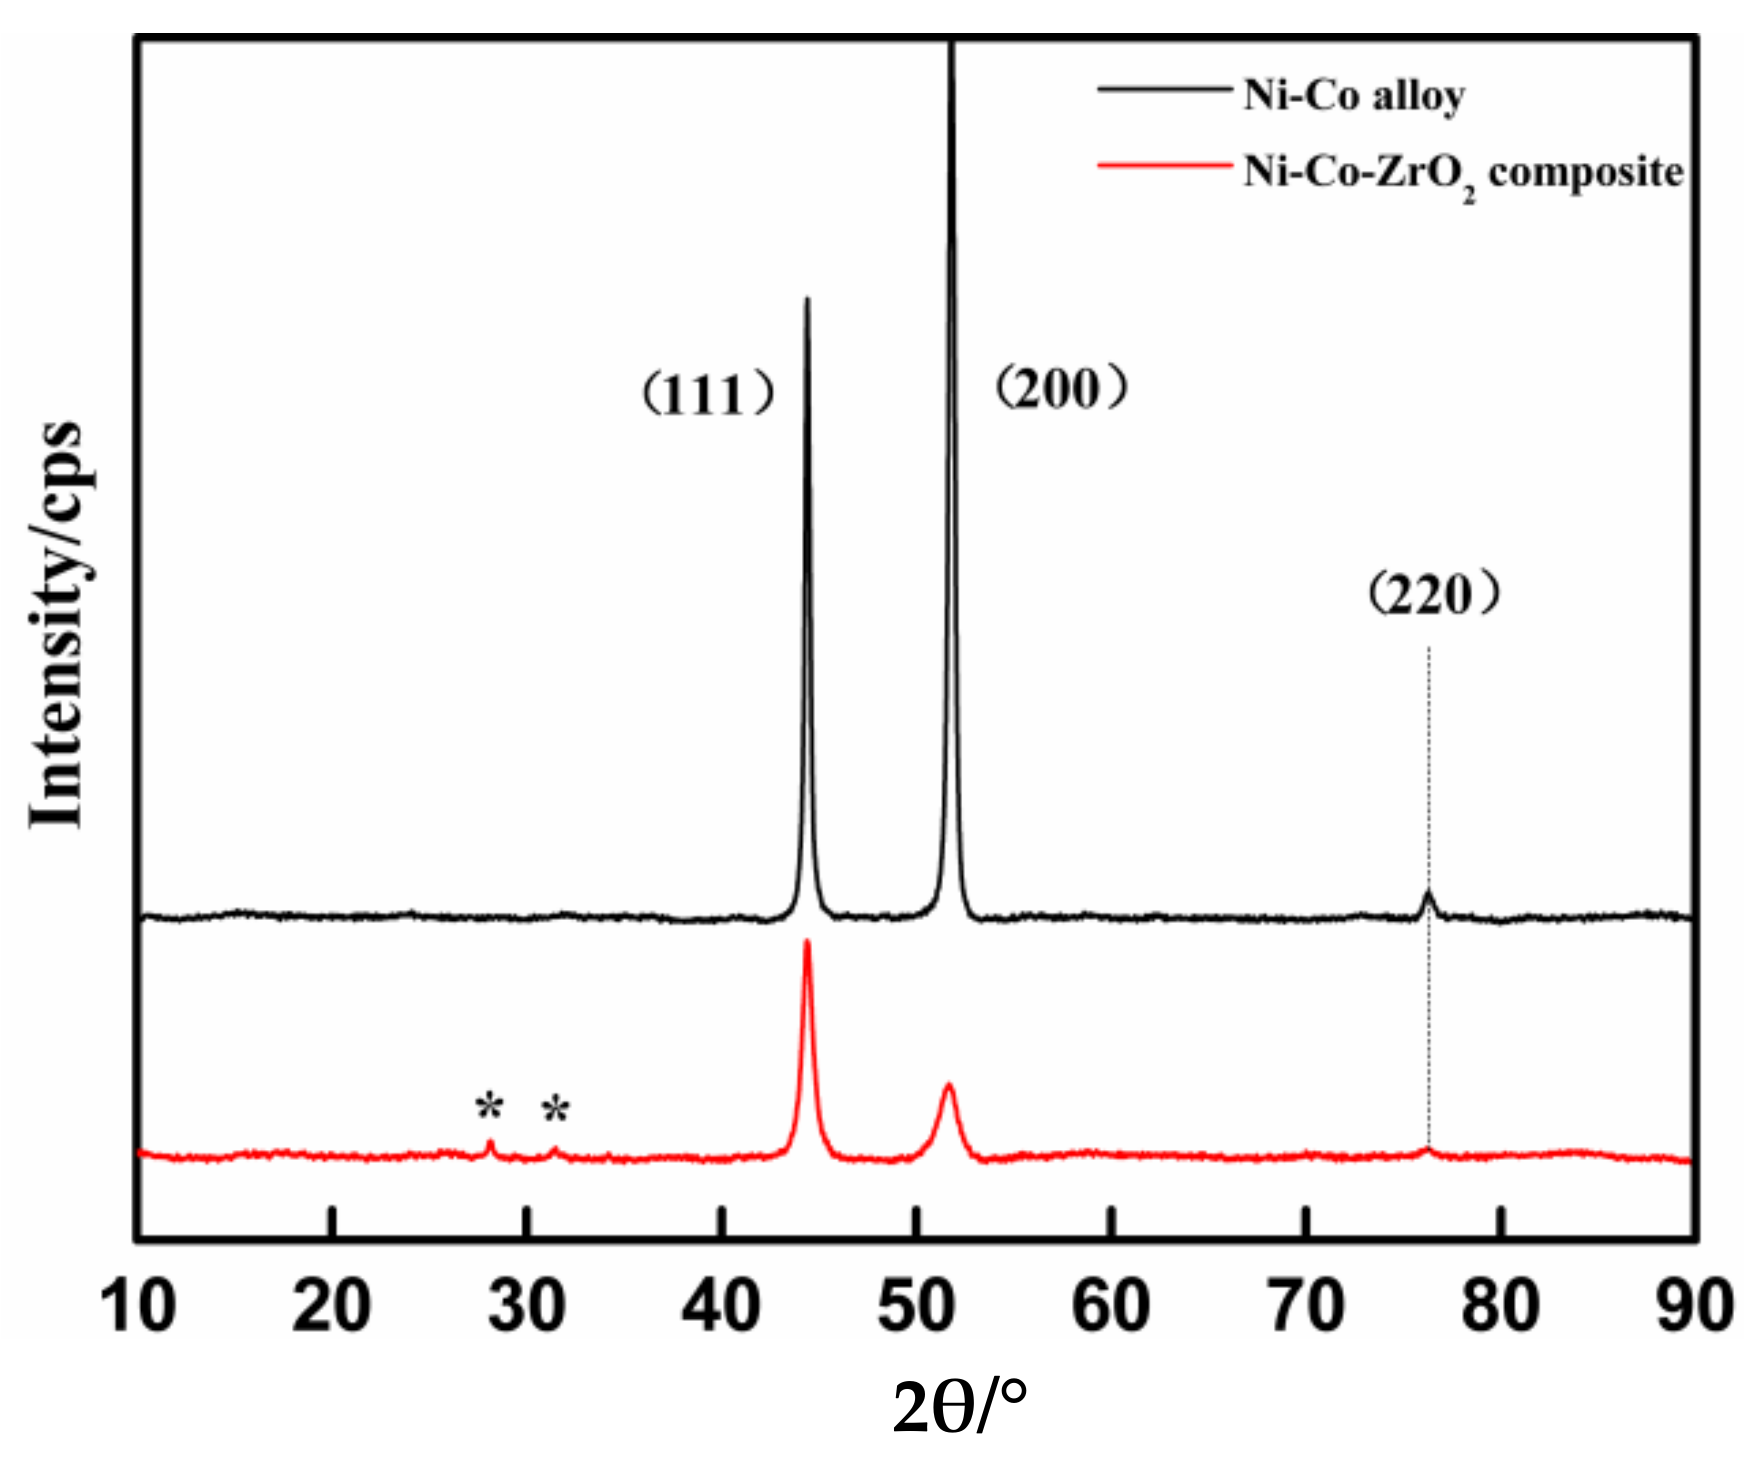
In order to study the microstructure of the depositions prepared under the aforementioned experimental conditions, X-ray diffraction texture was used for the coatings. The XRD curves of the coatings are shown in Figure 8.
The X-ray diffraction patterns described the influence of the nano-ZrO2 particles on the grain size and the preferred orientation of the sedimentary layers. As seen in Figure 8, the Ni-Co alloy coating showed two strong diffraction peaks near the 2θ value at 44° and 52°, corresponding to the crystal surface (111) and (200), and the (200) reflection was predominant, and the weak (220) diffraction peaks appeared at about 76°. However, the diffraction peaks of the Ni-Co-ZrO2 composite coating showed a predominant (111) reflection together with (200) and (220) at the same 2θ value with the alloy, and the relevant diffraction intensity of (111) was much larger than (200). The difference in the diffraction peak intensity between the compound metal and the composites could be related to the addition of the nano-ZrO2 particles in the electrolyte. It can be validated through the zirconia diffraction peaks (expressed in *) of the monoclinic phase appearance at 28° and 31° in the composite deposit (Ref. JCPDS card no.#96-230-0297). Furthermore, the shape of the diffraction peaks for the Ni-Co alloy coating was narrower and sharper when compared with the composite coating. It indicated that the Ni-Co layer had high crystallinity and coarse grains. This was consistent with grains size calculated by the Scherrer equation (D = 0.9λ/β cosθ, where λ is the wavelength of the radiation (0.154 nm), β is the full width at half maximum (FWHM) of the peak, and θ is the position of the peak) [37]. The computational results showed that the average grain size of the Ni-Co layer was 43.7 nm, the average grain size of the Ni-Co-ZrO2 composite coating was 37.3 nm, and the grain size of the composite was obviously reduced. The grain refinement and the change of the preferred orientation could be related to the incorporation between the matrix metal and the nano particles in the electrode positon process.
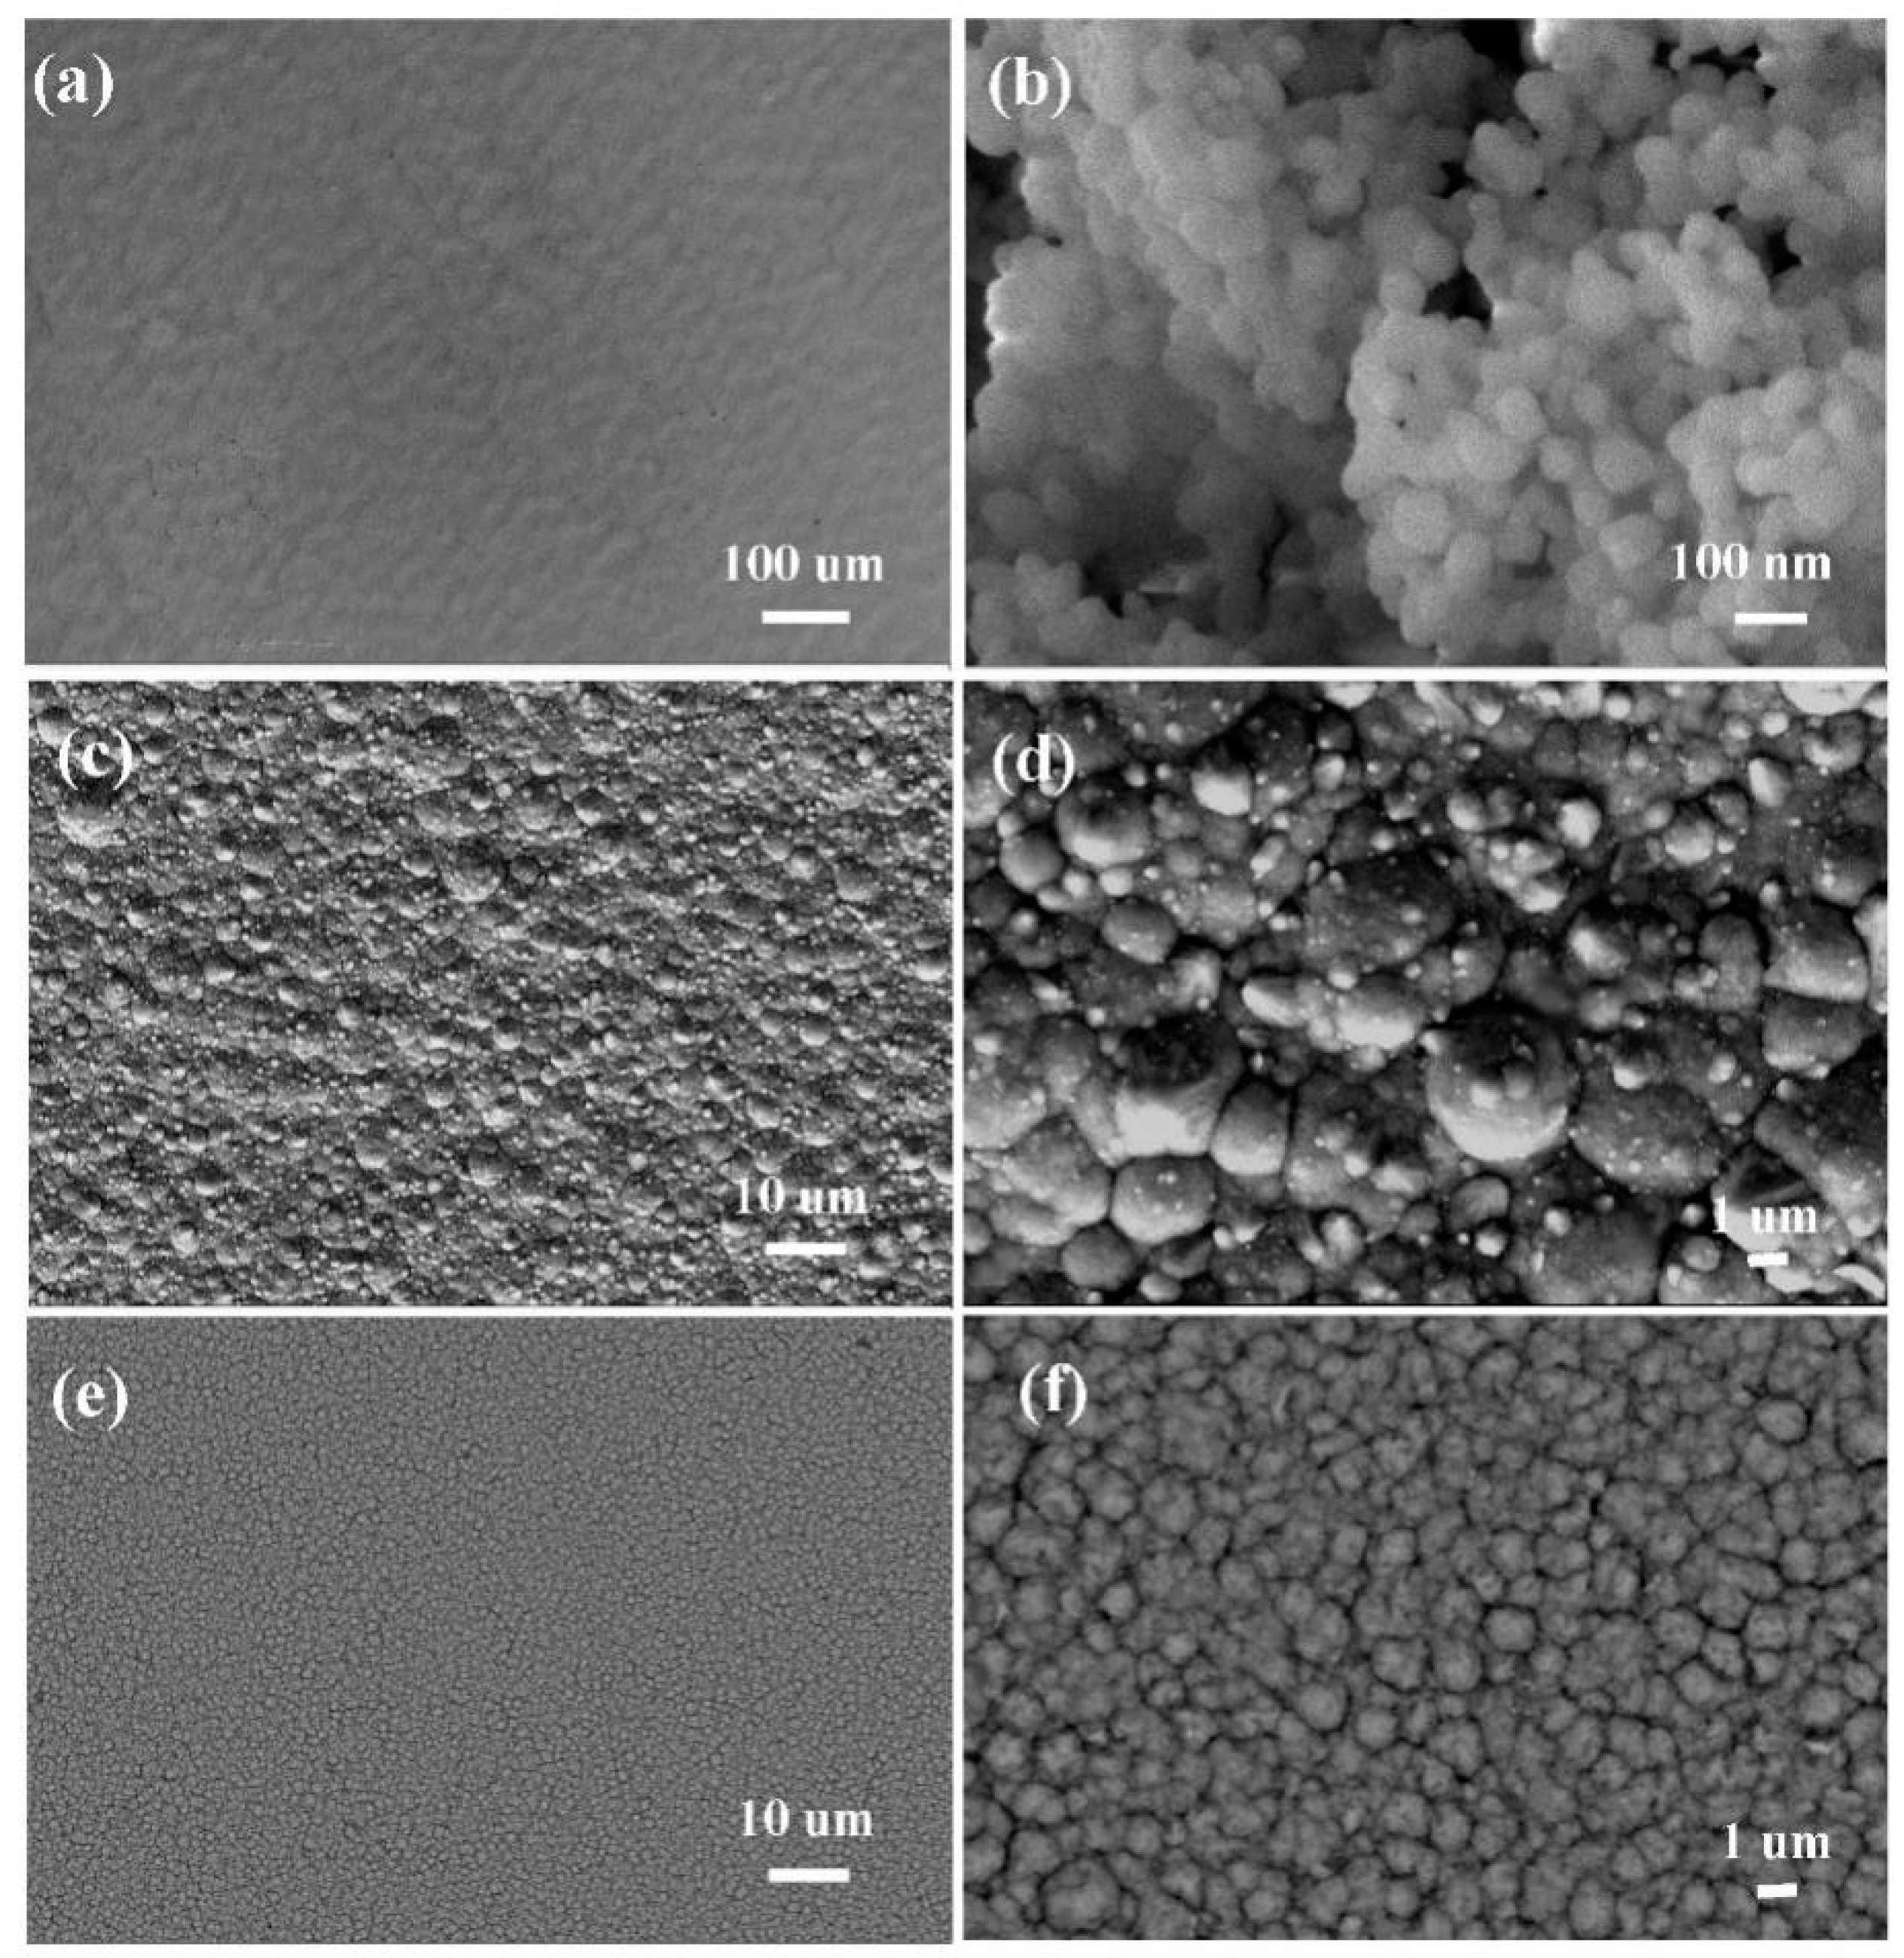
The surface morphology of the deposits are shown in Figure 9. The percentage of the atoms in the coatings was checked by the EDS test described in Table 4. The Ni-Co alloy shows incoherent, globular surface morphology (Figure 9c,d), and bulges are clearly visible on the alloy surface, which is due to the non-uniform nucleation and low nucleation rate according to Table 2. The surface morphology of the composites (Figure 9e,f) is different in comparison with the alloy; there are more finer grains on the surface and the composite layers are compact owing to their higher nucleation rate and the incorporation of the nano-ZrO2 particles in matrix.
4. Conclusions
The Ni-Co compound metal and the Ni-Co-ZrO2 multiple coatings were successfully electrodeposited on a pure copper plate in an acid amino sulfonate solution. The CV studies indicated that the initial deposition potential shifted to more positive values for the composite coatings. The nucleation/growth of the alloy and composite deposition at the early stage of electrocrystallization followed a 3D Scharifker–Hills model. These two coatings all followed the instantaneous nucleation model, and the nucleation kinetics calculation results show that the incorporation of the nano-ZrO2 promotes the nucleation rate of the matrix metal at low negative potentials (~−1.10, −1.15 V). However, the presence of the nano-ZrO2 particles in the electrolyte inhibited the nucleation/growth of the matrix metal at a more negative potential (~−1.20, −1.25 V). The results of the non-linear fitting calculation were consistent with the experimental curves. The EIS test showed that the nano-ZrO2 particles did not significantly affect the electric double-layer capacitance at the interface, but the charge transfer resistance was significantly reduced. The addition of the nano-ZrO2 particles in the bath promoted the preferred orientation of the sedimentary layer shift to the (111) plane, moreover, the dense and smooth surface morphology of the composite coatings can be seen in the SEM images.
Author Contributions
H.J. and Y.W. conceived and designed the experiments; X.Z. and Z.L. performed the experiments; Y.W. wrote the paper.
Funding
This work was supported by the National Natural Science Foundation of China (51674141). This work also was supported by the Nature and Science Fund (L2015259) from the Liaoning Province Ministry of Education in China.
Conflicts of Interest
The authors declare no conflict of interest.
References
- Kainer, K.U. Metal Matrix Composites: Custom-Made Materials for Automotive and Aerospace Engineering; Wiley VCH: Weinheim, Gemany, 2006; Volume 300. [Google Scholar] [CrossRef]
- Benea, L. Electrodeposition and tribocorrosion behaviour of ZrO2–Ni composite coatings. J. Appl. Electrochem. 2009, 39, 1671–1681. [Google Scholar] [CrossRef]
- Da Costa Pereira, R.F.; de Oliveira, E.S.D.; Silva, D.L.A.E.; Souza Ribeiro, A.; de Araújo Filho, O.O.; de Andrade e Lima, M.A.G.; Urtiga Filho, S.L. Influence of composite nano-coating of Ni-Co-SiC obtained by electrodeposition on the corrosion resistance of API 5L X80 Steel. Mater. Sci. Forum 2017, 899, 317–322. [Google Scholar] [CrossRef]
- Ranganatha, S.; Venkatesha, T.V.; Vathsala, K. Electrochemical studies on Zn/nano-CeO2 electrodeposited composite coatings. Surf. Coat. Technol. 2012, 208, 64–72. [Google Scholar] [CrossRef]
- Ghaziof, S.; Kilmartin, P.A.; Gao, W. Electrochemical studies of sol-enhanced Zn–Ni–Al2O3 composite and Zn–Ni alloy coatings. J. Electroanal. Chem. 2015, 755, 63–70. [Google Scholar] [CrossRef]
- Popoola, A.P.I.; Aigbodion, V.S.; Fayomi, O.S.I. Surface characterization, mechanical properties and corrosionbehaviour of ternary based Zn–ZnO–SiO2 composite coating of mildsteel. J. Alloys Compd. 2016, 654, 561–566. [Google Scholar] [CrossRef]
- Daniyan, A.A.; Umoru, L.E.; Popoola, A.P.I.; Fayomi, O.S.I. Comparative studies of microstructural, tribological and corrosion properties of Zn-TiO2 and Zn-TiO2-WO3 nano-composite coatings. Result. Phys. 2017, 7, 3222–3229. [Google Scholar] [CrossRef]
- Chen, Y.; Hao, Y.; Huang, W.; Ji, Y.; Yang, W.Z.; Yin, X.S.; Liu, Y.; Ling, X. Corrosion behavior of Ni-P-nano-Al2O3 composite coating in the presence of anionic and cationic surfactants. Surf. Coat. Technol. 2017, 310, 122–128. [Google Scholar] [CrossRef]
- Yu, H.L.; Zhang, W.; Wang, H.M.; Ji, X.C.; Song, Z.Y.; Li, X.Y.; Xu, B.S. In-situ synthesis of TiC/Ti composite coating by high frequency induction cladding. J. Alloys Compd. 2017, 701, 244–255. [Google Scholar] [CrossRef]
- Beltowska-Lehman, E.; Goral, A.; Indyka, P. Electrodeposition and characterization of Ni/Al2O3 nanocomposite coatings. Arch. Metall. Mater. 2011, 56, 919–931. [Google Scholar] [CrossRef]
- Singh, S.; Sribalaji, M.; Wasekar, N.P.; Joshi, S.; Sundararajan, G.; Singh, R.; Keshri, A.K. Microstructural, phase evolution and corrosion properties of silicon carbide reinforced pulse electrodeposited nickel-tungsten composite coatings. Appl. Surf. Sci. 2016, 364, 264–272. [Google Scholar] [CrossRef]
- Tripathi, M.K.; Singh, V.B.; Singh, H.K. Structure and properties of electrodeposited functional Ni–Fe/TiN nanocomposite coatings. Surf. Coat. Technol. 2015, 278, 146–156. [Google Scholar] [CrossRef]
- Beltowska-Lehman, E.; Indyka, O.; Bigos, A.; Kot, M.; Tarkowski, L. Electrodeposition of nanocrystalline Ni–W coatings strengthened by ultrafine alumina particles. Surf. Coat. Technol. 2012, 211, 62–66. [Google Scholar] [CrossRef]
- Chen, W.W.; Gao, W. Sol-enhanced electroplating of nanostructured Ni–TiO2 composite coatings—the effects of sol concentration on the mechanical and corrosion properties. Electrochim. Acta 2010, 55, 6865–6871. [Google Scholar] [CrossRef]
- Ataie, S.A.; Zakeri, A. Improving tribological properties of (Zn–Ni)/nano Al2O3 composite coatings produced by ultrasonic assisted pulse plating. J. Alloys Compd. 2016, 674, 315–322. [Google Scholar] [CrossRef]
- Beltowska-Lehman, E.; Indyka, P.; Bigos, A.; Szczerba, M.J.; Kot, M. Ni–W/ZrO2 nanocomposites obtained by ultrasonic DC electrodeposition. Mater. Des. 2015, 80, 1–11. [Google Scholar] [CrossRef] [Green Version]
- Srivastava, M.; Selvi, V.E.; Grips, V.K.W.; Rajam, K.S. Corrosion resistance and microstructure of electrodeposited nickel–cobalt alloy coatings. Surf. Coat. Technol. 2006, 201, 3051–3060. [Google Scholar] [CrossRef]
- Dolati, A.; Sababi, M.; Nouri, E.; Ghorbani, M. A study on the kinetic of the electrodeposited Co–Ni alloy thin films in sulfate solution. Mater. Chem. Phys. 2007, 102, 118–124. [Google Scholar] [CrossRef]
- Marikkannu, K.R.; Kalaignan, G.P.; Vasudevan, T. The role of additives in the electrodeposition of nickel–cobalt alloy from acetate electrolyte. J. Alloys Compd. 2007, 438, 332–336. [Google Scholar] [CrossRef]
- Hart, T.; Watson, A. Electroforming. Met. Finish. 2000, 100, 372–383. [Google Scholar] [CrossRef]
- Sr, M.S.; Grips, V.K.W.; Jain, A.; Rajam, K.S. Influence of SiC particle size on the structure and tribological properties of Ni–Co composites. Surf. Coat. Technol. 2007, 202, 310–318. [Google Scholar]
- Srivastava, M.; WilliamGrips, V.K.; Rajam, K.S. Electrochemical deposition and tribological behaviour of Ni and Ni–Co metal matrix composites with SiC nano-particles. Appl. Surf. Sci. 2007, 253, 3814–3824. [Google Scholar] [CrossRef]
- Wu, G.; Li, N.; Zhou, D.R. Electrochemical anomalous codeposition of Co-Ni alloys from sulfamate electrolytes and its mechanism. J. Chem. Eng. Chin. Univ. 2005, 19, 48–53. [Google Scholar]
- Kumar, K.; Chandramohan, R.; Kalyanaraman, D. Effect of heat treatment on cobalt and nickel electroplated surfaces with Cr2O3 dispersion. Appl. Surf. Sci. 2004, 227, 383–386. [Google Scholar] [CrossRef]
- Shi, L.; Sun, C.F.; Gao, P.; Zhou, F.; Liu, W.M. Electrodeposition and characterization of Ni–Co–carbon nanotubes composite coatings. Surf. Coat. Technol. 2006, 200, 4870–4875. [Google Scholar] [CrossRef]
- Wang, W.; Hou, F.Y.; Wang, H.; Guo, H.T. Fabrication and characterization of Ni–ZrO2 composite nano-coatings by pulse electrodeposition. Scr. Mater. 2005, 53, 613–618. [Google Scholar] [CrossRef]
- Zhang, K.F.; Ding, S.; Wang, G.F. Different superplastic deformation behavior of nanocrystalline Ni and ZrO2/Ni nanocomposite. Mater. Lett. 2008, 62, 719–722. [Google Scholar] [CrossRef]
- Cao, J.Q. Effect of Cr (VI) on the deposition of Nickel. J. Nanchang Hangkong Univ. Nat. Sci. 1994, 14–19. (In Chinese) [Google Scholar]
- Tan, C.; Cui, H.; Hu, W.; Liu, Y.; Zheng, Z. Influence of nano-Al2O3 particles on nickel electrocrystallization at initial stage. Rare Met. Mater. Eng. 2010, 39, 10–16. [Google Scholar]
- Vathsala, K. Zn–ZrO2 nanocomposite coatings: Elecrodeposition and evaluation of corrosion resistance. Appl. Surf. Sci. 2011, 257, 8929–8936. [Google Scholar] [CrossRef]
- Scharifker, B.; Hills, G. Theoretical and experimental studies of multiple nucleation. Electrochim. Acta 1983, 28, 879–889. [Google Scholar] [CrossRef]
- Raeissi, K.; Saatchi, A.; Golozar, M.A. Effect of nucleation mode on the morphology and texture of electrodeposited zinc. J. Appl. Electrochem. 2003, 33, 635–642. [Google Scholar] [CrossRef]
- Wu, G.; Li, N.; Wang, D.L.; Zhou, D.R.; Xu, B.Q.; Mitsuo, K. Effect of α-Al2O3 particles on the electrochemical codeposition of Co–Ni alloys from sulfamate electrolytes. Mater. Chem. Phys. 2004, 87, 411–419. [Google Scholar] [CrossRef]
- Palomar-Pardavé, M.; Scharifker, B.R.; Arce, E.M.; Romero-Romo, M. Nucleation and diffusion-controlled growth of electroactive centers: Reduction of protons during cobalt electrodeposition. Electrochim. Acta 2005, 50, 4736–4745. [Google Scholar] [CrossRef]
- Song, L.X.; Zhang, Z.; Zhang, J.Q.; Chunan, C. Electroplating mechanism of nanostructured black Ni films. Acta Metall. Sin. 2011, 47, 123–128. [Google Scholar]
- Nowak, P.; Socha, R.P.; Kaisheva, M.; Fransaer, J.; Celis, J.P.; Stoinov, Z. Electrochemical investigation of the codeposition of SiC and SiO2 particles with nickel. J. Appl. Electrochem. 2004, 21, 429–437. [Google Scholar]
- Monshi, A.; Foroughi, M.R.; Monshi, M.R. Modified scherrer equation to estimate more accurately nano-crystallite size using XRD. World J. Nano Sci. Eng. 2012, 2, 154–160. [Google Scholar] [CrossRef]
Figure 1.
Cyclic voltammetry (CV) curves on pure copper in electrolyte with and without nano-ZrO2 particles, scan rate 100 mV/s, ultrasonic power 100 W, T = 40 °C, and pH = 4.
Figure 1.
Cyclic voltammetry (CV) curves on pure copper in electrolyte with and without nano-ZrO2 particles, scan rate 100 mV/s, ultrasonic power 100 W, T = 40 °C, and pH = 4.
Figure 2.
Open circuit potential curves of Ni-Co alloy and Ni-Co-ZrO2 composite, respectively.
Figure 3.
I~t curves for (a) Ni-Co and (b) Ni-Co-ZrO2 deposition on pure copper plate at different potential, ultrasonic power 100 W, T = 40 °C, pH = 4.
Figure 3.
I~t curves for (a) Ni-Co and (b) Ni-Co-ZrO2 deposition on pure copper plate at different potential, ultrasonic power 100 W, T = 40 °C, pH = 4.
Figure 4.
Dimensionless plots (I/Im)2~(t/tm): (a) Ni-Co layer; (b) Ni-Co-ZrO2 multiple coatings, ultrasonic power 100 W, T = 40 °C and pH = 4.
Figure 4.
Dimensionless plots (I/Im)2~(t/tm): (a) Ni-Co layer; (b) Ni-Co-ZrO2 multiple coatings, ultrasonic power 100 W, T = 40 °C and pH = 4.
Figure 5.
Nonlinear fitting curves for experimental transient curves by use of Equation (5) (a) Ni-Co layer and (b) Ni-Co-ZrO2 composite deposition, potential range at −1.15 V and −1.25 V, ultrasonic power 100 W, T = 40 °C and pH = 4.
Figure 5.
Nonlinear fitting curves for experimental transient curves by use of Equation (5) (a) Ni-Co layer and (b) Ni-Co-ZrO2 composite deposition, potential range at −1.15 V and −1.25 V, ultrasonic power 100 W, T = 40 °C and pH = 4.
Figure 6.
Nyquist curves for Ni-Co-ZrO2 multiple coatings electroplated on copper surface, (a) measured at -0.2 V to -0.8 V(vs.SCE), (b) measured at -1.0 V to -1.10 V(vs.SCE), ultrasonic power 100 W, T = 40 °C, and pH = 4.
Figure 6.
Nyquist curves for Ni-Co-ZrO2 multiple coatings electroplated on copper surface, (a) measured at -0.2 V to -0.8 V(vs.SCE), (b) measured at -1.0 V to -1.10 V(vs.SCE), ultrasonic power 100 W, T = 40 °C, and pH = 4.
Figure 7.
(a) Experimental Nyquist plots (with bode) and fitting curves for deposition on pure copper plate in electrolyte, potential was at −1.10 V, ultrasonic power 100 W, T = 40 °C, and pH = 4; (b) Bode spectra; (c) Simulated impedance spectra for deposits.
Figure 7.
(a) Experimental Nyquist plots (with bode) and fitting curves for deposition on pure copper plate in electrolyte, potential was at −1.10 V, ultrasonic power 100 W, T = 40 °C, and pH = 4; (b) Bode spectra; (c) Simulated impedance spectra for deposits.
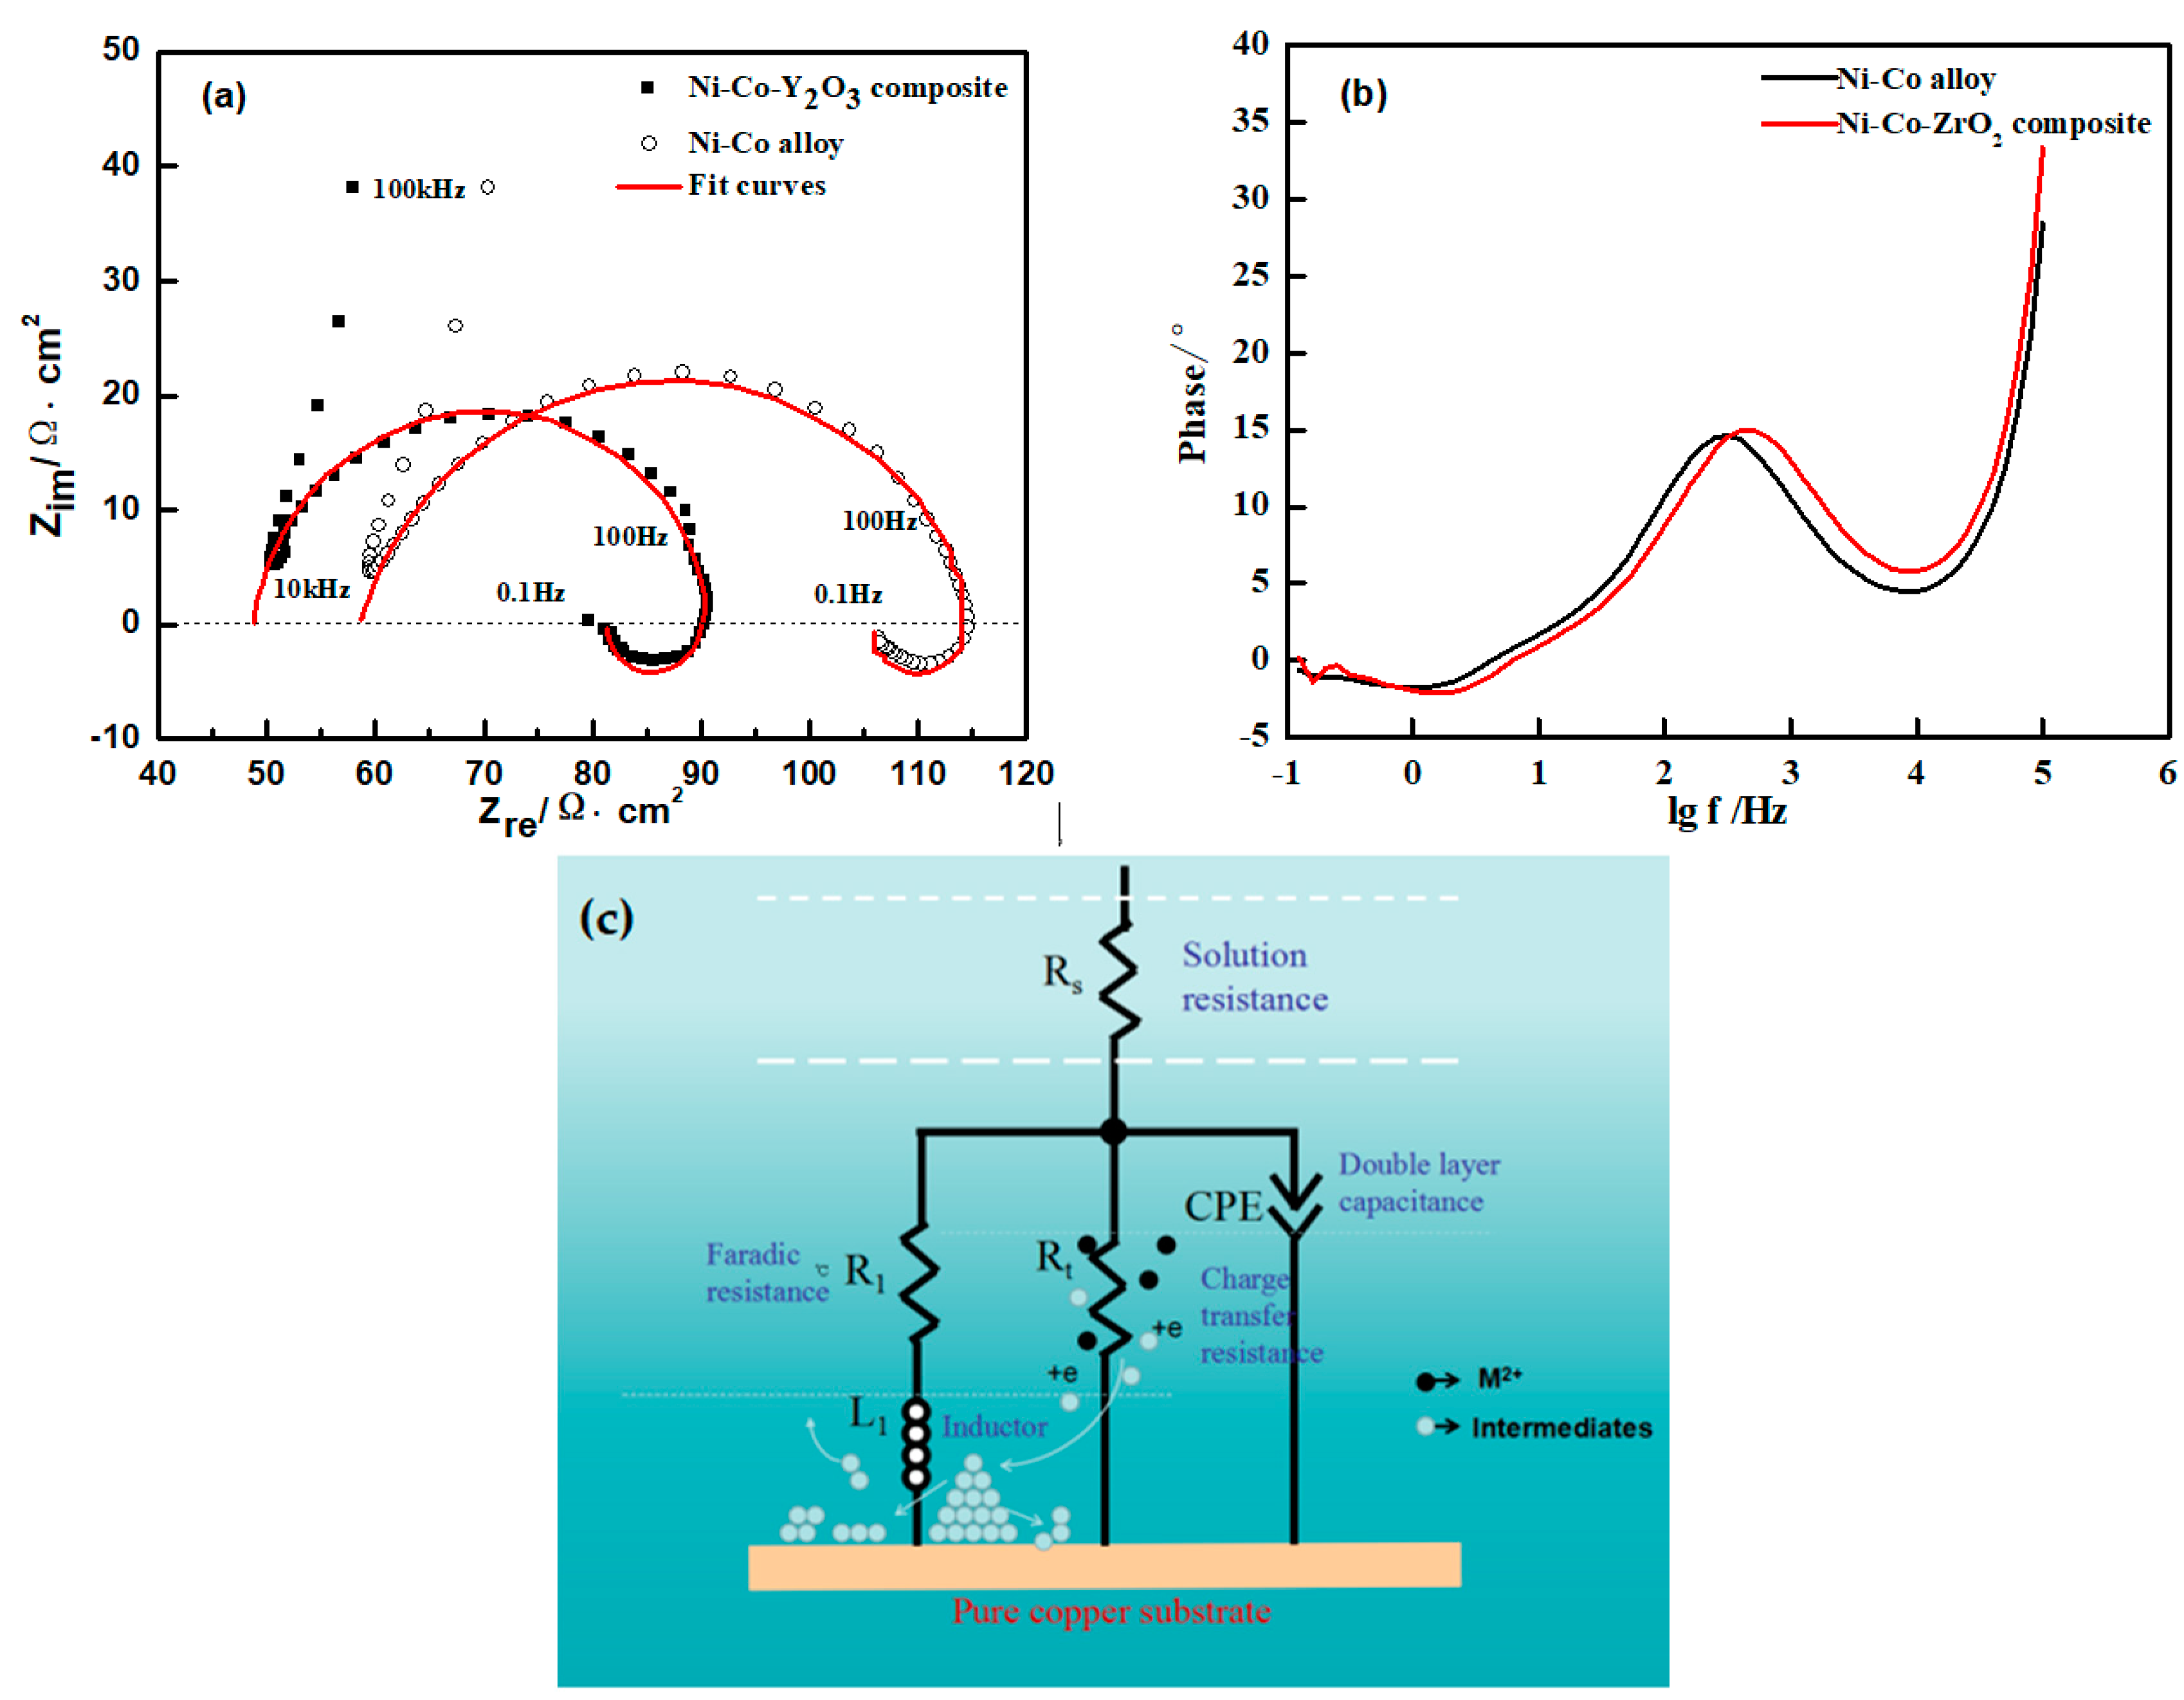
Figure 8.
X-ray diffraction patterns for the two depositions.
Figure 9.
Scanning electron microscope (SEM) images for the coatings: (a) Pure copper plate; (b) nano-ZrO2 particles; (c) Ni-Co layer; (d) Ni-Co layer; (e)Ni-Co-ZrO2 multiple coating; (f) Ni-Co-ZrO2 multiple coatings.
Figure 9.
Scanning electron microscope (SEM) images for the coatings: (a) Pure copper plate; (b) nano-ZrO2 particles; (c) Ni-Co layer; (d) Ni-Co layer; (e)Ni-Co-ZrO2 multiple coating; (f) Ni-Co-ZrO2 multiple coatings.

Table 1.
The composition of electroplating solution and electrodeposition parameters.
| Bath Constituents | Bath Parameters |
|---|---|
| Ni(NH2SO3)2·4H2O—80 g/L(source of Ni2+) | Current density—5 × 10⁻² A/m2 |
| Co(NH2SO3)2·4H2O—20 g/L(source of Co2+) | Temperature—40 ± 2 °C |
| H3BO3—40 g/L | Ultrasonic power—100 W |
| ZrO2—10 g/L | pH = 4 |
Table 2.
Optimal nucleation kinetic parameters derived from Equation (5).
| Materials | Potential (V) | P1* (μA cm−2) | P2 (s−1) | P3 (s−1) | P4 (μA cm−2) | A (s−1) |
|---|---|---|---|---|---|---|
| Ni-Co | −1.15 | −1.80 | 0.13974 | 1.72 | −4.38 | 1.72 |
| Ni-Co | −1.25 | −1.95 | 0.33107 | 2.91 | −6.52 | 2.91 |
| Ni-Co-ZrO2 | −1.15 | −2.02 | 0.37832 | 1.95 | −0.89313 | 1.95 |
| Ni-Co-ZrO2 | −1.25 | −3.36 | 0.83355 | 2.49 | −0.89541 | 2.49 |
Table 3.
Impedance parameters of materials electrodeposition at −1.10 V.
| Materials | Potential (V) | Rs/Ω cm2 | CPE1-P/F cm2 | Rt/Ω cm2 | R1/Ω cm2 | L1/H cm2 |
|---|---|---|---|---|---|---|
| Ni-Co | −1.10 | 55.56 | 5.2 × 10⁻⁵ | 54.89 | 249.8 | 34.52 |
| Ni-Co-ZrO2 | −1.10 | 45.48 | 4.1 × 10⁻⁵ | 43.36 | 133.7 | 7.989 |
Table 4.
Atomic percentage of each element in the coatings (wt %).
| Materials | Ni | Co | O | Zr | Total |
|---|---|---|---|---|---|
| Ni-Co | 63.55 | 36.45 | – | – | 100 |
| Ni-Co-ZrO2 | 59.66 | 21.39 | 12.57 | 6.38 | 100 |
© 2018 by the authors. Licensee MDPI, Basel, Switzerland. This article is an open access article distributed under the terms and conditions of the Creative Commons Attribution (CC BY) license (http://creativecommons.org/licenses/by/4.0/).
Share and Cite
MDPI and ACS Style
Wang, Y.; Zhou, X.; Liang, Z.; Jin, H. Characterization of Ultrasonic-Assisted Electrochemical Deposition of Ni-Co-ZrO2. Coatings 2018, 8, 211. https://doi.org/10.3390/coatings8060211
AMA Style
Wang Y, Zhou X, Liang Z, Jin H. Characterization of Ultrasonic-Assisted Electrochemical Deposition of Ni-Co-ZrO2. Coatings. 2018; 8(6):211. https://doi.org/10.3390/coatings8060211
Chicago/Turabian StyleWang, Yiyong, Xinyu Zhou, Zhipeng Liang, and Hui Jin. 2018. "Characterization of Ultrasonic-Assisted Electrochemical Deposition of Ni-Co-ZrO2" Coatings 8, no. 6: 211. https://doi.org/10.3390/coatings8060211
Note that from the first issue of 2016, this journal uses article numbers instead of page numbers. See further details here.