Raman Microscopy for Classification and Chemical Surface Mapping of Barrier Coatings on Paper with Oil-Filled Organic Nanoparticles


Applied and Analytical Chemistry, Institute for Materials Research (IMO-IMOMEC), University of Hasselt, B-3590 Diepenbeek, Belgium
Coatings 2018, 8(5), 154; https://doi.org/10.3390/coatings8050154
Submission received: 11 February 2018
/
Revised: 11 March 2018
/
Accepted: 20 March 2018
/
Published: 24 April 2018
(This article belongs to the Special Issue Functional Coatings for Food Packaging Applications)
Abstract
:The creation of functional papers requires a specific deposition of chemical moieties at the surface. In particular, water-repellent barrier coatings can be formed by the deposition of (poly(styrene-co-maleimide) nanoparticles filled with different vegetable oils. The analysis of coated paper surfaces by dispersive Raman spectroscopy allows for statistical classification of different coating types and chemical mapping of the lateral surface distribution of the coating components. The Raman spectra were used to quantify the amount of free oil and imide content. The partial least squares model with three principal components (PC) could differentiate between the type of oil (degree of saturation in PC-1), coating thickness (cellulose bands of paper substrate in PC-2), and organic coating phase (styrene, imide in PC-3). The chemical surface maps with average intensities indicate coating inhomogeneities for thin coatings located near the organic coating components, while the presence of free oil acts as a natural binder in between the organic phase and provides a more homogeneous coating. Depending on the type of oil, a higher amount of free oil coincides with lower imide content at the surface. The surface coverage of polyunsaturated oils overlaps relatively well with the areas of organic coating components, as the oil is largely encapsulated. The surface coverage for mono- and unsaturated oils is rather complementary to the organic phase as there are larger amounts of free oil. The latter is confirmed by single wavenumber maps and image processing constructing composite chemical surface maps.

1. Introduction
The surface properties of paper are manipulated by the deposition of a coating layer containing an organic binder and different organic or inorganic fillers. In particular, the barrier properties and water repellence of cellulose substrates can be tuned by altering the chemical composition and topography of the surface. As cellulose materials are highly hydrophilic in nature, the protection against water is a primary requirement for controlling the barrier properties of packaging papers. The traditional methods of internal sizing and surface sizing provide a first barrier against water, but often cannot meet the requirements for modern packaging applications. Therefore, huge progress in nanoparticle deposition and functionalized additives was made in the last decade, as reviewed elsewhere [1].The nanoparticles can be applied as local deposits on single cellulose fibers or as fillers in a paper coating to create various functionalities [2]. The metallic nanoparticles, e.g., silica [3] or titania [4], have been sprayed as a thin top-coating layer to improve the hydrophobicity. A simple, low-cost method involves the dispersion of silica nanoparticles in a silane/siloxane solution for the treatment of different paper grades by brush [5]. The fluorinated silica nanoparticles have also been deposited through one-step spray-coating, providing mechanical robustness together with self-cleaning and anti-icing [6]. Driven by environmental concerns, fluorine derivatives have been replaced by alternative materials with hydrophobic properties. Organic nanoparticles with surface-modified nanocellulose have been incorporated into coating formulations [7]. Other types of organics such as vegetable oils may also possess good potential to serve as a hydrophobic coating [8]. As an advantage of using nanoparticles instead of a polymer/oil mixture as protective barrier coating, the encapsulation of oils into an organic carrier material can provide better protection of the oil against oxidative degradation [9]. Moreover, the local presentation at the surface of functional chemical groups and hydrophobic moieties can be better controlled using nanoparticles. The high surface area of the nanoparticles allows us to increase the efficiency in presentation of the hydrophobic groups at the surface and the deposition of the nanoparticles in a top coating layer prevents the flow of the hydrophobic oil towards the bulk of the porous paper structure. In addition, nanoscale changes in the surface morphology contribute to the creation of a surface structure with hierarchical nano- to microscale roughness. However, the local deposition and lateral distribution of hydrophobic moieties at the surface are the most important parameter to create efficient barrier properties.
Raman spectroscopy is an appropriate analytical tool for paper analysis as it can be applied to water-based systems and water-sensitive materials such as cellulose fibers, where the water is strongly absorbing in the IR region but weak in Raman scattering. The confocal Raman imaging allows us to study the distribution of chemical compounds of paper coatings in the sub-micrometer range with adequate sensibility, spatial and depth resolution to differentiate between surface features and the substrate [10]. The local organization of a styrene–butadiene latex and calcium carbonate fillers in a paper coating has been observed, while information about the ink density in a printed top layer could be obtained simultaneously [11,12]. By appropriate selection of objectives and measuring times, the depth profiles with variations in latex content in z-direction of a coating were determined [13]. In particular, the migration of various pigments in the paper coating was followed [14]. Different paper coating fillers such as ground calcium carbonate (GCC) and precipitated calcium carbonate (PCC) could be differentiated and the spatial distribution of coatings containing a mixture of both components was monitored [15]. However, the technique was less effective at differentiating between minor coating components such as rheology modifiers and dispersants [16]. The other pigments such as calcium carbonate, talcum, gypsum, titanium dioxide (rutile/anatase crystalline forms), optical brighteners, and kaolinite could be detected [17]. The kaolinite has characteristic Raman bands, but they are often masked by fluorescence due to impurities in the sample [18]. Other disturbing effects for paper coatings include non-uniformities in geometry and morphology of the substrate, causing scattering effects. These effects can hinder the quantification of the coating components and calibration curves, baseline correction, or band intensity ratio calculations are needed to determine the relative amounts of each component. The more advanced systems with microcapsules in polymeric coatings have been more recently investigated by confocal Raman microscopy [19].
In this paper, the surface properties of a hydrophobic barrier coating on paper with poly(styrene-co-maleimide) nanoparticles and encapsulated vegetable oils (SMI/oil) are monitored as an example coating system by chemical mapping using Raman spectroscopy. The suitability of SMI/oil nanoparticles as a waterborne coating formulation has been proven by studying their rheological properties [20]: a comparison of pure SMI and SMI/oil dispersions (35 wt %) illustrates that the presence of oil induces viscoelastic behaviour and decreases the viscosity by an order of magnitude. The rotational rheometry shows good stability and reproducibility with no hysteresis for SMI/oil dispersions, in contrast to pure SMI dispersions. In particular, the present study focuses on an analytical method of describing the surface chemistry of the SMI/oil coatings. The understanding of in-plane lateral distribution (x, y) of the coating moieties (styrene, imide, oil) in relation to the type of selected oil type is important to gain better control over the surface properties and the presence of specific functional groups. First, Raman spectroscopy is used for statistical classification of coatings with different oil types by principal component analysis. Second, the distribution of different chemical moieties is visualized and shows various surface coverage depending on the degree of saturation and reactivity of the oil.
2. Materials and Methods
2.1. Materials for Paper Coating and Coating Application
An aqueous dispersion of hybrid organic nanoparticles was obtained by the imidization reaction of a given high-molecular-weight poly(styrene-co-maleic anhydride) or SMA copolymer (molecular weight Mw = 80.000 mol, 26 mol % maleic anhydride), in the presence of ammonium hydroxide (NH4OH) and different types of vegetable oil. The resulting hybrid organic nanoparticles of poly(styrene-co-maleimide) or SMI with oil (SMI/oil) were obtained in combination with soy oil (SO), corn oil (CO), rapeseed oil (RO), sunflower oil (SfO), castor oil (CaO), and hydrogenated castor oil (HCO). More details about the reaction conditions and a full characterization of the aqueous nanoparticle dispersions as well as the dried nanoparticles can be found elsewhere [21]. Some characteristics of the oil qualities and SMI/oil nanoparticle dispersions are summarized in Table 1: the solid content (S.C.) was determined by infrared drying and weighing (LP16, Mettler Toledo, Greifensee, Switzerland); the viscosity was measured with a portable viscosity meter (Brookfield, DV-II Pro, Brookfield Engineering Laboratories, Middleboro, MA, USA), using a spindle n°5 at rotation speed of 100 rpm, and the particle sizes were measured by dynamic light scattering (Nanosizer ZS90, Malvern, Malvern, UK).
The SMI/oil nanoparticle coatings were deposited onto a paper substrate with a laboratory-scale K303 Multi-coater (RK Print Coat Instruments Ltd., Royston, UK). Two different metering bars were used at a constant speed of 6 mm/s, resulting in a thin coating (dry weight 4.0 ± 0.2 g/m2) and a thick coating (dry weight 6.0 ± 0.2 g/m2). The base paper sheets (100 g/m2, thickness 125 µm, Mondi Business Paper, Vienna, Austria) contained bleached long-fiber and short-fiber kraft pulp with internal sizing and calendering. All coated paper samples were immediately dried in a circulating hot-air oven for 2 min at 120 °C, and stored in a controlled environment (23 °C, 60% RH) until further use. The characterization was done on the as-deposited coatings without any further processing (no calendering) to intentionally keep the specific micro- to nanoscale coating morphology.
2.2. Paper Coating Characterization
The scanning electron microscopy (SEM) was performed on a Hitachi Tabletop TM3000 microscope (Manufacturer, Krefeld, Germany) at different magnifications (800×, 2000×) and 15 kV voltage. An ultra-high-resolution image was obtained by FEG-SEM analysis using a FEI Nova 600 NanoLab focused ion beam workstation (Manufacturer, Hillsboro, OR, USA).
The confocal micro-Raman microscopy was performed on a dispersive Perkin Elmer Raman Flex 400 equipment (Manufacturer, Rodgau, Germany) with a multichannel charge-coupled array detector (CCD). The measuring conditions were optimized to avoid fluorescence and provide a good signal-to-noise ratio, using a of diode NIR laser (785 nm) with a maximum power output of 100 mW at the head and selecting a 40 mW measured laser power output at the sample position. The laser light was coupled to an optical microscope (Olympus BX51, Hamburg, Germany) equipped with a motorized piezoelectric x, y micro-Raman stage. The chemical Raman maps were recorded over a surface area of 5 × 5 mm2 using an objective lens of 20× (numerical aperture NA = 0.40) and a pinhole size of 50 µm. With a refractive index n = 1.5 for the samples, a lateral resolution of 2 µm and depth resolution of 5 µm was obtained. The Raman spectra were recorded at 100 × 100 points with 0.05 mm interdistance, 5 s exposure time, and six exposures per point (i.e., a total measuring time of about 14 h per map). The spectra were recorded at 3200–200 cm−1 with 4 cm−1 spectral resolution. The data were processed with Spectrum 10 analysis software (Perkin Elmer, Waltham, MA, USA) and Spectrum Image software (Version R1.7, Perkin Elmer, Waltham, MA, USA) to plot surface maps with average intensities, band ratio intensities, or single wavenumber intensities after normalization and baseline correction. Further processing of the Raman surface maps has been performed using the Image J processing software program (version 1.32j).
The statistical analysis of Raman spectra was done with Unscrambler 10.1 software. The input variables for the model were the baseline-corrected Raman spectra over the full wavenumber region. A calibration model for the principal component analysis (PCA) was developed by including 10 spectra per coating type (totally 60 spectra), recorded at random places over the coated surface area. The calibration model was verified by a cross-validation procedure, leaving out one of the calibration samples from the regression model and performing a new model for the remaining calibration samples. This validation method is considered when the number of samples is too small to have an independent training and validation set. The model was externally validated with an independent dataset (new coated paper samples), including five spectra per coating type that were recorded on independent surface areas.
3. Results
3.1. Paper Coating Morphology
The SEM images of thick and thin SMI/oil nanoparticle coatings on paper are shown in Figure 1 at magnifications of 800× and 2000×. A reference SEM image of the uncoated paper at the same magnifications can be found in the Supplementary Materials (see Figure S1 in Supplementary Materials).
The features of the base paper with cellulose fibers and internal paper fillers remain visible on the surface of thin coatings. The thin coating mainly fills the pores between the fibers and forms only a small layer on top of the fibers. The thick coatings almost fully cover the paper substrate with a more continuous layer. As pure nanoparticle dispersions are used here (no coating binder was used in order to study the intrinsic nanoparticle coating properties), the drying effects of the colloidal suspensions cause some coating defects, resulting in local cracks. The development of cracks in the drying of colloidal suspensions can be attributed to the role of packing and flocculation of the particles [22]. Therefore, the rheological properties of the SMI/oil nanoparticle types have been studied before [20], and the reduction in the surface tension (and consequent influences on capillary forces between nanoparticles) for the SMI/oil nanoparticles in comparison with the SMI nanoparticles is particularly beneficial to reduce the existence of cracks. Also, the smaller nanoparticle sizes of SMI/oil nanoparticles (20–50 nm) compared to pure SMI nanoparticles (100 nm) enhance the packing and reduce the tendency for cracking. The drying of the nanoparticle suspensions on porous substrates may induce stresses that can lead to a fracture of the thin film. However, the presence of oil may improve the coating homogeneity and partially functions as a natural binder. The dry thickness of thick coatings is about 10 ± 2 µm, and the dry thickness of thin coatings is about 7 ± 2 µm. Further detail of the coating structure (e.g., SMI/HCO) and presence of nanoparticles is illustrated in the FEG-SEM images in Figure 2.
3.2. Raman Spectroscopy and PCA Model
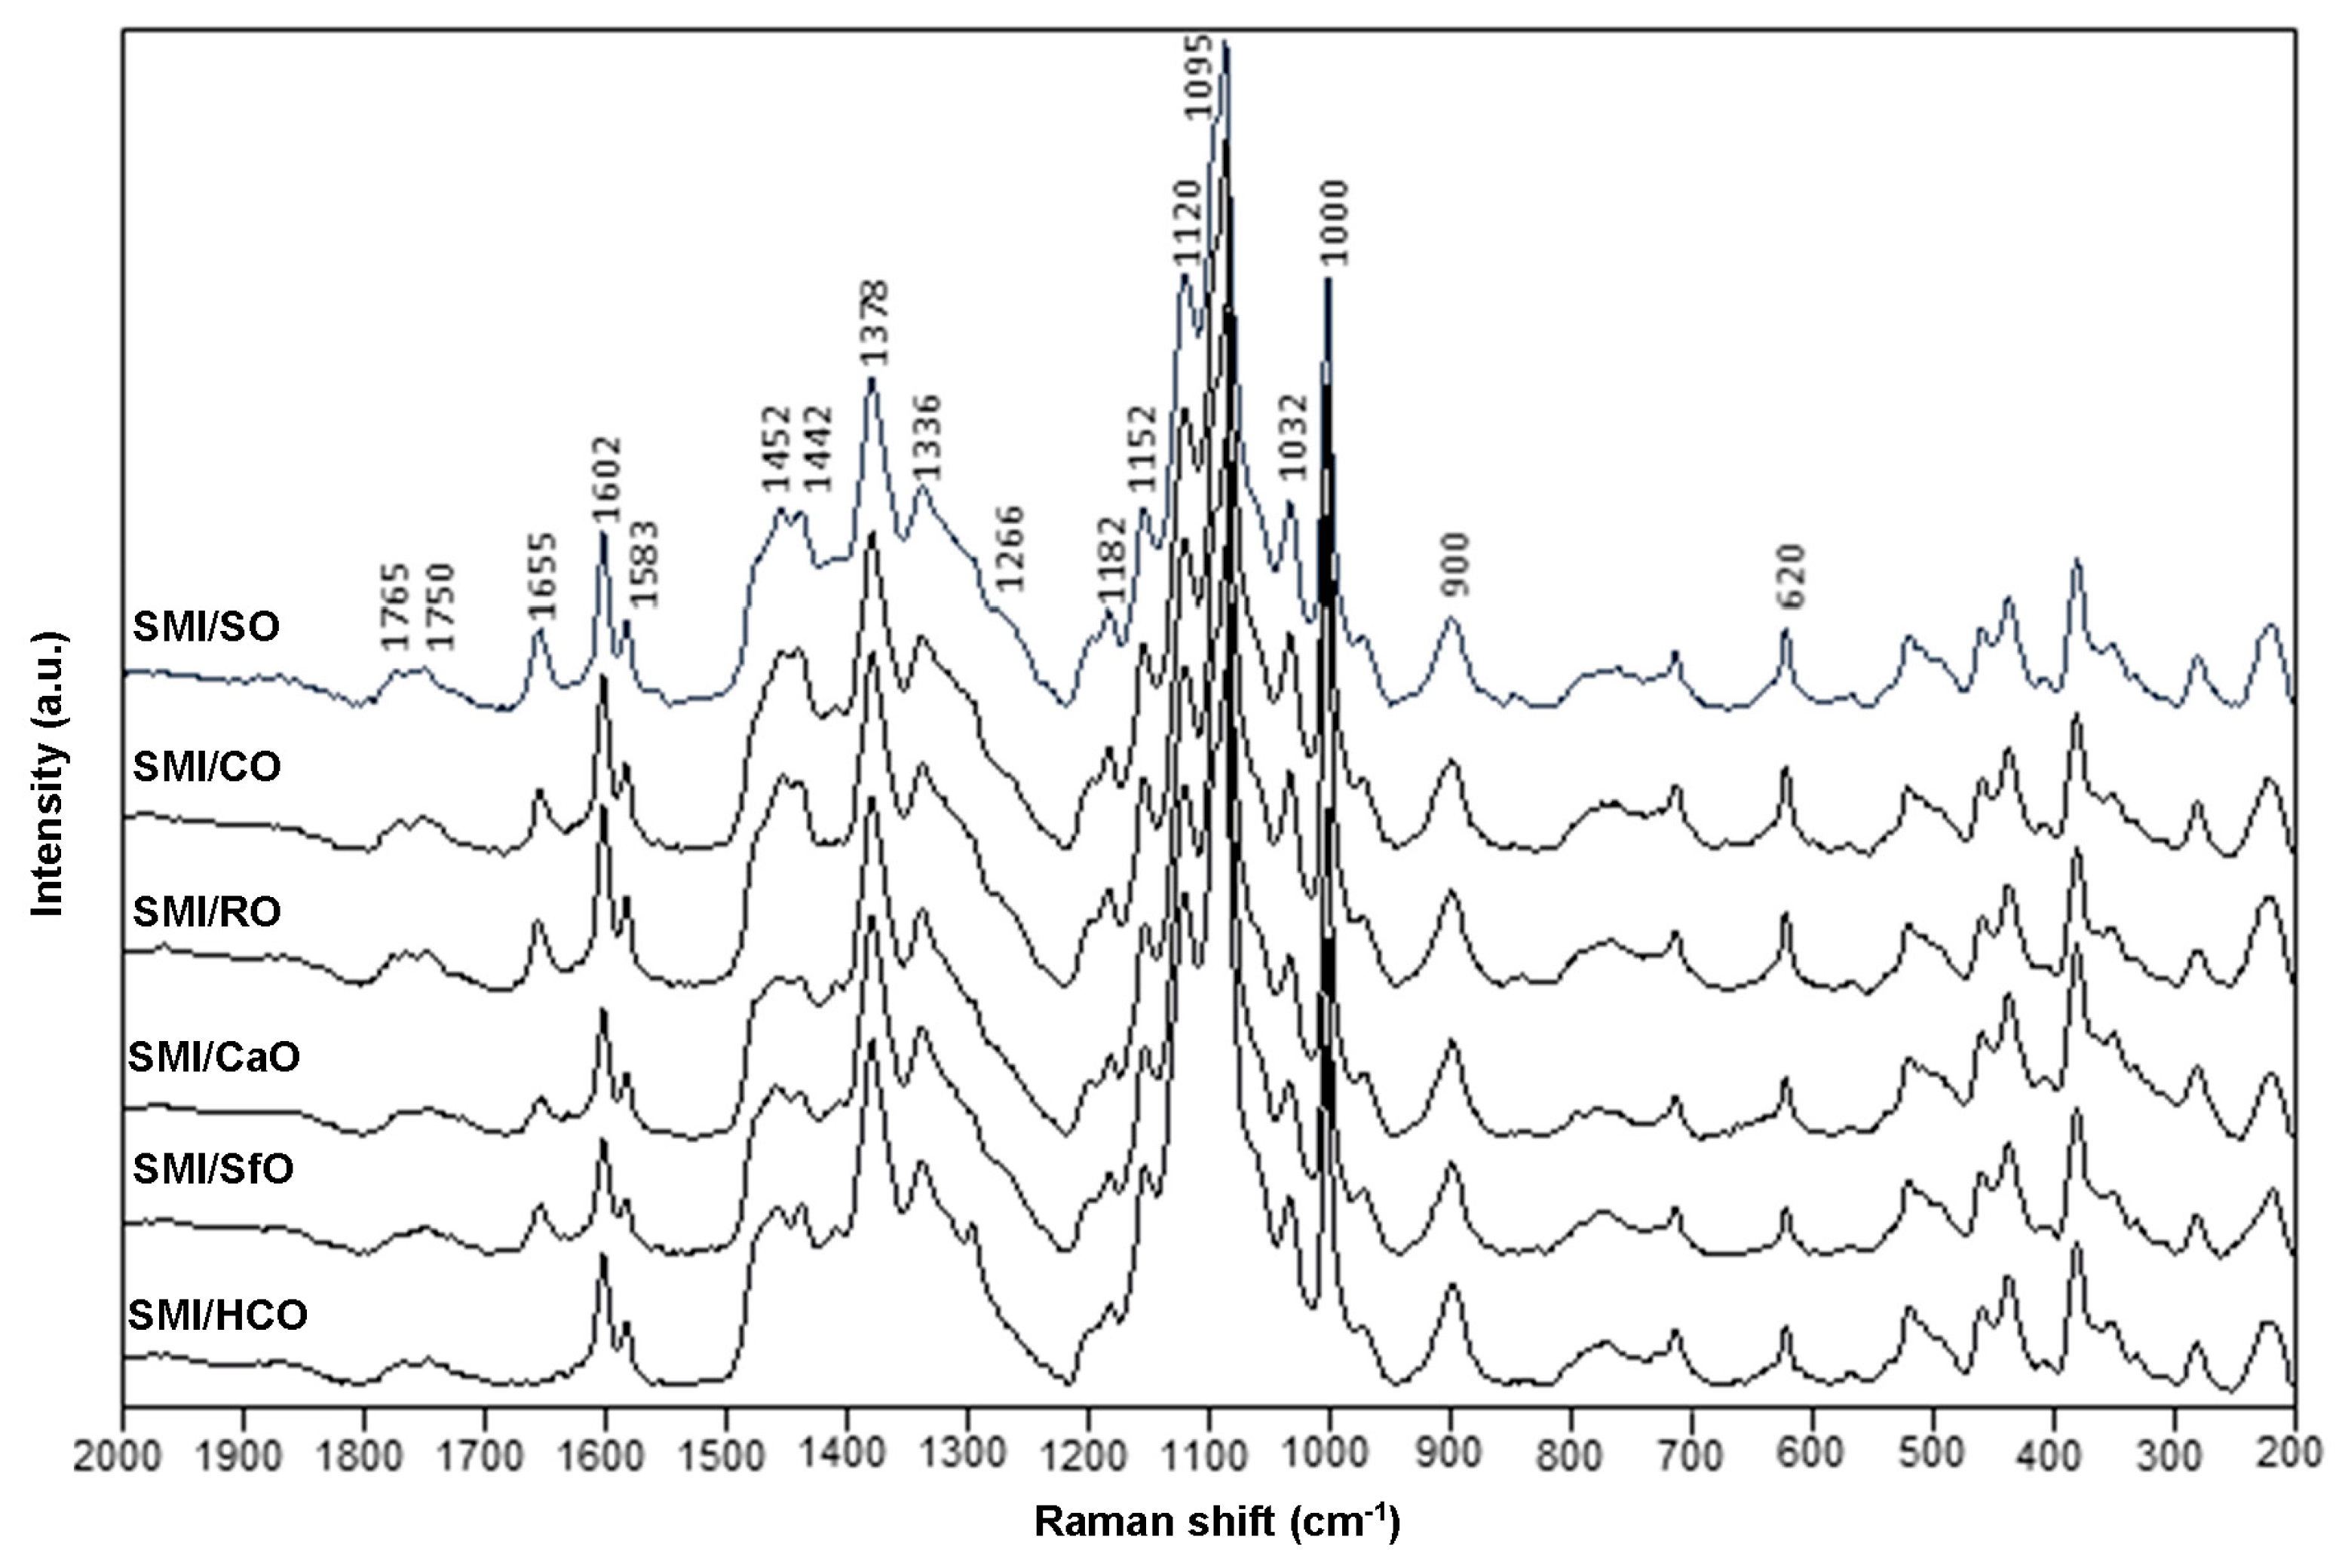
The fingerprint region of Raman spectra for different SMI/oil nanoparticle coatings on paper is illustrated in Figure 3 (see also Table 1 for band assignments in Supplementary Materials). For clarity of presentation, only the spectra of the thick coatings are represented, while the thin coatings give similar results within the fingerprint region (of course, with higher intensity of substrate-related cellulose bands).
The characteristic Raman bands for coating moieties (styrene, imide, and oil) and substrate (cellulose fibers) are clearly separated and allow for accurate characterization. The spectra have been normalized by integration of the region corresponding to the cellulose bands at 1170 to 1050 cm−1. The C=O ester bands for imide (1765 cm−1) and oil (1750 cm−1) are clearly resolved as distinct peaks. The band at 1655 cm−1 represents cis conformation (C=C) of the fatty acids and naturally occurs in vegetable oils, in contrast with the trans-isomers at around 1680–1670 cm-−1 in synthetic systems [23]. For fatty acids with the same chain length, the intensity at 1655 cm−1 increases in parallel with the degree of unsaturation [24], as follows: HCO (saturated fatty acids obtained after hydrogenation); SfO, CaO, RO (monounsaturated fatty acids); CO, SO (polyunsaturated fatty acids).
The imide content and amount of free oil can be quantified from the ratios of integrated Raman band areas of imide I (1765 cm−1), oil (1655 cm−1) and styrene (1602 cm−1), after calibration with a fully imidized pure SMI coating (no oil), as calculated in Table 2. Based on the SMA grade with 26 mol % maleic anhydride, the calculated imide content should be compared to a theoretical maximum imide content (relative to styrene parts) of 35%. Depending on the oil type, the imide content is lower than the theoretical maximum, which can be explained by the interference of oil with the imidization reaction (reactive C=C oil) and consequently remaining ammonolyzed maleic anhydride. A progressively higher amount of unreacted or ‘free’ oil is present in the coating as the imide content lowers: the amount of free oil is low for polyunsaturated oil (SMI/SO, SMI/CO), intermediate for monounsaturated oils (SMI/RO, SMI/SfO, SMI/CaO), and extremely high for saturated oils (SMI/HCO).
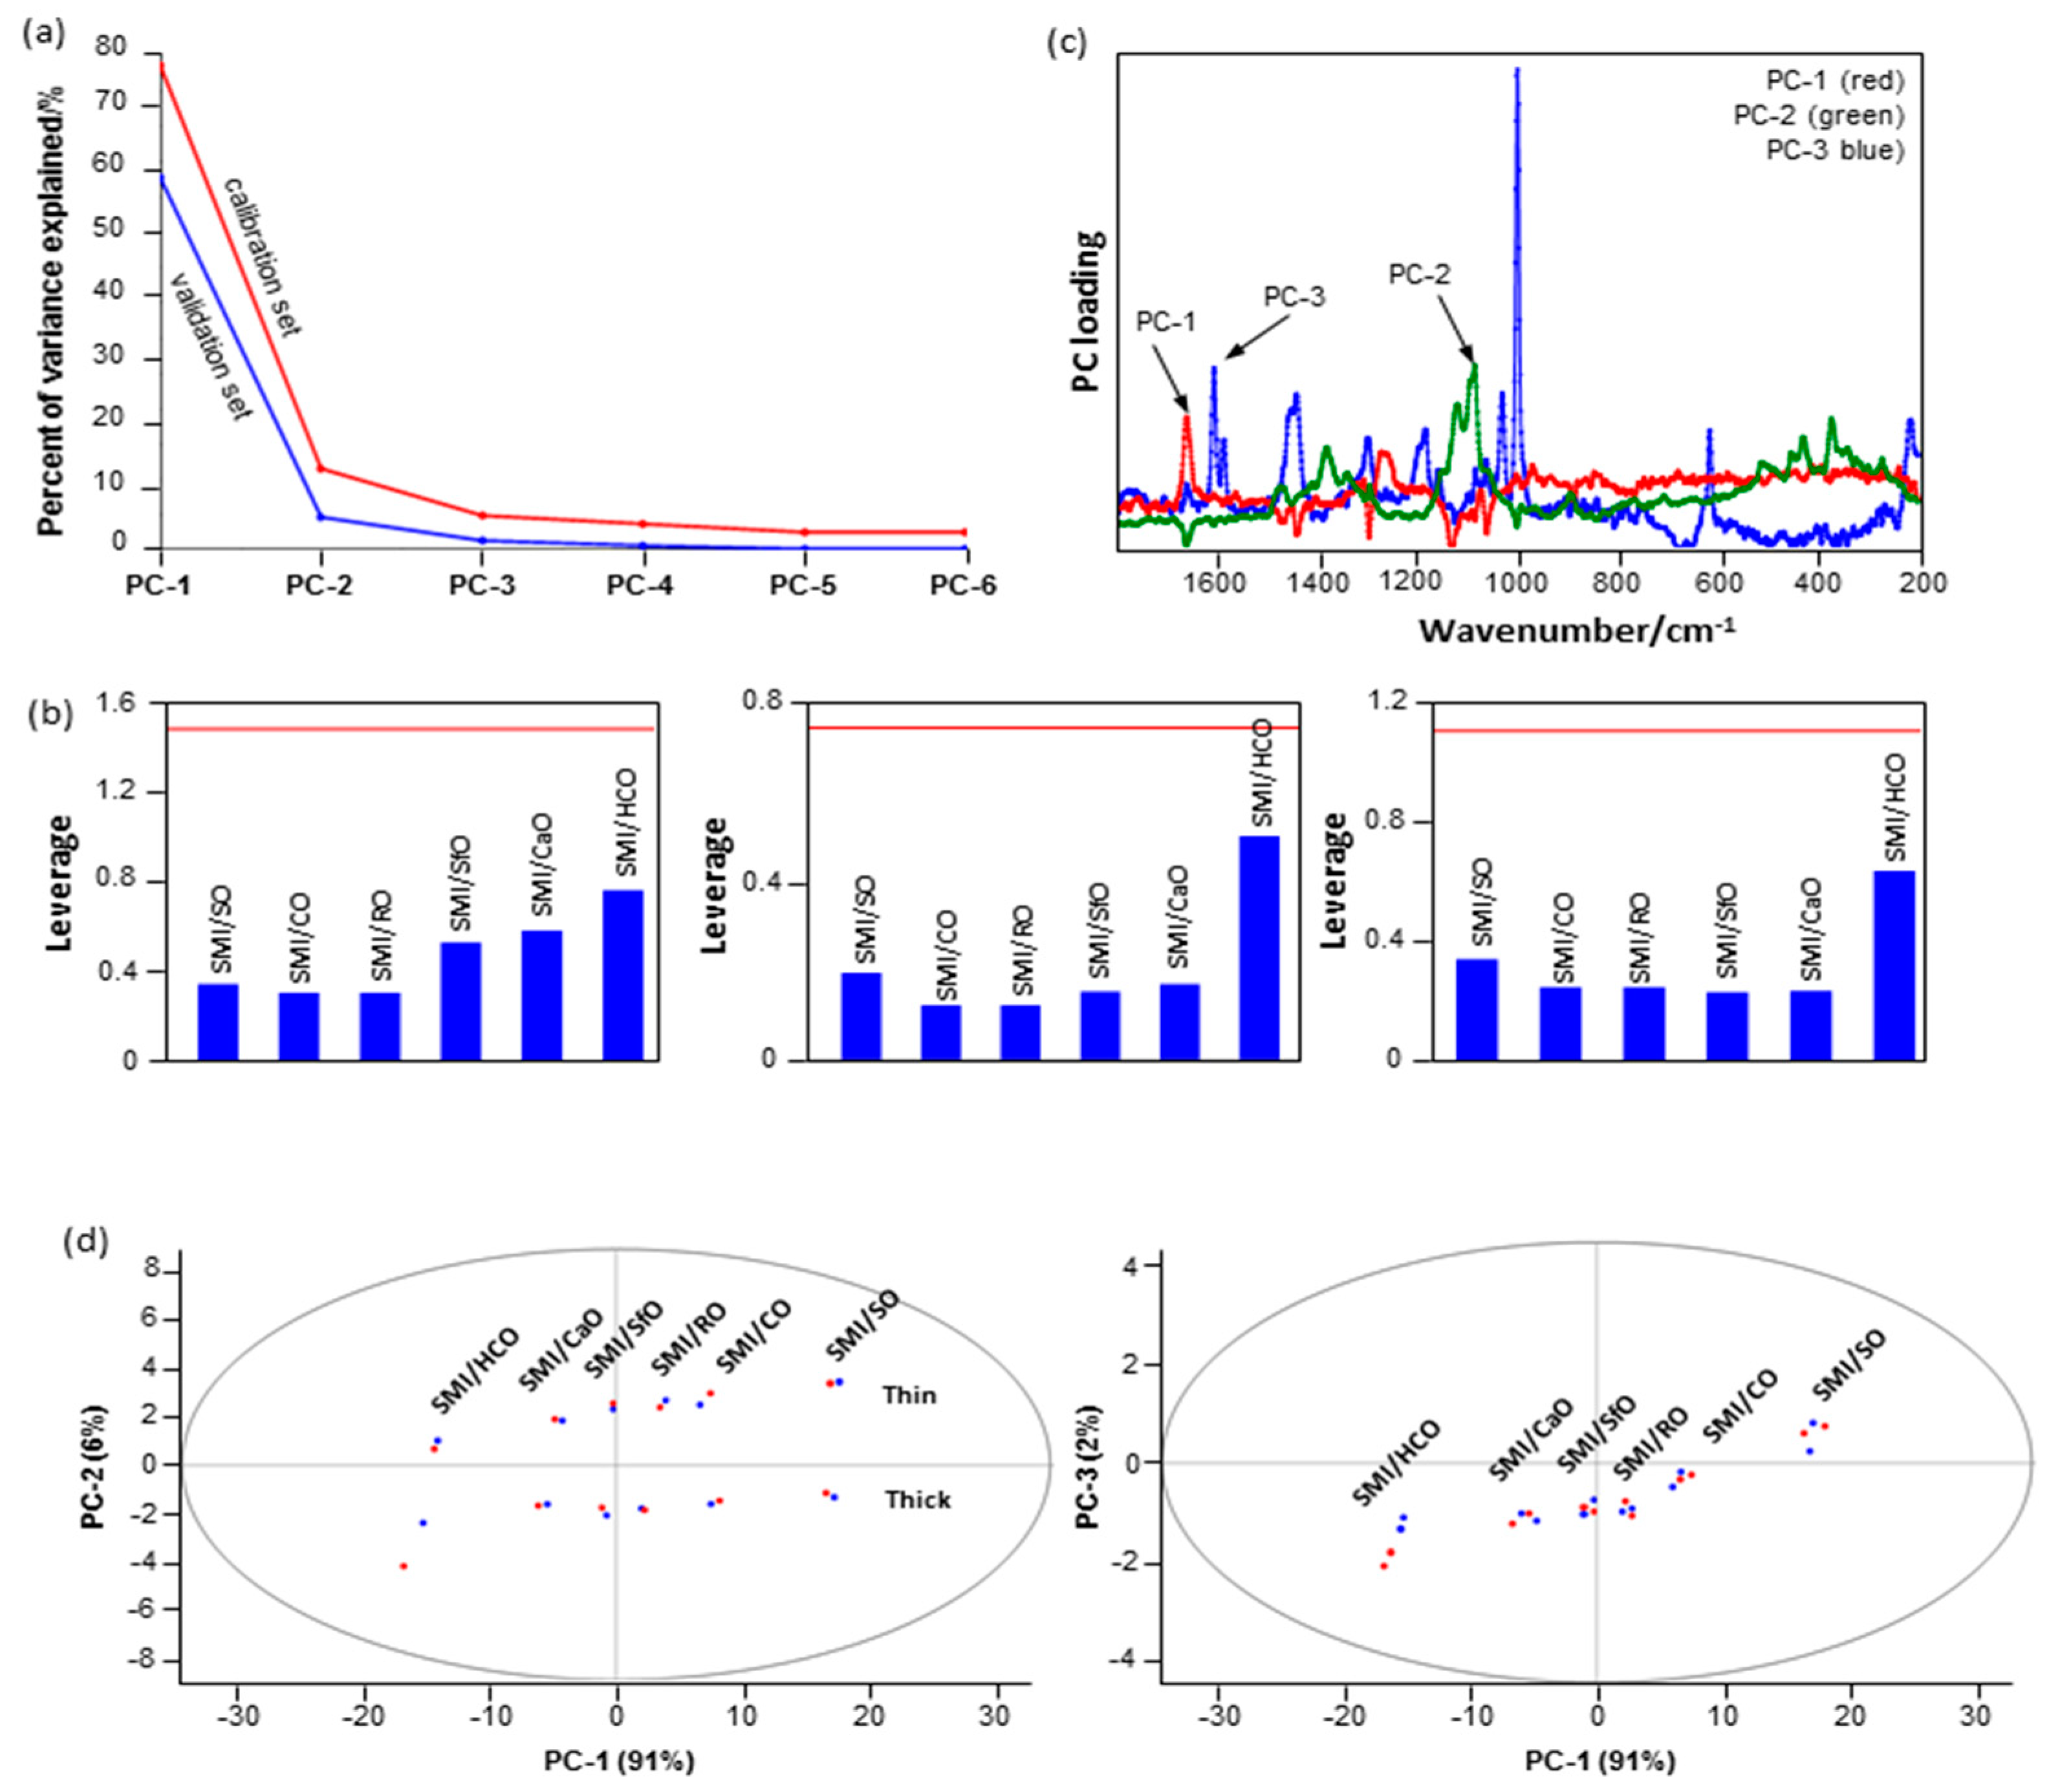
A model for the classification of the paper coatings based on principal component analysis (PCA) of the Raman spectra is presented in Figure 4. The analysis is used to define parameters that describe the variation in Raman spectra between the different coating types and illustrate major trends. The number of principal components (PC) included in the model is selected from a scree plot (Figure 4a). The variation in data points is most effectively described by a model with nearly zero residual variance and as few PCs as possible: the three principal components account for 97% of total variation (PC-1: 78%, PC-2: 12%, and PC-3: 7%), and the residual variance is very small for the higher-order components. The calibration model was evaluated by a leverage and residual analysis against PC-1, PC-2, and PC-3 to detect eventual outlier samples (Figure 4b). The samples with higher leverage are positioned further away from the mean value and have different characteristics: e.g., the leverage variation between the coating samples is somewhat larger for PC-1, while the leverage for PC-2 and PC-3 is almost the same. PC-1 consequently takes into account differences in oil type, discriminating between polyunsaturated, monounsaturated, and saturated oil. Only samples with high leverage and high residues would damage the model and should be removed from the model: as none of the samples simultaneously indicate high leverage and high residues, all samples fit into the model and each sample adds novel information to the model. The meaning of the different components in relation to the original Raman spectral bands can be recognized form the loading for individual PCs (Figure 4c): (i) the PC-1 (82% of the variation) includes specific characteristics related to the oil type (1655 cm−1); (ii) the PC-2 (10% of the variation) includes characteristics of the substrate (cellulose: 1120–1095 cm−1); and (iii) the PC-3 (4% of the variation) includes the characteristics of the organic phase (styrene: 1602, 1583, 1452, 1032, 1000, 620 cm−1; imide: 1765, 1329 cm−1). As such, single Raman bands make a major contribution to the individual PCs and can be used for statistical discrimination between the coatings. The two-dimensional score plots of individual PCs can be used for classification of the coated papers within the 95% confidence interval (Figure 4d). Test results of the graph include data for some representative samples from the calibration set (red points) and the validation set (blue points) with good agreement. From the score plot of PC-1 versus PC-2, the coated papers are classified according to the coating type in PC-1 and the coating thickness in PC-2. The discrimination of thick and thin coatings is related to the intensity of the Raman bands corresponding to the cellulose substrate, as reflected in PC-2. From the score plot PC-1 versus PC-3, the coated papers are classified according to the oil type, with polyunsaturated oils (SO, CO) having the highest PC values, monounsaturated oils (CaO, RO, SfO) having intermediate PC values, and the hydrogenated oils (HCO) having the lowest PC values. The latter classification is based on the relatively small variations in the organic composition of the coating (similar styrene content and slightly variable imide content), as reflected in PC-3.
3.3. Raman Chemical Mapping (Average Intensities)
The chemical surface maps of coated papers (top view on 5 × 5 mm2 surface area) with different SMI/oil compositions were recorded to study the surface coverage, homogeneity, and distribution of different chemical moieties within the coating layer.
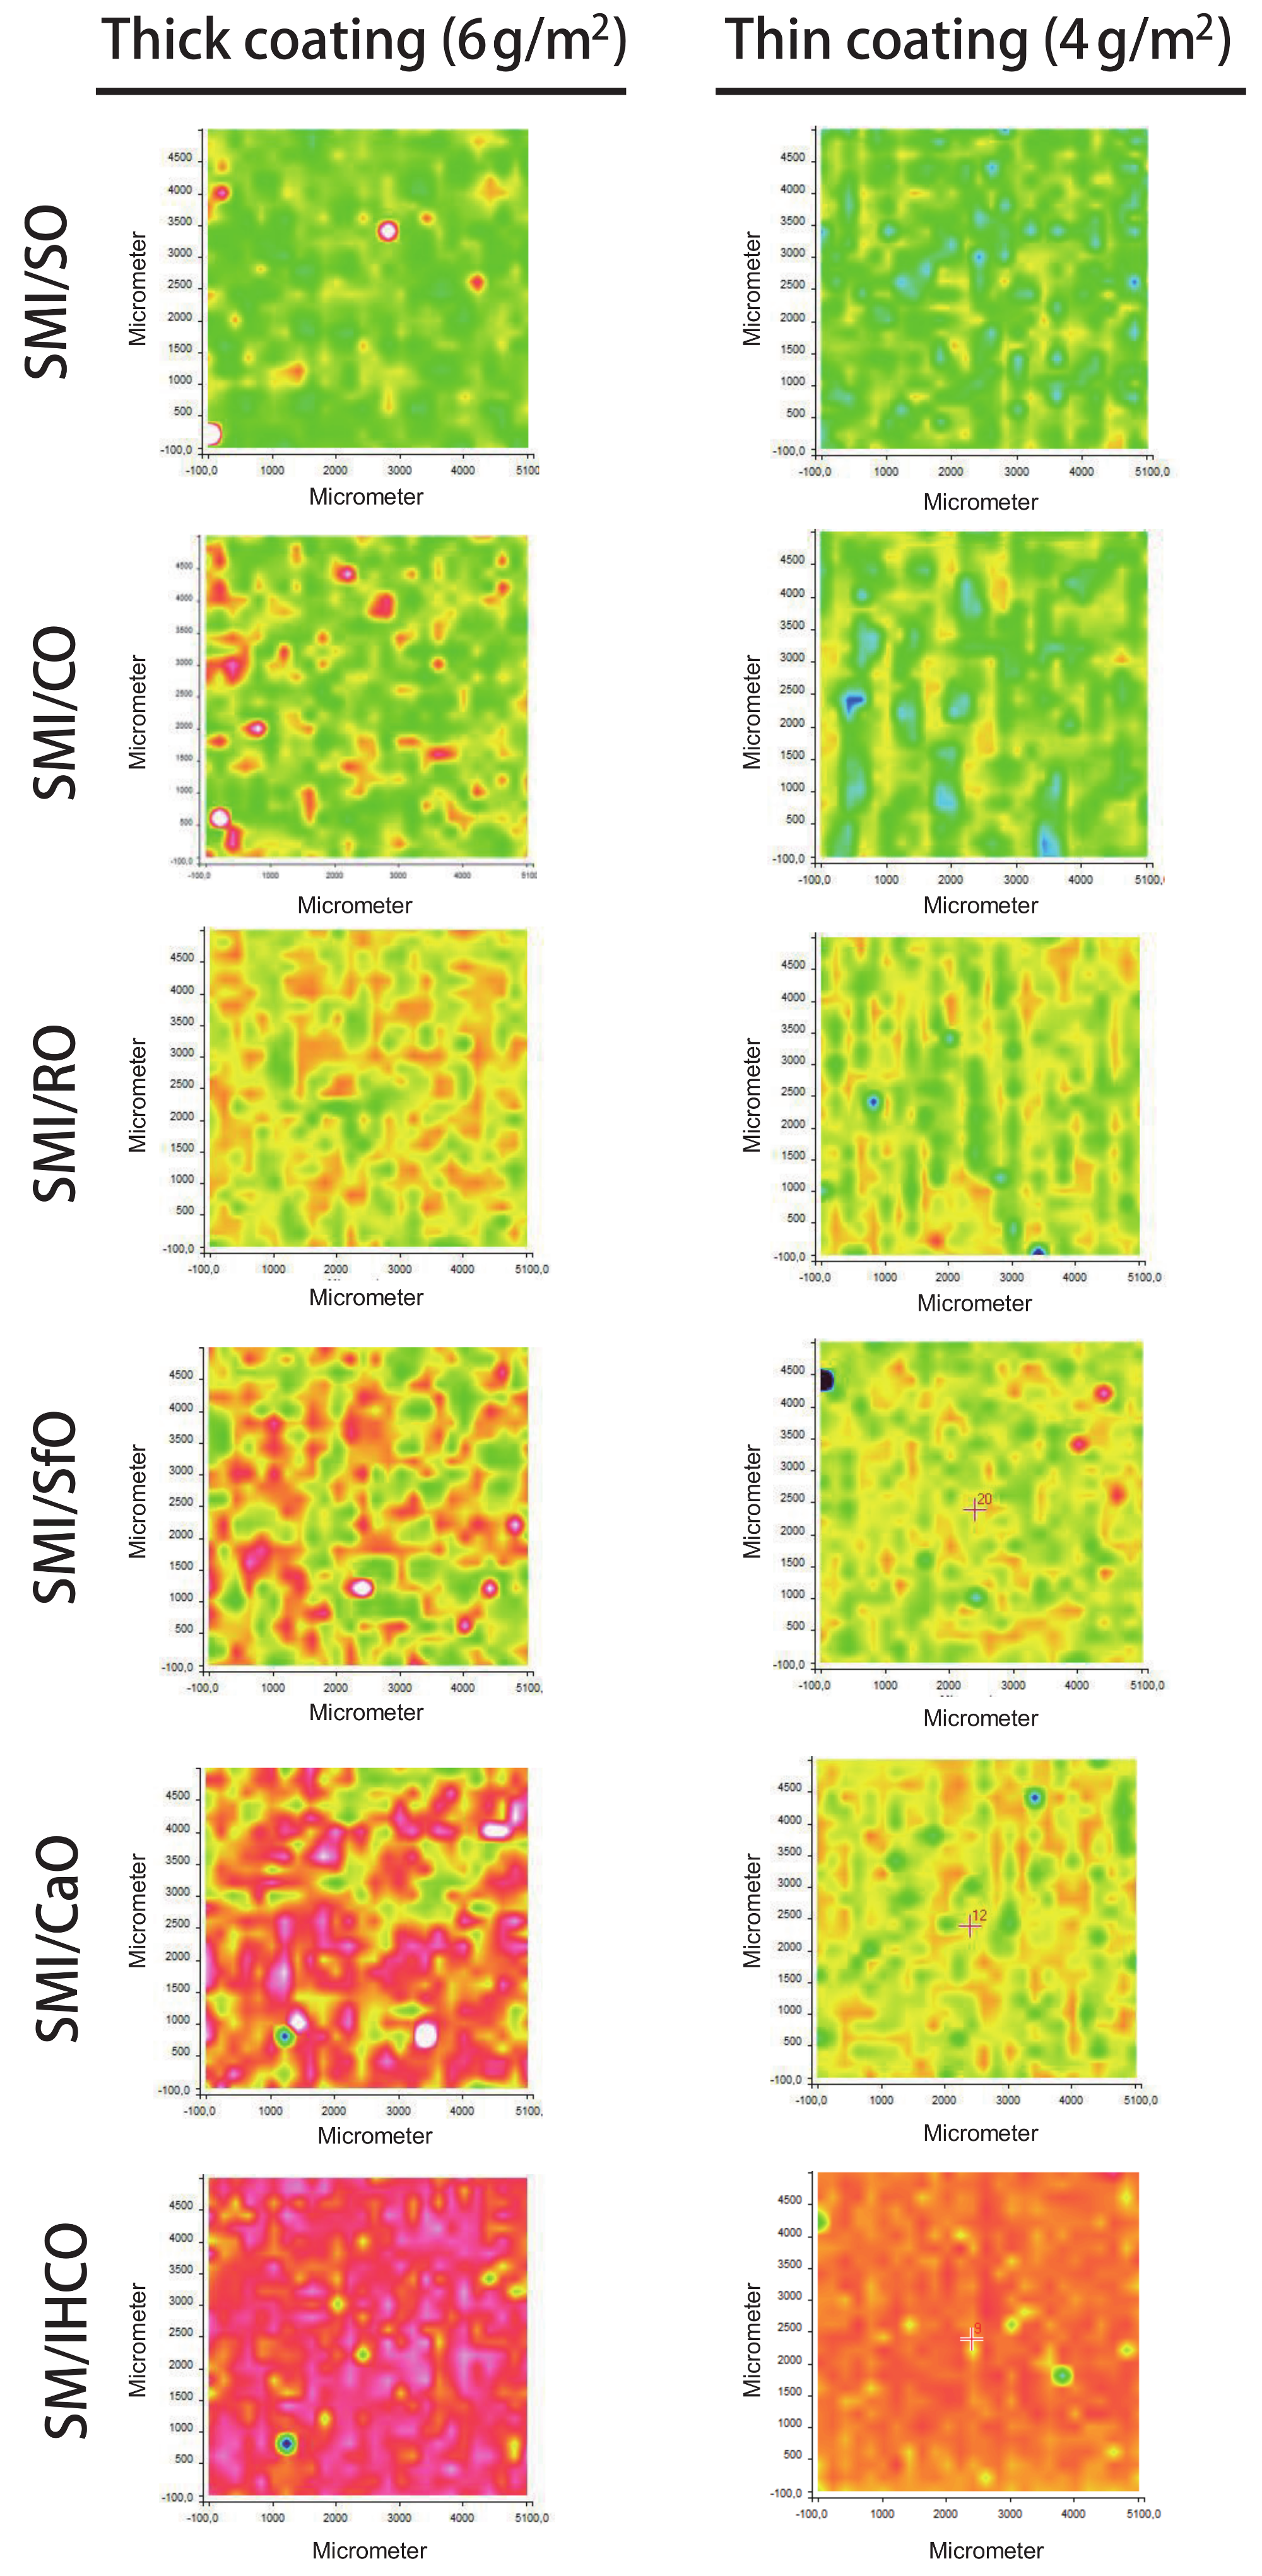
The average intensity maps for thick and thin paper coatings are illustrated in Figure 5, with all maps having the same ordinate scale to make valid comparison between all SMI/oil coating types. The ordinate values are calculated as an average intensity value from the spectrum recorded at each (x, y) point. The surface maps consequently include data related to the intensities of the dominant Raman bands and illustrate the lateral homogeneity of the coating. As confirmed by the following more detailed analysis of single Raman bands, the ordinate intensities of average intensity maps can be related to the lateral distribution of organic coating moieties, with (i) high intensities (yellow to red) representing thick deposits of coating species and, (ii) low intensities (blue) corresponding to thin coating deposits and poor coverage. The surface areas with low average intensities consequently represent almost uncoated paper. For the thin coatings, inhomogeneities are recognized with striations parallel to the direction of the bar-coating. The average intensities are higher for thick coatings than for thin coatings as an indication for the surface coverage. The contrast in average intensities illustrate local heterogeneities: the coatings with high imide content and low amount of free oil are obviously most homogeneous, while the presence of a high amount of free oil is visualized as an island-like coating phase. The observations for average intensity maps can consequently be related to a combination of coating coverage and homogeneity, which depend on the imide content and amount of free oil. In order to confirm the significance of the average intensity maps and locations of oil, imide and styrene deposits, the features observed in the general surface maps are analyzed below in relation with specific Raman bands for the coating and paper substrate.
3.4. Raman Chemical Mapping (Band Ratios)
The intensity ratios of specific Raman bands related to the oil, styrene, imide, and cellulose components are further detailed to provide information on the local chemical composition and distribution of these elements over the paper coating.
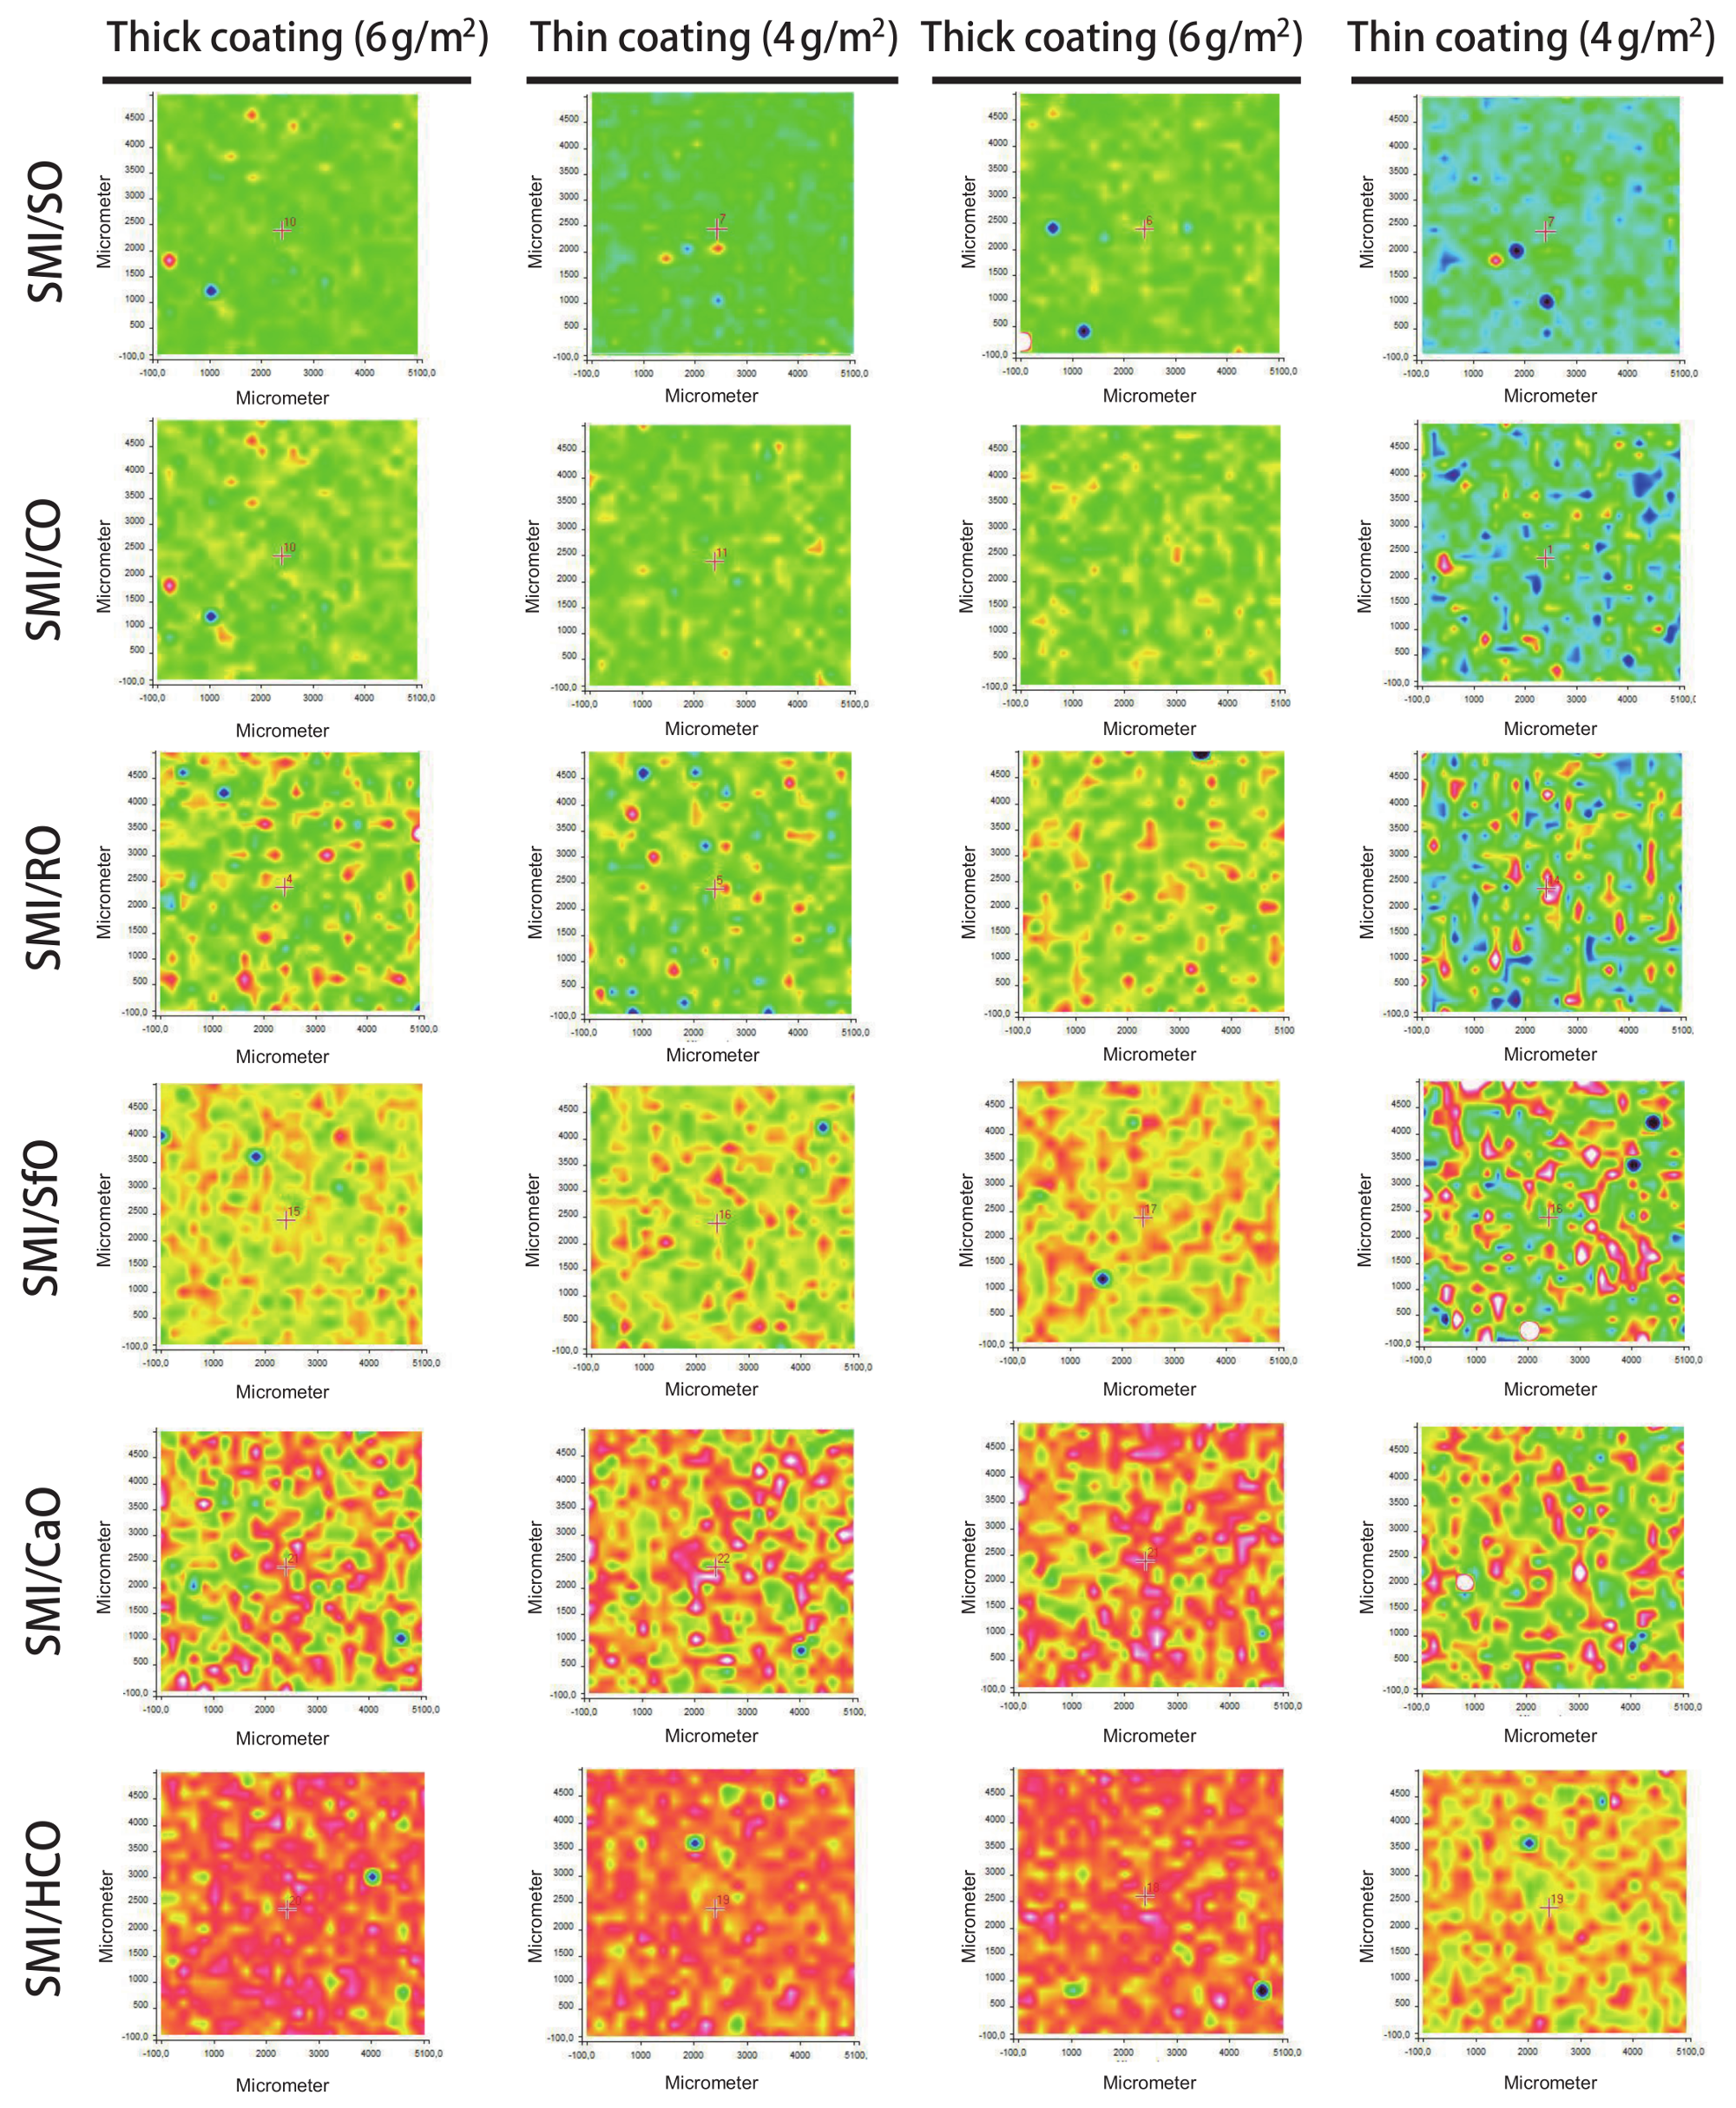
The distribution of oil is evaluated from the intensity ratios of Raman bands for oil (1655 cm−1), relative to styrene (1602 cm−1) and cellulose (1095 cm−1), as illustrated in Figure 6: the styrene band is chosen as a reference band for the distribution of oil within the coating, while the cellulose band is chosen as a reference for the distribution of coating over the paper substrate. The progressive increase in oil at the surface for different SMI/oil coatings agrees with previous calculations (see Table 2). The band intensity ratios and surface coverage of oil is comparable for thin and thick coatings when expressing the relative intensity of oil versus styrene within the coating itself: indeed, the same coating dispersions for deposition of thin and thick coatings were used. Contrarily, the differences in oil exposure between thin and thick coatings become clear when using the relative band intensity of oil versus cellulose. The surface patterns and locations covered with oil in the coating and those covered with oil are relative to the paper substrate overlap. Interestingly, the inhomogeneities for thin coatings observed in the average intensity maps are not reflected in the oil distribution over the surface. It is obvious that the inhomogeneities of the coating relative to the paper substrate are not expressed when taking the coating (styrene) as a reference. However, homogeneous distribution of the oil is also observed when taking the substrate (cellulose) as a reference. Therefore, the oil seems to be homogeneously spread over the surface and provides a continuous phase. The coating defects in thin coatings with striations can likely be attributed to the viscosity of the coating dispersions, where the presence of a free oil phase locally enhances the formation of a continuous coating due to better flow properties.
The distribution of organic coating moeities is evaluated from the intensity ratios of Raman bands for imide (1765 cm−1), relative to styrene (1602 cm−1) and cellulose (1095 cm−1), as represented in Figure 7. The relative intensity of imide progressively decreases for different SMI/oil coatings, in agreement with previous calculations (see Table 2). The relative intensity of imide is comparable for thick and thin coatings when expressed against styrene, while the differences in imide between thick and thin coatings become clear relative to the paper substrate: the thick coatings are relatively homogeneous with even distribution of the imide, while thin coatings show striations at the same locations as observed in the average intensity maps. Therefore, the distribution of the organic imide phase plays a major role in the coating homogeneity. The imide phase is likely more rigid and viscous compared to the oil phase, with more risk of coating defects. There is good agreement in the surface maps of oil/cellulose versus imide/cellulose for the thin coatings, confirming that an amount of free oil is present between the imide phase and contributes to the formation of a homogeneous coating layer by ‘filling’ the non-imide zones as a binder. The complementarity of the oil and imide phases is visible for thin coatings with poly- and monounsaturated oils (e.g., SMI/CO, SMI/RO), where the calculated amounts of free oil are relatively small. The latter is less visible for thin coatings with polyunsaturated oils (e.g., SMI/SO) as there is only a limited amount of free oil, while it is partly visible for the coatings with unsaturated oil (e.g., SMI/HCO) as the oil coverage is much larger than the zones in between the imide phase.
The distribution of organic coating moieties from the intensity ratios of Raman bands for styrene (1602 cm−1 and 1000 cm−1), relative to cellulose (1095 cm−1), are shown in Figure 8. The maximum intensity of styrene bands is comparable for all SMI/oil coating types and does not strongly differ with the oil type, because all copolymers contain a fixed amount of 74 mol % styrene that remains inert during the synthesis of the SMI/oil nanoparticles. The differences in intensities of styrene therefore mainly correspond to variations in coating coverage. In particular, the effects of thin and thick coatings are visualized. The locations for coverage of styrene components represented by Raman bands at 1602 cm−1 and 1000 cm−1 are in agreement, but slight differences in intensity may be attributed to the specific orientation of the styrene parts. The styrene-related absorption bands are characteristic for either the aromatic C=C stretch (1602 cm−1) or the aromatic C–H bending (1000 cm−1). Their intensities depend on the bonding length of the π-conjugation between the vinyl group and benzene ring and change with local conformation of the aromatic styrene groups [25]. The styrene orientation in the SMI copolymer is induced by a specific molecular structure of the high-molecular-weight SMA precursor and induces nanoparticle formation through self-assembly [26]. Therefore, the variations in ratio of both styrene bands at 1602 and 1000 cm−1 can eventually be attributed to configuration or orientation effects: the influences of segment orientation in styrene bloc copolymers with polarized Raman scattering were detected [27]. In particular, the locations corresponding to the aromatic parts (1602 cm−1) are more confined that the aliphatic parts of the styrene, as the aromatic styrene groups are likely more influenced by self-organization within the nanoparticles.
In conclusion, the locations for styrene coverage strongly overlap with the previous locations for imide coverage (see Figure 6). The chemical mapping for the band ratios of organic coating moieties (imide and styrene) generally corresponds with the chemical mapping based on average intensities: the areas with high intensity in styrene (see Figure 7) overlap with the areas of high average intensity (see Figure 4). In case of coatings with polyunsaturated oils (SMI/SO, SMI/CO, SMI/SfO), the surface coverage with high intensities of band ratios for oil moieties (see Figure 5) overlap with the areas of styrene coverage (see Figure 7), as the oil is largely encapsulated in the organic parts. For coatings with monounsaturated oils (e.g., SMI/CaO), the surface areas with high intensities of oil moieties (see Figure 5) are complementary to the surface areas with high intensities of styrene moieties (see Figure 7), as there is a large amount of free oil in between the organic coating phase.
3.5. Raman Chemical Mapping (Single Bands)
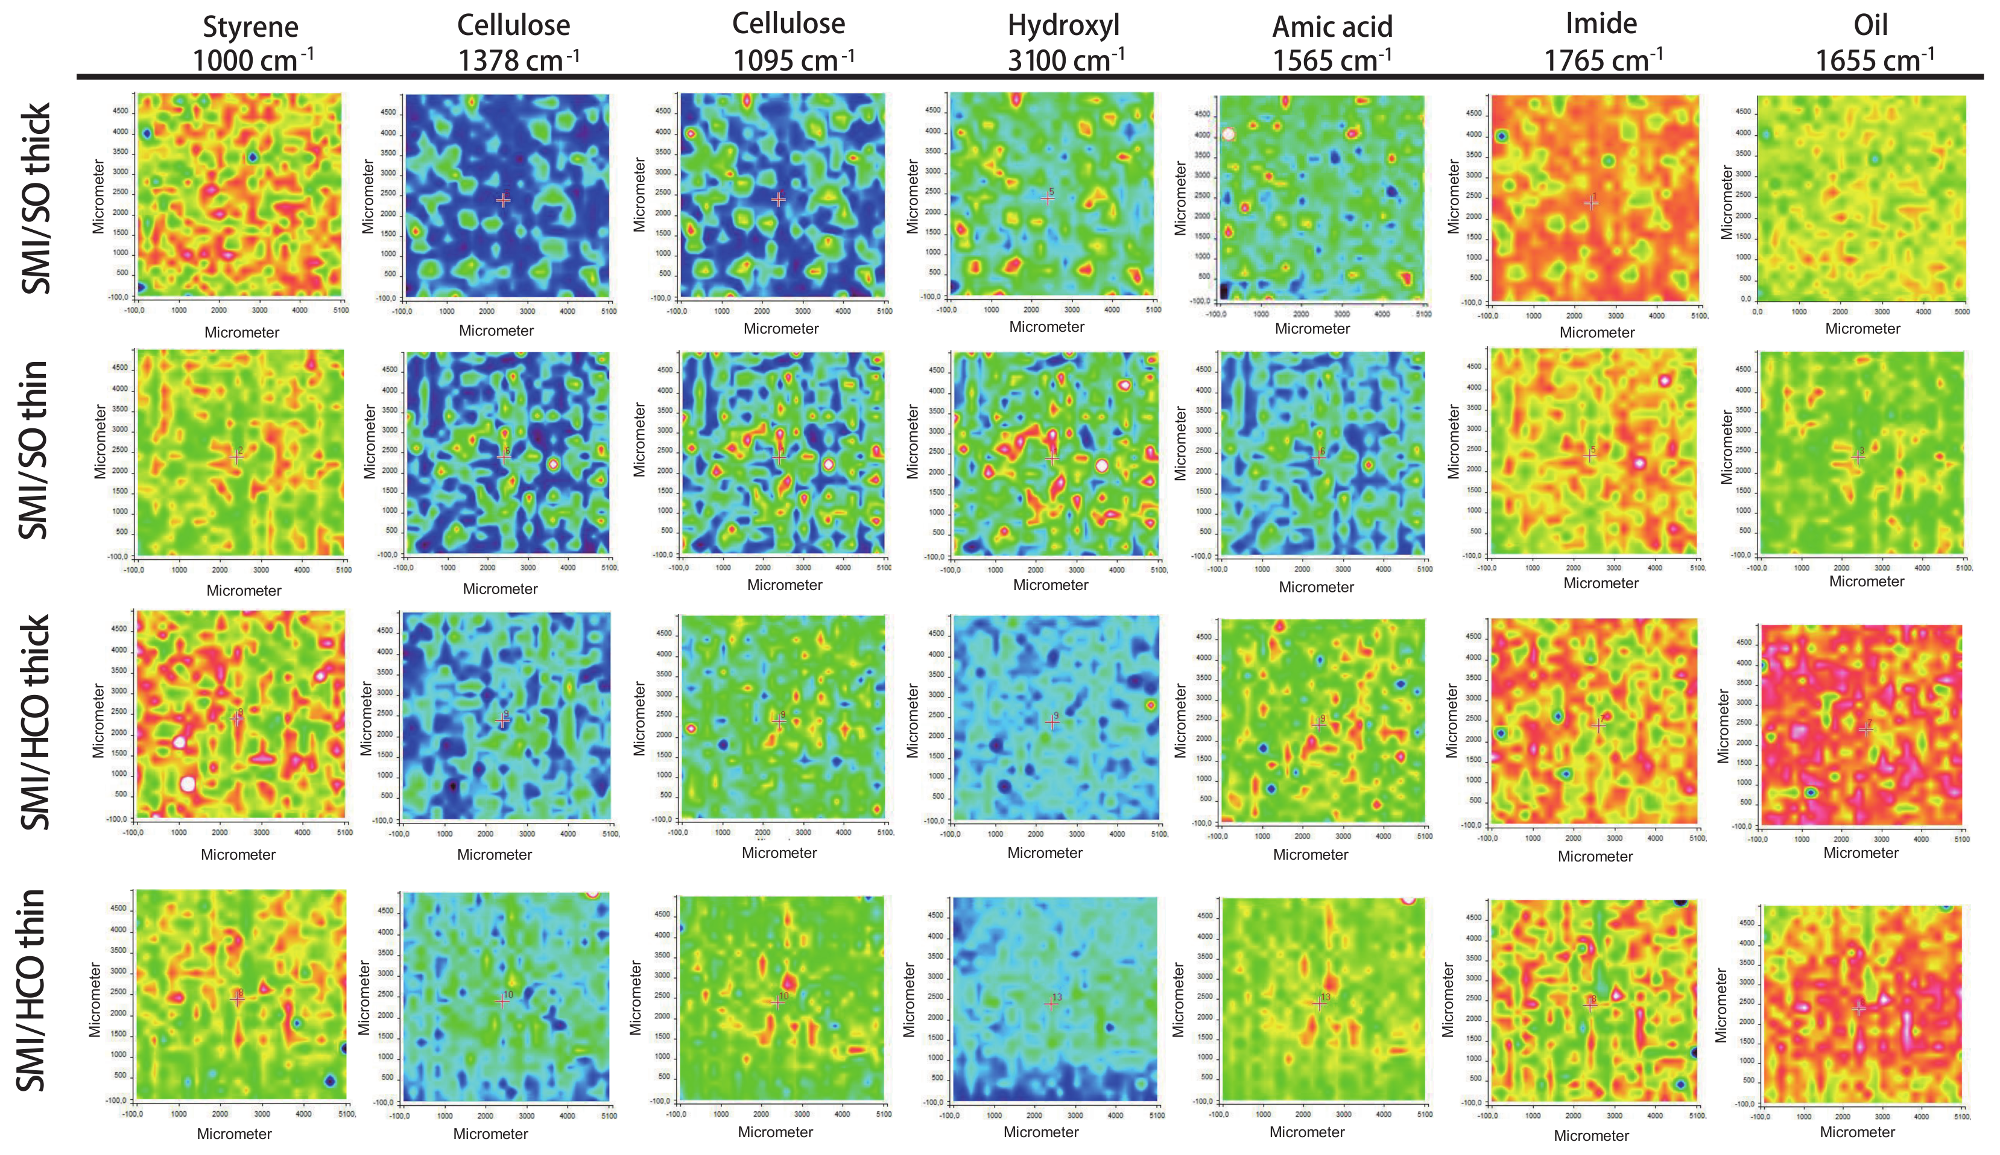
The surface maps with intensities of single Raman bands provide direct chemical information on the surface composition of coated papers. As only a single band is considered, the spectra are first normalized (cellulose region 1170–1050 cm−1) and baseline-corrected before selecting a specific band. An example of chemical surface maps for different single Raman bands of thick and thin coatings of SMI/SO and SMI/HCO is shown in Figure 9 (the maps for other coating types are given in Figures S2–S5 in Supplementary Materials). The selected Raman bands provide complementary information on the surface coverage of different chemical components.
The surface areas covered with high intensities of the styrene band (1000 cm−1) are similar to those covered with high intensities of the imide band (1765 cm−1). The same surface areas have also been covered by high intensities in previous surface maps with band intensity ratios of organic coating moieties. The surface maps of the cellulose bands (1378 cm−1 and 1095 cm−1) are complementary to the holes observed in the surface maps with organic coating deposits, indicating that the paper is locally penetrating through the coating at those locations. Both cellulose bands cover the same surface areas and exposure of cellulose bands at the surface is more intense for thin coatings than for thick coatings. The intensity of the single band related to hydroxyl groups (3100 cm−1) is highest at locations where cellulose fibers are exposed and lowest at locations covered by the coating. The exposure of cellulose hydroxyl groups at the surface is evidently more intense for thin coatings than for thick coatings. Therefore, interactions between the coating and the paper substrate are expected to happen through hydrogen bonding between hydroxyl groups at the cellulose fibers and the imidized SMI/oil nanoparticles. In a search for other complementary bands, the locations with low intensities in the 1765 cm−1 band (imide) correspond to locations with high intensities of the 1565 cm−1 band. The latter band can be assigned to the amide II band (NH bend + CN stretch) and represents amic acid groups as a remaining intermediate product after imidization (i.e., ammonolyzed maleic anhydride). The non-imidized parts obviously induce minor local defect spots and influence the formation of a fully homogeneous coating layer. These parts do not interact well with the paper substrate as they appear at similar surface areas with high intensities of hydroxyl bands. The surface areas with high intensities of the single oil band (1655 cm−1) fully overlap with the imide zones for coatings with polyunsaturated oil (e.g., SMI/SO), corresponding to previous conclusions that oil is embedded in the organic phase and there is very little free oil. The overlap of oil coverage and imide locations is much less for coatings with monounsaturated oil (see Figures S3–5 in Supplementary Materials). In particular, the oil coverage largely exceeds the locations with imide deposits in the case of unsaturated oil types (e.g., SMI/HCO) due to the large amount of free oil.
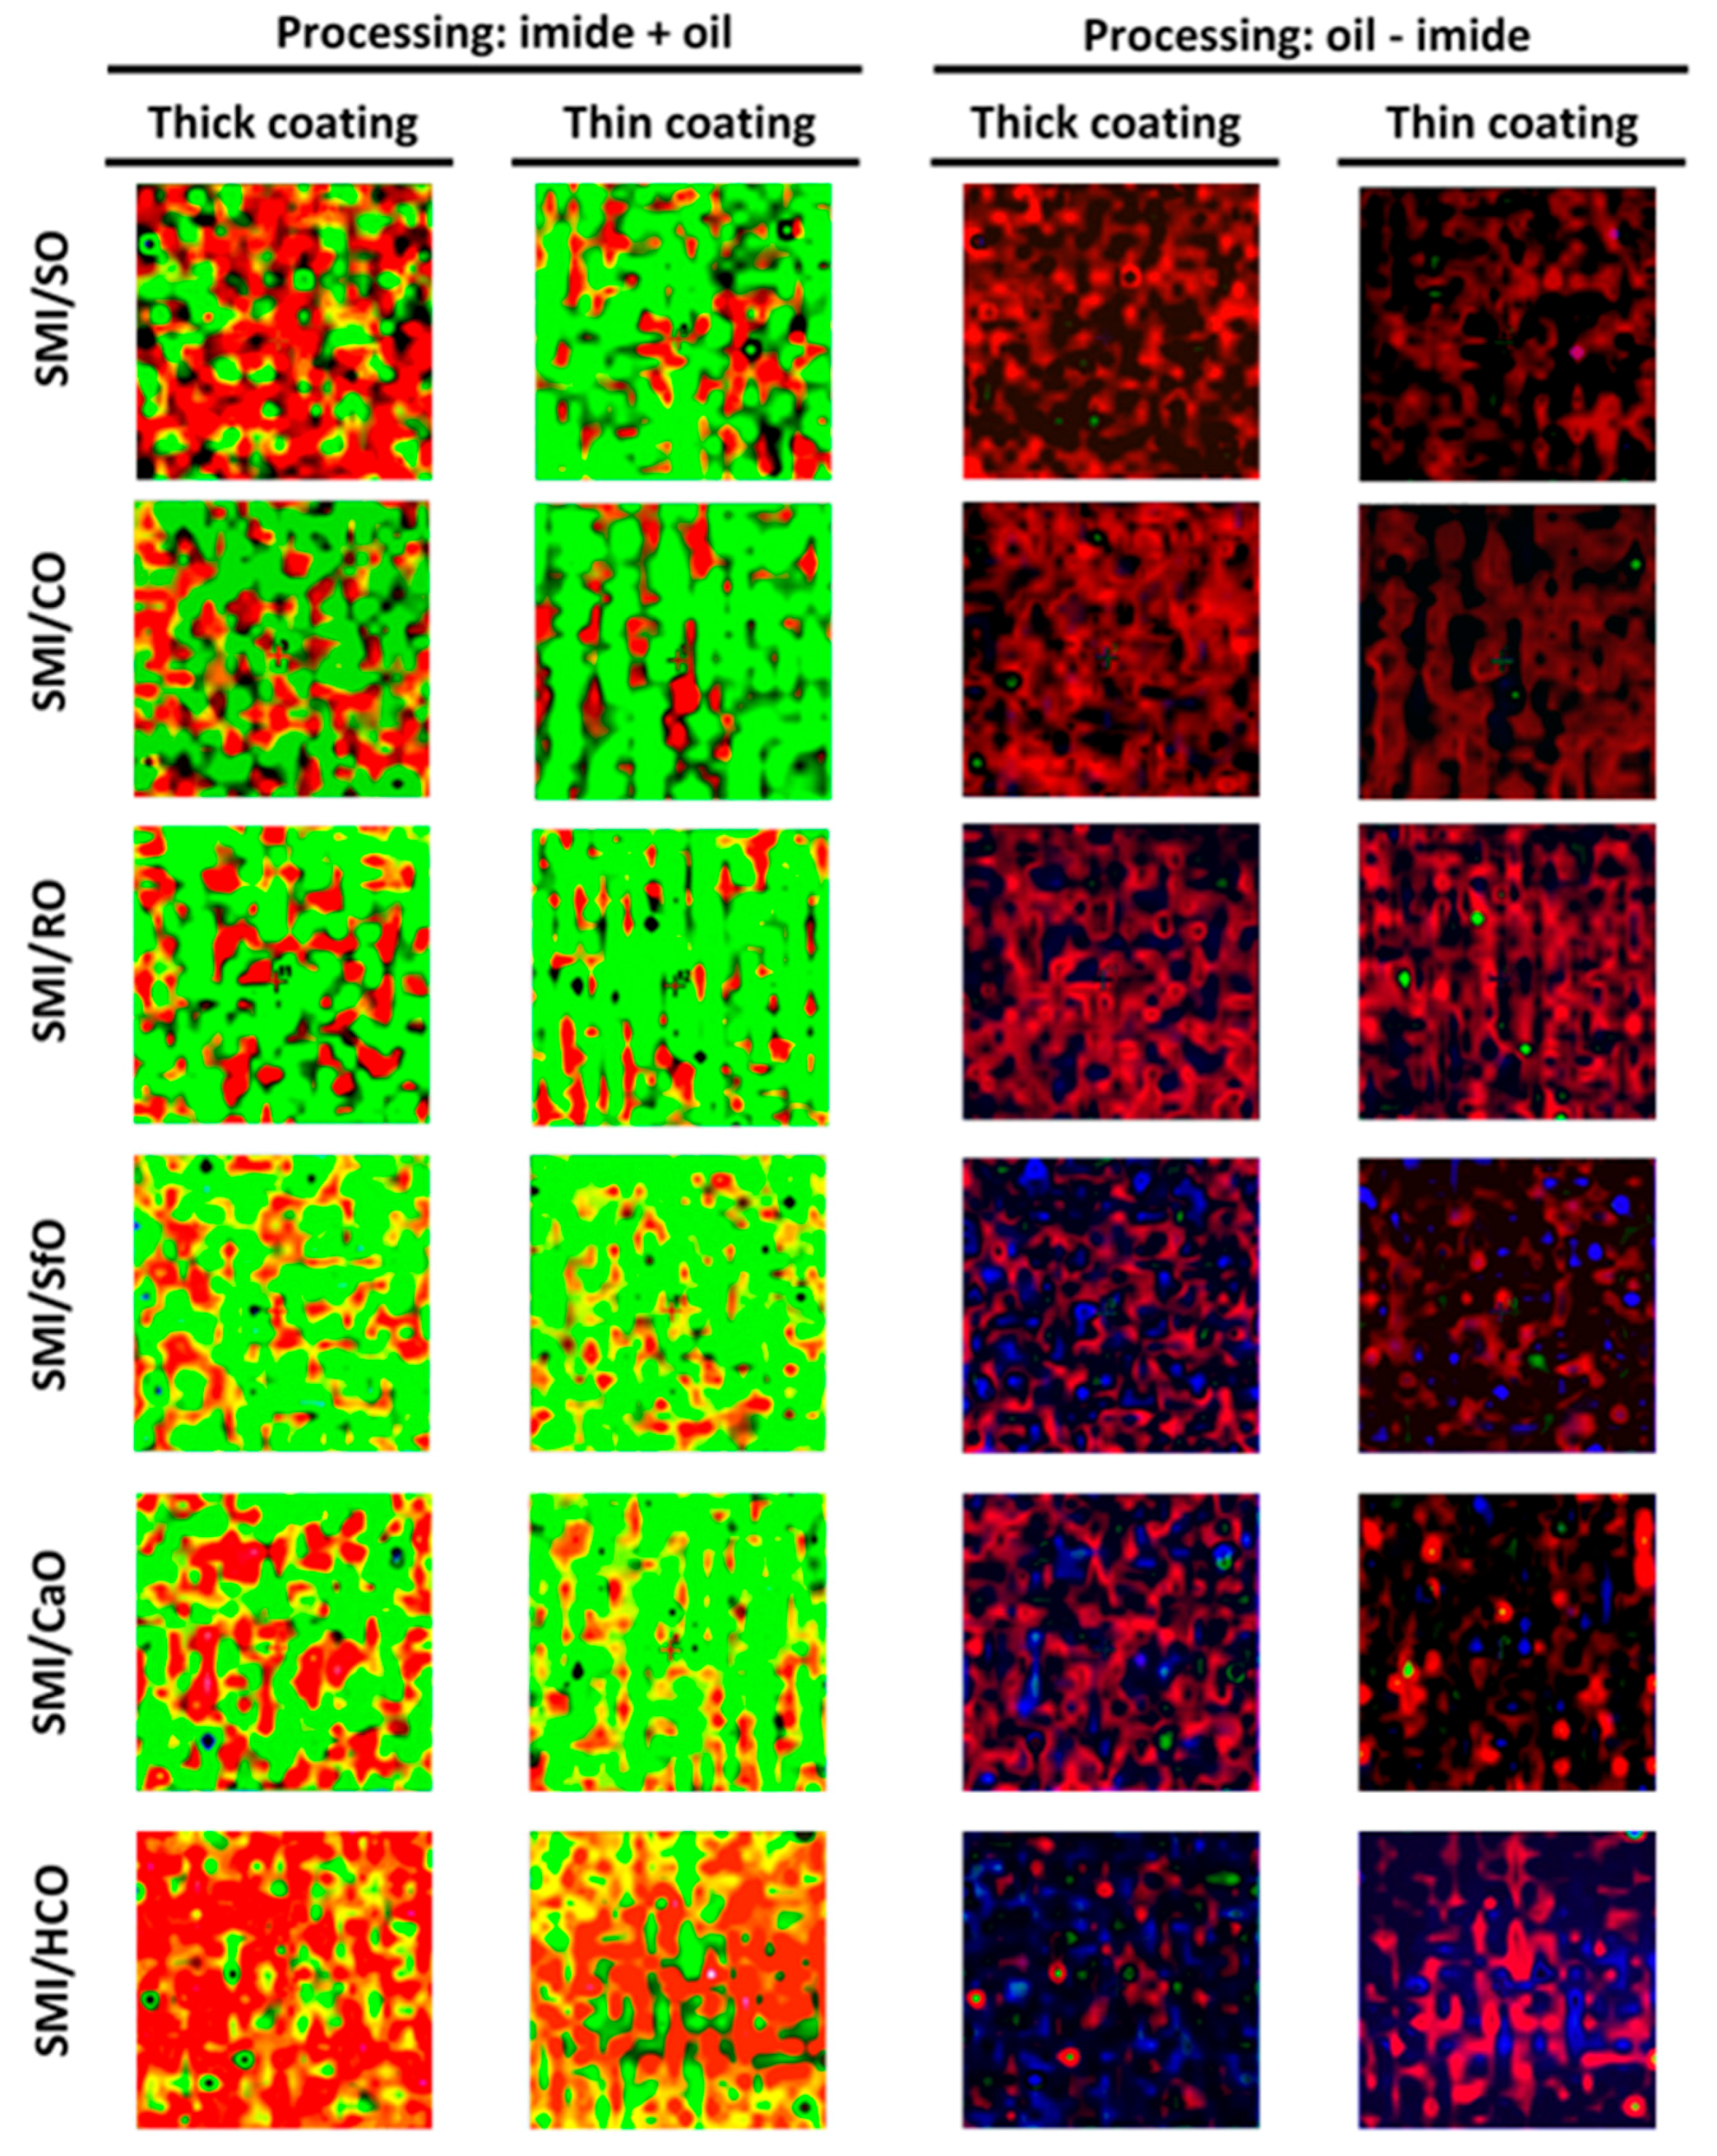
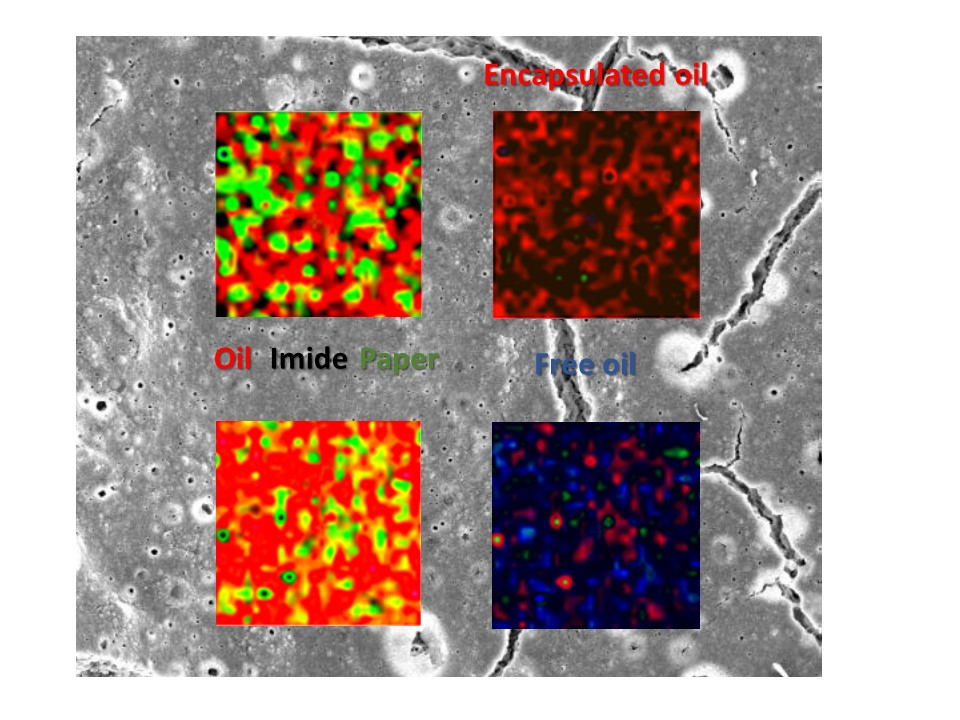
The surface maps with simultaneous coverage of the different coating components have been constructed after image processing (Figure 10). The summation images with imide and oil coverage (“imide ADD oil”) illustrate the degree of overlap and inclusion of oil within the organic coating phase, with following color code (see online for color figures: red = oil, black = imide). The quantification of thick and thin coatings is visible from the surface areas covered with the red phase. Almost full inclusion of the red surface areas within the black surface areas is recognized for SMI/SO, SMI/MO, and SMI/RO coatings, while the amount of red surface areas outside the black surface areas increases for SMI/SfO, SMI/CaO, and SMI/HCO coatings, which is in parallel with the localization of free oil. The difference in images between oil and imide (“oil SUBTRACT imide”) directly illustrate the surface locations with free oil, following the color code (see online for color figures: blue = free oil). From the blue surface areas it can be observed that the amount of free oil increases in the formerly reported order of SMI/oil coating types, and is higher for thick coatings than for thin coatings. In conclusion, the processed images and original Raman surface maps allow us to accurately visualize the different components and local chemical composition at the coated paper surface, and systematically illustrate the effect of oil encapsulation depending on the degree of saturation of the vegetable oil.
4. Conclusions
Dispersive Raman spectroscopy and microscopy provide an efficient analytical tool for the characterization, discrimination, and quantification of thick and thin barrier coatings on paper with nanoparticle deposits of poly(styrene-co-maleimide) that are filled with six different types of vegetable oils, soy oil, corn oil, rapeseed oil, sunflower oil, castor oil, and hydrogenated castor oil. Depending on the degree of oil saturation (iodine value), the imide content gradually decreases and the amount of free oil gradually increases.
A statistical classification of the coatings can be made by the partial least squares model with three principal components (PC), as each of them include information about the different coating components, i.e., oil phase (PC-1), cellulose substrate (PC-2), and the organic coating components (PC-3). The overall classification of the paper coatings in score plots is based on the degree of saturation for the different oils and coating thicknesses.
The chemical surface maps with average intensities illustrate the coating coverage and homogeneity, where high amounts of free oil result in thick deposits with island-like locations. The thin coatings often result in the formation of striations parallel to the direction of coating, and can mainly be related to local deposits of the organic (imide) coating components. The presentation of free oil in different amounts depending on the coating type is complementary to the average intensity maps. The chemical surface maps with relative band ratios have been analyzed relative to the organic coating phase and the substrate. The distribution of styrene and imide over the surface agrees fairly well and largely corresponds with the chemical mapping based on average intensities. For coatings with polyunsaturated oils, the surface coverage with high intensities of oil overlaps with the areas of organic coating components, as the oil is largely encapsulated in the organic parts. For coatings with monounsaturated oils, the surface coverage with high intensities of band ratios for oil is complementary to the surface areas with organic coating components, as there is a large amount of free oil as a binder in between the organic coating phase.
In conclusion, the selection of specific oils incorporated in poly(styrene-co-maleic) anhydride allows us to create various distributions of chemical moieties at the surface. Depending on the type of oil chosen, the amount of imide, styrene, and free oil at the coating surface varies. As the resulting hydrophobic properties and barrier performance depend on both the chemical surface composition and topography, the coatings are expected to serve as a candidate for barrier coatings in future packaging applications.
Supplementary Materials
The following are available online at https://www.mdpi.com/2079-6412/8/5/154/s1, Figur S1: Reference SEM image of uncoated paper and the same magnifications of the coated paper samples; Figures S2–S5: Raman maps (5 × 5 mm2) with single wavenumbers representing different coating and substrate components at the surface for SMI/oil paper coatings, Table S1: Raman shift assignment for SMI/oil coatings on paper.
Acknowledgments
The author acknowledges the support of Mr. Peter Mast (Ghent University—Department of Materials Science and Engineering, Belgium) with FEG-SEM. Samples were kindly supplied by Topchim N.V. (Wommelgem, Belgium).
Conflicts of Interest
The author declares no conflict of interest.
References
- Samyn, P. Review paper: Wetting and hydrophobic modification of cellulose surfaces for paper applications. J. Mater. Sci. 2013, 48, 6455–6498. [Google Scholar] [CrossRef]
- Samyn, P.; Barhoum, A.; Ohlund, T.; Dufresne, A. Review: Nanoparticles and nanostructured materials in papermaking. J. Mater. Sci. 2018, 53, 146–184. [Google Scholar] [CrossRef]
- Ogihara, H.; Xie, J.; Okagaki, J.; Saji, T. Simple method for preparing superhydrophobic paper: Spray-deposited hydrophobic silica nanoparticle coatings exhibit high water-repellency and transparency. Langmuir 2012, 88, 4605–4608. [Google Scholar] [CrossRef] [PubMed]
- Aromaa, M.; Arffman, A.; Suhonen, H.; Haapanen, J.; Keskinen, J.; Honkanen, M.; Nikkanen, J.P.; Levänen, E.; Messing, M.E.; Deppert, K.; et al. Atmospheric synthesis of superhydrophobic TiO2 nanoparticle deposits in a single step using liquid flame spray. J. Aerosol Sci. 2012, 52, 57–68. [Google Scholar] [CrossRef]
- Karapanagiotis, I.; Grosu, D.; Aslanidou, D.; Aifantis, K.E. Facile method to prepare superhydrophobic and water repellent cellulosic paper. J. Nanomater. 2015, 2015, 219013. [Google Scholar] [CrossRef]
- Torun, I.; Onses, M.S. Robust superhydrophobicity on paper: Protection of spray-coated nanoparticles against mechanical wear by the microstructure of paper. Surf. Coat. Technol. 2017, 319, 301–308. [Google Scholar] [CrossRef]
- Jonoobi, M.; Harun, J.; Mathew, A.P.; Hussein, M.Z.; Oksman, K. Preparation of cellulose nanofibers with hydrophobic surface characteristics. Cellulose 2010, 17, 299–307. [Google Scholar] [CrossRef] [Green Version]
- Alam, M.; Akram, D.; Sharmin, E.; Zafar, F.; Ahmad, S. Vegetable oil based eco-friendly coating materials: A review article. Arab. J. Chem. 2014, 7, 469–479. [Google Scholar] [CrossRef]
- Shen, Z.; Augustin, M.A.; Sanguansri, L.; Cheng, L.J. Oxidative stability of microencapsulated fish oil powders stabilized by blends of chitosan, modified starch, and glucose. J. Agric. Food Chem. 2010, 58, 4487–4493. [Google Scholar] [CrossRef] [PubMed]
- Workman, J.J. Infrared and Raman spectroscopy in paper and pulp analysis. Appl. Spectrosc. Rev. 2001, 36, 139–168. [Google Scholar] [CrossRef]
- Vyörykkä, J.; Juvonen, K.; Bousfield, D.; Vuorinen, T. Raman microscopy in lateral mapping of chemical and physical composition of paper coating. Tappi J. 2004, 3, 19–24. [Google Scholar]
- Guyot, C.; Amram, B.; Ubrich, J.M. Raman-microscopic study of mottling of coated paper. Wochenbl. Papierfabrikation 1995, 123, 646. [Google Scholar]
- Kenttä, E.; Juvonen, K.; Halttunen, M.; Vyörykkä, J. Spectroscopic methods for determination of latex content of coating layers. Nordic Pulp Pap. Res. J. 2000, 15, 579–585. [Google Scholar] [CrossRef]
- Bitla, S.; Tripp, C.P.; Bousfield, D.W. Raman spectroscopic study of migration in paper coatings. J. Pulp Pap. Sci. 2003, 29, 382–385. [Google Scholar]
- He, P.; Bitla, S.; Bousfield, D.; Tripp, C.P. Raman spectroscopic analysis of paper coatings. Appl. Spectrosc. 2002, 56, 1115–1121. [Google Scholar] [CrossRef]
- Kugge, C.; Greaves, M.; Hands, K.; Scholes, F.H.; Vanderhoek, N.; Ward, J. Paper coating analysis by confocal Raman spectroscopy. Appita J. 2008, 61, 11–16. [Google Scholar]
- Niemelä, P.; Hietala, E.; Ollanketo, J.; Tornberg, J.; Pirttinen, E.; Stenius, P. FT-Raman spectroscopy as a tool for analyzing the composition of recycled paper pulp. Prog. Pap. Recycl. 1999, 8, 15–24. [Google Scholar]
- Frost, R.L. The structure of the kaolinite minerals: A FT-Raman study. Clay Miner. 1997, 32, 65–77. [Google Scholar] [CrossRef]
- Lutz, A.; De Graeve, I.; Terryn, H. Non-destructive 3-dimensional mapping of microcapsules in polymeric coatings by confocal Raman spectroscopy. Prog. Org. Coat. 2015, 88, 32–38. [Google Scholar] [CrossRef]
- Taheri, H.; Stanssens, D.; Samyn, P. Rheological behaviour of oil-filled polymer nanoparticles in aqueous dispersion. Colloid Surf. A 2016, 499, 31–45. [Google Scholar] [CrossRef]
- Samyn, P.; Schoukens, G.; Stanssens, D.; Vonck, L.; Van den Abbeele, H. Incorporating different vegetable oils into an aqueous dispersion of hybrid organic nanoparticles. J. Nanopart. Res. 2012, 14, 1075–1099. [Google Scholar] [CrossRef]
- Singh, K.B.; Bhosale, L.R.; Tirumkudulu, M.S. Cracking in drying colloidal films of flocculated dispersions. Langmuir 2009, 25, 4284–4287. [Google Scholar] [CrossRef] [PubMed]
- Sadeghi-Jorabchi, H.; Wilson, R.H.; Belton, P.S.; Edwards-Webb, J.D.; Coxon, D.T. Quantitative analysis of oils and fats by Fourier transform Raman spectroscopy. Spectrochim. Acta A 1991, 47, 1449–1458. [Google Scholar] [CrossRef]
- Johnson, G.L.; Machado, R.M.; Freidl, K.G.; Achenbach, M.L.; Clark, P.J.; Reidy, S.K. Evaluation of raman spectroscopy for determining cis and trans isomers in partially hydrogenated soybean oil. Org. Proc. Res. Dev. 2002, 6, 637–644. [Google Scholar] [CrossRef]
- Choi, C.H.; Kertesz, M. Conformational information from vibrational spectra of styrene, trans-stilbene, and cis-stilbene. J. Phys. Chem. A 1997, 101, 3823–3831. [Google Scholar] [CrossRef]
- Samyn, P.; Schoukens, G. Morphologies and thermal variability of patterned polymer films with poly(styrene-co-maleic anhydride). Polymers 2014, 6, 820–845. [Google Scholar] [CrossRef] [Green Version]
- Archer, L.A.; Fuller, G.G. Segment orientation in a quiescent block copolymer melt studied by Raman scattering. Macromolecules 1994, 27, 4359–4363. [Google Scholar] [CrossRef]
Figure 1.
SEM microscopy of SMI/oil coatings on paper, including thin and thick coatings at different magnifications (indicated scale bars apply to full column).
Figure 1.
SEM microscopy of SMI/oil coatings on paper, including thin and thick coatings at different magnifications (indicated scale bars apply to full column).
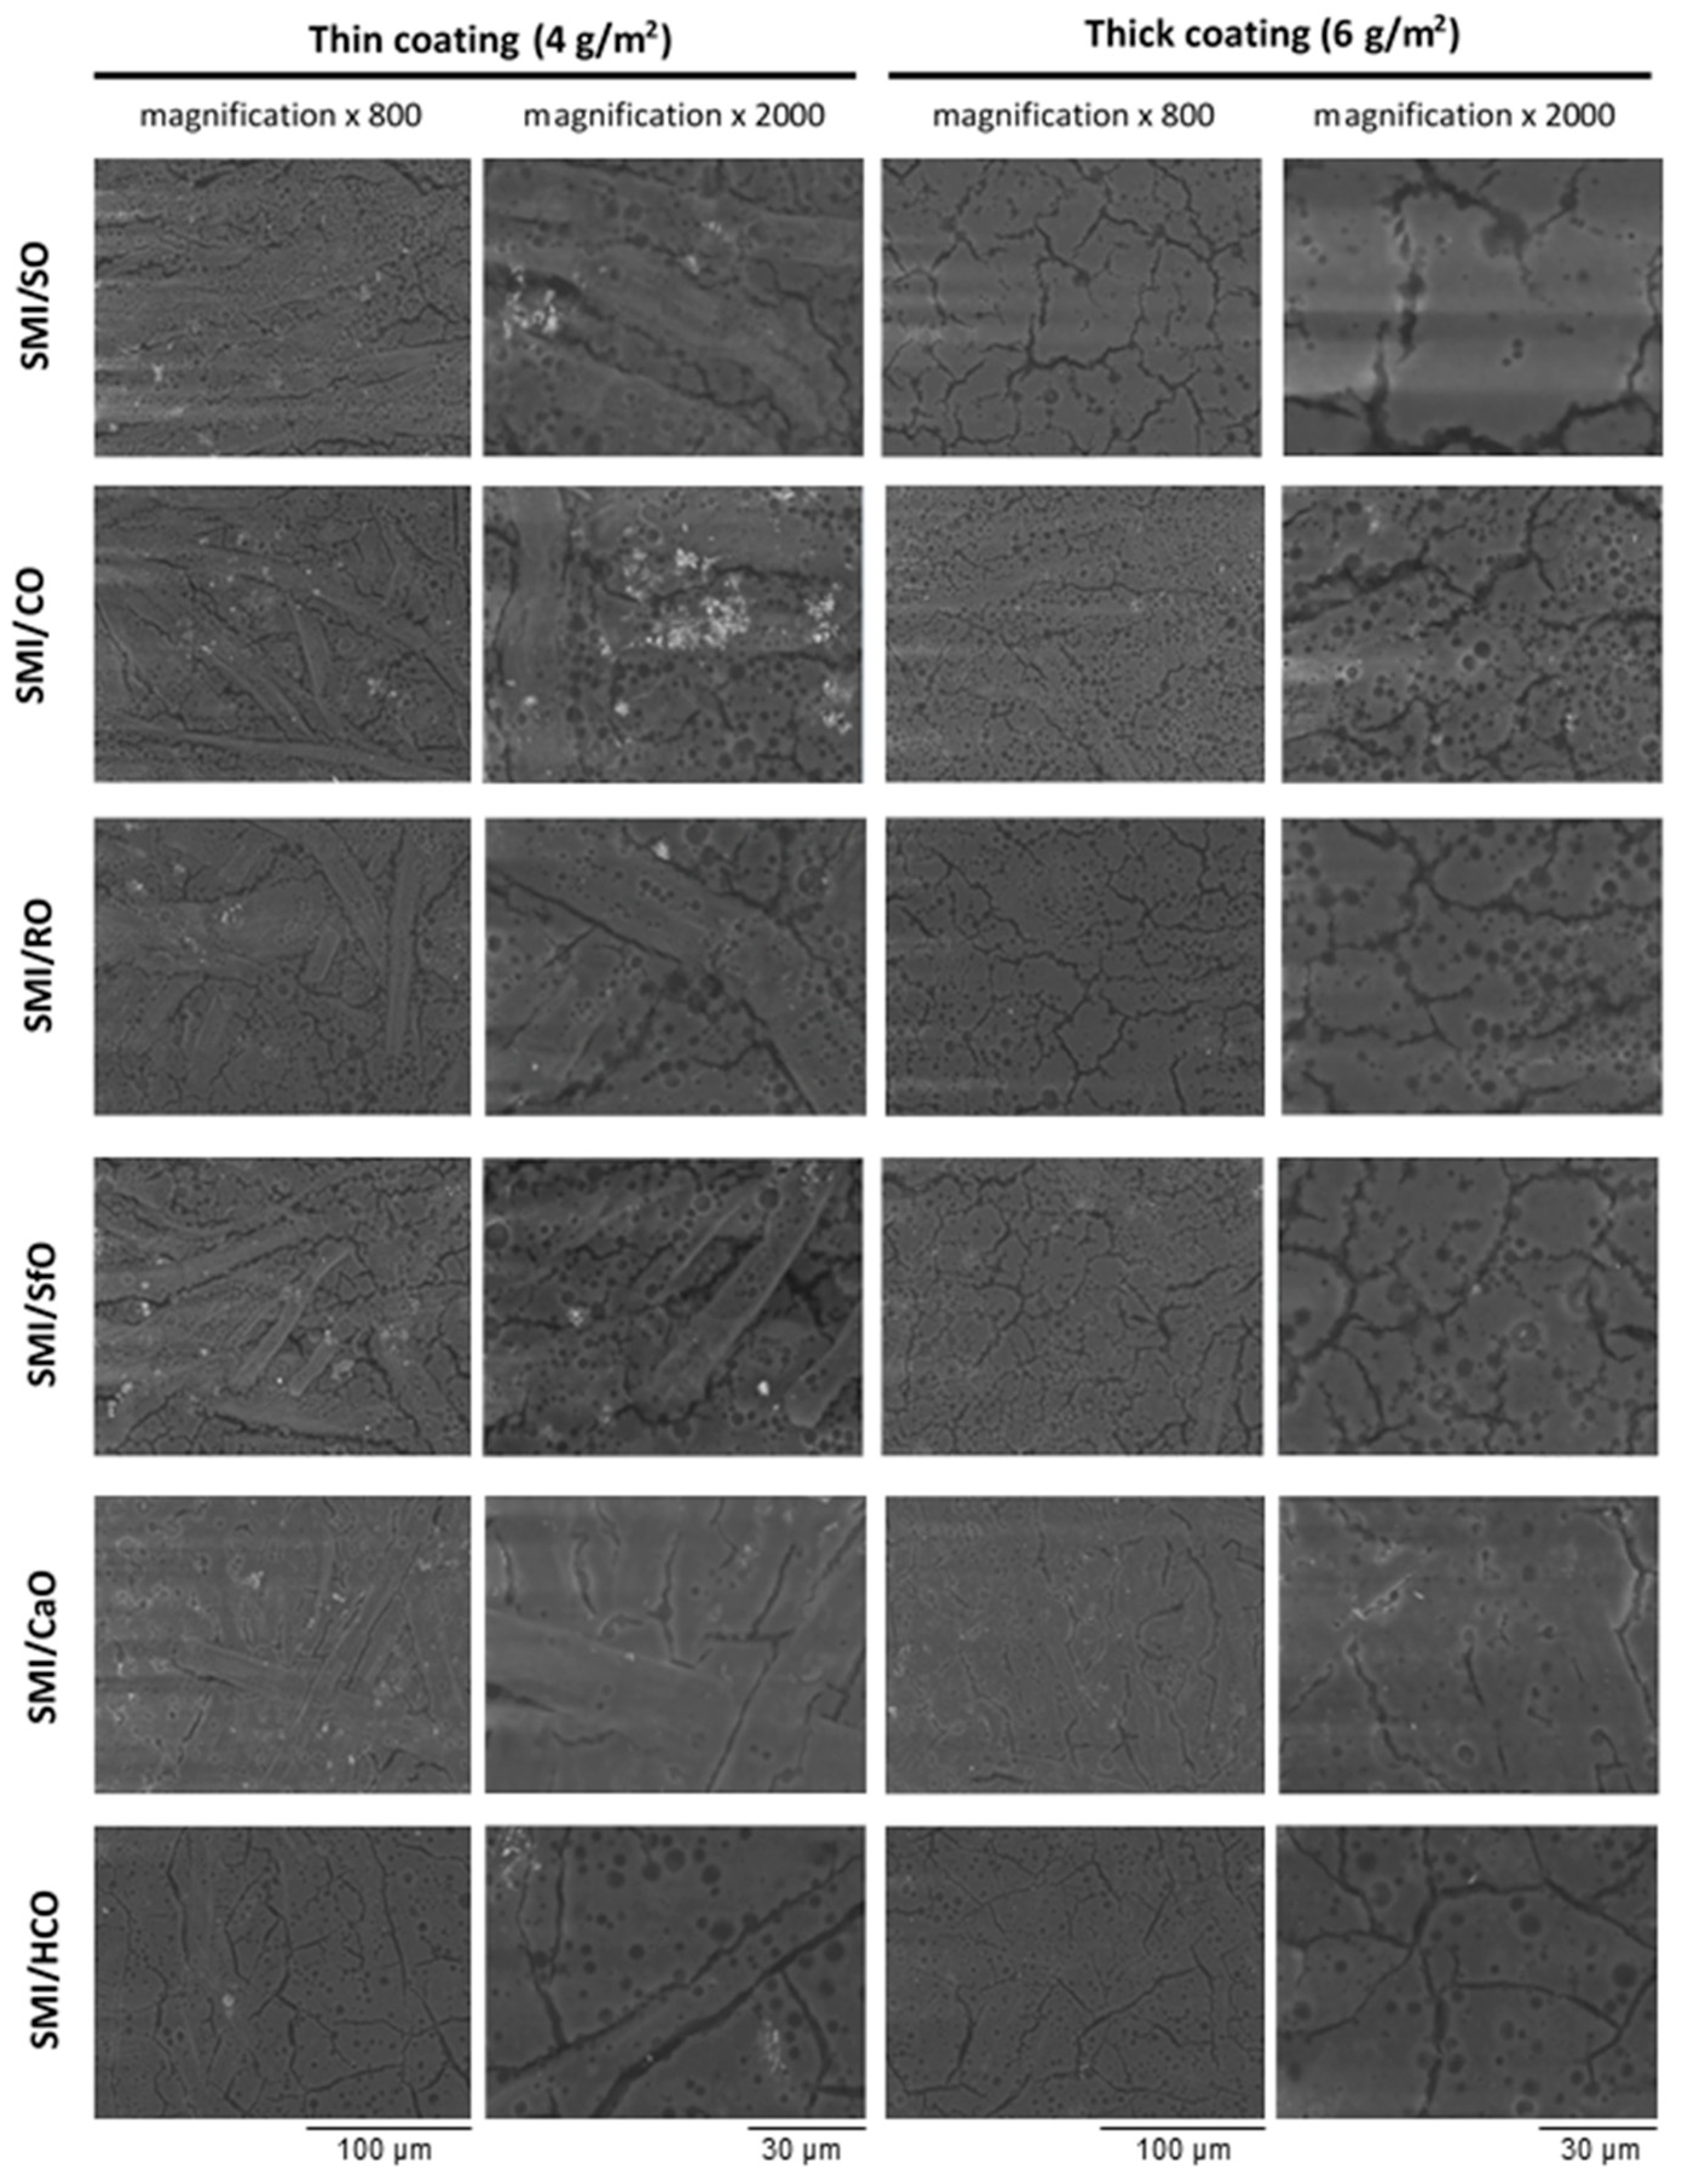
Figure 2.
Detailed FEG-SEM microscopy of SMI/oil coating on paper (e.g., SMI/HCO): (a) magnification 5000×; (b) magnification 50000×.
Figure 2.
Detailed FEG-SEM microscopy of SMI/oil coating on paper (e.g., SMI/HCO): (a) magnification 5000×; (b) magnification 50000×.
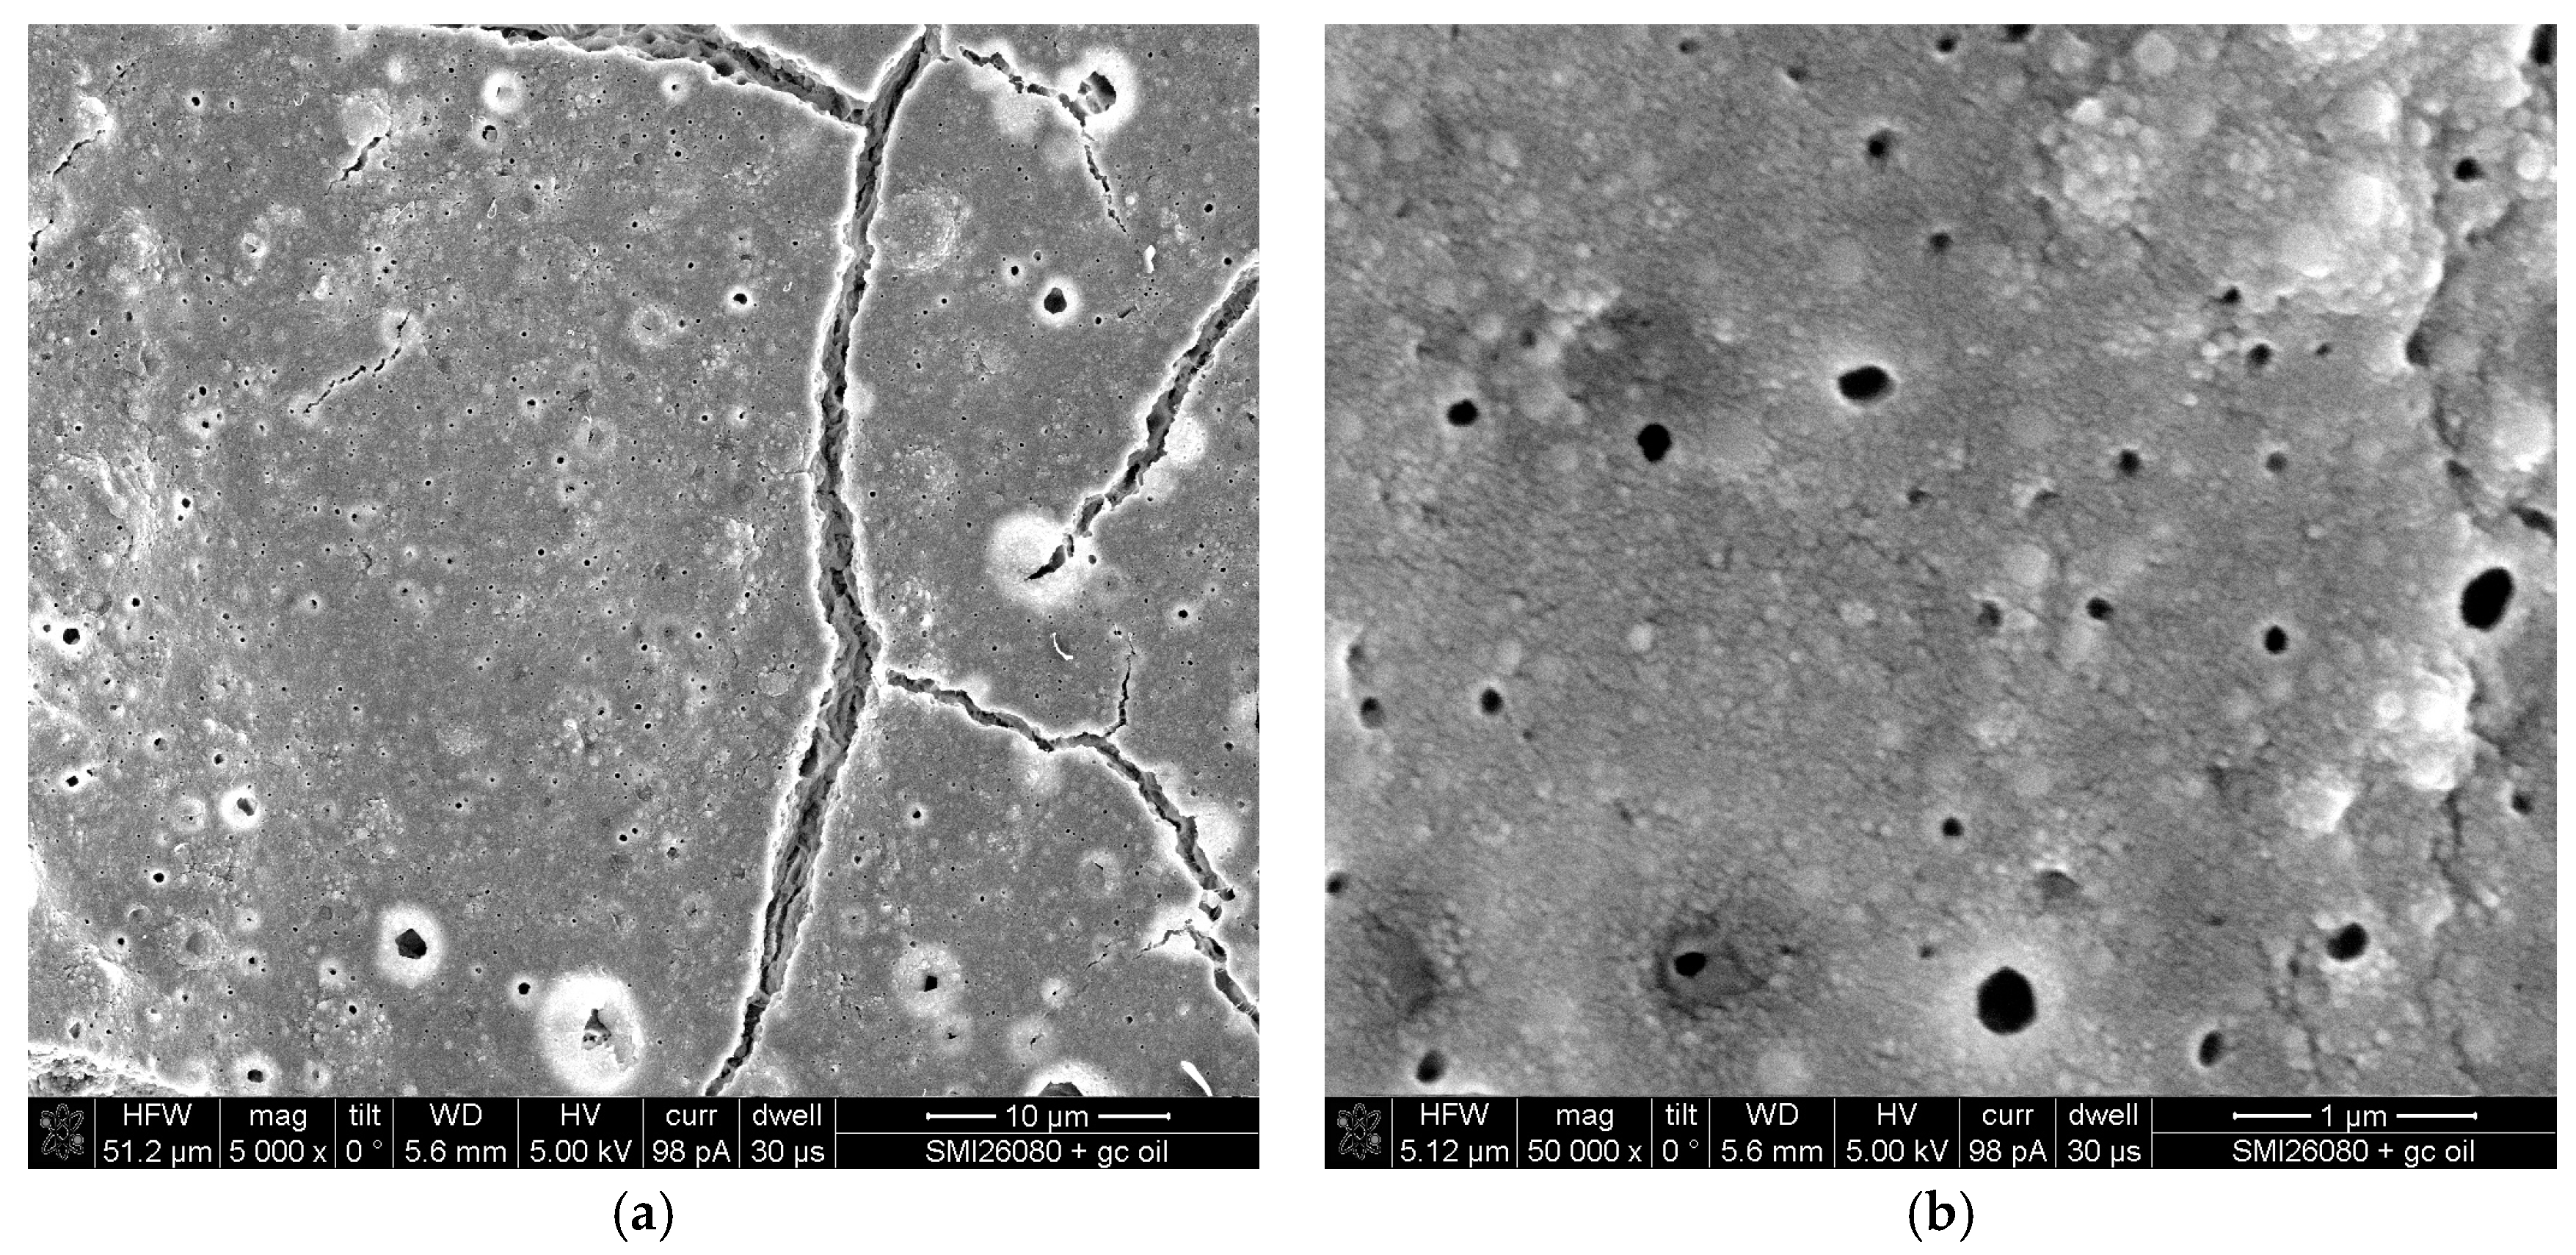
Figure 3.
Raman spectra for SMI/oil coatings on paper.

Figure 4.
Statistical classification of SMI/oil paper coatings by statistical principal component analysis (PCA) of Raman spectra: (a) residual variance plots; (b) leverage plots; (c) PC loading plots; and (d) score plots with 95% confidence interval.
Figure 4.
Statistical classification of SMI/oil paper coatings by statistical principal component analysis (PCA) of Raman spectra: (a) residual variance plots; (b) leverage plots; (c) PC loading plots; and (d) score plots with 95% confidence interval.

Figure 5.
Raman maps (5 × 5 mm2) with average intensities for SMI/oil paper coatings.

Figure 6.
Raman maps (5 × 5 mm2) with band intensity ratios illustrating exposure of oil at the surface for SMI/oil paper coatings (left two columns: oil/styrene; right two columns: oil/cellulose).
Figure 6.
Raman maps (5 × 5 mm2) with band intensity ratios illustrating exposure of oil at the surface for SMI/oil paper coatings (left two columns: oil/styrene; right two columns: oil/cellulose).

Figure 7.
Raman maps (5 × 5 mm2) with band intensity ratios illustrating imide moieties at the surface for SMI/oil paper coatings (left two columns: imide/styrene, right two columns: imide/cellulose).
Figure 7.
Raman maps (5 × 5 mm2) with band intensity ratios illustrating imide moieties at the surface for SMI/oil paper coatings (left two columns: imide/styrene, right two columns: imide/cellulose).
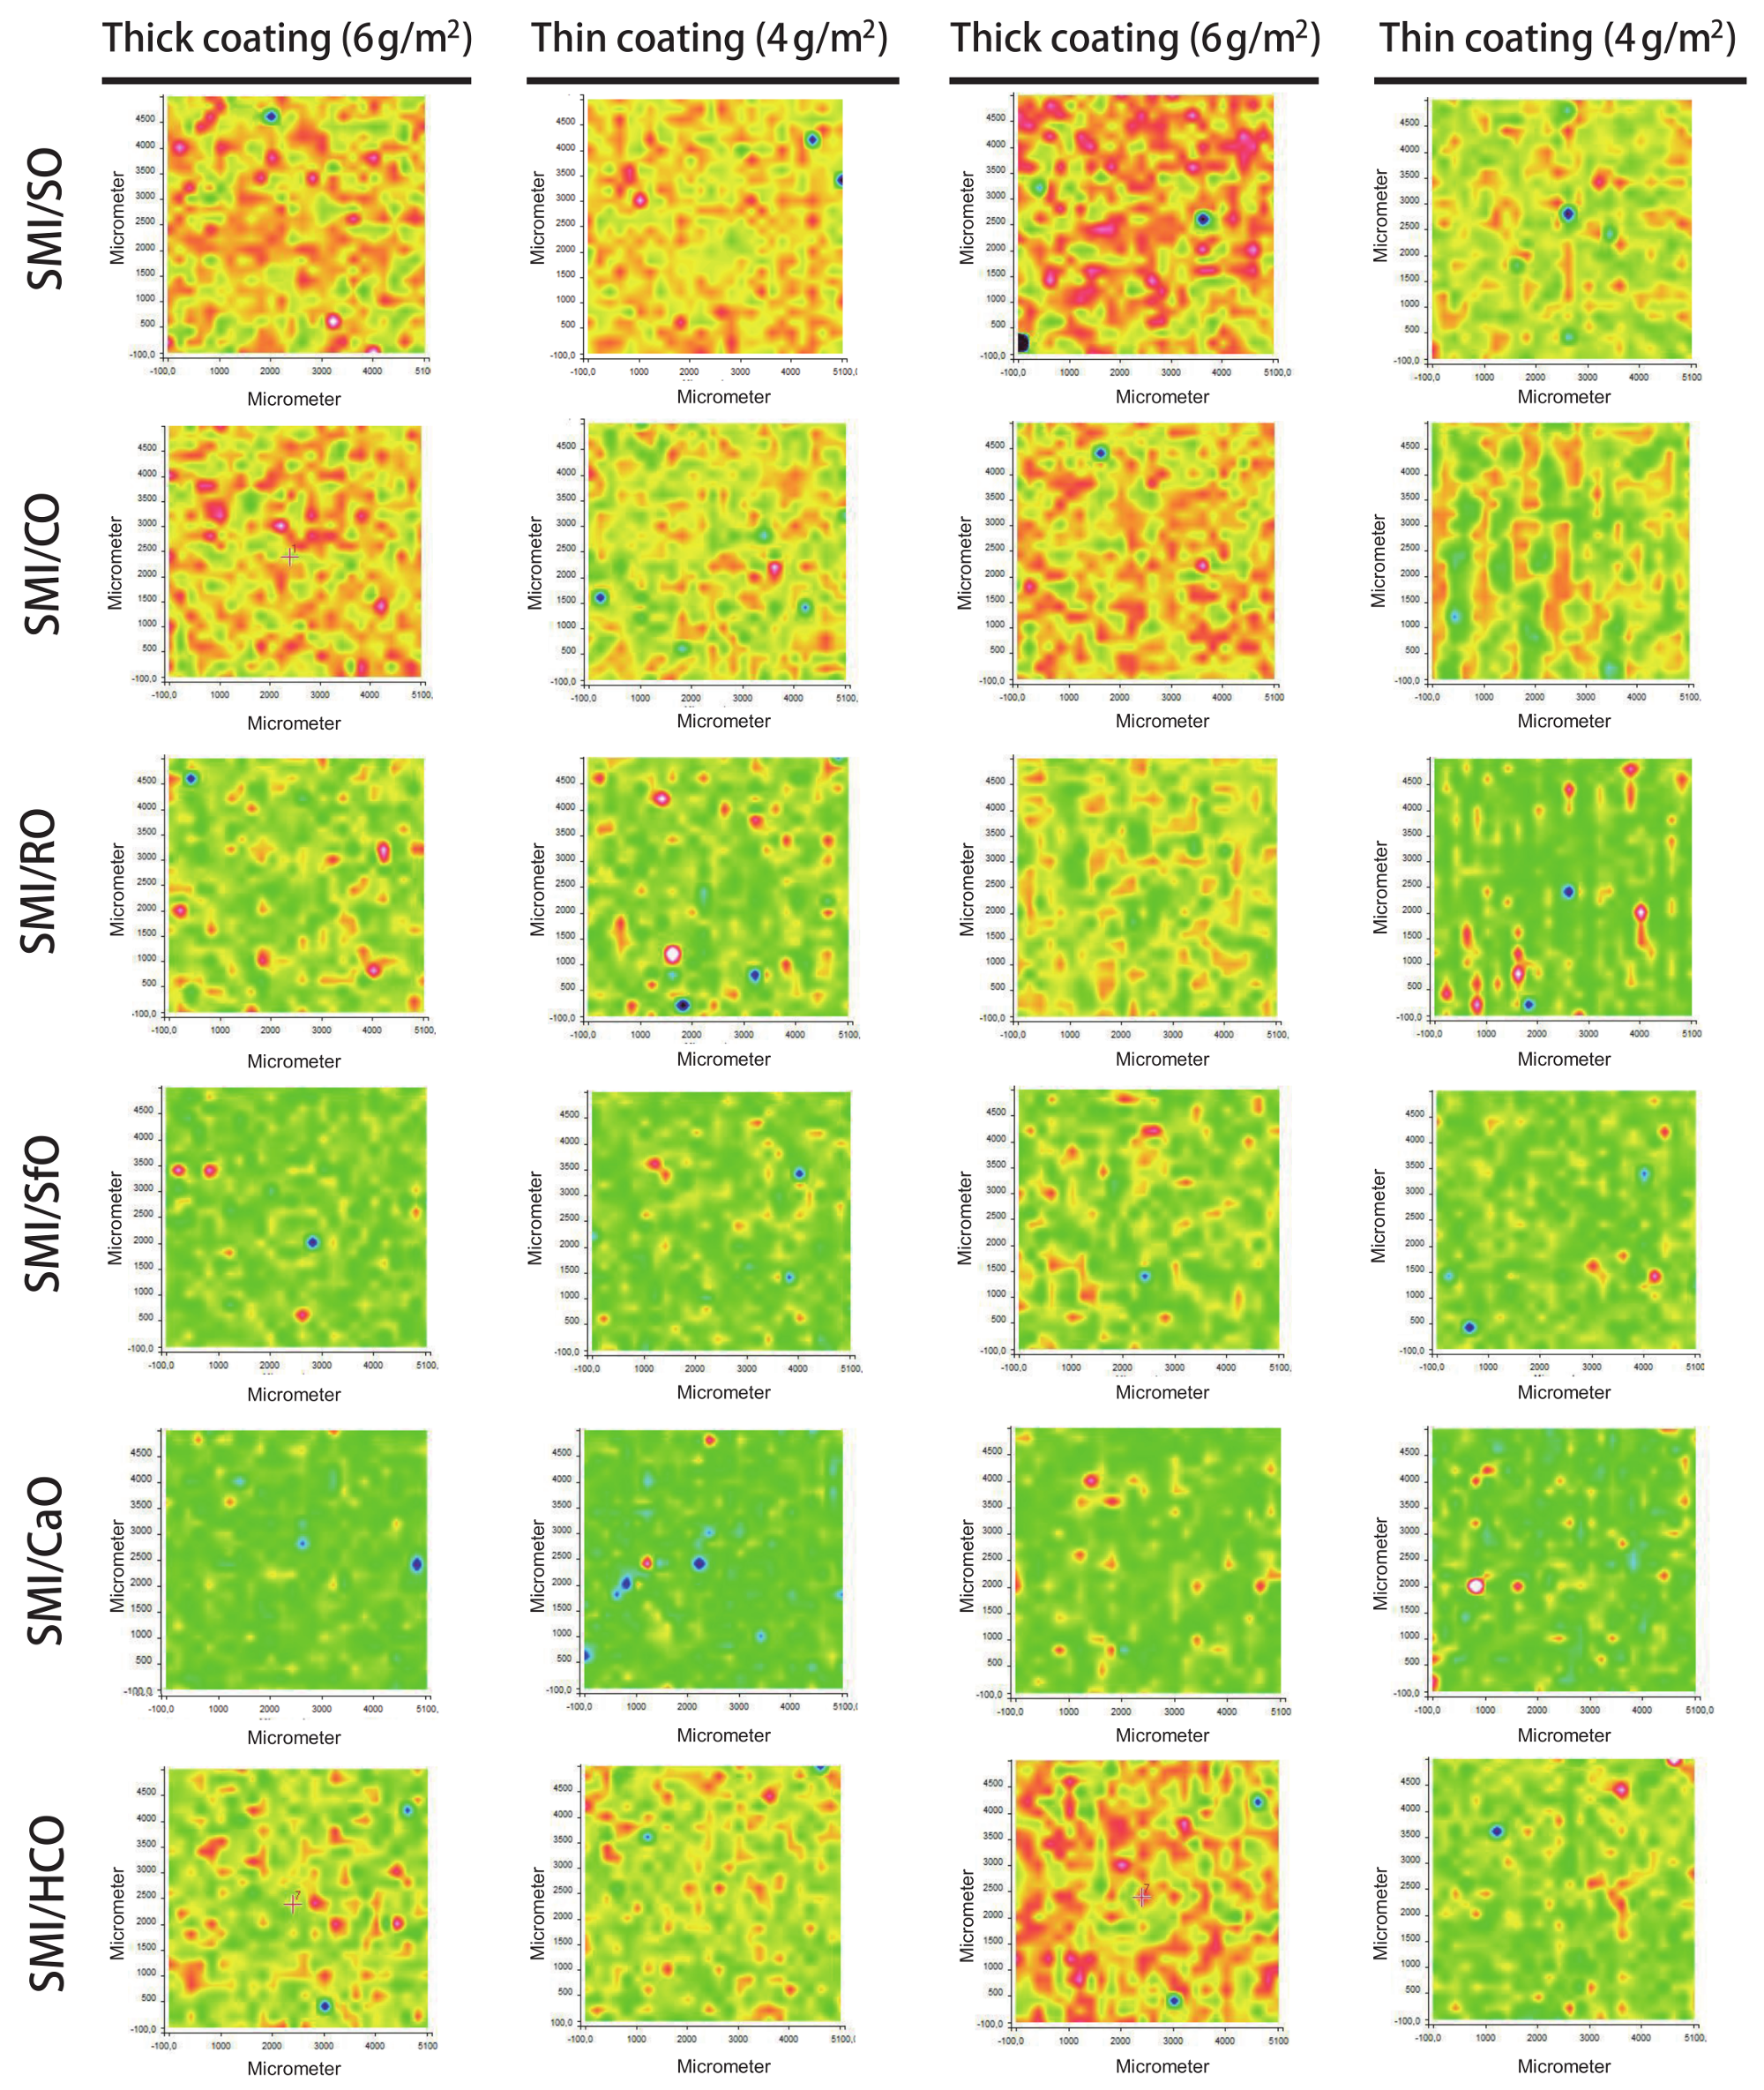
Figure 8.
Raman maps (5 × 5 mm2) with band intensity ratios illustrating styrene moieties at the surface for SMI/oil paper coatings (left two columns: 1602 cm−1/cellulose, right two columns: 1000 cm−1/cellulose).
Figure 8.
Raman maps (5 × 5 mm2) with band intensity ratios illustrating styrene moieties at the surface for SMI/oil paper coatings (left two columns: 1602 cm−1/cellulose, right two columns: 1000 cm−1/cellulose).
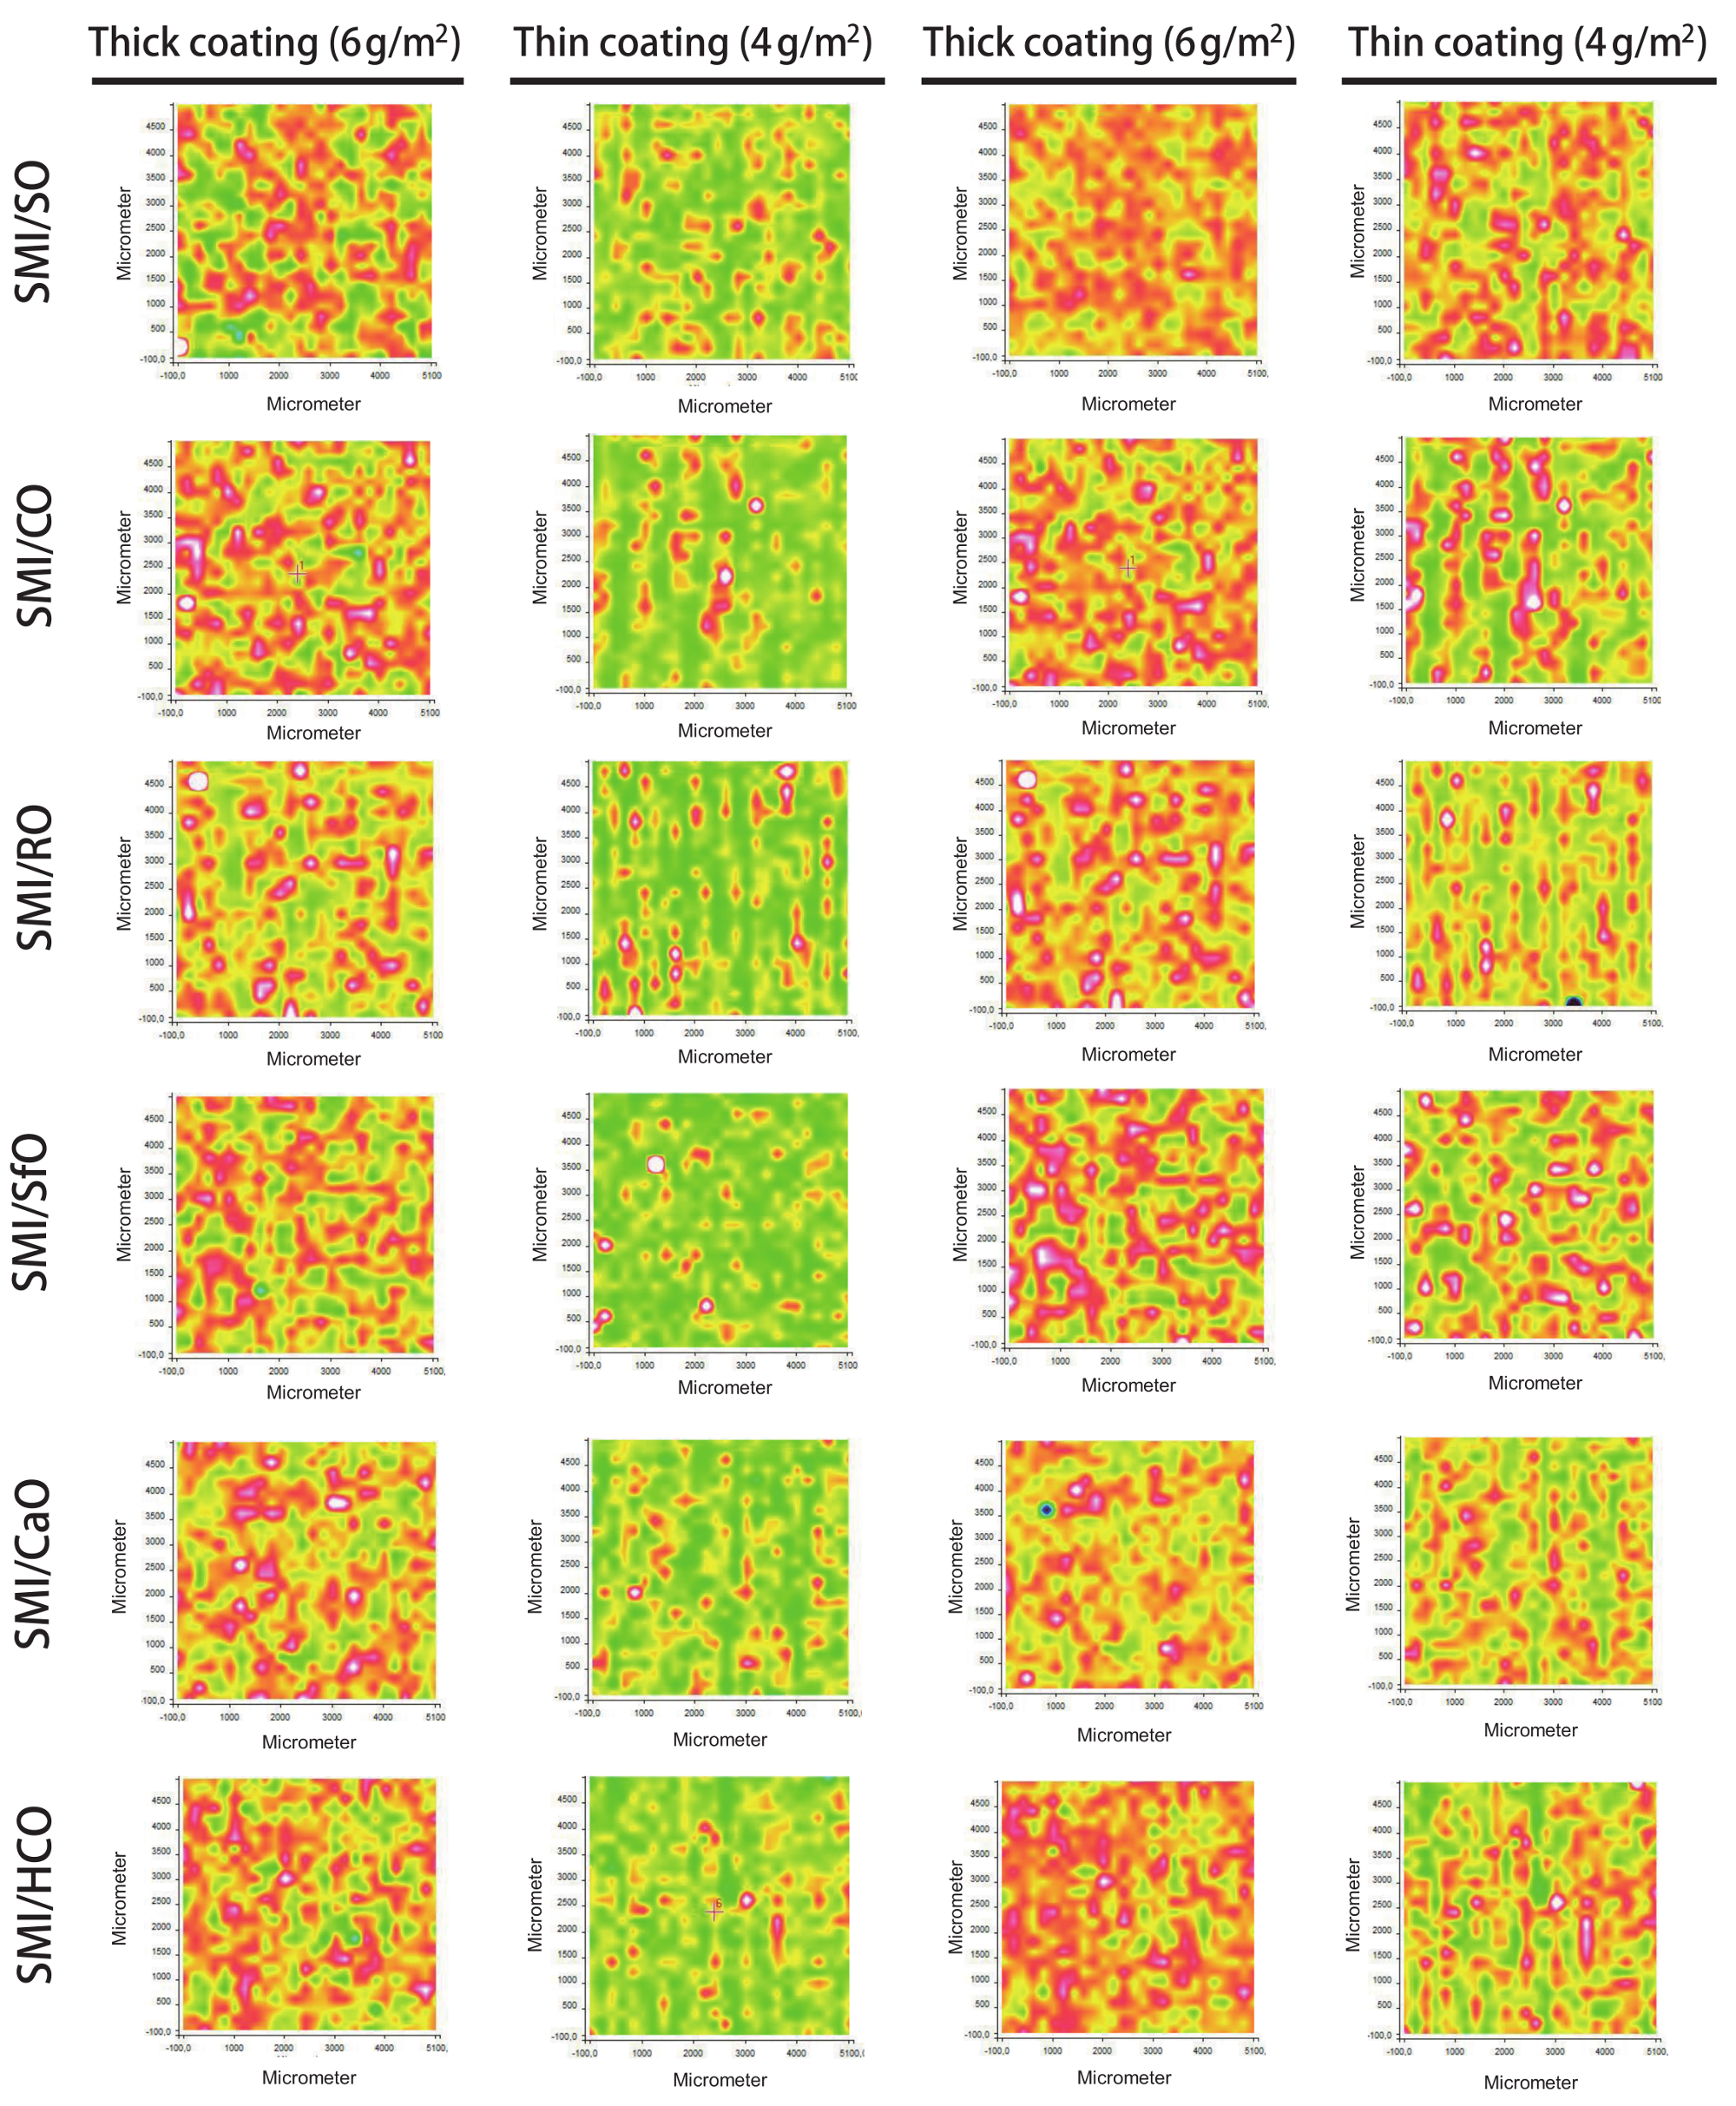
Figure 9.
Raman maps (5 × 5 mm2) with single wavenumbers representing different coating and substrate components at the surface for SMI/oil paper coatings.
Figure 9.
Raman maps (5 × 5 mm2) with single wavenumbers representing different coating and substrate components at the surface for SMI/oil paper coatings.

Figure 10.
Processed images of single Raman wavenumbers for imide (1765 cm−1) and oil (1655 cm−1), illustrating lateral distribution of oil within the organic phase (+) and free oil (−).
Figure 10.
Processed images of single Raman wavenumbers for imide (1765 cm−1) and oil (1655 cm−1), illustrating lateral distribution of oil within the organic phase (+) and free oil (−).

Table 1.
Characteristics of the oils and SMI/oil nanoparticle dispersions for paper coatings.
| Vegetable Oils | SMI/Oil Nanoparticle Dispersions | ||||||
|---|---|---|---|---|---|---|---|
| Oil Type | Iodine Value g(I2)/100 g | Coating Type | pH | S.C. (%) | Viscosity (cp) | z-Average Particle Size, Diameter (nm) | Poly-Dispersity |
| Soy | 130 | SMI/SO | 5.48 | 49.8 | 146 | 149 | 0.163 |
| Corn | 119 | SMI/CO | 5.44 | 49.9 | 102 | 143 | 0.161 |
| Rapeseed | 98 | SMI/RO | 5.43 | 49.5 | 91 | 156 | 0.137 |
| Sunflower | 85 | SMI/SfO | 5.38 | 48.8 | 134 | 143 | 0.176 |
| Castor | 81 | SMI/CaO | 5.72 | 49.9 | 230 | 148 | 0.137 |
| Hydrogenated Castor | 5 | SMI/HCO | 5.54 | 49.4 | 116 | 132 | 0.152 |
Table 2.
Quantification of SMI/oil coatings on paper based on Raman spectroscopy.
| Coating Type | Imide Content/% | Free (Unreacted) Oil/% |
|---|---|---|
| SMI/SO | 26.4 | 4 |
| SMI/CO | 23.2 | 5 |
| SMI/RO | 21.2 | 15 |
| SMI/SfO | 19.8 | 22 |
| SMI/CaO | 19.3 | 24 |
| SMI/HCO | 24.6 | 50 |
© 2018 by the author. Licensee MDPI, Basel, Switzerland. This article is an open access article distributed under the terms and conditions of the Creative Commons Attribution (CC BY) license (http://creativecommons.org/licenses/by/4.0/).
Share and Cite
MDPI and ACS Style
Samyn, P. Raman Microscopy for Classification and Chemical Surface Mapping of Barrier Coatings on Paper with Oil-Filled Organic Nanoparticles. Coatings 2018, 8, 154. https://doi.org/10.3390/coatings8050154
AMA Style
Samyn P. Raman Microscopy for Classification and Chemical Surface Mapping of Barrier Coatings on Paper with Oil-Filled Organic Nanoparticles. Coatings. 2018; 8(5):154. https://doi.org/10.3390/coatings8050154
Chicago/Turabian StyleSamyn, Pieter. 2018. "Raman Microscopy for Classification and Chemical Surface Mapping of Barrier Coatings on Paper with Oil-Filled Organic Nanoparticles" Coatings 8, no. 5: 154. https://doi.org/10.3390/coatings8050154
Note that from the first issue of 2016, this journal uses article numbers instead of page numbers. See further details here.