Article

Realization of Graphene on the Surface of Electroless Ni–P Coating for Short-Term Corrosion Prevention

1
School of Materials Science and Engineering, Southwest Petroleum University, Chengdu 610500, China
2
College of Materials Science and Engineering, Zhejiang University of Technology, Hangzhou 310014, China
3
Department of Materials Science and Engineering, College of Engineering, Peking University, Beijing 100871, China
*
Author to whom correspondence should be addressed.
Coatings 2018, 8(4), 130; https://doi.org/10.3390/coatings8040130
Submission received: 3 March 2018 / Revised: 25 March 2018 / Accepted: 31 March 2018 / Published: 4 April 2018
(This article belongs to the Special Issue Advanced Coatings for Corrosion Protection in Extreme Environments)

Abstract

:
Graphene was first fabricated on the surface of an electroless Ni–P coating/carbon steel (Ni–P–G) to improve its corrosion resistance. Meanwhile, an electroless Ni–P coating (Ni–P) was heated (Ni–P–H) under the same condition as Ni–P–G for comparison. The morphological results showed that a wavy multilayer graphene was formed on the surface of Ni–P–G. The layer number of the graphene film was 5–10 according to the analysis of Raman spectra and observation by a high-resolution transmission electron microscope. The ID/IG ratio calculated from the Raman spectrum revealed that the graphene growing at the grain of Ni–P–H had larger grain size than that growing at the grain boundary. The electrochemical results showed a higher Rp, a lower CPEdl, and a lower corrosion rate of Ni–P–G than Q235 steel, Ni–P, and Ni–P–H, indicating a higher corrosion resistance. In addition, the surface potential map achieved by a scanning Kelvin probe presented a more positive surface potential of Ni–P–G than Ni–P with the difference being around 375–750 mV, demonstrating a lower corrosion tendency of Ni–P–G.

1. Introduction

A protective Ni–P coating can be prepared on the surfaces of most metals, alloys, and even polymers by electroless plating, which is an autocatalytic process and a cost-efficient method [1]. However, the corrosion resistance of electroless Ni–P coating needs to be further improved for applications in harsh environment. As a result, nanoparticles—TiO2, ZrO2, Al2O3, etc.—have been widely studied to enhance the corrosion resistance of Ni–P coating. However, the additional interfaces between the particles and the Ni–P matrix may worsen the long-term corrosion resistance of these composite coatings [2].
Graphene, a promising material, has attracted much attention for its excellent properties, such as ultra-high electric and thermal conductivity and outstanding mechanical strength, as well as its large specific area [3,4]. The application of graphene as a barrier to reduce the corrosion of materials has been investigated for several years, but its protection efficiency is has been inconsistent [5]. For example, Raman et al. [6] developed a high-quality graphene film on the surface of Cu and found that graphene increased its resistance to electrochemical degradation by one and half orders of magnitude. Prasai et al. [7] reported that Ni coated with multilayer graphene was corroded 20 times slower than bare Ni. Stoot et al. [8] found that even non-perfect multilayer graphene films can considerably increase the lifetime of next-generation bipolar plates for fuel cells. However, Schriver et al. [9] noted that a single-layer conducting graphene film, acting as a long-term anticorrosion barrier, on Cu substrate actually further promoted corrosion by facilitating electrochemical reactions both across the surface and through the bulk of the substrate. Yu et al. [10] also found that graphene failed as a long-term corrosion barrier. Therefore, the protection efficiency of graphene as an anticorrosion barrier mainly depends on its quality and thickness. Generally, the thicker and more integrated the graphene, the higher the protection efficiency [7].
Chemical vapor deposition (CVD) was one of the first reliable methods of preparing high-quality graphene on Cu substrate based on the surface growth model [11] and on Ni substrate based on the segregation growth model [12]. Then, graphene was also fabricated on the substrates of various other materials—Fe [13], Co [14], Ru [15], Rh [16] and even alloys of stainless steel [17] (Cu/Ni alloy [18], Cu/Pt alloy [19] and Ni–Mo alloy [20])—to widen its application. However, the preparation of some of the above described graphene did not follow the traditional method, which usually resulted in a high cost and a complex process. Fortunately, electroless Ni–P coating has been identified as one of the metallic materials that could be a potential substrate for growing graphene more efficiently. One advantage of Ni–P coating is that graphene grown on its surface has the potential to increase the corrosion resistance of the Ni–P coating. In addition, Ni–P coating can serve as a cost-efficient medium for growing graphene on the surface of most metals and alloys, thereby widening the potential use of graphene as an anticorrosive barrier.
In this study, chemically inert graphene was fabricated on the surface of electroless Ni–P coating in order to analyze its microstructure and anticorrosion performance. This research is believed to advance significantly the fields of corrosion prevention and the application potential of graphene.

2. Materials and Methods

2.1. Materials

Prior to the growth of graphene, a Ni–P coating was fabricated by electroless plating on the substrate of Q235 carbon steel. The contents of the plating solution and the preparation parameters of the Ni–P coating can be found in authors’ early research [21]. Here, the time of electroless plating was 2 h, and the thickness of the achieved pure Ni–P coating was around 25 μm. Then, the Ni–P/steel specimens were put into a tube furnace (Lindberg/Blue M HTF55322C) and heated to 1000 °C at a temperature ramping rate of 16 °C/min under the atmosphere of Ar (500 sccm) and H2 (200 sccm). Next, the specimens were annealed in the same atmosphere for 1 h to remove surface oxides and improve grain size. CH4 (48 sccm) was then introduced in the tube furnace at ambient pressure for 30 min. Finally, the specimens were cooled down to ambient temperature at a rate of 10 °C/min to achieve large crystal grain of graphene. In addition, an electroless Ni–P coating (Ni–P) and a Ni–P coating that was heated (Ni–P–H) under the same conditions as the graphene-coated Ni–P coating (Ni–P–G) were prepared for comparison purposes.

2.2. Methods

The surfaces of the achieved specimens were characterized by a scanning electron microscope (SEM, EV0 MA15 Zeiss, Carl Zeiss Co., Oberkochen, Germany) and a LabRAM HR Raman spectrometer (Horiba-Jobin Yvon, Kyoto, Japan). In addition, the graphene film was obtained by dissolving the Ni–P/steel substrate in 2 mol/L nitric acid, and then a high-resolution transmission electron microscope (HRTEM, F20, FEI, Hillsboro, OR, USA) was applied to observe the morphology of graphene.
The electrochemical impedance spectroscopy (EIS) of the coatings was tested at the immersion time of 2 h in a 3.5 wt % NaCl solution at a frequency range of 100 kHz–10 mHz and a voltage amplitude of ±5 mV rms. Potentiodynamic polarization curves of coatings were measured afterwards with a potential scanning rate of 1 mV/s. All the electrochemical tests were carried out on an electrochemical workstation (CS310, CorrTest Instruments Corp., Ltd., Wuhan, China) with a conventional three-electrode cell by using a saturated calomel electrode (SCE) as the reference electrode, a platinum sheet as the counter electrode, and a specimen as the working electrode. In addition, a non-destructive method of scanning Kelvin probe technique (SKP, Versa SCAN, Ametek Scientific Instruments, Berwyn, PA, USA) was employed within an area of 2 mm × 4 mm to evaluate the surface potential distribution of the Ni–P and Ni–P–G.

3. Results and Discussion
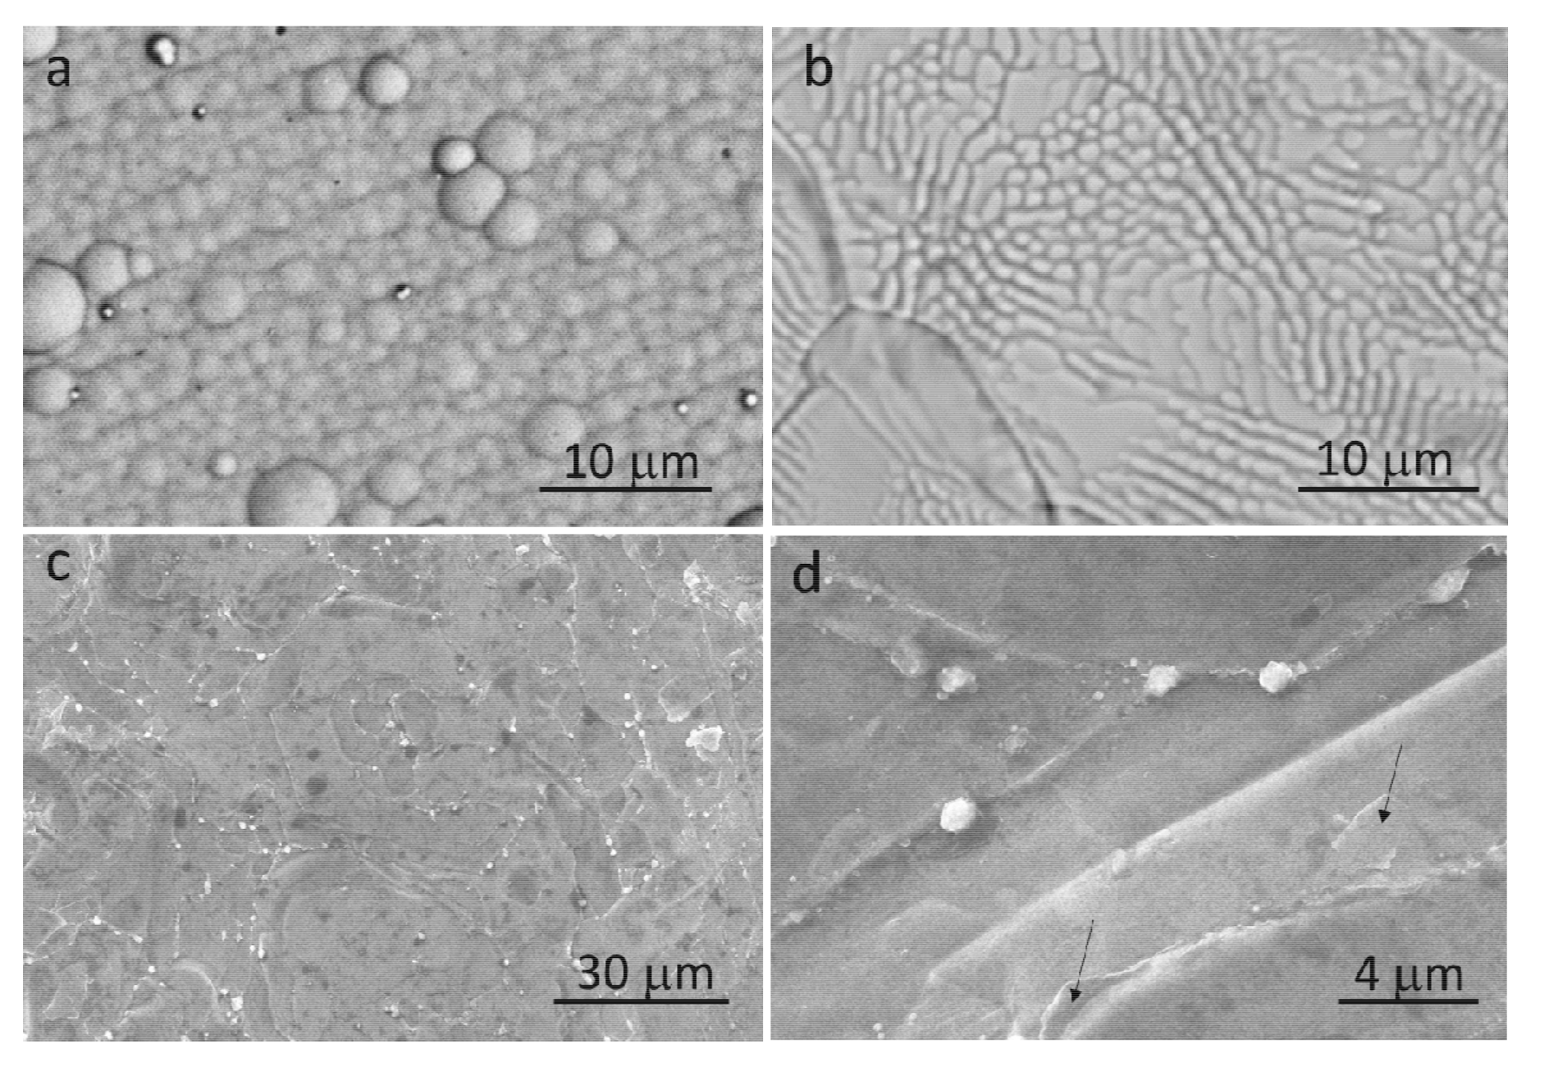
3.1. Morphology

SEM images of Ni–P, Ni–P–H, Ni–P–G, and an enlarged view of Ni–P–G are presented in Figure 1. It can be observed that Ni–P shows a cellular morphology that belongs to an amorphous phase [22], as shown in Figure 1a. It is well-known that the amorphous phase of Ni–P will transform to a crystalline phase after being heated at a temperature higher than about 350 °C [23]. Thus, crystalline grains are observed on the surface of Ni–P–H in Figure 1b. The crystalline phases of Ni–P–H are mainly Ni3P, NiP, and NiO, as the authors reported in [21]. In addition, the surface of Ni–P–G displayed a very different morphology compared with Ni–P and Ni–P–H, as shown in Figure 1c. Clear polygonal grains and the grain boundaries between them are seen on the surface of Ni–P–G. Also, thin graphene sheets are found in the enlarged view of the Ni–P–G surface, as arrows denote in Figure 1d. These morphological features demonstrate that graphene film was formed on the surface of Ni–P by CVD.
Raman spectra were obtained to indirectly determine the thickness of the graphene film formed on the surface of Ni–P–G. An image of Ni–P–G with the Raman spectra at regions ① and ② are provided in Figure 2. It can be observed that the Raman spectrum of region ① displays two characteristic peaks at 1580 cm−1 and 2700 cm−1, which separately correspond to G and 2D Raman bands. The intensity of the 2D band is lower than that of the G band with the IG/I2D ratio around 2.45. This means that the obtained graphene is multilayered rather than single-layered, and the layer number is around 5–10 [24]. By contrast, although the Raman spectrum of region ② displays a similar IG/I2D ratio as that of region ①, a characteristic peak at 1350 cm−1 corresponding to a defect/disorder induced D band is found. The ID/IG ratio strongly depends on the defect density of the graphene, and thus, it can be used to calculate the number of defects using the empirical formula below [25]:
n D ( cm 2 ) = 7.3 × 10 9 × E L 4 × ( I D I G )
where, nD is defect density; EL is the laser energy used for the Raman spectrum, which is 2.4 eV in this study; the number 7.3 × 10⁹ is an empirical constant; and the ID/IG ratio is 0.12, calculated from Figure 2. The final nD equaling 2.9 × 10¹⁰ indicates that the multilayer graphene formed in region ② contains a small number of defects. In contrast, no obvious D band is observed for the graphene formed in region ①, revealing that ID/IG ratio is very low and that there are nearly no defects in the graphene within this region. In addition, the ID/IG ratio also provides information about the grain size of the graphene [26]. The higher ID/IG ratio in region ② indicates smaller grain size, while the lower ID/IG ratio in region ① indicates a larger grain size. Generally, region ① is dominant on the surface of Ni–P–G, and thus, the 5–10 multilayer graphene with nearly no defects is determined to be distributed on the majority of the surface of this coating. Region ② is mainly located at the grain boundaries of Ni–P–G, where more nucleation sites are possible, thereby causing smaller grain sizes of graphene.
An image of the graphene film, dissolved from Ni–P–G and observed by a HRTEM, is shown in Figure 3 to directly define the thickness. The wavy graphene film is very thin and nearly transparent. Meanwhile, the edges of the graphene film with a thickness of around 2–4 nm can be observed, indicating that the number of layers of graphene is about 5–10, which is consistent with the result concluded in Raman spectra.

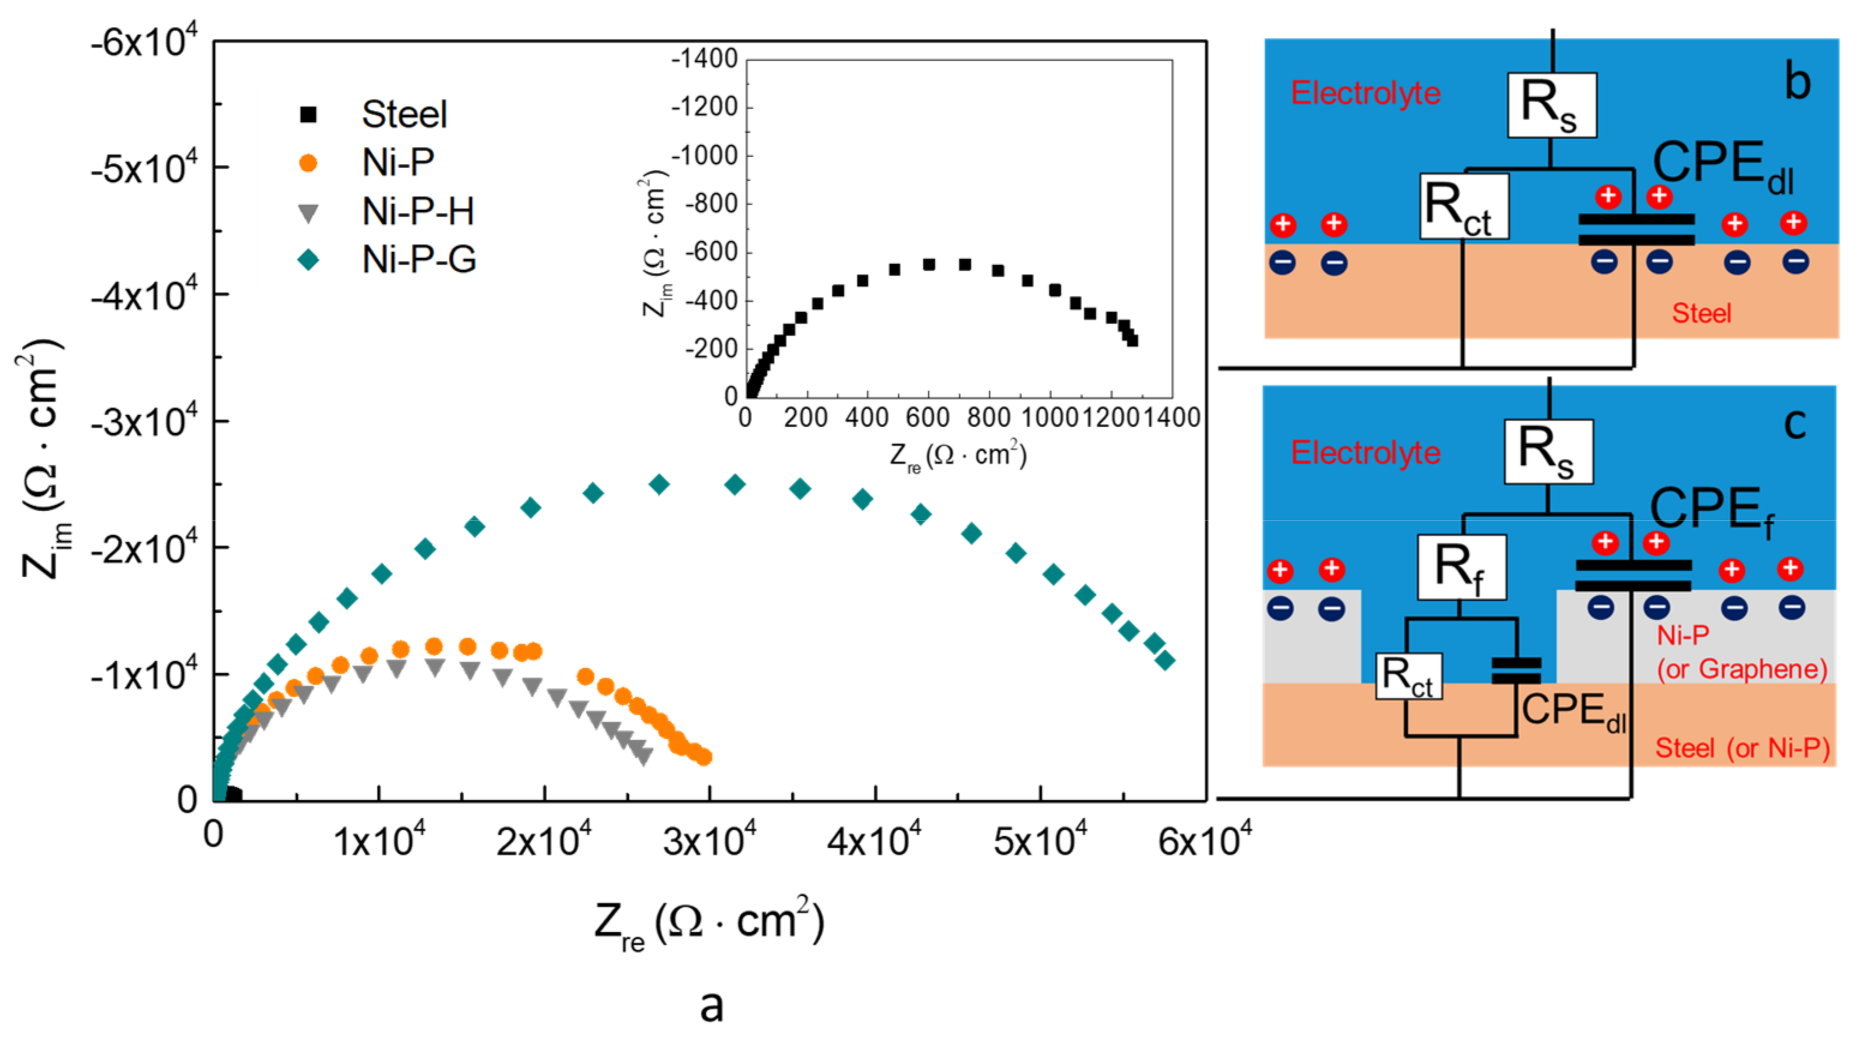
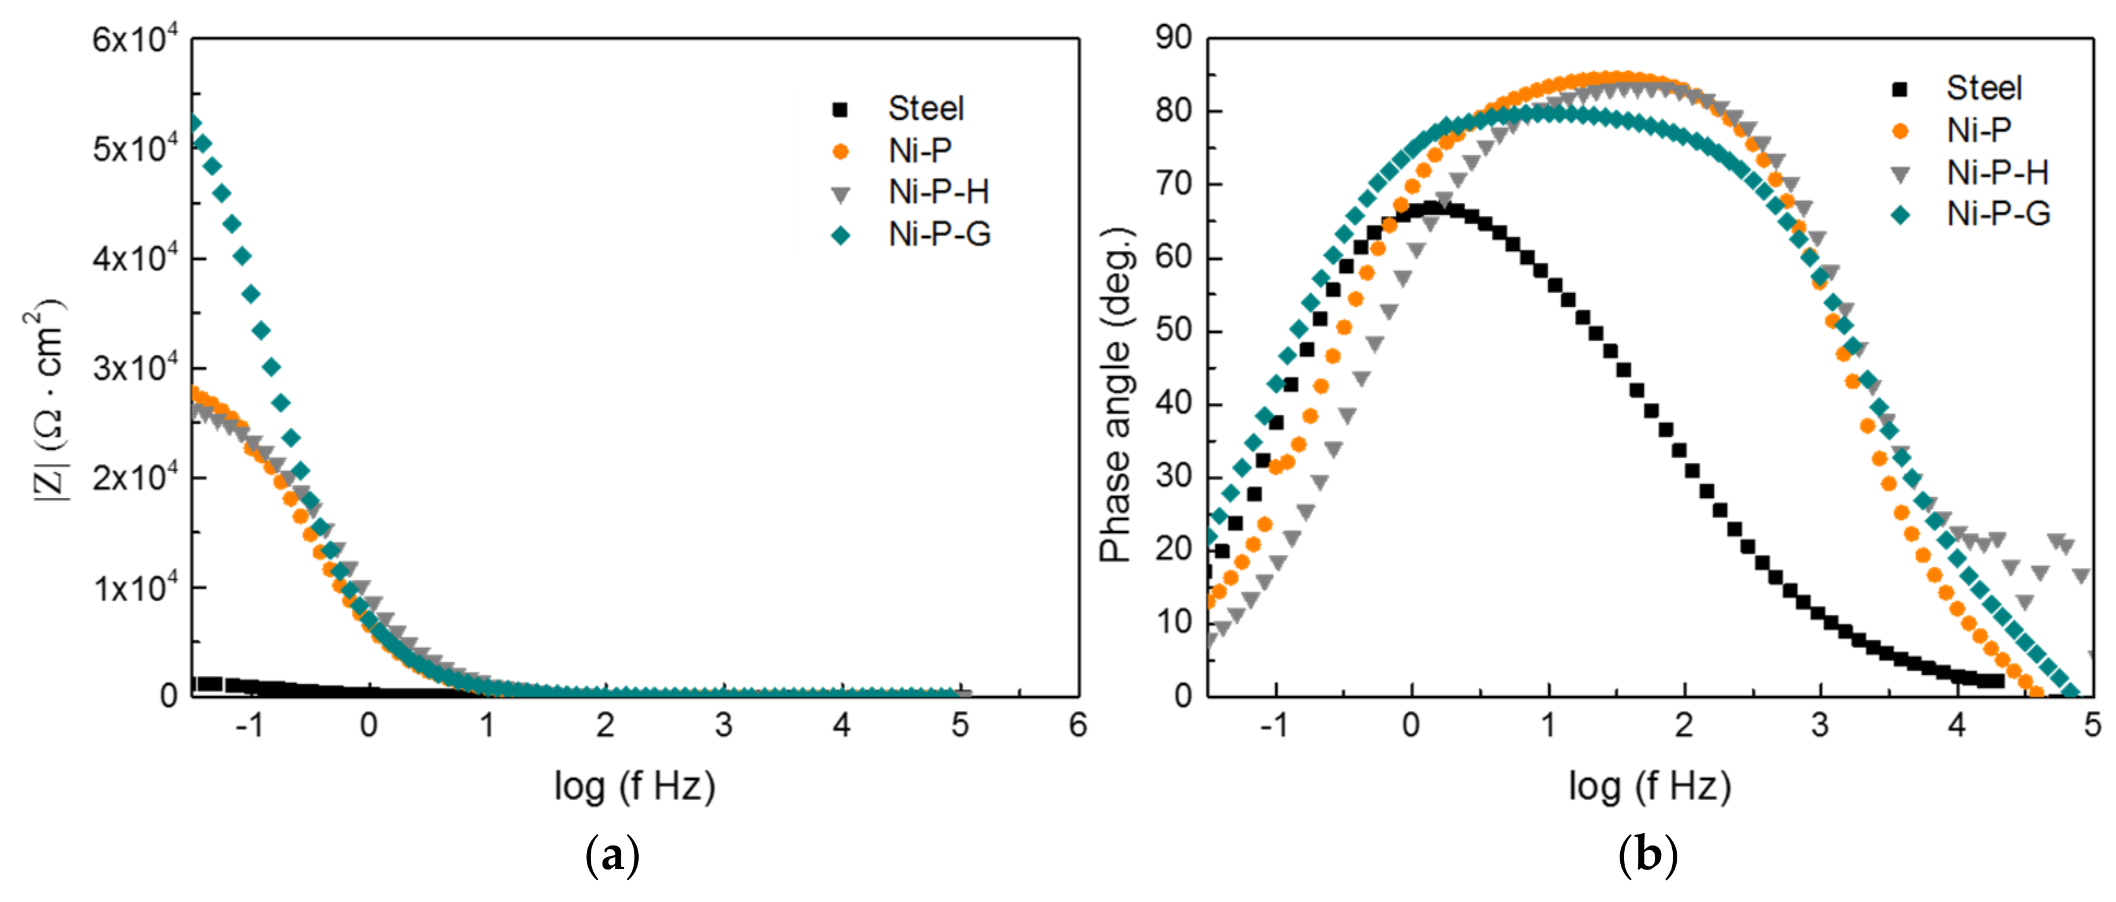
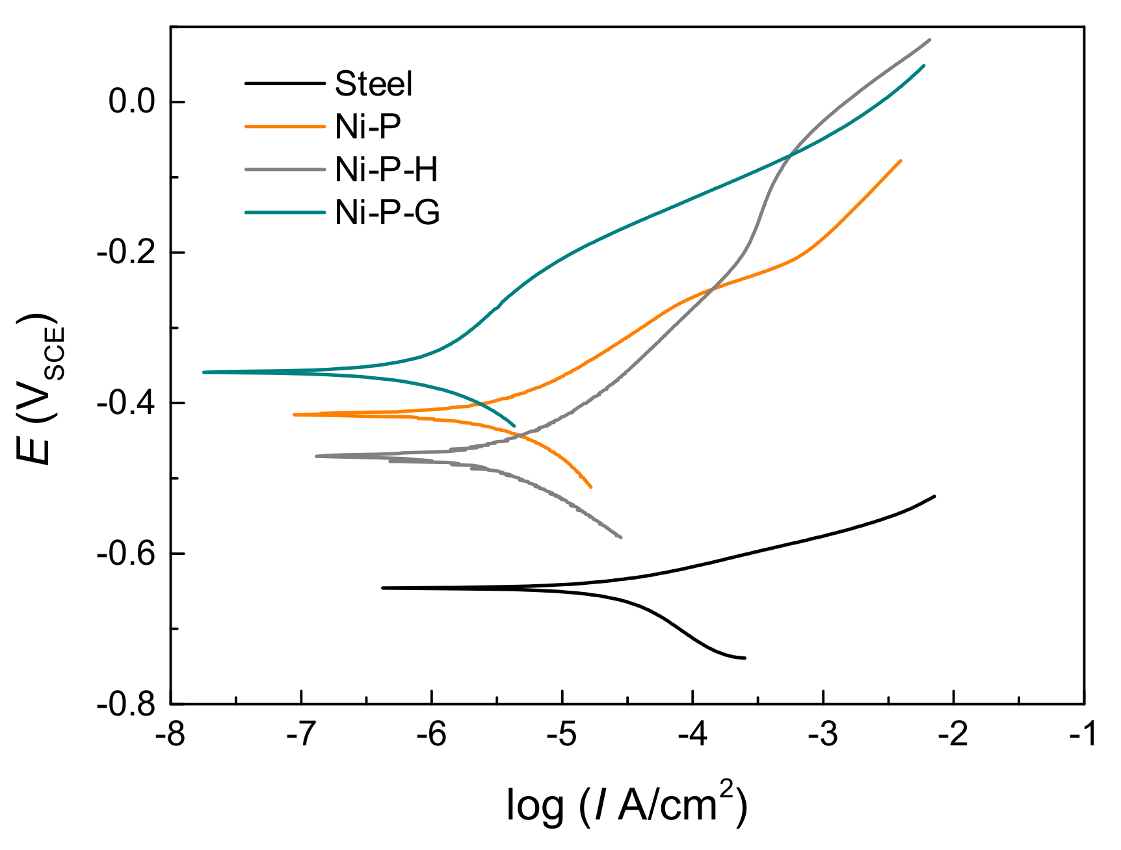
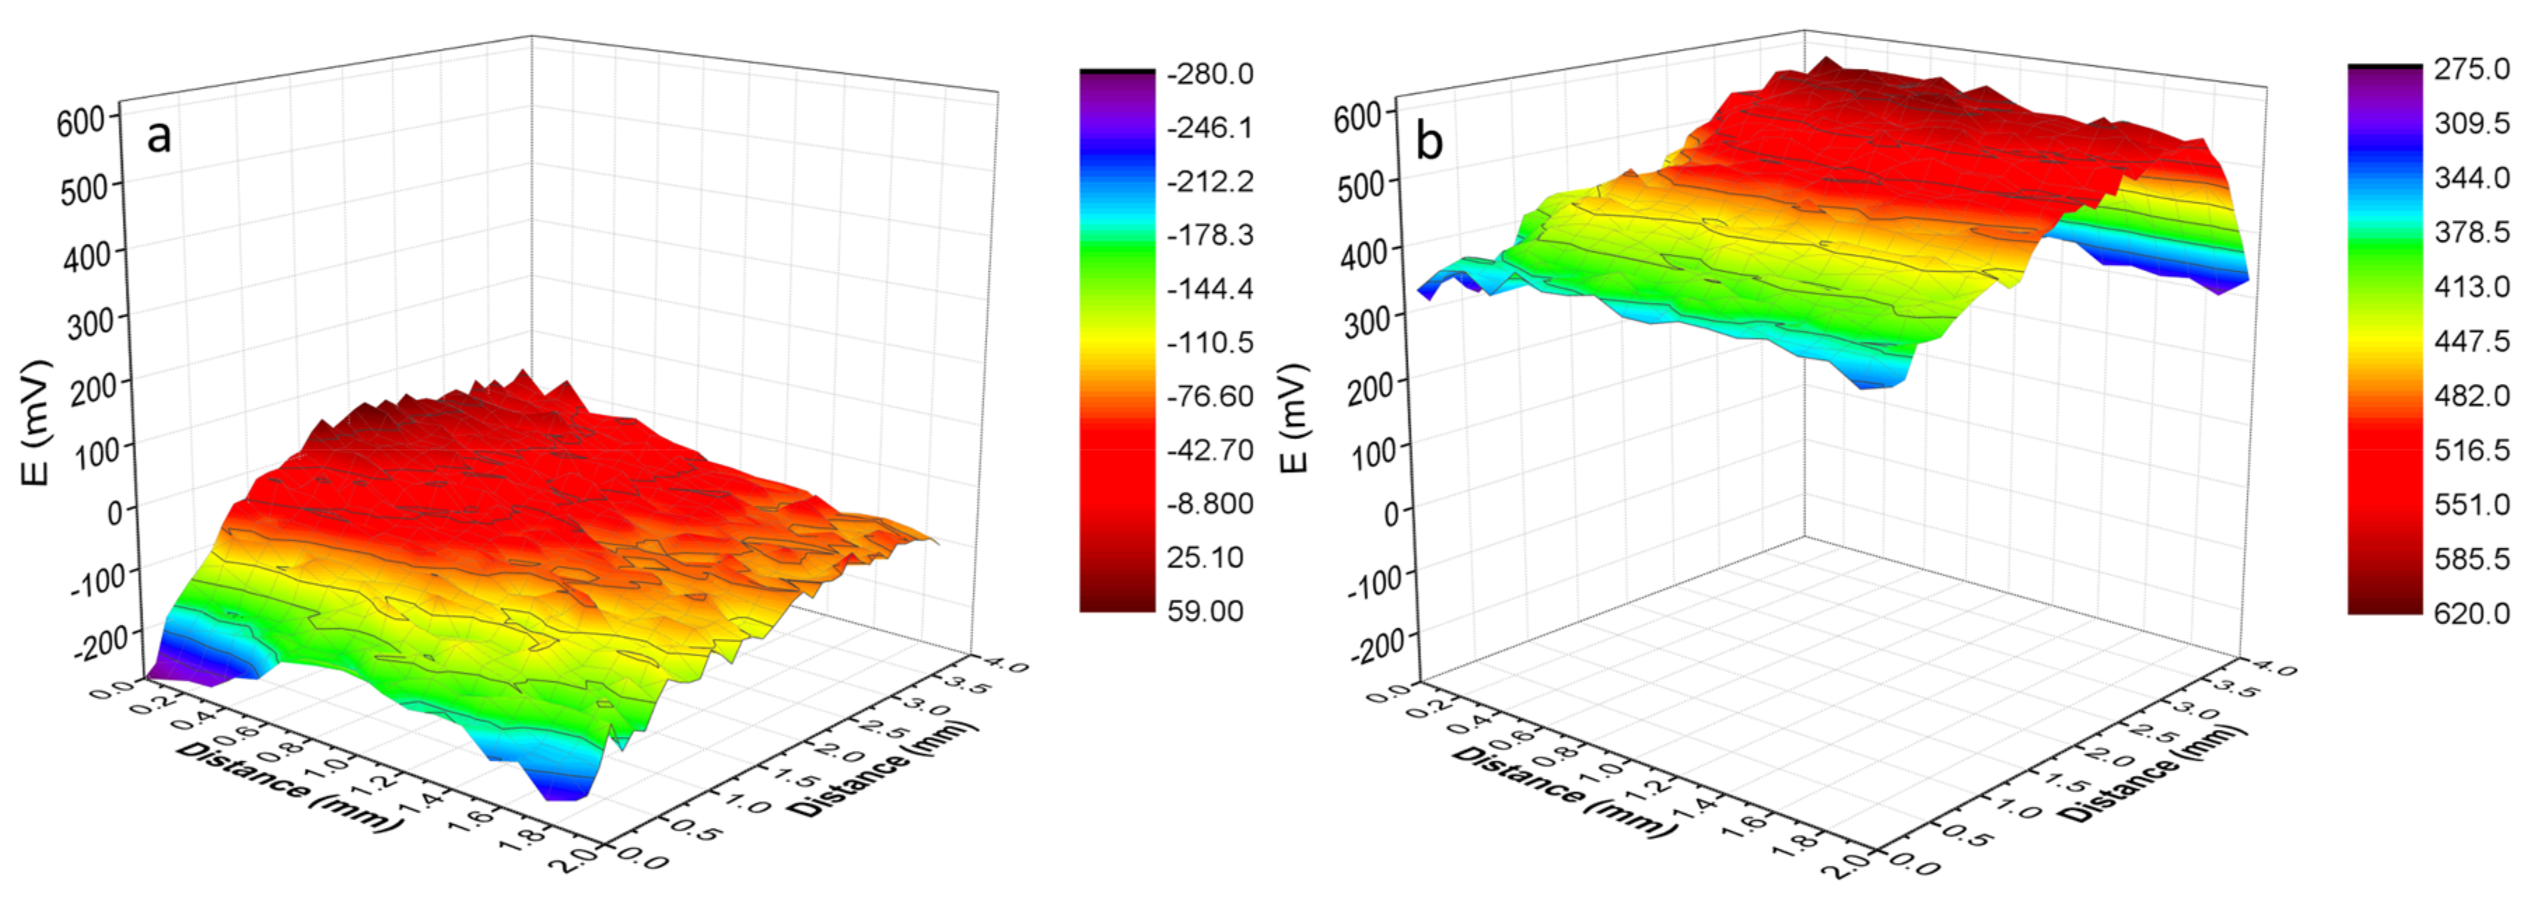
3.2. Electrochemical Tests

Graphene has been widely studied as a barrier to prevent harmful ions from penetrating to the surface of the substrate and thus improve corrosion resistance. The protection efficiency of the graphene achieved on the surface of Ni–P–G was investigated by electrochemical method. The Nyquist plots of the Q235 steel as well as Ni–P, Ni–P–H, and Ni–P–G immersed in 3.5 wt % NaCl solution for 2 h were tested and are shown in Figure 4. It was observed that all of the materials displayed depressed capacitive loops, indicating that a dispersion effect occurred generally. Moreover, the three types of coatings exhibited larger radiuses of the capacitive loops than did the Q235 steel, revealing higher corrosion resistance of the formers [27]. In addition, Ni–P–H displayed a slightly smaller radius of the capacitive loop than did Ni–P, indicating slightly lower corrosion resistance. This phenomenon is consistent with the findings of past studies [28]; essentially, the crystalline phase of Ni–P is more sensitive to corrosion than the amorphous phase because of the appearance of grain boundaries, dislocations, or second-phase precipitates. However, the radiuses of the capacitive loops of both of the above coatings are smaller than that of Ni–P–G, which indicates that the corrosion resistance of Ni–P is improved by graphene. In addition, the Bode plots of the Q235 steel and the three coatings are provided in Figure 5, in which a higher magnitude of impedance of Ni–P–G than that of the other specimens is found. Meanwhile, the broader phase angle curves of Ni–P, Ni–P–H and Ni–P–G as compared to that of the Q235 steel indicate that two time constants were involved in the EIS testing.
The typical Nyquist plots of the Q235 steel and coatings in Figure 4a can be fitted by widely employed equivalent circuits in Figure 4b,c, respectively [6]. In these two equivalent circuits, Rs is the resistance of the electrolyte, Rf is the resistance of the pore at the coating surface, and CPEf is a constant phase element to represent the capacitance of the electrical double layer on the surface of the coating. CPE is generally attributed to the distributed surface reactivity, roughness, electrode porosity, and current and potential distributions associated with the electrode geometry; therefore, here we use a CPEf rather than an ideal capacitor [29]. Rct and CPEdl are used to represent the metal/electrolyte interface. For the Q235 steel, this interface is between the steel surface and the electrolyte, while for the coatings, the metal/electrolyte interface is exposed to the electrolyte through defects or pores in the coating and, therefore, is in series with Rf. The impedance of the above elements in the equivalent circuits is expressed by Equations (2)–(6), where ZR is the impedance of a resistance. ZCPE is the impedance of a constant phase element, which is composed of an admittance (Yo) and a dispersion coefficient (n). Ztotal-steel and Ztotal-coating are the whole impedance of the equivalent circuits for the Q235 steel and the coatings, respectively. The different parameters associated with the proposed equivalent circuits and the relevant polarization resistance (Rp) are summarized in Table 1. Normally, Rp is evaluated by the mathematical sum of the specimen’s relevant resistances (i.e., Rp = Rct + Rf) [1,6]. A higher Rp implies a higher corrosion resistance of materials. As evident from Table 1, the corrosion resistance of the Q235 steel is increased by around 20 times after being coated. In addition, Ni–P and Ni–P–H show slightly different Rp around 3.24 × 10⁴ Ω·cm2 and 2.70 × 10⁴ Ω·cm2, respectively. Whereas, Ni–P–G has the highest Rp among all of the specimens, which is about two times higher than that of Ni–P and Ni–P–H, revealing the highest corrosion resistance. Meanwhile, the metal/electrolyte interface capacitance, CPEdl, of Ni–P–G is lower than that of the Q235 steel and the other two coatings. Since this capacitance is directly proportional to the area of the capacitor, the relatively lower capacitance indicates a comparatively lower exposure of the metal/electrolyte interface to the electrolyte [30]. This means that the graphene on the surface of Ni–P–G is uniform with a small number of defects, which is consistent with the conclusion obtained from Raman spectra.
Z R = R
Z C = 1 j ω C
Z CPE = 1 / Y 0 ( j ω ) n
Z total steel = R s + R ct 1 + Y 0 ( j ω ) n R ct
Z total coating = R s + j ω C dl R ct R cp + R ct + R cp Y 0 ( j ω ) n ( j ω C dl R ct R cp + j ω C dl R ct + R ct + R cp + 1 )
The potentiodynamic polarization curves of the specimens were measured to further evaluate the corrosion resistance and are shown in Figure 6, from which the corrosion potential (Ecorr) and corrosion current density (Icorr), as well as the corrosion rate calculated based on Faraday’s law and the assumption of uniform corrosion, can be obtained [31] (see Table 2). Generally, all the coatings exhibited lower Icorr and corrosion rates than did the Q235 steel substrate. In addition, a lower corrosion rate of 0.011 mm/year for Ni–P–G than for Ni–P or Ni–P–H is noted, indicating a higher corrosion resistance of the former, while the latter two coatings have similar corrosion rates of 0.040 and 0.039 mm/year, respectively. Actually, the corrosion resistance of graphene as a protective layer on metal surfaces relies strongly on its quality and thickness, as stated in the Introduction. The corrosion of the metal will be worsened if graphene cannot completely cover the surface. Therefore, the higher corrosion resistance of Ni–P–G than that of the other two coatings implies that there is high-quality graphene on the surface. Furthermore, the protection efficiency of materials can be calculated by Equation (7) [32]:
η = I corr I corr I corr
where, η is the protection efficiency and Icorr and I’corr are the corrosion current densities of the materials before and after coating. As can be seen in Table 2, the η of Ni–P–G compared with that of Ni–P or Ni–P–H is about 72.5%, while that of Ni–P–G compared with that of the Q235 steel is about 97.1%.
The surface potential maps of Ni–P and Ni–P–G are presented in Figure 7 to evaluate corrosion tendency. A more positive surface potential, 400–600 mV, is noted for Ni–P–G than for Ni–P, −150~25 mV, and the difference between them is around 375–750 mV. This indicates that Ni–P–G is more difficult to be corroded than Ni–P. In addition, the surface potential distribution on the surfaces of the two specimens is relatively uniform, and no local variation is observed, revealing a uniform Ni–P on the Q235 steel substrate and a continuous graphene film on Ni–P–G.
It is worth noting that the electrochemical tests are quick methods to evaluate the short-term corrosion resistance of materials, while more systemic research should be done to figure out the long-term corrosion resistance of Ni–P–G. In addition, currently, the growing mechanism of graphene on the surface of electroless Ni–P coating is not very clear, which needs to be further studied in order to optimize the parameters of the fabrication.

4. Conclusions

Graphene was fabricated on the surface of electroless Ni–P coating by CVD. The conclusions regarding the microstructure and protection efficiency of the graphene are drawn below.
(1)
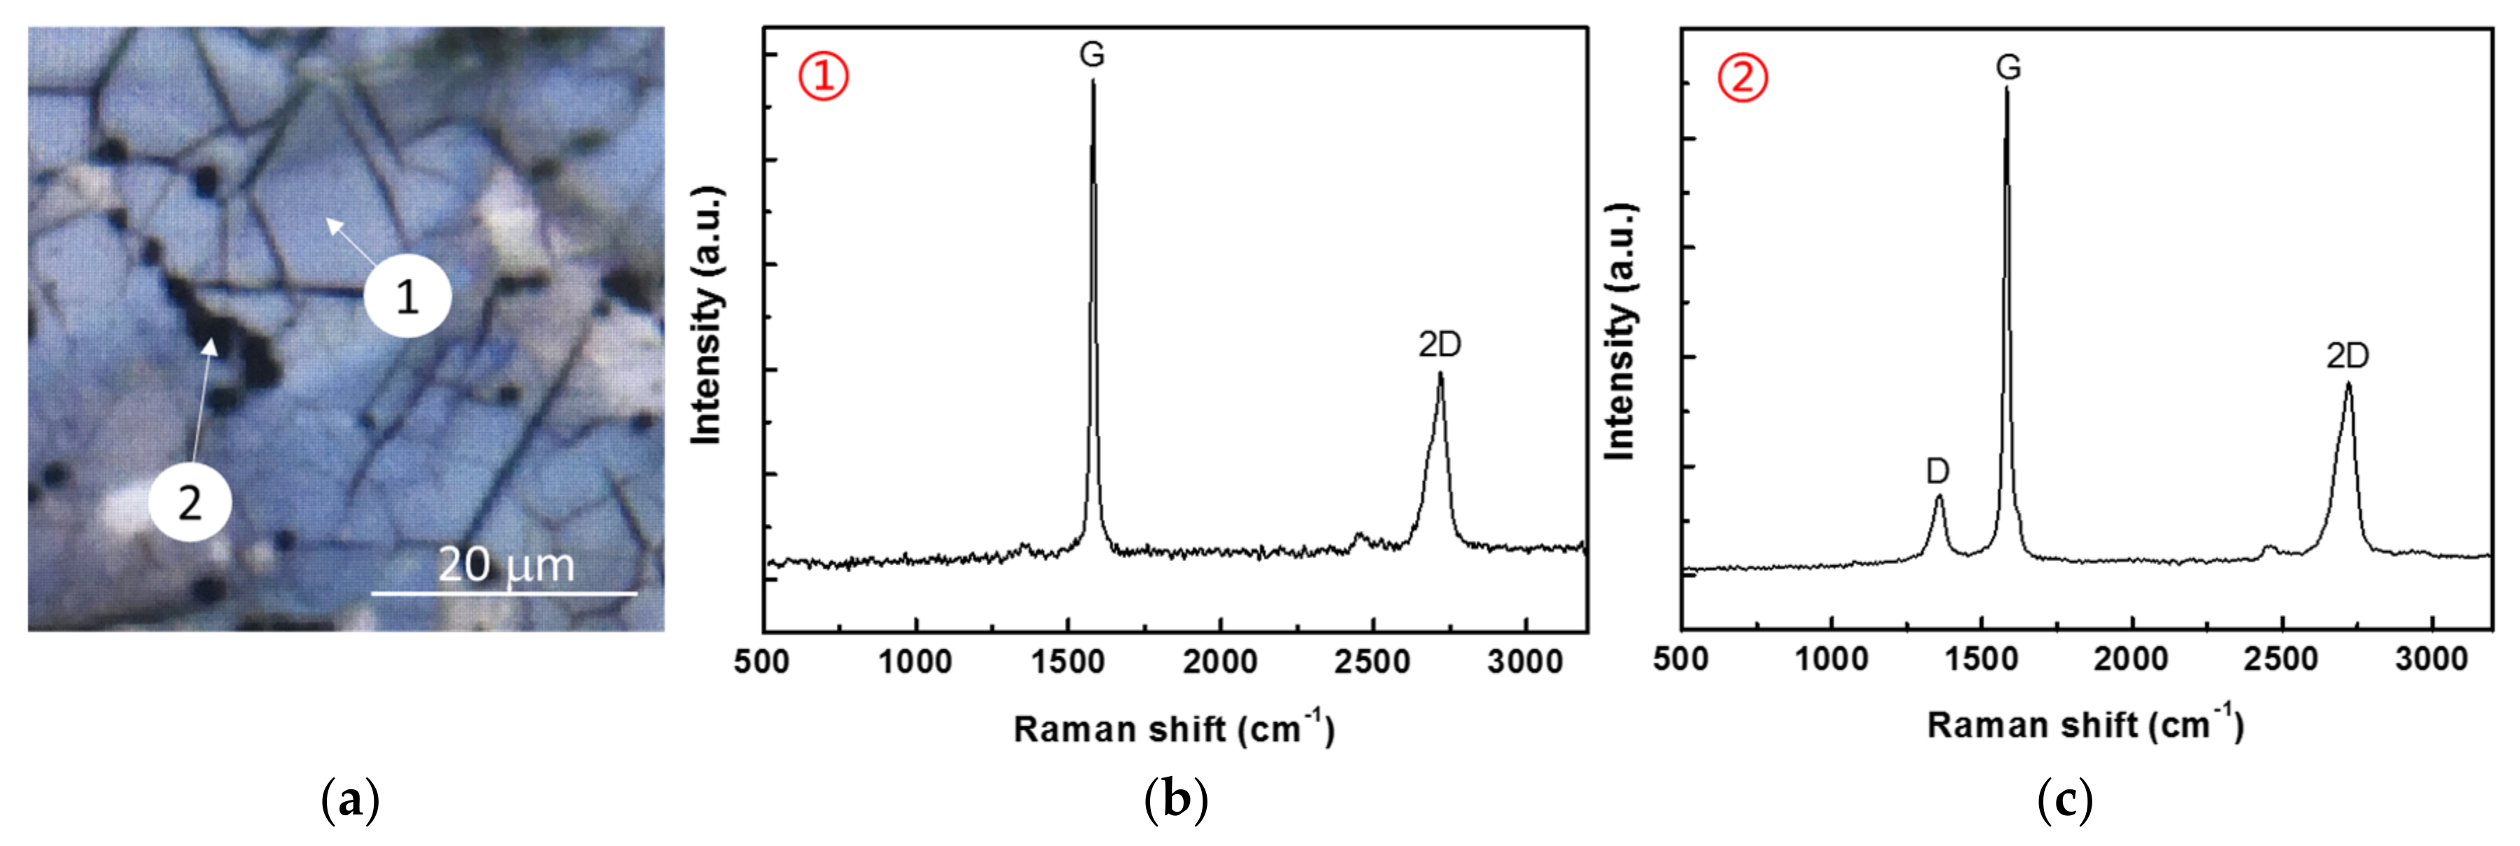
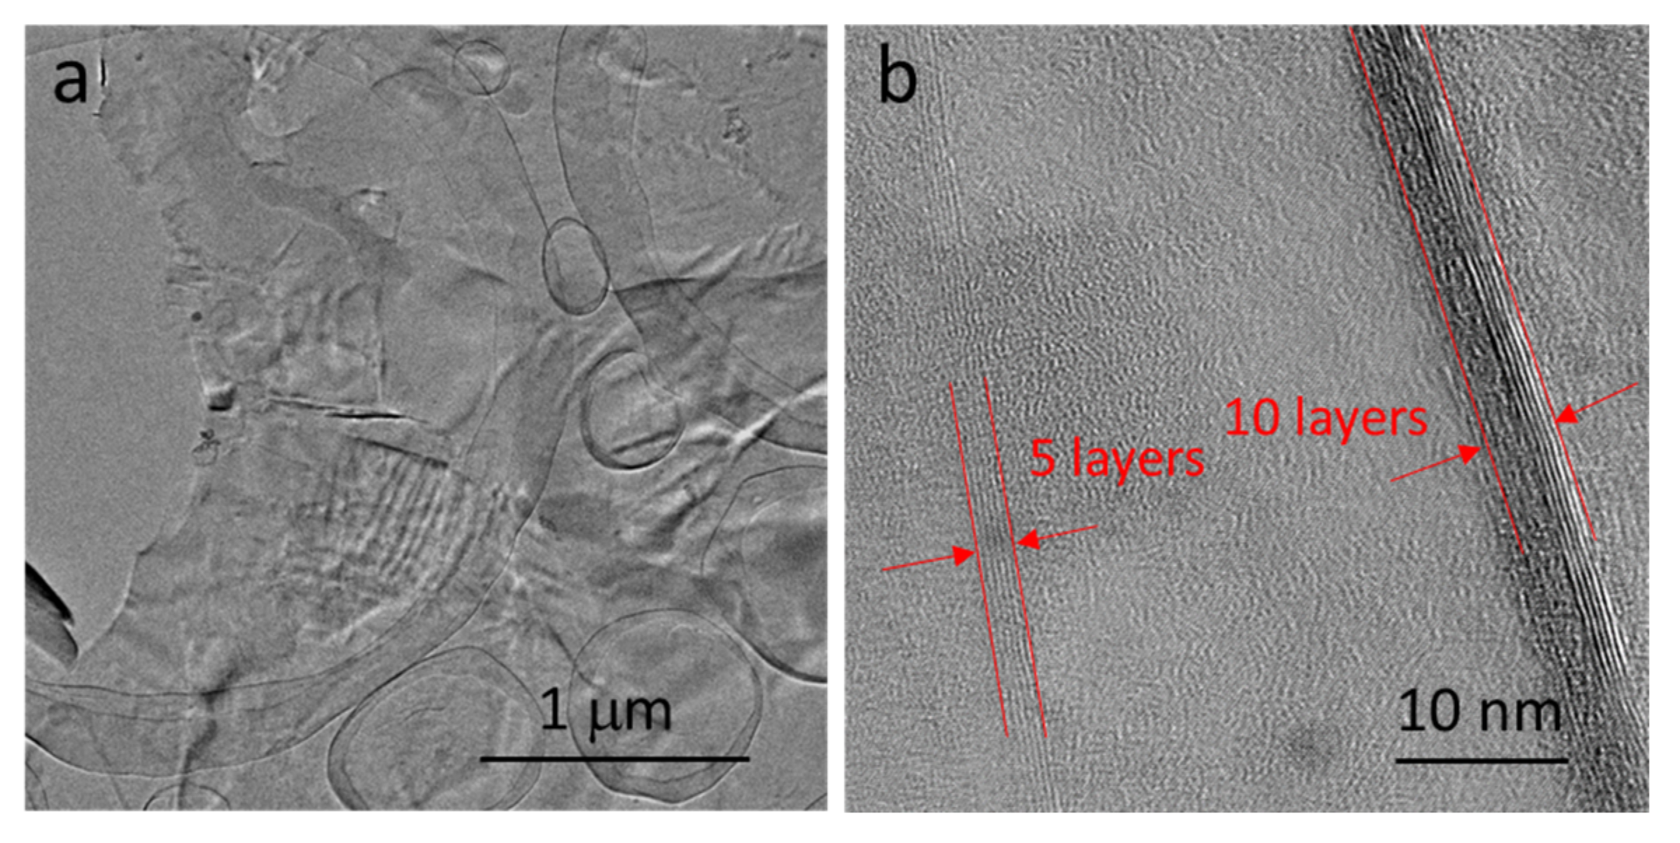
Graphene achieved on the surface of Ni–P–G was multilayered with the number of layers around 5–10, which was determined by the IG/I2D ratio from Raman spectra and the observation of HRTEM. The ID/IG ratio revealed that the graphene at the grain region of Ni–P–H had large grain size, while that at the grain boundary contained slight defects and had smaller grain size because there were more nucleation sites there.
(2)
The corrosion resistance of Ni–P–G is more than two times higher than that of Ni–P and Ni–P–H, displaying a higher Rp around 6.09 × 10⁴ Ω·cm2, a lower CPEdl, and a lower corrosion rate of 0.011 mm/year, which is ascribed to the impermeable and inert ionic barrier of graphene on the surface. Graphene also reduced the corrosion tendency of Ni–P–G by shifting its surface potential.
This research demonstrated the feasibility of growing graphene on the surface of electroless Ni–P coating as a protective, anticorrosive barrier, and the potential to prepare graphene on most metals and alloys indirectly.

Acknowledgments

This research was financially supported by the Key laboratory program of oil and gas field materials (X151517KCL09) and the Innovation program of Sichuan province.

Author Contributions

Qin-Ying Wang and Yu-Chen Xi conceived and designed the experiment, analyzed the data, and wrote the paper. Shuang Liu and Yi-Rong Tang performed the experiment. Jiao Xu and Hao-Ming Fang contributed materials and performed the experiment. Jing Yu and Shu-Lin Bai contributed the writing of the paper.

Conflicts of Interest

The authors declare no conflict of interest.

References

  1. Wang, Q.Y.; Wang, X.Z.; Luo, H.; Luo, J.L. A study on corrosion behaviors of Ni–Cr–Mo laser coating, 316 stainless steel and X70 steel in simulated solutions with H2S and CO2. Surf. Coat. Technol. 2016, 291, 250–257. [Google Scholar] [CrossRef]
  2. Sudagar, J.; Lian, J.; Sha, W. Electroless nickel, alloy, composite and nano coatings—A critical review. J. Alloys Compd. 2013, 571, 183–204. [Google Scholar] [CrossRef] [Green Version]
  3. Choi, W.; Lahiri, I.; Seelaboyina, R.; Kang, Y.S. Synthesis of graphene and its applications: A review. Crit. Rev. Solid State 2010, 35, 52–71. [Google Scholar] [CrossRef]
  4. Ming, H.; Wang, J.; Zhang, Z.; Wang, S.; Han, E.H.; Ke, W. Multilayer graphene: A potential anti-oxidation barrier in simulated primary water. J. Mater. Sci. Technol. 2014, 30, 1084–1087. [Google Scholar] [CrossRef]
  5. Hu, J.; Ji, Y.; Shi, Y.; Hui, F.; Duan, H.; Lanza, M.A. A review on the use of graphene as a protective coating against corrosion. Ann. J. Mater. Sci. Eng. 2014, 1, 16. [Google Scholar]
  6. Raman, R.S.; Banerjee, P.C.; Lobo, D.E.; Gullapalli, H.; Sumandasa, M.; Kumar, A.; Majumder, M. Protecting copper from electrochemical degradation by graphene coating. Carbon 2012, 50, 4040–4045. [Google Scholar] [CrossRef]
  7. Prasai, D.; Tuberquia, J.C.; Harl, R.R.; Jennings, G.K.; Bolotin, K.I. Graphene: Corrosion-inhibiting coating. ACS Nano 2012, 6, 1102–1108. [Google Scholar] [CrossRef] [PubMed]
  8. Stoot, A.C.; Camilli, L.; Spiegelhauer, S.A.; Yu, F.; Bøggild, P. Multilayer graphene for long-term corrosion protection of stainless steel bipolar plates for polymer electrolyte membrane fuel cell. J. Power Sources 2015, 293, 846–851. [Google Scholar] [CrossRef]
  9. Schriver, W.R.M.; Gannett, W.J.; Zaniewski, A.M.; Crommie, M.F.; Zettl, A. Graphene as a long-term metal oxidation barrier: Worse than nothing. ACS Nano 2013, 7, 5763–5768. [Google Scholar] [CrossRef] [PubMed]
  10. Yu, F.; Stoot, A.C.; Bøggild, P.; Camilli, L. Failure of multi-layer graphene coatings in acidic media. RSC Adv. 2016, 6, 21497–21502. [Google Scholar] [CrossRef] [Green Version]
  11. Li, X.; Cai, W.; An, J.; Kim, S.; Nah, J.; Yang, D.; Piner, R.; Velamakanni, A.; Jung, I.; Tutuc, E. Large-area synthesis of high-quality and uniform graphene films on copper foils. Science 2009, 324, 1312–1314. [Google Scholar] [CrossRef] [PubMed]
  12. Chem, A. Evolution of graphene growth on Ni and Cu by carbon isotope labeling. Nano Lett. 2009, 9, 4268–4272. [Google Scholar]
  13. John, R.; Ashokreddy, A.; Vijayan, C.; Pradeep, T. Single- and few-layer graphene growth on stainless steel substrates by direct thermal chemical vapor deposition. Nanotechnology 2011, 22, 165701. [Google Scholar] [CrossRef] [PubMed]
  14. Zhan, N.; Wang, G.; Liu, J. Cobalt-assisted large-area epitaxial graphene growth in thermal cracker enhanced gas source molecular beam epitaxy. Appl. Phys. A 2011, 105, 341–345. [Google Scholar] [CrossRef]
  15. Que, Y.; Xiao, W.; Fei, X.; Chen, H.; Huang, L.; Du, S.X.; Gao, H.J. Epitaxial growth of large-area bilayer graphene on Ru(0001). Appl. Phys. Lett. 2014, 104, 093110. [Google Scholar] [CrossRef]
  16. Liu, M.; Gao, Y.; Zhang, Y.; Zhang, Y.; Ma, D.; Ji, Q.; Gao, T.; Chen, Y.; Liu, Z. Single and polycrystalline graphene on Rh(111) following different growth mechanisms. Small 2013, 9, 1360–1366. [Google Scholar] [CrossRef] [PubMed]
  17. Romani, E.C.; Larrude, D.G.; Nachez, L.; Vilani, C.; de Campos, J.B.; Peripolli, S.B.; Freire, F.L. Graphene grown by chemical vapour deposition on steel substrates: Friction behaviour. Tribol. Lett. 2017, 65, 96. [Google Scholar] [CrossRef]
  18. Liu, Z.D.; Yin, Z.Y.; Du, Z.H.; Yang, Y.; Zhu, M.M.; Xie, L.H.; Huang, W. Low temperature growth of graphene on Cu–Ni alloy nanofibers for stable, flexible electrodes. Nanoscale 2014, 6, 5110–5115. [Google Scholar] [CrossRef] [PubMed]
  19. Zhang, Y.; Fu, Y.; Edwards, M.; Jeppson, K.; Ye, L.; Liu, J. Chemical vapor deposition grown graphene on Cu-Pt alloys. Mater. Lett. 2017, 193, 255–258. [Google Scholar] [CrossRef]
  20. Dai, B.; Fu, L.; Zou, Z.; Wang, M.; Xu, H.; Wang, S.; Liu, Z. Rational design of a binary metal alloy for chemical vapour deposition growth of uniform single-layer graphene. Nat. Commun. 2011, 2, 522. [Google Scholar] [CrossRef] [PubMed]
  21. Wang, Q.Y.; Xi, Y.C.; Xu, J.; Liu, S.; Lin, Y.H.; Zhao, Y.H.; Bai, S.L. Study on properties of double-layered Ni–P–Cr composite coating prepared by the combination of electroless plating and pack cementation. J. Alloys Compd. 2017, 729, 787–795. [Google Scholar] [CrossRef]
  22. Sadeghzadeh-Attar, A.; AyubiKia, G.; Ehteshamzadeh, M. Improvement in tribological behavior of novel sol-enhanced electroless Ni–P-SiO2 nanocomposite coatings. Surf. Coat. Technol. 2016, 307, 837–848. [Google Scholar] [CrossRef]
  23. Chen, C.K.; Feng, H.M.; Lin, H.C.; Hon, M.H. The effect of heat treatment on the microstructure of electroless Ni–P coatings containing SiC particles. Thin Solid Films 2002, 416, 31–37. [Google Scholar] [CrossRef]
  24. Prikhod’ko, N.G.; Lesbaev, B.T.; Auelkhankyzy, M.; Mansurov, Z.A. Synthesis of graphene films in a flame. Rus. J. Phys. Chem. B 2014, 8, 61–64. [Google Scholar] [CrossRef]
  25. Li, Z.; Xu, Y.; Cao, B.; Qi, L.; He, S.; Wang, C.; Zhang, J.; Wang, J.; Xu, K. Raman spectra investigation of the defects of chemical vapor deposited multilayer graphene and modified by oxygen plasma treatment. Superlattice Microstruct. 2016, 99, 125–130. [Google Scholar] [CrossRef]
  26. Terasawa, T.; Saiki, K. Growth of graphene on Cu by plasma enhanced chemical vapor deposition. Carbon 2012, 50, 869–874. [Google Scholar] [CrossRef]
  27. Luo, H.; Dong, C.F.; Li, X.G.; Xiao, K. The electrochemical behaviour of 2205 duplex stainless steel in alkaline solutions with different pH in the presence of chloride. Electrochim. Acta 2012, 64, 211–220. [Google Scholar] [CrossRef]
  28. Ashassi-Sorkhabi, H.; Rafizadeh, S.H. Effect of coating time and heat treatment on structures and corrosion characteristics of electroless Ni–P alloy deposits. Surf. Coat. Technol. 2004, 176, 318–326. [Google Scholar] [CrossRef]
  29. Trabelsi, W.; Triki, E.; Dhouibi, L.; Ferreira, M.G.S.; Zheludkevich, M.L.; Montemor, M.F. The use of pre-treatments based on doped silane solutions for improved corrosion resistance of galvanised steel substrates. Surf. Coat. Technol. 2006, 200, 4240–4250. [Google Scholar] [CrossRef]
  30. Banerjee, P.C.; Raman, R.S. Electrochemical impedance spectroscopic investigation of the role of alkaline pre-treatment in corrosion resistance of a silane coating on magnesium alloy, ZE41. Electrochim. Acta 2011, 56, 3790–3798. [Google Scholar] [CrossRef]
  31. Qian, M.; Li, D.; Liu, S.B.; Gong, S.L. Corrosion performance of laser-remelted Al–Si coating on magnesium alloy AZ91D. Corros. Sci. 2010, 52, 3554–3560. [Google Scholar] [CrossRef]
  32. Wang, H.L.; Fan, H.B.; Zheng, J.S. Corrosion inhibition of mild steel in hydrochloric acid solution by a mercapto-triazole compound. Mater. Chem. Phys. 2003, 77, 655–661. [Google Scholar] [CrossRef]
Figure 1. SEM images of Ni–P (a), Ni–P–H (b), Ni–P–G (c), and enlarged view of Ni–P–G (d).
Coatings 08 00130 g001
Figure 2. Metallomicroscope image (a) of Ni–P–G with corresponding Raman spectra of regions ① (b) and ② (c).
Coatings 08 00130 g002
Figure 3. High-resolution transmission electron microscope (HRTEM) images of the graphene film on the surface of Ni–P–G: (a) enlarged view; (b) edges of the graphene film.
Coatings 08 00130 g003
Figure 4. Nyquist plots of the Q235 steel, Ni–P, Ni–P–H, and Ni–P–G at the immersion time of 2 h in 3.5 wt % NaCl solution (a) and the equivalent circuits for the Q235 steel (b) and the three type of coatings (c).
Coatings 08 00130 g004
Figure 5. Bode plots of the Q235 steel, Ni–P, Ni–P–H, and Ni–P–G at the immersion time of 2 h in 3.5 wt % NaCl solution: (a) frequency-impedance magnitude curves; (b) frequency-phase angle curves.
Coatings 08 00130 g005
Figure 6. Potentiodynamic polarization curves of the Q235 steel, Ni–P, Ni–P–H, and Ni–P–G in 3.5 wt % NaCl solution.
Coatings 08 00130 g006
Figure 7. Scanning Kelvin probe (SKP) surface potential maps of Ni–P (a) and Ni–P–G (b) in an area of 2 mm × 4 mm exposed to humidity.
Coatings 08 00130 g007
Table 1. Parameters of equivalent circuits in Figure 4b,c.
SampleRs (Ω·cm2)CPEfRf (Ω·cm2)CPEdlRct (Ω·cm2)Rp (Ω·cm2)
Y0−1·cm−2·sn)nY0−1·cm−2·sn)n
Q2355.9---1.14 × 10−30.791.51 × 1031.51 × 103
Ni–P5.42.4 × 10−50.961.66 × 1044.97 × 10−50.481.58 × 1043.24 × 104
Ni–P–H6.51.73 × 10−50.932.27 × 1042.55 × 10−40.834.32 × 1032.70 × 104
Ni–P–G5.91.01 × 10−50.9612.331.78 × 10−50.846.09 × 1046.09 × 104
Table 2. Parameters achieved from potentiodynamic curves and calculated corrosion rates of the specimens.
SamplesQ235 SteelNi–PNi–P–HNi–P–G
Average atomic mass (g/mol)56.089.789.789.7
Icorr (A/cm2)5.30 × 10−53.46 × 10−63.38 × 10−69.77 × 10−7
Corrosion rate (mm/year)0.3810.0390.0400.011
η (%)97.172.5-

