Texture Analysis of Hydrophobic Polycarbonate and Polydimethylsiloxane Surfaces via Persistent Homology


1
Department of Mathematics and Statistics, King Fahd University of Petroleum and Minerals, Dhahran 31261, Saudi Arabia
2
Department of Mechanical Engineering, King Fahd University of Petroleum and Minerals, Dhahran 31261, Saudi Arabia
3
Department of Systems Engineering, King Fahd University of Petroleum and Minerals, Dhahran 31261, Saudi Arabia
*
Author to whom correspondence should be addressed.
Coatings 2017, 7(9), 139; https://doi.org/10.3390/coatings7090139
Submission received: 1 June 2017
/
Revised: 15 August 2017
/
Accepted: 28 August 2017
/
Published: 3 September 2017
Abstract
:Due to recent climate change-triggered, regular dust storms in the Middle East, dust mitigation has become the critical issue for solar energy harvesting devices. One of the methods to minimize and prevent dust adhesion and create self-cleaning abilities is to generate hydrophobic characteristics on surfaces. The purpose of this study is to explore the topological features of hydrophobic surfaces. We use non-standard techniques from topological data analysis to extract morphological features from the AFM images. Our method recovers most of the previous qualitative observations in a robust and quantitative way. Persistence diagrams, which is a summary of topological structures, witness quantitatively that the crystallized polycarbonate (PC) surface possesses spherulites, voids, and fibrils, and the texture height and spherulite concentration increases with the increased immersion period. The approach also shows that the polydimethylsiloxane (PDMS) exactly copied the structures at the PC surface but 80 to 90 percent of the nanofibrils were not copied at PDMS surface. We next extract a feature vector from each persistence diagram to show which experiments hold features with similar variance using principal component analysis (PCA). The K-means clustering algorithm is applied to the matrix of feature vectors to support the PCA result, grouping experiments with similar features.
1. Introduction
Micro/nano scale texturing of surfaces is critical for self-cleaning applications, particularly for those surfaces used in solar energy harvesting devices. Increasing frequency of dust storms in the Middle East, because of climate change, causes dust settlements on optically transparent surfaces while significantly reducing the performance of solar energy harvesting devices, such as photovoltaic panels [1]. Environmental dust settlement on surfaces becomes a detrimental problem in humid, ambient air because of mud formation due to water condensate on dust particles. The mud formed at the surfaces enhances adhesion between dust particles and the surface [2], which in turn requires significant efforts to remove from the surface [2]. One of the solutions to reduce the adhesion of dust particles on surfaces is to create hierarchical micro/nano size pillars at the surface [3]. This arrangement provides hydrophobic surface characteristics through reducing the contact line between the surfaces and residing particles. The one step process of surface texturing on optically transparent substrates is demanding because of the requirement of low-cost operation and fast processing. On the other hand, polycarbonate (PC) sheets are one of the most promising transparent wafers to be utilized as a protective cover for photovoltaic panels. This is mainly because of its low density, high fracture toughness, and mechanical flexibility. Solvent induced crystallization of polycarbonate surfaces is one of the promising techniques to generate surface texture comprising of micro/nano pillars [4]. Depending on the solvent concentration, process temperature, and crystallization duration, surface textures of different hierarchical structures can be formed [5]. In some circumstances, optical transmittance of the crystallized polycarbonate wafer is lowered because of scattering and the diffusive reflection of the textured surface [2]. Polydimethylsiloxane (PDMS) copying and replicating of textured surfaces can overcome this shortcomings [6]. However, identification of surface texture topology is critical to meet the required hierarchical texture at the surface. Consequently, topological examination of the textured surfaces becomes crucial to identify the texture characteristics influencing the surface hydrophobicity.
Considerable research studies were carried out to examine hydrophobic characteristics of surfaces pertinent to solar energy applications. Surface topology of transparent hydrophobic coatings applied to solar cell covering glass towards self-cleaning applications was studied by Quan et al. [7]. They demonstrated that the low surface energy and topology composing of rough structures of coatings worked together to improve surface hydrophobicity and lower the adhesion forces between the particles and surfaces. Surface treatment of polymeric solar cells with poly(3,4-ethylenedioxythiophene):poly(styrenesulfonate) (PEDOT:PSS) buffer layer with co-solvents of hydrophilic organic solvents and hydrophobic 1,2-dichlorobenzene was investigated by Sun et al. [8]. They showed that the cosolvent treatment of the PEDOT:PSS buffer layer could remarkably improve the photovoltaic efficiency of polymer solar cells. The treatment of the PEDOT:PSS buffer layer with a cosolvent of methanol and hydrophobic 1,2-dichlorobenzene improved the photovoltaic efficiency of polymer solar cells based on poly(3-hexylthiophene) (P3HT) and phenyl-C61-butyric acid methyl ester (PCE) . The PCE improvement was attributed to the high conductivity and high surface area of the cosolvent-treated PEDOT:PSS buffer layer. A critical review of superhydrophobic surfaces with antireflection properties for solar applications was presented by Mehmood et al. [9]. They indicated that a normal solar panel absorbs only about 25 percent of the incident solar radiation, the remainder being reflected. Therefore, the design and implementation of transparent super hydrophobic surfaces that repel atmospheric dust from solar panels, and thus reduce reflectivity of the surfaces, were highly desirable. Self-cleaning glazing products towards solar photovoltaic applications were examined by Midtdal and Jelle [10]. They demonstrated that the self-cleaning action of hydrophobic-coated products was limited by a relatively short life expectancy of about three to four years, and their self-cleaning performance was found to be feeble compared to ordinary untreated float glass. Nonetheless, the potential for future use of both self-cleaning technologies were apparent, with the focus on alternative application areas such as solar cells, building integrated photovoltaic panels, and information display devices, which indeed could benefit from utilizing the self-cleaning technology. On the other hand, surface texturing and grafting become important to achieve a surface topology with hydrophobic characteristics. A study on the repeated grafting-casting processes via regulating the surface topologies of polydimethylsiloxane (PDMS) was carried out by Zhou et al. [11]. They indicated that, based on the suspended droplet drying method, the inter-gaps among particles could be well optimized on the rougher substrate than on flat PDMS surface. The roughness and topology of ultra-hydrophobic surfaces were examined by Kijlstra et al. [12]. They showed that the topological nature of the surface roughness was critical for hydrophobic characteristics of surfaces and it had a major influence on the water repellency from surfaces. Yan et al. [13] studied model surfaces with orderly arranged nano- and micro-spheres in a closely packed structure for a quantitative understanding of the effect of surface topography on surface hydrophobicity. The precise control of surface micro-topology via laser beam ablation was investigated by Obeidi et al. [14]. They demonstrated that the resulting modified surfaces contained texture geometries with pre-definable peak-to-peak widths, valley-to-peak heights, and texture directions. The precise control of the laser textured surfaces and texture patterns were key factors in determining the potential suitability of textured surfaces for various applications. Structural and hydrophobic–hydrophilic properties of nanosilica/zirconia were studied by Sulym et al. [15]. They showed that the surface topology of the particles was important for the hydrophobic state of the surface and nanosilica/zirconia modified by polydimethylsiloxane (PDMS) remained in the powder state with aggregates of primary particles smaller than those of unmodified PDMS surfaces. A study on controlling of surface topology towards enhancing the hydrophobicity of amorphous carbon thin films was examined by Banerjee et al. [16]. The findings revealed that with the decrease of the polar component of the surface energy, the surface gradually became hydrophobic. The contact angle was independent of the pH of water from extremely acidic to extremely basic.
Although hydrophobicity of the crystallized polycarbonate surfaces was examined previously [2,5], the study was limited to texture characteristics and optical transmittance of the resulting surface. The correlation between the surface topology and the water droplet contact angle was left for a future study. Surface topology, comprising of micro/nano size pillars, fibrils, and spherules, is important for the assessment of the wetting state of the surface. The distribution of the texture features, in terms of height, width, and pitches on the surface, is critical for identifying the surface hydrophobicity in terms of droplet contact angle. One of the methods to identify the texture topology is to introduce persistence diagrams (PD) summarizing the topological structures quantitatively and correlating the contact angle of the droplet with the quantitative values of the texture features. Consequently, in the present study, the surface topology of PC and PDMS replicated crystallized polycarbonate wafers is examined. The texture of replicated PDMS surfaces is assessed using atomic force microscopes (AFM). The persistence diagrams are introduced to assess quantitatively the topological features of PC and PDMS replicated surfaces, in terms of size and concentration of micro/nano size spherulites, voids, and fibrils formed on the surfaces.
The main topological tool that we are using is persistent homology, which tracks how topological features appear and disappear in a nested sequence of topological spaces. Persistent homology is a new tool for studying shape in application areas such as digital images [17,18], dynamical systems [19], and high-dimensional data-mining [20]. There are two main strengths of our approach:
- It represents surfaces based on their topology making it invariant to small changes in shapes and hence robust to noise;
- It determines a range of coarse to fine scales of topological changes, thereby, summarizing large and small scale objects. In our case, it enables us to demonstrate micro and nanostructures of the surface in the same statistical summary without a need of thresholding or smoothing algorithms.
A wealth of geometric information can be extracted from a surface by the approach providing a more holistic analysis than the information from standard invariants such as surface roughness and gas-liquid area fraction.
The persistent homological framework enables us to analyze complex and high dimensional data in a consistent manner [21,22,23]. It is robust to perturbations, independent of dimensions and scale, and provides a compact representation of the outputs. It lets us construct informative summaries of the shape of data. It can be applied to analyze both 2D and 3D images.The output of the persistent homology can be summarized visually using a persistence diagram, which is a collection of points in the plane where each point characterizes a topological feature (e.g., hills, pores, cavities, etc.) that appears at height x and disappears at height y. We say the feature has a persistence value (or life-span) of . The features with low persistence can be considered as noise.
Application of persistent homology to digital image analysis was studied previously. Bendich et al. [17] investigated the robustness of homology classes in level and interlevel sets of functions and apply these tools to study 3-dimensional images of plant root systems. They showed that estimated standard deviations of the errors indicate the robustness and classification results. Zeppelzauer et al. [24] investigated different topological descriptors and measured their ability to discriminate structurally different 3D surface patches. The study revealed that topological descriptors are (i) robust, (ii) yield state-of-the-art performance for the task of 3D surface analysis, and (iii) improve classification performance when combined with non-topological descriptors. Mander et al. [25] developed topological methods and algorithms based on persistent homology to quantify the surface ornamentation and texture using interpretable features. Yamamoto [26] proposed a technique that connects persistent homology with the roughness of a surface.
In this work, we first calculate persistence diagrams (PD) of AFM images of hydrophobic surfaces with different contact angles. We use the experimental data that was previously analyzed in [6] using standard methods. We recover most of the previous qualitative observations in [6] from PD’s in a robust and quantitative way. Persistence diagrams, which is a summary of topological structures, witnesses quantitatively that (i) the crystallized PC surface possesses microlevel/nanolevel spherulites, voids, and fibrils, and (ii) the texture height and spherulite concentration increases with the increased immersion period. The approach also shows that the PDMS exactly copied the microlevel structures at the PC surface but 80 to 90 percent of the nanofibrils were not copied at PDMS surface. Persistence diagrams provide different geometric insight to the hydrophobic surfaces. We next adopt Bendich’s approach [27] to obtain feature vectors for each PD. The matrix of feature vectors is utilized in PCA and the K-means algorithm is employed to cluster similar experiments in terms of feature vectors. The results indicate that the contact angle might be the determining factor of topological structures within a specified interval on crystallized PC surfaces and PDMS surfaces.
2. Methods
2.1. Theoretical Background
Topology ideally aims to find the homoemorphism type of a topological space. Roughly speaking, we would like to classify the spaces up to stretching and bending but not tearing and gluing. However, in most cases, it is very hard to get the homoemorphism type of a space. Hence, we need to consider other invariants such as homotopy, homology, cohomology, etc.
We now give the basic idea behind the persistent homology, which is the main mathematical tool that we use in our analysis. One can refer to the survey articles [21,22,23,28] for more detailed discussions on persistent homology.
In our context, homology can be considered as an algebraic object that detects certain features of a topological space, such as connected components, loops, and voids. For example, zero dimensional homology counts the number of connected components; one dimensional homology counts the number of loops. Persistent homology, on the other hand, tracks the changes in topological features of the nested sequence of spaces.
Considering AFM images using the height function , persistent homology describes the topological changes of the sub-level complexes , where m is the minimum value of f. One then gets the birth and death times of the homological features of each dimension as t increases from m to M, where M is the maximum value of f. The birth time is the value of t when a feature starts to exist, while the death time indicates the value when a feature disappears, (i.e., it becomes trivial or merges with another feature whose birth time is less.) The persistence (or lifespan) of a feature is the difference between its death and birth time. The features with large persistence provide the most important information about the topology of the surface while the features with short persistence are, most of the time, considered as noise. In our particular setting, zero and one dimensional persistent homology detects the valleys and the hills of the surface, respectively. One can also make the same analysis for the super-level sets , in a similar way.
The persistence intervals correspond with finite subsets of {}, where a and b are the birth and the death time, respectively. This set can visually be represented as a collection of points of the first quadrant of the coordinate plane. This visual representation is called the persistence diagram. With the help of the persistence diagram, one can identify the significant homological features, which are located far from the main diagonal, and filter the noisy features, which can be found near to the main diagonal.
In other words, the persistence diagram contains geometric information of horizontal cross sections of the surface at different heights. A horizontal cross section at a certain height corresponds to a set of contours or “islands”. The power-law distribution of island sizes known as Korcak’s law, and the scaling relation between the area and the perimeter of each island can provide useful information about the surface [29]. While the horizontal cross sections at a certain height can be used to characterize the surface via these scaling relations [26], the arbitrariness of various height choices and the lack of a systematic approach to view the surface at different heights remain as the main difficulties. Persistent homology addresses the difficulties by tracking the changes in the shape of horizontal cross sections against different heights.
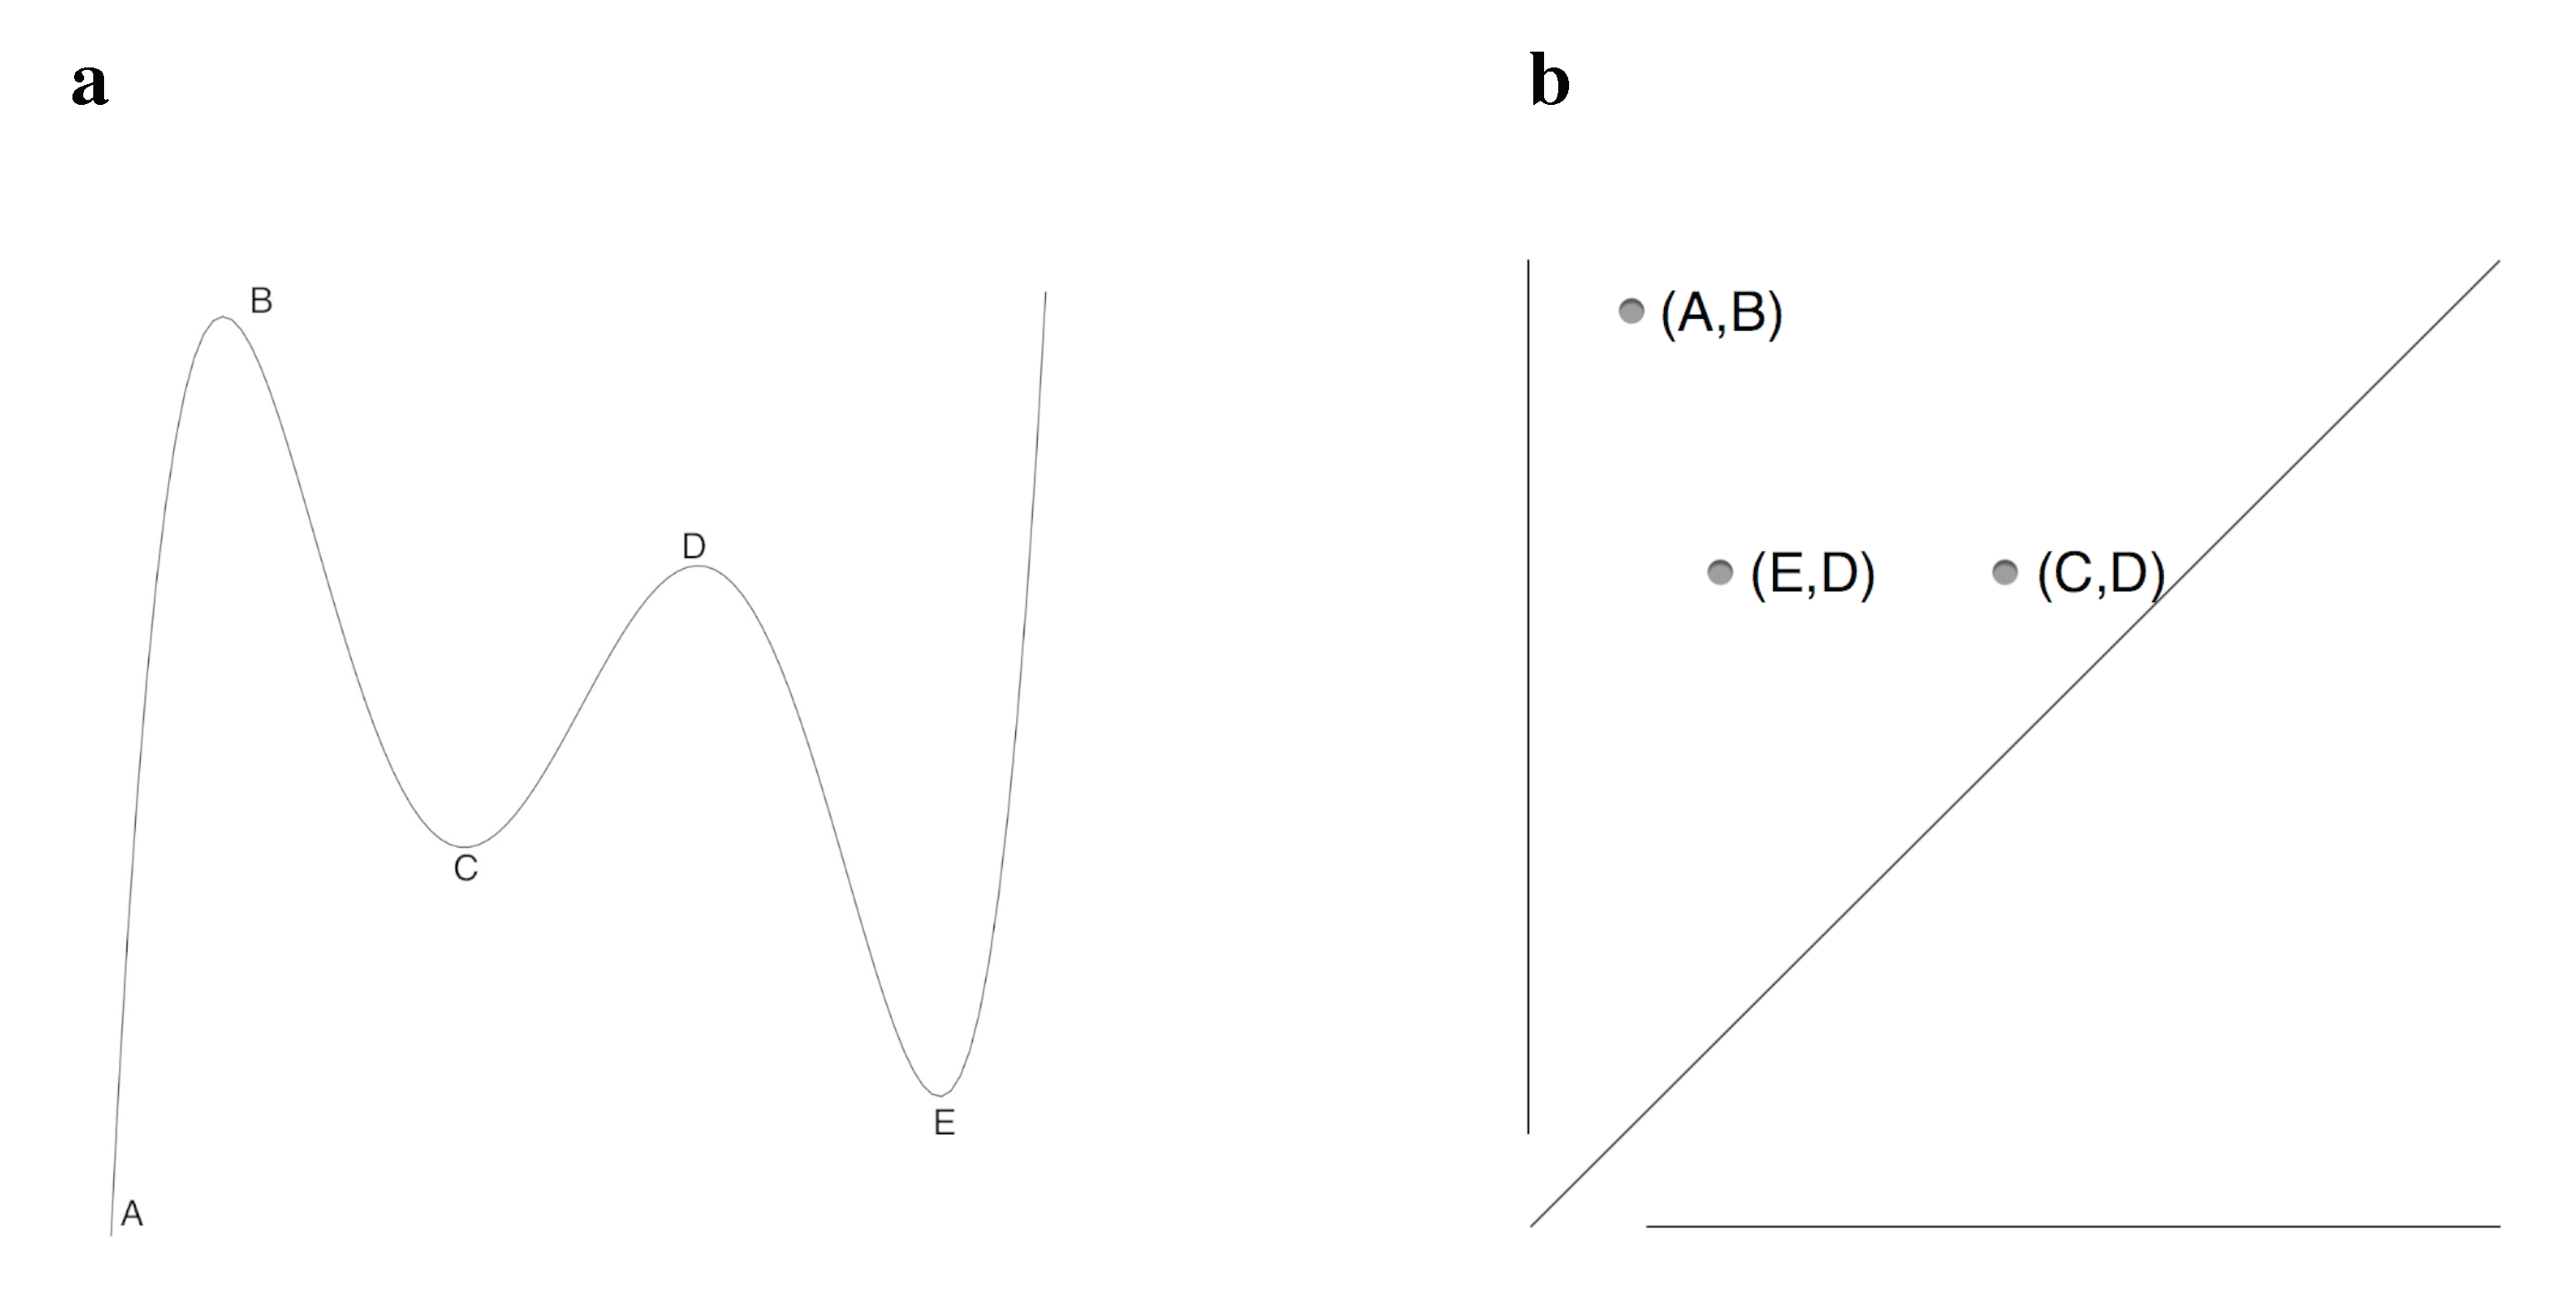
Figure 1 illustrates our method for a one-dimensional surface. We can consider the surface as a landscape with a varying water level as an intuitive example. When the water level is low, there is only one island. While the level increases new islands start to form and each island size gets smaller. An island disappears once it is completely under water. The persistence diagram on the right of the figure marks the coordinate pairs which represent the birth and death height of each island.
It is now worth to mention the relation between persistent homology and surface roughness due to Yamamoto [26]. The lifespan of the islands is defined as the difference between death and birth height. The lifespan distribution reveals power law behaviour. Indeed, the number , which is the number of islands whose life span is larger than z, exhibits a power law behaviour , and
where is the surface roughness. This relation between and implies that the persistence diagrams captures the scaling structure of rough surfaces.
Machine learning techniques can be applied to topological persistency in several ways. The different approaches include the notion of persistent landscape introduced by Bubenik [30], a vector representation of persistence diagram due to Carriere et al. [20], persistent images by Adams et al. [31]. In this paper, we use the feature vectors approach of Bendich [27] by superimposing a grid over persistence diagrams and counting the number of topological features in each bin. The main advantage of this approach is that the output maintains a more interpretable connection to the original data set than some other techniques.
Bendich’s approach [27] introduces the uniform tilings of the plane to “bin” the persistence pairs to obtain sparsely-structured feature vectors. For this reason, one needs to project the persistence diagrams onto Euclidean plane. Hence, the persistence diagram is transformed to as in Figure 2.
This transformation just aligns the persistence diagram so that rectangular tilings of the upper-half plane is compatible with the natural constraints of the diagram. The next step is to partition the rectangle that contains all the points of . Let and be the partitions of and , respectively. These two partitions give us a partition of the rectangle that contains . Finally, we define a bin matrix M whose -th entry is the number of elements of in the rectangle , i.e., . The size of the rectangles can be learned and optimized to capture necessary clarity as there is no standard way of construction. The matrix M is composed of the feature vectors that we are going to use in PCA and K-means clustering.
2.2. Experimental
Polycarbonate (PC) wafers of 3 mm thickness were used as work pieces. PC wafer was derived from A PBA (p-hydroxypheyl) and had excellent optical clarity with high toughness. PC wafer surface could be textured through crystallization in an acetone solution. In this case, PC wafers were first ultrasonic cleaned and later they were immersed into liquid acetone for 2, 4, 6, 8, and 10 min durations at ambient temperature (298 K). The selection of the immersion durations was based on the texture height and texture spacing, which were composed of micro/nano size fibrils and spherulites, while resulting in hierarchical texture patterns at the crystallized surface. Since the crystallized PC surface had low optical transmittance [2,5], the surface texture of the crystallized PC was replicated by using liquid polydimethylsiloxane (PDMS), which belongs to a group of polymeric organosilicon compounds. PDMS has high optical transmittance and optical dispersion of the textured surface had no significant effect on the transmittance of replicated PDMS [2]. Liquid PDMS was deposited onto the crystallized PC surface and left for curing over 18 h. Solidified PDMS was then removed from crystallized PC surface after the curing period.
The topological characteristics of the crystallized PC and replicated PDMS surfaces were carried out incorporating atomic force microscopes (AFM). In this case, Jeol 6460 electron microscopy(JEOL, Peabody-MA, USA) was used for AFM, by Agilent, in contact mode, was used to analyze the surface texture. The tip was made of silicon nitride probes (r = 20–60 nm) with a manufacturer specified force constant, k, of 0.12 N/m.
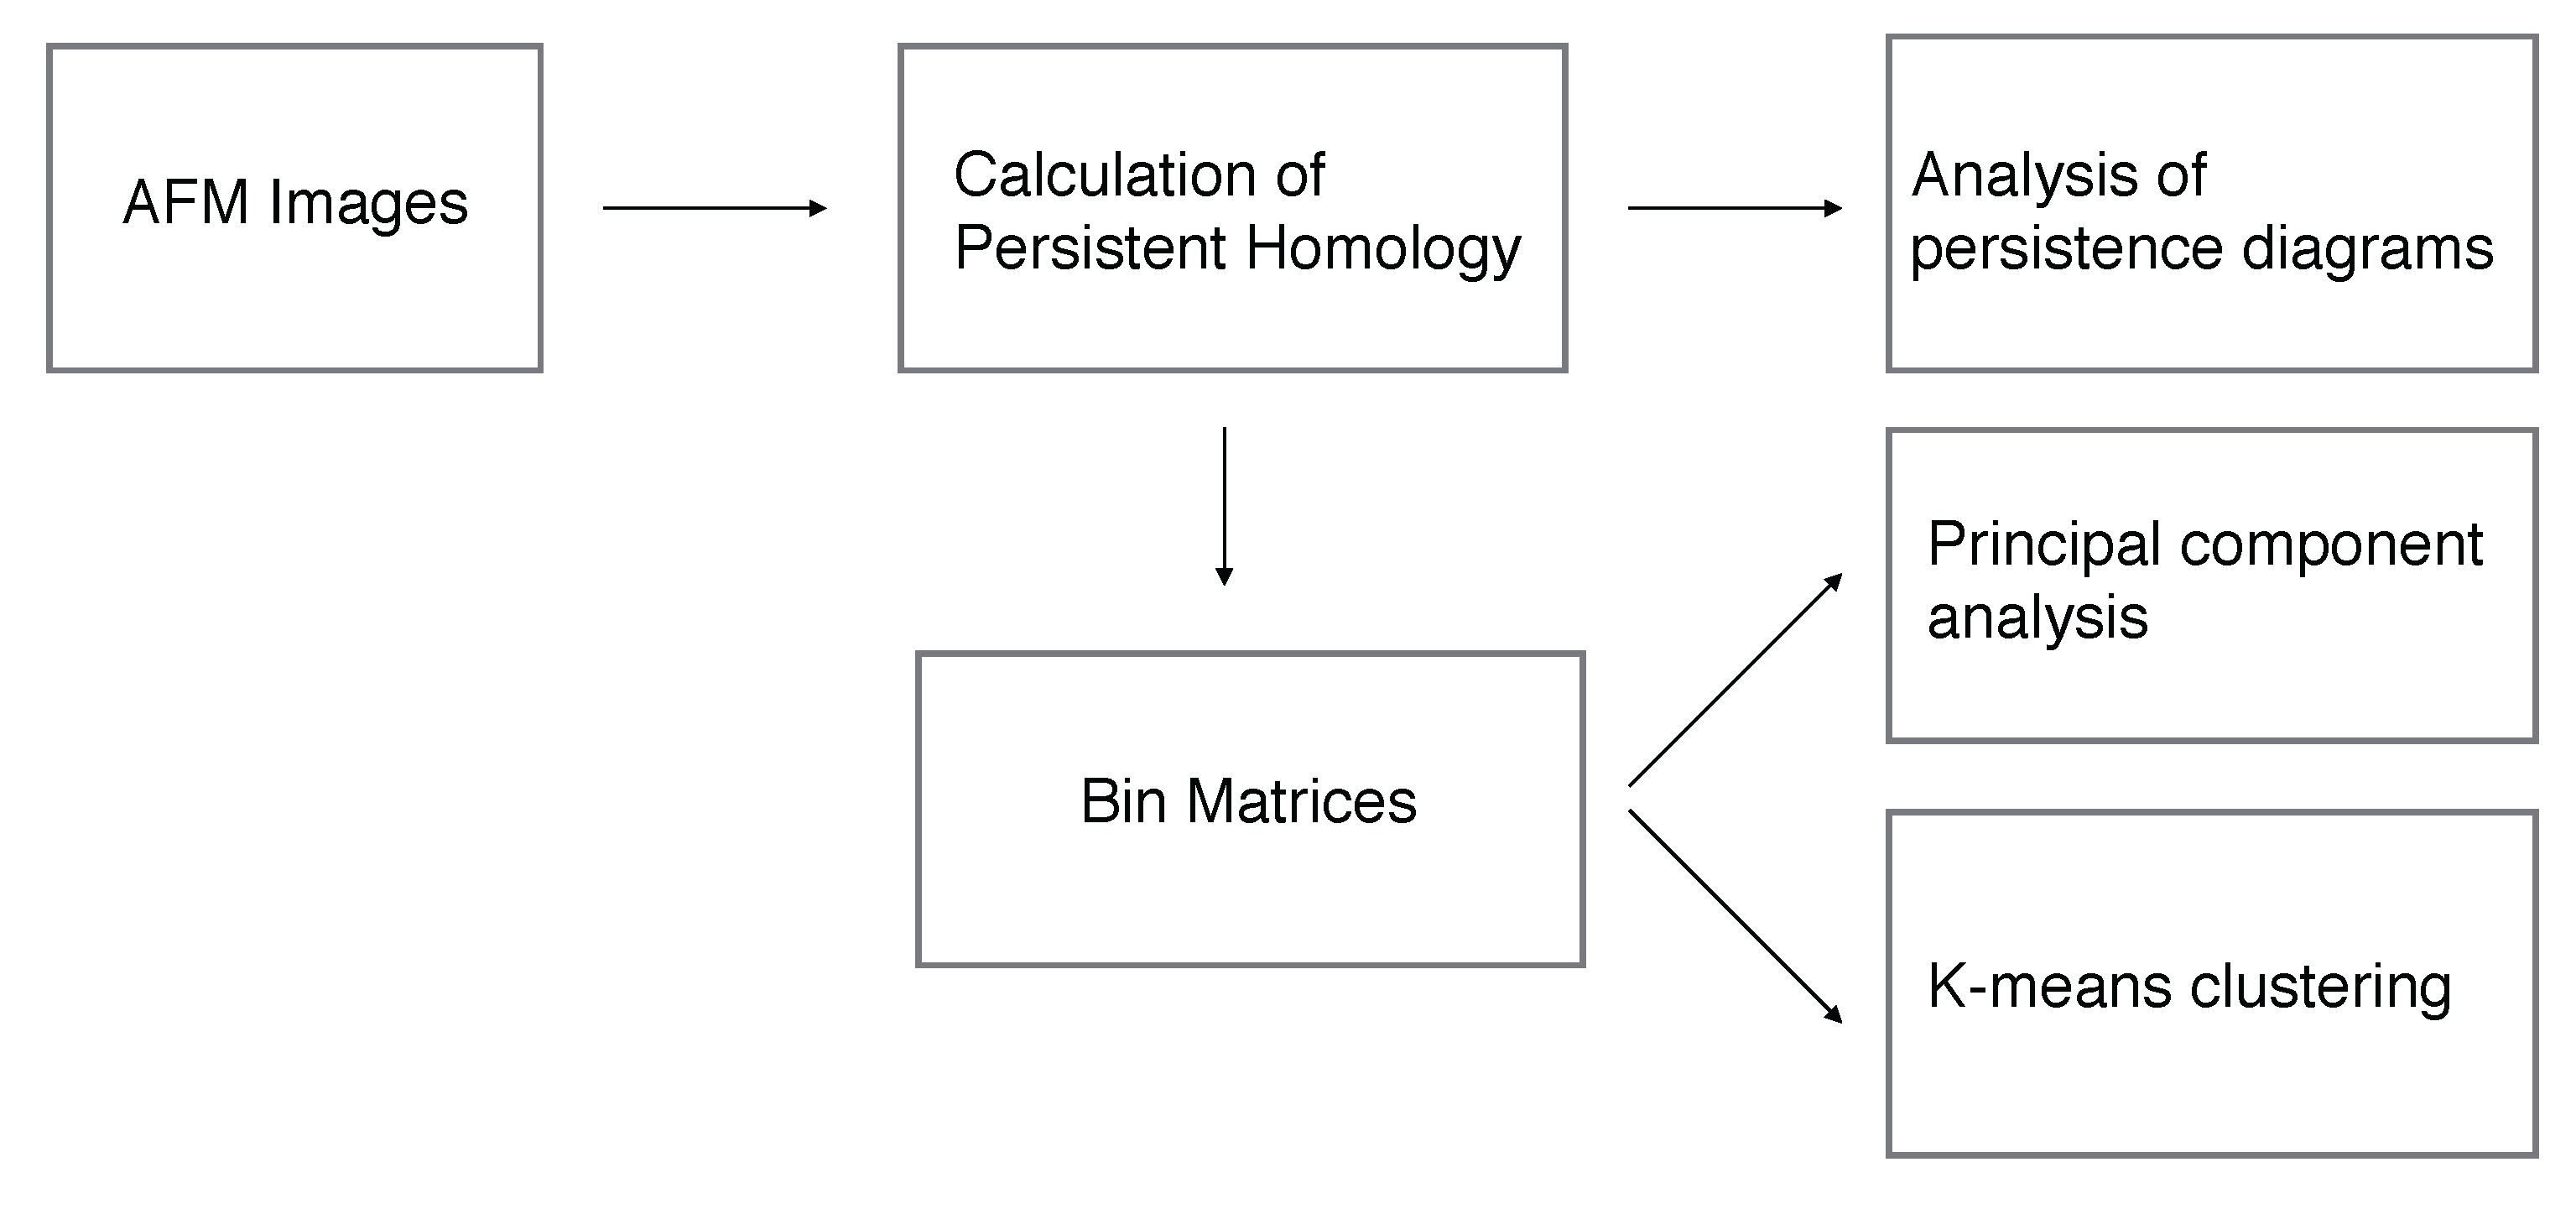
The workflow is illustrated in Figure 3.
3. Results and Discussion
In this section, we robustly confirm the qualitative observations in [6]. We also extract more geometric information from the examined surfaces. Table 1 presents the distribution of the contact angle and the corresponding images of droplets captured from the sessile contact angle tests for the crystallized PC and copied PDMS surfaces [6]. The main parameters influencing the liquid drop contact angle were the surface free energy of the substrate material and the surface texture. We next investigate the surface texture using persistent homology. The surface hydrophobicity was improved for the crystallized PC, and the maximum contact angle achieved was on the order of 152, which corresponded to 6 min of immersion. The PDMS copying of the crystallized surface texture resulted in a higher contact angle than those of the crystallized PC surfaces. This was attributed to the low surface energy of PDMS, even though nanosize and sub-nanosize fibrils were not copied by PDMS.
We now examine the morphology of crystallized PC surfaces and copied textures on PDMS using topological data analysis tools. AFM is used to assess the texture characteristics of the surfaces. Each AFM image gives us a height function over a grid. We next compute the persistence diagram of sublevel sets (and superlevel sets) of the height function over the grid of points in order to determine the persistent topological features (connected components and loops). As the grid is two dimensional, only zero- and one-dimensional diagrams are calculated. In 50 m × 50 m AFM images, zero-dimensional features in the persistence diagram of the sublevel sets correspond to the persistency of the valleys in the surface texture, while one-dimensional features correspond to the hills. The persistent homology is computed using R TDA package [32].
Figure 4 shows 50 m × 50 m AFM images of the 2 min and 6 min of immersion of PC and the corresponding persistence diagrams. The number of black dots (zero-dimensional pairs) and red triangles (one-dimensional pairs) that are far from the diagonal is higher in the diagram of the 2 min immersion than the 6 min immersion. This result, with the increasing average height of the persistent features (see Table 2), suggests the aggregation of the micro structures with increased immersion time. The birth heights of the micro-level hills in 6 min immersion sample are concentrated between 4 and 6 m while for the 2 min immersion sample, the birth heights are between 2 and 6 m. Hence, the tips of the micro-level hills in the 6 min immersion have similar elevation, unlike the 2 min immersion case. This observation suggests that even the distribution of the maximum heights of the hills increase hydrophobicity. The dots and triangles close to the main diagonal represent the nano-level structures. As their birth height are scattered along the diagonal, we conclude from the diagram that there is no well-defined hierarchical structure at the surface. In particular, the existence of pores and cavities that cause micro and nano level waviness on the surface is deduced from the black dots in the diagram.
We now extract some statistical information about the morphology of the surface from the persistence diagrams. The number of one-dimensional persistent pairs that are far from the diagonal will give us the number of spherulite-like structures. A simple count, that ignores the structures whose height is less than 1 m, shows a significant decrease in the number of hills and valleys on the surface with the increase of immersion time. This agrees with the fact that the micro-structures aggregated to cover larger areas at the surface (see Table 1). In other words, the spherulites corresponding to hills in the AFM image are clustered and/or closely spaced with the increase of immersion time. This fact was also noticed in the SEM images in [6]. Moreover, the zero-dimensional pairs in the persistence diagram witness the presence of small-size cavities and pores, which results in microlevel waviness at the surface. This shows the correlation between the number of pores and spherulite-like structures. Hence, our findings quantitatively supports the earlier qualitative observations in [6].
Table 2 implies that higher immersion time increases the roughness of the crystallized PC surface. The relation between the roughness and persistence diagram is given as , and
Here is the surface roughness and is the number of hills whose height is larger than z. Hence, a decrease in the number in Table 1 reveals the increase in the roughness. This observation is in accordance with the experimental results in [6].
Table 3 shows that the average height of microlevel structures increases with increasing immersion time. The average is calculated using the heights of the structures that are greater than 1 m. The height of crystallization on the surface ranges from 1.9 to 2.7 m. This implies that the crystallization occurred in the surface region. Although this result was also observed in [6] by viewing a finite number of texture profiles, the persistence diagram confirms it by looking at the entire surface. This increases the robustness of the previous observation.
As shown in Figure 4 and Figure 5, the persistent pairs in the persistence diagrams indicate that there is no regular pattern at the surface that might have been the result of the non-uniform evaporation of acetone across the entire surface. The birth time of the topological structures demonstrates that there is no specific height where the spherulites and pores start to appear. Nanostructures are witnessed by the short-life persistent pairs that are close to the diagonal. The high number of such short-life pairs are formed by the ripples/waviness in the texture as the surface texture possesses nanofibrils. The short-life pairs whose death time are close to the long-life ones (i.e., spherulites) are due to the hierarchical structure initiated from the spherulites. The short-life pairs all over the diagonal indicate that the nanofibrils cover almost the entire surface.
Figure 6 shows the persistence diagrams of the crystallized PC surface with 4 min of immersion time and copied surface by PDMS. The similar location of the highly persistent zero and one dimensional pairs is quantitative evidence that the PDMS surface has almost the same texture as the copied PC surface. As results of the copying procedure, the zero-dimensional (one-dimensional) features in the persistence diagram of the PDMS surface originated from the one-dimensional (zero-dimensional) features of the PC surface. The persistence diagrams of PDMS also indicate that the height and the coverage area of the hills (i.e., spherulite structures) increased with increasing immersion time. There is also no standard pattern observed in the diagram of PDMS surface, which is the result of the multidimensional features of crystal growth of PC surface.
The persistence diagrams enable us to count the number of fibrils whose height is between 1 and 0.1 m. Table 4 shows that the number of the nano-structures at the PDMS surface are much less than the crystallized PC surface. This demonstrates that majority of nanosize fibrils were not copied on PDMS surface. Hence, the PDMS surface is smoother than the crystallized PC surface in nano scale. The lack of hierarchical structure in the PDMS surface explains the similar contact angle measures with the PC surface, even though there is a large difference in the surface energy of both samples (The energy of PDMS and PC are mN/m, mN/m, respectively [33]).
As explained in the previous section, we next bin the features in each persistence diagram to examine the repetitive structures on the surface morphology. For the 50 m × 50 m AFM images, we focus on the micro-structures rather than nanoscale and sub-nanoscale features. We choose the bin size as 0.5 m × 0.5 m (see Figure 7). We construct the feature vectors for each image by considering the values of the bins that are not located in the first two rows. Hence, the feature vectors consist of microlevel structures. These vectors can then be utilized in traditional machine learning algorithms. As a matter of purpose, we implemented principal component analysis (PCA).
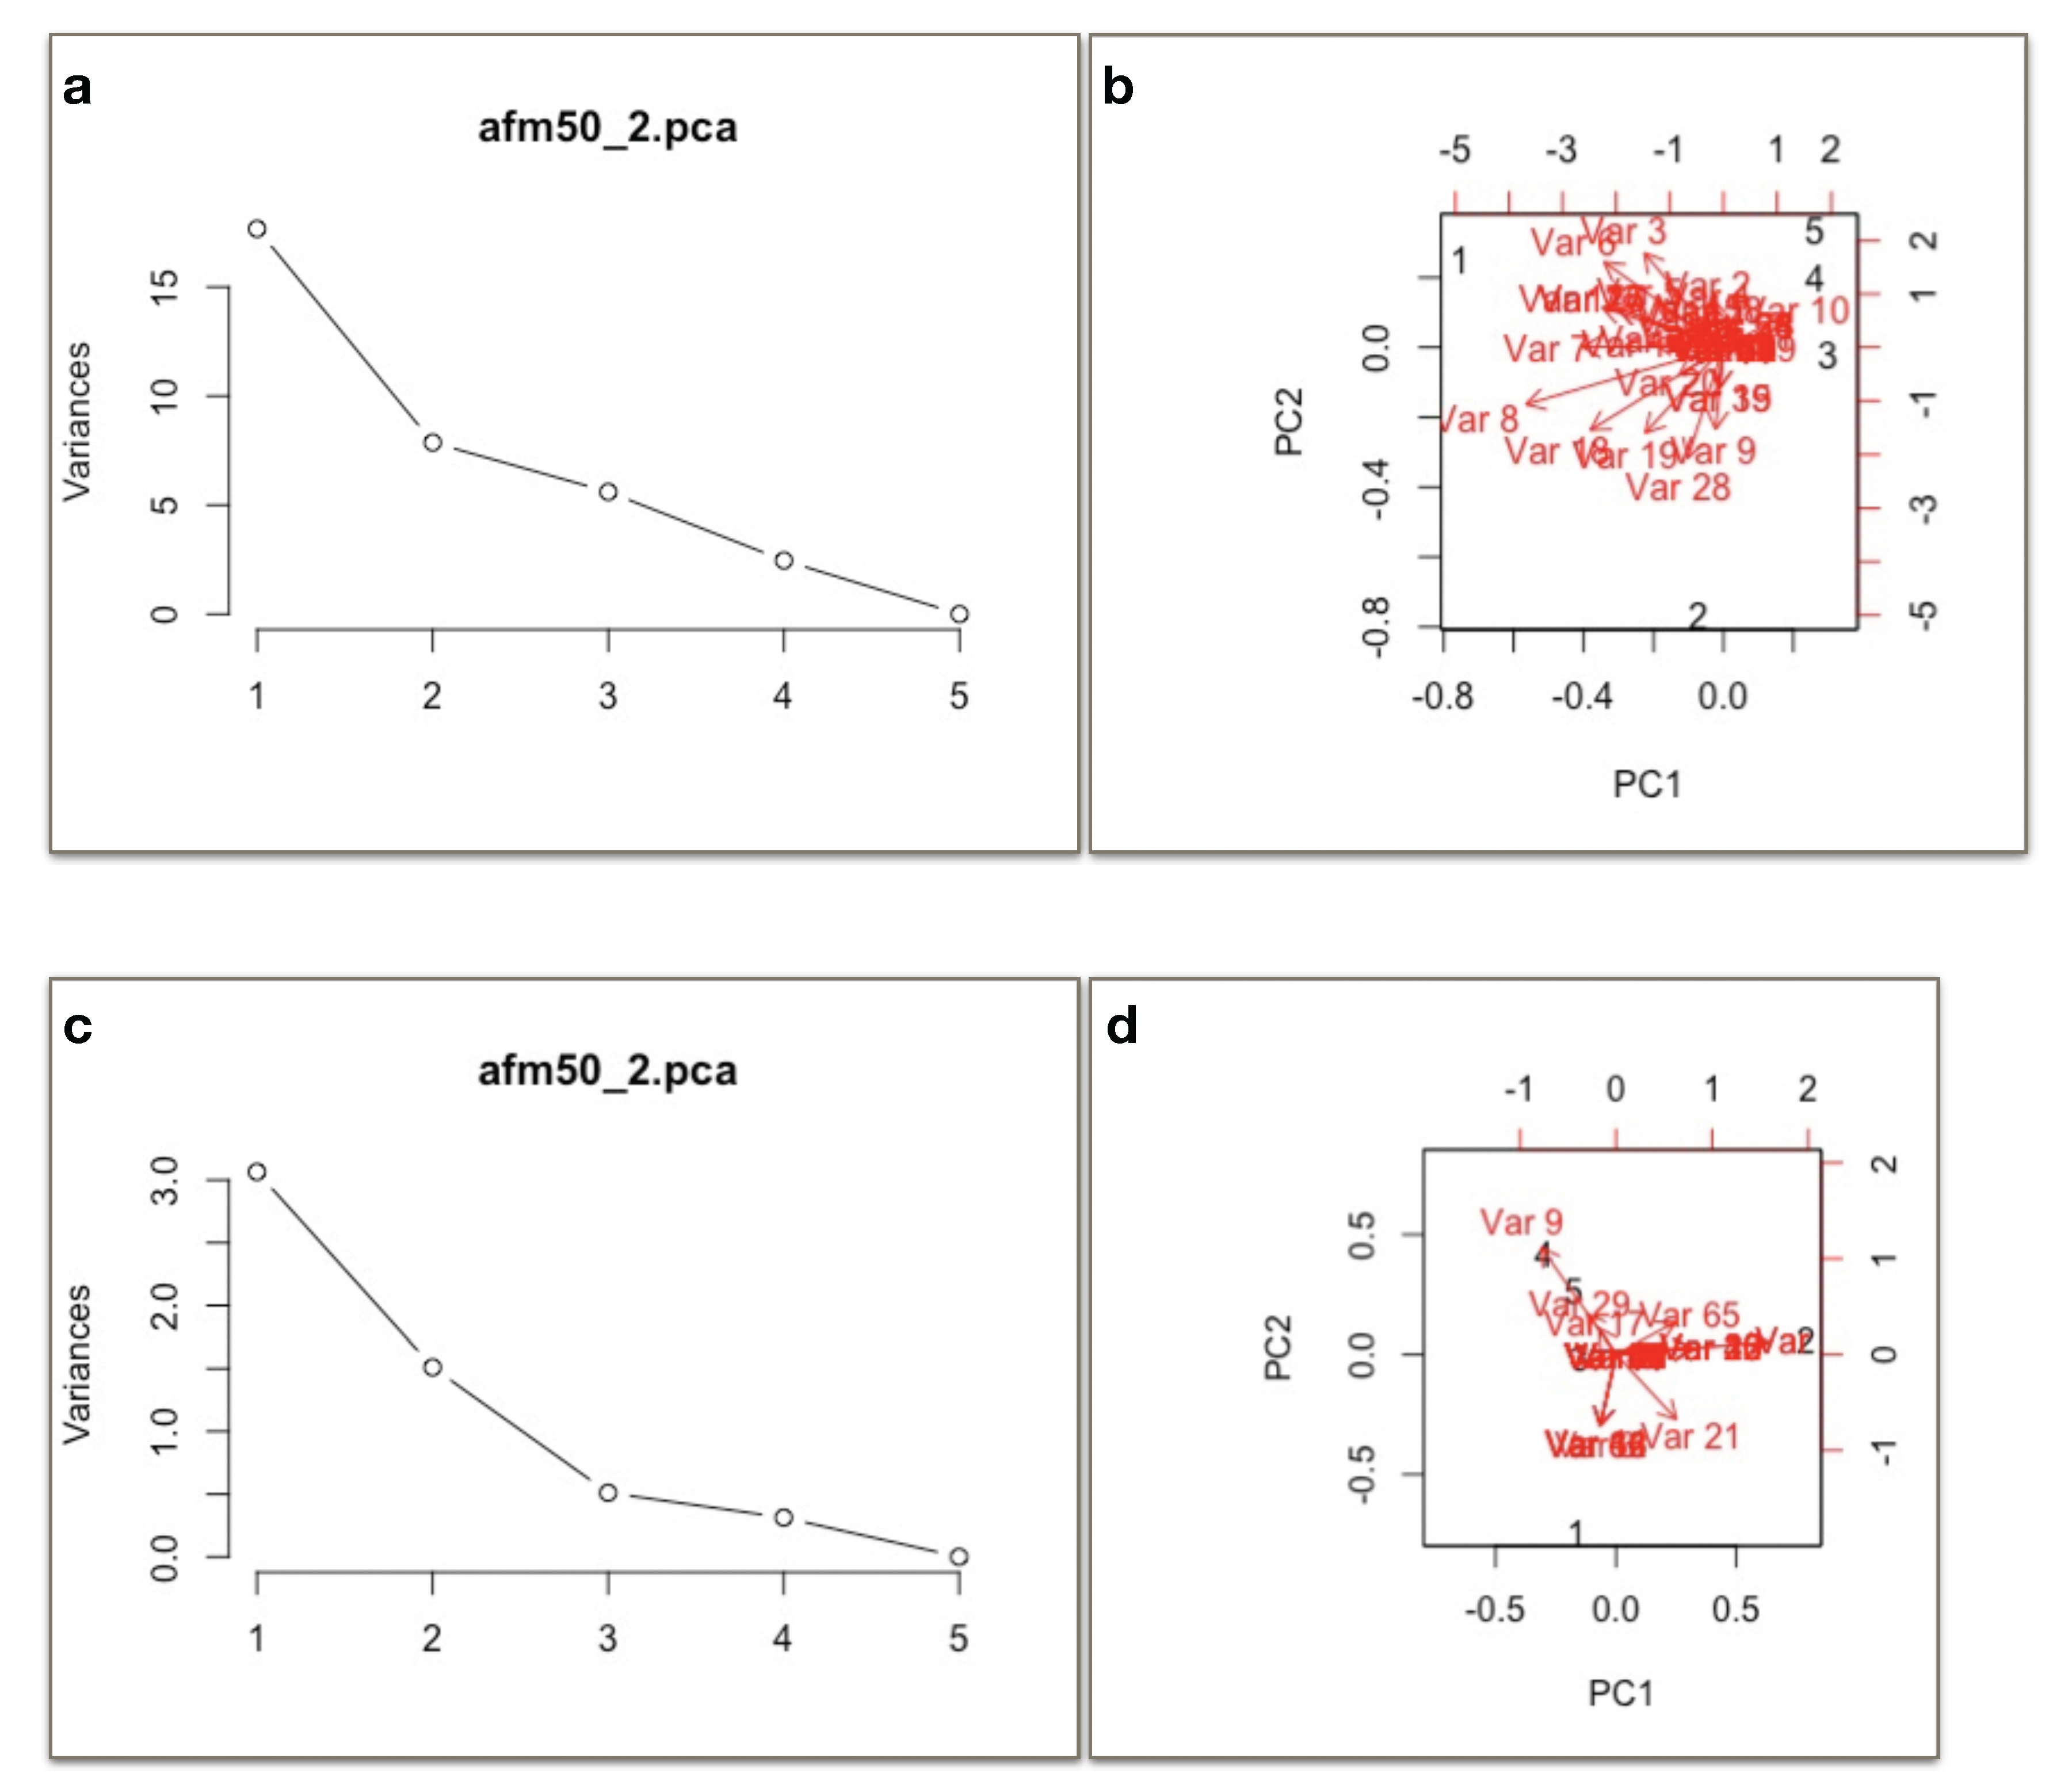
Figure 8 shows the output of PCA. The left part of the figure indicates that the first two principal components among five components pose the most variability in the data (the features matrix). The biplots on the right part of the figure illustrate which experiments are affected by similar directions of variances by principle components. Experiments 3, 4, 5 lie close to each other forming a cluster, while Experiments 1 and 2 fall apart from each other and the cluster. The result is in correlation with the contact angles of surfaces. The surfaces of 6, 8, 10 min of immersion of PC with high contact angles appear close (experiments 3, 4, 5), while relatively low contact angles appear far from each other (experiments 1, 2). The same result is also observed with PDMS surfaces. The K-means algorithm implemented on the feature vectors of the bin matrices obtain the same clusters (Experiment 1, Experiment 2, other experiments).
4. Conclusions
Texture characteristics of polycarbonate surface after solvent induced crystallization are examined. The resulting texture topology is analyzed using atomic force microscope. Topological characteristics of surface texture are identified incorporating the persistence diagrams to assess surface hydrophobicity. Consequently, a robust and quantitative method based on topological data analysis is proposed to investigate the morphology of AFM images of crystallized PC surfaces and their PDMS copies. The morphological characteristics of the same samples noticed in [6] are robustly confirmed by using persistent homology and its visualization persistence diagrams. Persistence diagrams witness the following:
- Existence of microsize/nanosize spherulites, voids, and fibrils;
- Enhancement of texture height and fibrils with the increase in immersion time;
- Aggregation of spherulites with the increase immersion time;
- Nonhierarchical distribution of spherulites;
- The microsize structures of PC surface were copied by PDMS, while 80-90 percent of nanofibrils were not captured.
The maximum heights of the macro-level hills at the surfaces with higher contact angles are evenly distributed in contrast to the surfaces with smaller contact angles. Persistence diagrams indicate that there is no well-defined hierarchical structure at the surfaces. In particular, the existence of pores and cavities that cause micro- and nano-level waviness on the surface are deduced from the diagram. A significant decrease in the number of hills and valleys on the surface with the increase of immersion time is numerically proven. This agrees with the fact that the spherulites corresponding to hills in the AFM image are clustered and/or closely spaced with the increase of immersion time. The zero-dimensional pairs in the persistence diagram witnesses the presence of small-size cavities and pores that result in micro-level waviness at the surface. The decrease in the number hills extracted from PD’s reveals the increase in the roughness as a result of the relation given in [26]. The enhancement of texture height implies the crystallization occurred in the surface region. The short-life pairs all over the diagonal indicate that the nano fibrils cover almost the entire crystallized PC surface. The similar location of the highly persistent zero and one dimensional pairs is a quantitative evidence that the PDMS surface has almost the same texture of the copied PC surface. The persistence diagrams of PDMS also indicate that the height and the coverage area of the hills (i.e., spherulite structures) increased with increasing immersion time. There is no standard pattern observed in the diagram of the PDMS surface as well, which is the result of the multidimensional features of crystal growth of the copied PC surface. Persistence diagrams enable us to count the number of fibrils whose height is between 1 and 0.1 m. The less number of the nano-structures at the PDMS surface demonstrates that majority of nano-size fibrils were not copied on the PDMS surface.
We have applied principle component analysis (PCA) and K-means clustering methods on persistence diagrams. PCA and K-means clustering revealed that the surfaces with high contact angle lie in the same cluster. We thus claim that the determining feature for a high contact angle might be the topological structures whose heights are within a specified interval.
Acquisition of big collection of results obtained from analytical surface analysis methods makes finding new approaches to determining the characteristics of surface morphology a crucial task. Emerging methods from data mining can be useful to extract meaningful information from experimental samples. The current study is the first application of a topological data analysis technique applied to the analysis of hydrophobic surfaces. Our result shows that the newly developing computational topology methods are promising to find morphological characteristics of hydrophobic surfaces where morphology is crucial besides the surface energy.
Acknowledgments
We thank the reviewers for their thorough reviews and highly appreciate the comments and suggestions, which significantly contributed to improving the quality of the publication. Authors would like to thank to King Fahd University of Petroleum and Minerals for the support during the course of the work. In addition, we would like to thank Mao Li for helpful suggestions. we also acknowledge Britanny Fasy, Jose Perea, Vidit Nanda for the advice and discussions on topological data analysis.
Author Contributions
A.N.D., B.Y. and H.P. wrote the paper. B.Y. and H.A. conceived, designed and performed experiments.
Conflicts of Interest
The authors declare no conflict of interest.
References
- Goossens, D.; Kerschaever, E.V. Aeolian dust deposition on photovoltaic solar cells: The effects of wind velocity and airborne dust concentration on cell. Sol. Energy 1999, 66, 277–289. [Google Scholar] [CrossRef]
- Yilbas, B.S.; Ali, H.; Al-Aqeeli, N.; Khaled, M.; Said, S.; Abu-Dheir, N.; Merah, N.; Youcef-Toumi, K.; Varanasi, K.K. Characterization of environmental dust in the Dammam area and mud after-effects on bisphenol—A polycarbonate sheets. Nat. Sci. Rep. 2016, 6, 24308. [Google Scholar] [CrossRef] [PubMed]
- Yilbas, B.S.; Ali, H.; Khaled, M.; Al-Aqeeli, N.; Abu-Dheir, N.; Varanasi, K. Influence of dust and mud on the optical, chemical, and mechanical properties of a PV protective glass. Nat. Sci. Rep. 2015, 5, 15833. [Google Scholar] [CrossRef] [PubMed]
- Yilbas, B.S.; Ali, H.; Al-Aqeeli, N.; Abu-Dheir, N.; Khaled, M. Influence of mud residues on solvent induced crystalized polycarbonate surface used as PV protective cover. Sol. Energy 2016, 125, 282–293. [Google Scholar] [CrossRef]
- Owais, A.; Khaled, M.M.; Yilbas, B.S.; Varanasi, K.K.; Toumi, K.Y. Surface and wetting characteristics of textured Bisphenol—A based polycarbonate surfaces: Hierarchical texturing using acetone-induced crystallization. J. Appl. Polym. Sci. 2016, 133, 43074. [Google Scholar] [CrossRef]
- Yilbas, B.S.; Ali, H.; Al-Aqeeli, N.; Khaled, M.; Abu-Dheir, N.; Varanasi, K.K. Solvent-induced crystallization of a polycarbonate surface and texture copying by polydimethylsiloxane for improved surface hydrophobicity. J. Appl. Polym. Sci. 2016, 133, 43467. [Google Scholar] [CrossRef]
- Quan, Y.-Y.; Zhan, L.-Z. Experimental investigation of the anti-dust effect of transparent hydrophobic coatings applied for solar cell covering glass. Sol. Energy Mater. Sol. Cells 2017, 160, 382–389. [Google Scholar] [CrossRef]
- Sun, K.; Xia, Y.; Ouyang, J. Improvement in the photovoltaic efficiency of polymer solar cells by treating the poly(3,4-ethylenedioxythiophene): Poly(styrenesulfonate) buffer layer with co-solvents of hydrophilic organic solvents and hydrophobic 1,2-dichlorobenzene. Sol. Energy Mater. Sol. Cells 2012, 97, 89–96. [Google Scholar] [CrossRef]
- Mehmood, U.; Al-Sulaiman, F.A.; Yilbas, B.S.; Salhi, B.; Ahmed, S.H.A.; Hossain, M.K. Superhydrophobic surfaces with antireflection properties for solar applications: A critical review. Sol. Energy Mater. Sol. Cells 2016, 157, 604–623. [Google Scholar] [CrossRef]
- Midtda, K.L.; Jelle, B.P. Self-cleaning glazing products: A state-of-the-art review and future research pathways. Sol. Energy Mater. Sol. Cells 2013, 109, 126–141. [Google Scholar] [CrossRef]
- Zhou, B.; Gao, Y.; Wu, X.; Wen, W. Control the drying configuration of suspensions via regulating the surface topologies for surface-enhanced Raman scattering optimization. J. Coll. Interface Sci. 2017, 502, 67–76. [Google Scholar] [CrossRef] [PubMed]
- Kijlstra, J.; Reihs, K.; Klamt, A. Roughness and topology of ultra-hydrophobic surfaces. Coll. Surf. A Physicochem. Eng. Asp. 2002, 206, 521–529. [Google Scholar] [CrossRef]
- Yan, L.; Wang, K.; Wu, J.; Ye, L. Hydrophobicity of model surfaces with closely packed nano- and micro-spheres. Coll. Surf. A Physicochem. Eng. Asp. 2007, 296, 123–131. [Google Scholar] [CrossRef]
- Obeidi, M.A.; McCarthy, E.; Brabazon, D. Methodology of laser processing for precise control of surface micro-topology. Surf. Coat. Technol. 2016, 307, 702–712. [Google Scholar] [CrossRef]
- Sulym, I.Y.; Borysenko, M.V.; Goncharuk, O.V.; Terpilowski, K.; Sternik, D.; Chibowski, E.; Gun’ko, V.M. Structural and hydrophobic—Hydrophilic properties of nanosilica/zirconia alone and with adsorbed PDMS. Appl. Surf. Sci. 2011, 258, 270–277. [Google Scholar] [CrossRef]
- Banerjee, B.; Mukherjee, S.; Chattopadhyay, K.K. Controlling the surface topology and hence the hydrophobicity of amorphous carbon thin films. Carbon 2010, 48, 1025–1031. [Google Scholar] [CrossRef]
- Bendich, P.; Edelsbrunner, H.; Kerber, M. Computing robustness and persistence for images. IEEE Trans. Vis. Comput. Graph. 2010, 16, 1251–1260. [Google Scholar] [CrossRef] [PubMed]
- Delgado-Friedrichs, O.; Robins, V.; Sheppard, A. Skeletonization and Parti- tioning of Digital Images Using Discrete Morse Theory. IEEE Trans. Pattern Anal. Mach. Intell. 2015, 37, 654–666. [Google Scholar] [CrossRef] [PubMed]
- Kurtuldu, H.; Mischaikow, K.; Schatz, M. F. Measuring the departures from the Boussinesq approximation in Rayleigh-Benard convection experiments. J. Fluid Mech. 2011, 682, 543–557. [Google Scholar] [CrossRef]
- Carriere, M.; Oudot, S.Y.; Ovsjainikov, M. Stable topological signatures for points on 3D shapes. In Proceedings of the Computer Graphics Forum, Graz, Austria, 6–8 July 2015; Volume 34, pp. 1–12. [Google Scholar]
- Edelsbrunner, H.; Harer, J. Persistent homology: A survey. In Surveys on Discrete and Computational Geometry, Twenty Years Later, Comtemporary Mathematics; American Mathematical Society: Providence, RI, USA, 2008; Volume 453, pp. 257–282. [Google Scholar]
- Edelsbrunner, H.; Morozov, D. Persistent Homology: Theory and Practice. In Proceedings of the European Congress of Mathematics, Krakow, Poland, 2–7 July 2012. [Google Scholar]
- Ghrist, R. Barcodes: The Persistent Topology of Data. Bul. Am. Math. Soc. 2008, 45, 61–75. [Google Scholar] [CrossRef]
- Zeppelzauer, M.; Zielinski, B.; Juda, M.; Seidl, M. Topological descriptors for 3D surface analysis. LNCS 2016, 9667, 77–87. [Google Scholar]
- Mander, L.; Li, M.; Mio, W.; Fowlkes, C.C.; Punyasena, S.W. Classification of grass pollen through the quantitative analysis of surface ornamentation and texture. Proc. R. Soc. Biol. Sci. 2013, 280, 20131905. [Google Scholar] [CrossRef] [PubMed]
- Yamamoto, K. Topological Analysis of Rough Surfaces Using Persistent Homology. J. Phys. Soc. Jpn. 2015, 84, 113001. [Google Scholar] [CrossRef]
- Bendich, P.; Chin, S.; Clarke, J.; deSena, J.; Harer, J.; Munch, E.; Newman, A.; Porter, D.; Rouse, D.; Strawn, N.; Watkins, A. Topological and statistical behavior classifiers for tracking applications. arXiv, 2014; arXiv:1406.0214. [Google Scholar]
- Carlsson, G. Topology and Data. Bull. Am. Math. Soc. 2009, 46, 255–308. [Google Scholar] [CrossRef]
- Feders, J. Fractals; Premum: New York, NY, USA, 1988. [Google Scholar]
- Bubenik, P. Statistical topological data analysis using persistence landscapes. J. Mach. Learn. Res. 2015, 16, 77–102. [Google Scholar]
- Adams, H.; Chepushtanova, S.; Emerson, T.; Hanson, E.; Kirby, M.; Motta, F.; Neville, R.; Peterson, C.; Shipman, P.; Ziegelmeier, L. Persistence images: A stable vector representation of persistent homology. J. Mach. Learn. Res. 2015, 18, 1–35. [Google Scholar]
- Fasy, B.; Kim, J.; Lecci, F.; Maria, C.; Rouvreau, V. R Package “TDA”. Available online: https://CRAN.R-project.org/package=TDA (accessed on 27 April 2017).
- Solid Surface Energy Data (SFE) for Common Polymers. Available online: http://www.surface-tension.de/solid-energy.htm (accessed on 17 April 2017).
Figure 1.
Illustration of computation of persistence diagrams. (a) There is an example of a one-dimensional surface. The zero dimensional persistence pairs of the function on the left are (A,B), (C,D), and (E,D). The first point represents the place where an island forms. The second point is the place where it is completely flooded. (b) The persistence diagram is obtained by plotting the birth and death height of each island. The difference between y and x coordinates is the life span of an island.

Figure 2.
Persistence diagram transformation. Each point on the persistence diagram on (a) is projected onto Euclidean plane (b) via .
Figure 2.
Persistence diagram transformation. Each point on the persistence diagram on (a) is projected onto Euclidean plane (b) via .
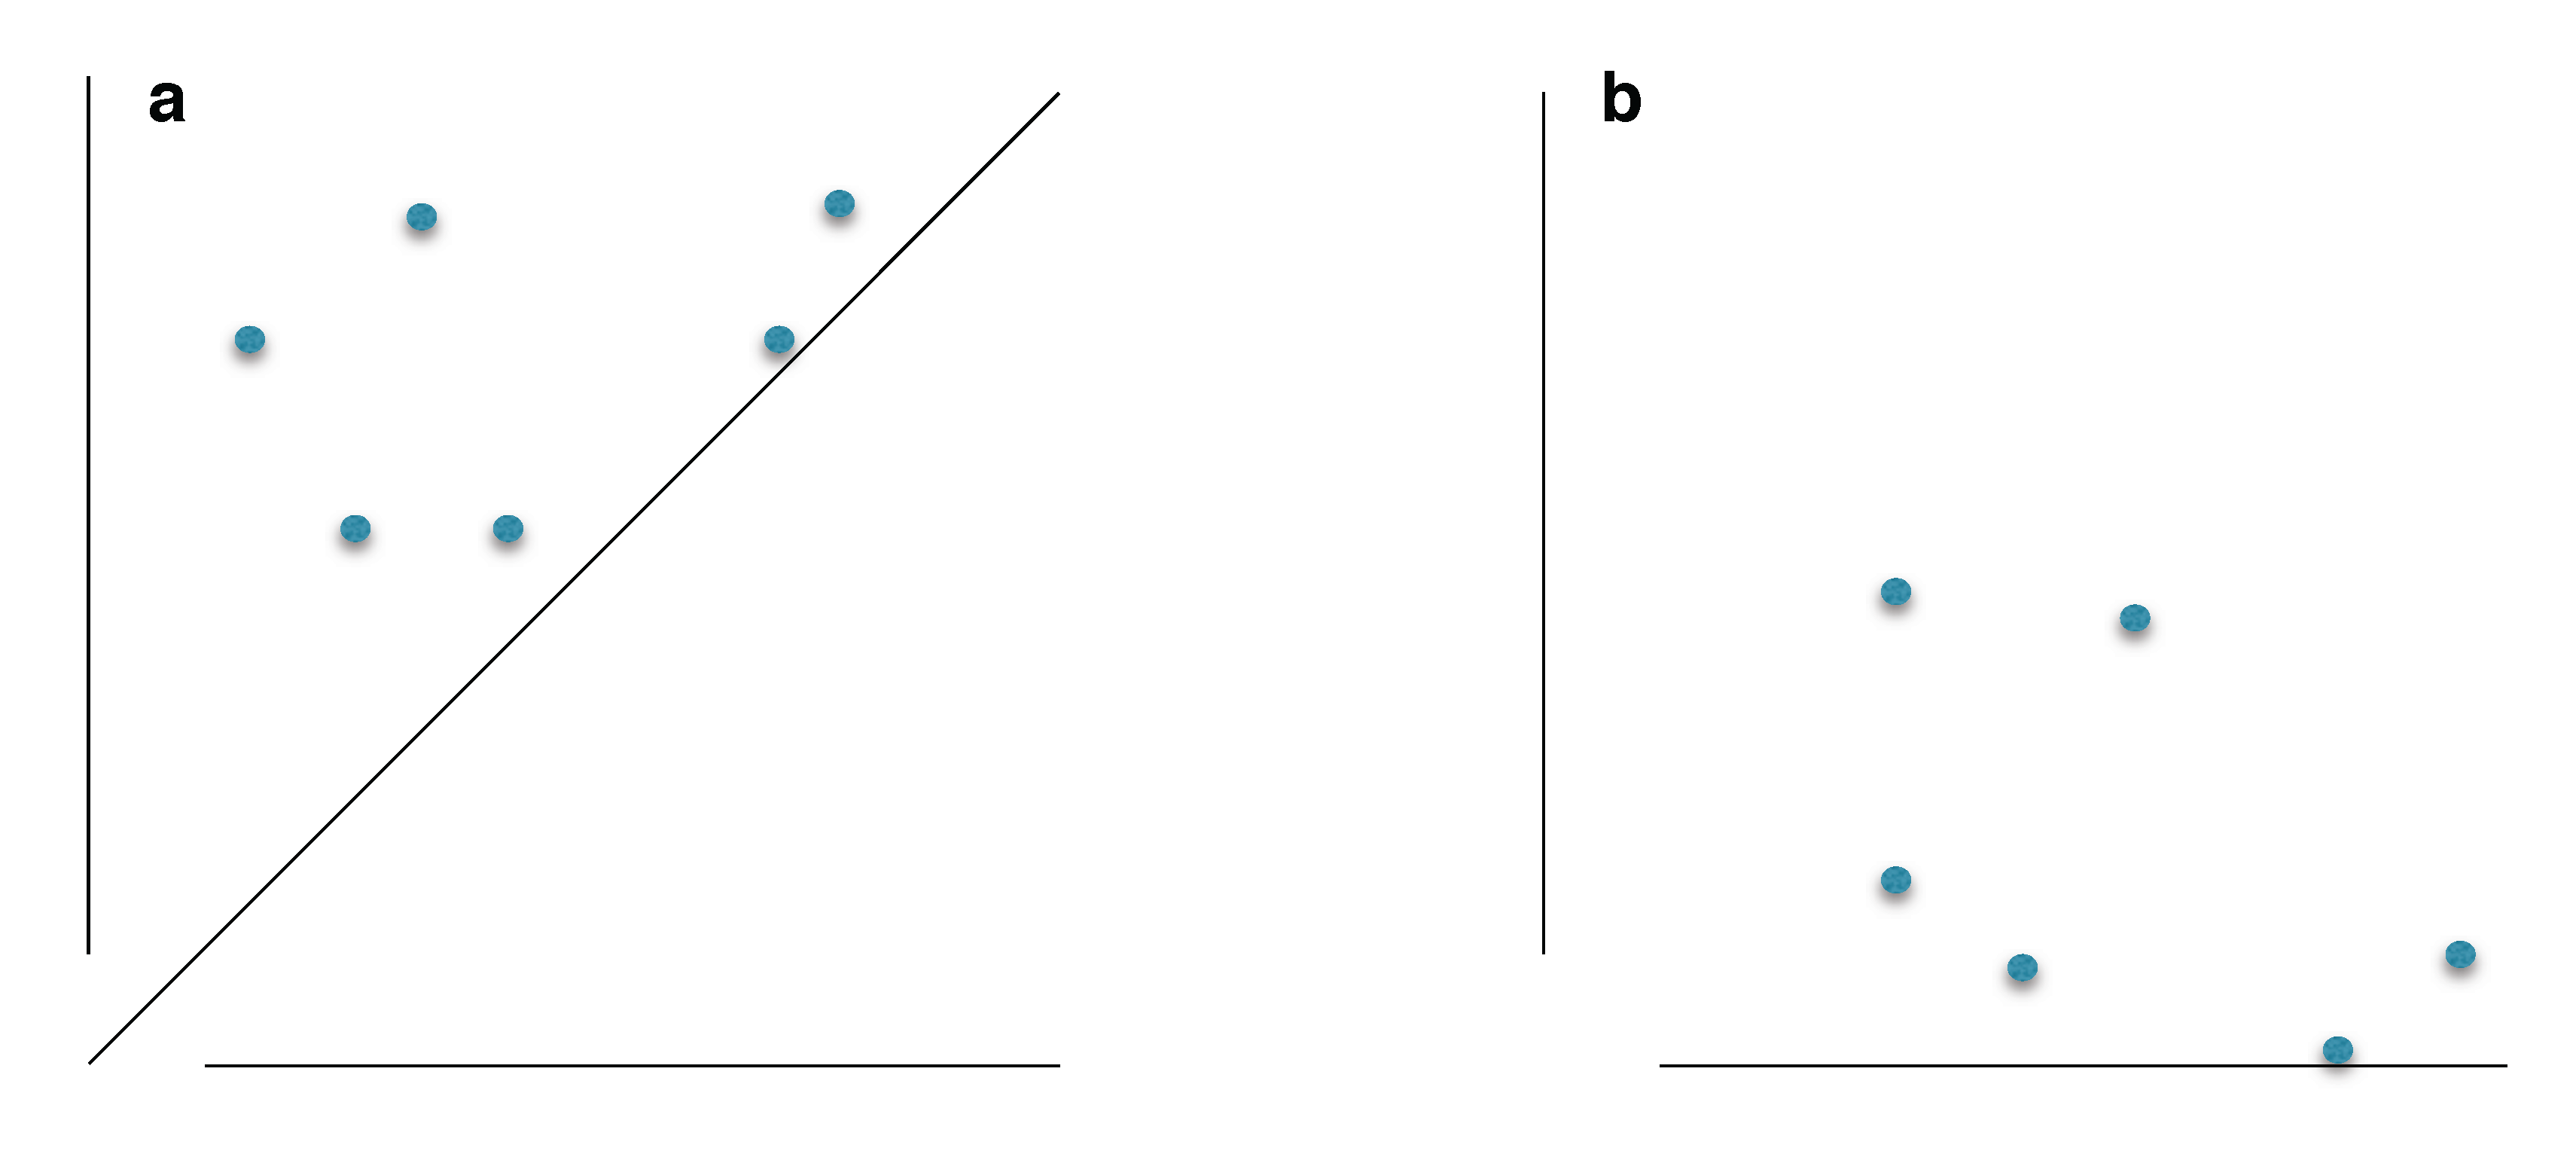
Figure 3.
The flow chart of our calculation process.

Figure 4.
50 m × 50 m AFM images of the (a) 2 min and (c) 6 min of immersion of PC and the corresponding persistence diagrams (b,d). The black dots indicate the persistency of zero-dimensional topological features (i.e., valleys). The red triangles indicate the persistency of one-dimensional topological features (i.e., hills). The less number of persistent features for the 6 min immersion with the increasing average height (see Table 2) proves the aggregation of micro structures.
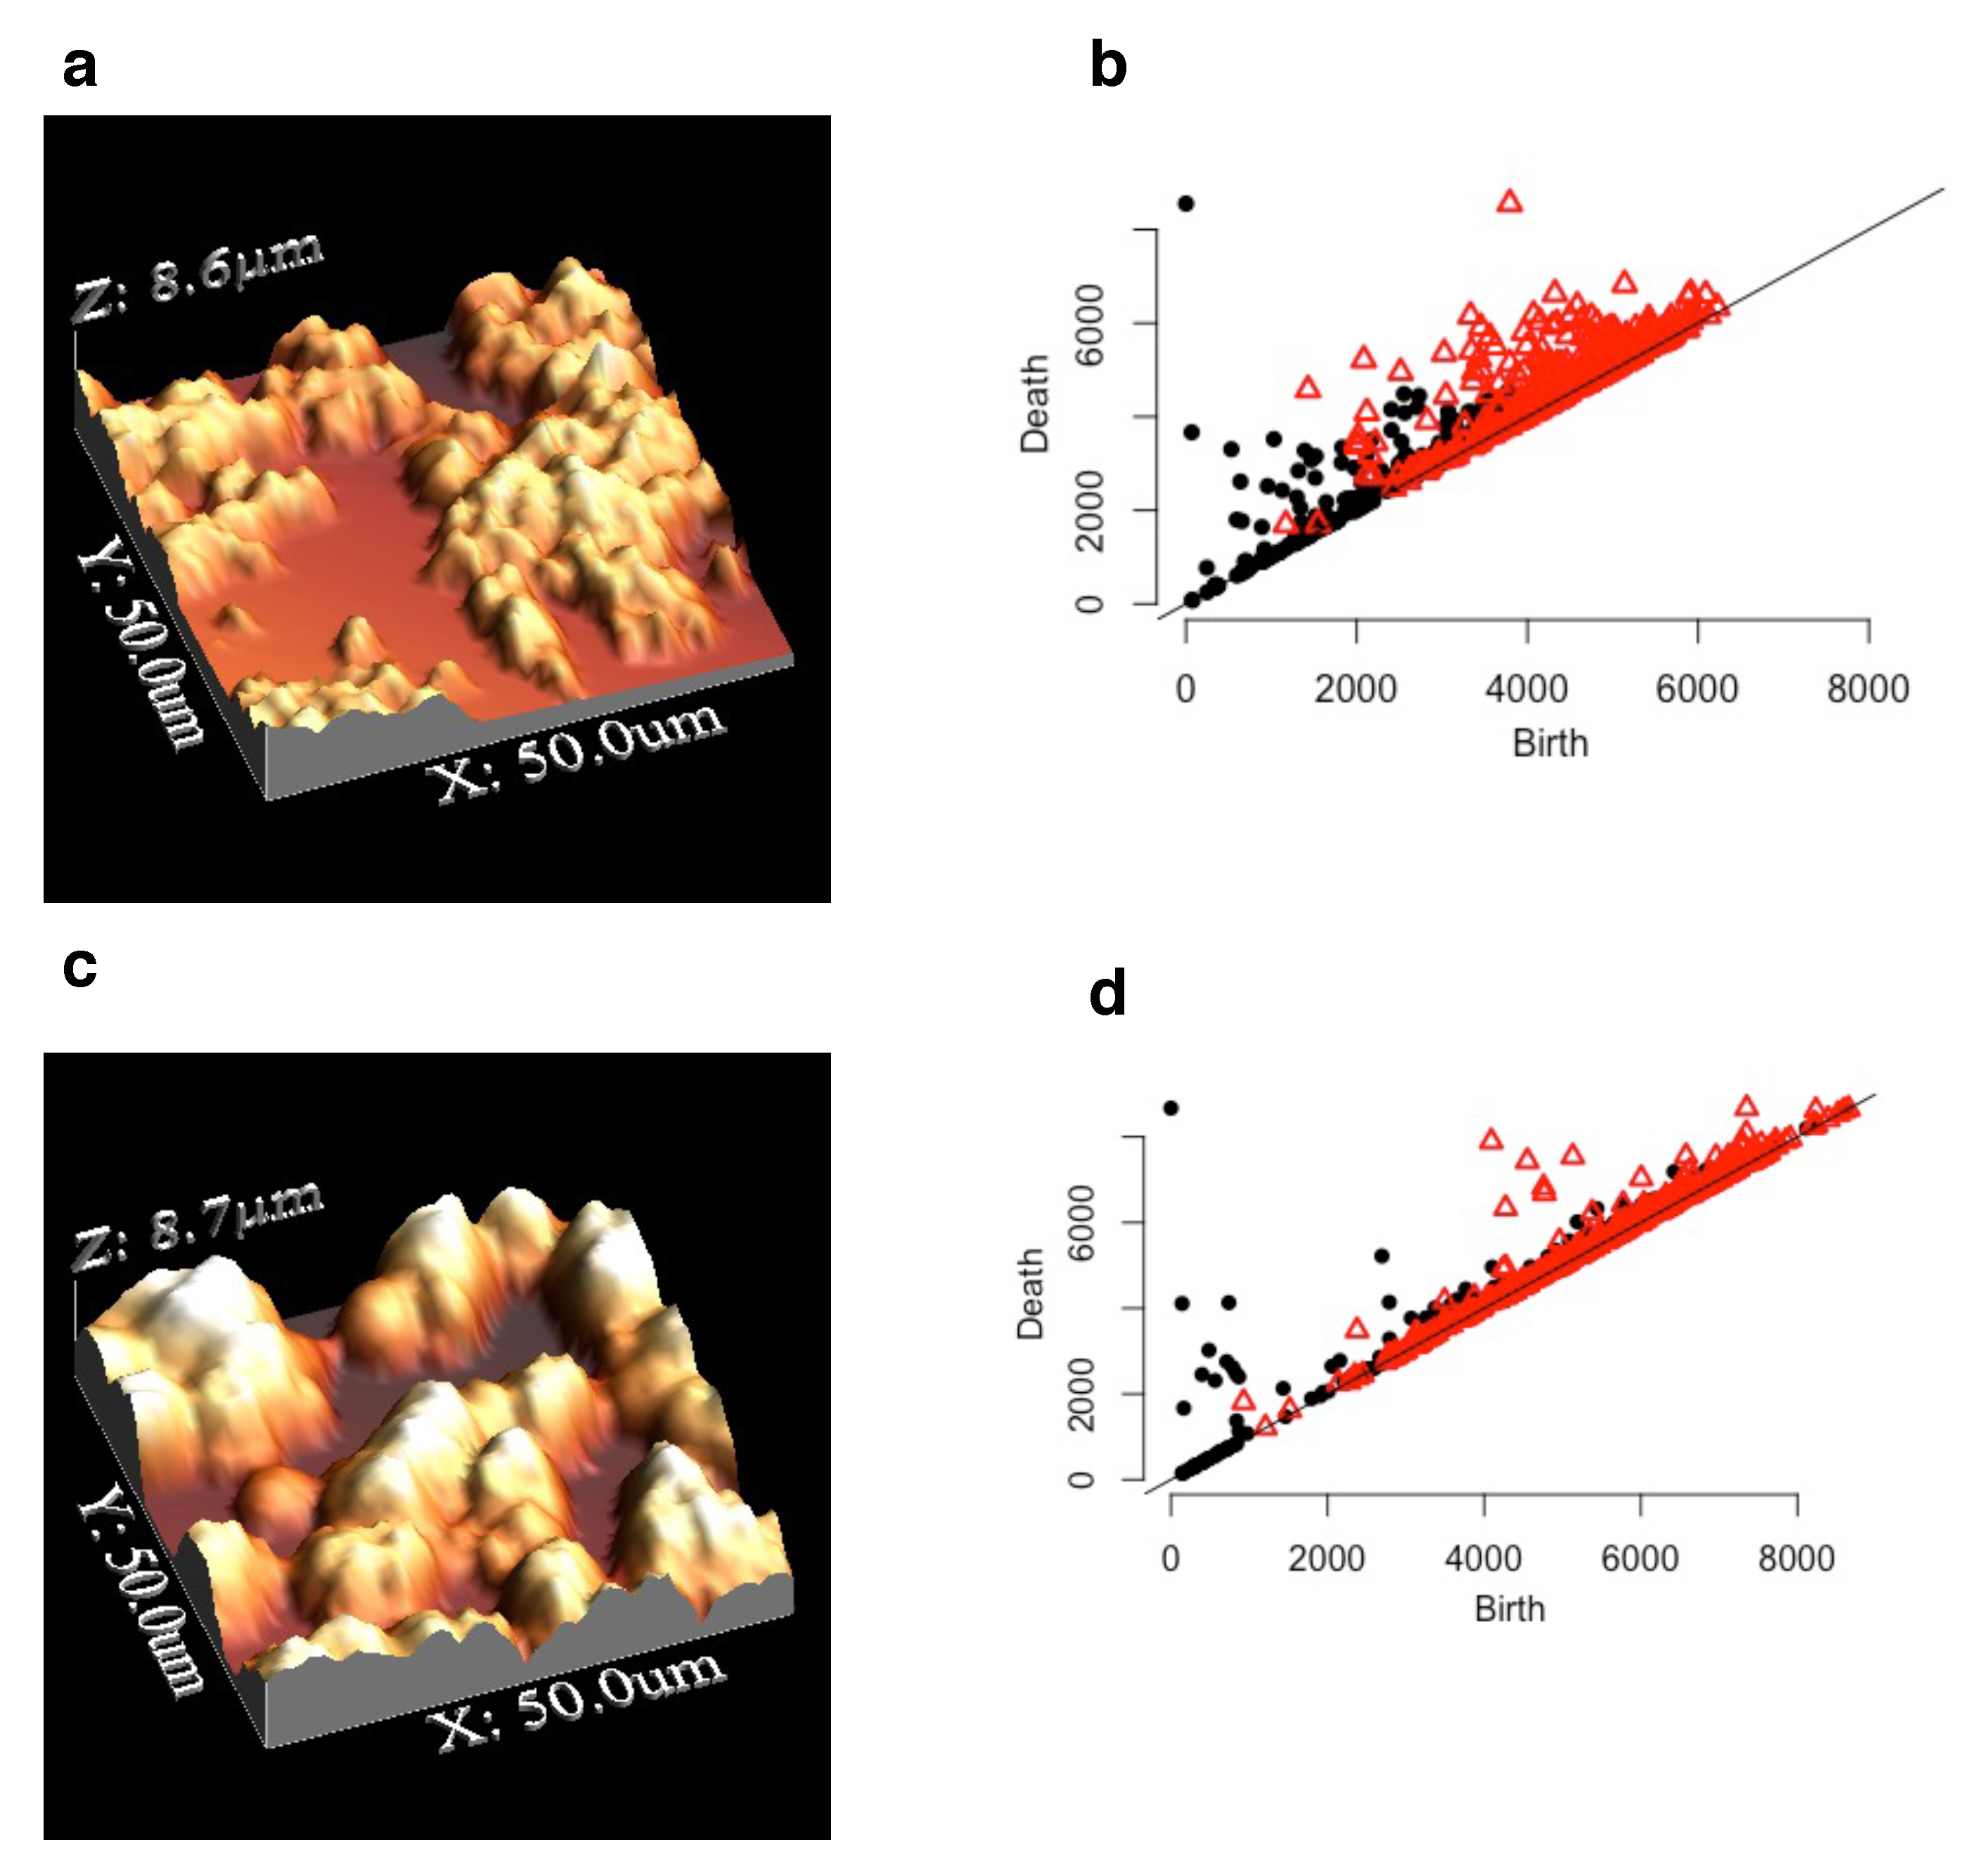
Figure 5.
Persistence diagrams of surface textures of (a) 4 min , (b) 8 min and (c) 10 min of immersion time of PC.
Figure 5.
Persistence diagrams of surface textures of (a) 4 min , (b) 8 min and (c) 10 min of immersion time of PC.
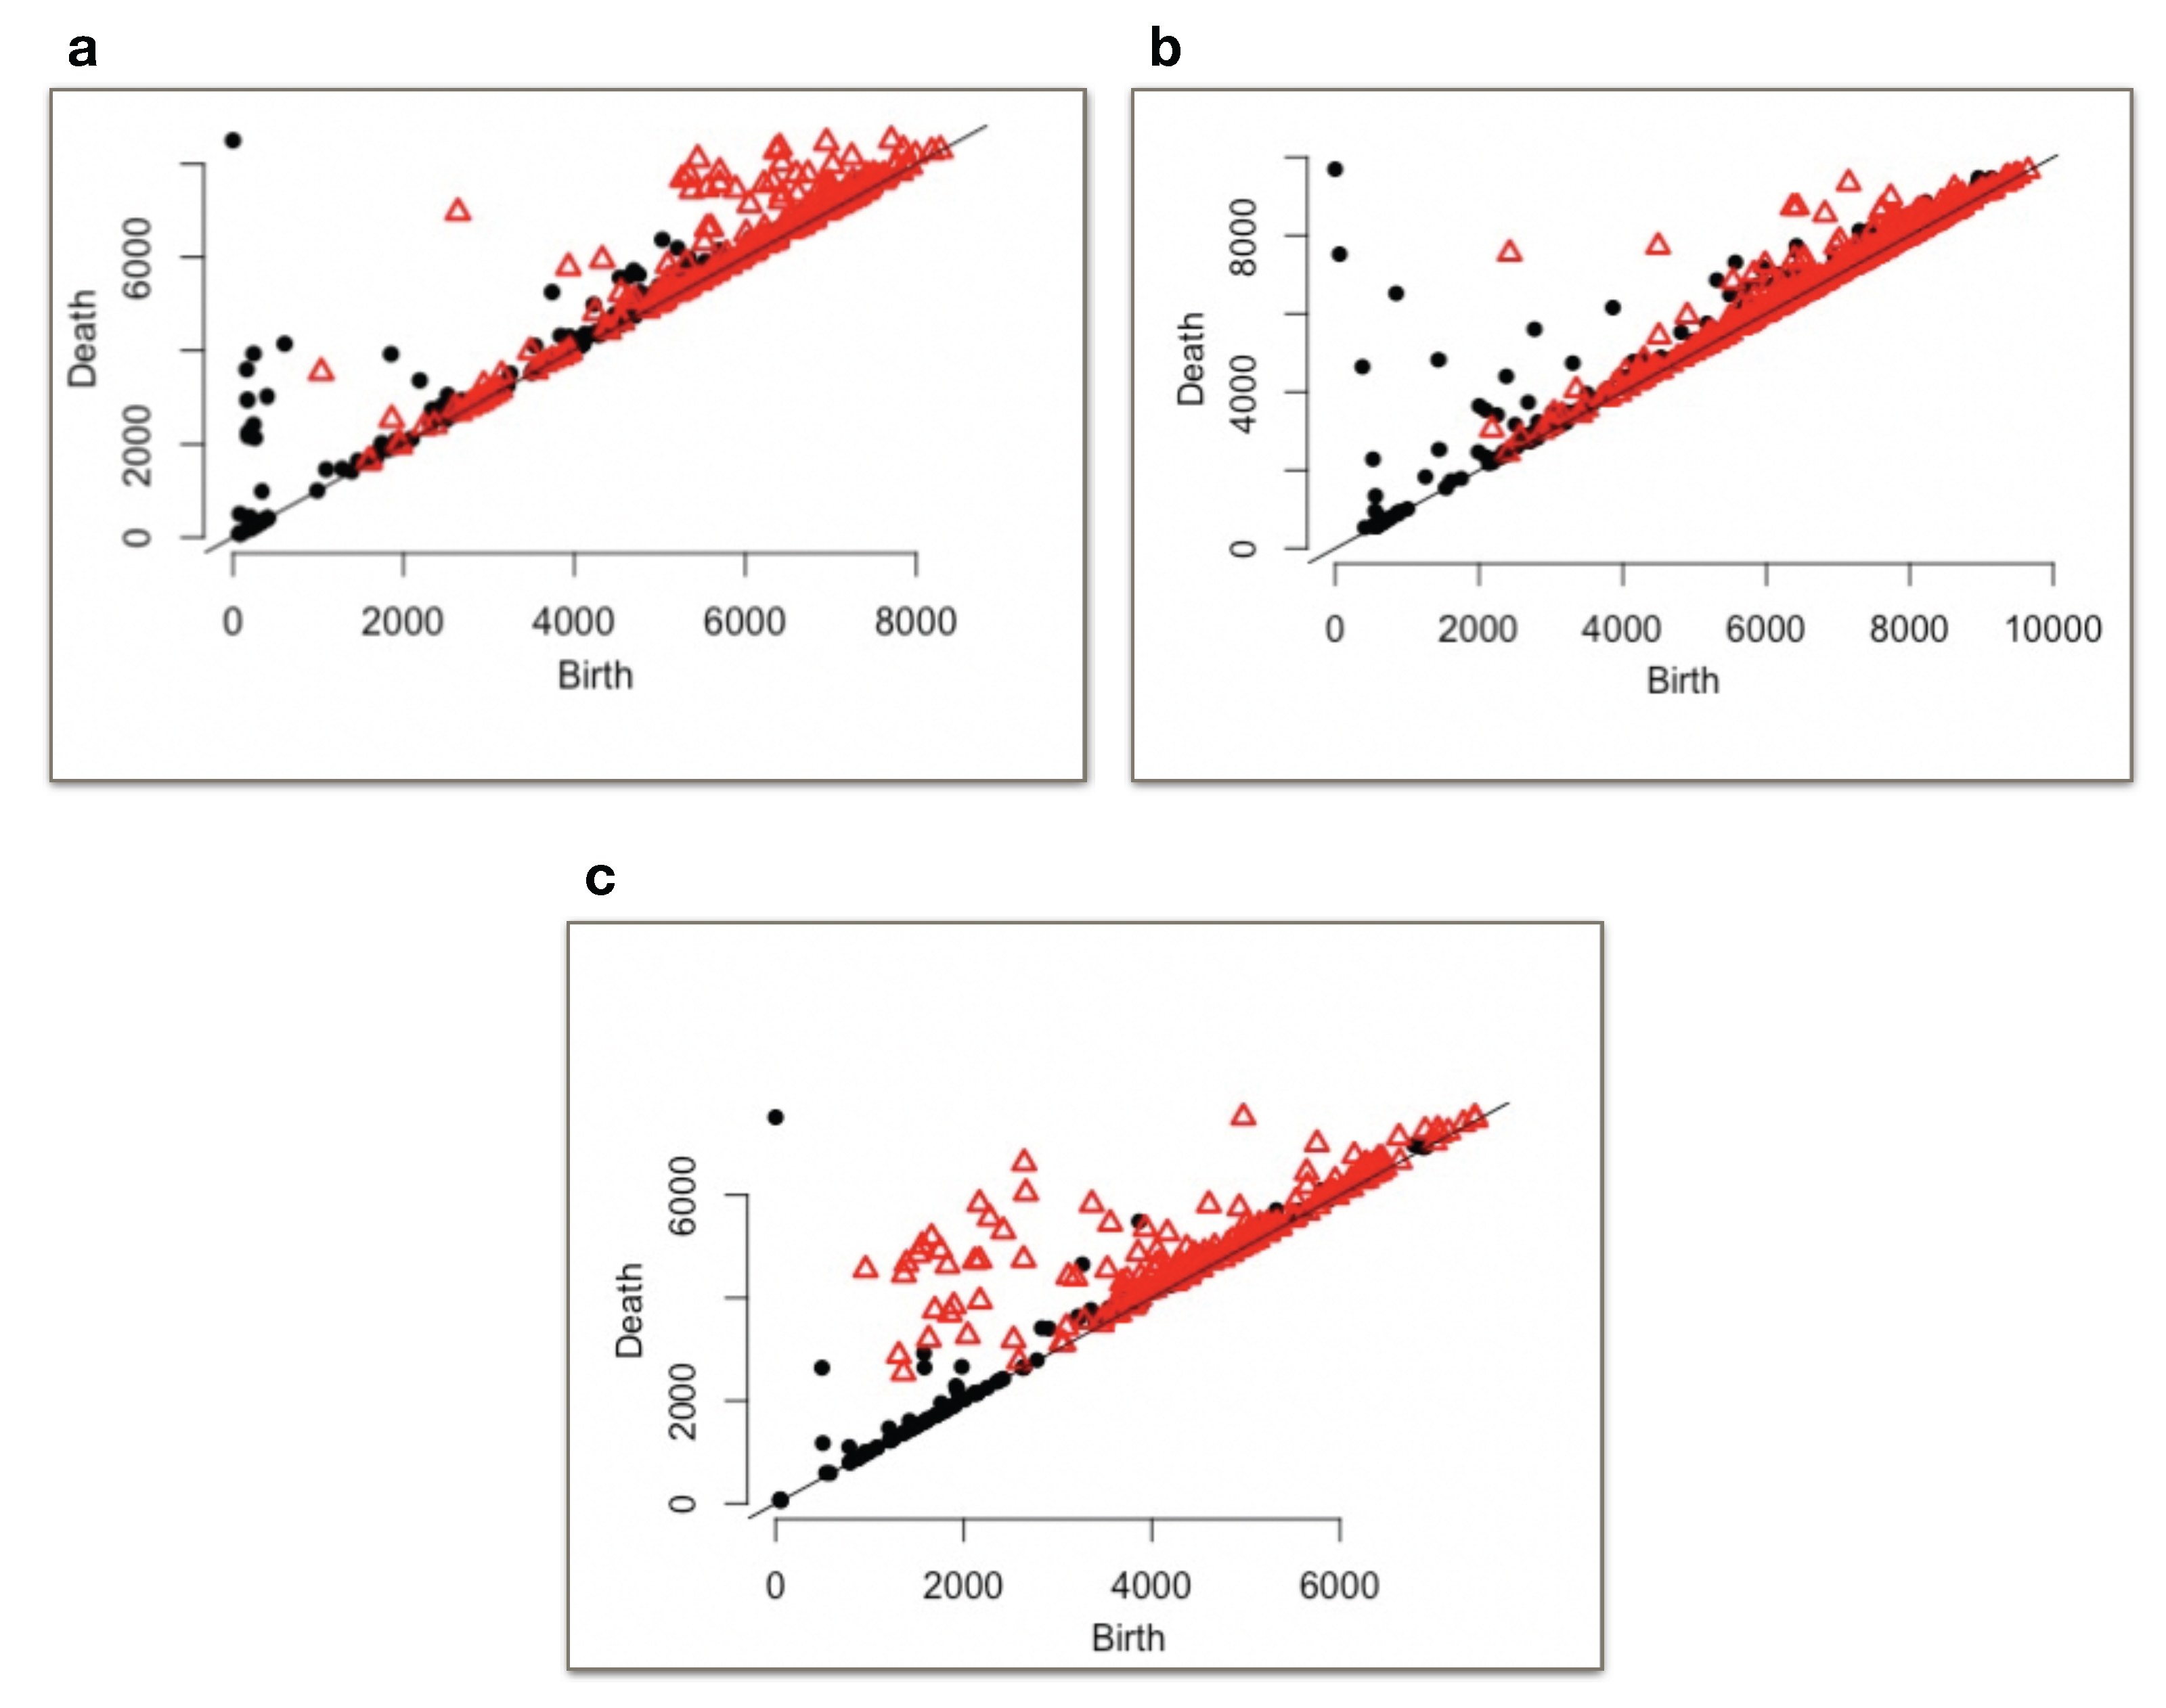
Figure 6.
Persistence diagrams of the crystallized PC surface with (a) 4 min of immersion time and (b) copied surface by PDMS .
Figure 6.
Persistence diagrams of the crystallized PC surface with (a) 4 min of immersion time and (b) copied surface by PDMS .
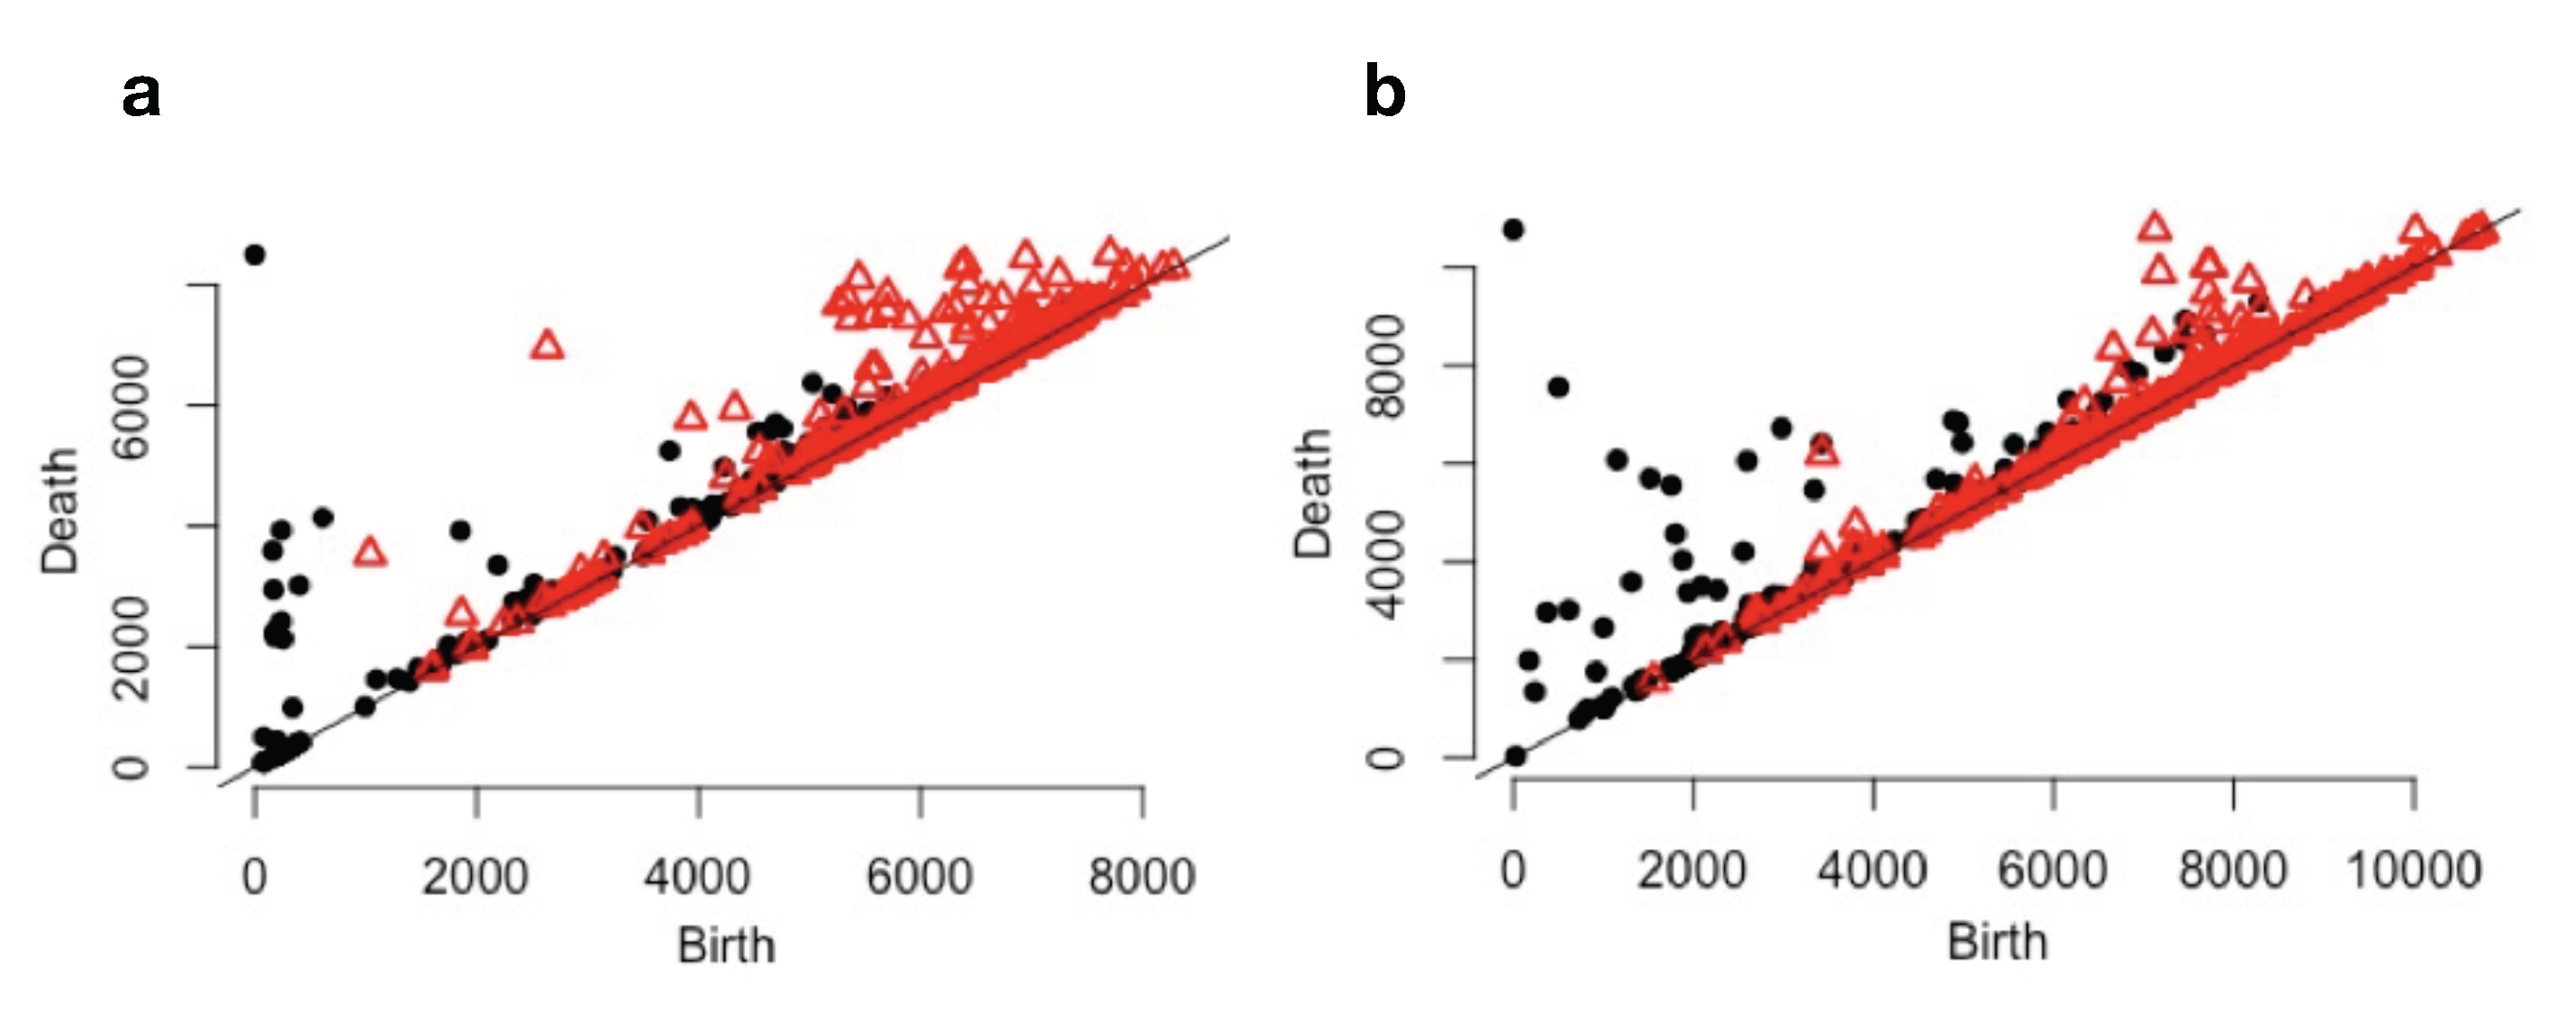
Figure 7.
Visualization of bin matrices corresponding to different immersion times (i.e., (a) 2 min, (b) 4 min (c) 6 min (d) 8 min (e) 10 min) for the crystallized PC. The horizontal axis indicates the height where the feature started to appear and the vertical axis indicates the height of the structure. Bins’ dimensions are 0.5 m × 0.5 m Yellow squares shows empty bins. Green, cyan, blue, purple and red bins contain 1, 2, 3, 4 and 5 features, respectively. White bins concentrated at the bottom contains more than five nanoscale and subnanoscale features.
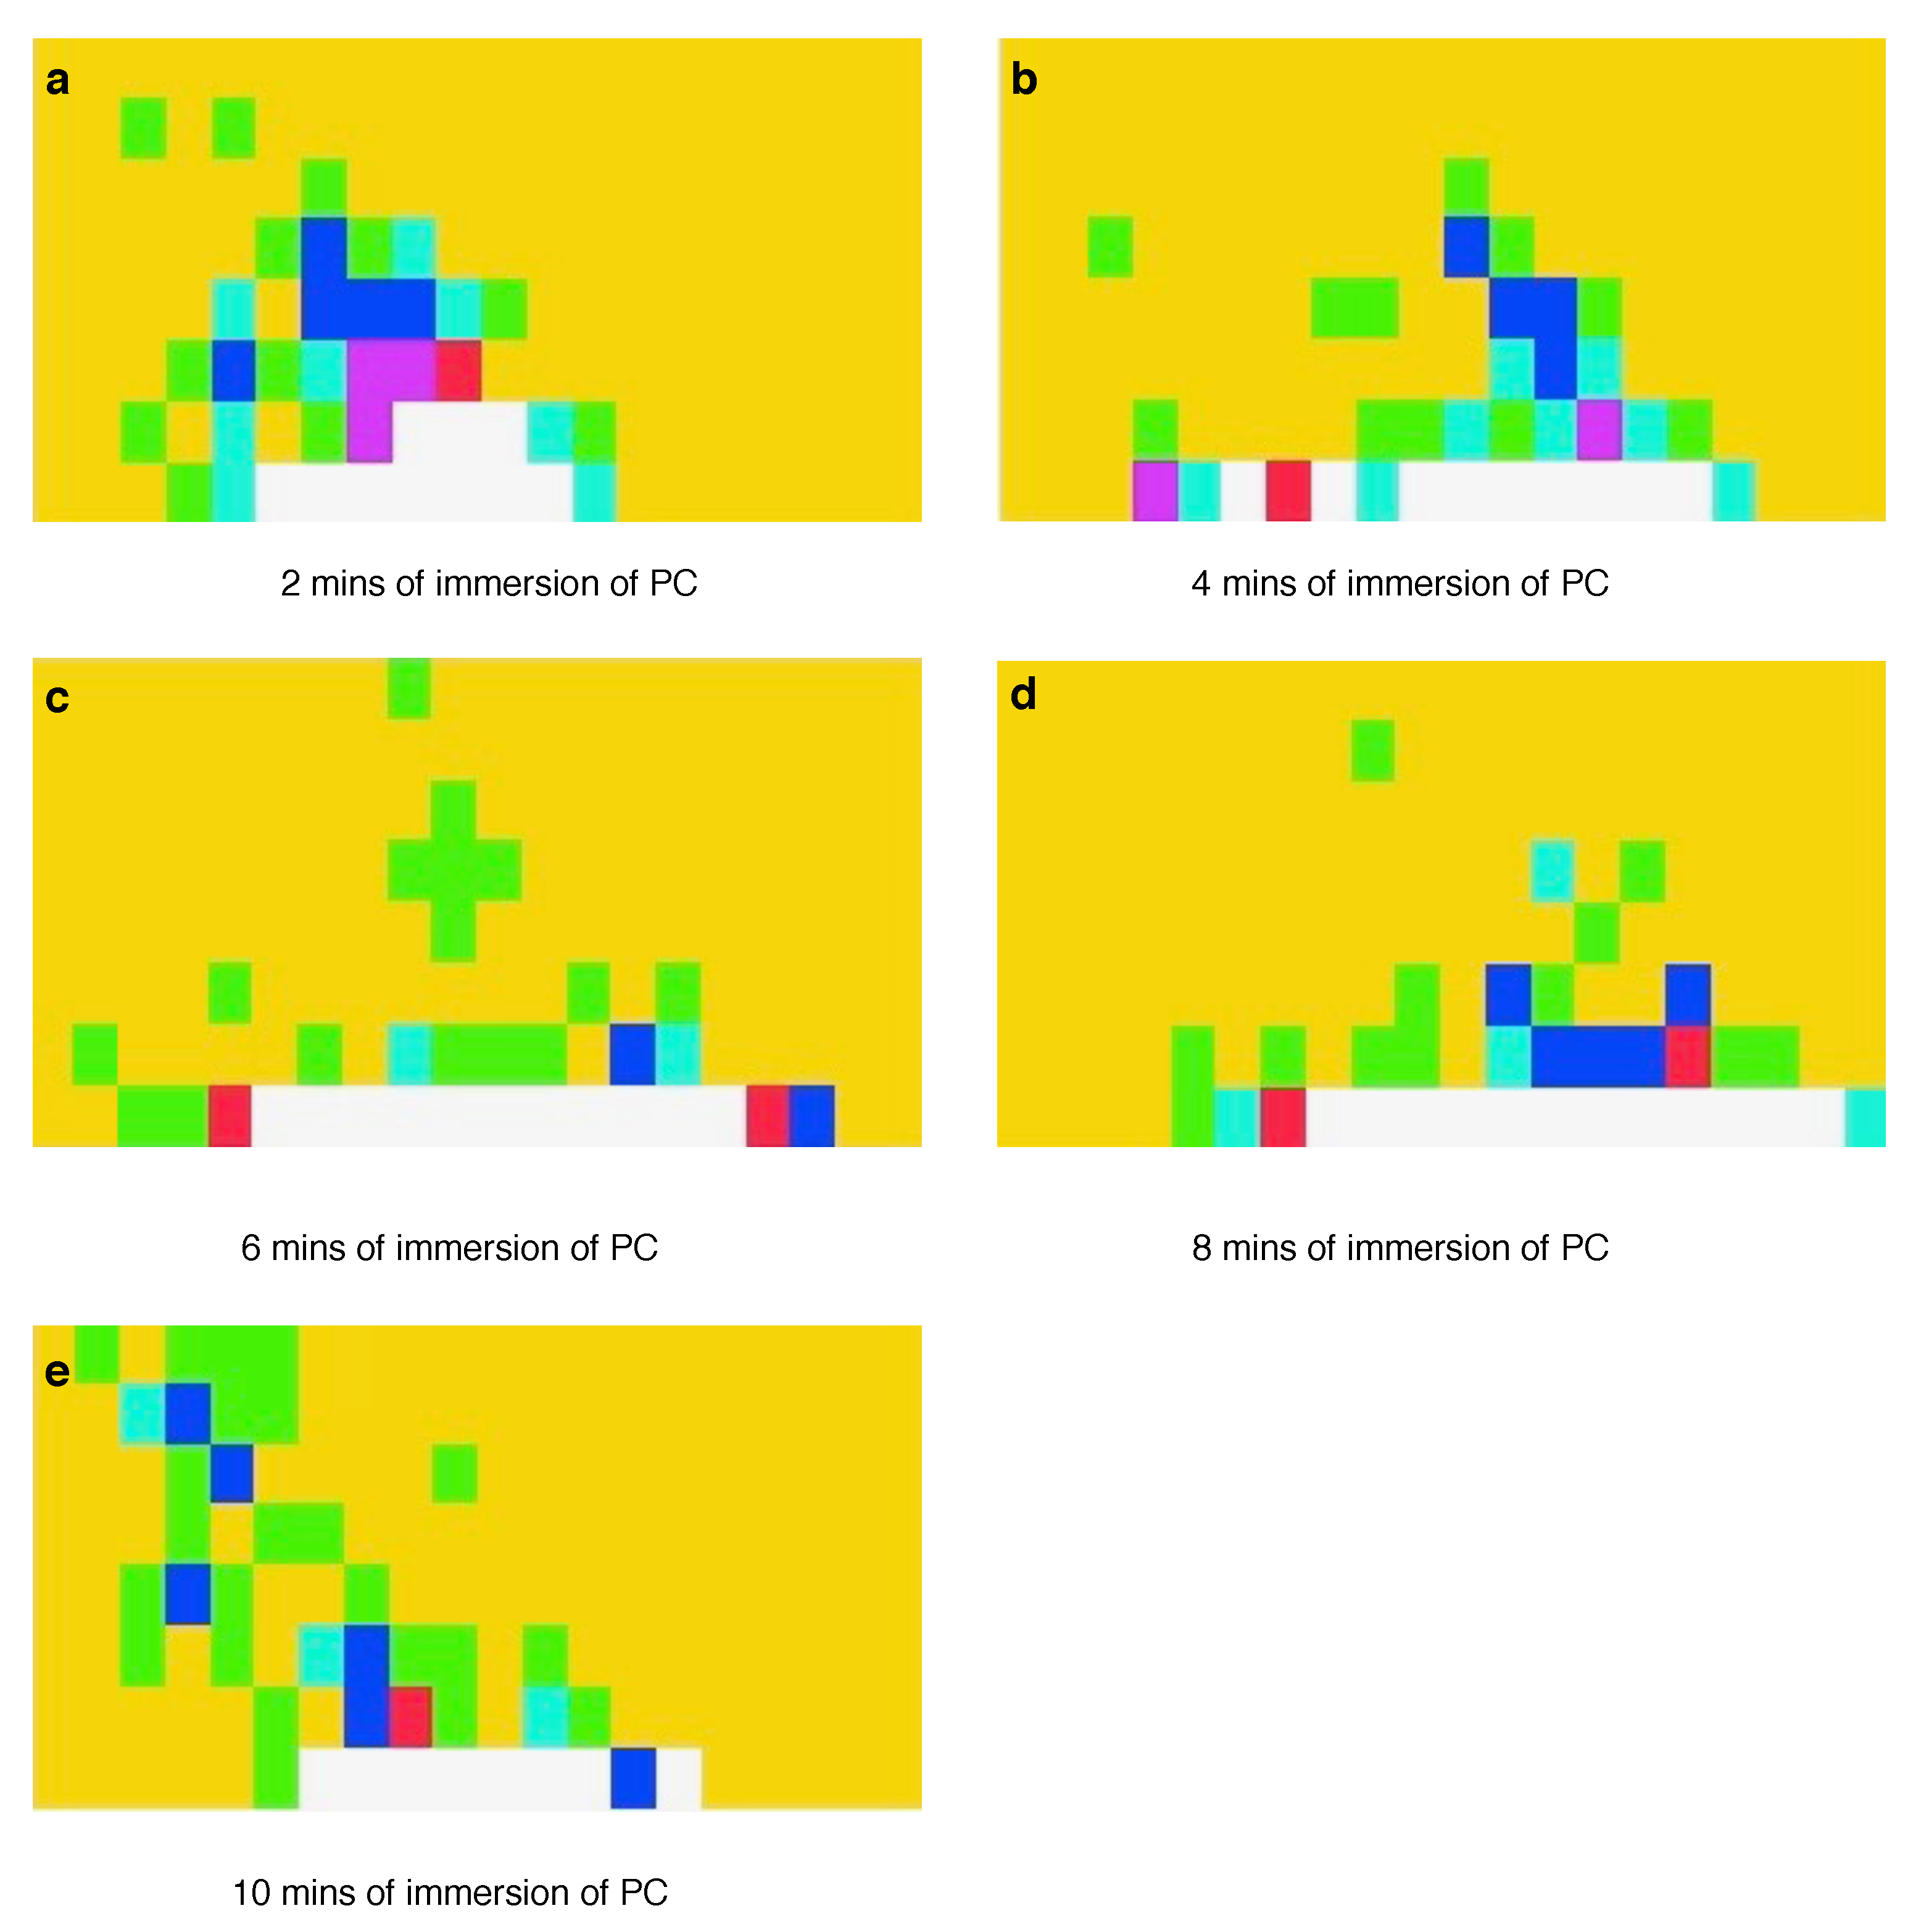
Figure 8.
Visualization of principal component analysis and PCA scores of (a), (b) the crystallized PC surface and (c), (d) copied surface by PDMS.
Figure 8.
Visualization of principal component analysis and PCA scores of (a), (b) the crystallized PC surface and (c), (d) copied surface by PDMS.

Table 1.
Contact Angle Measurement for the Crystallized PC Surface and the Copied PMDS Surface.
| Source | 2 min | 4 min | 6 min | 8 min | 10 min |
|---|---|---|---|---|---|
| PC | |||||
| PDMS |
Table 2.
The number of hills of height greater than 1 m (i.e., spherulites and spherulite-like structures) and valleys (i.e., pores, cavities, etc.) versus immersion time of PC. The decrease in the number of hills indicates the aggregation when the immersion time increases.
Table 2.
The number of hills of height greater than 1 m (i.e., spherulites and spherulite-like structures) and valleys (i.e., pores, cavities, etc.) versus immersion time of PC. The decrease in the number of hills indicates the aggregation when the immersion time increases.
| Immersion Time | Number of Hills | Number of Valleys |
|---|---|---|
| 2 min | 45 | 25 |
| 4 min | 23 | 16 |
| 6 min | 9 | 13 |
| 8 min | 14 | 21 |
Table 3.
The average height and depth of microlevel structures. The nano-structures with height less than 1 m are not considered in the calculation.
Table 3.
The average height and depth of microlevel structures. The nano-structures with height less than 1 m are not considered in the calculation.
| Immersion Time | Average Height of the Hills | Average Depth of the Valleys |
|---|---|---|
| 2 min | 1.72 m | 1.93 m |
| 4 min | 1.83 m | 2.55 m |
| 6 min | 2.06 m | 2.68 m |
| 8 min | 1.86 m | 2.64 m |
| 10 min | 2.29 m | 2.51 m |
Table 4.
The number of fibrils whose height is between 1 and 0.1 m.
| Immersion Time | PC Surface | PDMS Surface |
|---|---|---|
| 2 min | 221 | 98 |
| 4 min | 83 | 81 |
| 6 min | 108 | 23 |
| 8 min | 151 | 21 |
| 10 min | 89 | 9 |
© 2017 by the authors. Licensee MDPI, Basel, Switzerland. This article is an open access article distributed under the terms and conditions of the Creative Commons Attribution (CC BY) license (http://creativecommons.org/licenses/by/4.0/).
Share and Cite
MDPI and ACS Style
Duman, A.N.; Yilbas, B.S.; Pirim, H.; Ali, H. Texture Analysis of Hydrophobic Polycarbonate and Polydimethylsiloxane Surfaces via Persistent Homology. Coatings 2017, 7, 139. https://doi.org/10.3390/coatings7090139
AMA Style
Duman AN, Yilbas BS, Pirim H, Ali H. Texture Analysis of Hydrophobic Polycarbonate and Polydimethylsiloxane Surfaces via Persistent Homology. Coatings. 2017; 7(9):139. https://doi.org/10.3390/coatings7090139
Chicago/Turabian StyleDuman, Ali Nabi, Bekir S. Yilbas, Harun Pirim, and Haider Ali. 2017. "Texture Analysis of Hydrophobic Polycarbonate and Polydimethylsiloxane Surfaces via Persistent Homology" Coatings 7, no. 9: 139. https://doi.org/10.3390/coatings7090139
Note that from the first issue of 2016, this journal uses article numbers instead of page numbers. See further details here.