
Fabrication and Characterization of AlxCoFeNiCu1−x High Entropy Alloys by Laser Metal Deposition


Department of Mechanical Engineering, Missouri University of Science and Technology, Rolla, MO 65409, USA
*
Author to whom correspondence should be addressed.
Coatings 2017, 7(4), 47; https://doi.org/10.3390/coatings7040047
Submission received: 16 December 2016
/
Revised: 18 February 2017
/
Accepted: 21 March 2017
/
Published: 25 March 2017
(This article belongs to the Special Issue High Entropy Alloy Coatings)
Abstract
:High entropy alloys are multicomponent alloys that have at least five different principal elements as alloying elements. Each of these elements has an atomic percentage between 5% and 35%. Typically, they form body-centered cubic (bcc) or face-centered cubic (fcc) structure and are known to possess excellent mechanical properties, corrosion resistance, excellent electric and magnetic properties. Owing to their excellent corrosion and wear resistance, researchers are focusing on employing these materials as coatings. In this research, Laser Metal Deposition (LMD) was used to fabricate AlxCoFeNiCu1−x (x = 0.25, 0.5, 0.75) high entropy alloys from elemental powder based feedstocks. Thin wall claddings fabricated via LMD were characterized by a variety of techniques. Data from X-ray Diffraction (XRD) and Electron Back Scatter Diffraction (EBSD) suggested that with increase in Al content and decrease in Cu content, a change in crystal structure from a predominantly fcc to a combined fcc and bcc structure can be observed. The microstructure of the material was observed to be columnar dendritic. Data from standard less EDS analysis showed that the dendritic phase was Fe and Co enriched while the matrix was Cu and Al enriched in all the considered high entropy alloy fabrications. The Vickers hardness data was used to estimate the mechanical properties of these deposits. Results also showed that with the increase in aluminum content, AlxCoFeNiCu1−x displayed higher hardness. The high hardness values imply potential applications in wear resistant coatings.
1. Introduction
High entropy alloys are novel material systems that exhibit properties much more superior than traditional alloys [1]. The high entropy alloys are made up of at least five different principal elements. Typically, these elements have similar atomic size and each element has an atomic composition between 5% and 35% within the alloy. As the name suggests, the mixing of these principal elements causes a large change in entropy. The large change in entropy promotes these elements to solidify into solid solutions instead of forming complex intermetallic compounds. It has been proven that high entropy alloys are capable of excellent mechanical [2,3], electrical, and, magnetic properties [4]. They are also known to have excellent wear resistance [3], corrosion resistance [2,5] and thermal stability [6].
Over the past few years, studies have been conducted over several high entropy alloy systems. Material systems such as, CoCrCuFeNiTix, AlxNbTiMoV, CoCrFeMnNiVx, AlxCoCrCuFeNi and AlxCoCrFeNi have been investigated [7,8,9,10,11,12]. The fabrication of these materials was performed using production processes such as casting and arc melting. These studies were implemented to systematically study the impact of varying the content of one or more constituent elements on various physical and material properties. Tong et al. [7] synthesized AlxCoCrCuFeNi high entropy alloys with different aluminum content by the arc melting and casting methods. They found that variation in Al content can affect the structure of the resultant solid solution phases. Investigations carried out by Wang et al. [8] and Yang et al. [9] on the AlxCoCrFeNi alloy system also showed that variation in Al caused similar changes in microstructure and mechanical properties. Under the current study, the impact of simultaneously varying Al and Cu content in the AlxCoFeNiCu1−x system was investigated. Unlike most earlier works involving Al, Co, Cu, Ni and Fe elements, in the current study, Laser Metal Deposition (LMD) was used to fabricate these high entropy materials.
LMD deposition is an additive manufacturing technique capable of fabricating complicated structures with superior properties [13,14]. The applications of this technique include coatings, rapid prototyping, tooling, repair, etc. LMD uses a focused laser beam as a heat source to create a melt pool into which powder feedstock is injected. The powder is metallurgically bonded to the substrate through solidification [15]. The authors theorize that it is particularly beneficial to fabricate high entropy alloys by using LMD, owing to the high melt pool temperature and rapid solidification. The high melt pool temperature can be instrumental in overcoming issues of positive enthalpy of mixing and immiscibility. The high cooling rates produce fine grain size and excellent material properties. These attributes of LMD could potentially ensure fabrication of high entropy alloys with fine and homogenous microstructure.
The main goals of this work involved studying the microstructure and mechanical properties of LMD fabricated AlxCoFeNiCu1−x high entropy alloys. The impact of simultaneously varying Al and Cu on phase formation and principal crystal structure was investigated. In this study, 304 Stainless Steel (SS304) was used as the substrate material. The alloy material was fabricated as thin wall claddings and characterized for material properties using optical and Scanning Electron Microscope (SEM) microstructure characterization, hardness testing, X-ray Diffraction (XRD), Energy Dispersive X-ray Spectroscopy (EDS) and Electron Back Scatter Diffraction (EBSD). The hardness data gathered against SS304 substrates was crucial in assessing the potential application of the alloy system as a wear resistant coating.
2. Materials and Methods
2.1. Material Preparation
Under the current study, elemental powders of aluminum, cobalt, iron, nickel and copper were used as precursor materials. Blends of these powders were made by mixing these elements to achieve different compositions of high entropy alloys. The particle size definitions of Al, Co, Fe, Ni, and Cu powders are listed in Table 1. The chemical compositions of these powders are given in Table 2. SS304 was used as the substrate material for these depositions, and substrates were prepared to the dimensions of 2.75 × 2 × 0.25 in.
2.2. Deposition System
In this study, a 1 kW continuous wave fiber laser with a wavelength of 1064 nm was used to deposit the elemental powder blends. A melt pool spot size of approximately 2 mm was obtained through a lens of 750 mm focal length. A ceramic tube nozzle was used in conjuncture with a CNC (Computer Numerical Control) table to facilitate movement and perform deposition. Argon gas was used to implement an inert atmosphere and was also used as a carrier gas to deliver the powder mixture to the melt pool.
2.3. Experimental Procedure
Powders were weighed for desired alloy compositions in a glove box under an argon atmosphere and sealed in bottles. The as-blended atomic percentages of these powder mixtures can be represented by AlxCoFeNiCu1−x, where x = 0.25, 0.5, 0.75. These bottles were then shaken using a Turbula® mixer (Glen Mills Inc., Maywood, NJ, USA) for 20 min to obtain thorough mixing and homogeneity within the powder blends.
A schematic layout of the LMD system is shown in Figure 1. Thin wall claddings were fabricated by performing single melt pool, layer by layer deposition. To ensure perfect bonding, before deposition, a preheat scan was performed by running the laser across the surface of the substrate at 1 kW power and without powder. The preheating process was used to heat up the substrate and rid the surface of the substrate from oxide scale buildup, surface impurities, and, surface imperfections. Laser transverse speed was set at 600 mm/min for all the depositions. The initial 10 layers of deposition carried out a power to 1 kW to ensure perfect bonding with the substrate. The rest of the deposition was carried at a power of 400 W. The same deposition scheme and parameters were used for all the depositions. This was expected to ensure an unbiased comparison between different depositions.
After deposition, vertical transverse sections were cut using a wire Electro-Discharge Machine (wire-EDM, Hansvedt Industries Inc., Rantoul, IL, USA) and mounted in Bakelite for grinding and polishing. Aqua Regia, 30 mL HCl, and 10 mL HNO3 was used for etching. Hirox optical microscope was used to perform microstructure imaging. Helios Nanolab 600 SEM (FEI Company, Hillsboro, OR, USA) equipped with an Oxford Energy Dispersive Spectrometer and HKL Electron Backscatter Diffraction system was used to get the chemical compositions and crystal structure data. The Vickers hardness measurements were performed on the three different compositions using a Struers Duramin micro-hardness tester (Struers Inc., Cleveland, OH, USA). Press load of 9.81 N and load time of 10 s were used during the hardness tests.
3. Results and Discussion
3.1. Theory
The possibility of forming a solid solution can be predicted by the Hume–Rothery rules. Zhang et al. [17,18] have predicted phase formation for the multi-component alloys by calculating parameters Ω and δ. Ω is a parameter that combines effects of ΔSmix and ΔHmix on the stability of multicomponent solid solution, and it is defined as Equation (1). δ is the mean square deviation of the atomic size of elements. It is used to describe the comprehensive effect of atomic size difference in multi-element alloys, and the parameter δ is calculated using Equation (2) [19]. These parameters can be used to predict the possibility of solid-solution formation for multi-component alloys. Per Zhang, when Ω ≥ 1.1 and δ ≤ 6.6%, a stable solid solution would be obtained post solidification [18]
The melting point of n-elements alloy, Tm, is calculated using the rule of mixtures: , where (Tm)i is the melting point of the ith component of alloy. The enthalpy of mixing, ΔHmix, can be determined by the equation, , where is the solution interaction parameter between the ith and jth elements, and and are the mole fractions of the ith and jth component [20]. The remaining parameter, ΔSmix is the entropy of the mixture. It was calculated by following the Boltzmann’s hypotheses, the entropy of mixing of an n-element solution is (assuming they are in the liquid or fully solid solution state) where is mole fraction of component, , and R = 8.314 J/(K·mol) is a gas constant. In Equation (2), n is the number of the components in an alloy system, is the average atomic radius, and is the atomic radius of the ith component [21]
The characteristic parameters of the elements in the AlxCoFeNiCu1−x alloys are tabulated in Table 3 [21]. The mixing enthalpy () of binary alloys are listed below in Table 4 [22]. According to Equations (1) and (2) and the parameters in Table 3 and Table 4, the values of Ω and δ for the compositions considered in this study were calculated and tabulated in Table 5. The values of these parameters for the compositions under consideration were in range for solid solution formation. It shows that the AlxCoFeNiCu1−x (x = 0.25, 0.5, 0.75) alloys should have the high entropy effect and should easily form solid solutions. The high entropy effect should inhibit the formation of intermetallic compounds and promote the formation of solution phases. This is expected to reduce the number of phases and cause much simpler microstructures.
3.2. XRD
XRD tests were used to identify the crystal structure of the deposits. The XRD tests were performed using a XPERT Pro-type diffractometer (PANalytical, Almelo, The Netherlands) with Cu as the anode material. The XRD patterns from the AlxCoFeNiCu1−x (x = 0.25, 0.5, 0.75) deposits are shown in Figure 2. In this figure, the dot (•) is used to represent FCC peak pattern, and clubs (♣) represent the BCC peak pattern. The peak patterns of FCC solid solution were observed in Al0.25CoFeNiCu0.75 and Al0.5CoFeNiCu0.5, while both FCC and BCC structures were present in the Al0.75CoFeNiCu0.25 alloy. The XRD pattern of the Al0.5CoFeNiCu0.5 was similar to that of Al0.25CoFeNiCu0.75. A leftward i.e., lower 2-theta peak shift was seen from Al0.25CoFeNiCu0.75 to Al0.5CoFeNiCu0.5. This shift can be attributed to a decrease in copper content. The estimated values of the lattice parameters for FCC structure were also seen to increase with increasing Al content (Table 6).
From Figure 2, the increase in aluminum and decrease in copper, in Al0.25CoFeNiCu0.75 to Al0.75CoFeNiCu0.25, resulted in a change from complete fcc structure to a combined fcc and bcc structure. Therefore, it can be said that Cu promotes fcc phase formation while Al promotes bcc phase formation. However, it is the author’s belief that, between aluminum and copper, aluminum has a larger impact on causing the change in crystal structure. A substitutional solid solution is possible between elements of similar atomic radius. Among the five constituent elements, aluminum has the largest atomic radius [23]. At lower percentages of aluminum, substitutional solid solution is expected to be feasible. However, aluminum still causes distortion in the lattice structure owing to its larger atomic size [24]. Therefore, at larger percentages of aluminum, a bcc phase would be promoted over a substitutional fcc solid solution.
3.3. Microstructure
Images of transverse sections of the deposit and the substrate obtained from all the three powder mixtures are shown in Figure 3. A minimum of 6 mm height was deposited using each powder mixture.
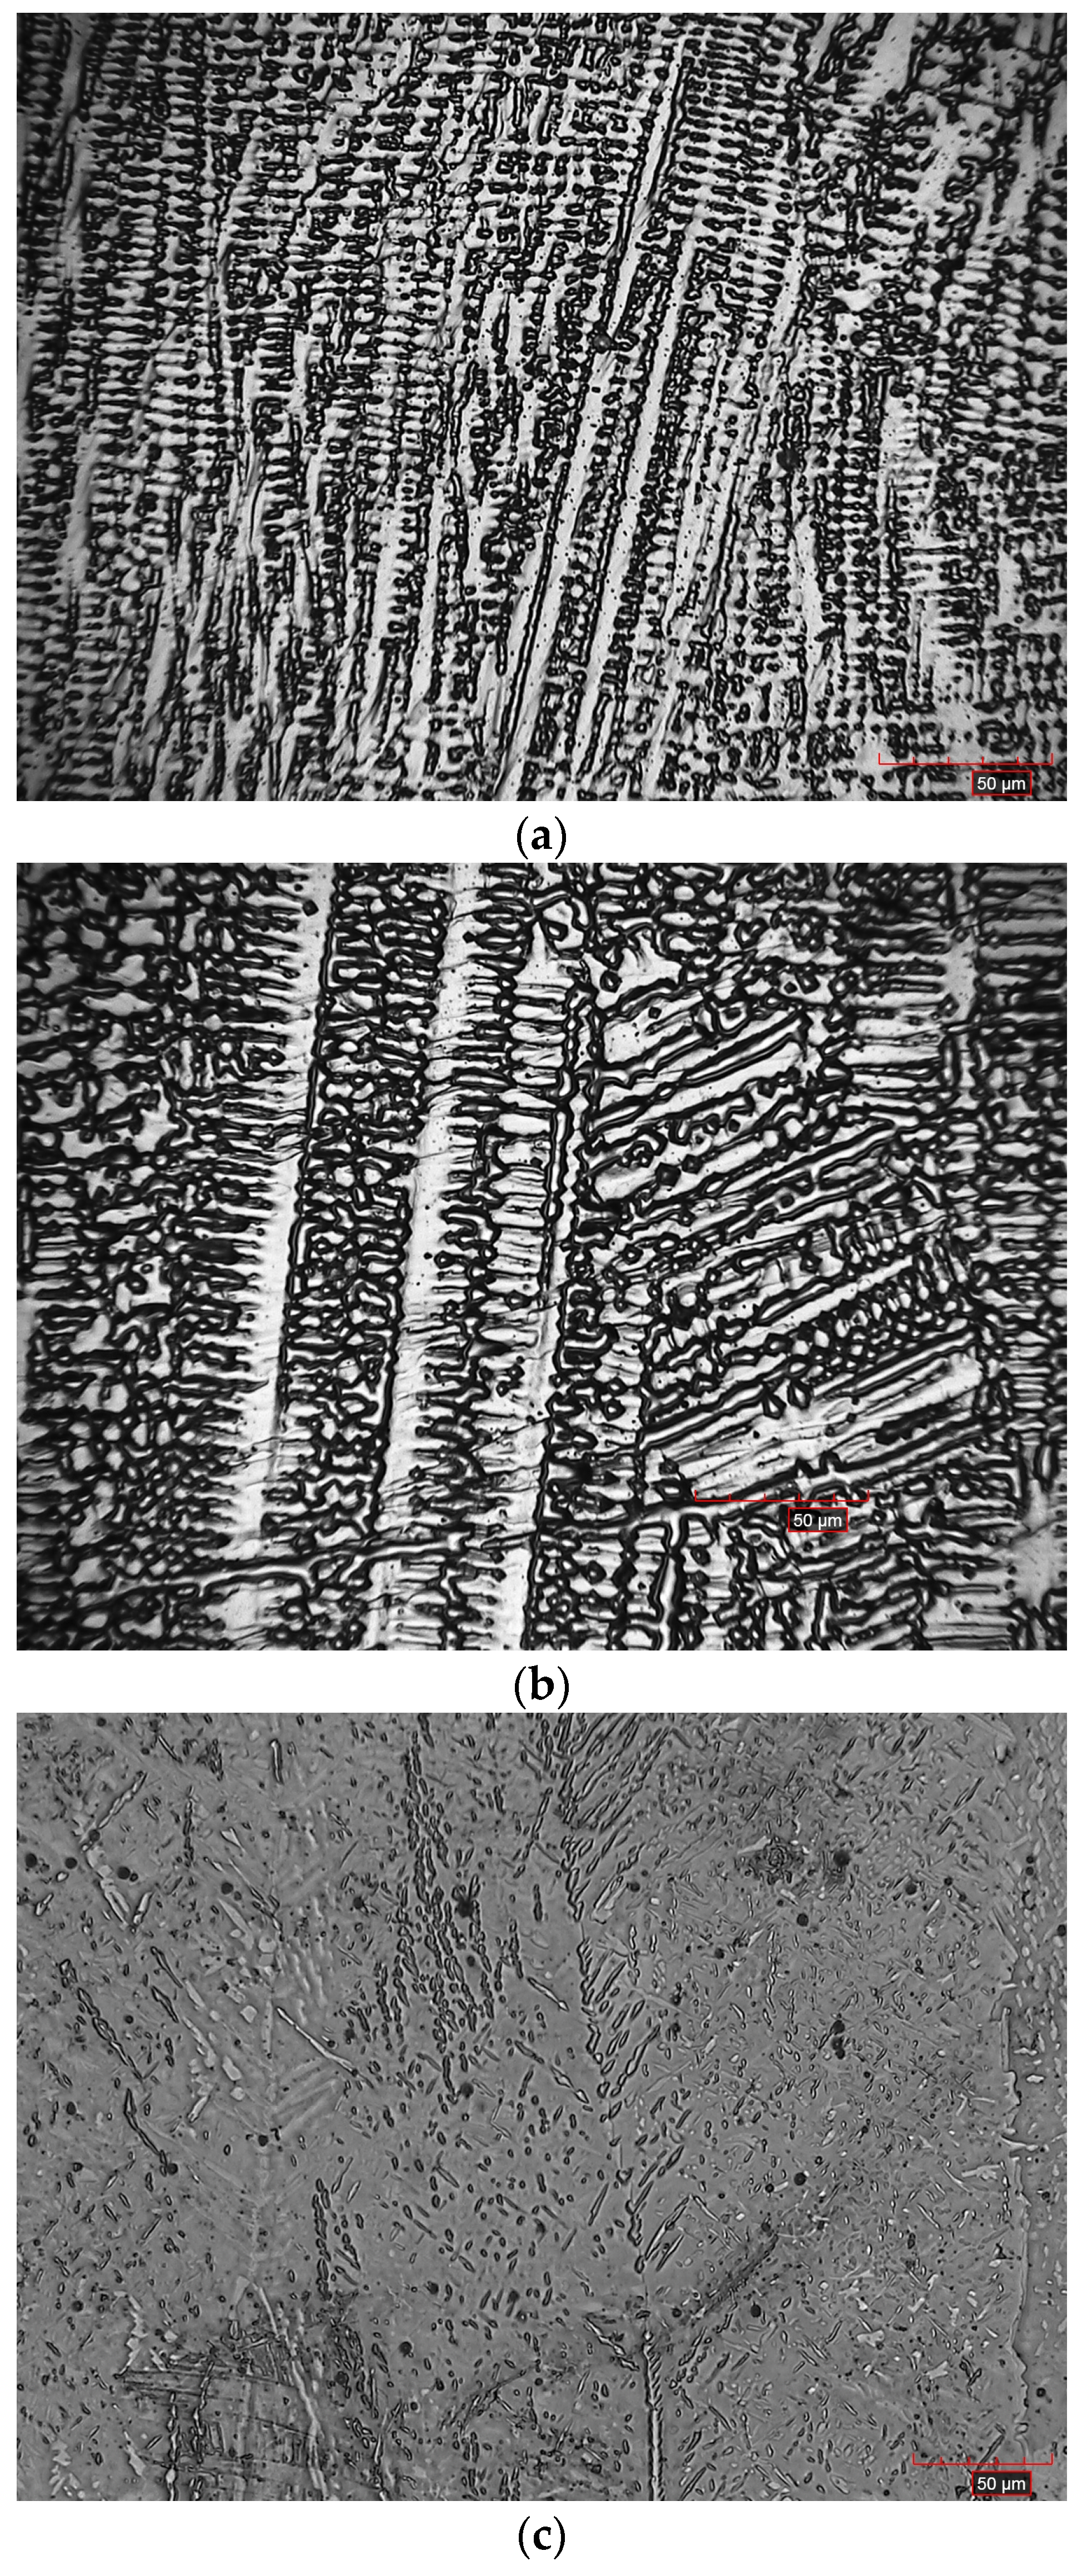
Figure 4a–c shows the etched microstructures of AlxCoFeNiCu1−x (x = 0.25, 0.5, 0.75) high entropy alloys captured under an optical microscope. The etched microstructure of Al0.25CoFeNiCu0.75 was composed of columnar dendritic material. The growth direction of these columnar grains was identified to be along the height of the deposit. This characteristic was expected to be caused by the directional cooling of the LMD process. The Al0.5CoFeNiCu0.5 deposit also had columnar dendritic material. The etched microstructure of Al0.75CoFeNiCu0.25 depicts a dendritic microstructure as well. Coarsening of microstructure can be observed by comparing the dendrites of Al0.25CoFeNiCu0.75 and Al0.5CoFeNiCu0.5. This change can be attributed to the drop in the solidus–liquidus temperature caused by the addition of aluminum (Table 5). Since the power parameters stayed the same for all of the deposits, a decrease in solidus–liquidus temperatures would increase the super heat in the melt pool and would thereby cause a slower cooling rate.
3.4. EBSD and EDS Analyses
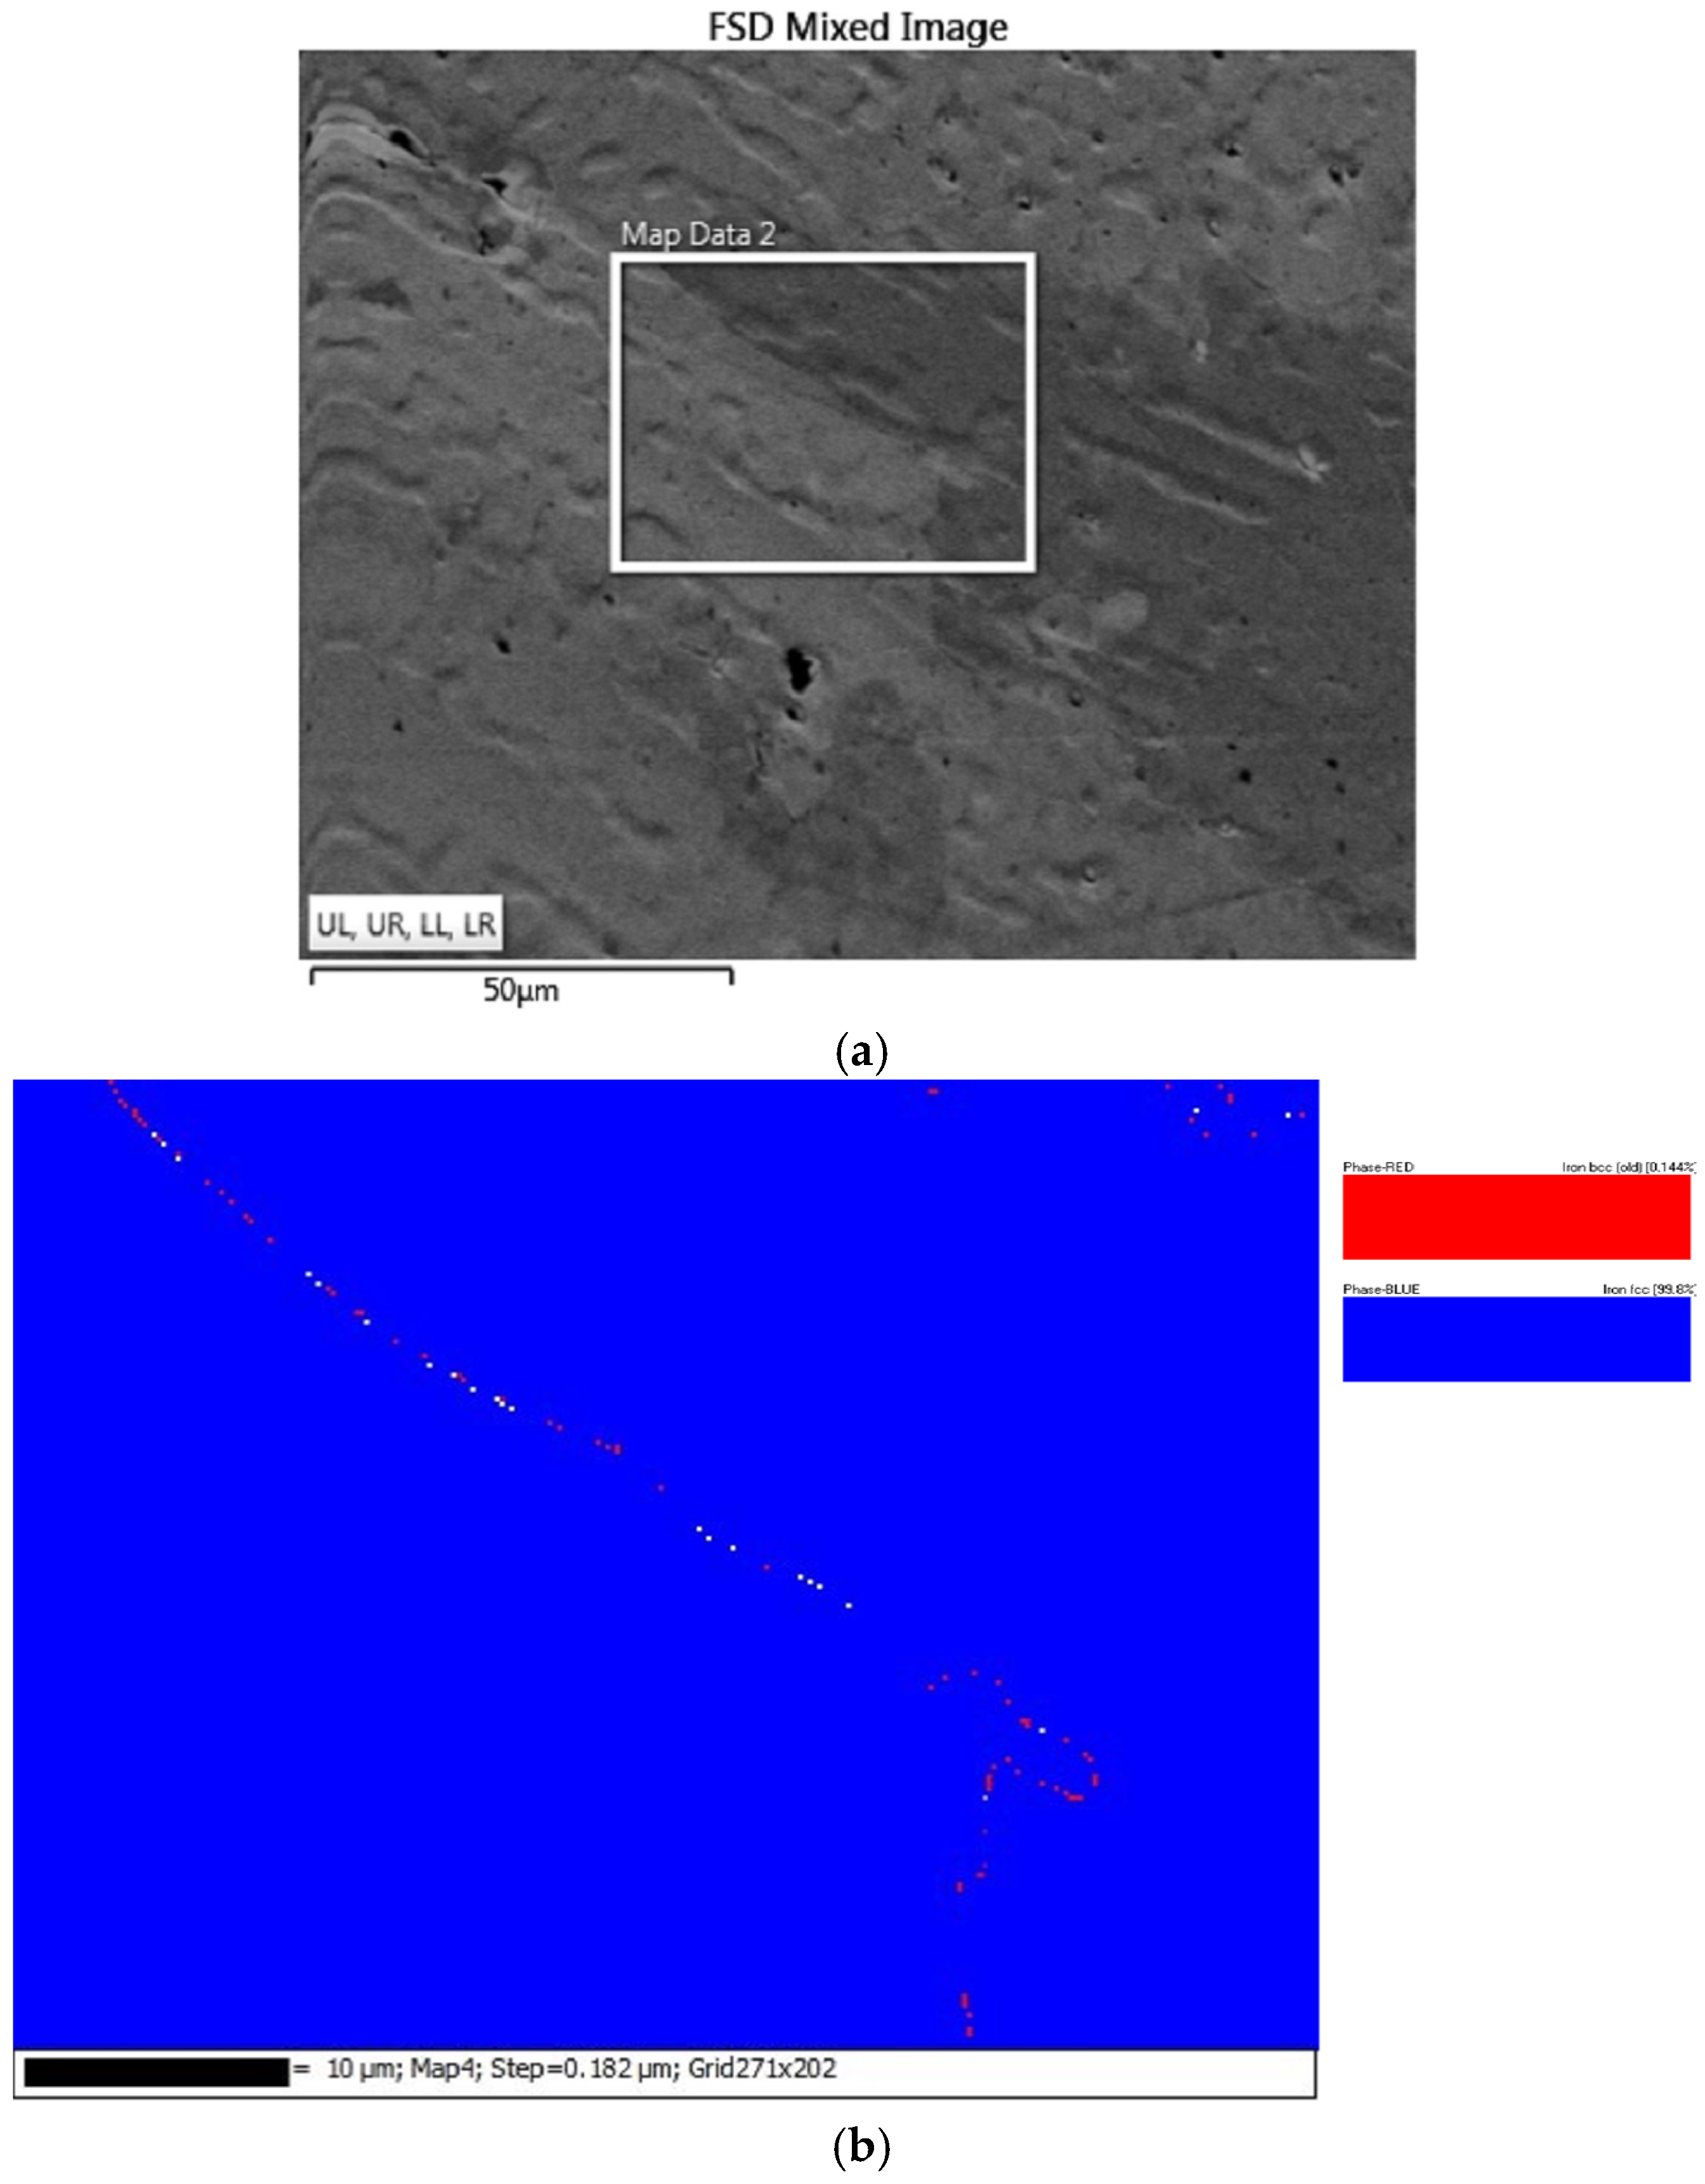
In the aim of further differentiating structure and phase information of the AlxCoFeNiCu1−x (x = 0.25, 0.5, 0.75) alloys, EBSD and EDS measurements were performed. Regions of interest and the phase analyses of Al0.25CoFeNiCu0.75, Al0.5CoFeNiCu0.5 and Al0.75CoFeNiCu0.25 alloys are shown in Figure 5, Figure 6 and Figure 7, respectively. Figure 5 and Figure 6 conclude an fcc crystal structure in the AlxCoFeNiCu1−x (x = 0.25, 0.5) fabrications. Al0.75CoFeNiCu0.25, however, contained both fcc and bcc phases. The phase fractions of fcc and bcc phases for the AlxCoFeNiCu1−x (x = 0.25, 0.5, 0.75) deposits were as listed in Table 7. These results agreed with the conclusions from XRD analysis.
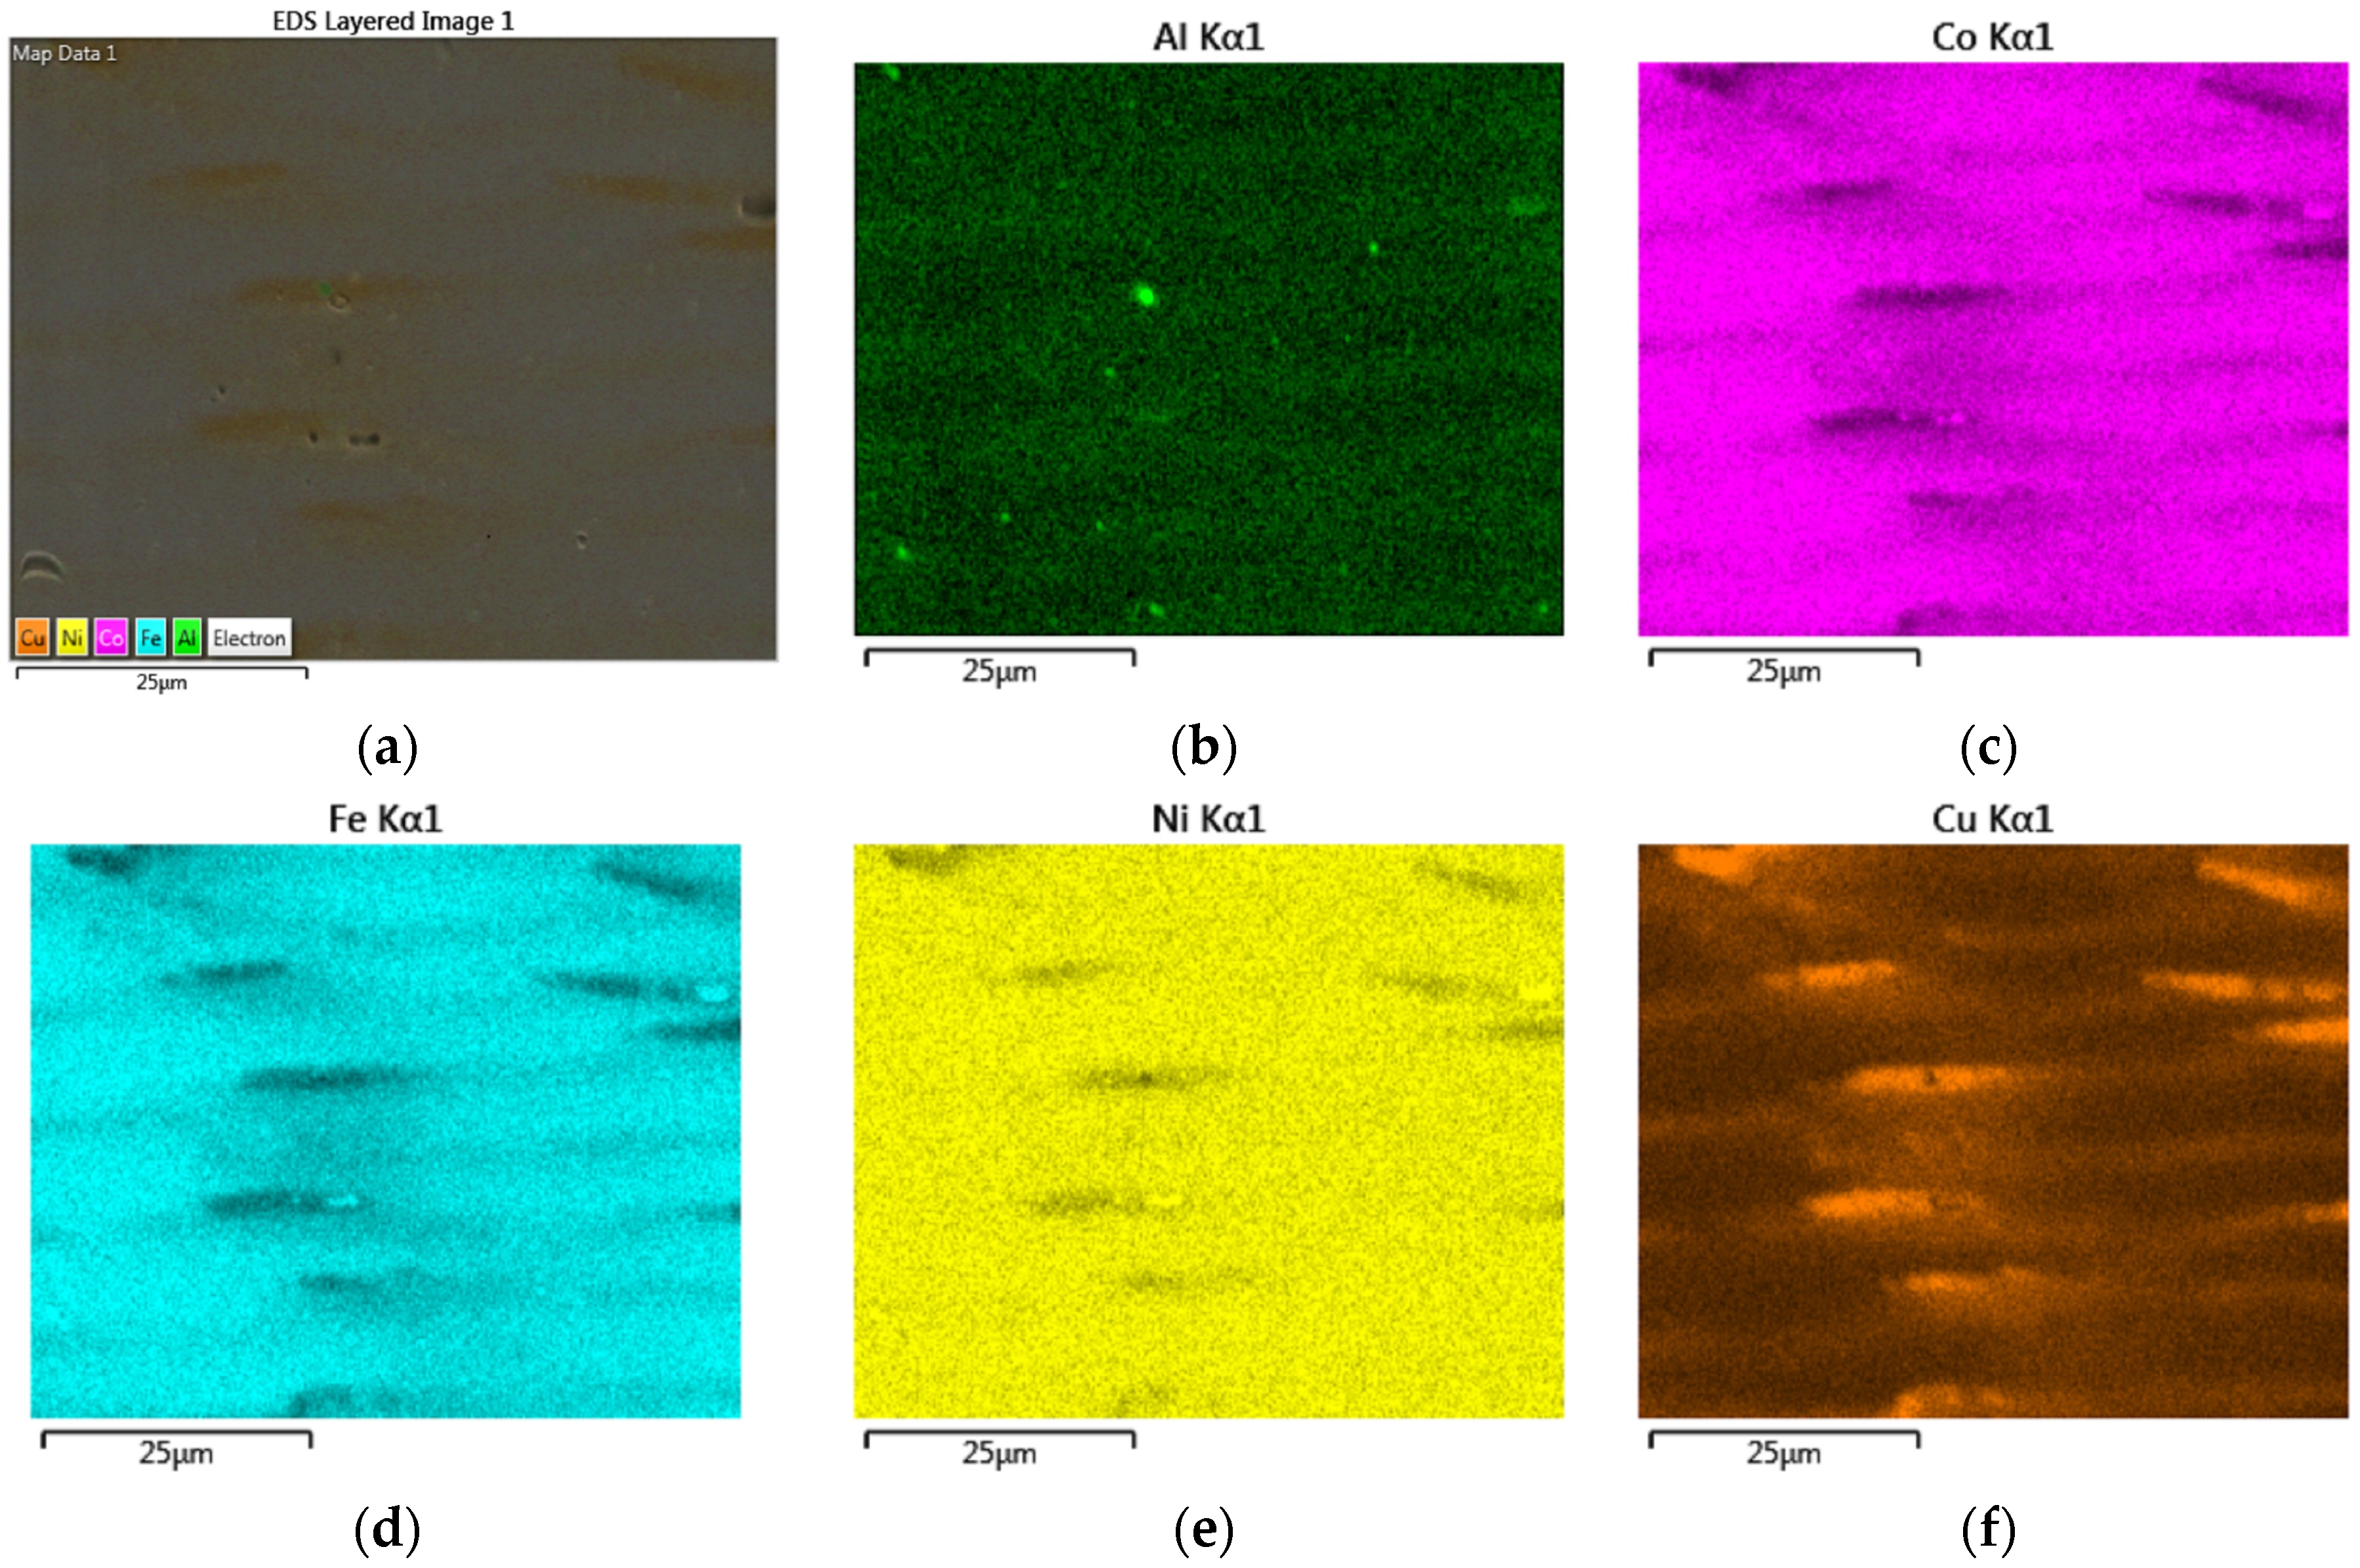
Figure 8, Figure 9 and Figure 10 show the EDS elemental maps obtained from the AlxCoFeNiCu1−x (x = 0.25, 0.5, 0.75) fabrications. The same regions of interest considered in Figure 5, Figure 6 and Figure 7 were used for this EDS analysis. The Fe-Kα, Al-Kα, Ni-Kα, Co-Kα, and Cu-Kα signals were used to estimate the elemental distributions within the regions of interest. Figure 8 indicates that the Al0.25CoFeNiCu0.75 fabrication contained predominantly two phases. The dendritic phase (also seen in Figure 4a) was observed to be Cu and Al deficient, whereas the matrix was Cu and Al rich. The authors theorize that the positive enthalpy of mixing between Cu-Ni, Cu-Fe and Cu-Co is expected to create segregation. This separation persists in the microstructure due to the rapid solidification of LMD process. The Cu and Al deficient fraction having higher proportions of Fe, Co, and Ni would have higher solidus–liquidus temperatures. Therefore, this fraction of the melt pool would solidify first to form the dendritic phase. The matrix being Cu and Al rich would have lower solidus–liquidus temperature values and would, therefore, solidify last. Figure 9 indicates that the Al0.5CoFeNiCu0.5 fabrication also contained predominantly two phases. Like Al0.25CoFeNiCu0.75, the dendritic phase (also seen in Figure 4b) was observed to be Cu and Al deficient, whereas the matrix was Cu and Al rich. However, nickel was observed to be more homogenously distributed in the Al0.5CoFeNiCu0.5 fabrication. This could be attributed to the increase in Al content and the highly negative enthalpy of mixing between Al and Ni. This increase in Al content can also be visualized from the increase in signal in the Al elemental map. From Figure 10, the acquired elemental maps show that the Al0.75CoFeNiCu0.25 alloy was composed of the Fe/Co-rich dendritic phase and Ni/Al-rich matrix. The negative enthalpy of mixing between Al and Ni is expected to cause the Ni enrichment in the matrix. Al was expected to promote bcc phase formation, the EDS elemental map data and the EBSD phase map data have been observed to be in support of this statement. The dendritic phase contained an fcc crystal structure (Al deficient) and the matrix contained a bcc structure (Al rich).
EDS chemistry data was gathered from the dendritic and matrix phases in the microstructures of different alloy compositions. The standard less measurements form the phases and grains (bright and dark regions captured in the Forward Scatter Detector (FSD) mixed images shown in Figure 5a, Figure 6a, and Figure 7a) are shown in Table 8. The variation observed from the elemental maps is again noticed from the values of atomic composition. Minimal variation in chemistry was noticed between the grains seen in the FSD images. The as-blended composition and average composition calculated from each grain were very close for all elements expect for the case of aluminum. This difference could be attributed to the loss of aluminum during transport to the melt pool (Al powder is comparatively very light in weight) and evaporation due to the lower melting and boiling points.
3.5. Vickers Hardness Analysis
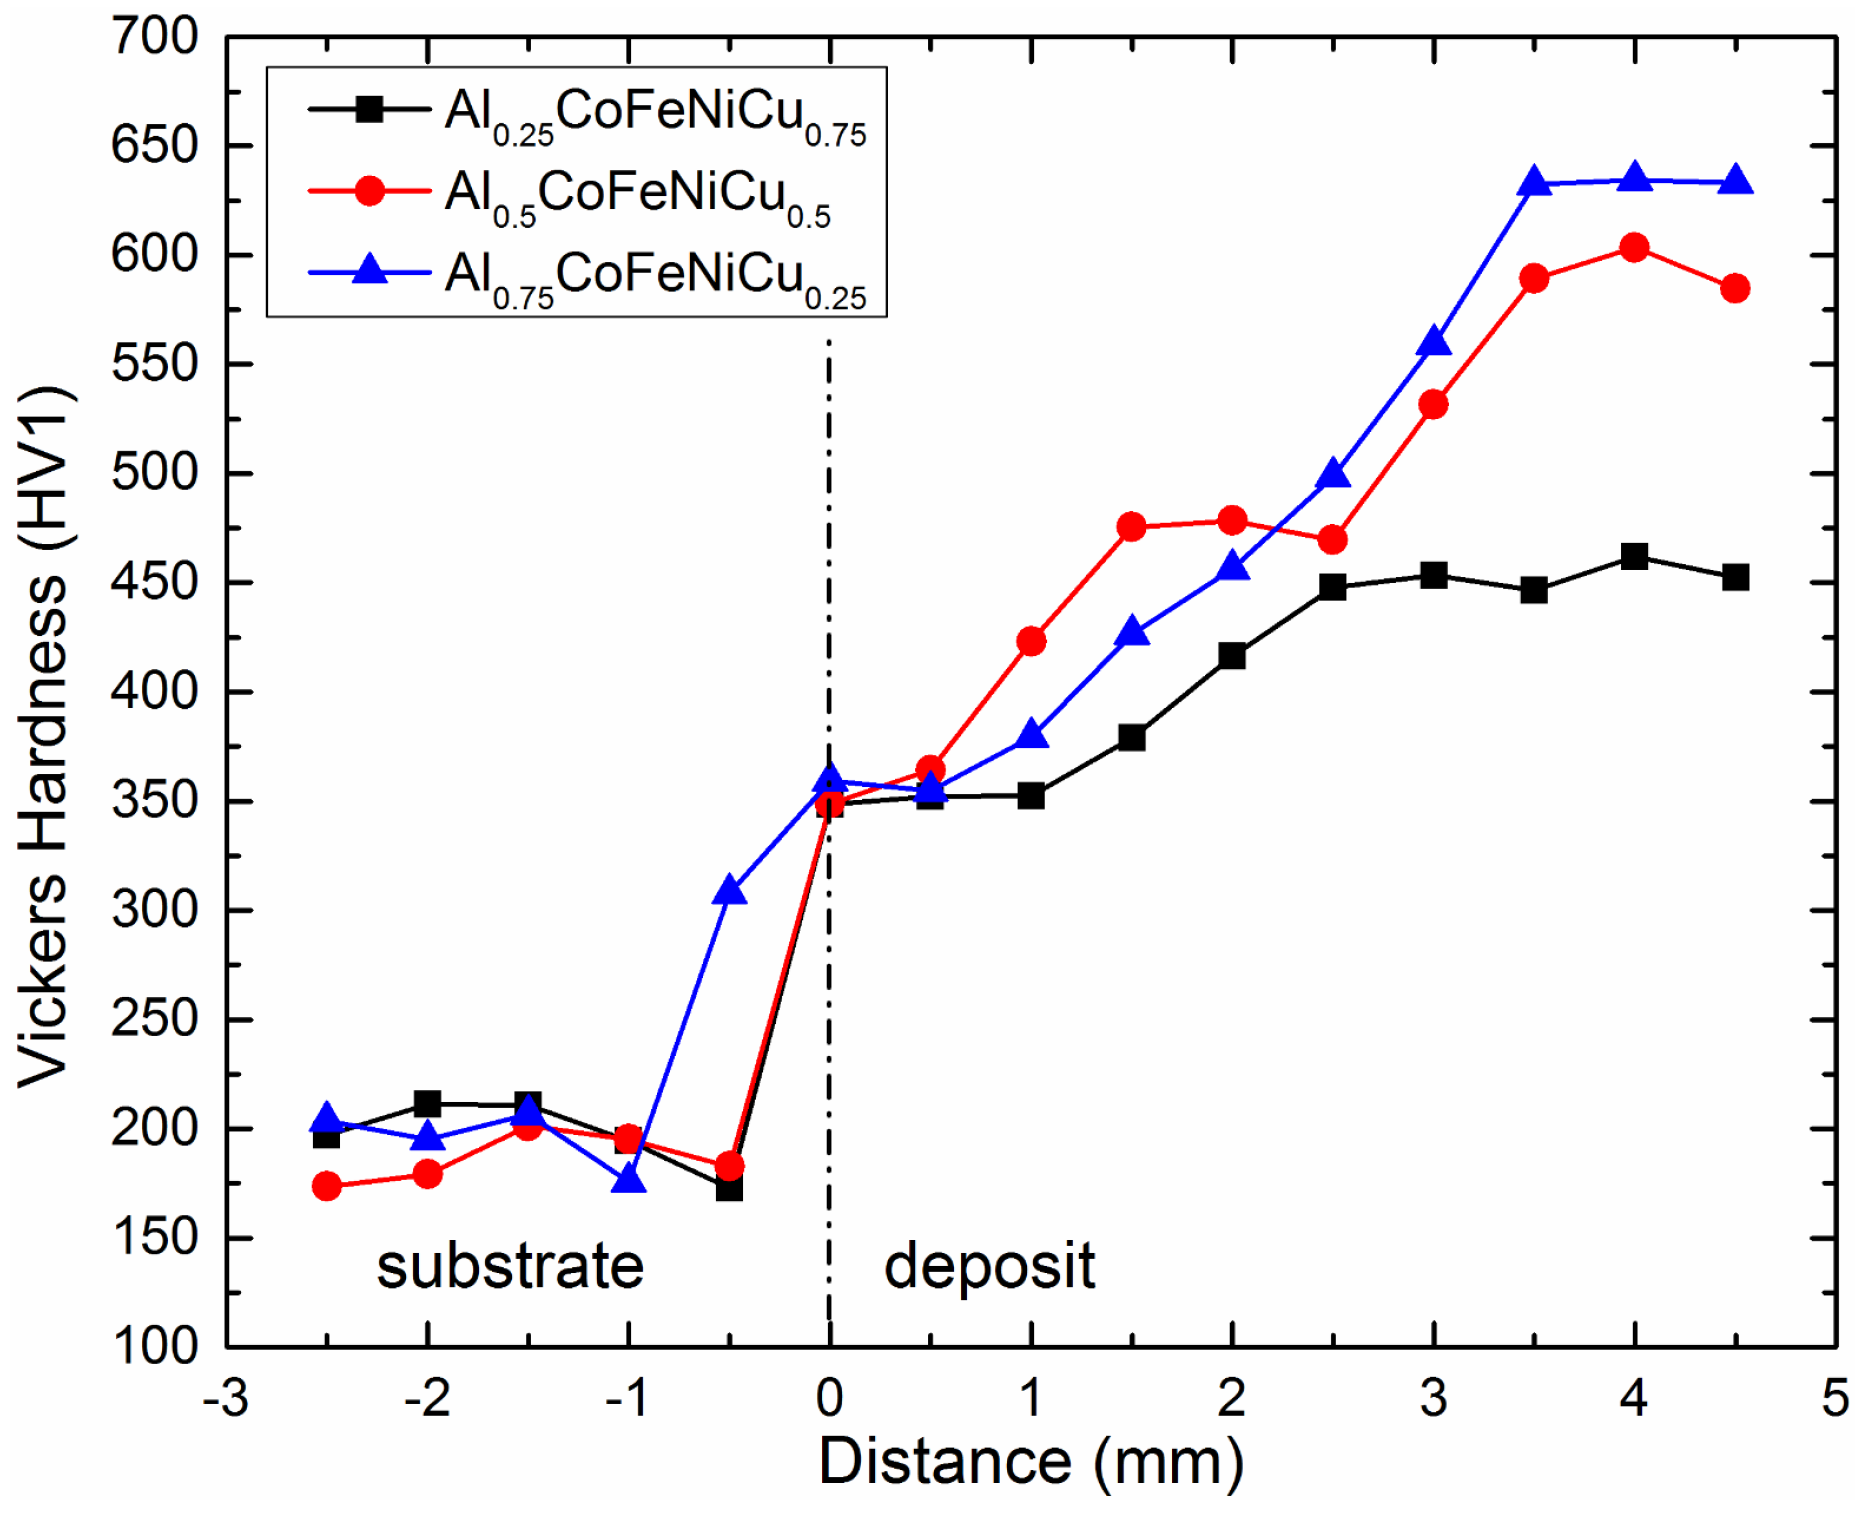
The hardness distribution curves of AlxCoFeNiCu1−x (x = 0.25, 0.5, 0.75) high entropy alloys samples are shown in Figure 11. The hardness curves were gathered along the height of the deposit. Indentations were gathered from the substrate SS304 and continued into the deposit. A fixed spacing of 0.5 mm was used between indentations.
Figure 11 depicts the highest hardness values for the three AlxCoFeNiCu1−x (x = 0.25, 0.5, 0.75) high entropy alloys that were observed around the top regions of the deposits. The maximum hardness values of AlxCoFeNiCu1−x (x = 0.25, 0.5, 0.75) alloys were 462 HV, 603.4 HV and 634.3 HV, respectively.
According to these results, the deposits of AlxCoFeNiCu1−x (x = 0.25, 0.5, 0.75) alloys have an average hardness of 426.3 HV, 519.4 HV, and 541.1 HV, respectively, and these values are much higher than the hardness values of the substrate SS304. This occurrence can be attributed to the effect of rapid cooling during the LMD process. This causes finer microstructure and results in excellent material properties. In addition, due to the differences in elements’ atomic radii, the resultant lattice distortion causes the solid-solution strengthening effect [20,25].
With the increase of the Al content and the decrease of the Cu content, the hardness values of AlxCoFeNiCu1−x (x = 0.25, 0.5, 0.75) were observed to increase. According to the XRD results, Al0.25CoFeNiCu0.75 and Al0.5CoFeNiCu0.5 had a predominantly fcc structure, while Al0.75CoFeNiCu0.25 had a combined fcc + bcc structure. With the increase of Al content, the increased bcc structure is expected to enhance the hardness of the alloys. Higher values of hardness correlate with higher strengths and wear resistance. In comparison to the SS304 substrate, all compositions show larger hardness. Therefore, the current alloy system has the potential application for wear resistant coatings.
4. Conclusions
The current research was implemented to investigate the feasibility of fabricating high entropy alloys of the material system AlxCoFeNiCu1−x (x = 0.25, 0.5, 0.75) via the LMD process. The fabricated material was characterized using techniques such as optical microscopy, electron microscopy, hardness testing, EDS, EBSD and XRD. The conclusions from the analyses include:
- AlxCoFeNiCu1−x (x = 0.25, 0.5, 0.75) high entropy alloys have been successfully fabricated by the LMD technique using blended Al-Co-Fe-Ni-Cu elemental powder as the feedstock.
- XRD analysis revealed Al0.25CoFeNiCu0.75 and Al0.5CoFeNiCu0.5 to have the fcc lattice structure, while Al0.75CoFeNiCu0.25 was composed of both fcc and bcc lattice structure. The lattice parameters of AlxCoFeNiCu1−x (x = 0.25, 0.5, 0.75) alloys were calculated and tabulated, and the increasing Al content resulted in an increase in lattice parameters of fcc structure.
- AlxCoFeNiCu1−x (x = 0.25, 0.5, 0.75) fabrications contained columnar dendritic microstructure;
- Results from EBSD analysis validated that Al0.25CoFeNiCu0.75 and Al0.5CoFeNiCu0.5 were predominantly fcc in structure, and Al0.75CoFeNiCu0.25 was constituted of fcc and bcc lattice structure.
- EDS elemental maps of AlxCoFeNiCu1−x (x = 0.25, 0.5, 0.75) fabrications showed the dendritic phase was Fe and Co enriched, whereas the matrix was Cu and Al enriched.
- AlxCoFeNiCu1−x (x = 0.25, 0.5, 0.75) alloys had an average Vickers hardness of 426.3 HV, 519.4 HV and 541.1 HV, respectively. With the increase of Al content, a higher hardness was observed. Large amounts of Al are expected to cause severe lattice distortion, and this is expected to strengthen the solid solution and result in the high values of hardness.
- The high hardness prompts a potential application in wear resistant coatings.
Acknowledgments
The authors would like to thank the support from NSF (National Science Foundation) grants CMMI-1547042 (Civil, Mechanical and Manufacturing Innovation) and CMMI-1625736. The support from the Intelligent Systems Center (ISC) and Material Research Center (MRC) for the help in sample preparation and test is also appreciated.
Author Contributions
For this research article, Xueyang Chen designed and performed the experiments, and analyzed the data and wrote the manuscript; Lei Yan assisted in revising figures; Sreekar Karnati assisted in paper review; Yunlu Zhang assisted in SEM analysis; and Frank Liou guided the direction of the research.
Conflicts of Interest
The authors declare no conflict of interest.
References
- Katakam, S.; Joshi, S.S.; Mridha, S.; Mukherjee, S.; Dahotrea, N.B. Laser assisted high entropy alloy coating on aluminum Microstructural evolution. J. Appl. Phys. 2014, 116, 104906. [Google Scholar] [CrossRef]
- Zhang, H.; Pan, Y.; He, Y.-Z. Synthesis and characterization of FeCoNiCrCu high-entropy alloy coating by laser cladding. Mater. Des. 2011, 32, 1910–1915. [Google Scholar] [CrossRef]
- Zhang, S.; Wu, C.L.; Yi, J.Z.; Zhang, C.H. Synthesis and characterization of FeCoCrAlCu high-entropy alloy coating by laser surface alloying. Surf. Coat. Technol. 2015, 262, 64–69. [Google Scholar] [CrossRef]
- Zhang, H.; Pana, Y.; He, Y.; Jiao, H. Microstructure and properties of 6FeNiCoSiCrAlTi high-entropy alloy coating prepared by laser cladding. Appl. Surf. Sci. 2011, 257, 2259–2263. [Google Scholar] [CrossRef]
- Qiu, X.-W. Microstructure and properties of AlCrFeNiCoCu high entropy alloy prepared by powder metallurgy. J. Alloys Compd. 2013, 555, 246–249. [Google Scholar] [CrossRef]
- Wang, W.-R.; Wang, W.-L.; Yeh, J.-W. Phases, microstructure and mechanical properties of AlxCoCrFeNi high-entropy alloys at elevated temperatures. J. Alloys Compd. 2014, 589, 143–152. [Google Scholar] [CrossRef]
- Tong, C.-J.; Chen, Y.-L.; Yeh, J.-W.; Lin, S.-J.; Chen, S.-K.; Shun, T.-T.; Tsau, C.-H.; Chang, S.-Y. Microstructure characterization of AlxCoCrCuFeNi high-entropy alloy system with multiprincipal elements. Metall. Mater. Trans. 2005, 36, 881–893. [Google Scholar] [CrossRef]
- Wang, W.-R.; Wang, W.-L.; Wang, S.-C.; Tsai, Y.-C.; Lai, C.-H.; Yeh, J.-W. Effects of Al addition on the microstructure and mechanical property of AlxCoCrFeNi high-entropy alloys. Intermetallics 2012, 26, 44–51. [Google Scholar] [CrossRef]
- Yang, T.; Xia, S.; Liu, S.; Wang, C.; Liu, S.; Zhang, Y.; Xue, J.; Yan, S.; Wang, Y. Effects of AL addition on microstructure and mechanical properties of AlxCoCrFeNi High-entropy alloy. Mater. Sci. Eng. A 2015, 648, 15–22. [Google Scholar] [CrossRef]
- Wang, X.F.; Zhang, Y.; Qiao, Y.; Chen, G.L. Novel microstructure and properties of multicomponent CoCrCuFeNiTix alloys. Intermetallics 2007, 15, 357–362. [Google Scholar] [CrossRef]
- Chen, S.Y.; Yang, X.; Dahmen, K.A.; Liaw, P.K.; Zhang, Y. Microstructures and Crackling Noise of AlxNbTiMoV High Entropy Alloys. Entropy 2014, 16, 870–884. [Google Scholar] [CrossRef]
- Stepanov, N.D.; Shaysultanov, D.G.; Salishchev, G.A.; Tikhonovsky, M.A.; Oleynik, E.E.; Tortika, A.S.; Senkov, O.N. Effect of V content on microstructure and mechanical properties of the CoCrFeMnNiVx high entropy alloys. J. Alloys Compd. 2015, 628, 170–185. [Google Scholar] [CrossRef]
- Chuna, C.K.; Leong, K.F.; Lim, C.S. Rapid Prototyping: Principles and Applications, 2nd ed.; World Scientific: Singapore, Singapore, 2003. [Google Scholar]
- Unocic, R.R.; DuPont, J.N. Composition control in the direct laser deposition process. Metall. Mater. Trans. 2003, 34, 439–445. [Google Scholar] [CrossRef]
- Gedda, H.; Kaplan, A.; Powell, J. Melt-solid interactions in laser cladding and laser casting. Metall. Mater. Trans. 2005, 36, 683–689. [Google Scholar] [CrossRef]
- Yan, L.; Chen, X.; Li, W.; Newkirk, J.; Liou, F. Direct laser deposition of Ti-6Al-4V from elemental powder blends. Rapid Prototyp. J. 2016, 22, 810–816. [Google Scholar] [CrossRef]
- Zhang, Y.; Zhou, Y.J.; Lin, J.P.; Chen, G.L.; Liaw, P.K. Solid-Solution Phase Formation Rules for Multi-component Alloys. Adv. Mater. Eng. 2008, 10, 534–538. [Google Scholar] [CrossRef]
- Yang, X.; Zhang, Y. Prediction of high-entropy stabilized solid-solution in multi-component alloys. Mater. Chem. Phys. 2012, 132, 233–238. [Google Scholar] [CrossRef]
- Fang, S.S.; Xiao, X.S.; Xia, L.; Li, W.H.; Dong, Y.D. Relationship between the widths of supercooled liquid regions and bond parameters of Mg-based bulk metallic glasses. J. Non-Cryst. Solids 2003, 321, 120–125. [Google Scholar] [CrossRef]
- Takeuchi, A.; Inoue, A. Quantitative evaluation of critical cooling rate for metallic glasses. Mater. Sci. Eng. 2001, 304, 446–451. [Google Scholar] [CrossRef]
- Kittel, C. Introduction to Solid State Physics, 8th ed.; John Wiley & Sons, Inc.: Hoboken, NJ, USA, 2004. [Google Scholar]
- Takeuchi, A.; Inoue, A. Classification of Bulk Metallic Glasses by Atomic Size Difference, Heat of Mixing and Period of Constituent Elements and Its Application to Characterization of the Main Alloying Element. Mater. Trans. 2005, 46, 2817–2829. [Google Scholar] [CrossRef]
- Wang, Y.P.; Li, B.S.; Ren, M.X.; Yang, C.; Fu, H.Z. Microstructure and compressive properties of AlCrFeCoNi high entropy alloy. Mater. Sci. Eng. A 2008, 491, 154–158. [Google Scholar] [CrossRef]
- Tung, C.-C.; Yeh, J.-W.; Shun, T.-T.; Chen, S.-K.; Huang, Y.-S.; Chen, H.-C. On the elemental effect of AlCoCrCuFeNi high-entropy alloy system. Mater. Lett. 2007, 61, 1–5. [Google Scholar] [CrossRef]
- Hsu, U.S.; Hung, U.D.; Yeh, J.W.; Chen, S.K.; Huang, Y.S.; Yang, C.C. Alloying behavior of iron, gold and silver in AlCoCrCuNi-based equimolar high-entropy alloys. Mater. Sci. Eng. A 2007, 92, 403–408. [Google Scholar] [CrossRef]
Figure 1.
Schematic layout of the Laser Metal Deposition (LMD) system [16].
Figure 1.
Schematic layout of the Laser Metal Deposition (LMD) system [16].
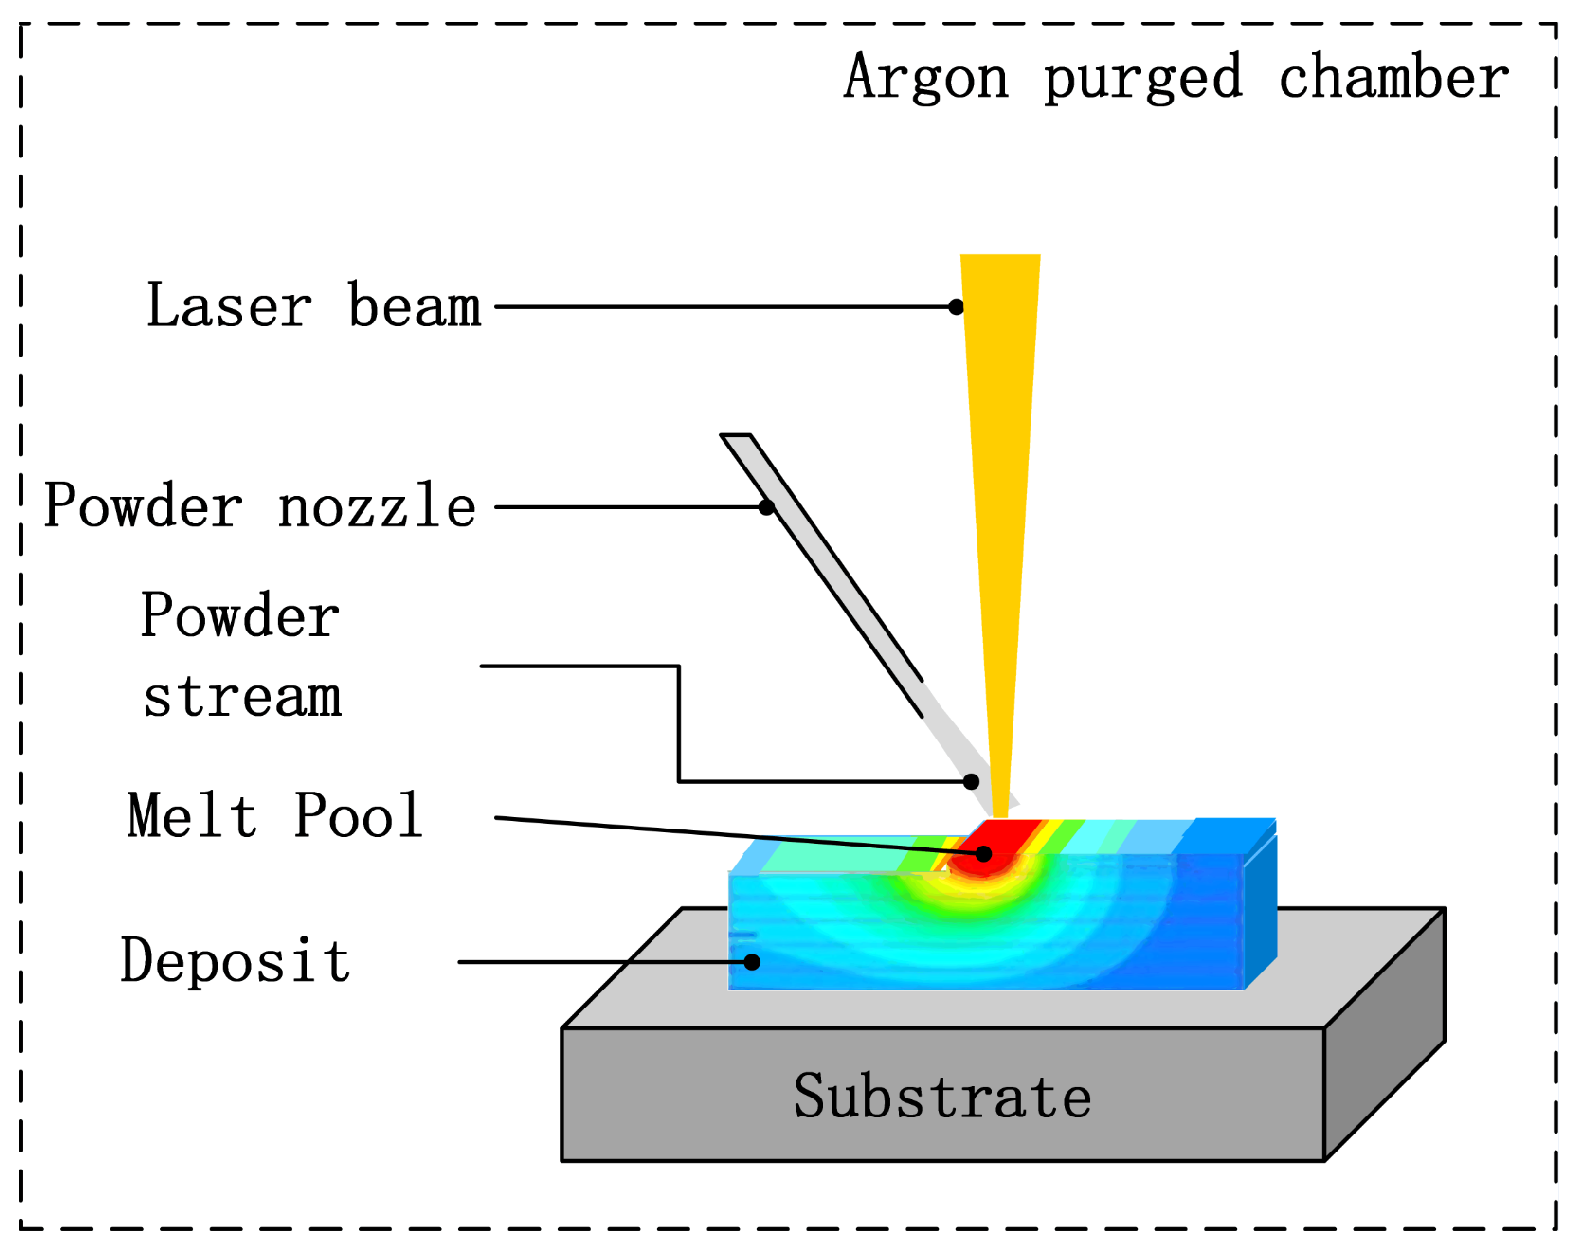
Figure 2.
The XRD patterns of the AlxCoFeNiCu1−x (x = 0.75, 0.5, 0.25) alloys, dot (•) represents the fcc peak pattern, and clubs (♣) represents the bcc peak pattern.
Figure 2.
The XRD patterns of the AlxCoFeNiCu1−x (x = 0.75, 0.5, 0.25) alloys, dot (•) represents the fcc peak pattern, and clubs (♣) represents the bcc peak pattern.
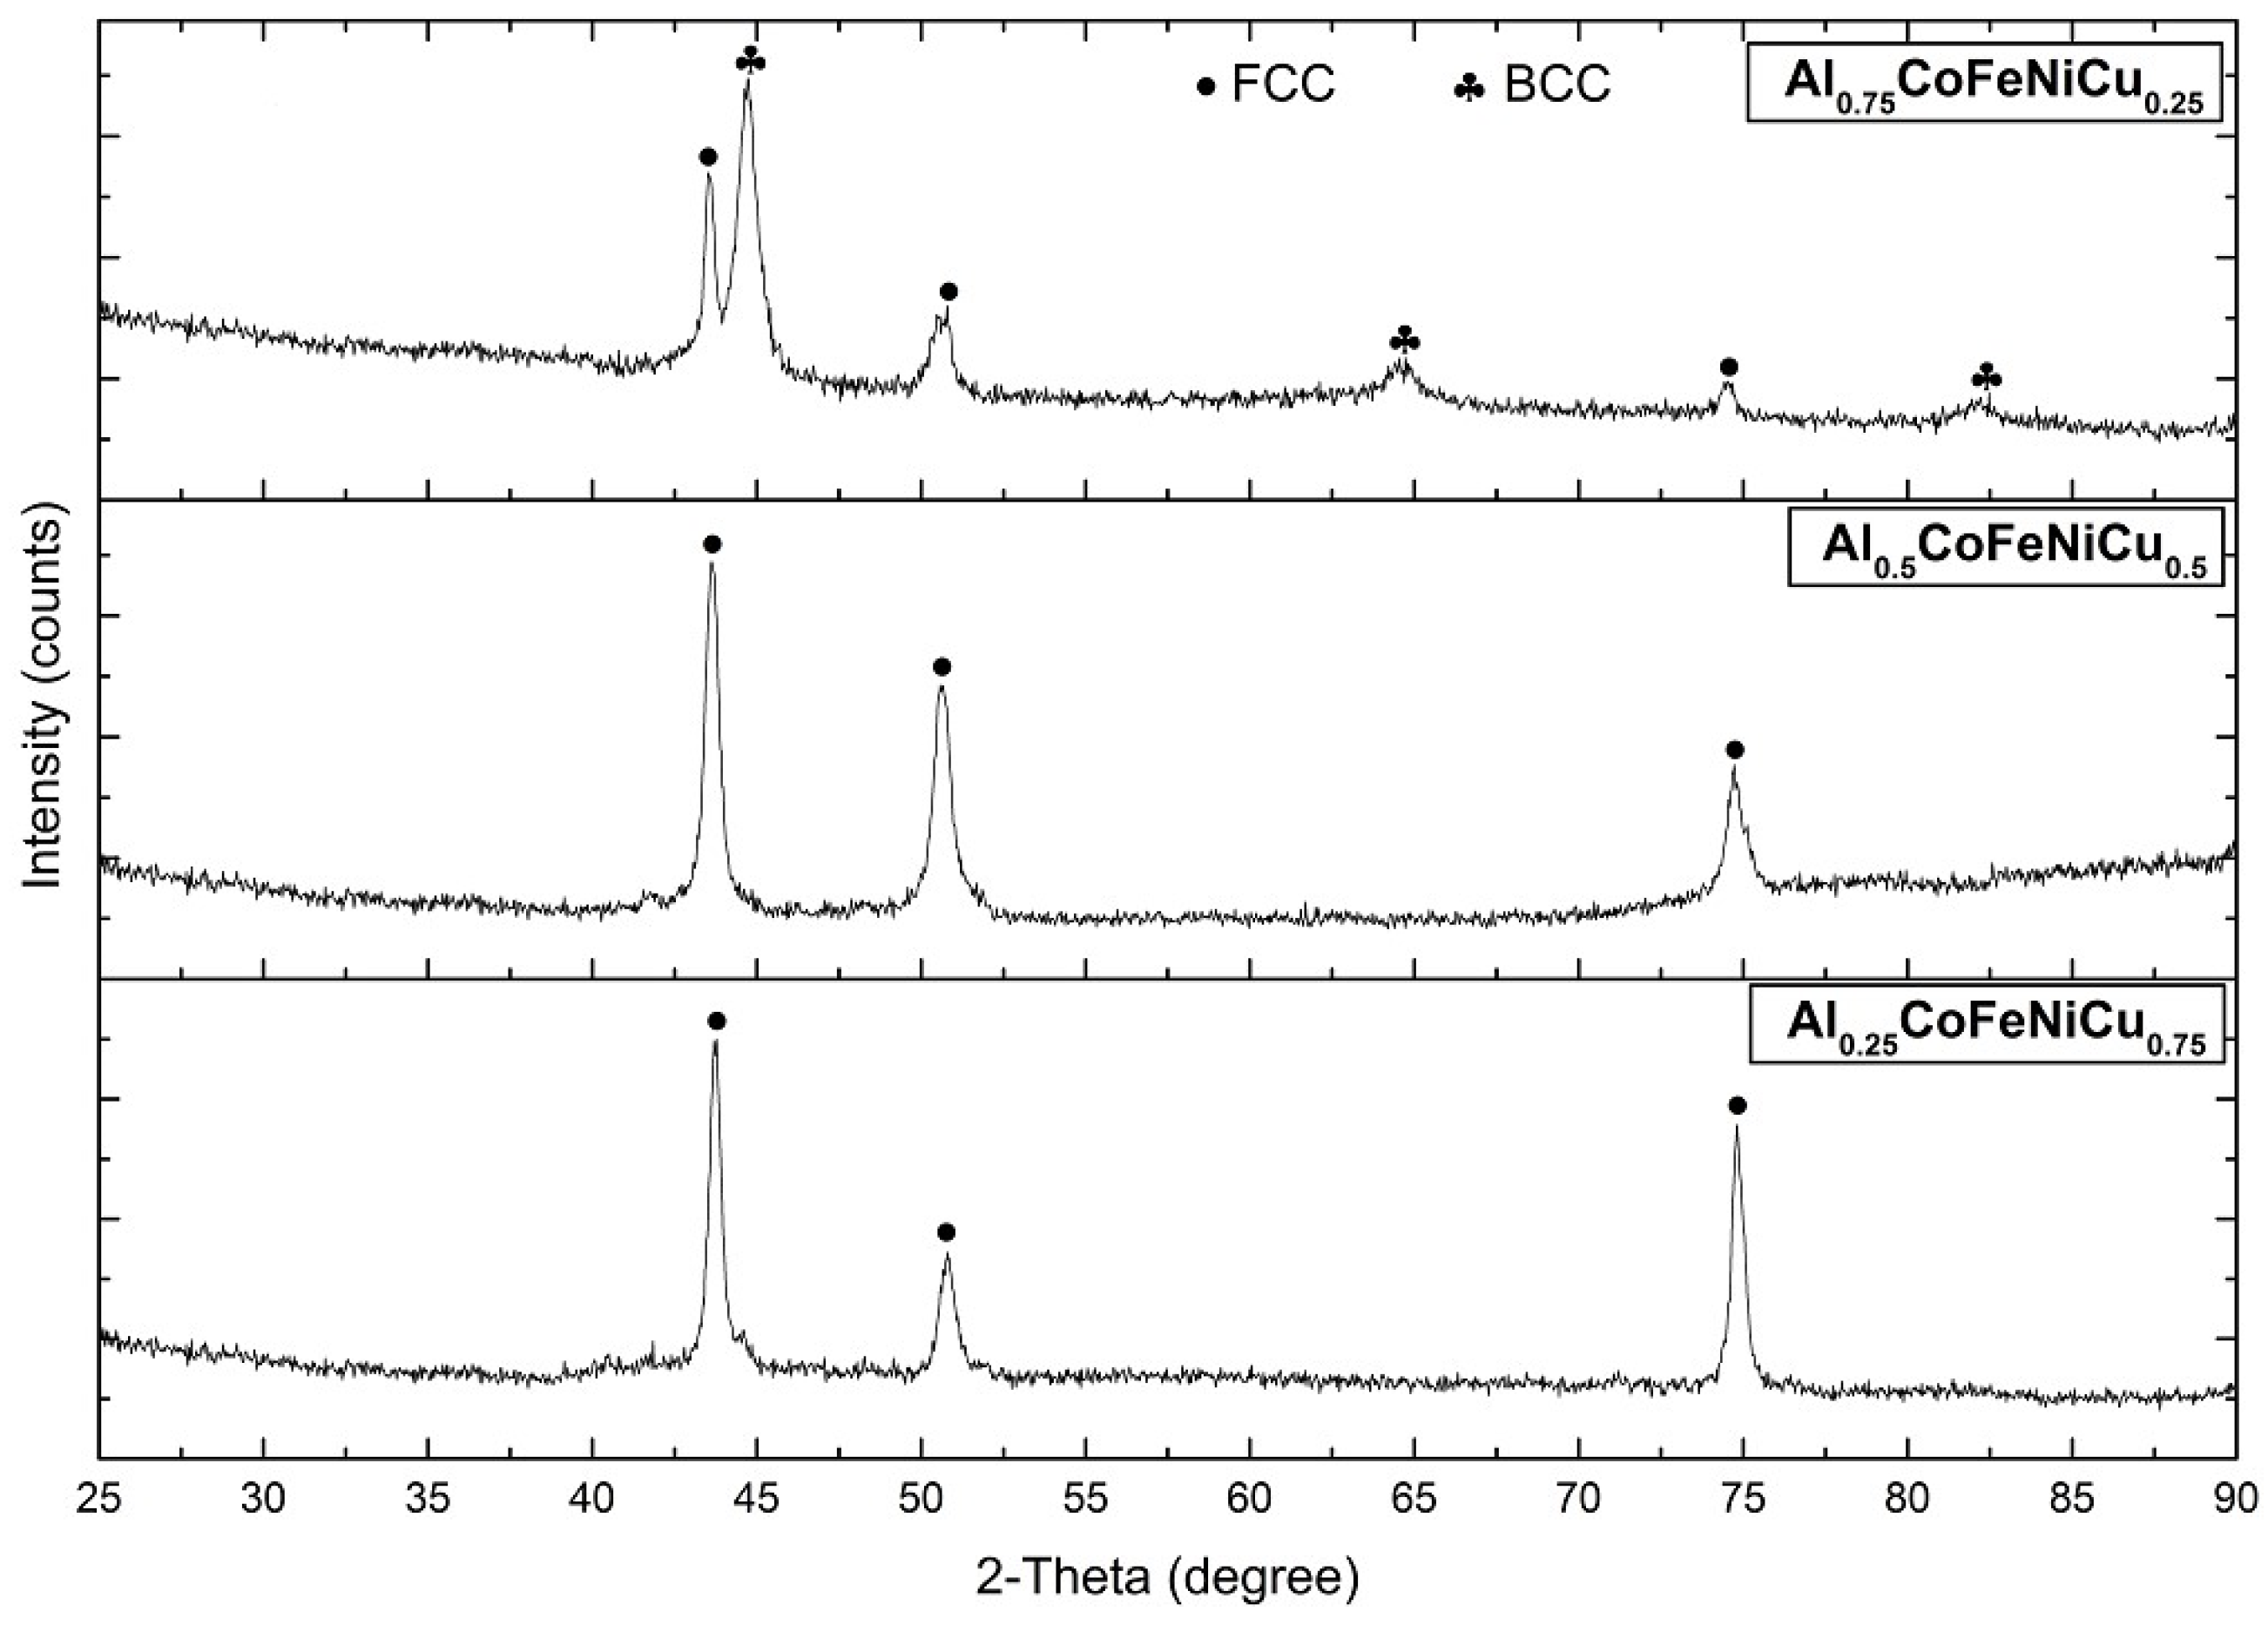
Figure 3.
Optical microstructural images of polished and etched transverse sections of all the AlxCoFeNiCu1−x (x = 0.25, 0.5, 0.75) high entropy alloy deposits. (a) Transverse section of the Al0.25CoFeNiCu0.75 alloy and SS304 substrate; (b) Transverse section of the Al0.5CoFeNiCu0.5 alloy and SS304 substrate; (c) Transverse section of the Al0.75CoFeNiCu0.25 alloy and SS304 substrate.
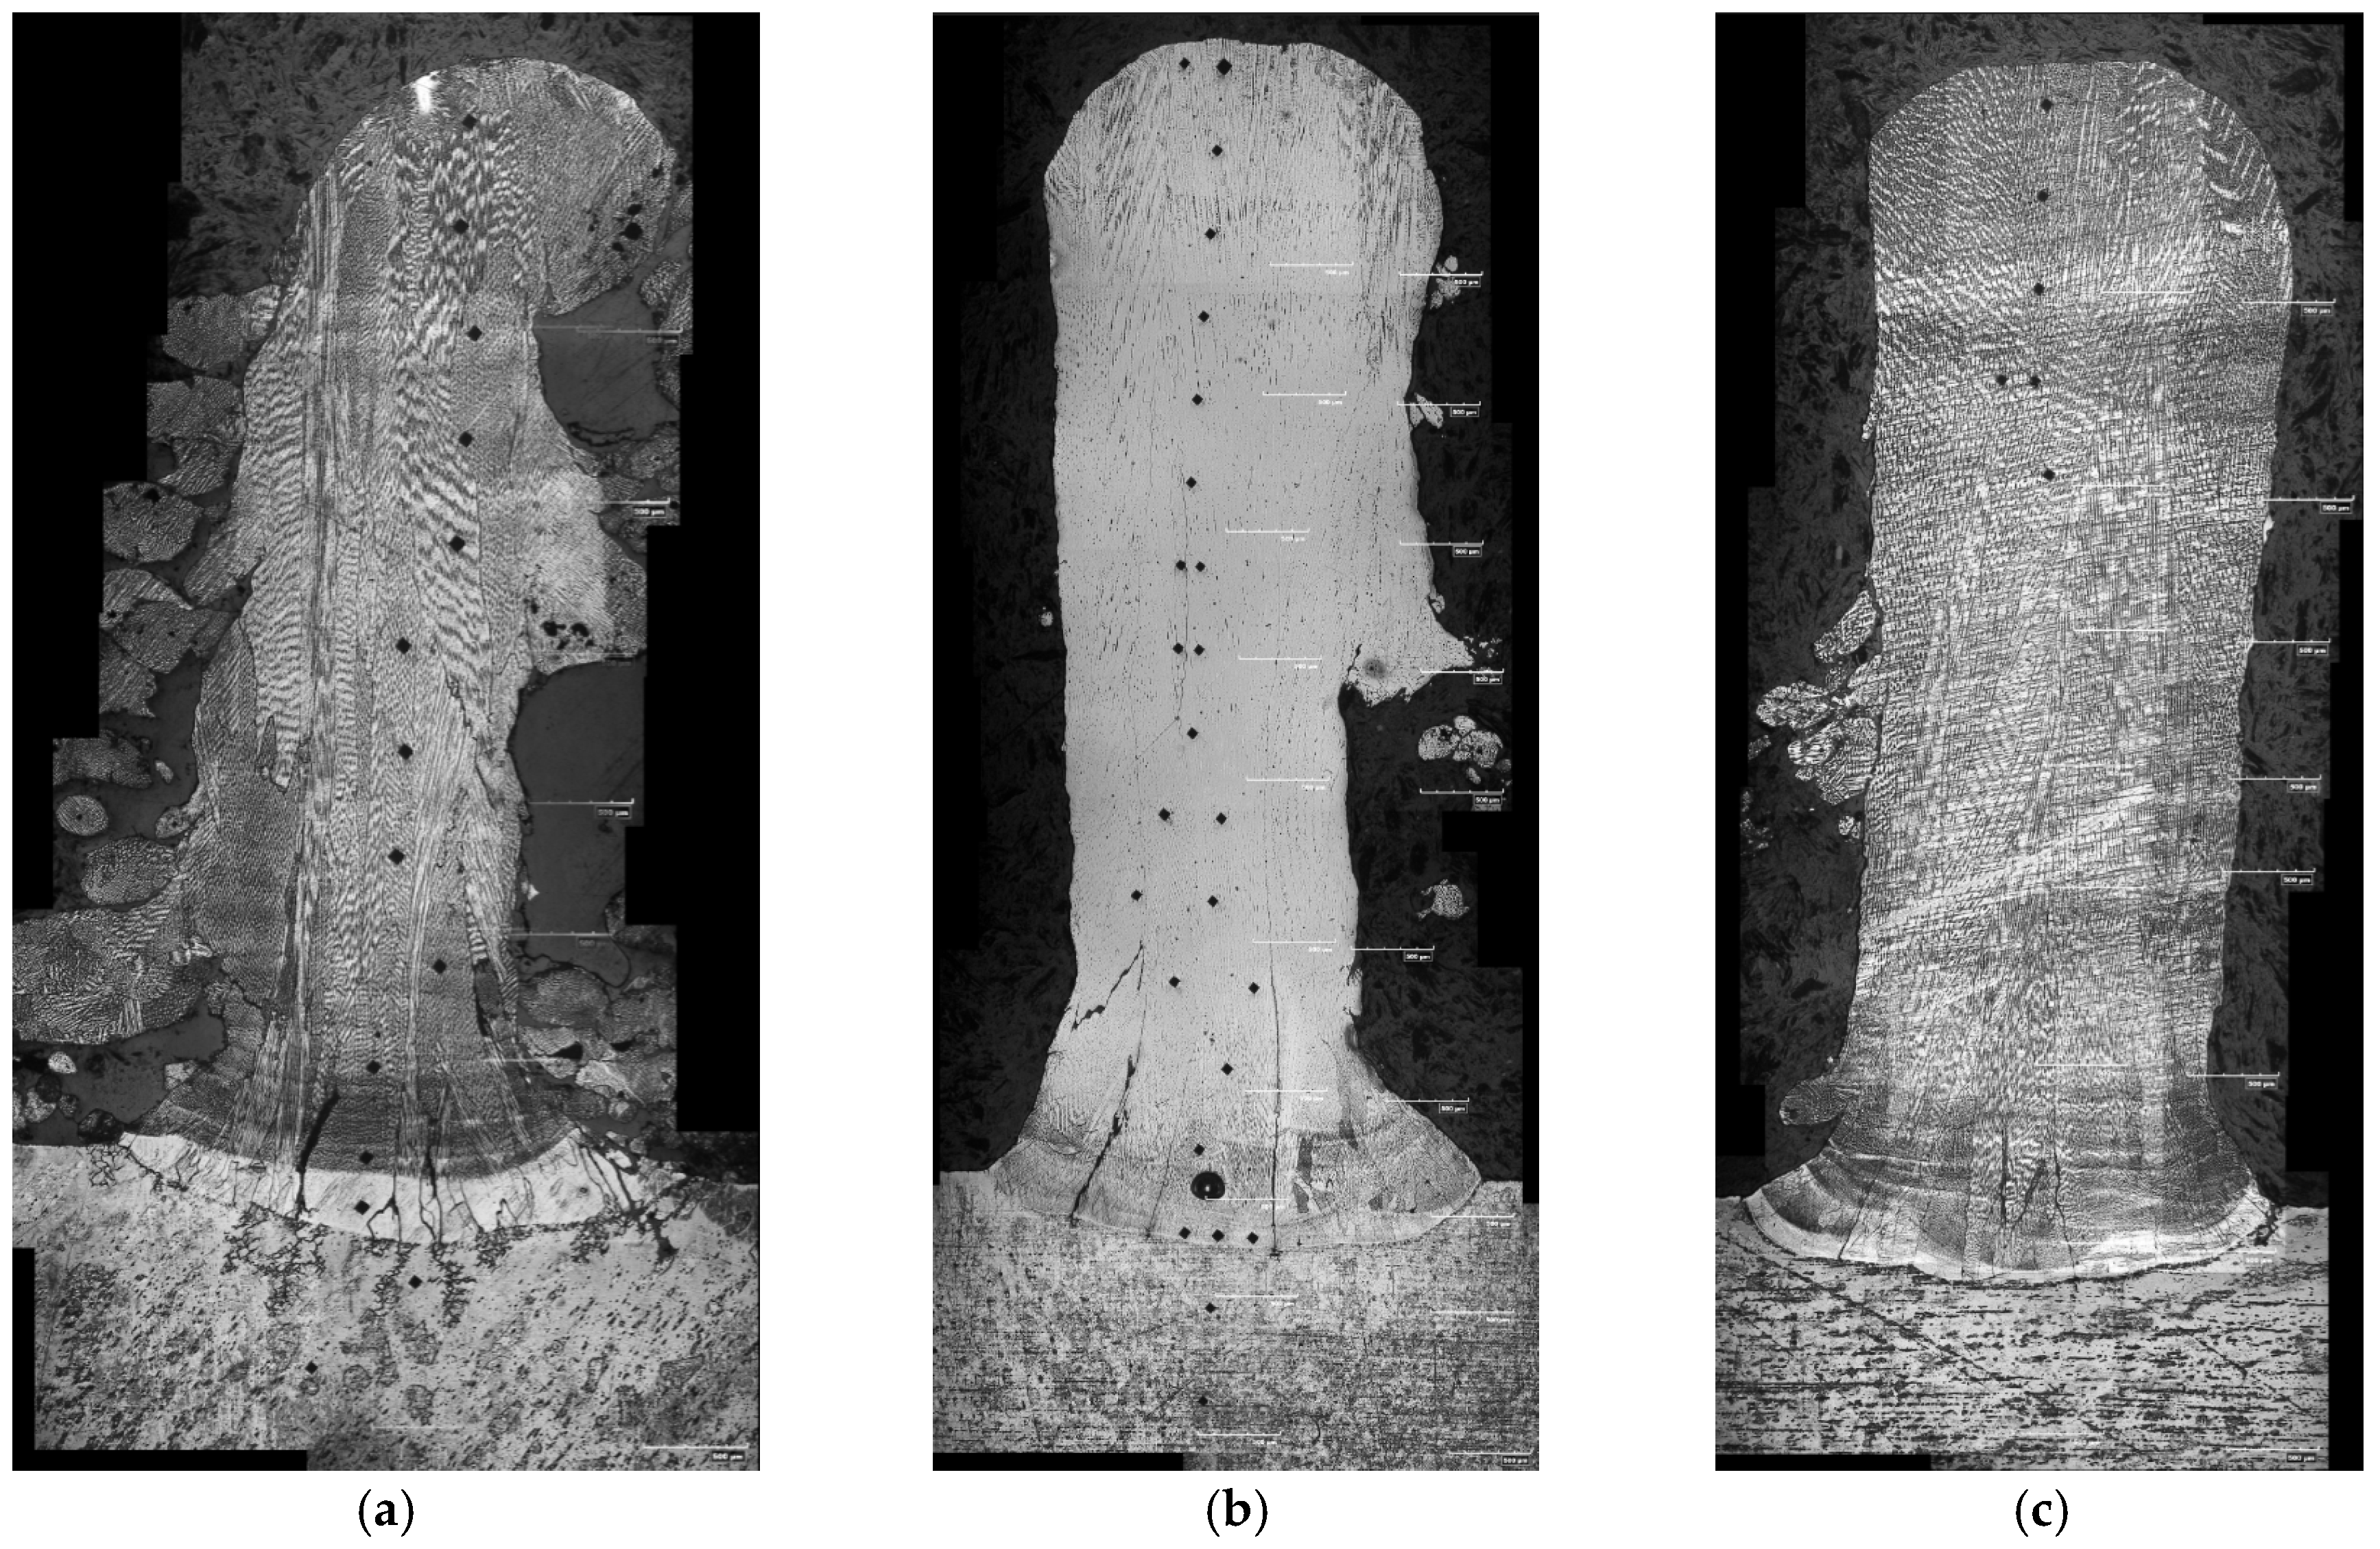
Figure 4.
Images reveal a columnar dendritic microstructure in all the AlxCoFeNiCu1−x (x = 0.25, 0.5, 0.75) high entropy alloy deposits. (a) Al0.25CoFeNiCu0.75; (b) Al0.5CoFeNiCu0.5; (c) Al0.75CoFeNiCu0.25.
Figure 4.
Images reveal a columnar dendritic microstructure in all the AlxCoFeNiCu1−x (x = 0.25, 0.5, 0.75) high entropy alloy deposits. (a) Al0.25CoFeNiCu0.75; (b) Al0.5CoFeNiCu0.5; (c) Al0.75CoFeNiCu0.25.

Figure 5.
EBSD phase map indicating predominantly fcc phase in the Al0.25CoFeNiCu0.75 fabrication. (a) Region of interest on Al0.25CoFeNiCu0.75; bright and dark phases represent two grains of different orientation; (b) Phase map showing predominantly fcc phase (represented by blue color) within the region of interest.
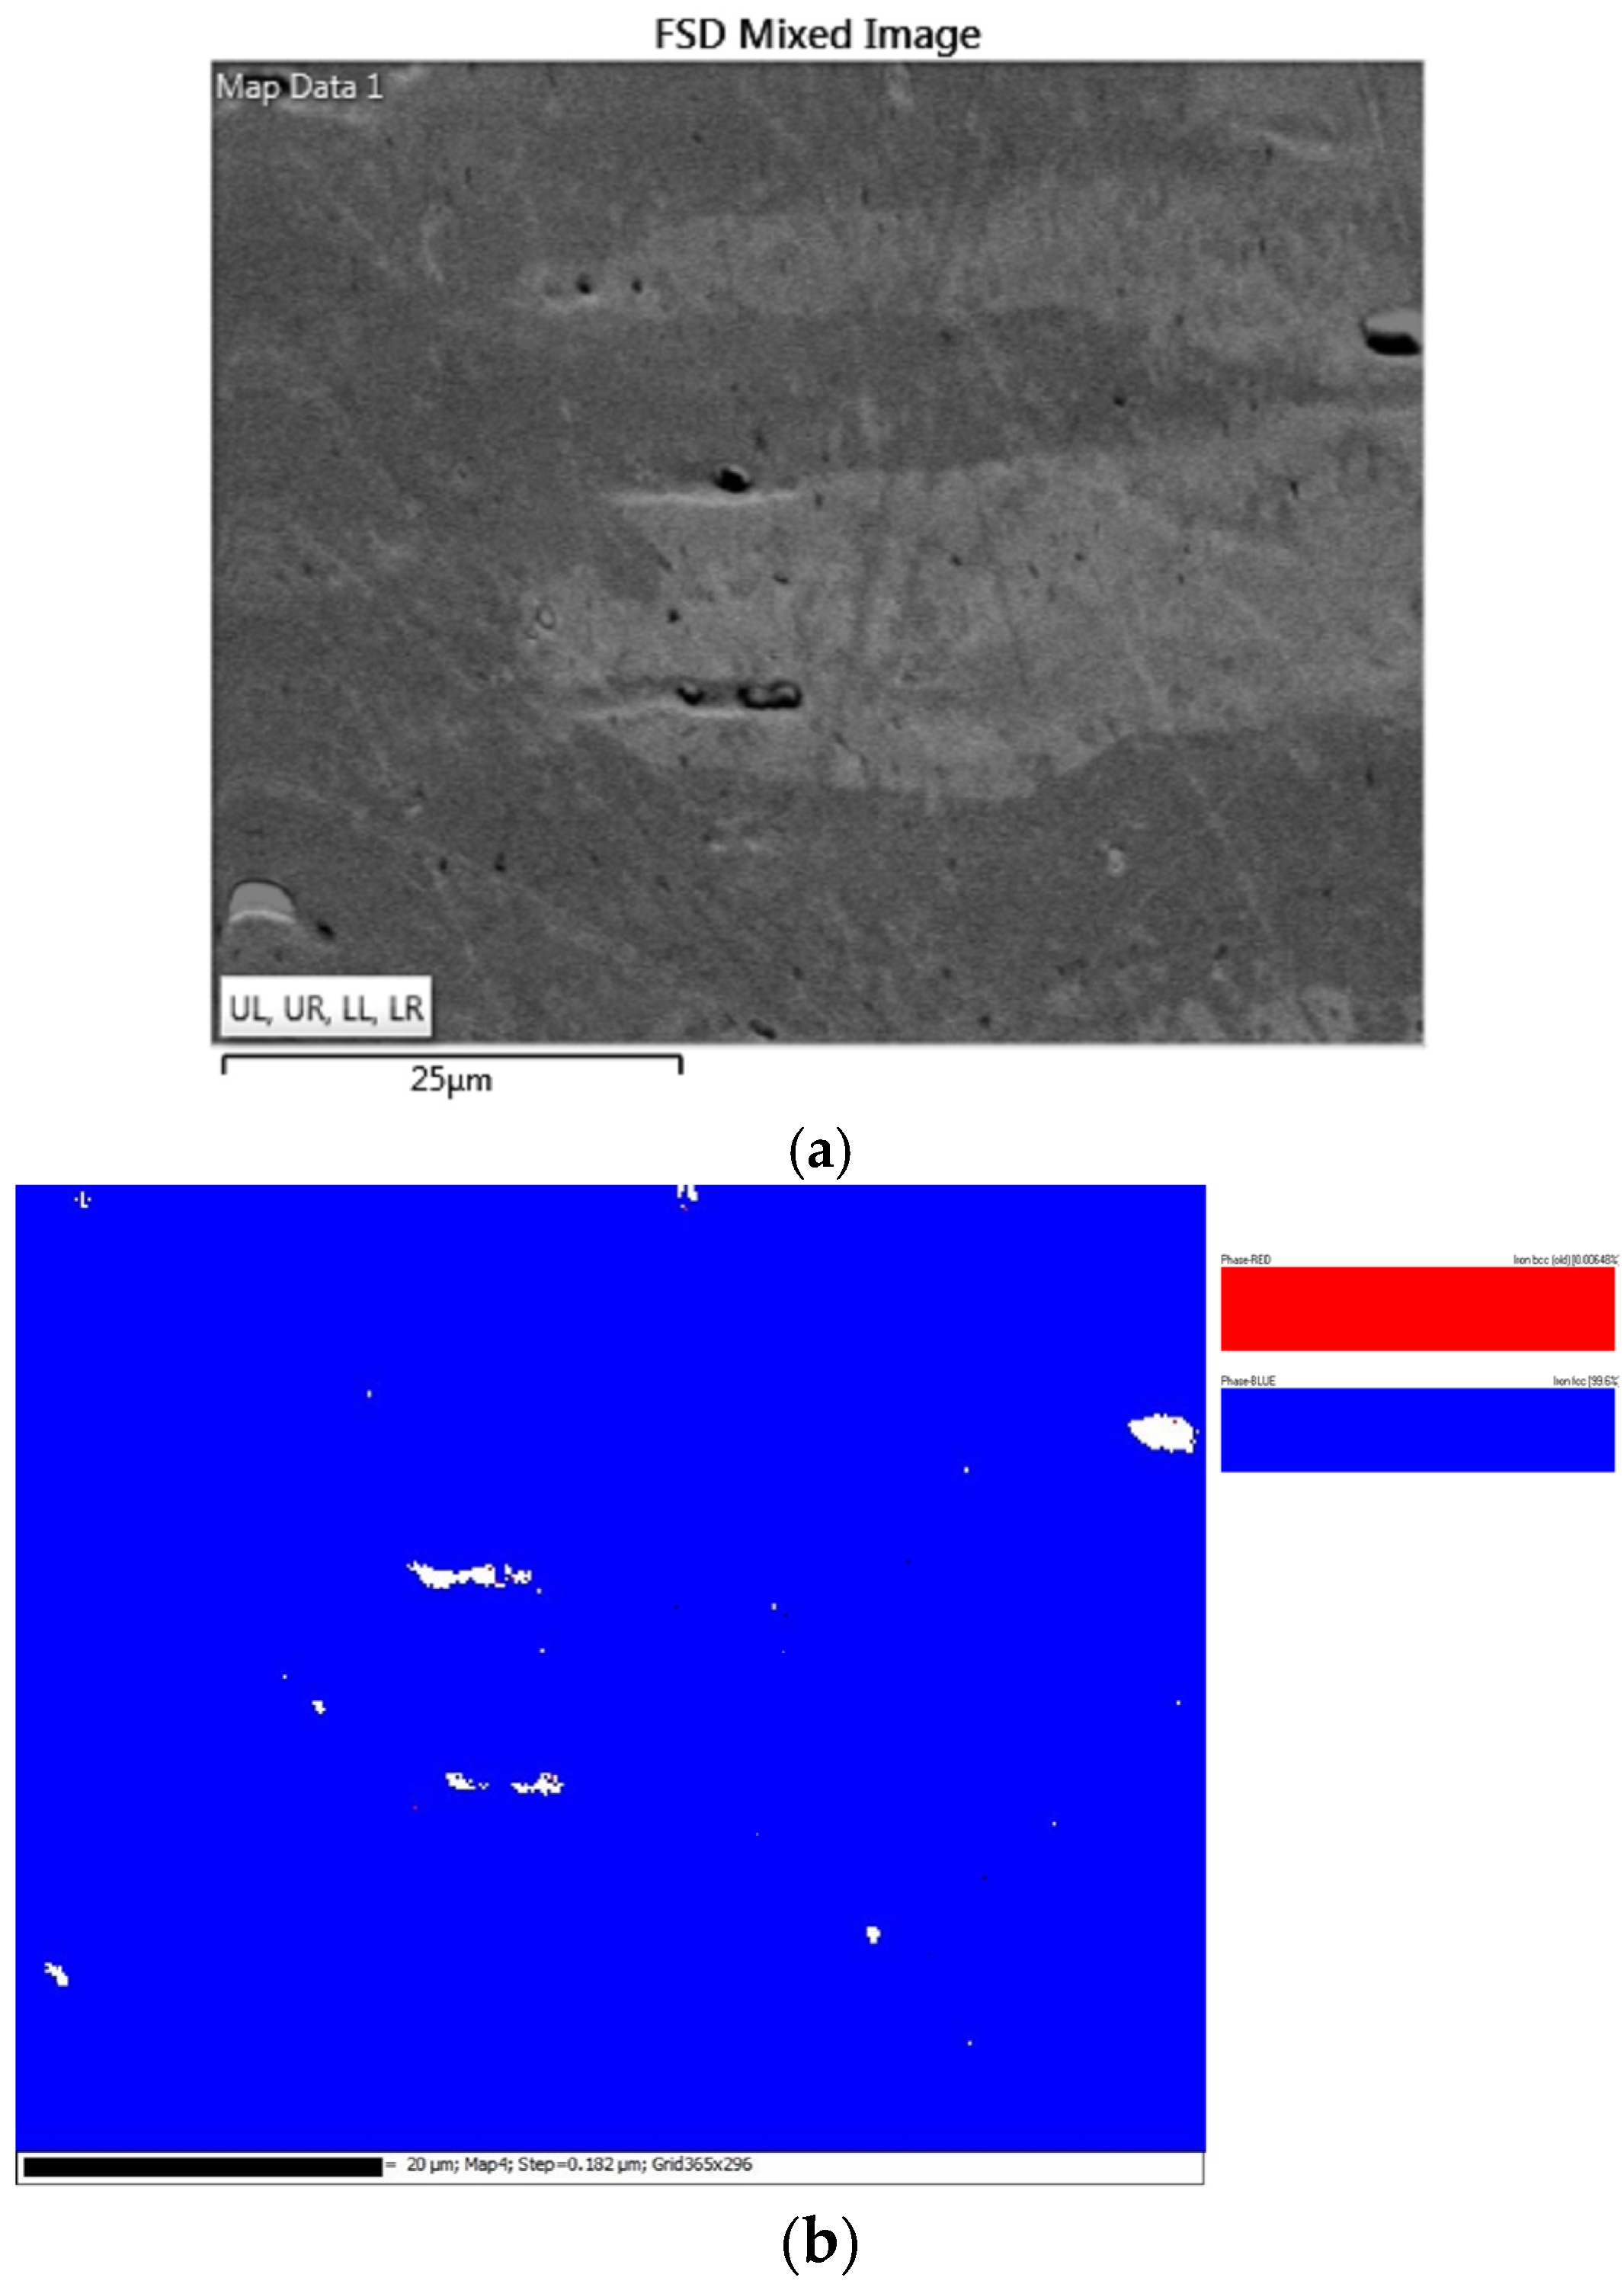
Figure 6.
EBSD phase map indicating predominantly fcc phase in the Al0.5CoFeNiCu0.5 fabrication. (a) Region of interest (enclosed within the white rectangle) on Al0.5CoFeNiCu0.5, bright and dark phases represent two grains of different orientation; (b) Phase map indicating mostly fcc phase (represented by blue color) in the region of interest.

Figure 7.
EBSD phase map indicating both fcc and bcc phases in the Al0.75CoFeNiCu0.25 fabrication. (a) Region of interest (enclosed within the white rectangle) on Al0.75CoFeNiCu0.25, bright and dark phases represent two grains of different orientation; (b) Phase map indicating fcc phase (represented by blue color) and bcc phase (represented by red color) in the region of interest.
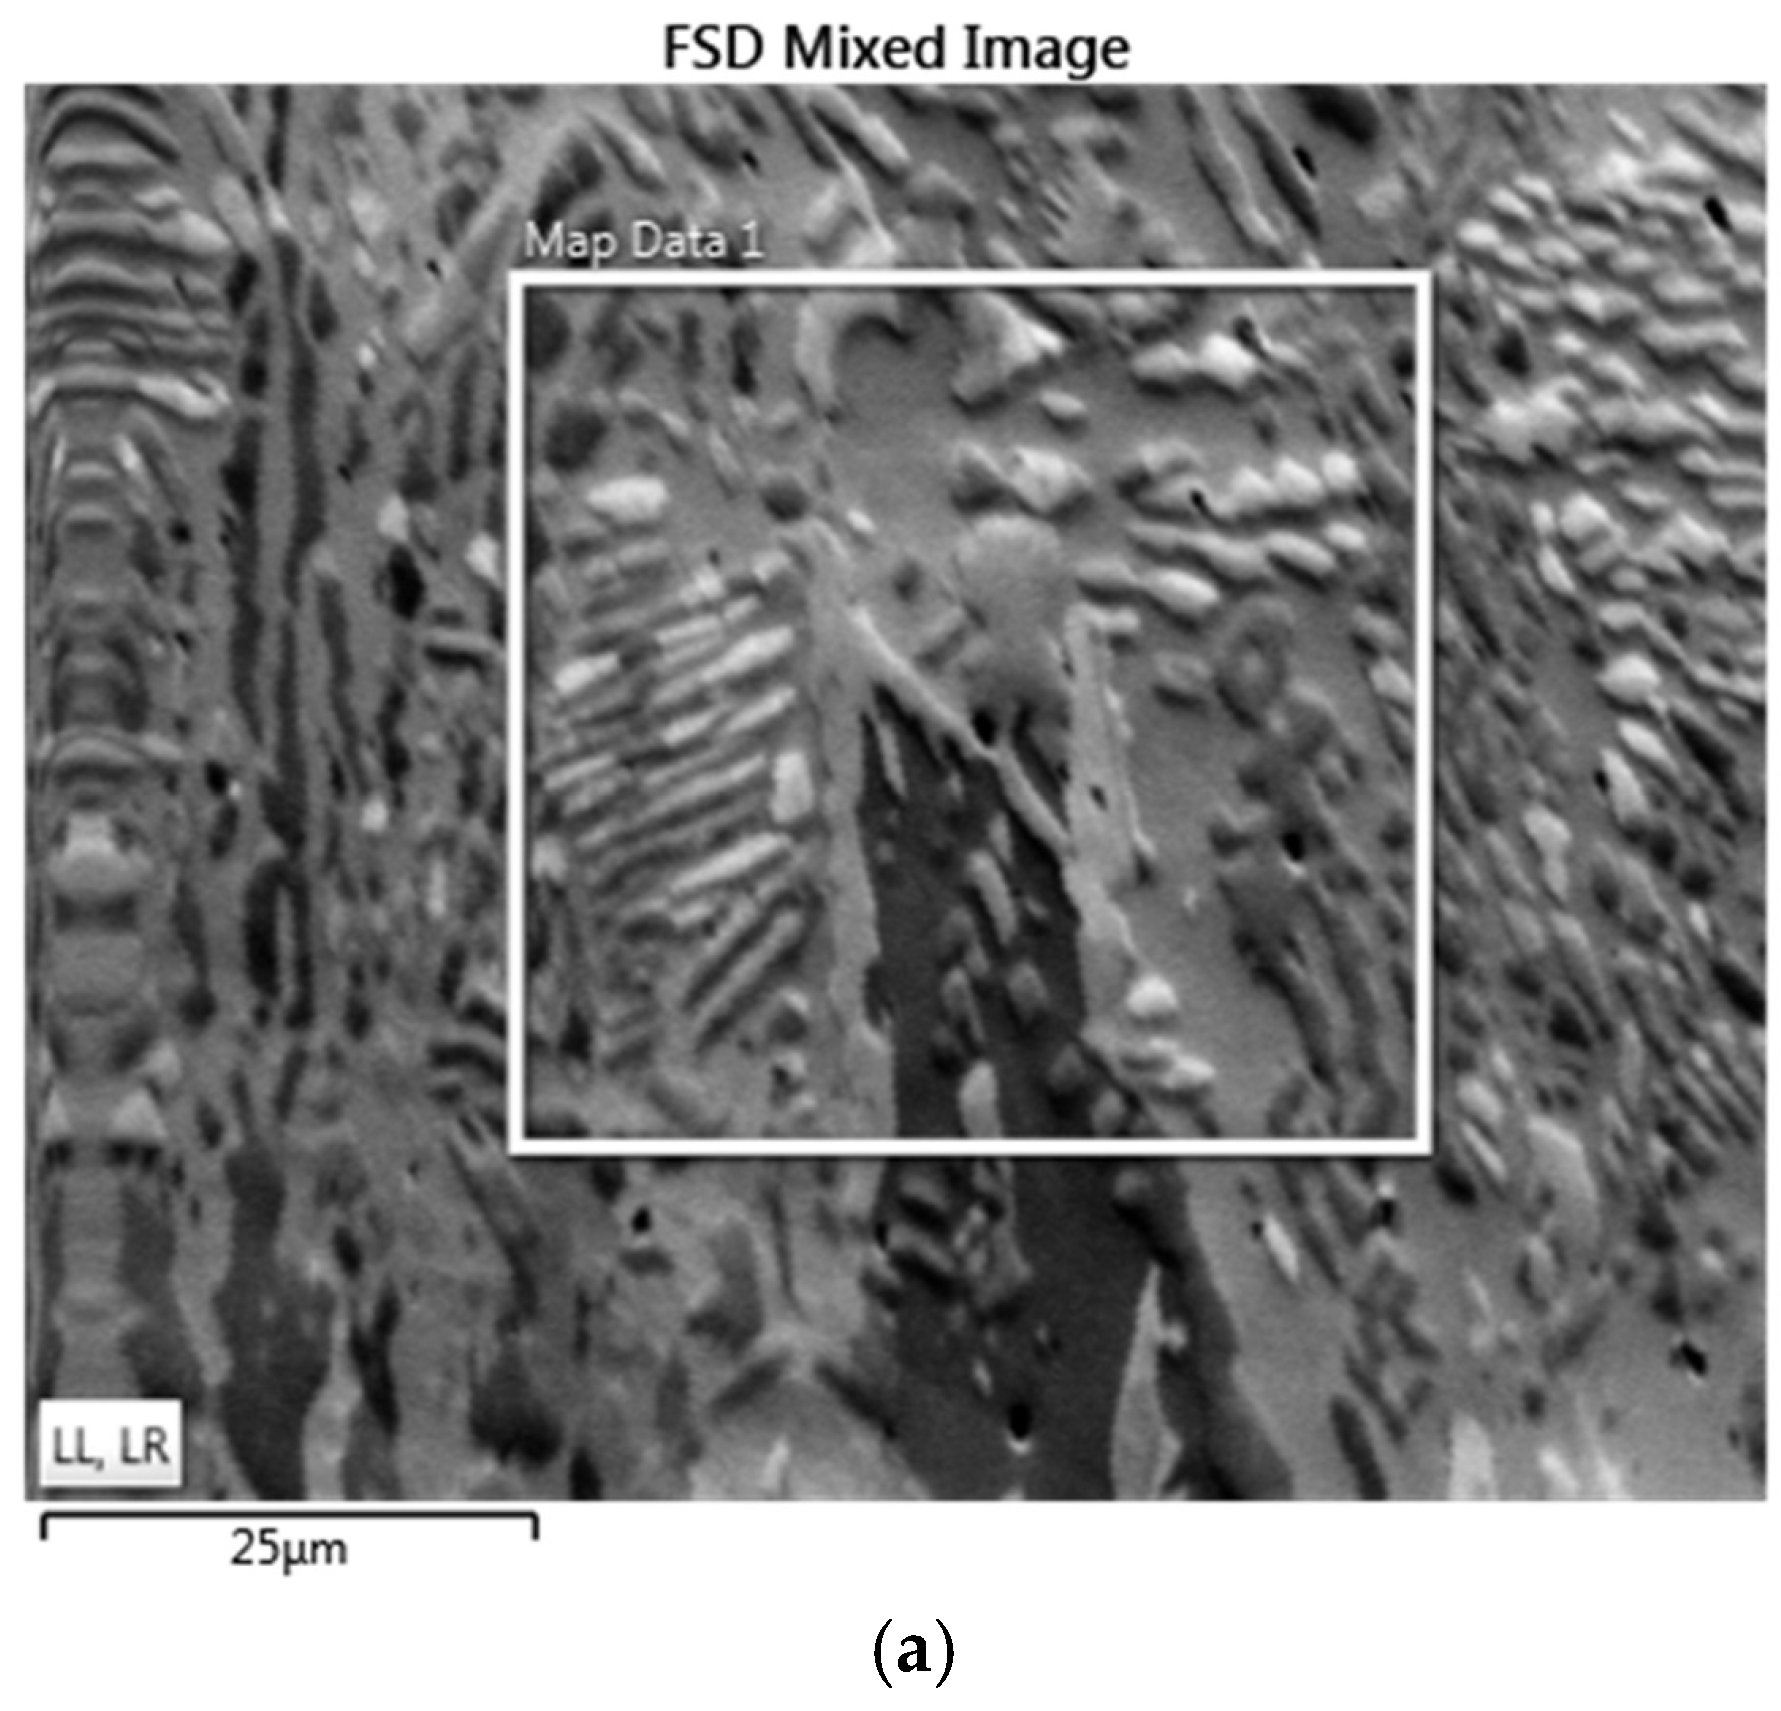
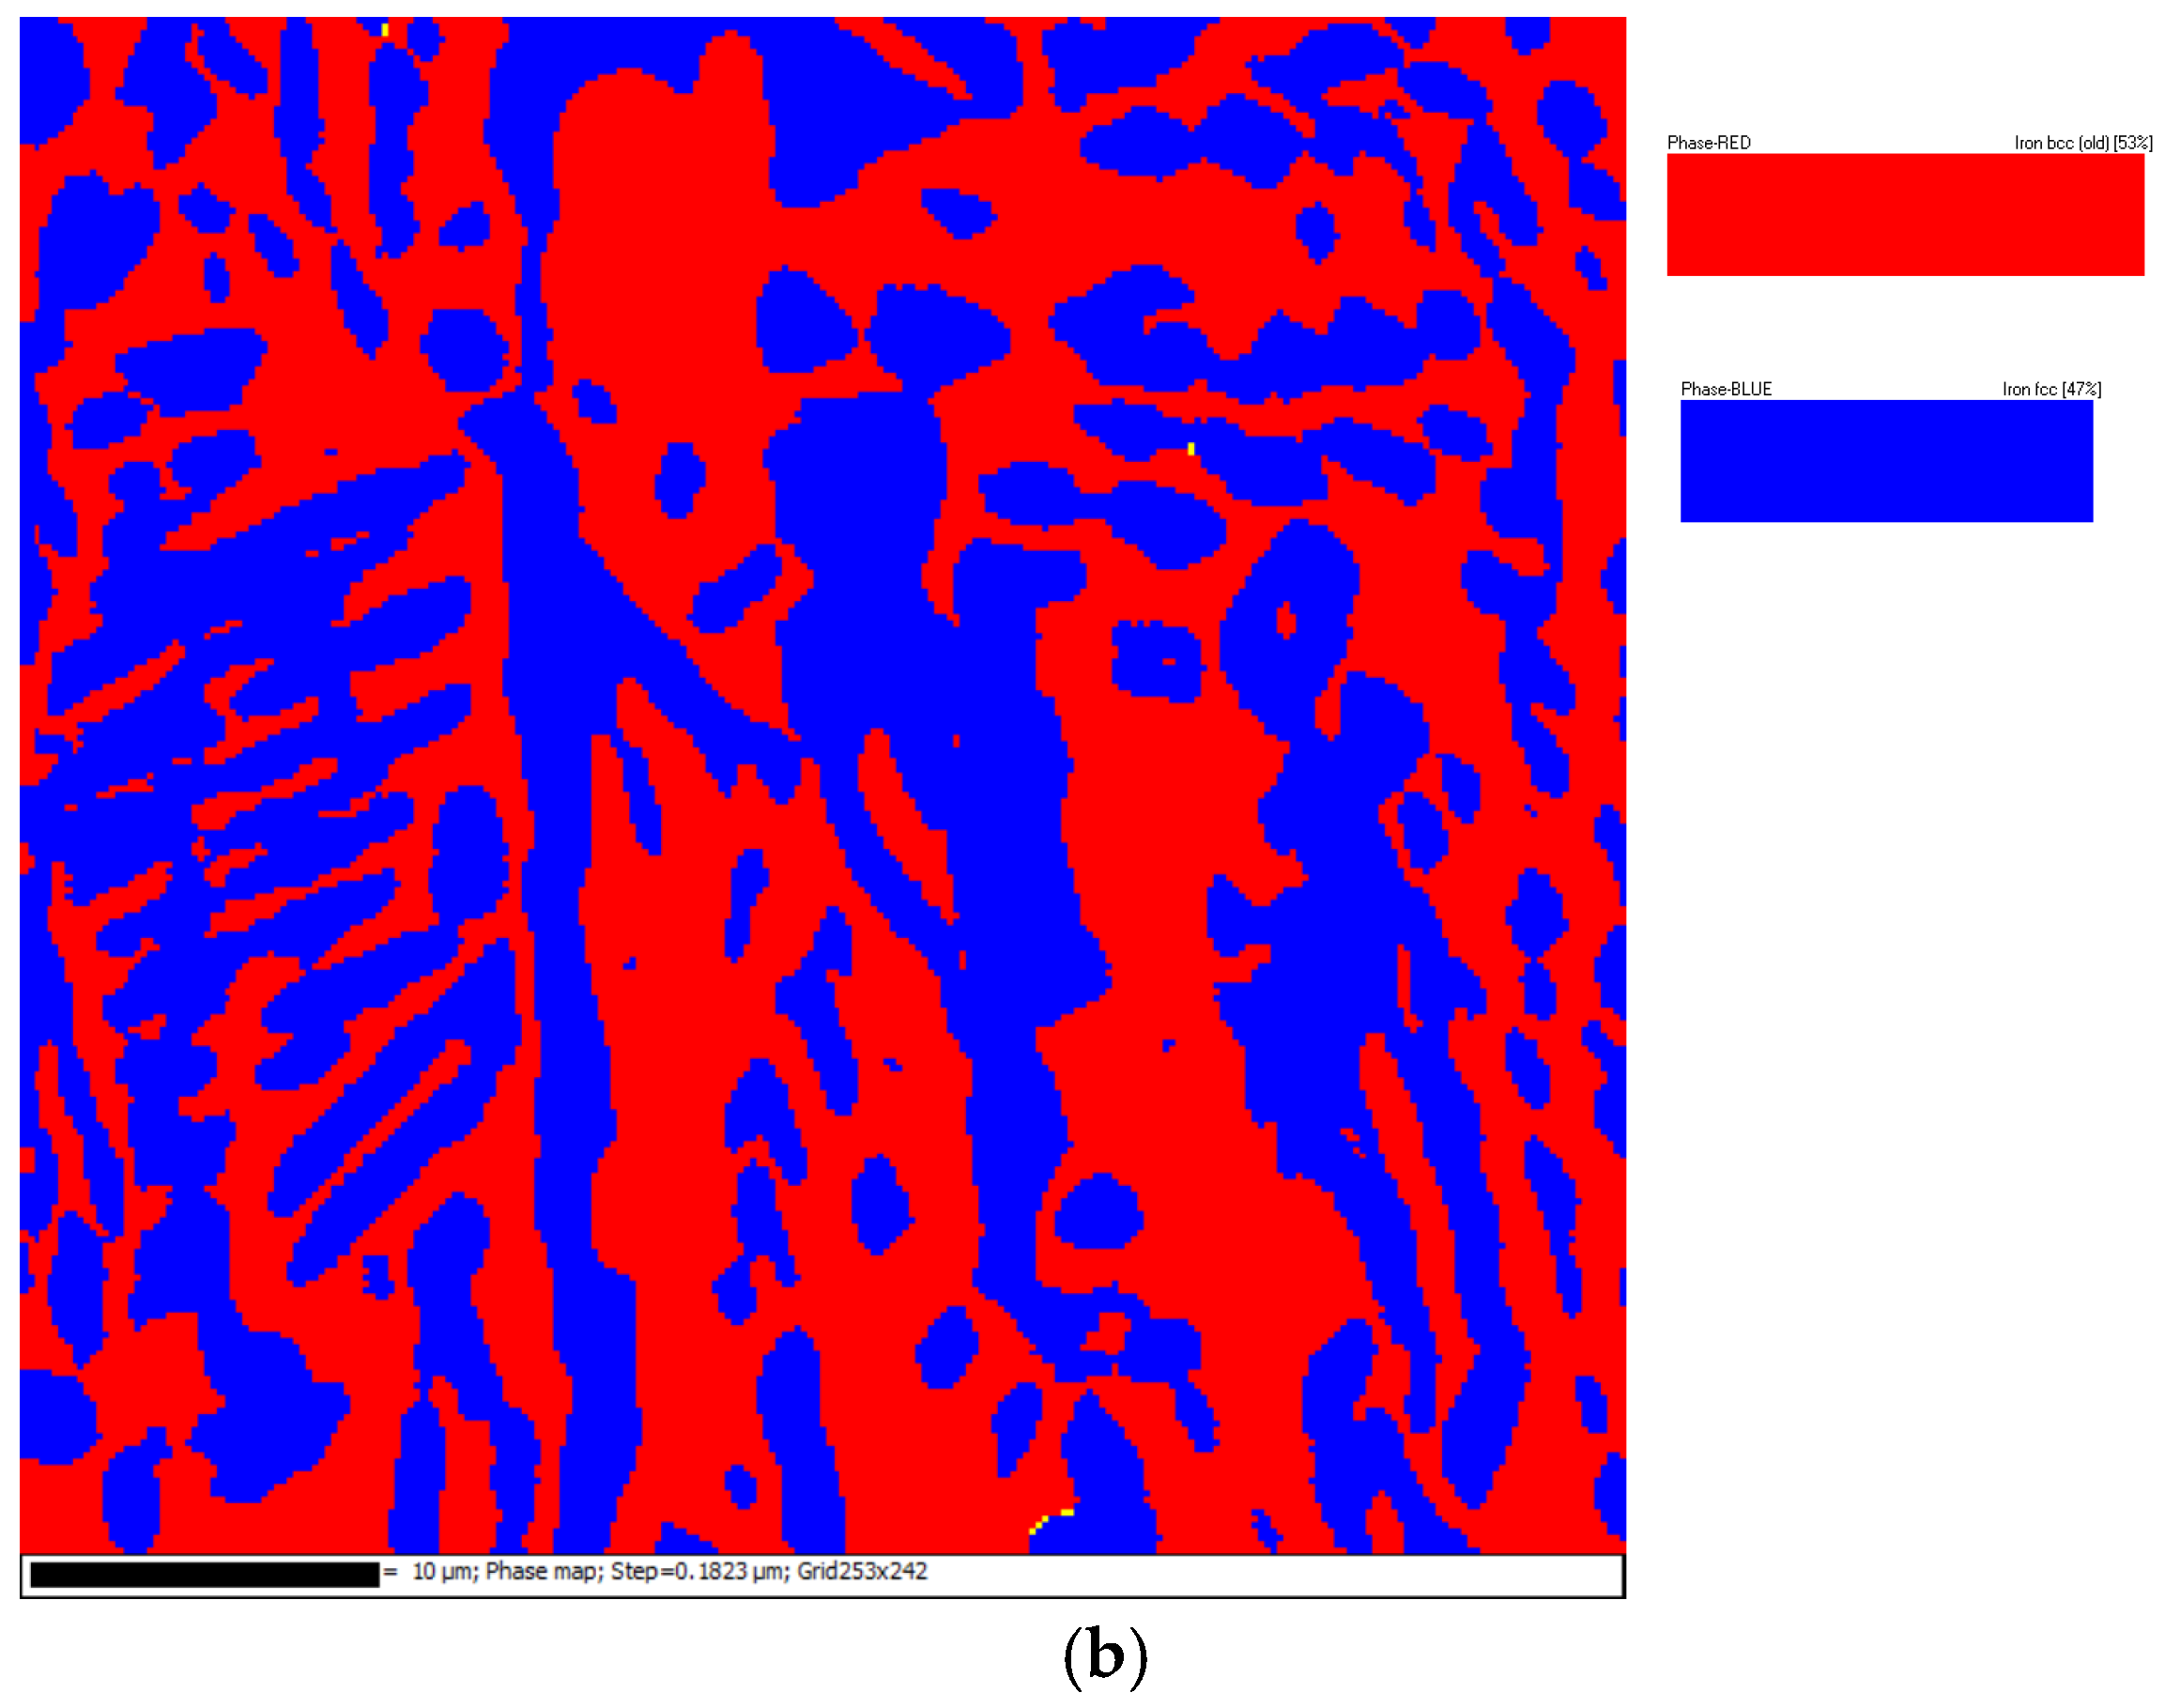
Figure 8.
EDS elemental maps of Al0.25CoFeNiCu0.75 alloy from the region of interest shown in Figure 5a. (a) EDS layered image; (b) Element map of Al; (c) Element map of Co; (d) Element map of Fe; (e) Element map of Ni; (f) Element map of Cu.
Figure 8.
EDS elemental maps of Al0.25CoFeNiCu0.75 alloy from the region of interest shown in Figure 5a. (a) EDS layered image; (b) Element map of Al; (c) Element map of Co; (d) Element map of Fe; (e) Element map of Ni; (f) Element map of Cu.

Figure 9.
EDS elemental maps of Al0.5CoFeNiCu0.5 alloy from the region of interest shown in Figure 6a. (a) EDS layered image; (b) Element map of Al; (c) Element map of Co; (d) Element map of Fe; (e) Element map of Ni; (f) Element map of Cu.
Figure 9.
EDS elemental maps of Al0.5CoFeNiCu0.5 alloy from the region of interest shown in Figure 6a. (a) EDS layered image; (b) Element map of Al; (c) Element map of Co; (d) Element map of Fe; (e) Element map of Ni; (f) Element map of Cu.
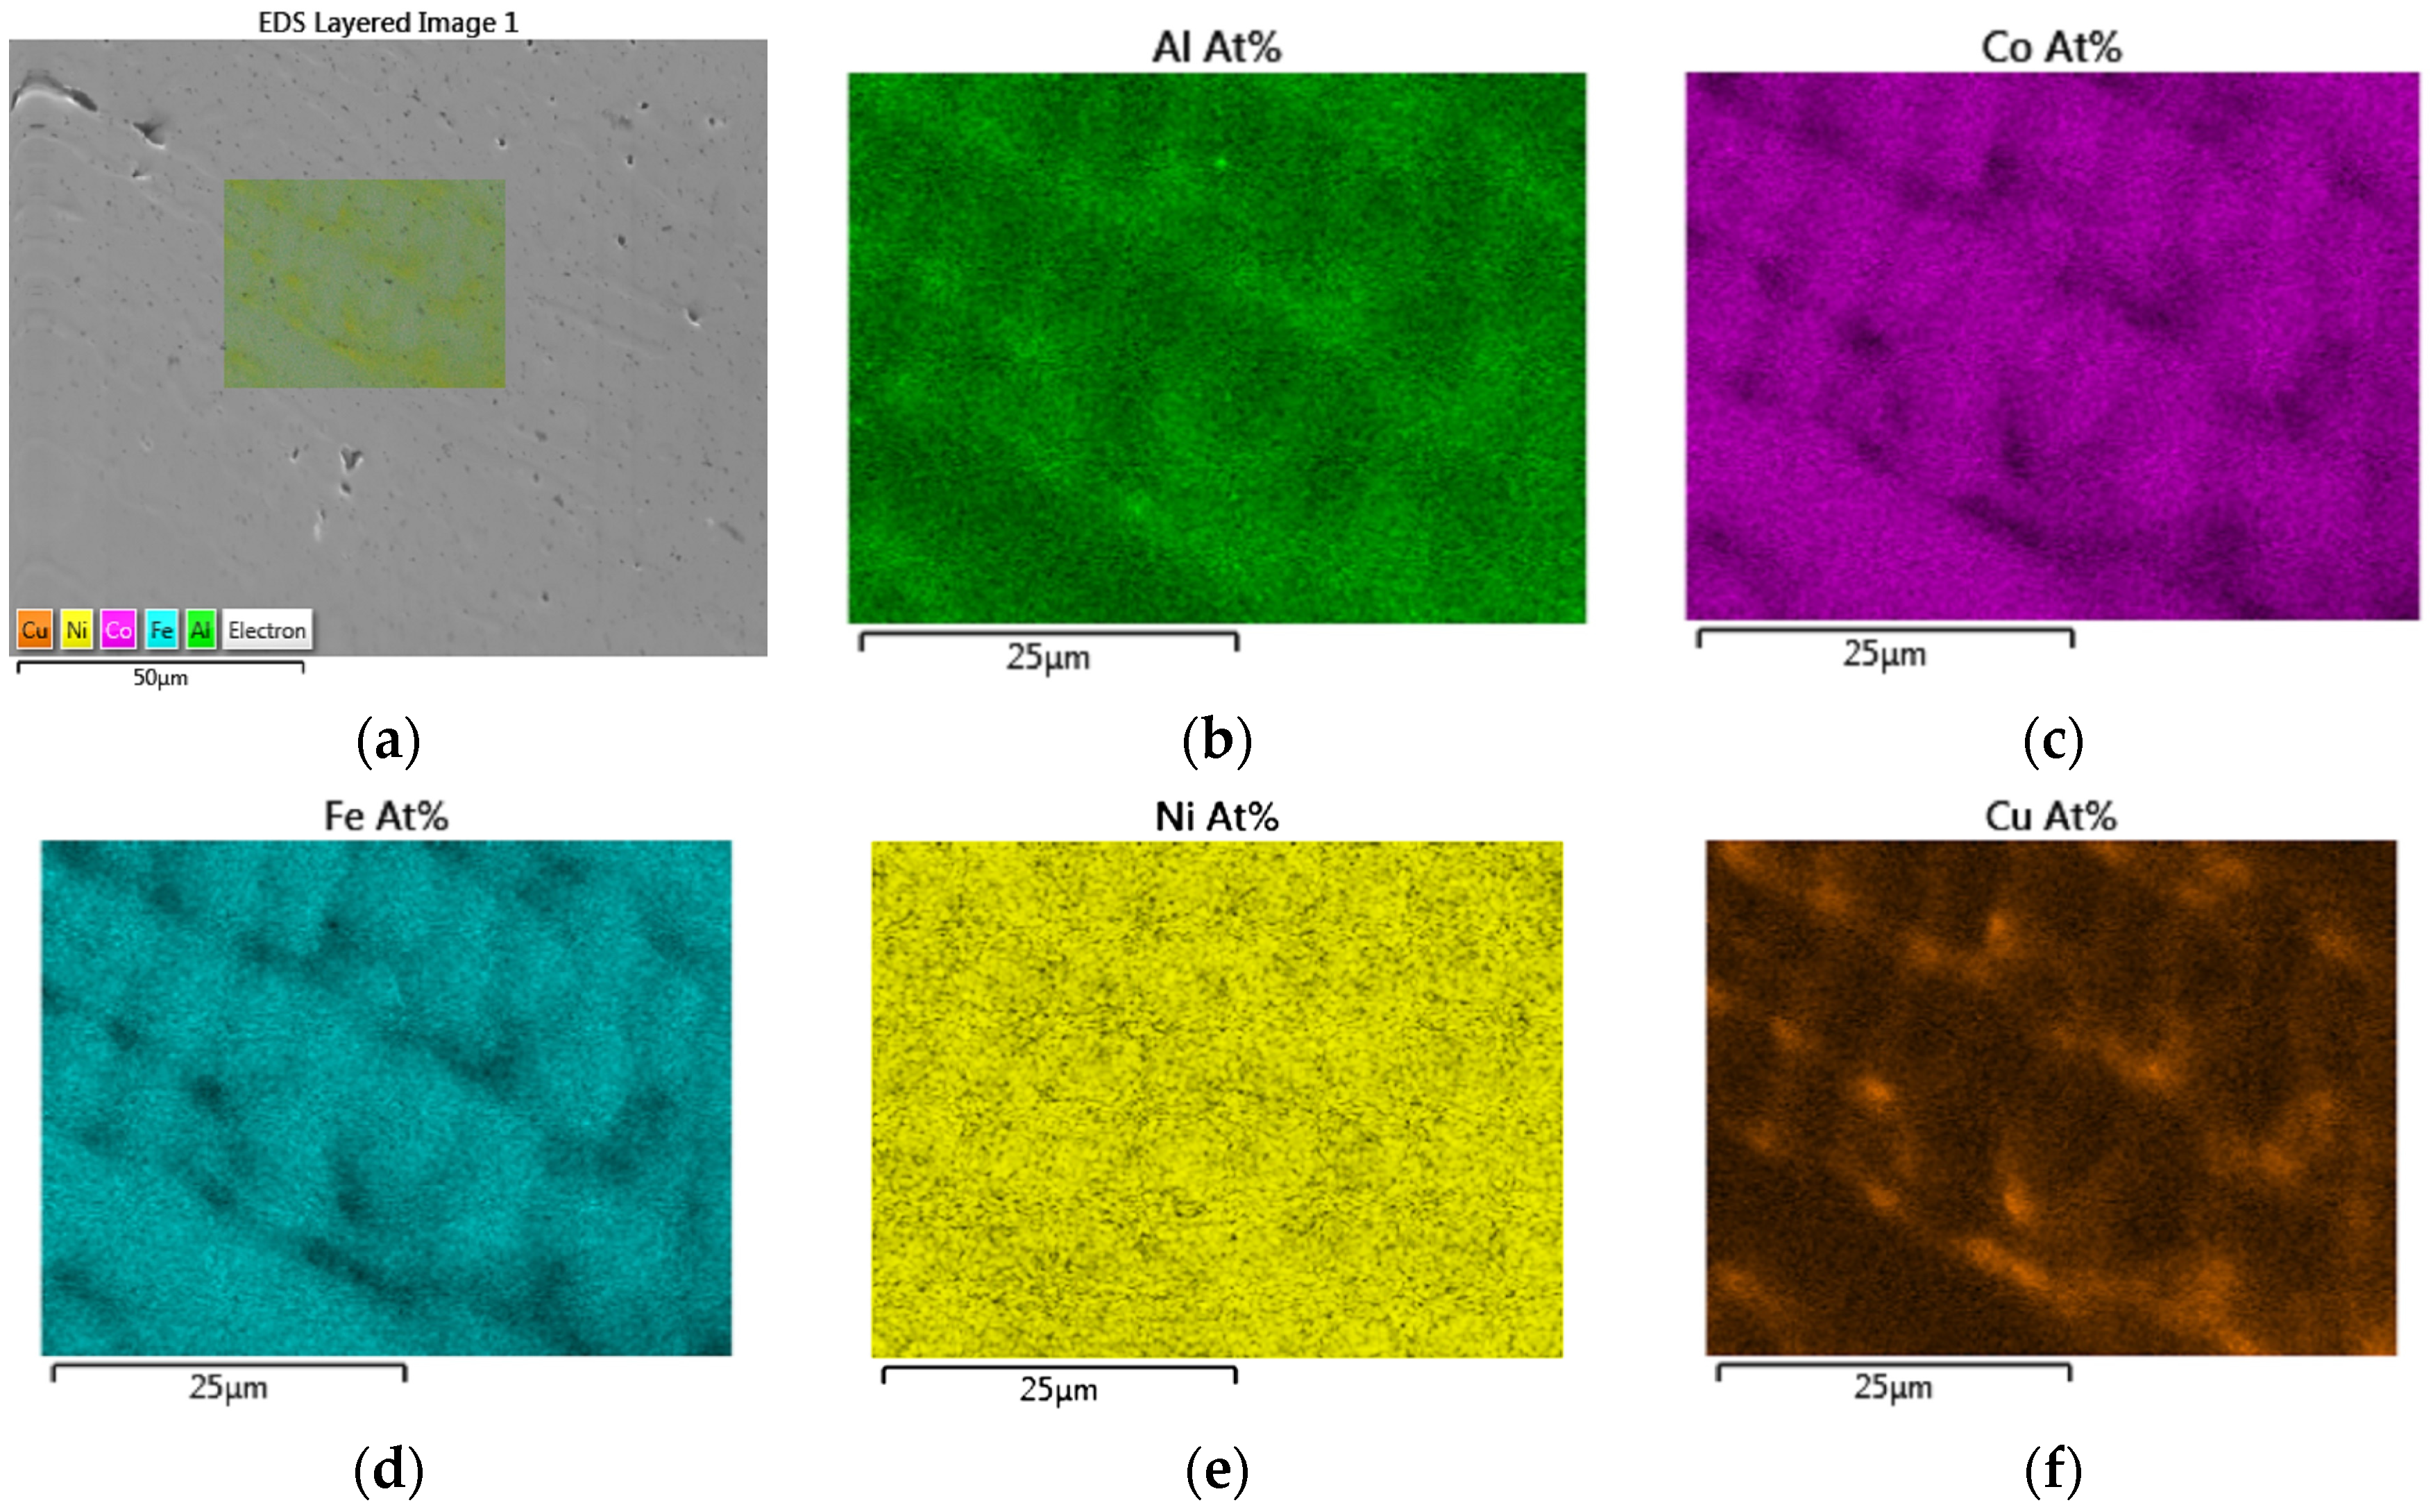
Figure 10.
EDS elemental maps of Al0.75CoFeNiCu0.25 alloy from the region of interest shown in Figure 7a. (a) EDS layered image; (b) Element map of Al; (c) Element map of Co; (d) Element map of Fe; (e) Element map of Ni; (f) Element map of Cu.
Figure 10.
EDS elemental maps of Al0.75CoFeNiCu0.25 alloy from the region of interest shown in Figure 7a. (a) EDS layered image; (b) Element map of Al; (c) Element map of Co; (d) Element map of Fe; (e) Element map of Ni; (f) Element map of Cu.
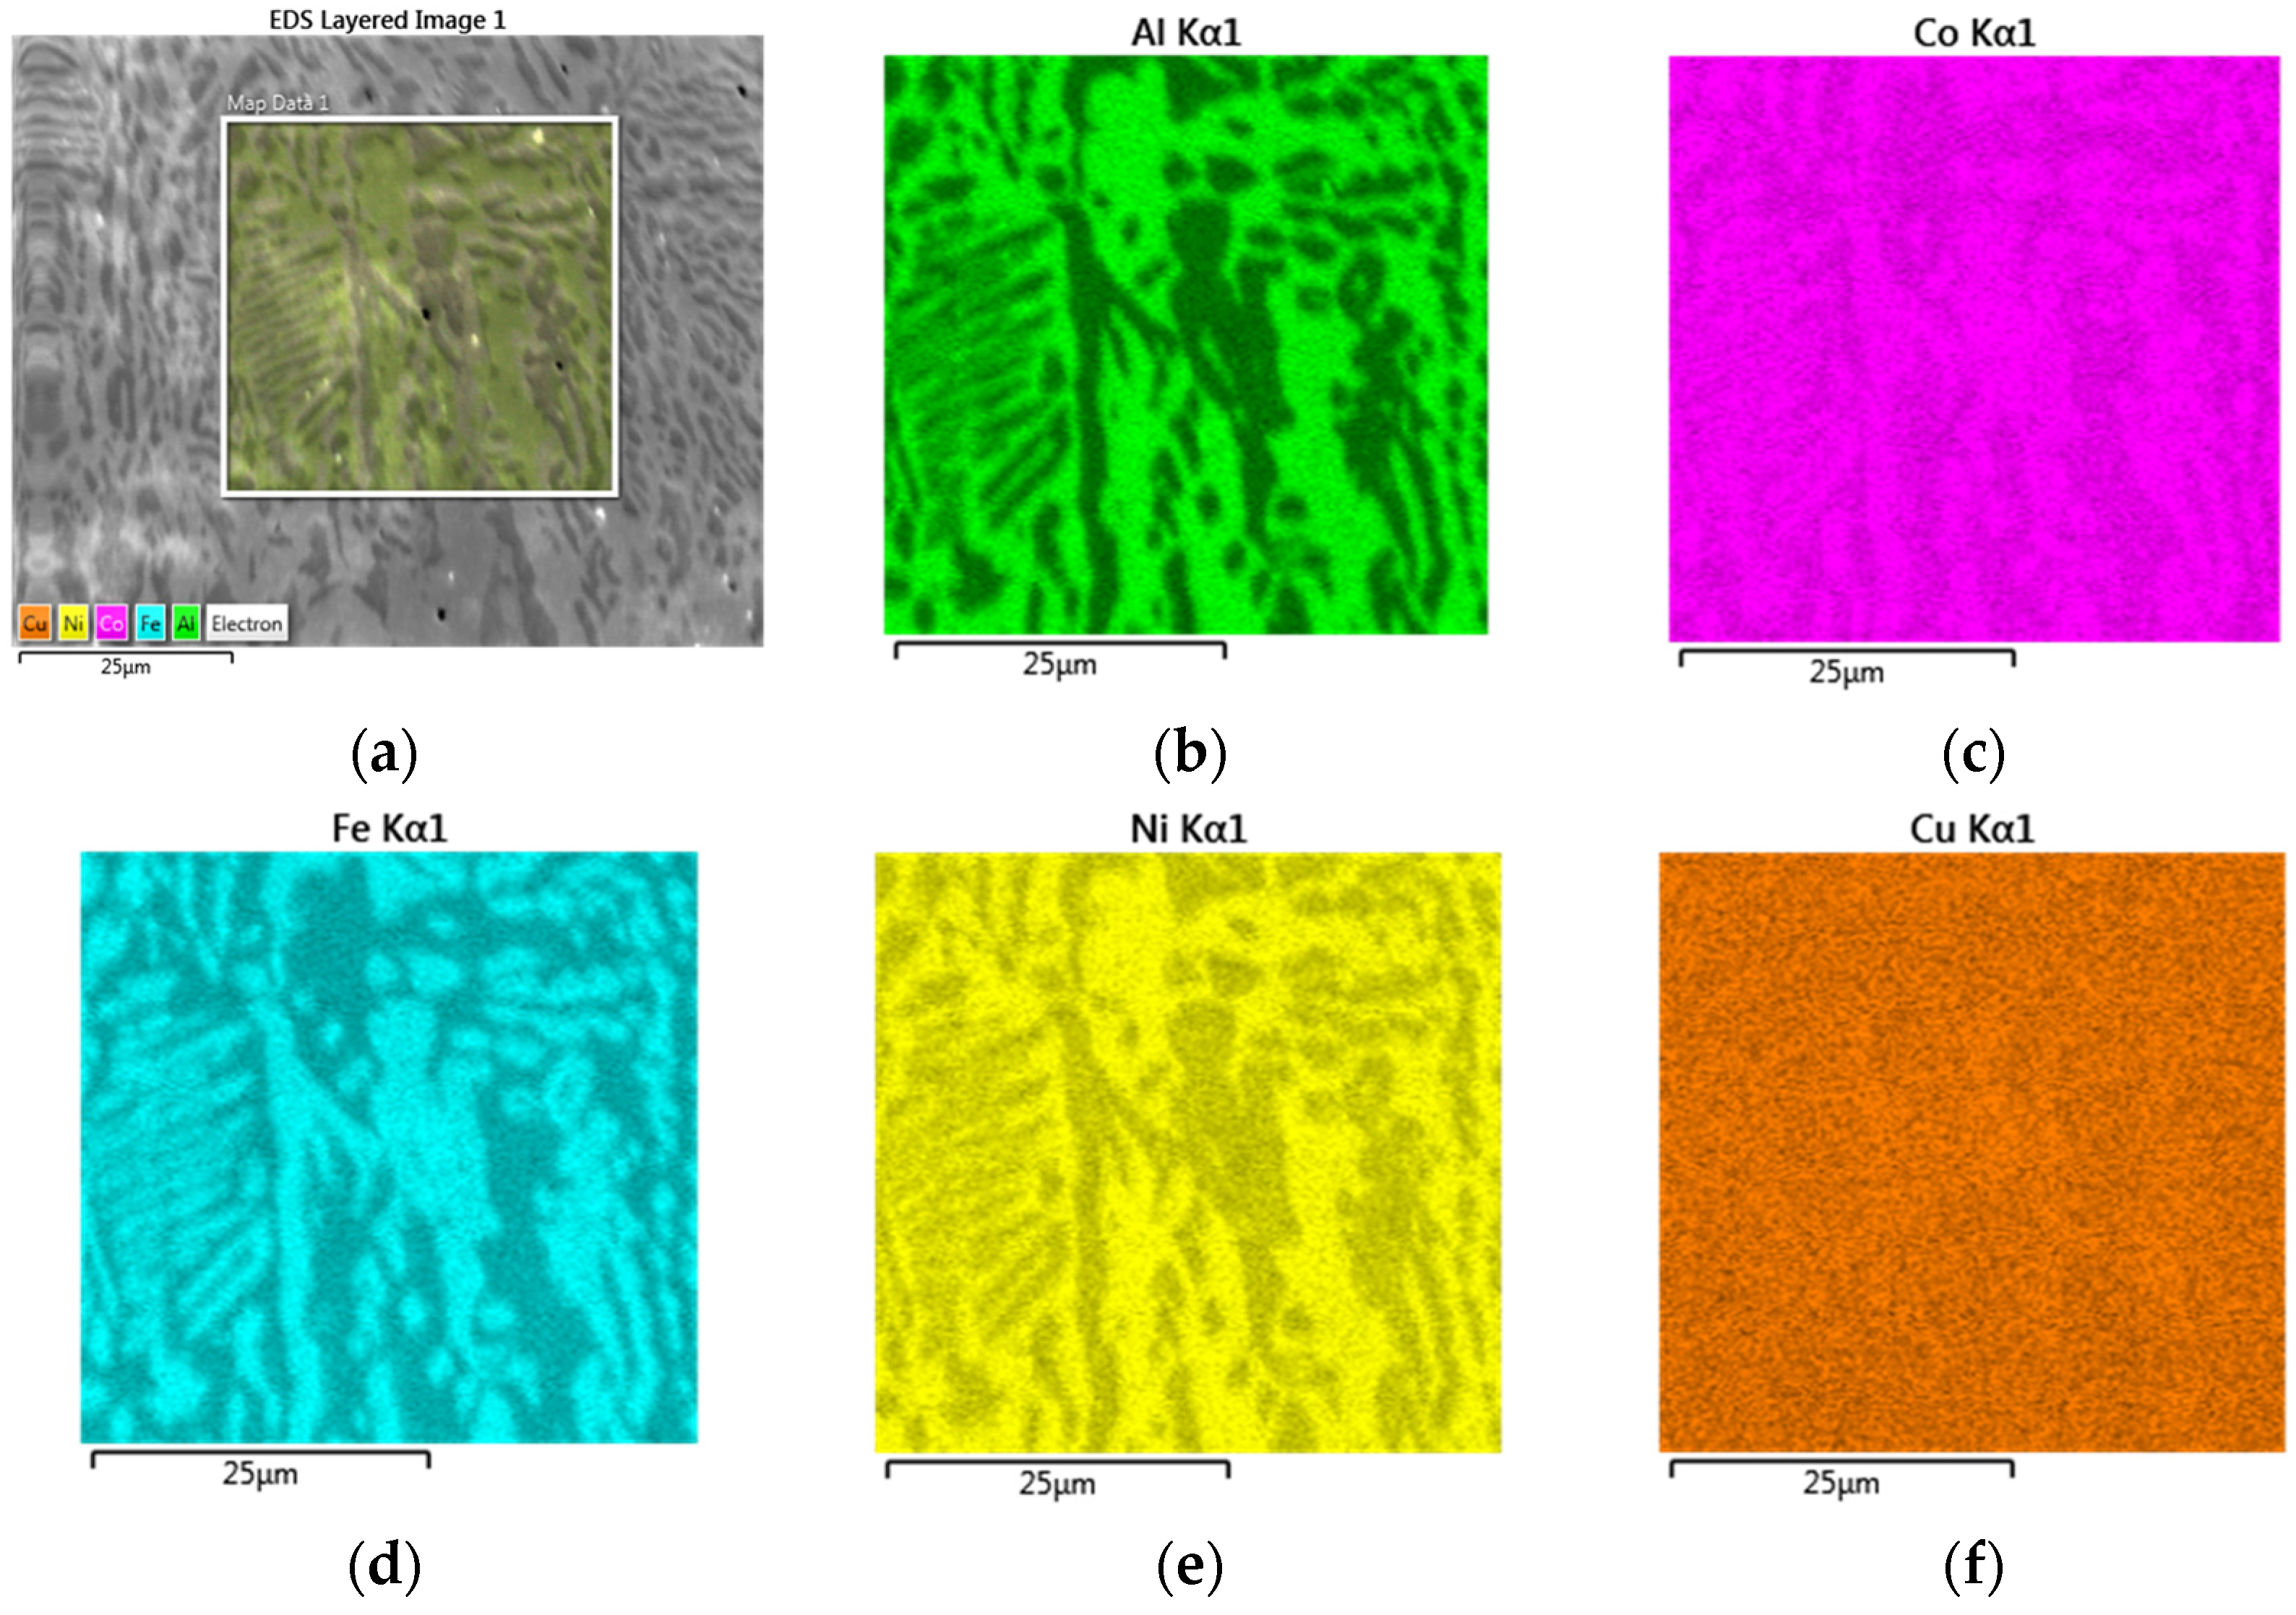
Figure 11.
The Vickers Hardness results of the AlxCoFeNiCu1−x (x = 0.25, 0.5, 0.75) alloys.

Table 1.
Particle size of the original materials.
| Materials | US Standard Mesh |
|---|---|
| Co | −100/+325 |
| Fe | −100 |
| Ni | −100/+325 |
| Al | −100 |
| Cu | −325 |
Table 2.
Chemical analysis of the original materials (wt.%).
| Materials | Fe | C | Ni | Cu | Al | Co | S | Si | Ca | Hydrogen Loss |
|---|---|---|---|---|---|---|---|---|---|---|
| CO-106 | 0.002 | – | <0.001 | <0.0001 | – | Bal. | – | – | 0.0004 | – |
| FE-103 | Bal. | 0.003 | – | – | – | – | – | – | – | 1.01 |
| NI-124 | 0.01 | 0.01 | Bal. | <0.01 | – | 0.01 | 0.02 | – | – | – |
| AL-103 | 0.07 | – | – | – | Bal. | – | – | <0.1 | – | – |
| CU-115 | – | – | – | Bal. | – | – | – | – | – | 0.28 |
Table 3.
Characteristic parameters of Al, Co, Fe, Ni and Cu element [21].
Table 3.
Characteristic parameters of Al, Co, Fe, Ni and Cu element [21].
| Elements | Atomic Number | Atomic Radius (Å) | Crystal Structure | Melting Point (K) |
|---|---|---|---|---|
| Al | 13 | 1.43 | fcc | 933.5 |
| Co | 27 | 1.25 | hcp | 1770 |
| Fe | 26 | 1.27 | bcc | 1811 |
| Ni | 28 | 1.25 | fcc | 1728 |
| Cu | 29 | 1.28 | fcc | 1358 |
| i-j System | (kJ/mol) |
|---|---|
| Al-Co | −19 |
| Al-Fe | −11 |
| Al-Ni | −22 |
| Al-Cu | −1 |
| Co-Fe | −1 |
| Co-Ni | 0 |
| Co-Cu | 6 |
| Fe-Ni | −2 |
| Fe-Cu | 13 |
| Ni-Cu | 4 |
Table 5.
The values of Ω and δ of the AlxCoFeNiCu1−x (x = 0.25, 0.5, 0.75) high entropy alloys.
| Alloys | Tm (K) | ΔHmix (kJ/mol) | ΔSmix (J/K·mol) | Ω | δ |
|---|---|---|---|---|---|
| Al0.25CoFeNiCu0.75 | 1640 | 0.27 | 12.7 | 78.39 | 3.4% |
| Al0.5CoFeNiCu0.5 | 1614 | −4.44 | 12.96 | 4.72 | 4.5% |
| Al0.75CoFeNiCu0.25 | 1587 | −9.11 | 12.69 | 2.21 | 5.2% |
Table 6.
Lattice parameters in the AlxCoFeNiCu1−x (x = 0.25, 0.5, 0.75) alloys.
| Alloy | Phase Name | Lattice Parameter (Å) |
|---|---|---|
| Al0.25CoFeNiCu0.75 | fcc | 3.5882 |
| Al0.5CoFeNiCu0.5 | fcc | 3.5920 |
| Al0.75CoFeNiCu0.25 | fcc | 3.6007 |
| bcc | 2.8724 |
Table 7.
Phase fractions of fcc and bcc phases in the region of interest for the AlxCoFeNiCu1−x (x = 0.25, 0.5, 0.75) fabrications.
Table 7.
Phase fractions of fcc and bcc phases in the region of interest for the AlxCoFeNiCu1−x (x = 0.25, 0.5, 0.75) fabrications.
| AlxCoFeNiCu1−x (x = 0.25, 0.5, 0.75) | Phase Name | Phase Fraction (%) |
|---|---|---|
| Al0.25CoFeNiCu0.75 | bcc | 0.01 |
| fcc | 99.56 | |
| Zero Solution | 0.44 | |
| Al0.5CoFeNiCu0.5 | bcc | 0.14 |
| fcc | 99.81 | |
| Zero Solution | 0.04 | |
| Al0.75CoFeNiCu0.25 | bcc | 52.62 |
| fcc | 46.42 | |
| Zero Solution | 0.96 |
Table 8.
Chemical composition of the elements at different regions in atomic % for the AlxCoFeNiCu1−x (x = 0.25, 0.5, 0.75) alloys.
Table 8.
Chemical composition of the elements at different regions in atomic % for the AlxCoFeNiCu1−x (x = 0.25, 0.5, 0.75) alloys.
| Alloy | Area | Al | Fe | Co | Ni | Cu |
|---|---|---|---|---|---|---|
| Al0.25CoFeNiCu0.75 | As-blended composition | 6.25 | 25 | 25 | 25 | 18.75 |
| Bright phase (Figure 5a) | 4.47 | 26.85 | 22.15 | 28.08 | 18.45 | |
| Dark phase (Figure 5a) | 4.27 | 27.8 | 23.2 | 28.47 | 16.26 | |
| Dendrite (fcc) | 4.32 | 27.84 | 23.23 | 28.41 | 16.2 | |
| Matrix (fcc) | 5.05 | 16.19 | 12.78 | 23 | 42.98 | |
| Al0.5CoFeNiCu0.5 | As blended composition | 12.5 | 25 | 25 | 25 | 12.5 |
| Bright phase (Figure 6a) | 9.21 | 25.57 | 26.44 | 27.54 | 11.24 | |
| Dark phase (Figure 6a) | 9.94 | 23.7 | 24.7 | 28.23 | 13.43 | |
| Dendrite (fcc) | 9.3 | 25.03 | 26 | 28 | 11.67 | |
| Matrix (fcc) | 11.72 | 17.65 | 18.93 | 28 | 23.7 | |
| Al0.75CoFeNiCu0.25 | As blended composition | 18.75 | 25 | 25 | 25 | 6.25 |
| Bright phase (Figure 7a) | 20.39 | 23.7 | 18.92 | 30.63 | 6.36 | |
| Dark phase (Figure 7a) | 21.42 | 22.86 | 18.22 | 31.19 | 6.31 | |
| Dendrite (fcc) | 9.85 | 35.58 | 22.06 | 25.53 | 6.98 | |
| Matrix (bcc) | 21.19 | 22.43 | 19.1 | 31.22 | 6.06 |
© 2017 by the authors. Licensee MDPI, Basel, Switzerland. This article is an open access article distributed under the terms and conditions of the Creative Commons Attribution (CC BY) license (http://creativecommons.org/licenses/by/4.0/).
Share and Cite
MDPI and ACS Style
Chen, X.; Yan, L.; Karnati, S.; Zhang, Y.; Liou, F. Fabrication and Characterization of AlxCoFeNiCu1−x High Entropy Alloys by Laser Metal Deposition. Coatings 2017, 7, 47. https://doi.org/10.3390/coatings7040047
AMA Style
Chen X, Yan L, Karnati S, Zhang Y, Liou F. Fabrication and Characterization of AlxCoFeNiCu1−x High Entropy Alloys by Laser Metal Deposition. Coatings. 2017; 7(4):47. https://doi.org/10.3390/coatings7040047
Chicago/Turabian StyleChen, Xueyang, Lei Yan, Sreekar Karnati, Yunlu Zhang, and Frank Liou. 2017. "Fabrication and Characterization of AlxCoFeNiCu1−x High Entropy Alloys by Laser Metal Deposition" Coatings 7, no. 4: 47. https://doi.org/10.3390/coatings7040047
Note that from the first issue of 2016, this journal uses article numbers instead of page numbers. See further details here.