Article

Cellular Automata Modelling of Photo-Induced Oxidation Processes in Molecularly Doped Polymers

Division of Physics, University of Dundee, Perth Road, Dundee DD1 4HN, UK
Coatings 2016, 6(4), 55; https://doi.org/10.3390/coatings6040055
Submission received: 24 August 2016 / Revised: 21 October 2016 / Accepted: 2 November 2016 / Published: 4 November 2016

Abstract

:
The possibility of employing cellular automata (CA) to model photo-induced oxidation processes in molecularly doped polymers is explored. It is demonstrated that the oxidation dynamics generated using CA models exhibit stretched-exponential behavior. This dynamical characteristic is in general agreement with an alternative analysis conducted using standard rate equations provided the molecular doping levels are sufficiently low to prohibit the presence of safe-sites which are impenetrable to dissolved oxygen. The CA models therefore offer the advantage of exploring the effect of dopant agglomeration which is difficult to assess from standard rate equation solutions. The influence of UV-induced bleaching or darkening upon the resulting oxidation dynamics may also be easily incorporated into the CA models and these optical effects are investigated for various photo-oxidation product scenarios. Output from the CA models is evaluated for experimental photo-oxidation data obtained from a series of hydrazone-doped polymers.

1. Introduction

Electronically active thin plastic films are becoming increasingly important in a diverse range of consumer electronic products. The electronic properties of the plastic may either be controlled through chemically linking an electronically active moiety to a polymer backbone via a ligand, or by dispersing a suitable molecular dopant throughout an insulating polymer support [1]. The latter approach results in so-termed molecularly doped polymers (MDPs) and these generally offer greater control of the ensuing electronic properties through informed selection of the dopant-polymer pairing and the ability to specify the molecular doping concentration. MDPs have consequently been widely employed in the large-area photoreceptor imaging and LED display markets. They also provide an ideal system to study fundamental electronic transport mechanisms which frequently involve inter-molecular reduction-oxidation processes that are initiated by photo-stimulation. The unavoidable presence of soluble oxygen in MDPs may, however, initiate irreversible chemical conversion of photo-excited dopant molecules to a new molecular by-product with associated degradation of the original MDP electronic performance [2]. The ability to predict the potential degradation of proposed MDP constituents should therefore be of interest for commercial applications where operational photo-excitation of the molecular dopant exists.
An earlier study of photo-induced oxidation processes in MDPs [3] considered a situation in which the incident ultraviolet (UV) radiation was capable of inducing photo-excitation of the molecular dopant, but was below the absorption threshold of the binder polymer. Complications from possible degradation of the polymer itself are thus avoided and any measurable degradation in electronic performance may be attributed to photo-chemical conversion of the molecular dopant. By setting up appropriate rate equations that describe the molecular photo-excitation rate (G), the molecular relaxation rate (β) and the fraction of photo-excited molecules that react with soluble oxygen (φ) it was found that under certain approximations the conversion dynamics of molecular dopant (M) to photo-product (P) could be analytically described as a function of photo-exposure time (t) by [3]:
P ( t ) = Γ [ 1 e ( t τ ) γ ]
In Equation (1) it is found from the rate-equation analysis that Γ = 1, γ = 1 and τ represents a characteristic time constant where:
τ = c M c O 2 β = 1 ( ϕ G ¯ )
In Equation (2) cM represents the starting molecular doping concentration, cO2 represents the concentration of soluble oxygen, and G ¯ gives the average photo-excitation rate across the entire MDP film thickness. Simple rate-equation modelling of MDP photo-degradation, in which the detailed photo-absorption profile across the film thickness is replaced by an average value ( G ¯ ), and all dopant locations are considered to be accessible to oxygen to permit photo-product conversion (Γ = 1), then yields exact (γ = 1) exponential dynamics for P(t). These simplifying assumptions are only likely to apply to weakly-doped (cM small) MDPs, however, where photo-absorption across the film thickness is weak and significant agglomeration of molecules is unlikely. Under realistic doping scenarios for electronic applications (cM large and approaching ~50% by weight of the constituent dopant binder) the incorporation of these latter approximations into a simple set of global rate equations becomes increasingly invalid, however, and an alternative modelling approach must be considered. A possible strategy is suggested by the physical structure of the MDP itself where stochastic models of inter-molecular electronic hopping transport are frequently implemented using cubic lattices in which cellular sites are occupied by dopant molecules according to the underlying doping concentration [4,5]. A similar cellular approach has accordingly been investigated to evaluate MDP photo-degradation dynamics using simple photo-product conversion rules. The output from such cellular automata (CA) models [6] are evaluated to consider how the Γ and γ parameters in Equation (1) are likely to be influenced under realistic MDP doping and photo-absorption conditions.

2. Materials and Methods

A two-dimensional (2D) CA model was used to represent the MDP thin-film structure as depicted in Figure 1. In this CA scheme row j = 1 corresponds to the film surface and row j = N defines the overall film thickness (L). If each cell is attributed a physical length (ΔL) according to the underlying “size” of the intended MDP dopant molecule then L = N × ΔL. The majority of CA simulations were conducted for L = 1 μm so that if typically ΔL = 1 nm then N = 1000. The number of CA columns (C) was subsequently selected using a minimum value of 50 to reduce statistical noise from the resulting cellular dynamics to acceptable levels. The i = 1 and i = C columns thus define the lateral edges of the film along one axis normal to the film surface. In reality the MDP film is of course three-dimensional in nature and the necessity to extend the CA model along a further (k) axis was therefore considered. For the CA rule-set that is described below this was not found to be critical to the simulation dynamics, however, and the adoption of a 2D CA model thus yielded significant savings in computational overhead.
Each cell within the CA model was allowed to assume one of four distinct occupation states which were considered to be representative of the actual MDP film composition according to a specified numerical coding scheme; 0 = polymer + soluble oxygen (O-cell); 1 = polymer only; 2 = molecular dopant (M-cell); 3 = photo-product (P-cell). As the purpose of the CA model is to consider photo-dynamical processes within each cell it is also necessary to establish the number of photons (NPj,i) that exist at each cell location at any instant. This was accomplished by first assigning a cellular absorption coefficient (αsj,i) to each cell according to its particular occupation state (s = 0, 1, 2 or 3 as defined by the cellular numerical codes), and calculating the number of photons for all cells in the first row (NP0,i) according to the required photon flux and CA cellular area (ΔL)2. For all sub-surface cells in each column, the number of photons may then be continuously updated throughout the CA simulation by applying de-Beer’s law [7] such that NPj,i = NPj−1,i [1 − ΔLαsj,i].
To initialise the CA model at time t = 0 the 2D CA cellular matrix was first completely populated with polymer (1) states, and a proportion of these cells were then randomly replaced with M-cells according to the user-selectable doping concentration cM. Following this procedure, a proportion cO2 of the remaining polymer cells were randomly re-assigned as 0-cell states where soluble oxygen is present. The occupancy of all M-cells across the entire CA matrix was then updated through successive application of a defined rule-set which was informed by the underlying physical requirements for photo-induced M-cell to P-cell conversion. The 4-stage CA rule-set adopted to comply with the associated MDP physical processes that are necessary to allow photo-conversion is summarised in Table 1.
For every iterative time-step in a simulation all cells in the CA matrix were individually examined to determine whether the above rule specifications (1 → 4) are progressively met. A M-cell to P-cell conversion was consequently only permitted upon fulfillment of all four rules for the reference cell under consideration. Rules 1 and 2 essentially establish that the reference cell under consideration is indeed a dopant molecule (M-cell) and that photons exist at the cell location to permit excitation. Rules 3 and 4 subsequently establish whether soluble oxygen exists within the reaction-radius of such an excited cell to permit conversion to the photo-product. For rule 3 the presence of oxygen is first confirmed by examining the status of the four cells that lie immediately adjacent to the reference cell (von Neumman neighbourhood of cells in rows/columns that are located above/below the reference cell co-ordinates [6]). Provided at least one of these von Neumann neighbour cells contains oxygen it is subsequently important to consider whether this O-cell is likely to lie within the reaction-radius of the reference cell, and hence react to become a P-cell, by application of rule 4. The specification for rule 4 is defined by the probability (φj,i) that the reference cell will react. For the reference cell φj,i may then be found from Equation (2) by using the appropriate local generation rate (Gj,i) where G j , i = G ¯ ( N P j , i / N P 0 , i ) . The statistical occurrence of reaction may finally be invoked by generating a random number (R) sourced from a uniform deviate on the range 0 ↔ 1 and permitting photo-conversion to proceed if R ≤ φj,i.
Following the global application of the above rule-set across the entire CA cell matrix, the O-cells that are consumed in successful M-cell → P-cell reactions are converted to polymer-only cells. All of the consumed 0-cells are then immediately replaced by performing a random assignment to available polymer cells to maintain the oxygen solubility limit at the initial cO2 fraction. This procedure acknowledges that under non-encapsulated conditions at the film surface the diffusion of oxygen is generally expected to be rapid and unrestricted throughout MDPs and thus should not dictate the conversion dynamics. The underlying time-step Δt that is associated with each successive CA update procedure is informed by the fundamental photo-conversion processes and in particular the molecular relaxation parameter β in Equation (2) which characterises the longevity of excited molecular states for reaction with soluble oxygen. In general Δt ≤ 0.1 β−1 was employed during CA simulations to ensure that the applied rule-set sampled potential photo-conversion events during a suitably short time interval before eventual relaxation. For the cM and cO2 parameter ranges explored this required that the total number of CA time-steps that were executed during a typical simulation to cover a time span of up to 20 τ was around 104. The information recorded throughout simulations at the conclusion of each CA time-step were the global proportion of photo-product P-cells, found by counting the total number of P-cells across the entire CA matrix, and the average number of emergent photons across the bottom (j = N) rows relative to the illuminated surface magnitude. This latter photonic information allowed the dynamics for optical absorbance to be modelled. All CA simulations were repeated using a minimum of 5 different random number seeds to ensure reproducibility of the dynamics and to permit statistical averaging of summary dynamical parameters.
Output from the CA simulations was evaluated against experimental data obtained from a series of hydrazone-doped polymer thin films. These MDP samples comprised cM = 50% by weight doping of p-diethylaminobenzaldehyde-1,1ʹ-diphenylhydrazone (DEH) in a commercial polyester binder and were subject to ultraviolet (UV) irradiation at 375 nm in order to induce a photo-oxidation conversion of the DEH to an indazole (IND) photo-product [8,9,10]. As demonstrated in an earlier paper [3] it is possible to deduce the concentration of IND molecules in such films using a combination of time-of-flight (TOF) and space-charge-limited current (SCLC) measurements. A restricted amount of photo-product dynamical information may thus be experimentally established for this MDP material using a finite number of samples which are exposed across a wide range of UV exposure times (102 s → 105 s).

3. Results

A typical set of CA simulation data is presented in Figure 2 where the fractional amount of initial molecular dopant (M0) that is converted to photo-product is plotted as a function of photo-exposure time. The fixed CA parameters used in these simulations are listed in the figure caption and the curves plotted have been obtained for different doping concentrations cM as indicated.
It is immediately interesting to consider whether such CA output may be appropriately described using the analytical expression embodied by Equation (1). To investigate this possibility, Equation (1) was accordingly fitted to the CA data using a Levenberg-Marquardt minimisation algorithm where the τ and γ fitting parameters were unconstrained but the Γ parameter was subject to the physical restriction that Γ ≤ 1. Optimised fitting could then be achieved as demonstrated by the symbols in Figure 2 provided γ ≤ 1 and it is consequently apparent that the photo-conversion dynamics may generally exhibit a stretched-exponential characteristic as opposed to exact (γ = 1) exponential dynamics inferred from the previous rate-equation study [3]. The emergence of this subtly different dynamical behaviour is to some extent anticipated since the CA model is now capable of handling local cellular φj,i effects which translate to an effective range of characteristic time constants throughout the film thickness.
The Equation (1) parameters required to fit the CA dynamical output may thus be conveniently used to establish the key changes that arise in the photo-conversion dynamics as the MDP properties (molecular doping concentration, soluble oxygen concentration and optical absorption coefficients) are varied. The key findings from this CA simulation work are summarised in the following sections where in all cases N = 1250, C = 50, ΔL = 0.8 nm, β = 10−2 s−1 and NP0,i = 160 which corresponds to a surface photon flux of 2.5 × 1016 cm−2 s−1 as was typically used in actual experimental UV exposure of the hydrazone MDP films.

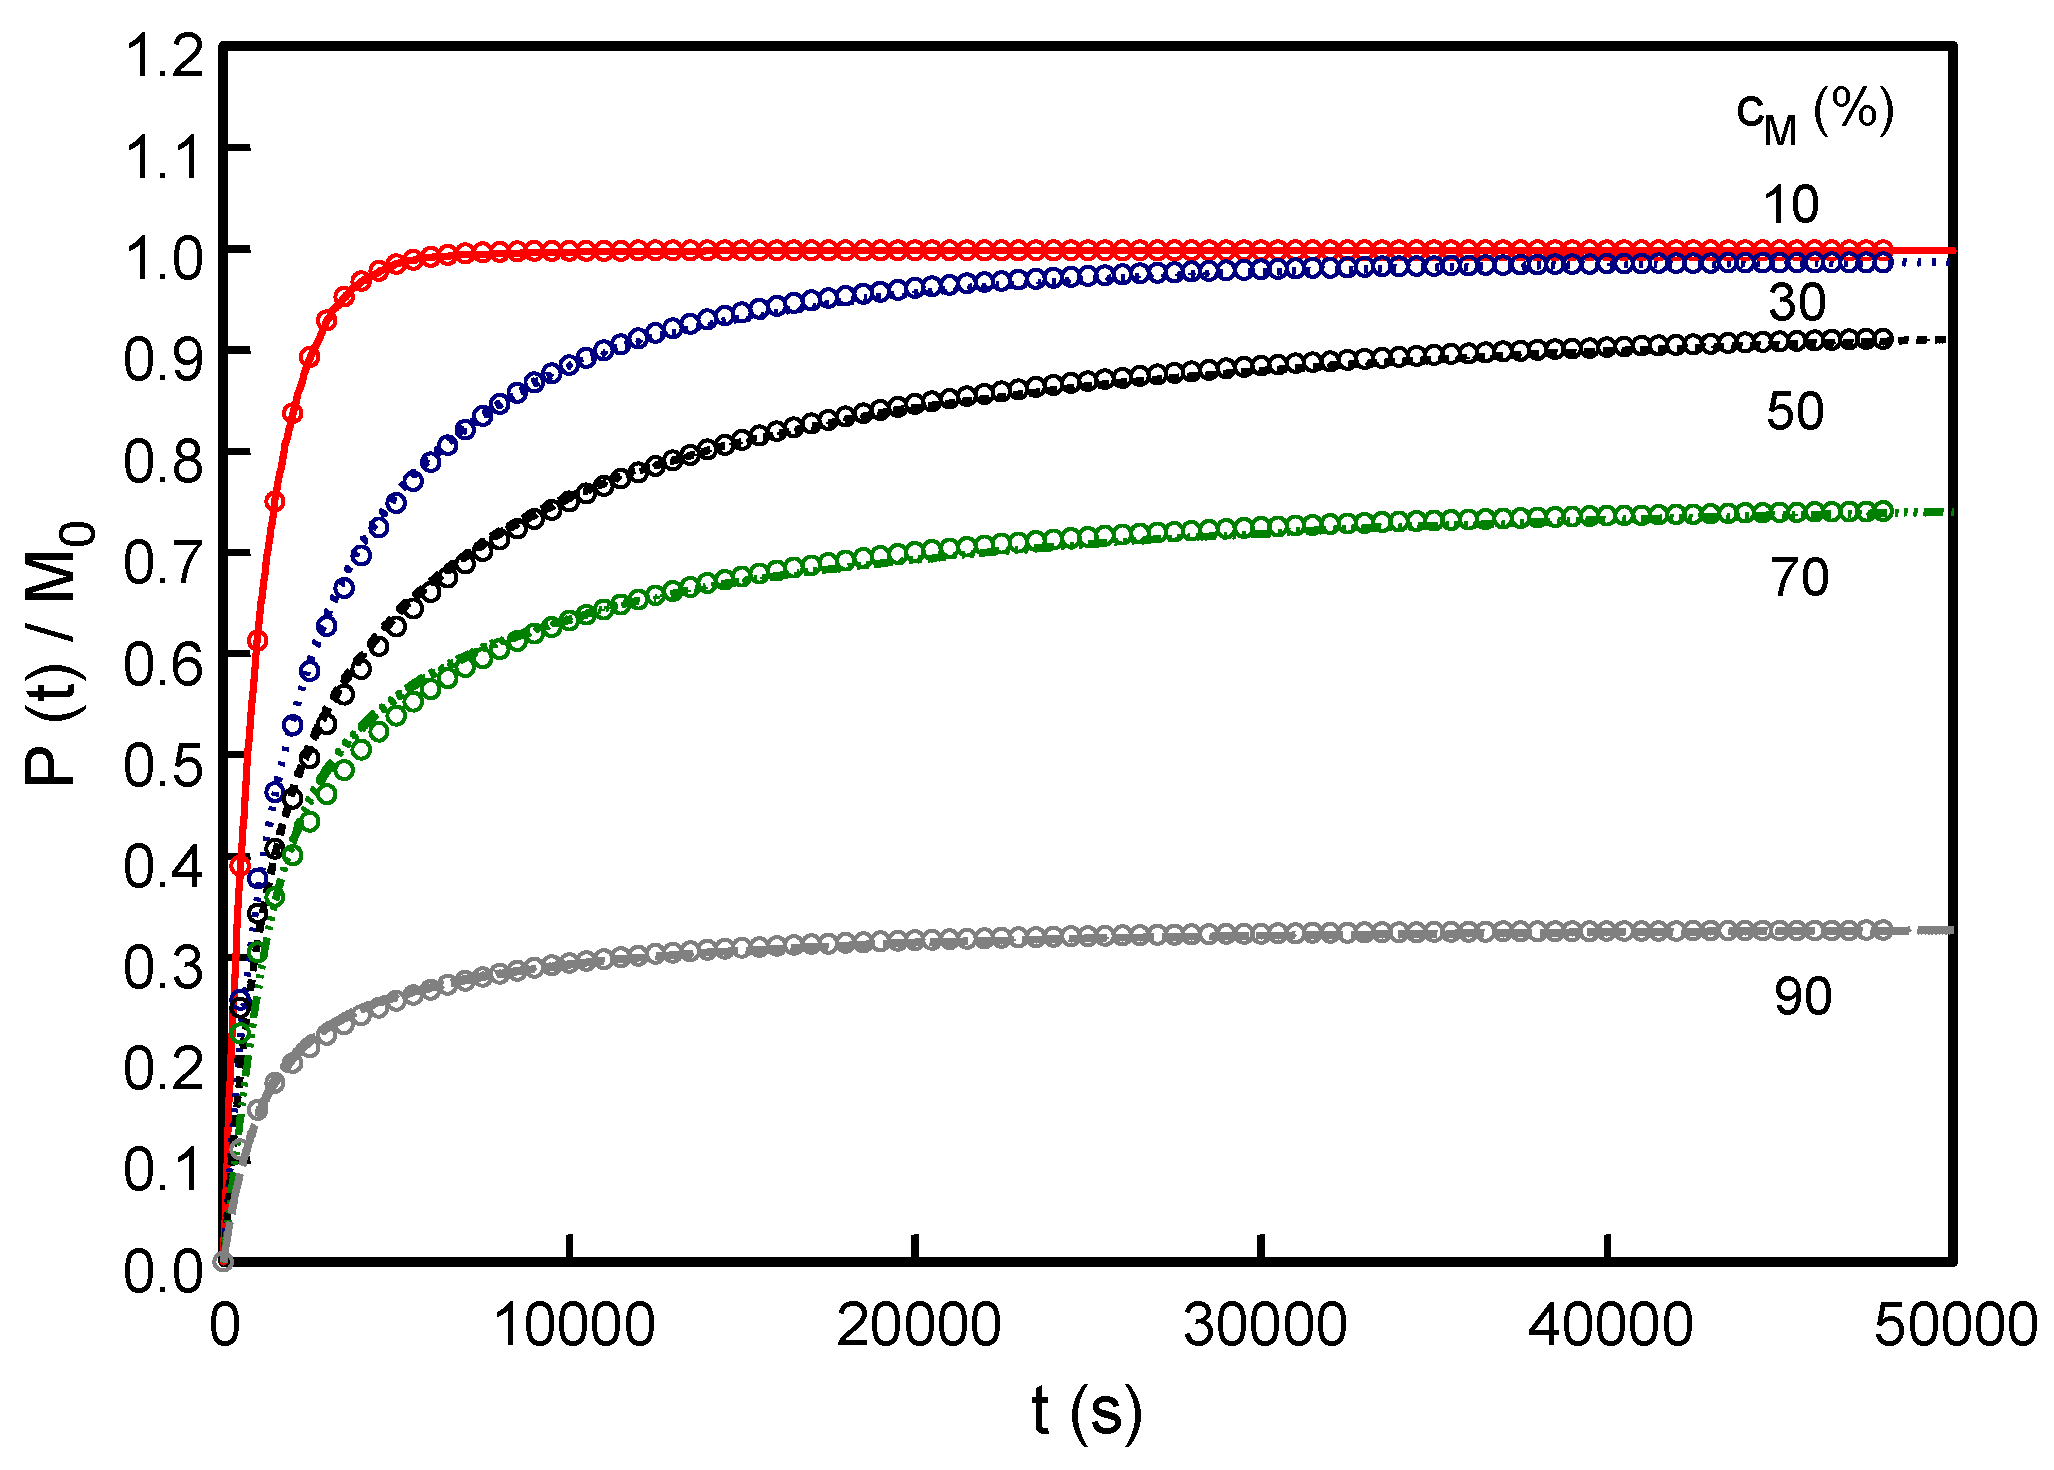
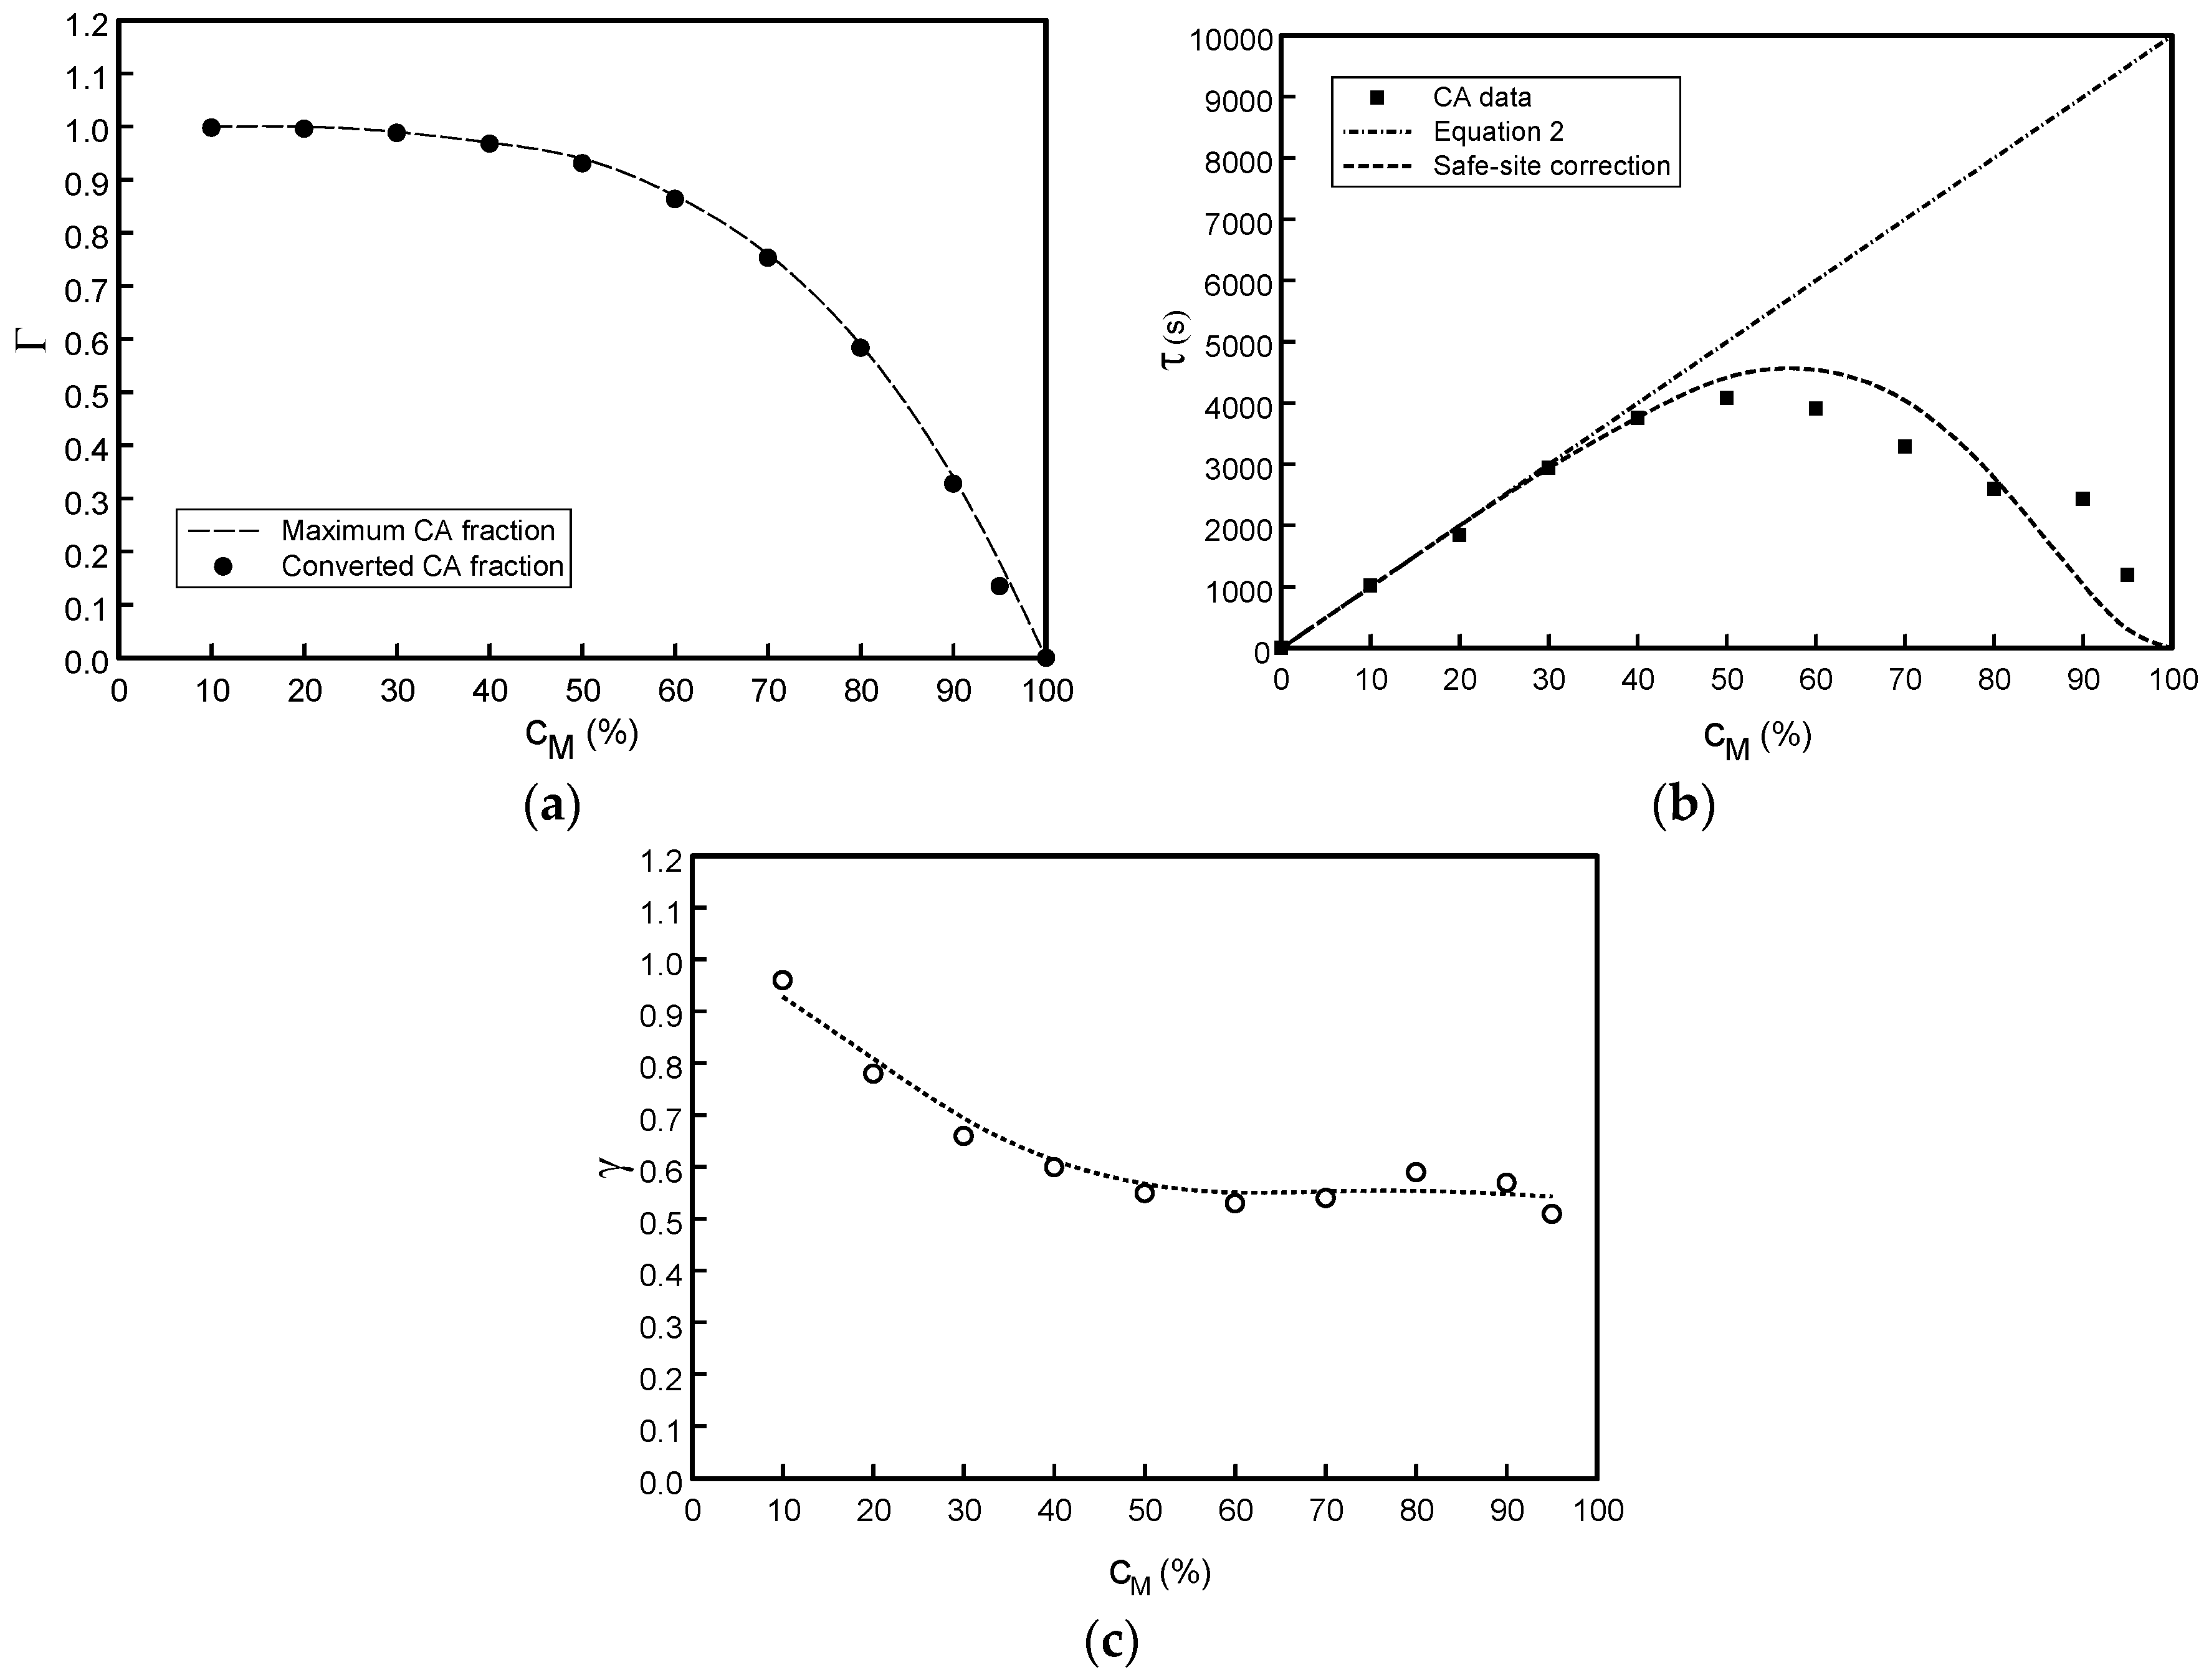
3.1. Effect of Varying Dopant Concentration (cM)

The dependence of the dynamical parameters upon doping concentration are shown in Figure 3 where in all cases the soluble oxygen concentration was held fixed at cO2 = 1%. For these CA simulations only the dopant molecule was permitted to absorb photons (α2 = 105 cm−1, typical for UV absorption by hydrazone molecules) and all other CA constituents were optically transparent (i.e., α0 = α1 = α3 = 0).
The Γ parameter plotted Figure 3a is observed to fall below the maximum possible 100% conversion magnitude as cM is progressively increased before approaching a final zero conversion rate when cM = 100% in the pure molecular glass. These Γ values are in good agreement with the maximum possible conversion fraction shown as the dashed curve. This curve is obtained by identifying the fraction of dopant “safe-sites” which may not undergo conversion to the photo-product since all four of their surrounding nearest-neighbours are also dopants and so oxygen cannot reside within the reaction radius (i.e., the corresponding CA rule for conversion, rule 3, is never fulfilled). An example of such a “safe-site” is highlighted in Figure 1.
The concentration of “safe-sites” appears to become significantly greater when cM > 50% and the agglomeration of dopant cells is enhanced. This is confirmed by the τ parameter data plotted in Figure 3b where it is noted that for lower doping concentrations (cM < 50% where Γ ~ 1) τ follows the expected linear increase with cM as predicted by Equation (2). At higher cM concentrations where “safe-sites” are present, however, there is an effective change in both the rate of conversion and the attainment of full conversion by a further factor of Γ. The characteristic time constant in Equation (2) is accordingly expected to be moderated by a factor of Γ2. This agglomeration effect appears to broadly agree with the CA τ data as evidenced by the dashed curve in Figure 3b.
More generally the absorption profile and associated generation rate will become highly non-uniform throughout the film thickness for cM > 1/α2L. Under strong optical absorption conditions φj,i will then show a strong local variation which results in stretched-exponential behaviour (γ < 1 in Figure 3c) as previously discussed. From Figure 3c the reduction in γ is seen to be progressive until cM ~ 0.5 when γ ~ 0.55. The attainment of this minimum γ magnitude is again attributable to the CA rule-set where it is necessary for NPj,i to exceed unity (rule 2). For larger cM this results in only a sub-fraction (J*) of the rows in any CA column being able to meet the criteria from optical absorption considerations for which N P 0 , i e c M α 2 J * Δ L = 1 . It follows that:
J * = ln ( N P 0 , i ) c M α 2 Δ L
It is interesting to note that although J* represents the sub-fraction of CA rows that lie immediately below the film surface at the start of the simulation (i.e., j = 0 ↔ J* at t = 0), the location of this sub-fraction of excited cells will gradually sink downwards as photo-conversion progresses and cells nearer the surface become bleached since α3 = 0 for the photo-product. The effects of photo-bleaching (α3 < α2) and photo-darkening (α3 > α2) are explored further in Section 3.3.

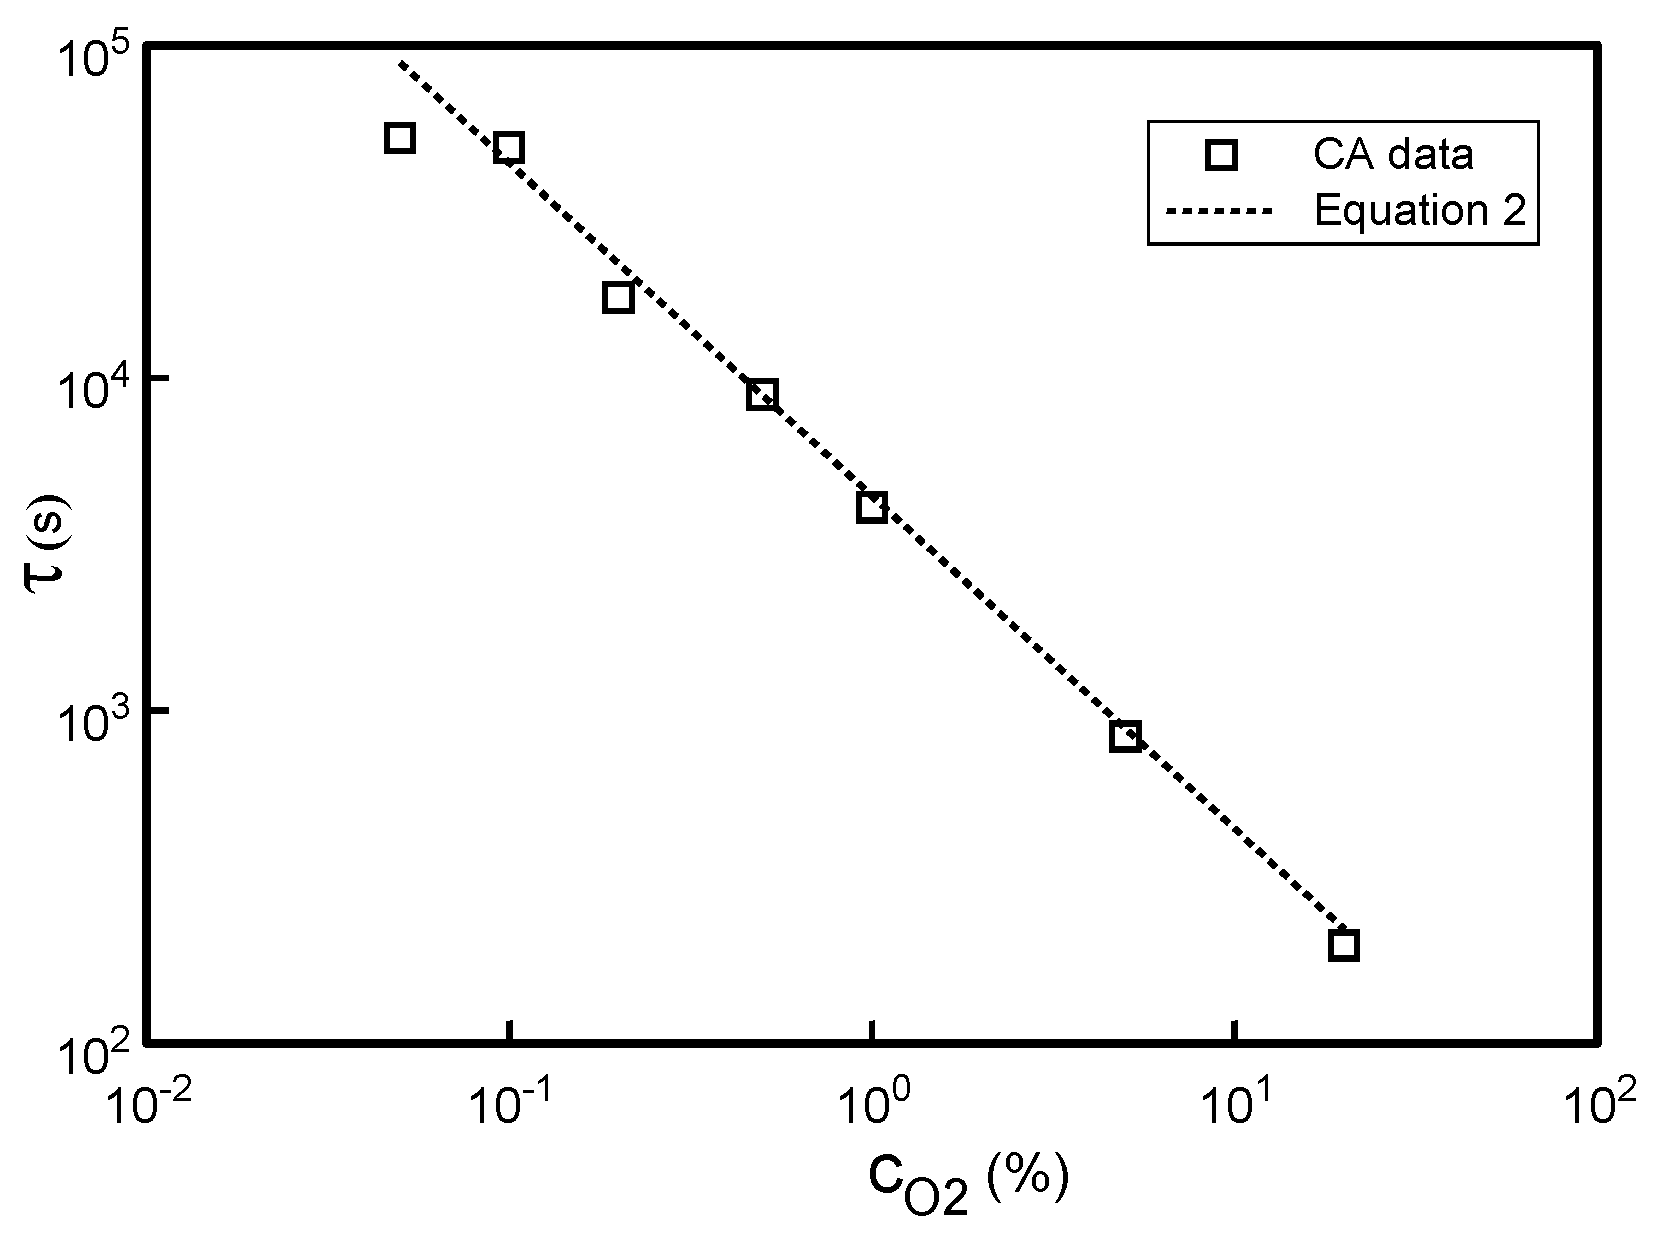
3.2. Effect of Varying Soluble Oxygen Concentration (cO2)

The influence of varying the soluble oxygen concentration upon the dynamical parameters was investigated where in all cases the molecular doping concentration was held fixed at cM = 50%. For these CA simulations only the dopant molecules were again permitted to absorb photons with all other CA constituents being optically transparent as specified in Section 3.1. It is now anticipated from the discussions concerning the CA results in Section 3.1 that both the Γ and γ parameters will not exhibit any dependence upon cO2 as this does not affect either the proportion of “safe-sites” or the optical absorption profile in the films. These expectations were confirmed for CA simulations run for 0.05% ≤ cO2 ≤ 20% where the average values found for Γ and γ were 0.93 ± 0.01 and 0.55 ± 0.02 respectively.
The amount of soluble oxygen is of course expected to influence the conversion rate from the CA rule-set (more oxygen = faster conversion = smaller τ) and this is confirmed by the data shown in Figure 4. The CA data are indeed found to agree well with the characteristic τ magnitudes calculated from Equation (2) which is plotted as a dashed line.

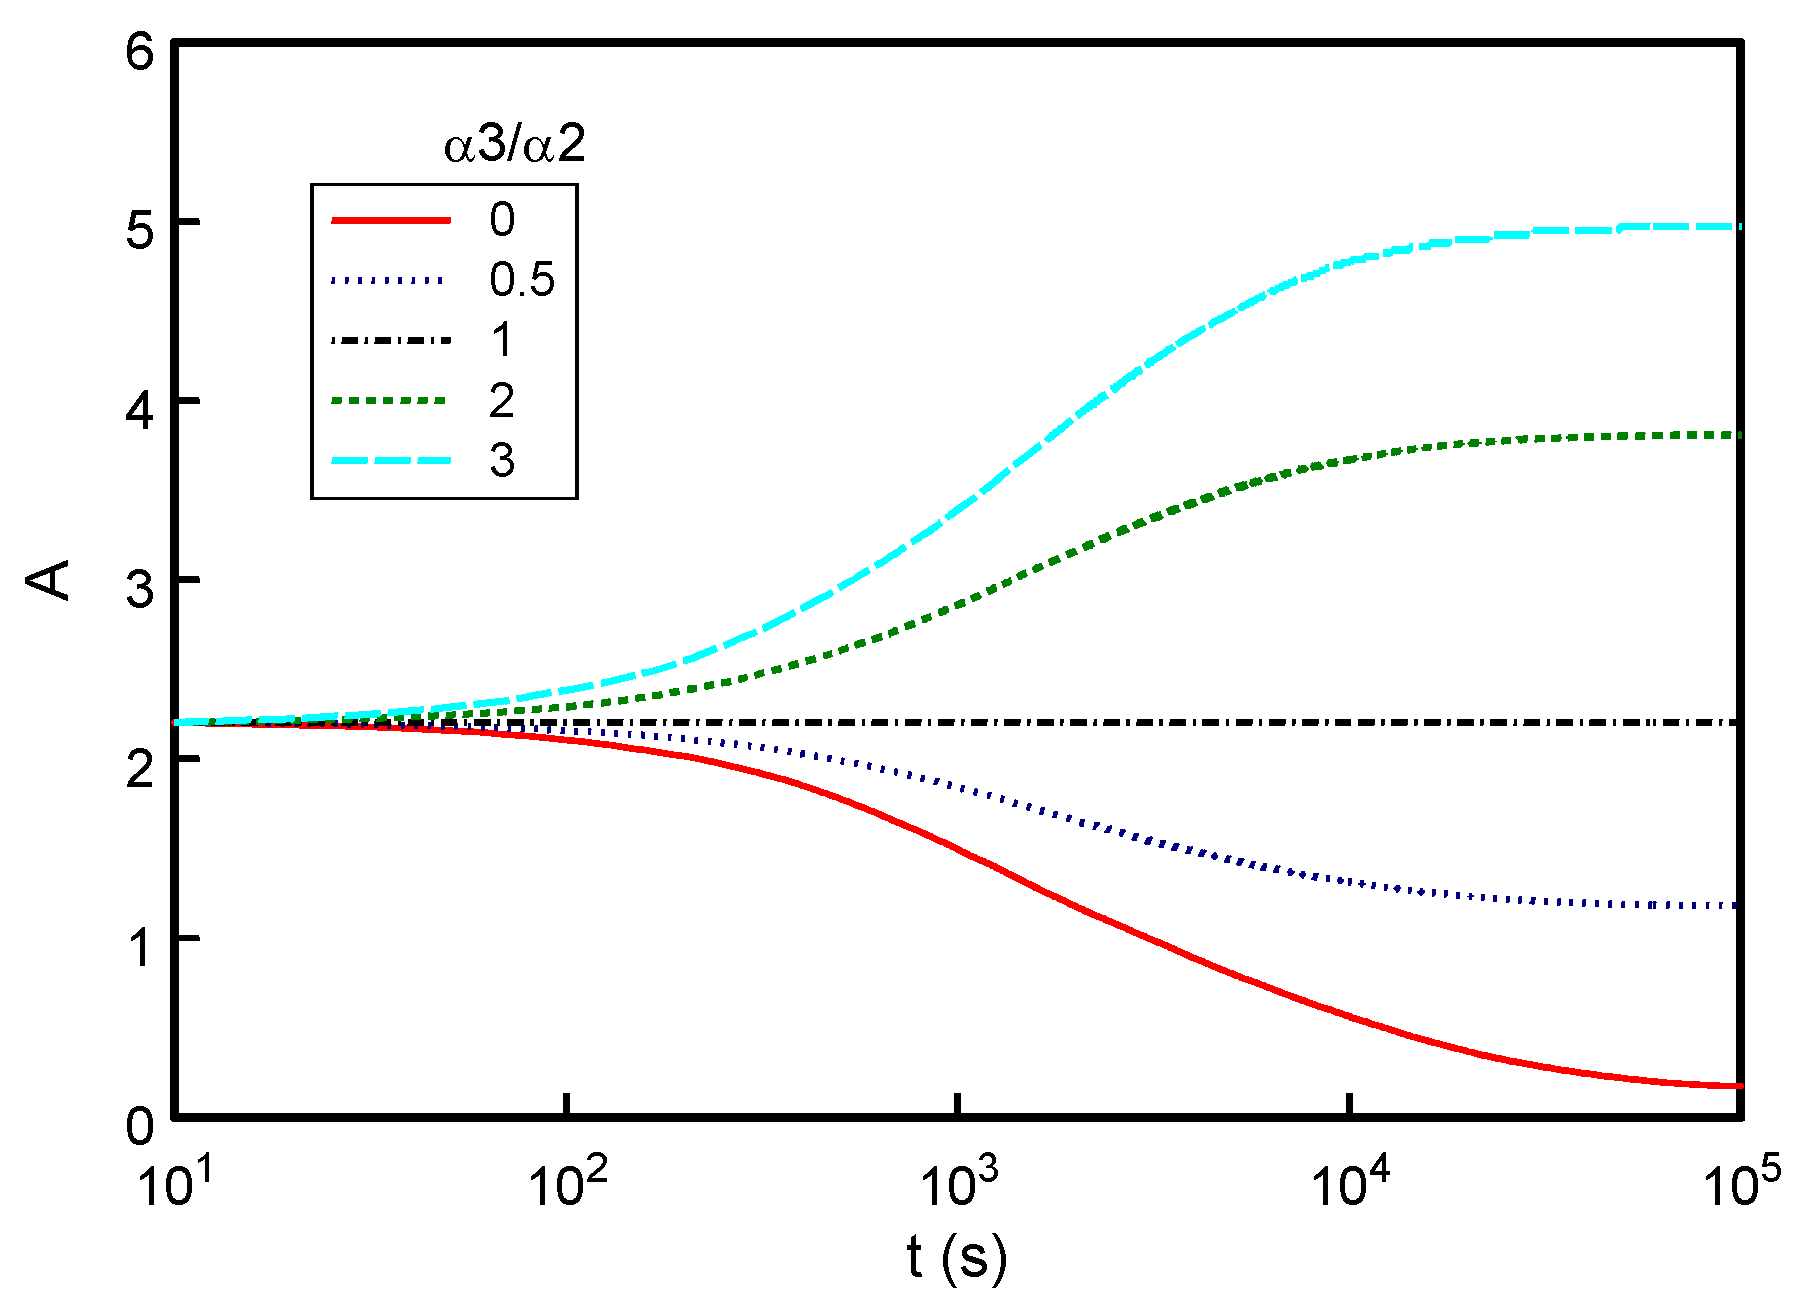
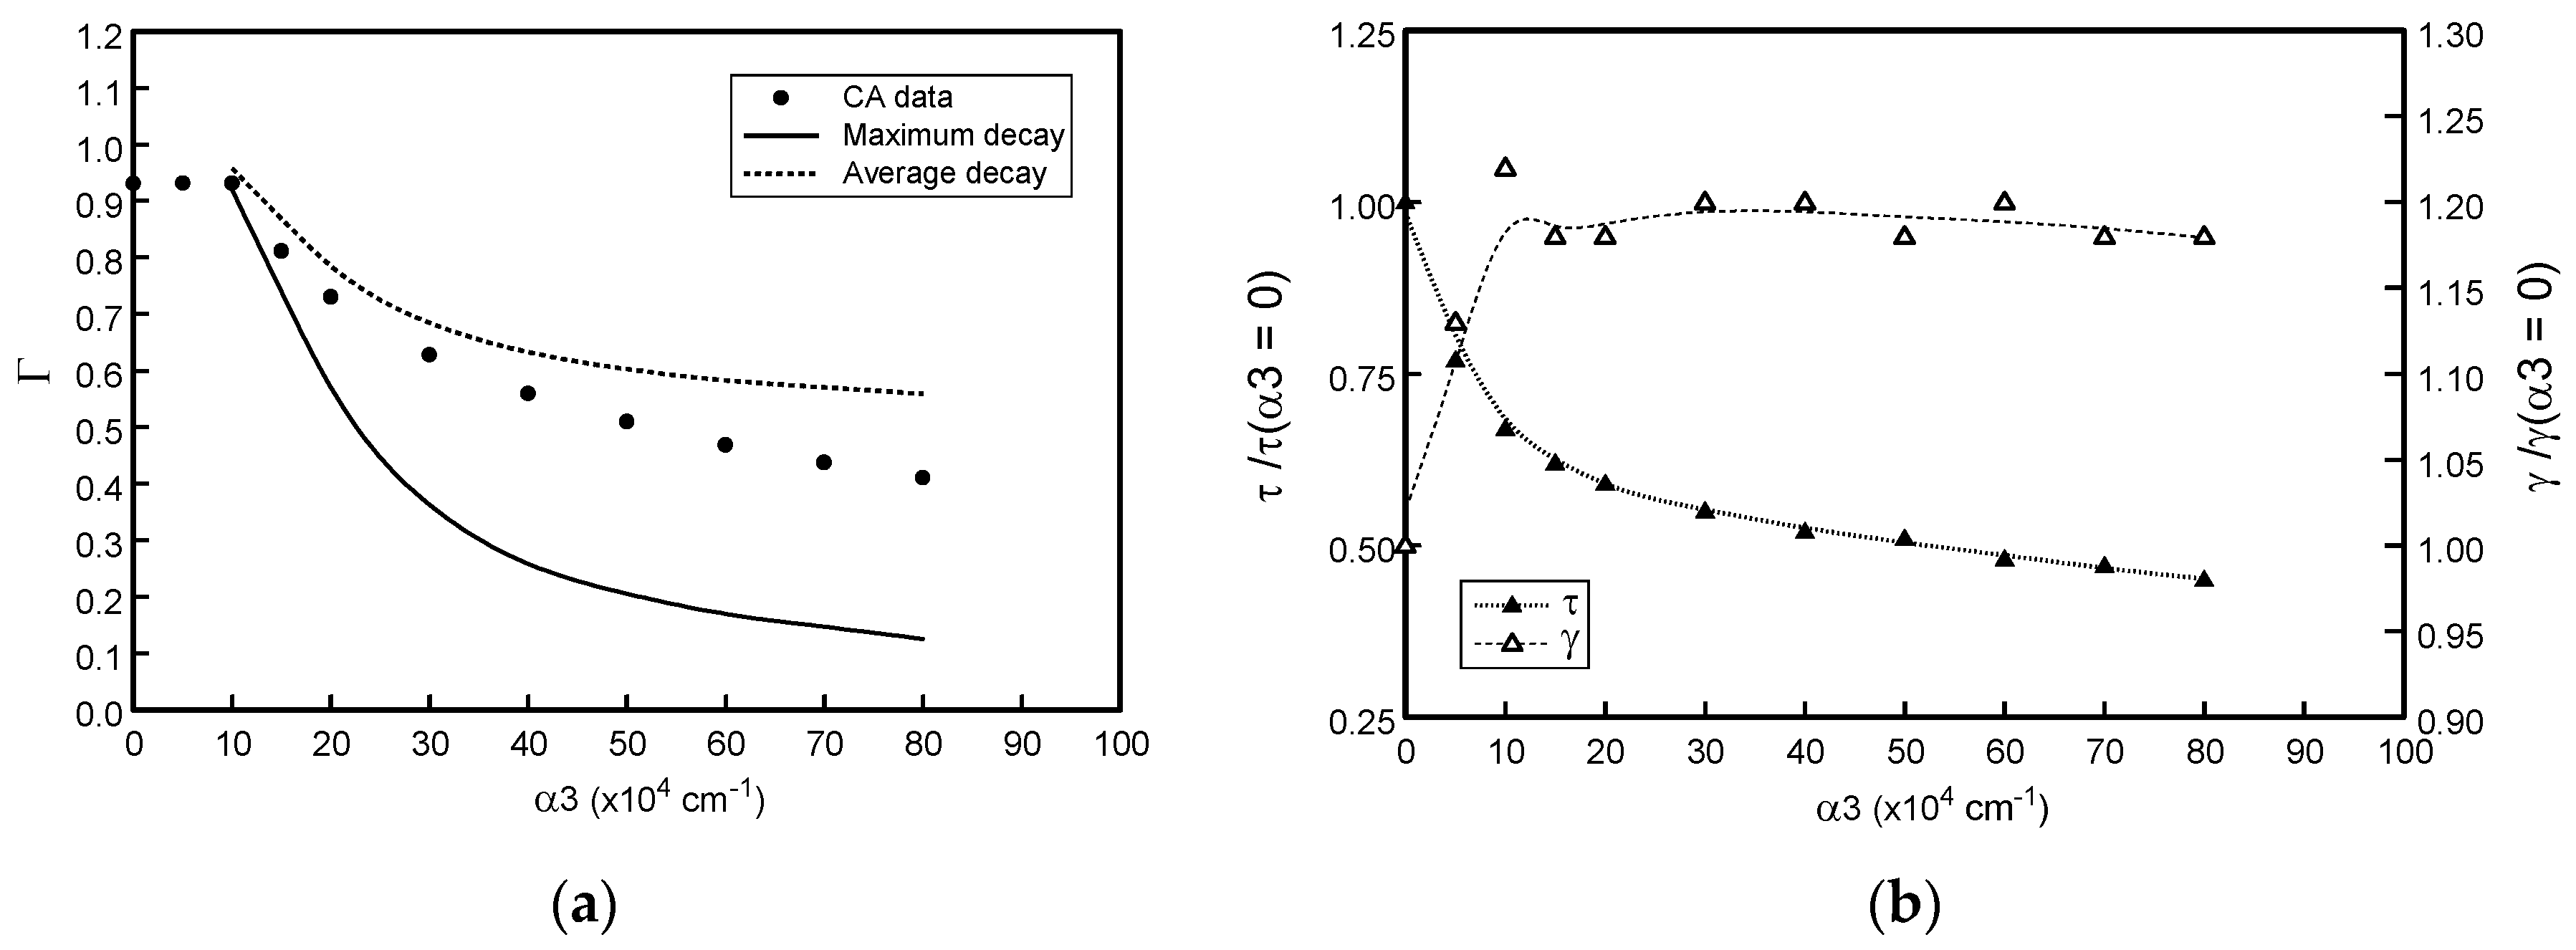
3.3. Effect of Varying Optical Absorption Properties (αs)

The CA results presented in Section 3.1 indicate that the inherent detail of the molecular excitation rate Gj,i (and the corresponding cellular reaction probability φj,i) have a strong influence upon the resulting stretched-exponential dynamics of photo-product conversion. It is therefore important to further investigate how the optical absorption properties of the molecular dopant and photo-product affect the characteristic dynamical parameters. The previously presented CA data have so far only considered the situation where α3 = 0 which equates to extreme photo-bleaching. In this situation the optical absorbance (A) of the films will display the greatest overall decrease for a given exposure interval. The dynamical variation of A will depend upon the relative absorption strength of the photo-product and molecular dopant, however, so that for α3 < α2 photo-bleaching will occur (A ↓), for α3 = α2 A remains constant, and for α3 > α2 photo-darkening will occur (A ↑). These optical absorbance effects are confirmed by the CA data given in Figure 5 where in all cases α2 = 105 cm−1.
The associated effect upon the characteristic dynamical parameters are summarised in Figure 6. The Γ parameter in Figure 6a is observed to fall when there is photo-darkening of film. This effect arises as CA M-cells that lie deep relative to the film surface are increasingly shielded by P-cells to a limiting point where there are no photons present and the required CA conversion rule 2 is not fulfilled. The deeper M-cells within the CA matrix are thus rendered to become effectively “safe-sites” via P-cell shielding. The maximum possible rate at which Γ falls as the photo-darkening regime is entered may be calculated by assuming that photo-conversion is instantaneous so that α2 is replaced by α3. From Equation (3) the fraction J* of cells that are then available for conversion is reduced by α2/α3 which is indicated by the solid curve in Figure 6a. Such an instantaneous conversion does not occur, however, and in practice there exists a composite fraction of M-cells and P-cells, with an associated J* magnitude, that varies between the limiting values set by α2 and α3. Using the simple J* average of these limits Γ would then be estimated to fall as ½[1 + (α2/α3)] which is plotted as the dashed curve in Figure 6a. The actual CA data in the photo-darkening region is observed to fall somewhere between these scenarios and reflects the dynamical complexity that is inherent from the optical absorption properties.
The τ parameter in Figure 6b is observed to continuously fall as photo-product absorption becomes stronger which is again consistent with a global increase of φj,i and the probability of photo-conversion being enhanced from the CA rule-set. The decrease of τ is accompanied by a small increase in γ (Figure 6b) but only until the photo-darkening regime is encountered. The saturation of γ in the photo-darkening region is similar to that observed for cM > 50% in Figure 3c and is again a consequence of the CA rule-set only being fulfilled for a fraction of the cells across the film thickness as P-cell absorption becomes stronger (i.e., J* < N from Equation (3)).

4. Discussion

The preceding analysis of CA simulation results using Equation (2) establishes how the characteristic dynamical parameters for photo-conversion are linked to fundamental physical properties of the MDP. A value of Γ below unity could therefore be associated with molecular dopant aggregation (linked to high cM), or may alternatively reflect stronger optical absorption in the photo-product relative to the molecular dopant (also possible at low cM). The optical absorption profile through the film thickness also has a strong influence upon the stretched-exponential exponent γ; knowledge of the characteristic time constant τ permits the molecular relaxation rate β to be determined from Equation (2) provided values for cM and cO2 are available. The correct interpretation of the parameter sets that emerge when experimental data is fitted to Equation (1) may then be assisted by information that is either directly known concerning the MDP film and photo-exposure conditions (thickness L, doping concentration cM, surface photon flux)) or can be independently established by supportive measurements (soluble oxygen concentration cO2 for polymer binder, absorption coefficients α2, α3 for molecular dopant and photo-product). For the experimental MDP data available in the present work it was known that L = 6.5 μm, cM = 50%, photon flux = 2.5 × 1016 cm−2 s−1, cO2 = 0.025%, and α2 = 10 × 104 cm−1. No information was available concerning α3 for the IND photo-product. Experimental data for DEH → IND photo-conversion in these MDP films is shown in Figure 7 together with the optimum solid fitted curve using Equation (1). The characteristic dynamical parameters returned from the unconstrained fit are Γ = 1.00, γ = 0.85 and τ = 7.0 × 10⁵ s giving β = 2.8 × 10⁻³ s−1 from Equation (2). Although the fitted Γ value is close to that expected from CA simulations where agglomeration effects should not be important (and indeed are not visually detectable in the deposited MDP films), the corresponding fitted γ value appears to be rather higher than predicted (Figure 3c) given that optical absorption is strong in the films (cM·α2·L = 32.5). It is therefore informative to consider whether an acceptable fit may be obtained using the suggested Γ = 0.95 and γ = 0.55 CA parameters from Figure 3 for cM = 50% (assuming α3 = 0 for IND). This constraint returns a slightly larger value for τ by a factor of around two and generates a slightly poorer fit indicated by the dashed curve in Figure 7. It is evident that to confidently extract characteristic stretched-exponential parameters using Equation (1) demands that photo-conversion data are available for exposure times that extend beyond the characteristic time constant τ. This is difficult to experimentally achieve in the present hydrazone MDP system, however, where τ is of the order of 10 days. It is nevertheless encouraging to note that the photo-conversion dynamics for exposure data gathered below τ is unambiguously sub-linear so that the existence of CA-predicted stretched-exponential behaviour is confirmed for this hydrazone MDP system.
The acquisition of sufficient experimental data is problematical using the TOF and SCLC detection methods for the photo-product as this involves the preparation and post-exposure measurement of multiple samples. The exposure requirements for some of these samples also become prohibitively long to cover the required wide range of exposure times. An alternative experimental approach that yields a continuous data-set as exposure progresses would thus be attractive and a possible approach is suggested by the optical absorbance data that were presented in Figure 5. By monitoring the dynamical evolution of A with exposure time it should in principle be possible to deduce the characteristic stretched-exponential parameters provided there is sufficient knowledge of the optical properties of the dopant and photo-product at the exposure wavelength. The optical detection equipment must also be capable of measuring the potential range of film optical densities throughout the exposure period. Tailoring of the film thickness, and selection of appropriate substrates that are UV transparent, will accordingly be important factors to facilitate the success of this method.

5. Conclusions

Cellular automata provide an appropriate modelling environment in which to evaluate photo-induced conversion dynamics in molecularly doped polymer thin films. The variation of the optical absorption properties across local cells is found to promote a range of photo-conversion times from the underlying CA rule-set which leads to a characteristic stretched-exponential behaviour for the photo-conversion dynamics. The existence of safe-sites which cannot be photo-converted due to either dopant agglomeration or photo-shielding effects also emerges from the CA rule-set details. Experimental evaluation of the CA model demands that data is available over a wider dynamical time range than is presently available. The acquisition of optical absorbance data may in practice offer the best opportunity to experimentally confirm the CA results.

Acknowledgments

The author acknowledges access to industrial coating equipment that was used to fabricate the MDP samples used in the experimental work.

Conflicts of Interest

The author declares no conflict of interest.

References

  1. Goldie, D.M. Organic Charge Transport Materials for Xerographic Imaging. In Handbook of Photochemistry and Photobiology; Nalwa, H.S., Ed.; American Scientific Publishers: Valencia, CA, USA, 2003; Volume 2, pp. 195–256. [Google Scholar]
  2. Giannouli, M.; Drakonakis, V.M.; Savva, A.; Eleftheriou, P.; Florides, G.; Choulis, S.A. Methods for improving the lifetime performance of organic photovoltaics with low-costing encapsulation. Chemphyschem 2015, 16, 1134–1154. [Google Scholar] [CrossRef] [PubMed]
  3. Goldie, D.M. Trap generation dynamics in photo-oxidised DEH doped polymers. Coatings 2015, 5, 263–277. [Google Scholar] [CrossRef]
  4. Pautmeier, L.; Richert, R.; Bassler, H. Anomalous time-independent diffusion of charge-carriers in a random potential under a bias field. Philos. Mag. B 1991, 63, 587–601. [Google Scholar] [CrossRef]
  5. Borsenberger, P.; Pautmeier, L.; Bassler, H. Charge transport in disordered molecular-solids. J. Chem. Phys. 1991, 94, 5447–5454. [Google Scholar] [CrossRef]
  6. Schiff, J.L. Cellular Automata: A Dscrete View of the World, 1st ed.; John Wiley and Sons Inc.: Hoboken, NJ, USA, 2008; pp. 89–184. [Google Scholar]
  7. Bube, R.H. Photoeletronic Properties of Semiconductors, 1st ed.; Cambridge University Press: Cambridge, UK, 1992; p. 1. [Google Scholar]
  8. Pacansky, J.; Coufal, H.C.; Brown, D.W. The photocyclization of a hydrazone to an indazole. J. Photochem. 1987, 37, 293–313. [Google Scholar] [CrossRef]
  9. Pacansky, J.; McLean, A.D.; Miller, M.D. Theoretical calculations and experimental studies on the electronic structures of hydrazones and hydrazone radical cations: Formaldehyde hydrazone and benzaldehyde diphenylhydrazones. J. Chem. Phys. 1990, 94, 90–98. [Google Scholar] [CrossRef]
  10. Stasiak, J.W.; Storch, T.J. Hole mobilities in photochemically modified DEH-doped polycarbonate. J. Imaging Sci. Technol. 1996, 40, 299–303. [Google Scholar]
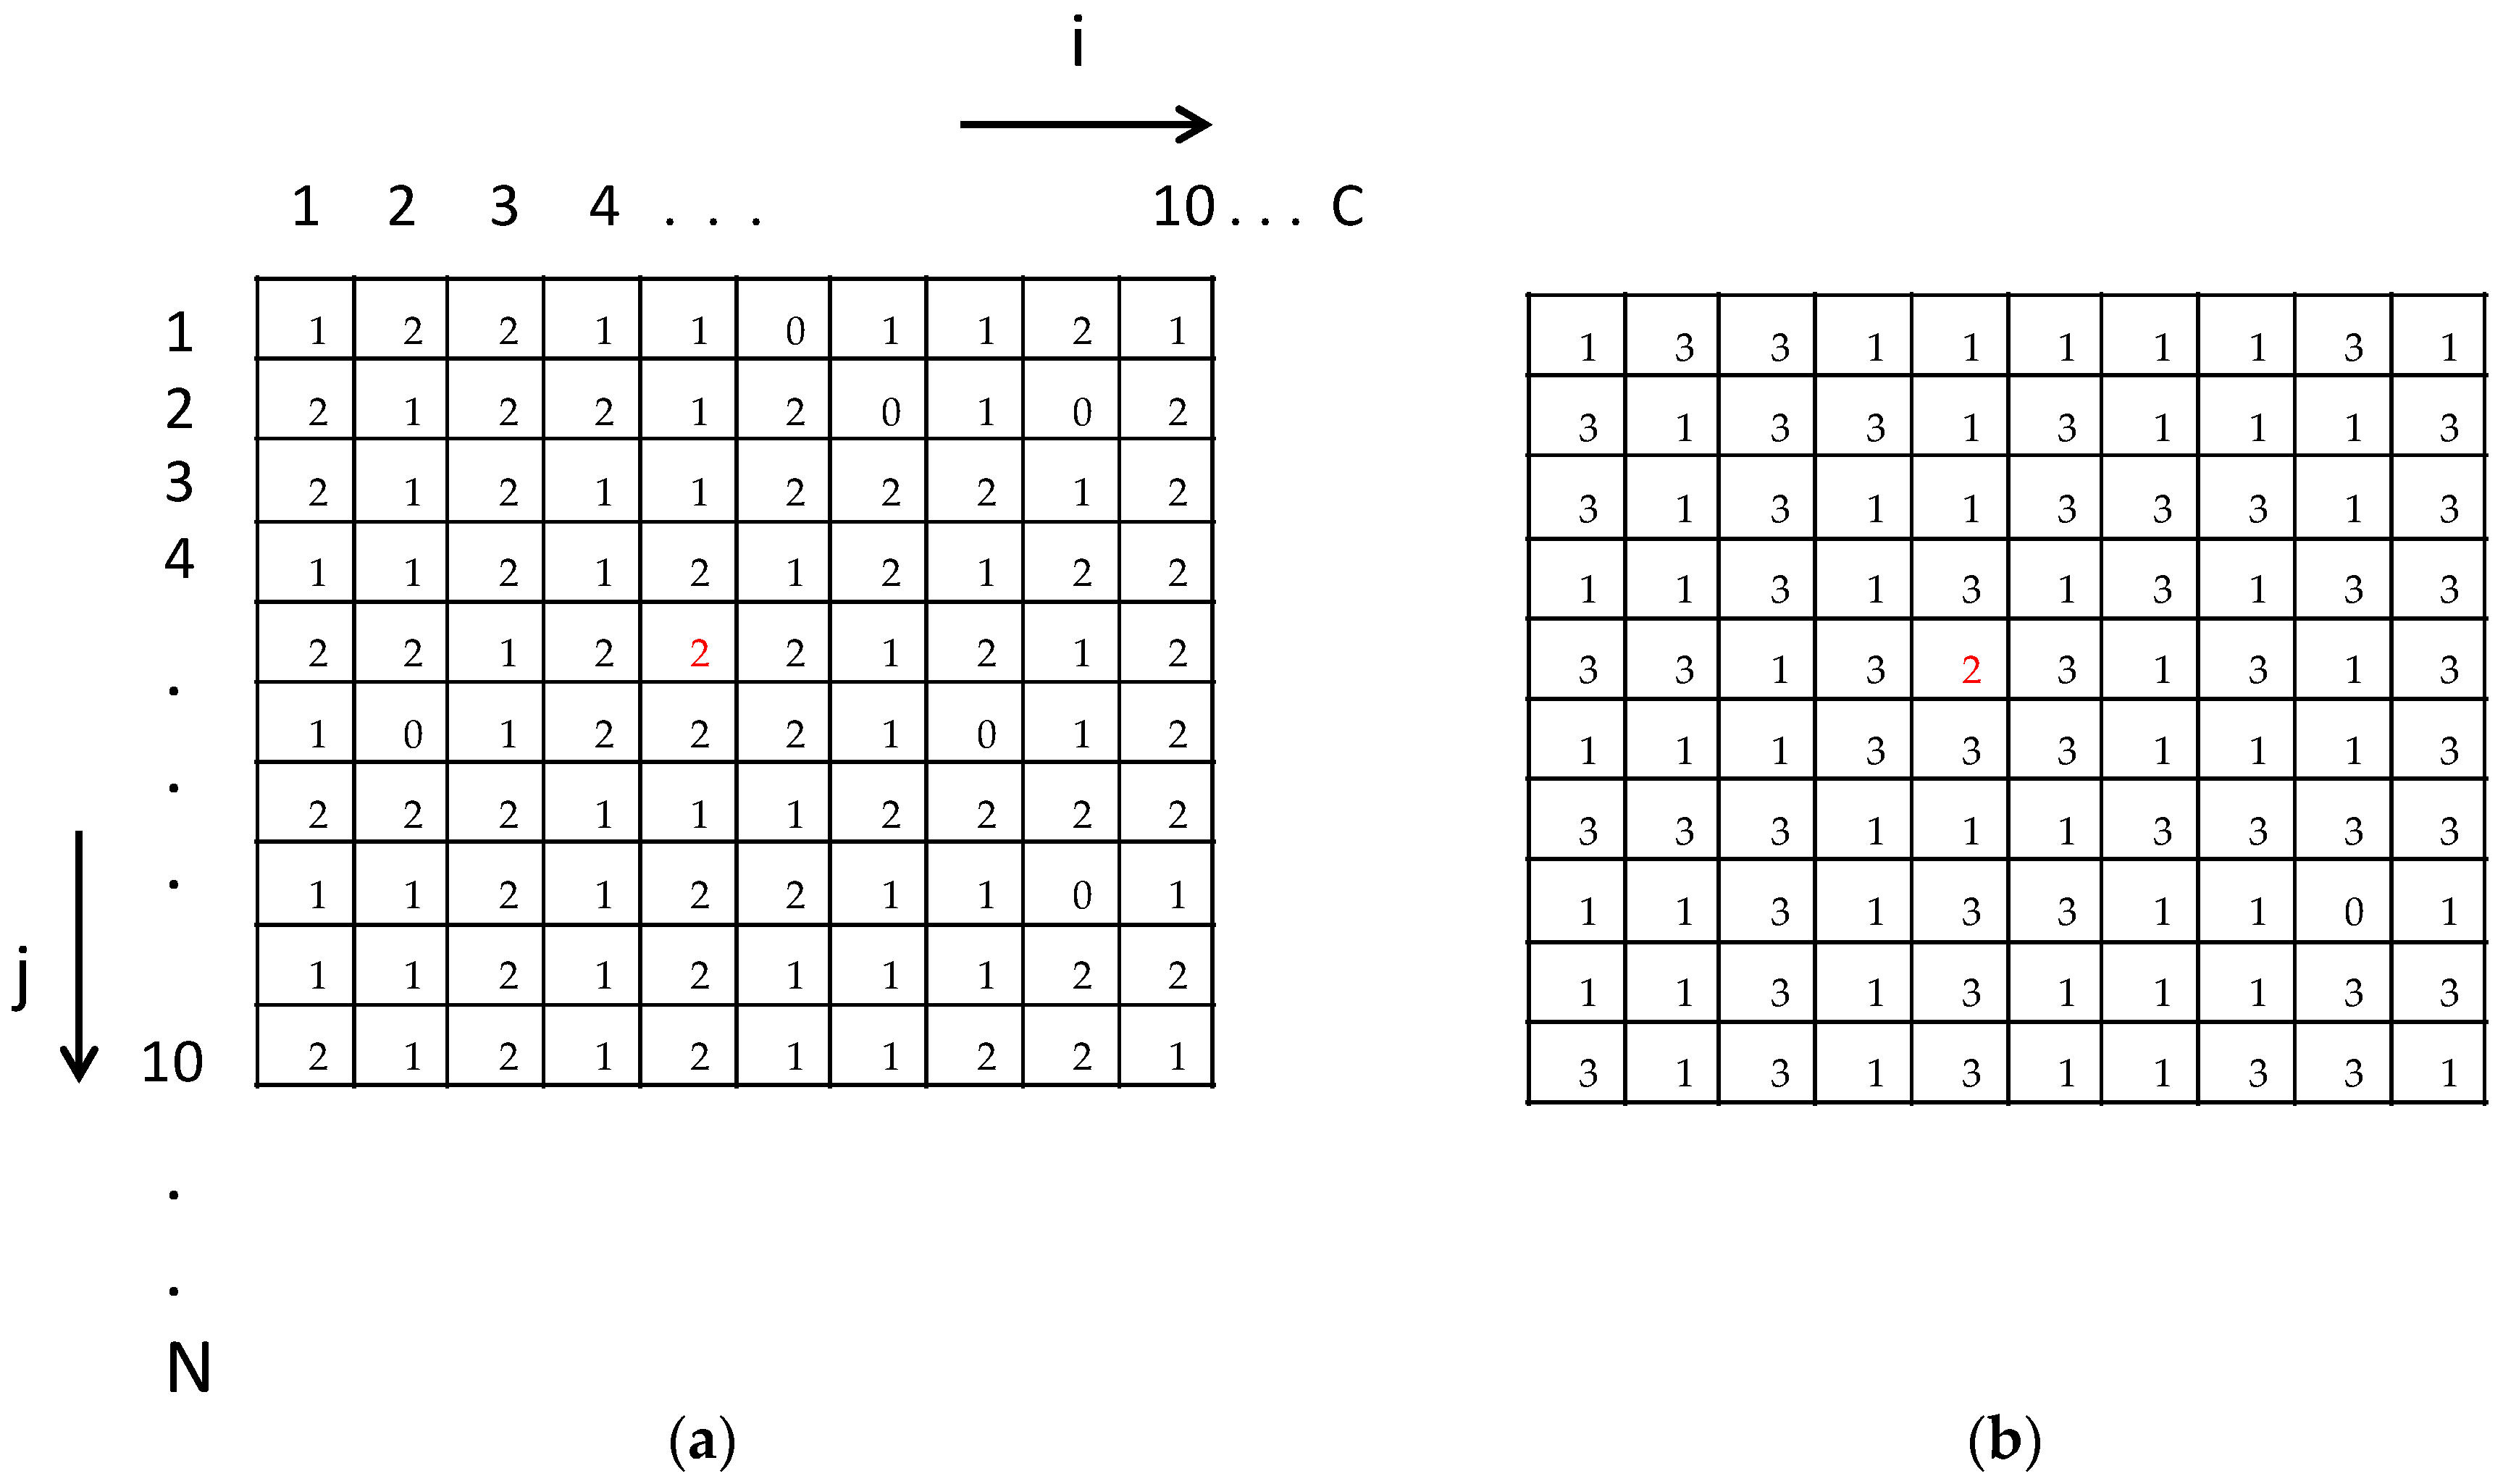
Figure 1. Cellular automata (CA) scheme used to model photo-oxidation in molecularly doped polymers (MDPs). Row j = 1 represents the photo-exposed film surface. The CA cell entries (0, 1, 2 or 3) are defined in the text. Portions of CA arrays are shown for cM = 50% and cO2 = 5% for: (a) initial time t = 0 s prior to exposure; (b) final time t = 105 s. A “safe-site” M-cell is highlighted in red.
Coatings 06 00055 g001
Figure 2. CA simulation data (solid lines) showing the dynamical dependence of photo-product creation for various cM. The symbols show the optimum fit of Equation (1) to the CA curves. In all cases L = 1 μm, N = 1250, C = 50, cO2 = 1%, α0 = α1 = α3 = 0, α2 = 105 cm−1, β = 10−2 s−1 and NP0,i = 160.
Coatings 06 00055 g002
Figure 3. cM dependence of dynamical parameters (symbols) from CA data fitted using Equation (1): (a) Converted fraction Γ; (b) Characteristic time constant τ; (c) Stretched-exponential parameter γ.
Coatings 06 00055 g003
Figure 4. cO2 dependence of time constant τ (symbols) from CA data fitted using Equation (1). The dashed line represents the expected variation from Equation (2).
Coatings 06 00055 g004
Figure 5. CA simulated dynamical dependence of the optical absorbance for various α3/α2 ratios.
Coatings 06 00055 g005
Figure 6. α3 dependence of dynamical parameters (symbols) from CA data fitted using Equation (1): (a) Converted fraction Γ; (b) Characteristic time constant τ and stretched-exponential parameter γ which are normalized to their α3 = 0 magnitudes.
Coatings 06 00055 g006
Figure 7. Dynamical dependence of indazole (IND) photo-product creation (symbols) determined for a series of MDP samples doped with p-diethylaminobenzaldehyde-1,1ʹ-diphenylhydrazone (DEH). The fitted lines are discussed in the text.
Coatings 06 00055 g007
Table 1. CA rule-set listing the various specifications that must be met in order for the associated physical process to apply to a cell under consideration.
RulePhysical Cell ProcessRule Specification
1Molecular dopantCell value = 2
2Excited molecular dopantNPj,i ≥ 1
3Soluble oxygen availableNearest (von Neumann) neighbourhood to cell contains at least one O-cell; randomly select one O-cell cell for possible reaction
4Oxygen within reaction-radius of excited molecular dopantGenerate random number R on the range 0 ↔ 1 from uniform deviate; if R ≤ φj,i oxygen is within reaction-radius of excited molecule and M-cell to P-cell reaction may proceed

