Article

The Acoustical Durability of Thin Noise Reducing Asphalt Layers

by
Cedric Vuye
1,*,
Anneleen Bergiers
2 and
Barbara Vanhooreweder
3
1
EMIB Research Group, Faculty of Applied Engineering, University of Antwerp, Rodestraat 4, Antwerp B-2000, Belgium
2
Division Surface characteristics-Markings-Noise (SMN), Belgian Road Research Centre, Fokkersdreef 21, Sterrebeek B-1933, Belgium
3
Flemish Government, Agency for Roads and Traffic, Olympiadenlaan 10, Brussels B-1140, Belgium
*
Author to whom correspondence should be addressed.
Coatings 2016, 6(2), 21; https://doi.org/10.3390/coatings6020021
Submission received: 1 April 2016 / Revised: 9 May 2016 / Accepted: 13 May 2016 / Published: 23 May 2016
(This article belongs to the Special Issue Low-Noise Road Surfaces)

Abstract

:
Within the context of the European Noise Directive, traffic noise action plans have been established. One of those actions is to deepen the knowledge about low noise roads, as they are considered the most cost-efficient measure for traffic noise abatement. Therefore, ten test sections were installed in May 2012 in Belgium, with the objective of integrating Thin noise-reducing Asphalt Layers (TAL) in the Flemish road surface policy in a later stage. Eight test sections are paved with TAL with a thickness of a maximum of 30 mm and a maximum content of accessible voids of 18%. The other two sections consist of a Double-layer Porous Asphalt Concrete (DPAC) and a Stone Mastic Asphalt (SMA-10 as a reference section). The acoustical quality of the asphalt surfaces has been monitored in time using Statistical Pass-By (SPB) and Close-ProXimity (CPX) measurements up to 34 months after construction. Texture measurements performed with a laser profilometer are linked to the noise measurement results. Very promising initial noise reductions were found, up to 6 dB(A), but higher than expected acoustic deterioration rates and the presence of raveling led to noise reductions of a max. of 1 dB(A) after almost three years. It is shown that the construction process itself has a large influence on the acoustical quality over time.

1. Introduction

Road traffic noise is a widespread problem, especially in the densely-populated cities of Europe. Exposure to high levels of (traffic) noise can lead to health problems, such as stress, sleep disturbance and even heart diseases. In a publication by the World Health Organization (WHO) in 2011 [1], it was estimated that over one million healthy years of life are lost to ill health, disability or early death related to traffic noise in the western part of Europe alone. Sleep disturbance and annoyance, mostly related to road traffic noise, embody the main burden of environmental noise.
The European Commission is well aware of this problem, and the reduction of road noise is one of its higher priorities. As a consequence of the European Noise Directive 2002/49/EC, all EU member states have been forced to not only analyze the situation by producing noise maps, but also to act against the problems by drafting noise action plans. The Environment, Nature and Energy Department (LNE) of the Flemish government drafted such a noise action plan for road noise, which was approved by the Flemish administration in July 2010 [2]. One of the measures to be taken included the mission for the Flemish Agency for Roads and Traffic (AWV), in cooperation with the Belgian Road Research Centre (BRRC), to expand its knowledge on low noise pavements by studying existing national and international research and by constructing low noise test sections. By the end of 2011, the regional road N19 Turnhout-Kasterlee in Belgium was selected as the location for the construction of the test sections. The concept of this trial was to monitor the acoustical and mechanical performance of different Thin noise-reducing Asphalt Layers (TAL), compared to two reference test sections, in order to evaluate the possibility of including TAL in the Flemish road surface policy in a later stage. Further details on this trial are given in Section 2.1.
A thorough report stating the health effects, social costs and traffic noise reduction options is given in [3], commissioned by T&E, the European Federation for Transport and Environment. It is clear that measures at the source are the most cost effective and that the greatest reduction potential is coming from technical measures to reduce noise emissions from vehicles, tires and road surfaces.
Many international studies on low noise pavements have been performed, including thin layers in, e.g., [4,5], Double-layer Porous Asphalt Concrete (DPAC [6]), rubberized asphalt in [7,8] and Poro-Elastic Road Surfaces (PERS, in, e.g., [9]). A good overview of all of the different types of noise-reducing surfaces can be found in [10], including SMA, TAL, porous asphalt, ultrathin surfacing, cement concrete, rubberized asphalt and poro-elastic road surfaces. The expected lifetime is also given, which shows the difference in expected mechanical lifetime for SMA-like TAL or porous-type TAL. This does not include the acoustical lifetime, which can be defined as the time needed to become louder than the reference of the same age (related to acoustic ageing).
Various European research projects have been initiated in the past on low noise pavements, e.g., SILVIA (Sustainable Road Surfaces for Traffic Noise Control [11]), SILENCE (Towards the sound of SILENCE in European cities [12]) and OPTHINAL (Optimization of Thin Asphalt Layers [13]), all projects in which BRRC was involved. More recently, a project specifically on poro-elastic road surfaces called PERSUADE was coordinated by BRRC (Poro-Elastic Road SUrface: an innovation to Avoid Damages to the Environment [14]).
Low noise road surfaces can be obtained by influencing one or more of the following surface characteristics, as already stated by [15] in 1987: texture [16], absorption [17], which can remove the so-called horn effect [18], and mechanical stiffness [19,20]. In this paper, the focus is on TAL with an optimized texture and only a limited influence of absorption (except for Test Sections 2 and 3, which have a larger percentage of accessible voids compared to the other TAL).
When monitoring the acoustical quality of low noise surfaces, especially the air and pavement temperature have a large impact on the measurement results. The temperature correction is calculated using a reference air temperature of 20 °C, as shown in Equation (1):
LA,max (20 °C) = LA,max(T) + a (20 − T)
where LA,max is the A-weighted maximum pass-by level, T is the air temperature in degree Celsius and a is the so-called temperature correction coefficient in dB(A)/°C. A similar equation can be established for the temperature correction of CPX measurements.
Different studies have examined this temperature effect related to the air temperature, but with varying results, as shown below:
  • A semi-generic temperature correction coefficient of −0.06 dB(A)/°C as proposed by [21];
  • For dense asphalt mixtures, −0.10 dB(A)/°C, and for porous asphalt mixtures, −0.06 dB(A)/°C [22];
  • A generic temperature correction coefficient of −0.10 dB(A)/°C was used for all road surfaces in [23];
  • For dense asphalt mixtures, −0.10 dB(A)/°C, and for porous asphalt mixtures, −0.05 dB(A)/°C [24].
It is clear that this issue still remains unsolved at the moment, but that it can influence the actual results and conclusions. In this paper, the correction coefficients proposed by [24] are used.
Section 2 of this paper starts with a description of the test sections, followed by an overview of all of the test methods that were used in this study. Next, the acoustical quality is investigated in detail in 
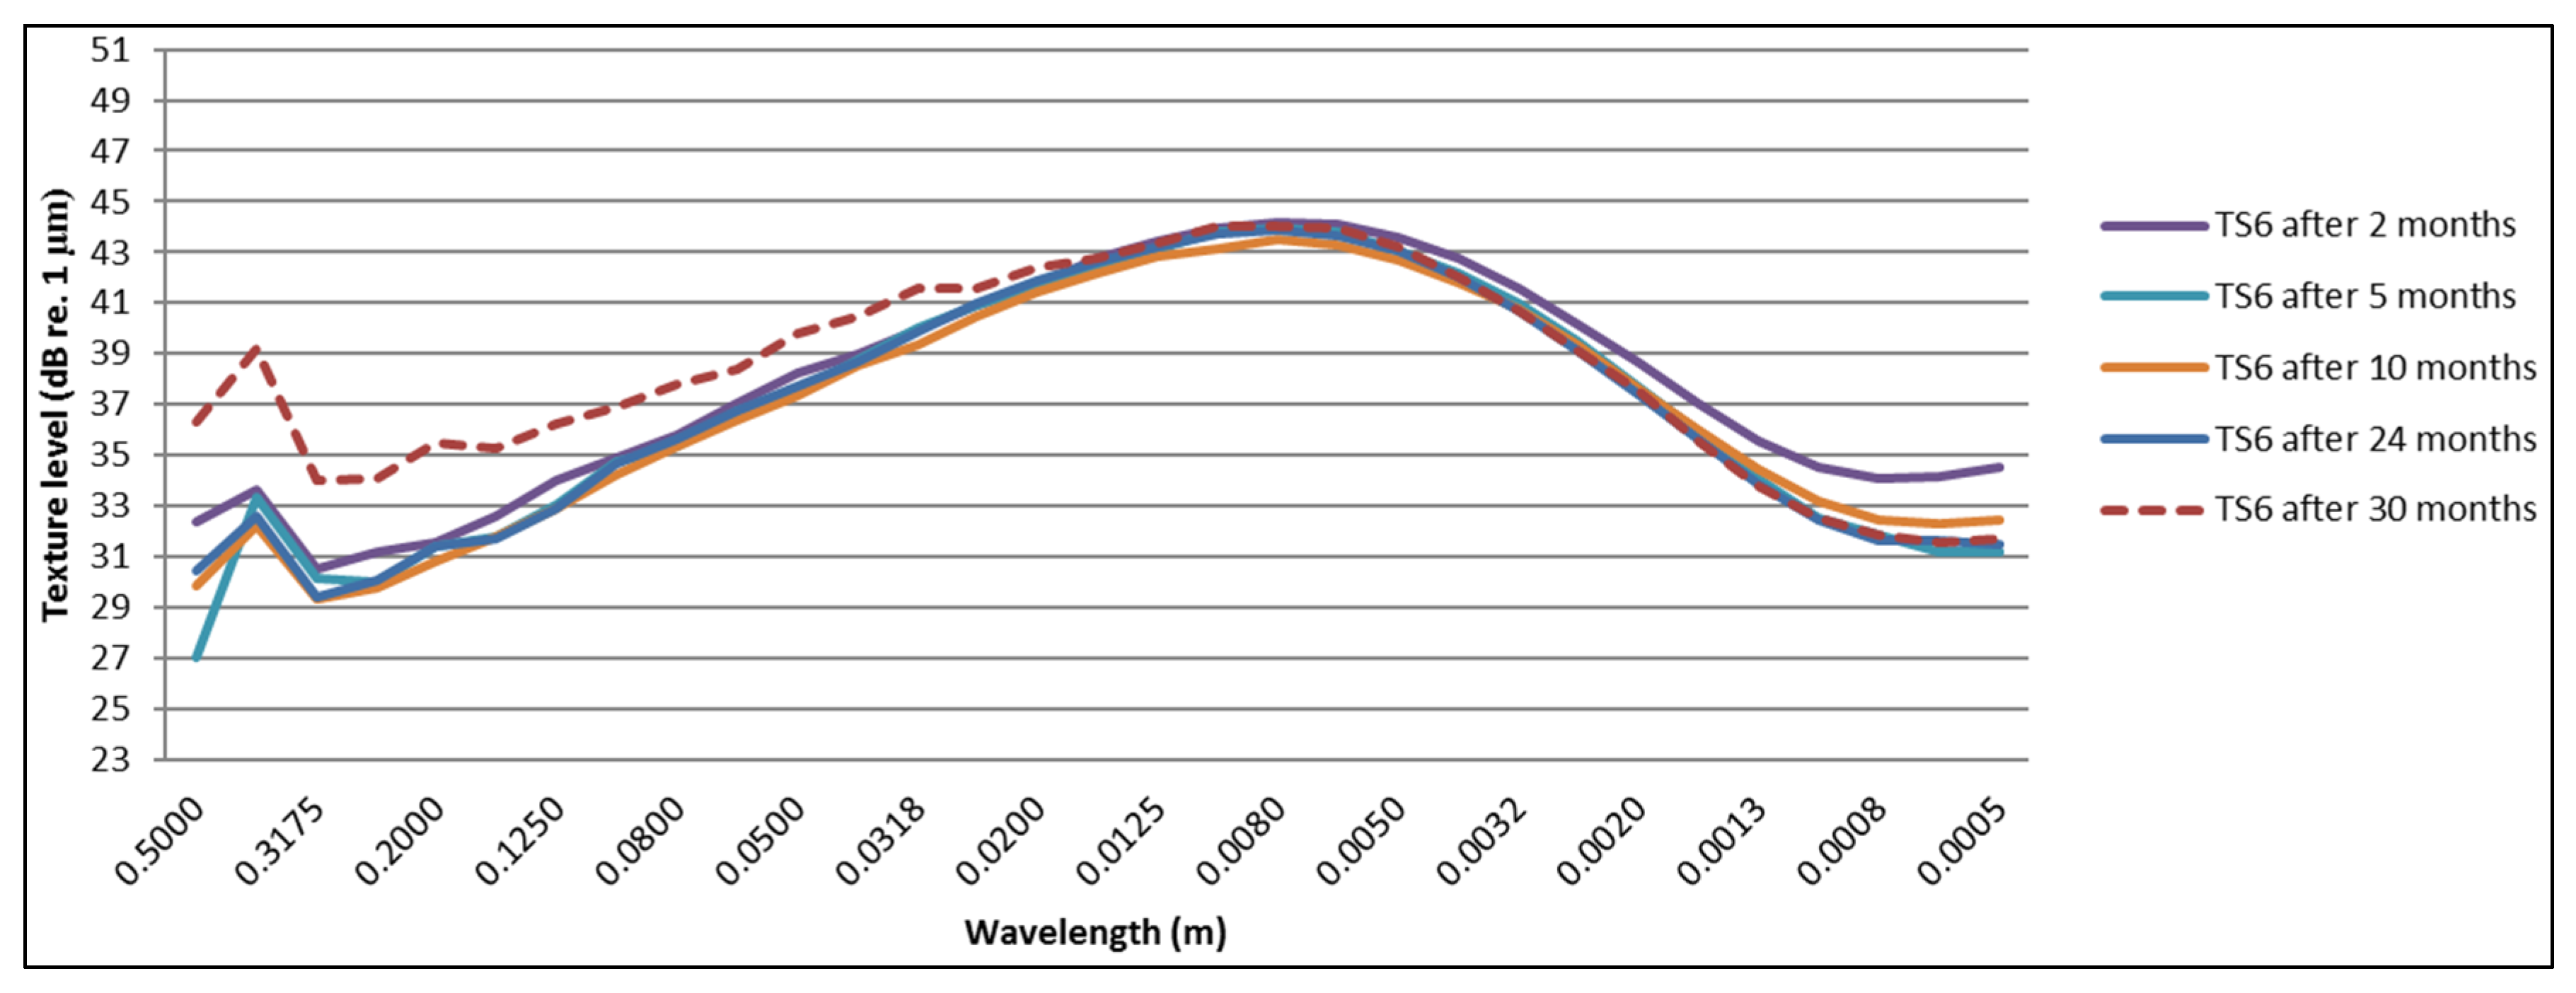
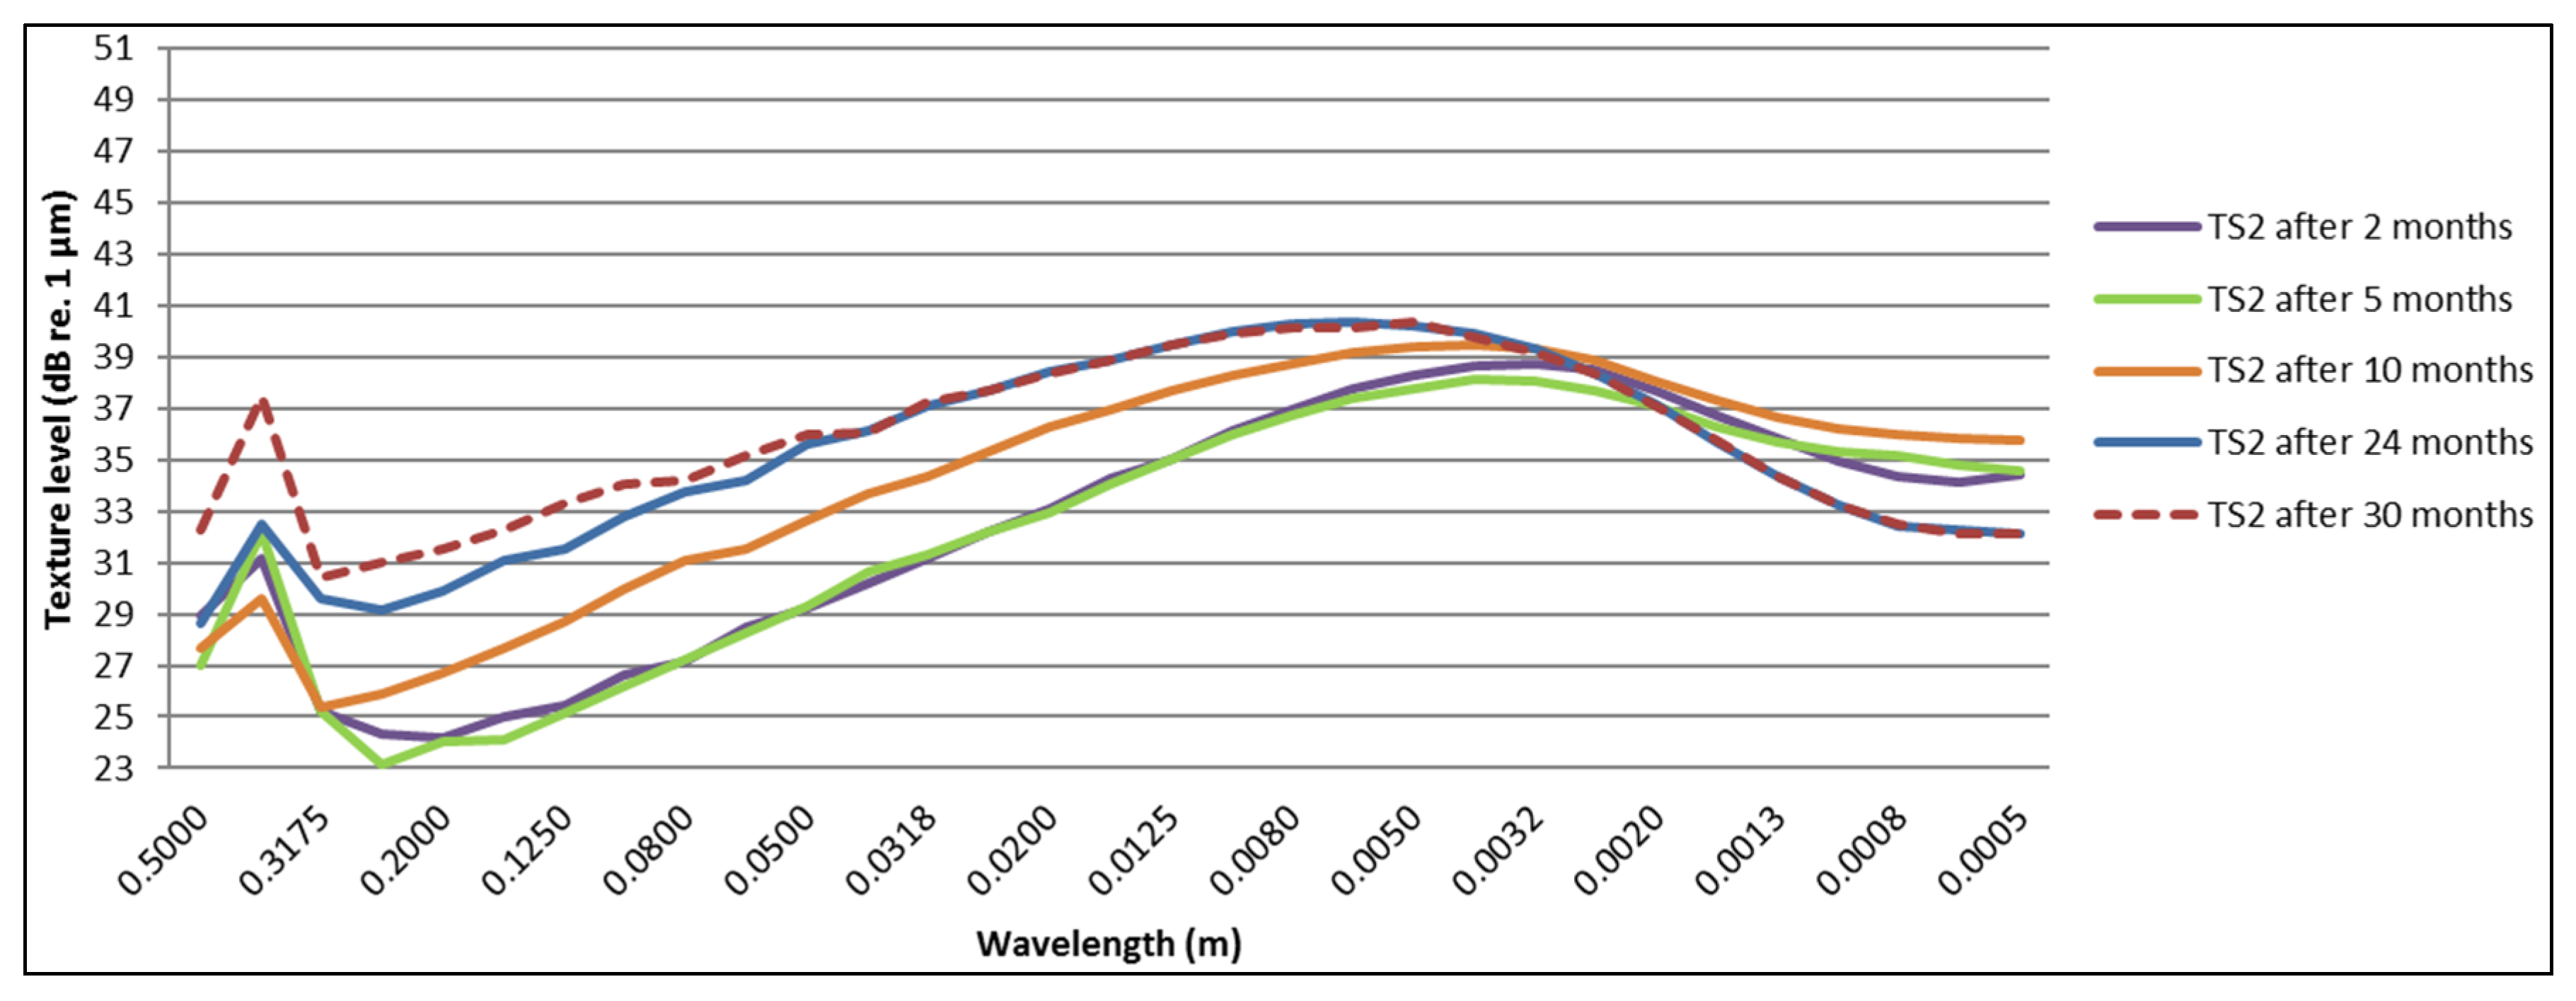
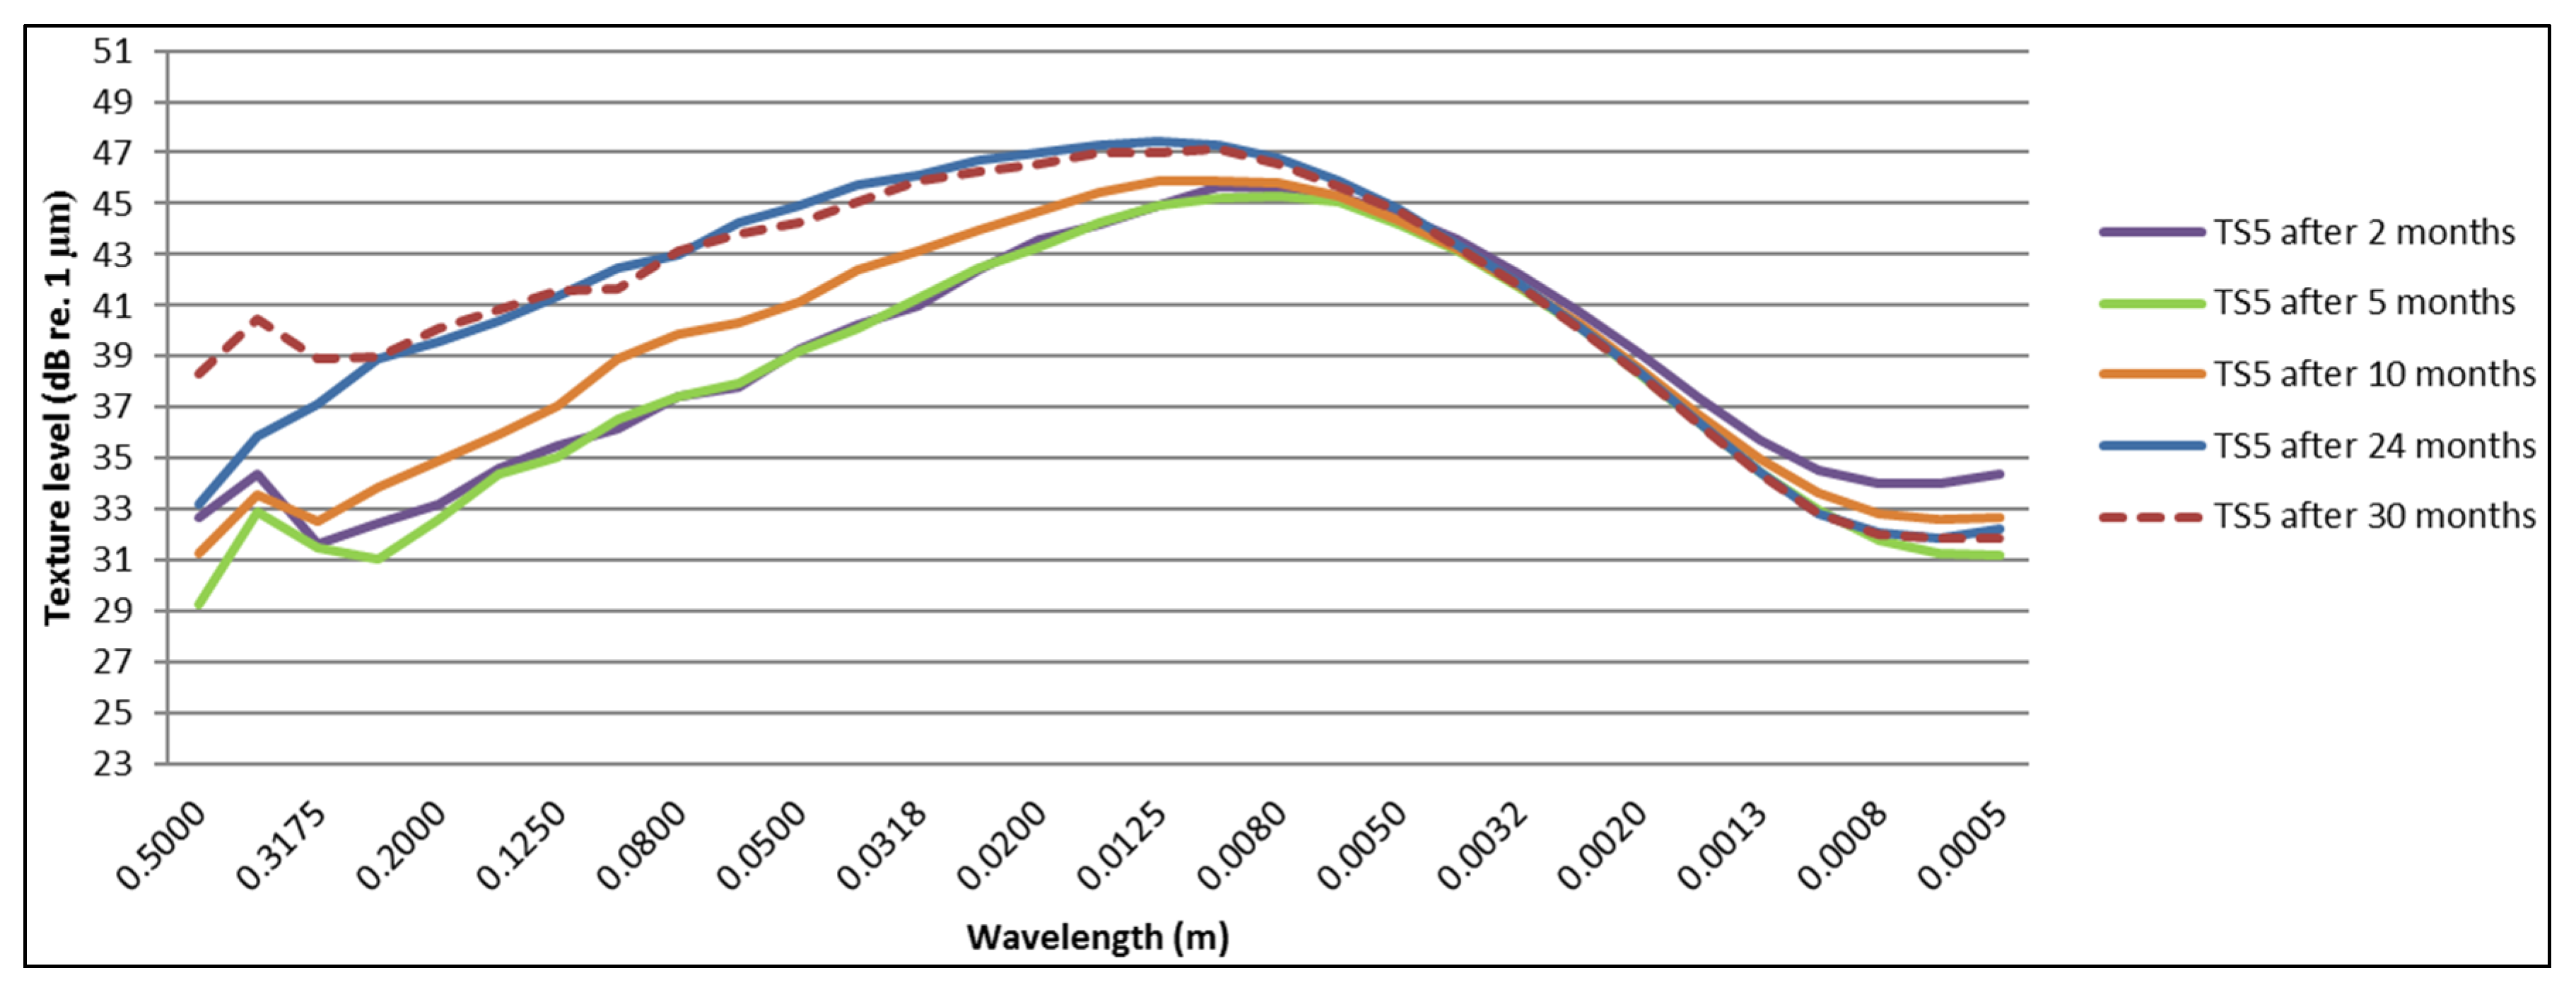
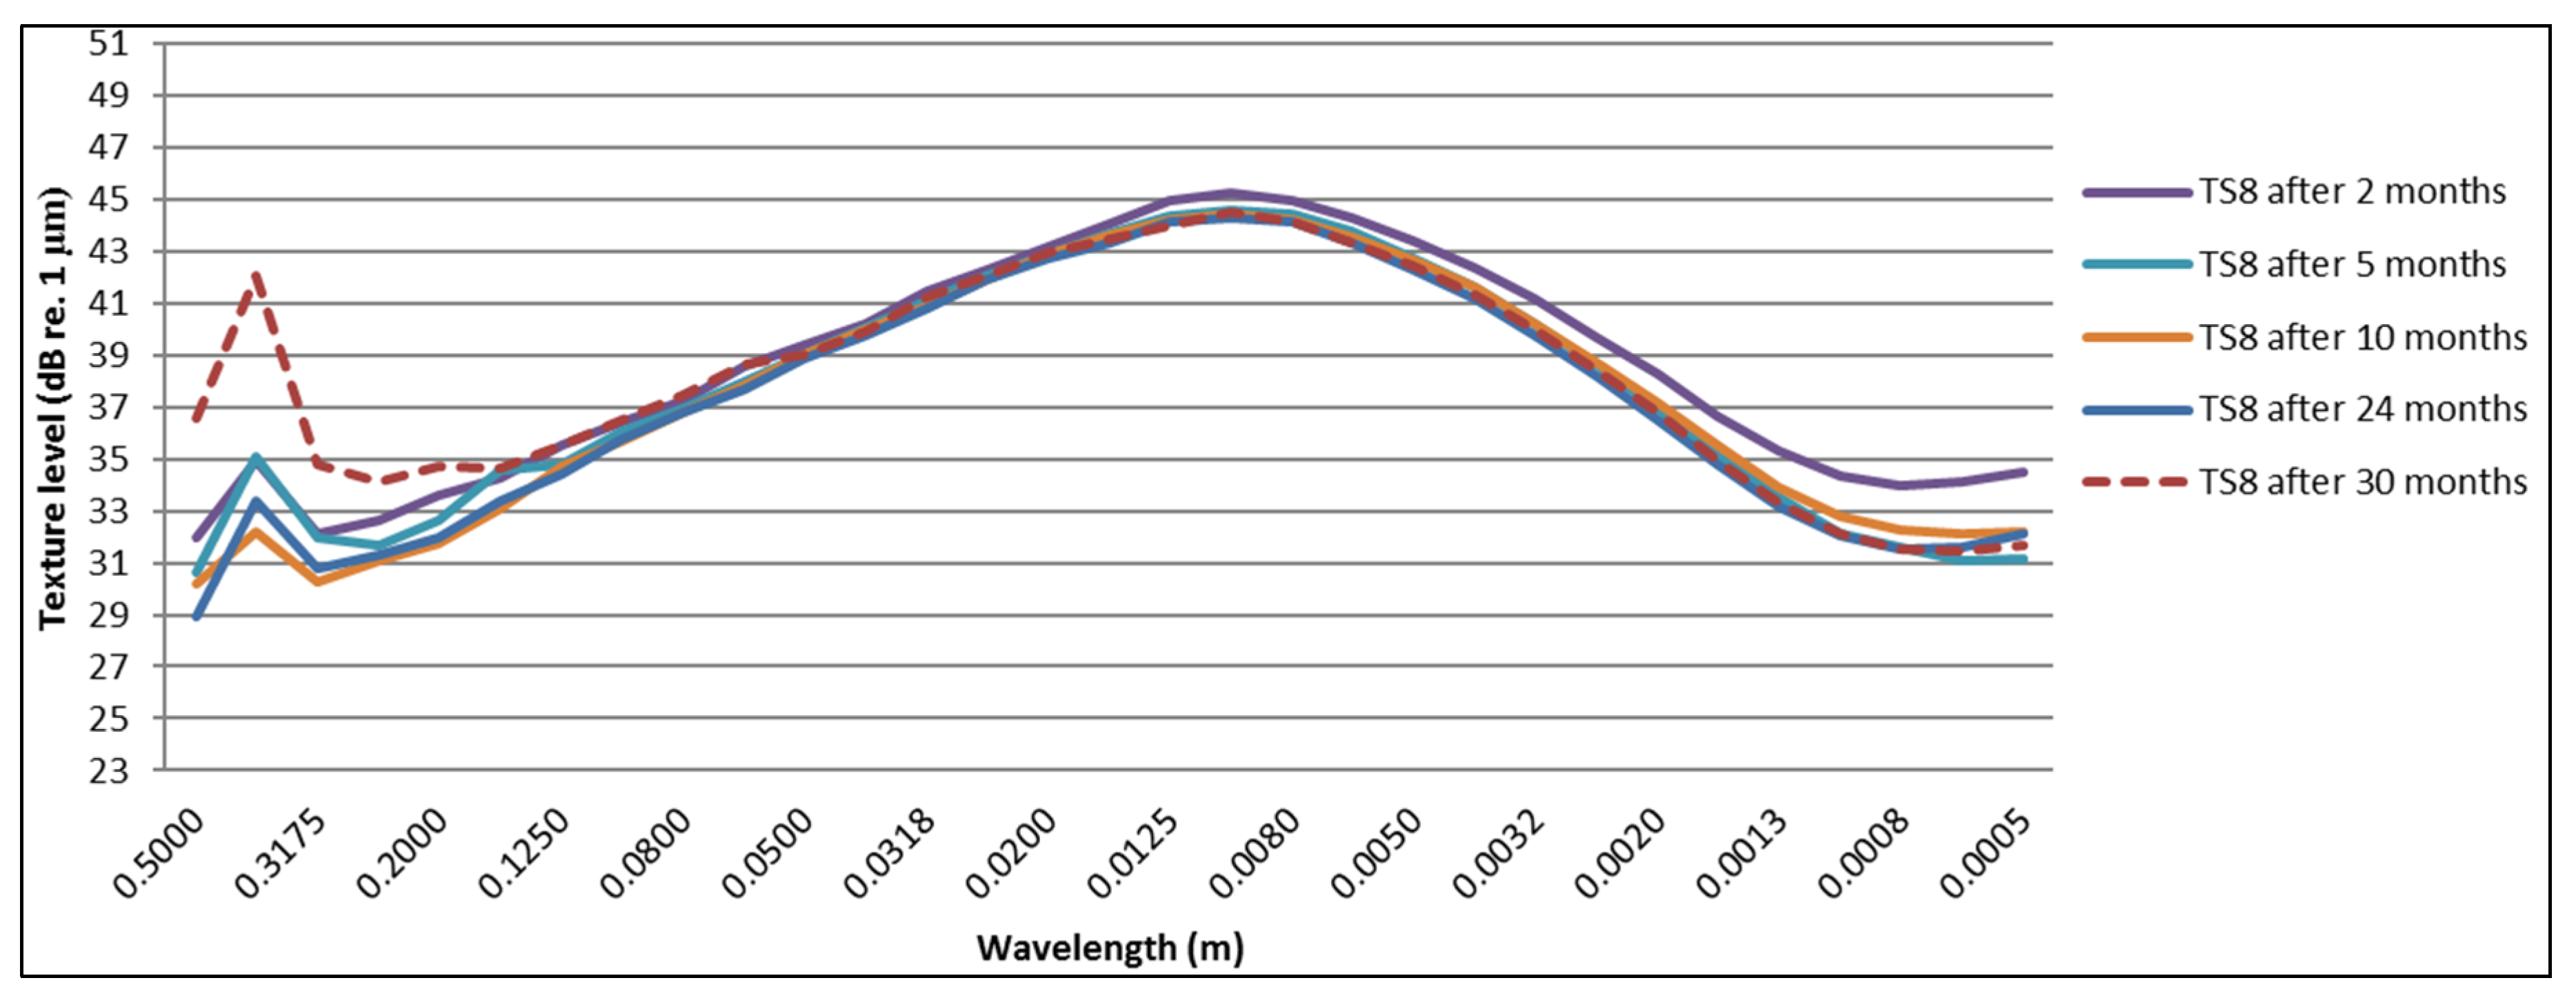
Section 3, including the results of repeated SPB, CPX and texture measurement campaigns up to 34 months after construction. A discussion of all of the measurement results is included in Section 4. Finally, some conclusions are given in Section 5.

2. Test Sections and Measurement Methods

This section includes a description of the test sections, which were discussed briefly in the Introduction, followed by a listing of the different measurement methods and equipment that were used in this research.

2.1. Description of the Test Sections

In May 2012, after a public tender, ten test sections were installed by two contractors, including seven different noise-reducing Thin Asphalt Layers (TAL; one mixture was used twice) and two reference test sections.
A suitable location was found on the regional road N19 Turnhout-Kasterlee in Belgium, which is a road with two lanes in each direction [25]. About 9200 vehicles pass the test location on a weekday, while during the weekend, about 6600 vehicles pass every day. A stretch of 2 km long was divided into ten sections of each 200 m in length, with two sections being used for the reference surfaces: a Stone Mastic Asphalt with a maximum aggregate size of 10 mm (SMA-10 on Test Section 1) and a Double-layer Porous Asphalt Concrete (DPAC on Test Section 5), which is considered the most efficient commercially-available mixture in terms of noise reduction. The eight remaining sections were paved with TAL. Test sections 8 and 9 were paved with the same TAL, but with a different thickness (25 and 30 mm), to evaluate its possible influence on the results. Table 1 presents an overview of the mixture properties for the reference surfaces and the different TAL used in this trial. The values for the voids’ percentage, ranging from 11% to 25%, were taken from ([26], Figure 5), determined on gyratory compacted samples after 100 gyrations.
Both the acoustical and the mechanical properties of the test sections have been studied and monitored for the last three years. The acoustical quality of the TAL is the main focus of this trial, but also other characteristics, like durability and skid resistance, were studied and reported earlier. In [26], an overview of the installation process itself, including infrared and gamma density measurements, has been given. The first acoustical measurement results shortly after the installation of the test sections were included in [27]. In [25], further acoustical results, but also laboratory tests, such as the resistance against raveling and interlayer bonding (adhesion tests), have been discussed in detail.

2.2. Statistical Pass-By Method

Standard ISO 11819-1 [28] describes the “Statistical Pass-By” (SPB) method. According to [28], the speed and the maximum sound pressure level of a minimum of 100 cars and 80 heavy vehicles should be measured. The measurement is performed during their passage in front of a microphone, which is placed at a height of 1.2 m and a distance of 7.5 m from the center of the first lane of which the acoustical quality has to be assessed. A graph with the maximum sound pressure level as a function of log(v), with v the vehicle speed, is plotted, and the average value of the maximum sound pressure level is calculated at a reference speed (Lveh). In this study, the reference speed v0 is 80 km/h, and no heavy vehicles are taken into account, as not enough single heavy vehicles pass at the test location. Most SPB measurements were performed by experienced operators from AWV and BRRC, while some of the measurements were performed by master students from UAntwerp with the equipment from and under the guidance of BRRC; see [29,30]. Table 2 gives an overview of the equipment used for the SPB measurements.

2.3. Close-ProXimity Method

The “Close-ProXimity” (CPX) method is described in the standard ISO/DIS 11819-2 [31]. In this case the tire/pavement noise is measured by driving over the pavement surface with a trailer equipped with different microphones close to the tire surface. The CPX method differs from the SPB method, as it only takes into account the tire/pavement noise and no other vehicle noise sources, nor any propagation effects between the vehicle and the side of the road. The main purpose of the CPX method is to evaluate the noise production and homogeneity of the road surface over a certain distance. The CPX trailer of AWV (see Figure 1) is used in this study. Two times two microphones are mounted close to the tire/road contact in two acoustically-isolated chambers, which are attached to the trailer. Measurements are performed at a reference speed of 80 km/h with two different reference tires, namely a Standard Reference Test Tire (SRTT, P1) and an Avon AV4 (AAV4, H1), representative for car and truck tires, respectively. As a result, the noise levels of individual 20-m parts of the test section and the noise level of the total test section (LCPX) are obtained. Furthermore, the averaged third octave band spectrum of the total test section can be reproduced, as shown in Section 3.2.4.

2.4. Texture Measurements

As texture is closely linked to the acoustical quality of any road surface, and especially for TAL, repeated measurements of the texture levels were performed using the dynamical laser profilometer of BRRC according to standards ISO 13473 [32,33,34]; see Figure 2. The used laser combines a high sampling frequency (78 kHz) with a small diameter of laser beam (0.2 mm). It is mounted on a vehicle, which allows performing measurements very efficiently. The laser profilometer has a vertical measuring range of 64 mm and a vertical resolution of 1 μm. Tests for this study were performed at low speed (approximately 40 km/h) in the right wheel track with a step size of 0.2 mm to obtain the highest possible detailing and accuracy.

3. Results

3.1. SPB

SPB measurement campaigns are performed within several time intervals after construction of the test tracks: 1, 11, 15, 22, 26 and 30 months. The first five test sections (1–5) are measured by BRRC, and the last five test sections (6–10) are measured by AWV. A few measurement points have been measured yearly by both operators in order to establish possible differences in the measurement equipment and operators. Furthermore, an international round robin was organized [35] where a standard deviation of 0.8 dB(A) was found for Vehicle Category 1 (cars). The differences between BRRC and AWV vary from 0.6 to 1.0 dB(A), which is in the same order of magnitude as the international round robin and inherent to the SPB procedure. The SPB results (Lveh,cars) shown in Figure 3 represent one measurement point per test section. The 95% confidence intervals are shown as error bars. Test Sections 1 (SMA-10) and 5 (DPAC) are the reference test sections. It was requested to keep the other numbered test sections anonymous. All of them are thin noise-reducing layers.
All results have been corrected using a semi-generic approach for the temperature correction coefficient of −0.10 dB(A)/°C for dense and −0.05 dB(A)/°C for porous road surfaces (in this case, only Test Section 5) and a reference temperature of 20 °C, as suggested in [24]. Previously reported SPB results [25] were corrected using a temperature correction coefficient of −0.06 dB(A)/°C as proposed by [21]. The influence of the temperature correction on the reported SPB results is in most cases limited to ±0.1 dB(A), with a few exceptions up to ±0.5 dB(A) when measurements were performed below 10 °C (some of the measurements in March or November before lunch time).
In Figure 4, an overview is given of the effective noise reduction of each road surface compared to the SMA-10 as the reference, based on the measured SPB results at v0 = 80 km/h. A negative number for the noise reduction signifies that the measured SPB levels are actually higher than that of the reference road surface.
Using the SPB results at the different time intervals, it is possible to estimate the average increase of Lveh,cars for all test sections. This average increase over time, both per month and annually, is calculated using a linear regression line and given in Table 3. Figure 4 shows the increase over time of Test Sections 2 (left) and 6 (right), showing the largest and smallest increase over time, respectively. The 95% confidence intervals are shown as error bars. The correlation coefficient R² is also given, both in Figure 5 and in Table 3.

3.2. CPX

CPX measurement campaigns have been performed within several time intervals: 1, 5, 11, 15, 22, 26 and 34 months after construction. All results have been corrected using a semi-generic approach for the temperature correction coefficient of −0.10 dB(A)/°C for dense and −0.05 dB(A)/°C for porous road surfaces (Test Section 5) and a reference temperature of 20 °C, as suggested in [24]. Previously reported CPX results [25] were corrected using a temperature correction coefficient of −0.03 dB(A)/°C as proposed in the draft CPX-standard at the time of the publication [31], as discussed in the working group responsible for this standard [32]. Each individual result is the average of ten measurement results calculated on road segments of 20 m.

3.2.1. Cars

The results of the measurements performed at 80 km/h with the P1 tire (SRTT) are shown in Figure 6. The shown standard deviations are calculated using the average results for each 20-m segment (each test section of 200 m is divided into ten parts of 20 m each). A larger standard deviation signifies more variation between each 20-m segment and can indicate local problems, such as raveling.
In Figure 7, an overview is given of the effective noise reduction of each road surface compared with the SMA-10 as a reference, based on the measured CPX results (P1) at 80 km/h. A negative number for the noise reduction signifies that the measured CPX levels are actually higher than that of the reference road surface.
Using the CPX results at different time intervals, it is possible to estimate the average increase of LCPX,P,80 for all test sections. Figure 8 shows the increase over time of Test Section 5, showing both the largest increase over time and the largest standard deviation.
This average increase over time, both per month and annually, is calculated using a linear regression line and given in Table 4.

3.2.2. Heavy Vehicles

The results of the measurements done at 80 km/h with the H1 tire are shown in Figure 9, followed by an overview of the effective noise reduction of each road surface compared to the SMA-10 at the same time interval as the reference in Figure 10.
Using the CPX results at the different time intervals, it is possible to estimate the average increase of LCPX,H,80 for all test sections. Figure 11 shows the increase over time of Test Section 1, showing both the smallest increase over time and the smallest standard deviation.
The average increase over time, both per month and annually, is given in Table 5.

3.2.3. Cars vs. Heavy Vehicles

The sound pressure level reductions with respect to reference Test Section 1 at different moments in time are shown in Figure 12 for both cars (P1) and heavy vehicles (H1).

3.2.4. CPX Third Octave Band Spectra

The third octave band spectra determined from the CPX measurements with the P1 tire are shown in Figure 13 for four different test sections. The initial noise spectrum one month after construction is compared to the noise spectrum 34 months after construction.

3.3. Texture

Texture measurements were performed 2, 5, 10, 24 and 30 months after construction. Figure 14 shows the measured texture spectrum two months after construction, while Figure 15 contains the texture spectrum for all test sections after thirty months. The two reference road surfaces are shown with a dotted line.
Most of the TAL show a similar behavior related to texture changes with mostly an increase in the megatexture range (wavelength between 50 and 500 mm) and a smaller decrease of the texture levels in the macrotexture range (wavelength between 0.5 and 50 mm), as shown in Figure 16 for Test Section 6. Especially, the increase of the megatexture has a negative effect on the noise reduction of the TAL.
Two test sections reveal a significant texture change, namely Test Section 2 and the double-layer porous asphalt in Test Section 5, which are shown in Figure 17 and Figure 18.
In Figure 19 and Figure 20, the texture spectra of test sections eight and nine are shown, which exhibit a more stable texture. The texture levels are indeed very similar, which is expected for the same mixture.

4. Discussion

A first remark can be made before actually discussing the measurement results in detail. The initial acoustical quality of reference Test Section 1 is surprisingly good for an SMA-10. A typical SMA-10 is expected to be 0.5 to 1 dB noisier as determined from a series of CPX measurements by AWV [36].

4.1. SPB Results

As shown in Figure 3, all test sections become noisier over time, as could be expected. Test Sections 2–5 show a sudden drop in the sound pressure level after 15 months, although afterwards higher noise levels are again measured. This drop is not present in the CPX measurements, however, so it is probably related to the fact that for these SPB measurements, all data had to be recorded manually due to a hardware malfunction. Test Sections 2, 5 and 7 show the largest increase in SPB levels (3–3.6 dB(A) after 30 months). For the SMA-10 reference Test Section 1, over a period of 30 months, an increase of only 0.5 dB(A) is noted. The absolute SPB value, 74.3 dB(A), is significantly lower than the value for a comparable SMA-11 in Poland [37], with a value of 76.6 dB(A) one year after construction. Test Sections 8 and 10 demonstrate a similar small increase of only 0.6–0.7 dB(A).
When looking at Figure 4, it is clear that Test Sections 3 and 5 exhibit the largest initial noise reduction, with values up to 6 dB(A) compared to the SMA-10. For Test Section 5 (DPAC), this was an expected value, and the fact that Test Section 3 is a porous-type TAL explains its high initial noise reduction. Test Sections 4 and 7 show an initial noise reduction of less than 2 dB(A), while Test Sections 8 and 10 are equally loud as the reference. Test Section 9 is even louder than the reference to begin with. This is also a surprising result as Test Sections 8 and 9 are constructed using the same TAL with only a different thickness. After 2.5 years (30 months), only Test Sections 3, 5 and 6 still show a noticeable noise reduction, although significant raveling is present.
Assuming a linear relationship between time and Lveh,cars, the acoustic ageing effect is assessed in Table 3 and shown for two test sections in Figure 5. The noise levels of reference Test Sections 1 and 5 increase with 0.04 and 0.11 dB(A) per month, respectively. The TAL show an increase ranging from 0.02 (Test Section 6) up to 0.14 dB(A) per month (Test Section 2), which corresponds to an increase of 0.24 and 1.70 dB(A) per year. This increase over time is difficult to compare to other international studies, as mostly CPX values are used to determine the acoustic ageing, as discussed further in Section 4.2. In [37], a limited number of SPB results at a reference speed of 80 km/h is shown. A VTAC 8, a thin layer with a maximum aggregate size of 8 mm, and a PAC 8 were evaluated at different times (one and three years after construction), showing an increase of 5.7 dB between the two measurement campaigns for the VTAC 8 and 6.5 dB(A) for the porous asphalt. This increase is related to clogging of the pores and local raveling. These results are in the same order of magnitude as the findings in this study. In a Portuguese study [7], the Controlled Pass-By (CPB) method was used to determine the acoustic ageing of rubberized asphalt and one reference gap-graded asphalt, resulting in an increase of 1.0–1.7 dB(A) per year. As the mixtures are completely different, it is difficult to compare this to our findings. Danish research on test sections with thin layers [38], using SPB at 80 km/h, revealed an average annual noise increase of 0.5–0.7 dB(A) per year, which is much lower than the loss of noise reduction that was found in this paper. In [39], an increase of 0.3–0.4 dB(A) per year is found in the Netherlands for TAL.

4.2. CPX Results

4.2.1. Cars

All of the TAL and Reference Section 5 show a steady increase over time; see Figure 6. The acoustical quality of the reference test section SMA-10 remains more or less stable over time. Only after five months is a small decrease in sound pressure levels noted. Test Sections 2, 3 and 5 reveal a higher inhomogeneity starting after 22 months (shown as a large standard deviation). This has been confirmed by visual inspections, which indeed show several zones of raveling, changing the surface texture and, therefore, the acoustic quality within these sections [25]. The acoustical quality of Test Section 10 is not homogeneous at the beginning, but the homogeneity has improved over time.
When examining the CPX values in Figure 6, it is clear that Test Sections 2 and 5 show the largest increase over time, which is due to the presence of raveling. In [25] (Figure 17), a clear image of this raveling and influence on the CPX measurement can be found. These two test sections were also prone to the highest increase in SPB levels. The CPX values of the other TAL have increased between 1.5–4 dB(A) over a period of 34 months.
The sound pressure level reductions with respect to reference Test Section 1 at different moments in time are summarized in Figure 7. The initial noise reduction is >3 dB(A) for all test sections, except for Test Section 10, and even up to >5 dB(A) for Test Sections 2–6. Overall, the calculated noise reduction is a lot higher than for the SPB results. The CPX method differs from the SPB method, as it only takes into account the tire/road noise and no other vehicle noise sources. Contrary to the SPB method, it does not comprise propagation effects, as the measurements are performed very close to the tire. The positioning of the SPB measurement locations was compared to the CPX levels of individual 20-m road segments in [27]. In some cases, the SPB measurement location was situated in a louder part of the test section explaining why the noise reduction is larger for CPX than for SPB. The pronounced tread pattern of the P1 tire might cause the larger noise reduction, as well, as this tire is more susceptible to the fine texture of the TAL.
After almost three years (34 months), the results are less satisfying, however, as only Test Sections 3, 4 and 6 show a reduction of approximately 1 dB(A). The other test sections have become as loud or even louder than the reference. DPAC (Test Section 5) showed an initial noise reduction of 6.1 dB(A), while after 34 months, it has become louder than the reference.
The evolution in time of the acoustical quality measured with the P1 tire for cars is shown in Table 4 and Figure 8. Assuming again a linear relationship, the ageing effect for the different test sections was assessed. The CPX value of the SMA-10 can be considered as stable, even though a small negative value was determined (−0.01 dB(A) per month). Lcpx,P1,80 of reference Test Section 5 (DPAC) shows the largest increase of 0.20 dB(A) per month. Lcpx,P1,80 of the TAL layers has increased with values between 0.05 and 0.20 dB(A) per month, corresponding to an increase of 0.62–2.39 dB(A) per year, which is more than expected. In a study in Germany [4], one of the mixtures used in this trial has been monitored for a period of three years using CPX measurements at 50 km/h. This means that the actual values cannot be compared, but they found almost no change in noise levels and a very stable texture. In this study, that particular mixture had a significantly higher deterioration rate. Furthermore, a decrease of the macrotexture levels and an increase of the megatexture levels was found, explaining the increase in noise levels. A very limited acoustic ageing has been found in [40] where low noise surfaces deteriorate at a rate of <0.5 dB(A) per year. It remains very difficult however to compare all of these results since information about other factors, such as traffic volume and composition, the presence of intersections, etc., and the construction process itself is lacking.

4.2.2. Heavy Vehicles

As shown in Figure 9, Lcpx,H1,80 of the reference SMA-10 is increasing over time, while it was stable for the measurements with the P1 tire. All test sections show an increase of sound pressure levels over time. In this case, only Test Section 5 reveals a large inhomogeneity after 34 months. The large inhomogeneity that was observed with the P1 tire for Test Section 3 in Figure 6 is not observed here. Possibly, the truck tire is less sensitive to texture change due to raveling than the car tire. The homogeneity of the acoustical quality of Test Section 10 has again improved over time, which is similar to the CPX results for cars.
As shown in Figure 10, the initial noise reductions are significantly lower compared to the results shown in Figure 7. Almost all TAL reach a noise reduction of approximately 3 dB(A), except Test Section 10, but only the DPAC reaches a higher initial noise reduction of 5 dB(A). After almost three years (34 months), the results are comparable to the results for the P1 tire, as most TAL show a reduction of max. 1 dB(A). In this case, Test Section 6 outperforms the other TAL with a noise reduction after 34 months of 2.5 dB(A) and the highest initial noise reduction for heavy vehicles of all TAL, as well.
The evolution in time of the acoustical quality measured with the H1 tire is shown in Table 5 and Figure 11. Reference Test Sections 1 and 5 show an increase of 0.05 and 0.17 dB(A) per month, respectively. The TAL deteriorates at a rate between 0.11 and 0.13 dB(A) per month, except for Test Section 6, with a rate of 0.09 dB(A) per month.

4.2.3. Cars vs. Heavy Vehicles

The ageing effect for cars is smaller than for heavy vehicles for Test Sections 2 and 6, when comparing the results shown in Table 4 and Table 5. No difference in acoustic ageing is found for Test Sections 3 and 4, and the effect is even higher for Test Sections 8, 9 and 10. This is in contradiction with recent Danish research where the ageing effect was found to be smaller for heavy vehicles than for cars on a larger range of various surfaces [41]. The reference SMA-10 shows a similar increase for heavy vehicles as for SPB (approximately 0.5 dB(A)/year), but surprisingly almost no increase for cars.
One month after construction, on all test sections, except Test Section 10, more noise reduction is obtained for car tires than for truck tires; see Figure 12. This changes completely over time as only Test Section 4 keeps a higher noise reduction for car tires after almost three years. An important remark has to be kept in mind when comparing these figures. The sound pressure levels of the reference SMA-10 are practically constant over time for passenger cars, while they increase for heavy vehicles; see Figure 6 and Figure 9. The influence of the acoustic ageing of the reference surface is taken into account in these graphs. Additionally, the difference in ageing effect was not always significant if one keeps in mind the uncertainties and accuracy of measurements and the applied temperature correction.

4.2.4. CPX Third Octave Band Spectra

As shown in Figure 13, different changes in noise spectra can be found. The reference SMA-10 shows only a very small increase in noise levels, while the DPAC shows an increase in noise levels throughout the complete spectrum, related to clogging of the pores (high frequencies) and degradation/raveling of the surface (low and mid-frequencies). Test Section 2 shows a similar behavior as the DPAC, while the other test sections all show a similar behavior as Test Section 6. Only a limited increase in the lower frequencies and a larger increase in noise levels starting from 800 Hz are present, probably caused by dirt or compaction of the slightly open layer, influencing air-flow-related mechanisms, such as air-pumping, negatively.

4.2.5. Correlation between CPX and SPB

It is clear form Figure 4 (SPB, light vehicles) and 7 (CPX, P1 tire) that the measurement results are only moderately correlated. This was previously investigated and reported in [42] (Figure 8 and Figure 9), where R2 was between 0.43 and 0.72. Additionally, the correlation between SPB and CPX measurements of these and other sites was investigated further in the ROSANNE project [43]. Many data points of this project, though not all, were shown as outliers when presented together with the remainder of the ROSANNE data that were collected. The probable cause is the fact that some of the measurement sites have a partly grass-covered area between the microphone and the road, which does not completely comply with the ground requirements in the IS0 11819-1 standard [28]. In practice, it is difficult to find a measurement point that completely complies with the requirements. For this project, the best possible locations were selected, although no perfect locations were found. These SPB measurements are considered to be suitable to follow up the noise evolution of a given measurement point, although the CPX measurements are considered to be more accurate and comparable to other external data. In any case, the correlation between CPX and SPB is not perfect in general. In the ROSANNE project, the following formula has been derived for cars [44]:
LA,max = 0.95 CPX (P1 tire) −15.6 dB
Almost 90% of all data (chosen based on very severe selection criteria) are within ±1 dB around this trend line, which means there is still a large uncertainty when looking at correlations.

4.3. Texture Measurement Results

For the test sections with a similar behavior as shown in Figure 16 (Test Sections 3 and 4, 6–9), a decrease of the texture levels at lower wavelengths (macrotexture) is visible starting after five months. After this period, not much change in macrotexture is observed. Increasing levels in megatexture (larger wavelengths) are mostly visible after 30 months. Test Sections 8–10 show the least change in megatexture, which is confirmed by the smallest acoustic deterioration calculated from the SPB and CPX results (for cars). It is clear from Figure 19 and Figure 20 that Test Sections 8 and 9 exhibit a similar change in texture levels and that the spectra are almost identical. This is logical, as they are the same TAL (only different thickness), although the SPB results show much higher levels for Test Section 9. The differences in CPX levels are much smaller, so probably the difference in SPB levels can be explained by local variations near the measurement locations (presence of grass at the measurement location of Test Section 8, which will absorb part of the noise). The presence of raveling is confirmed clearly in Figure 17 and Figure 18, which show a large increase in megatexture levels after ten months (first winter period). Such an increase in megatexture will definitely result in more tire vibrations and, thereby, noise, which is confirmed by both SPB and CPX measurements.

5. Conclusions

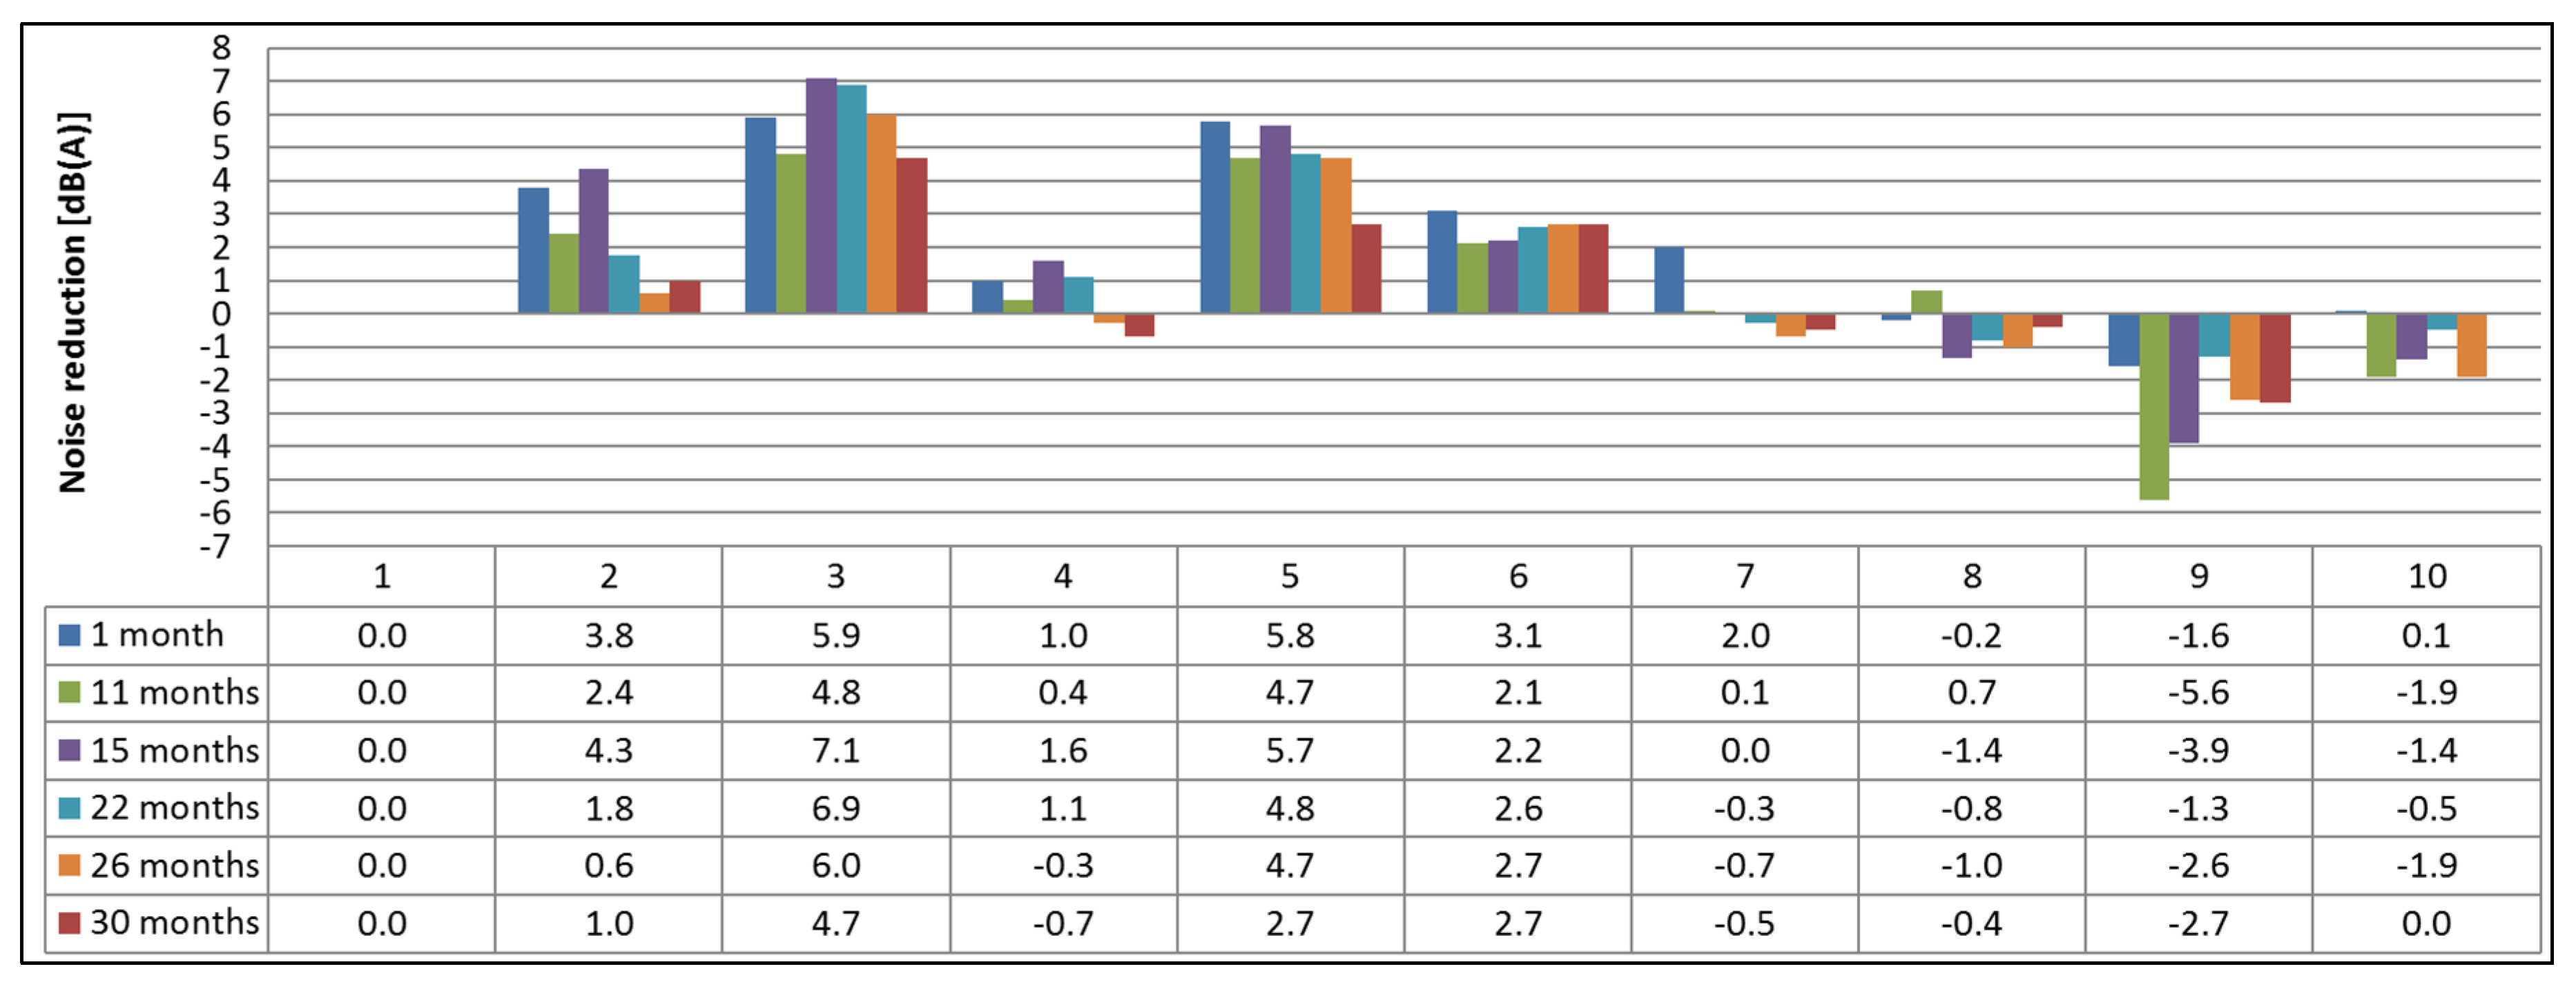
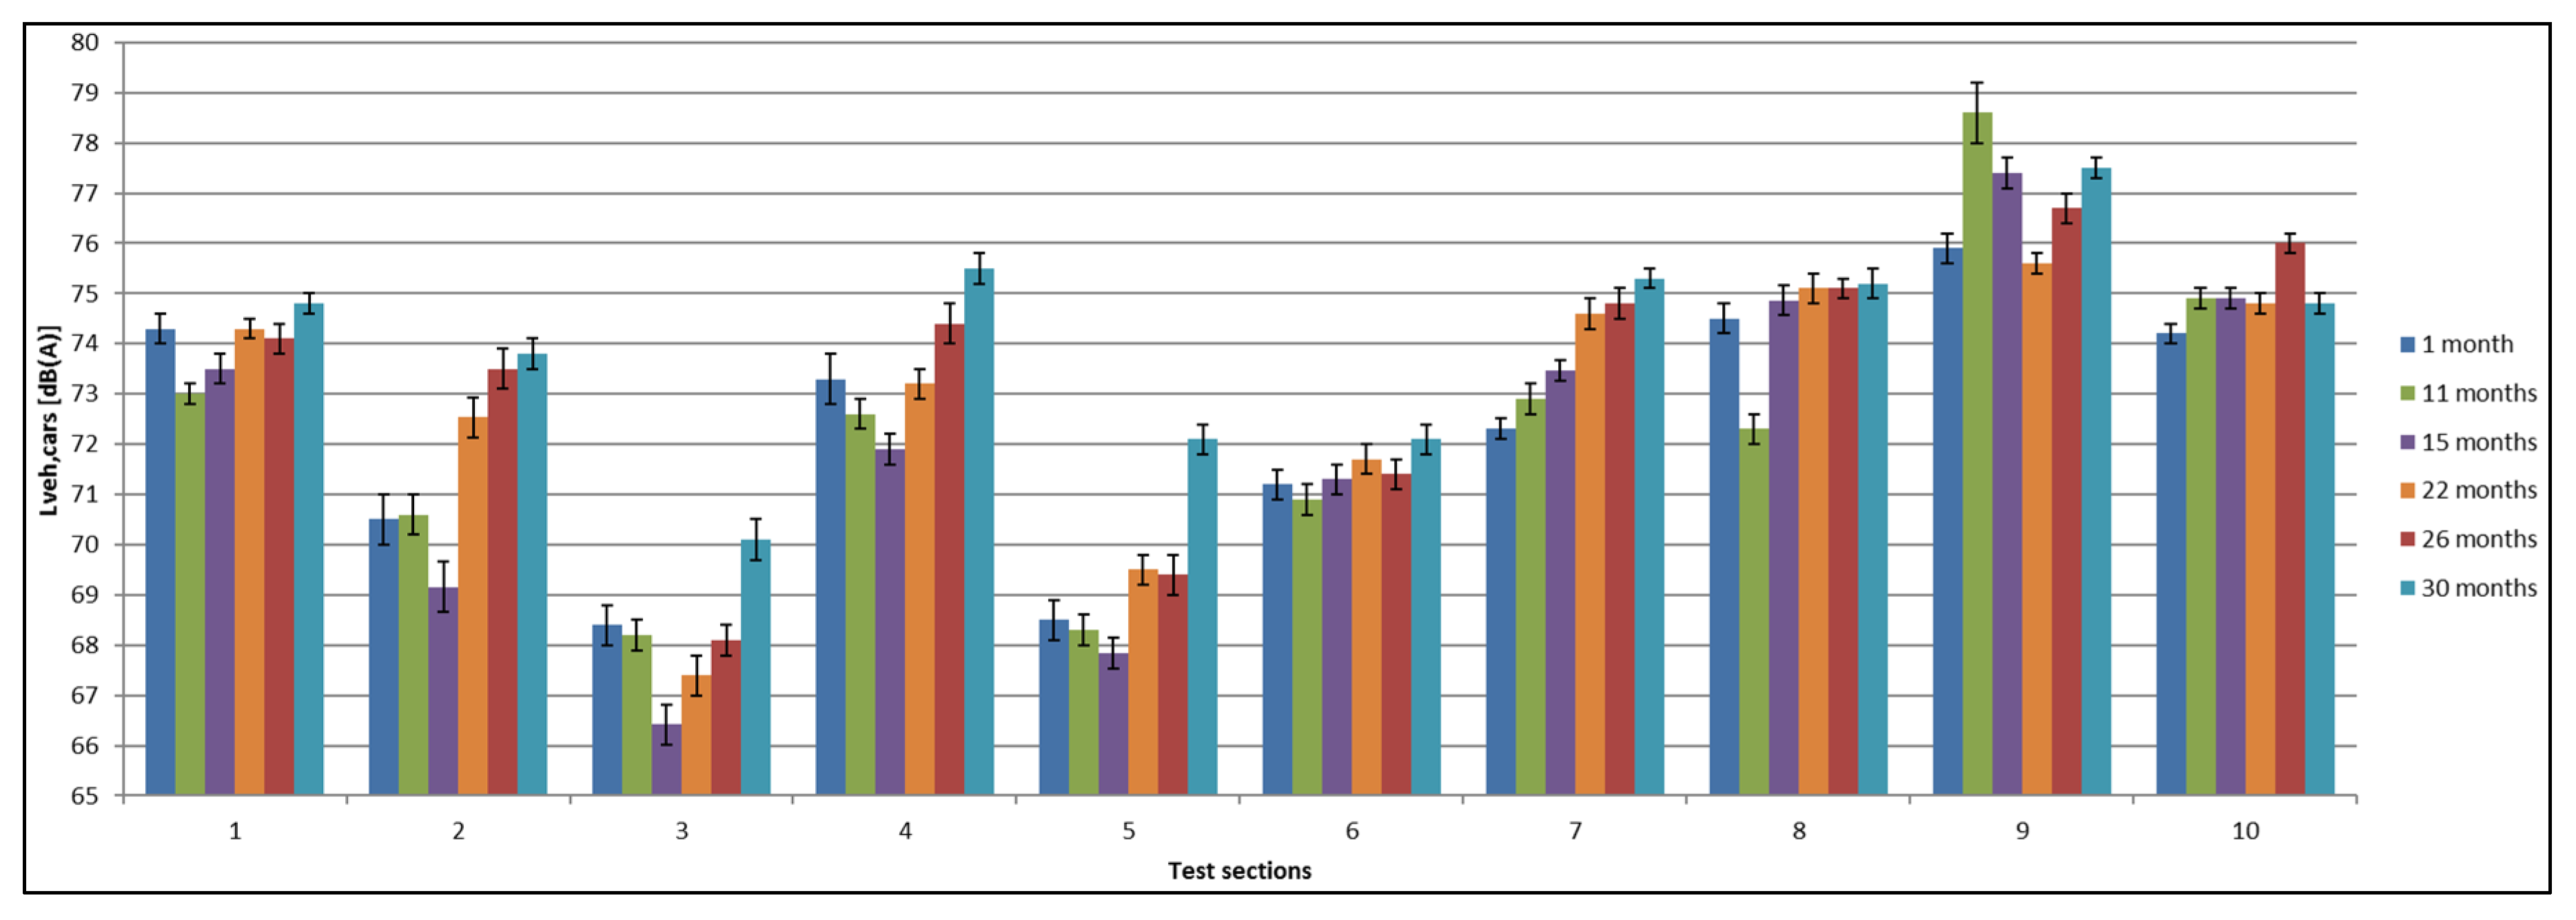
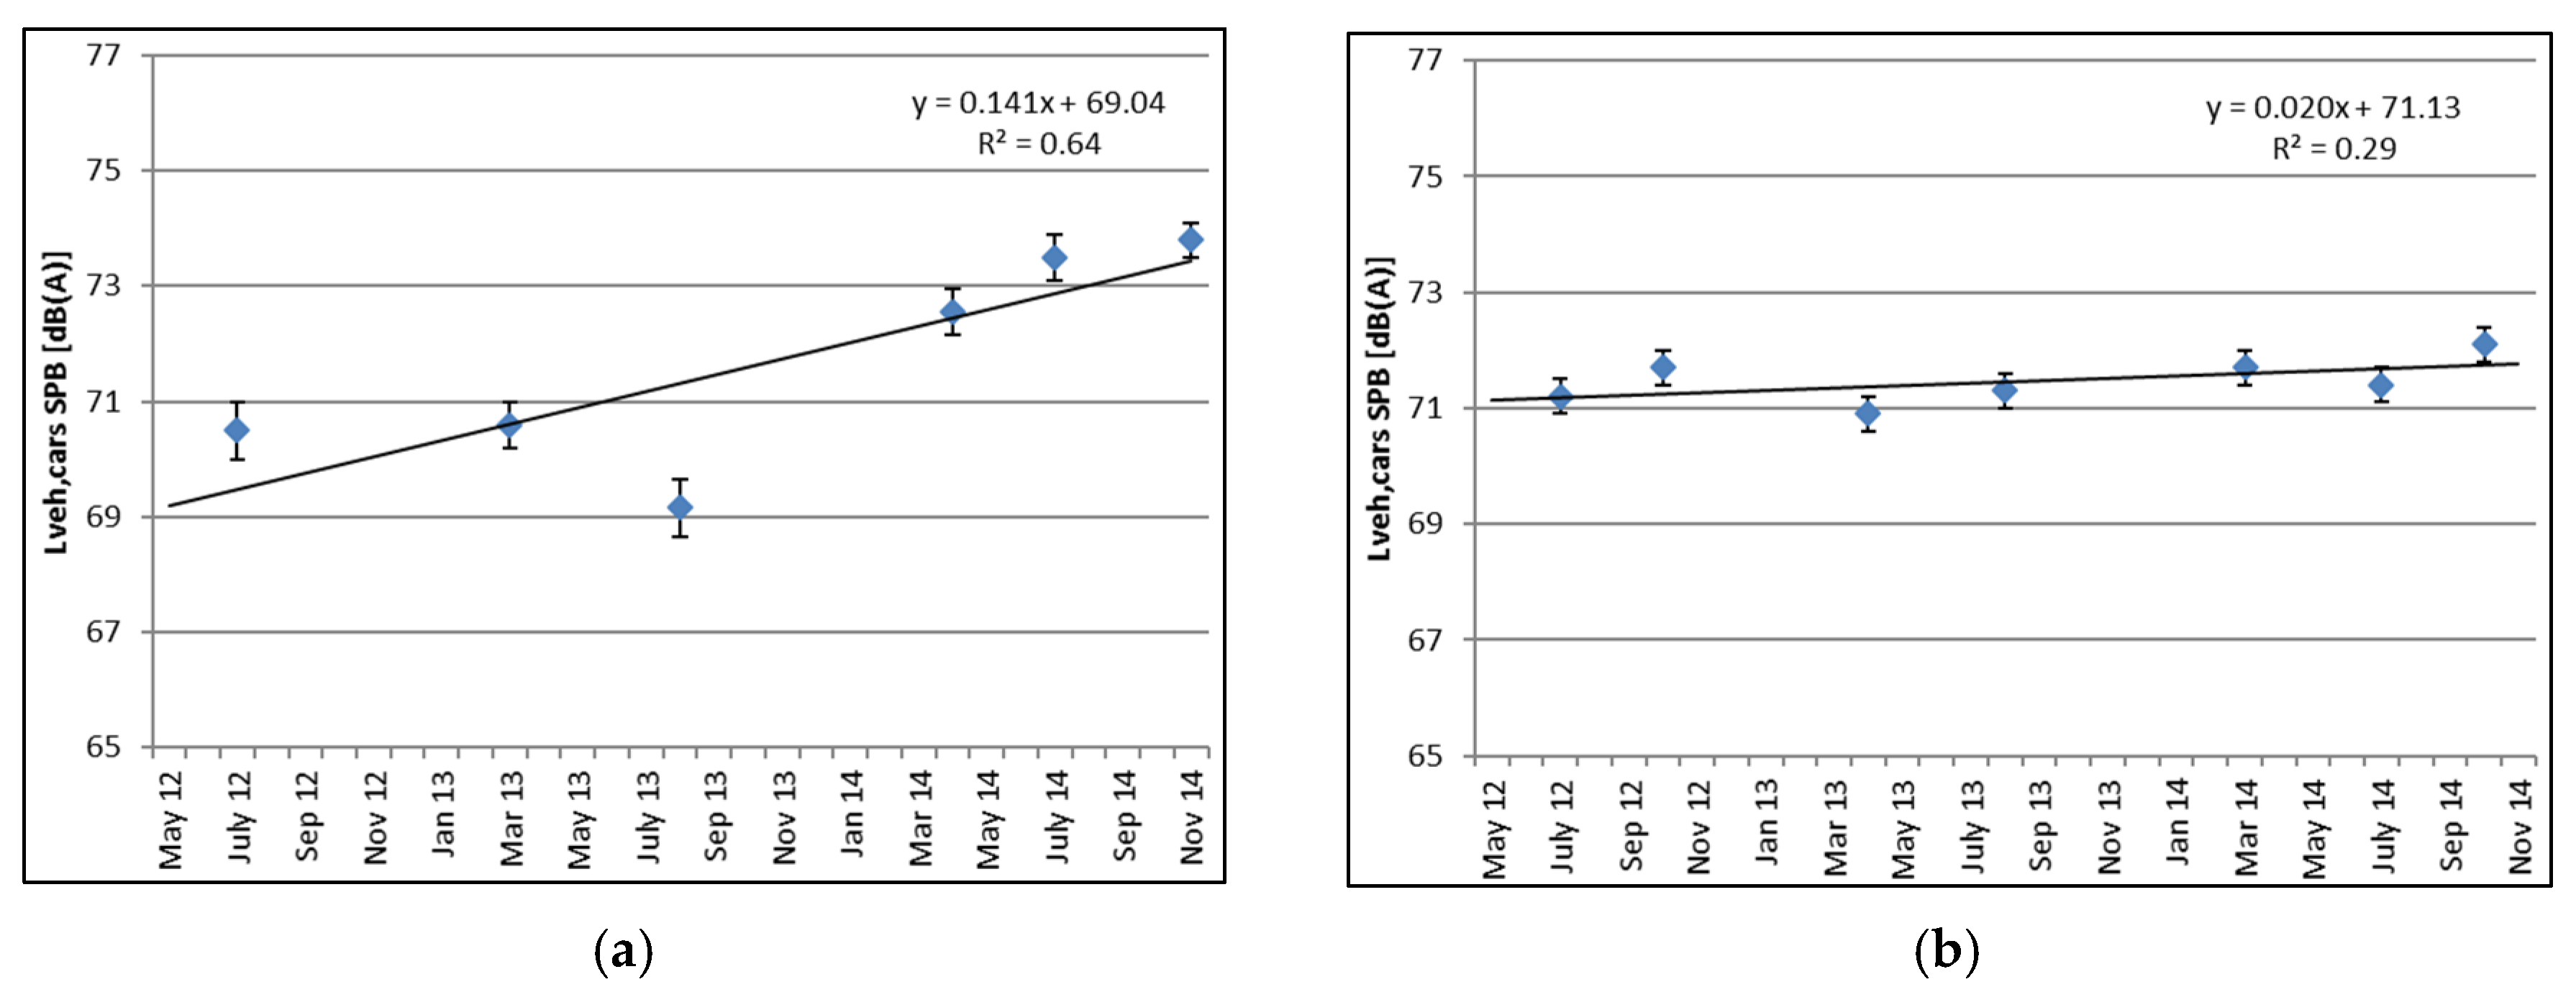
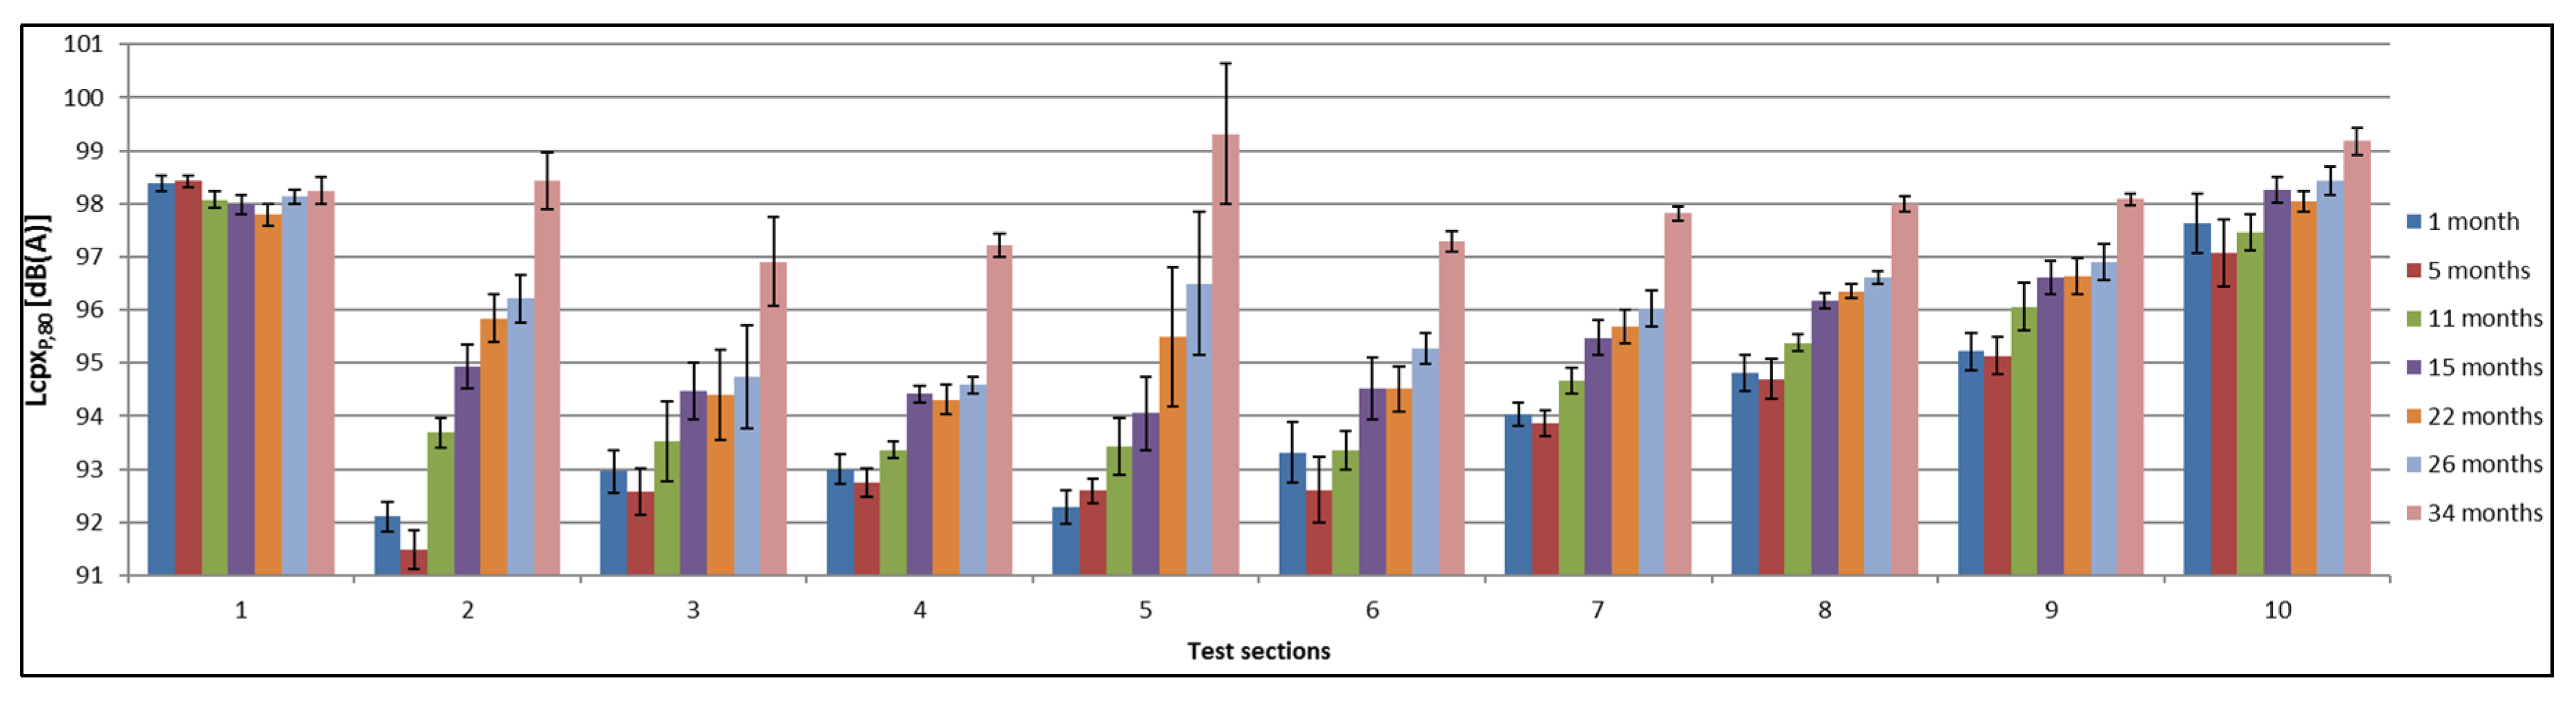
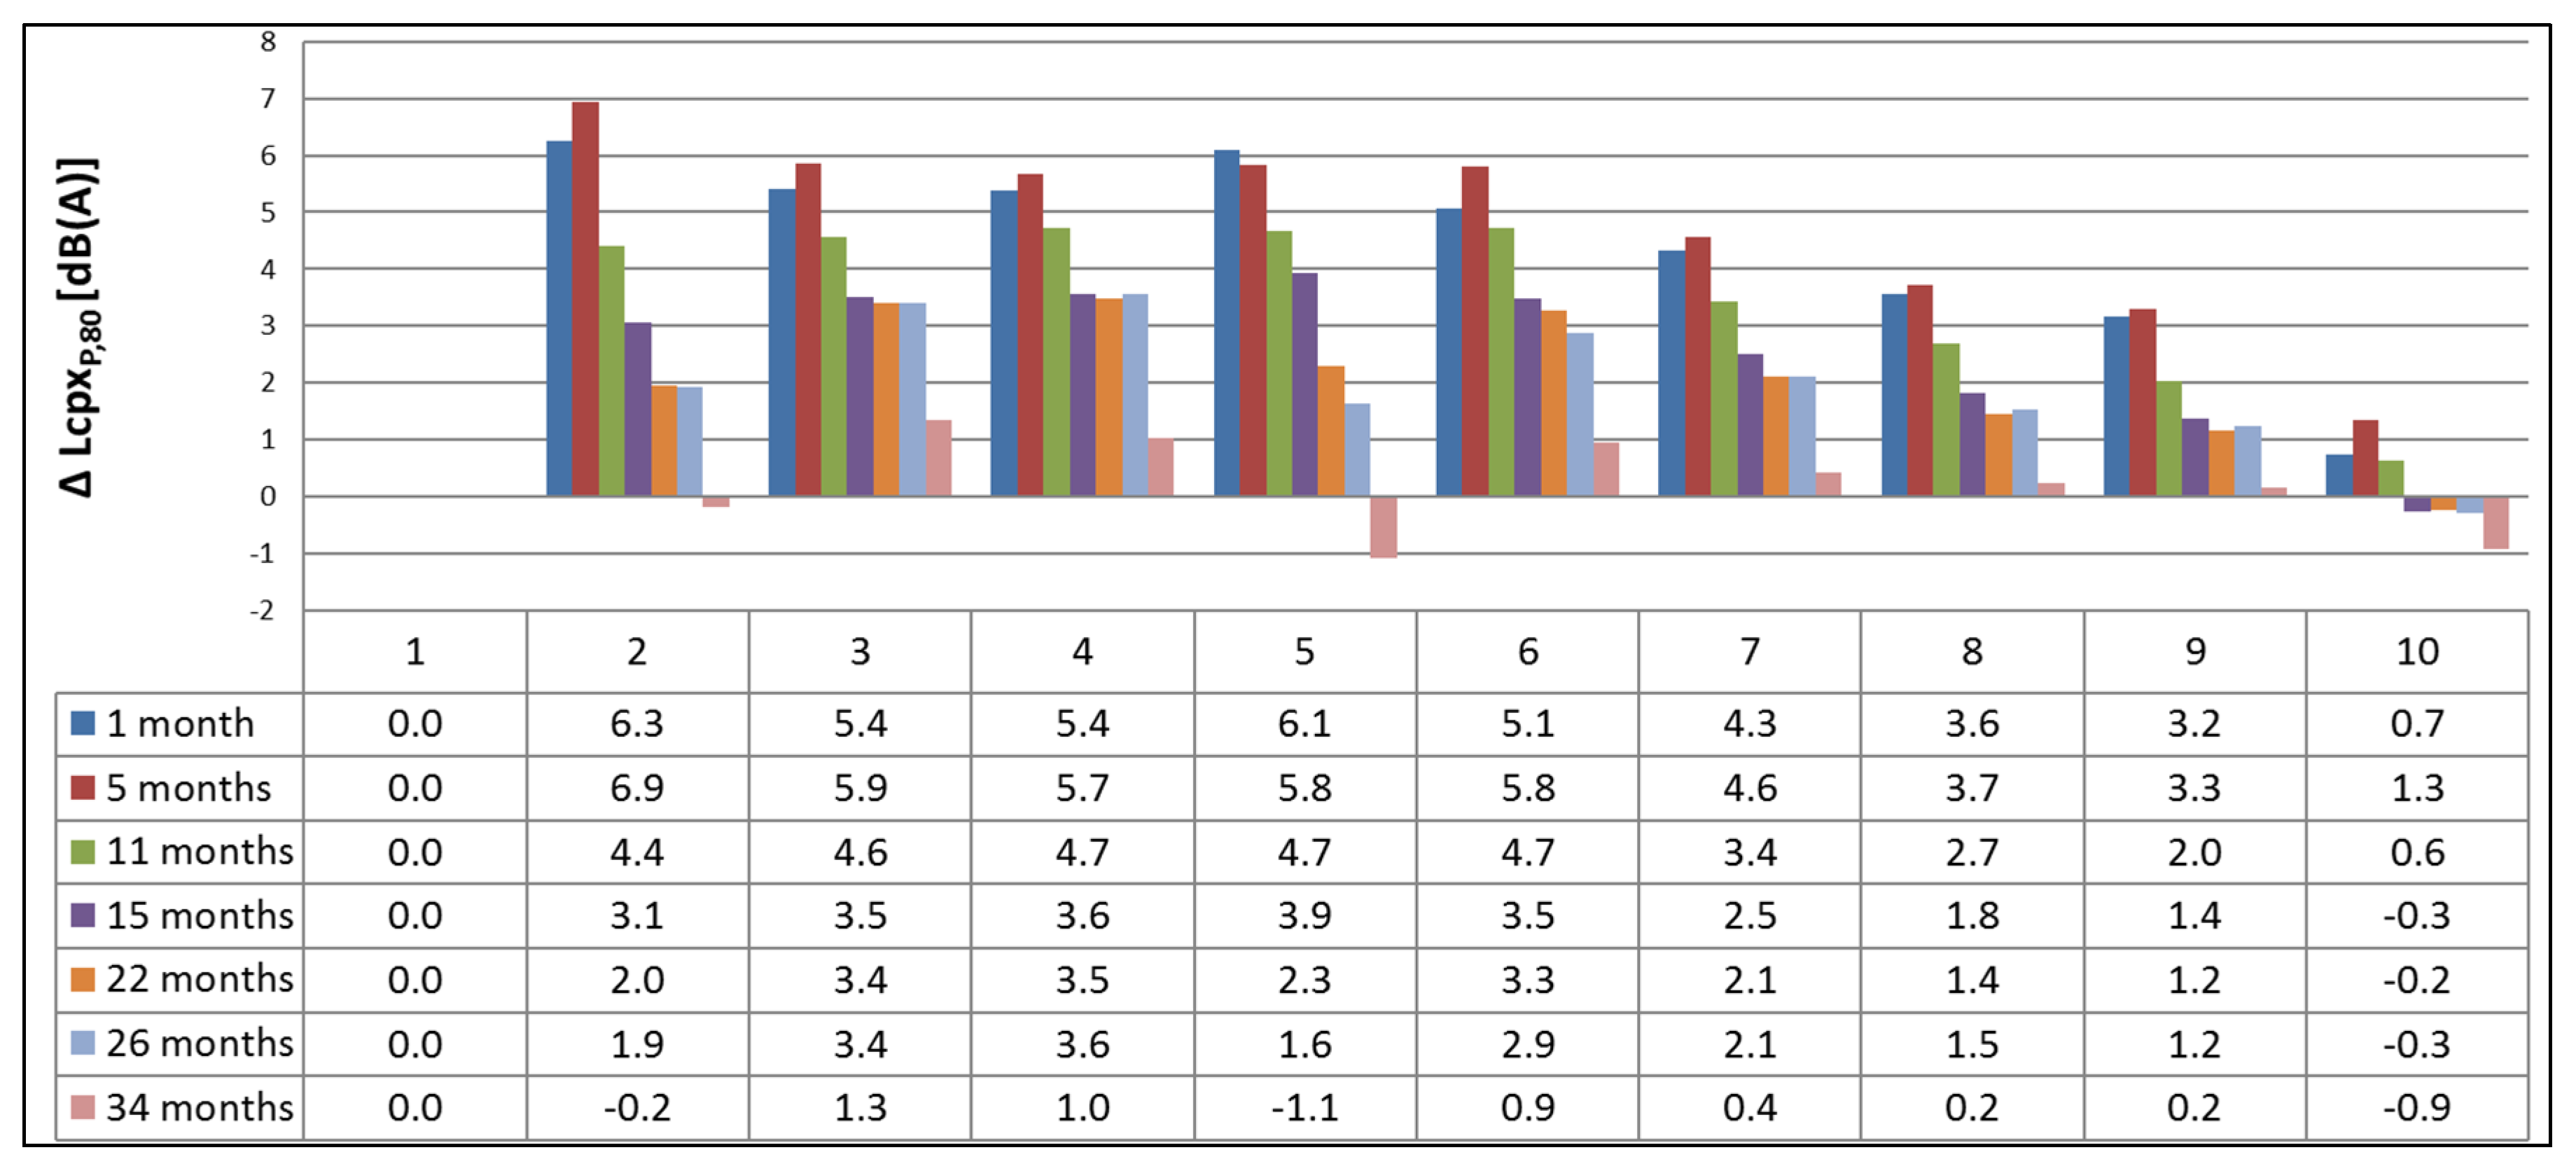
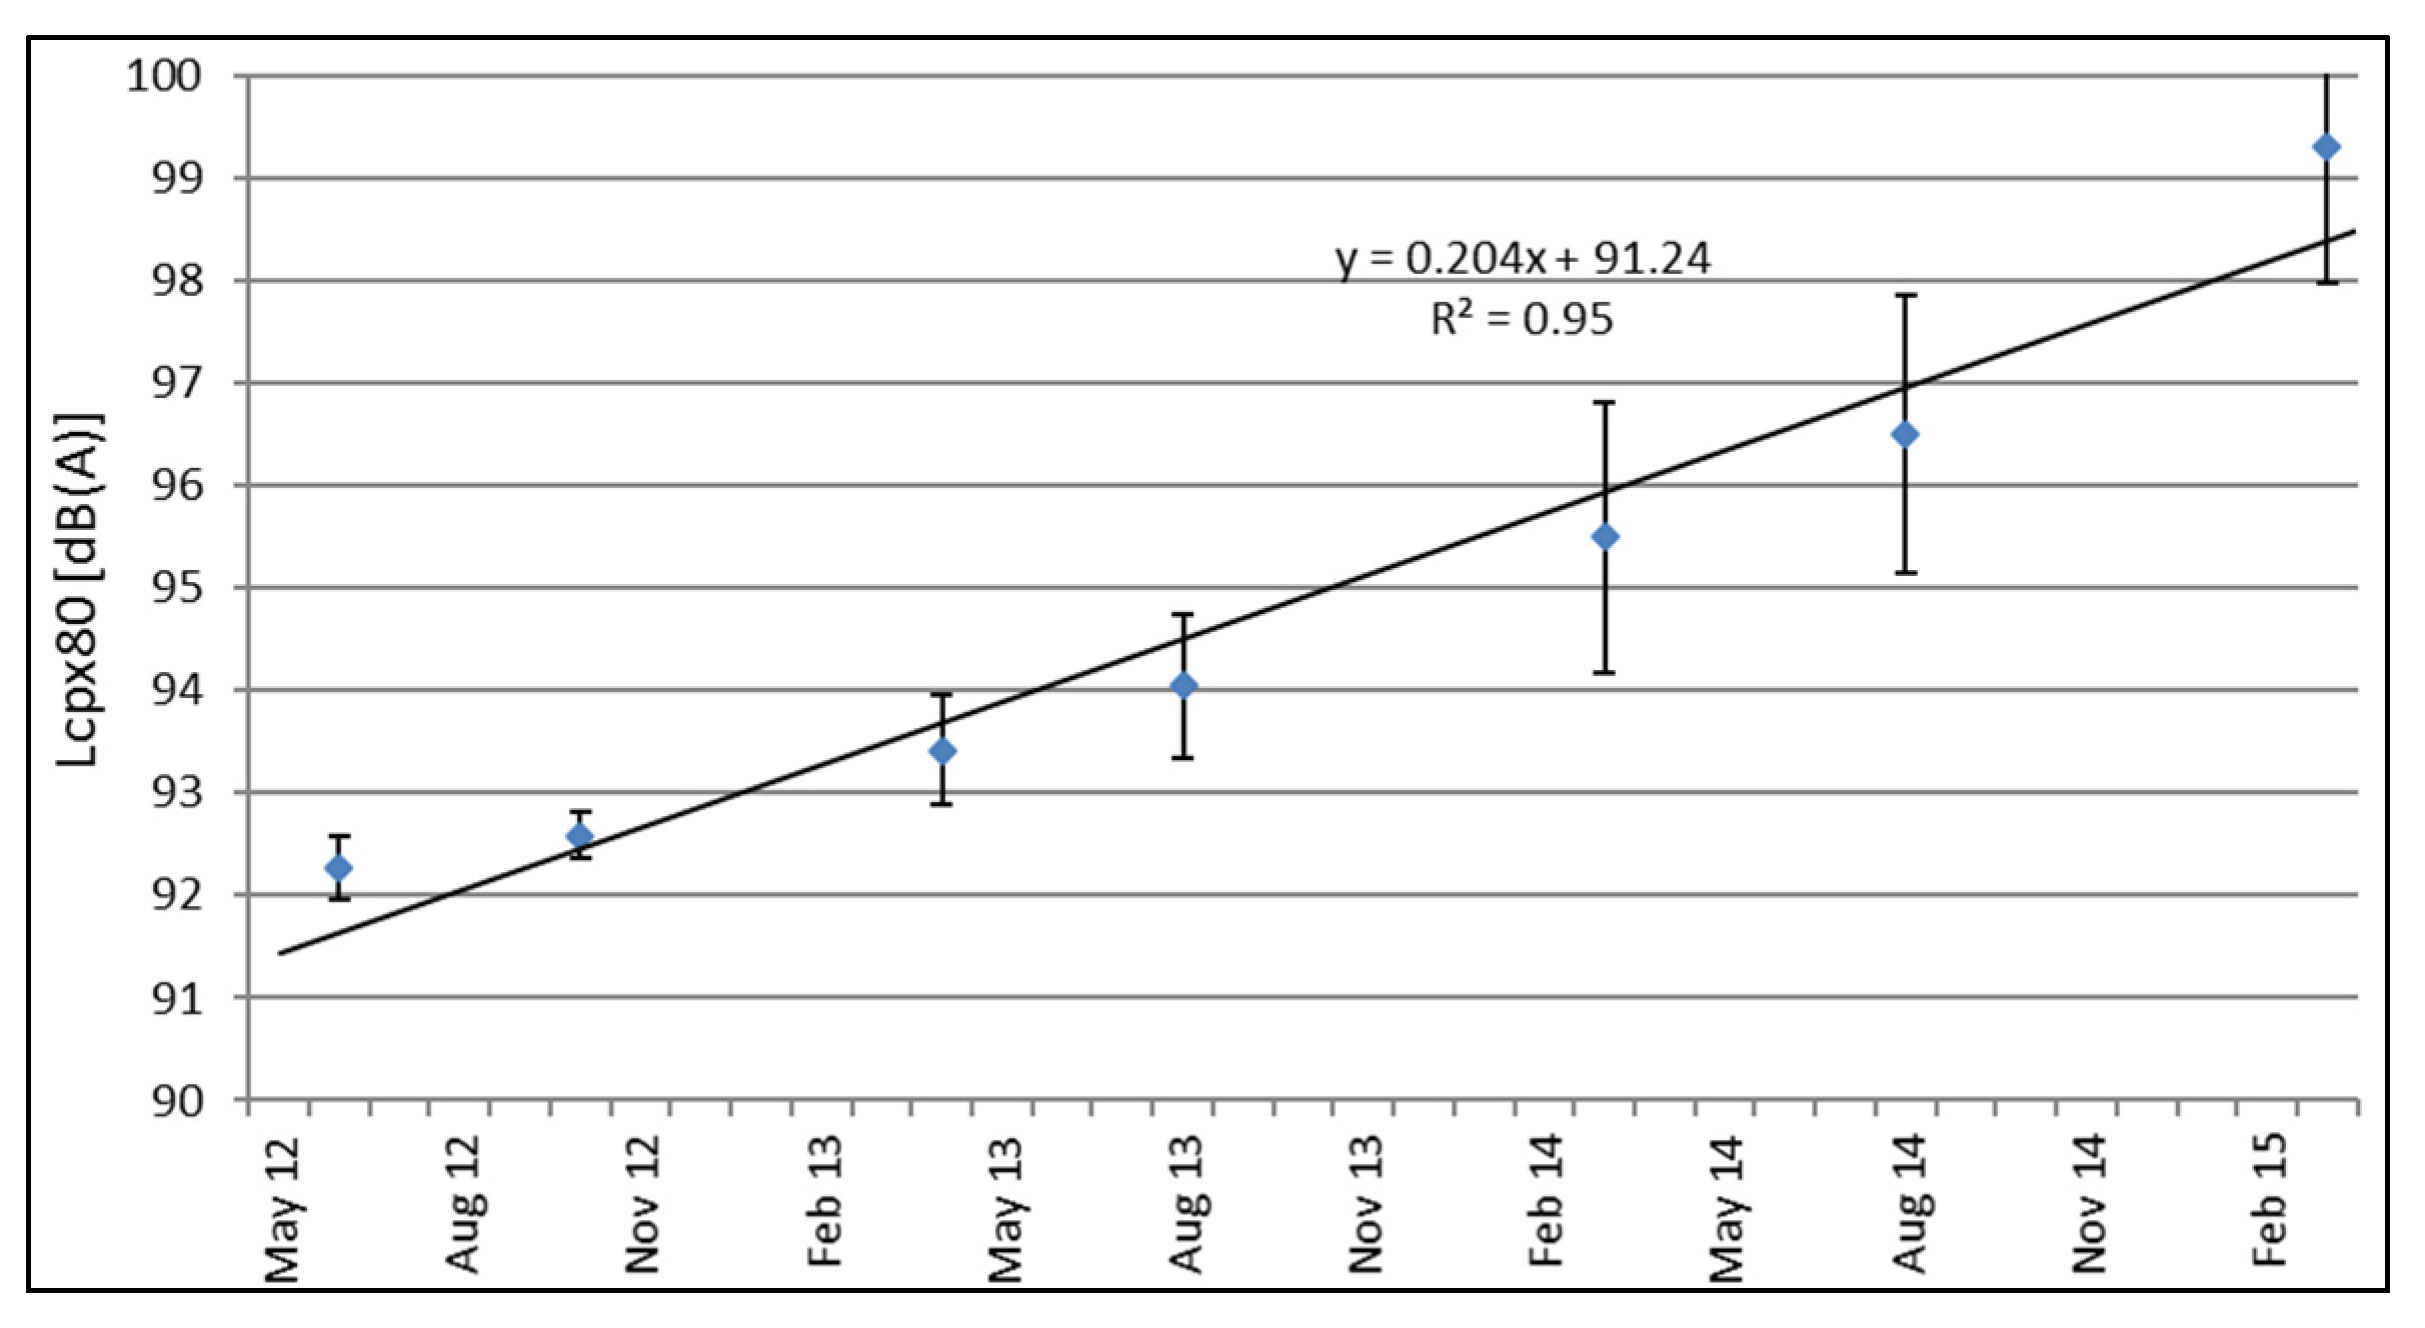
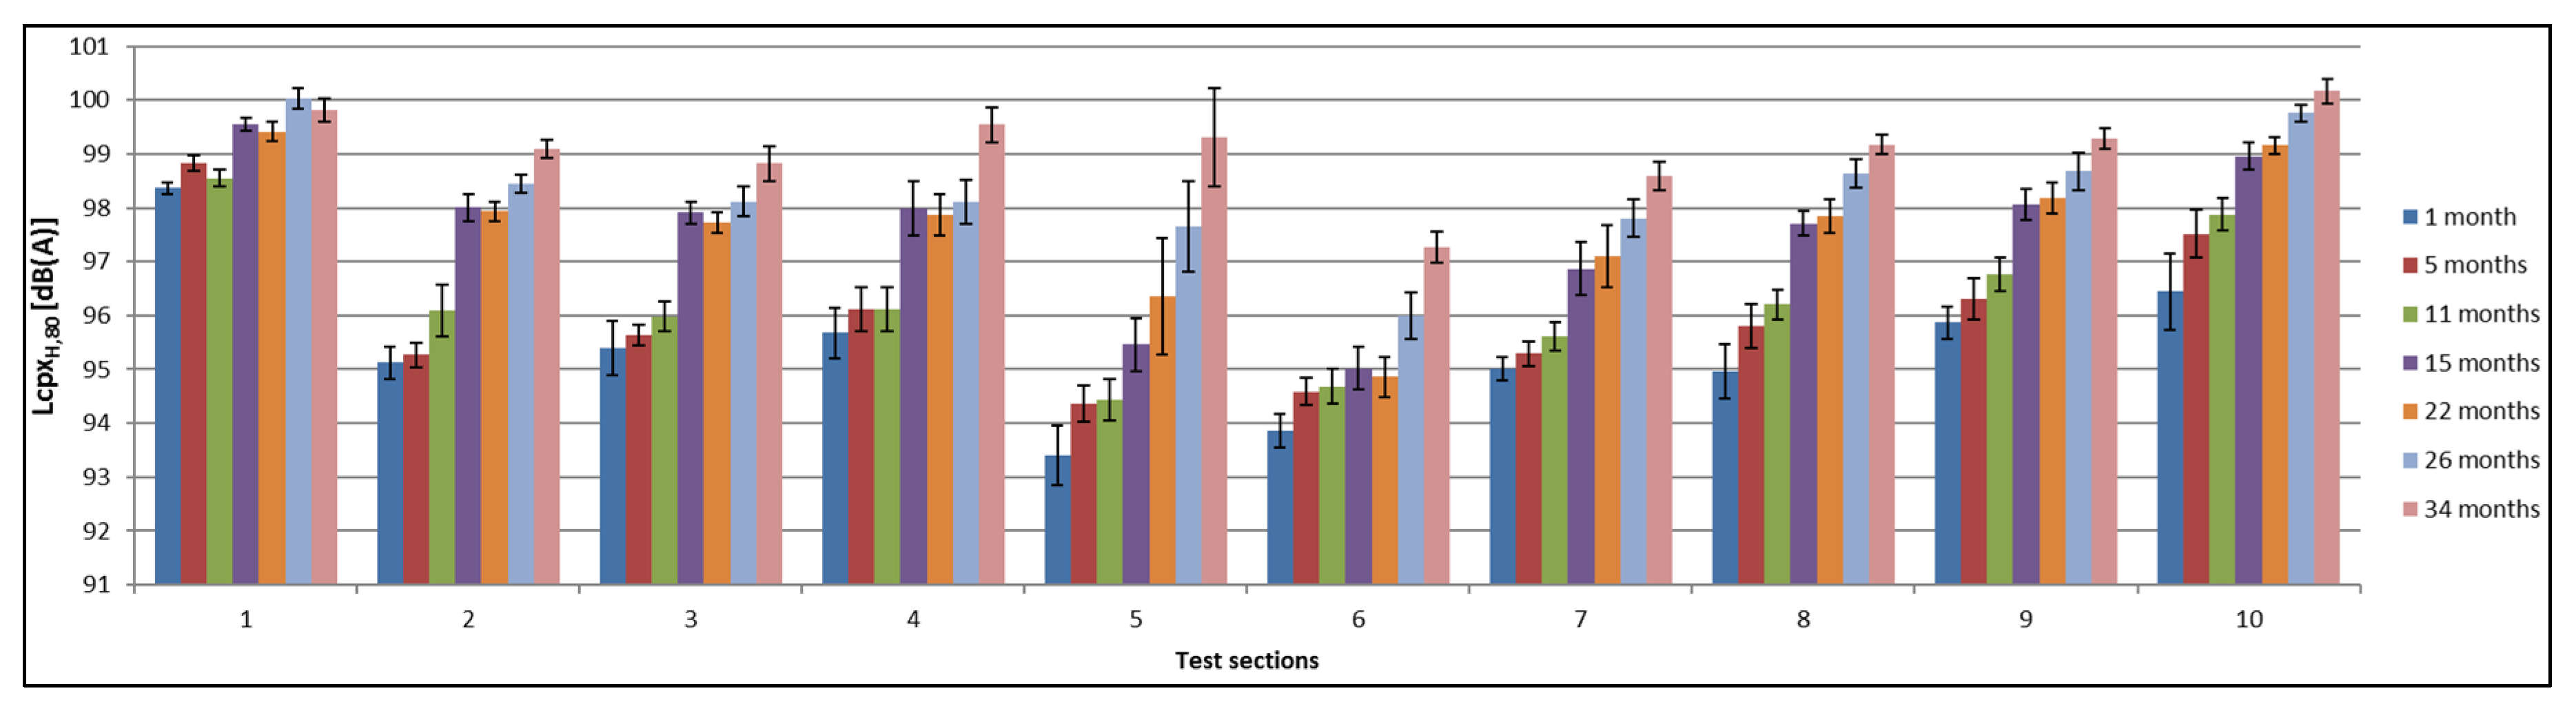
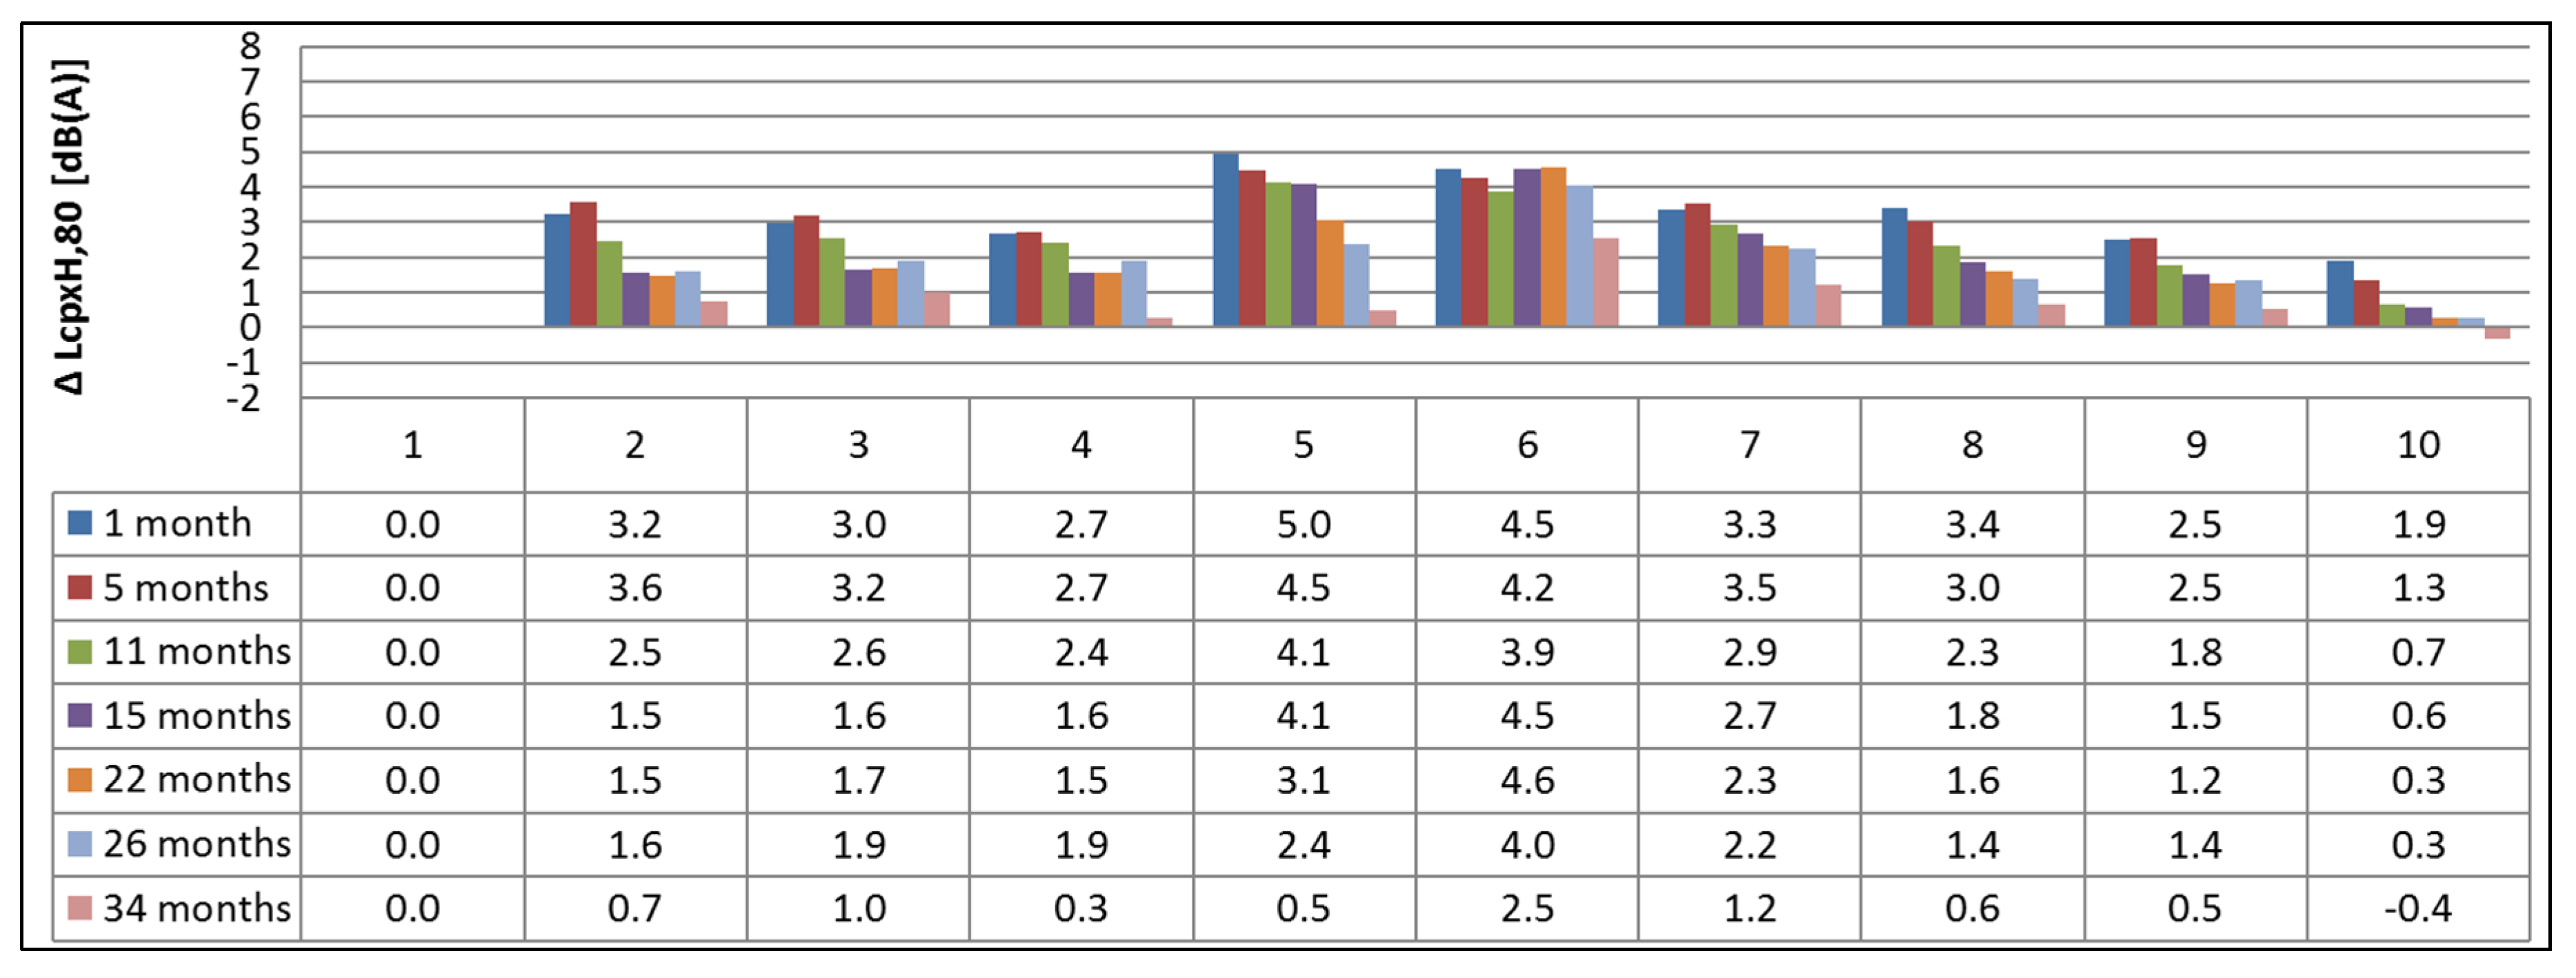
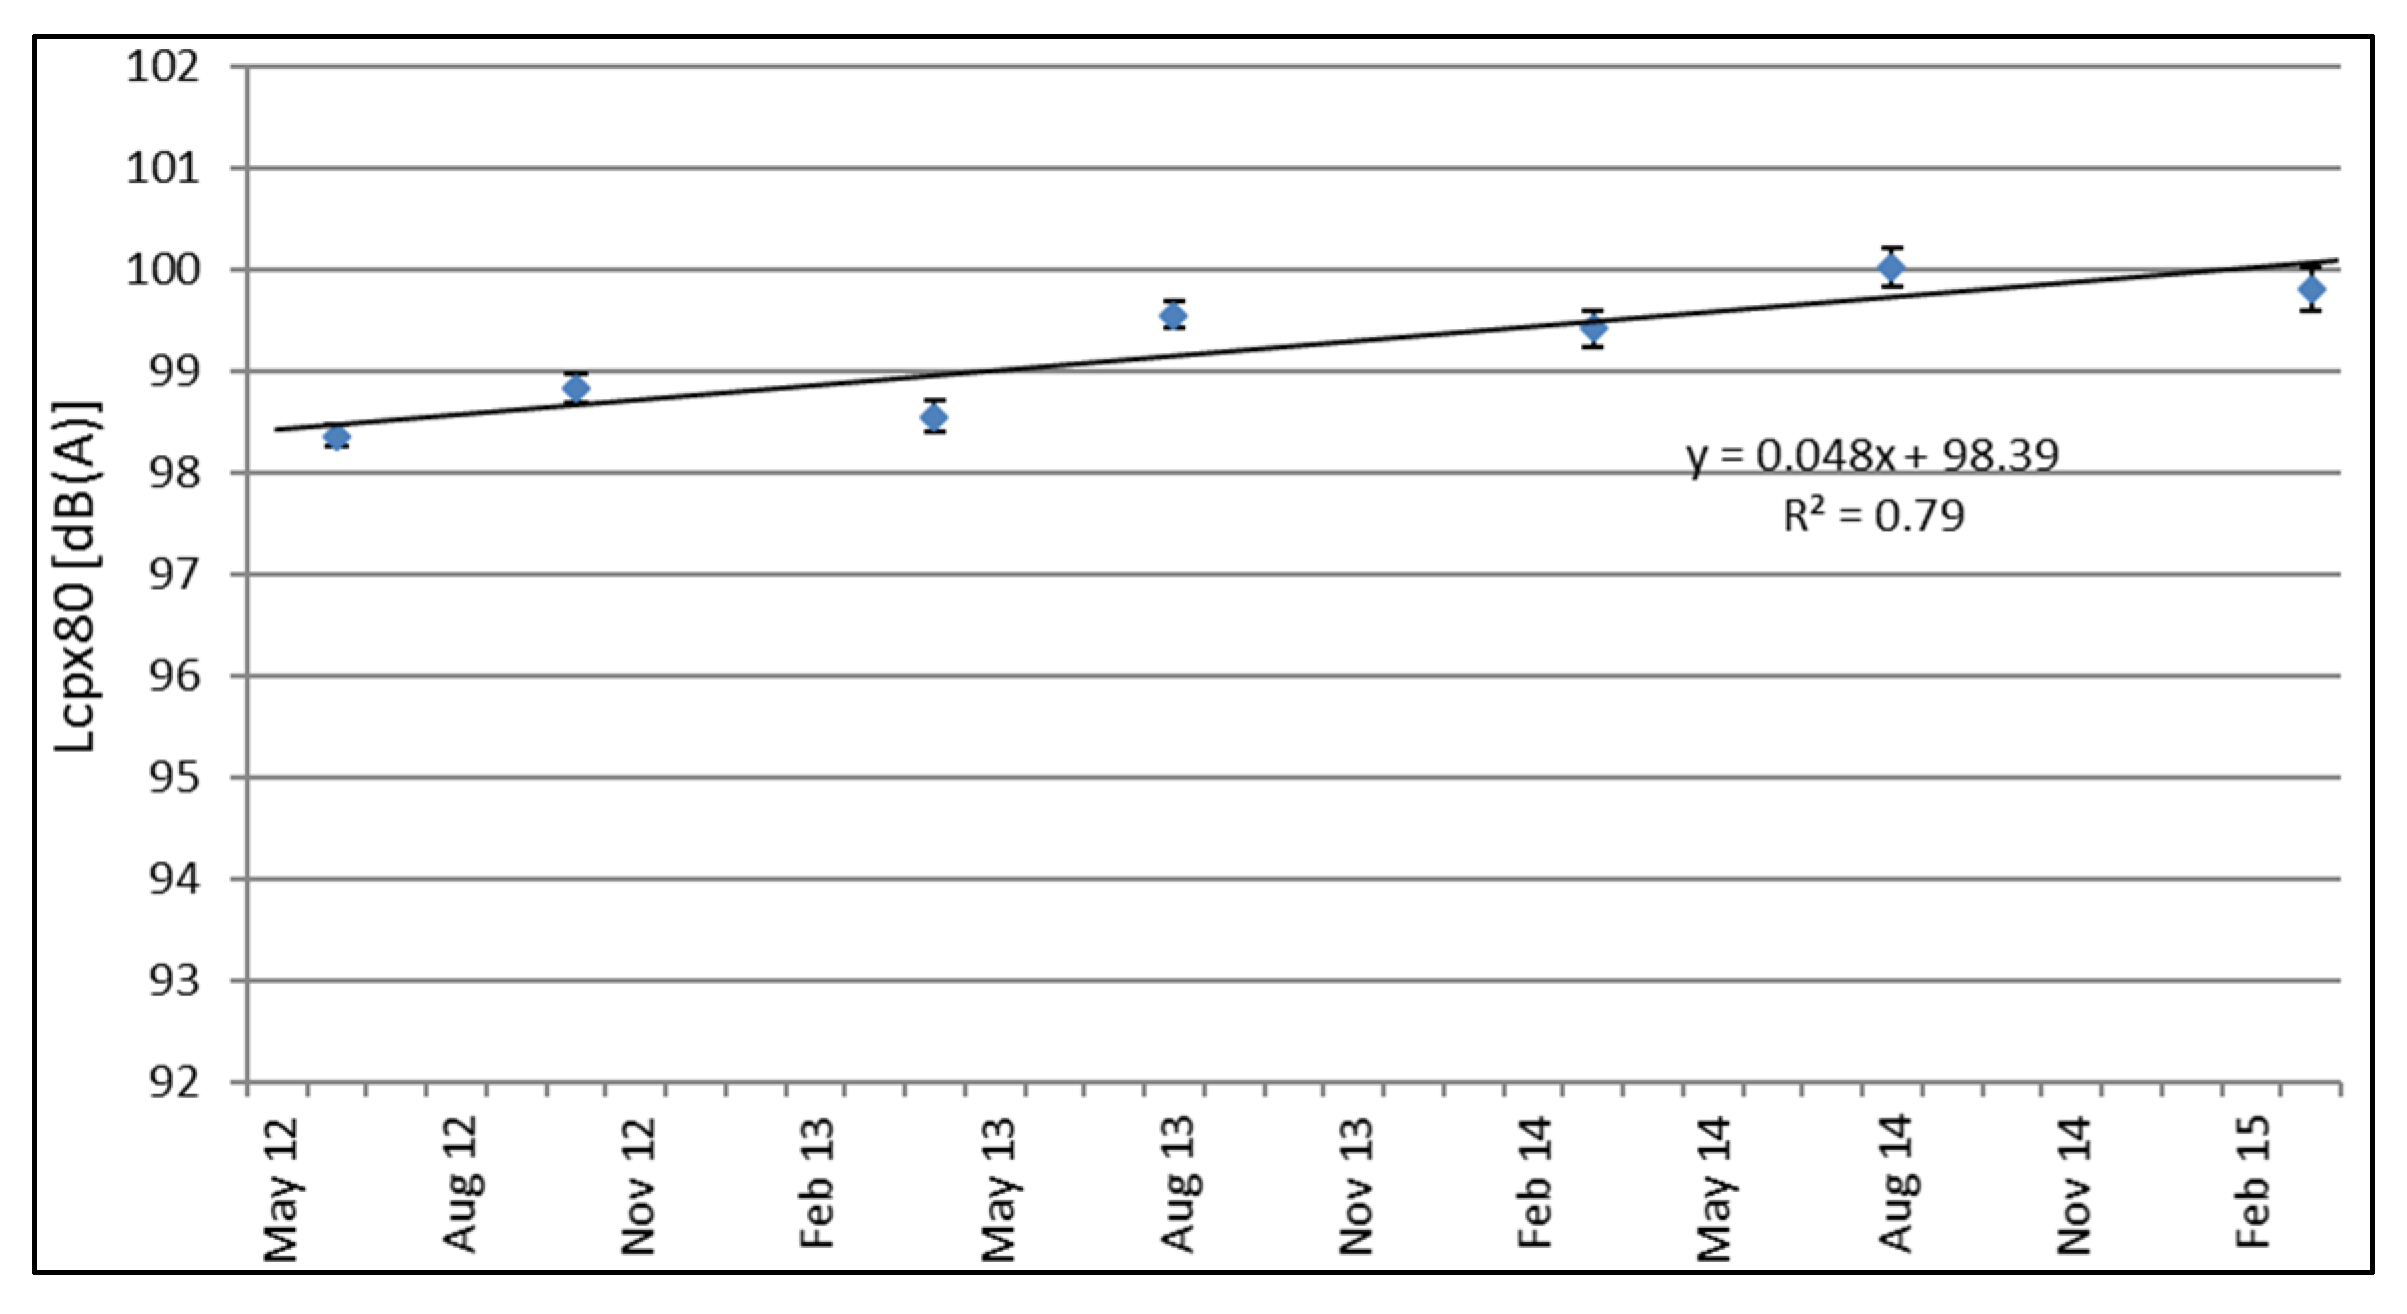
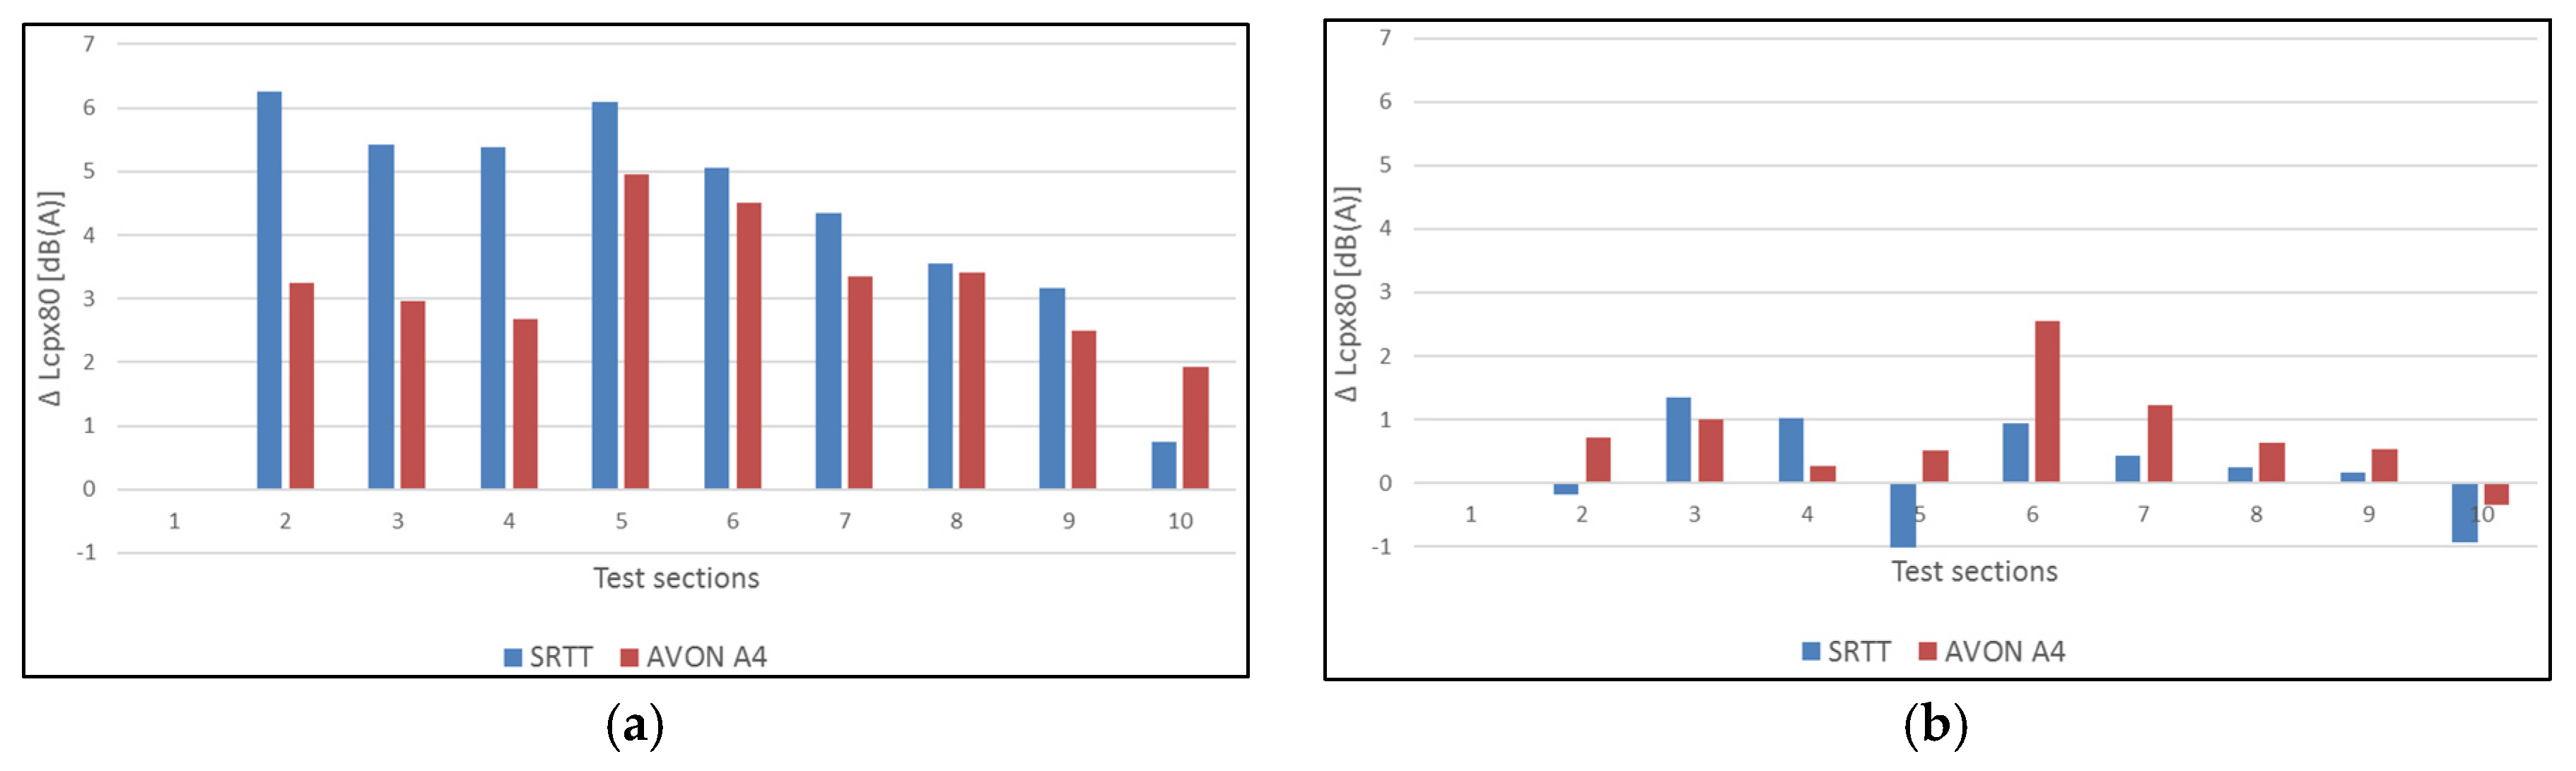
The first experience with TAL in Belgium can be considered only partly successful. A high initial noise reduction was found for a number of TAL one month after construction. The SPB results show lower initial noise reductions compared to the CPX results. As the acoustic ageing effect on the SPB results is lower than for the CPX results, the noise reduction after 2.5–3 years is considerably higher (up to 4.7 dB(A) using SPB and only 1.3 dB(A) and 2.5 dB(A) using CPX for cars and truck tires respectively). Assuming a linear relationship, the acoustic ageing effect on the noise reduction is assessed for both SPB and CPX. The TAL layers show a noise increase of 0.02–0.14 dB(A) per month based on the SPB measurements. The ageing effect is much larger for the CPX measurements with 0.05–0.20 dB(A) per month. All of these results are larger than expected when compared to previous international research.
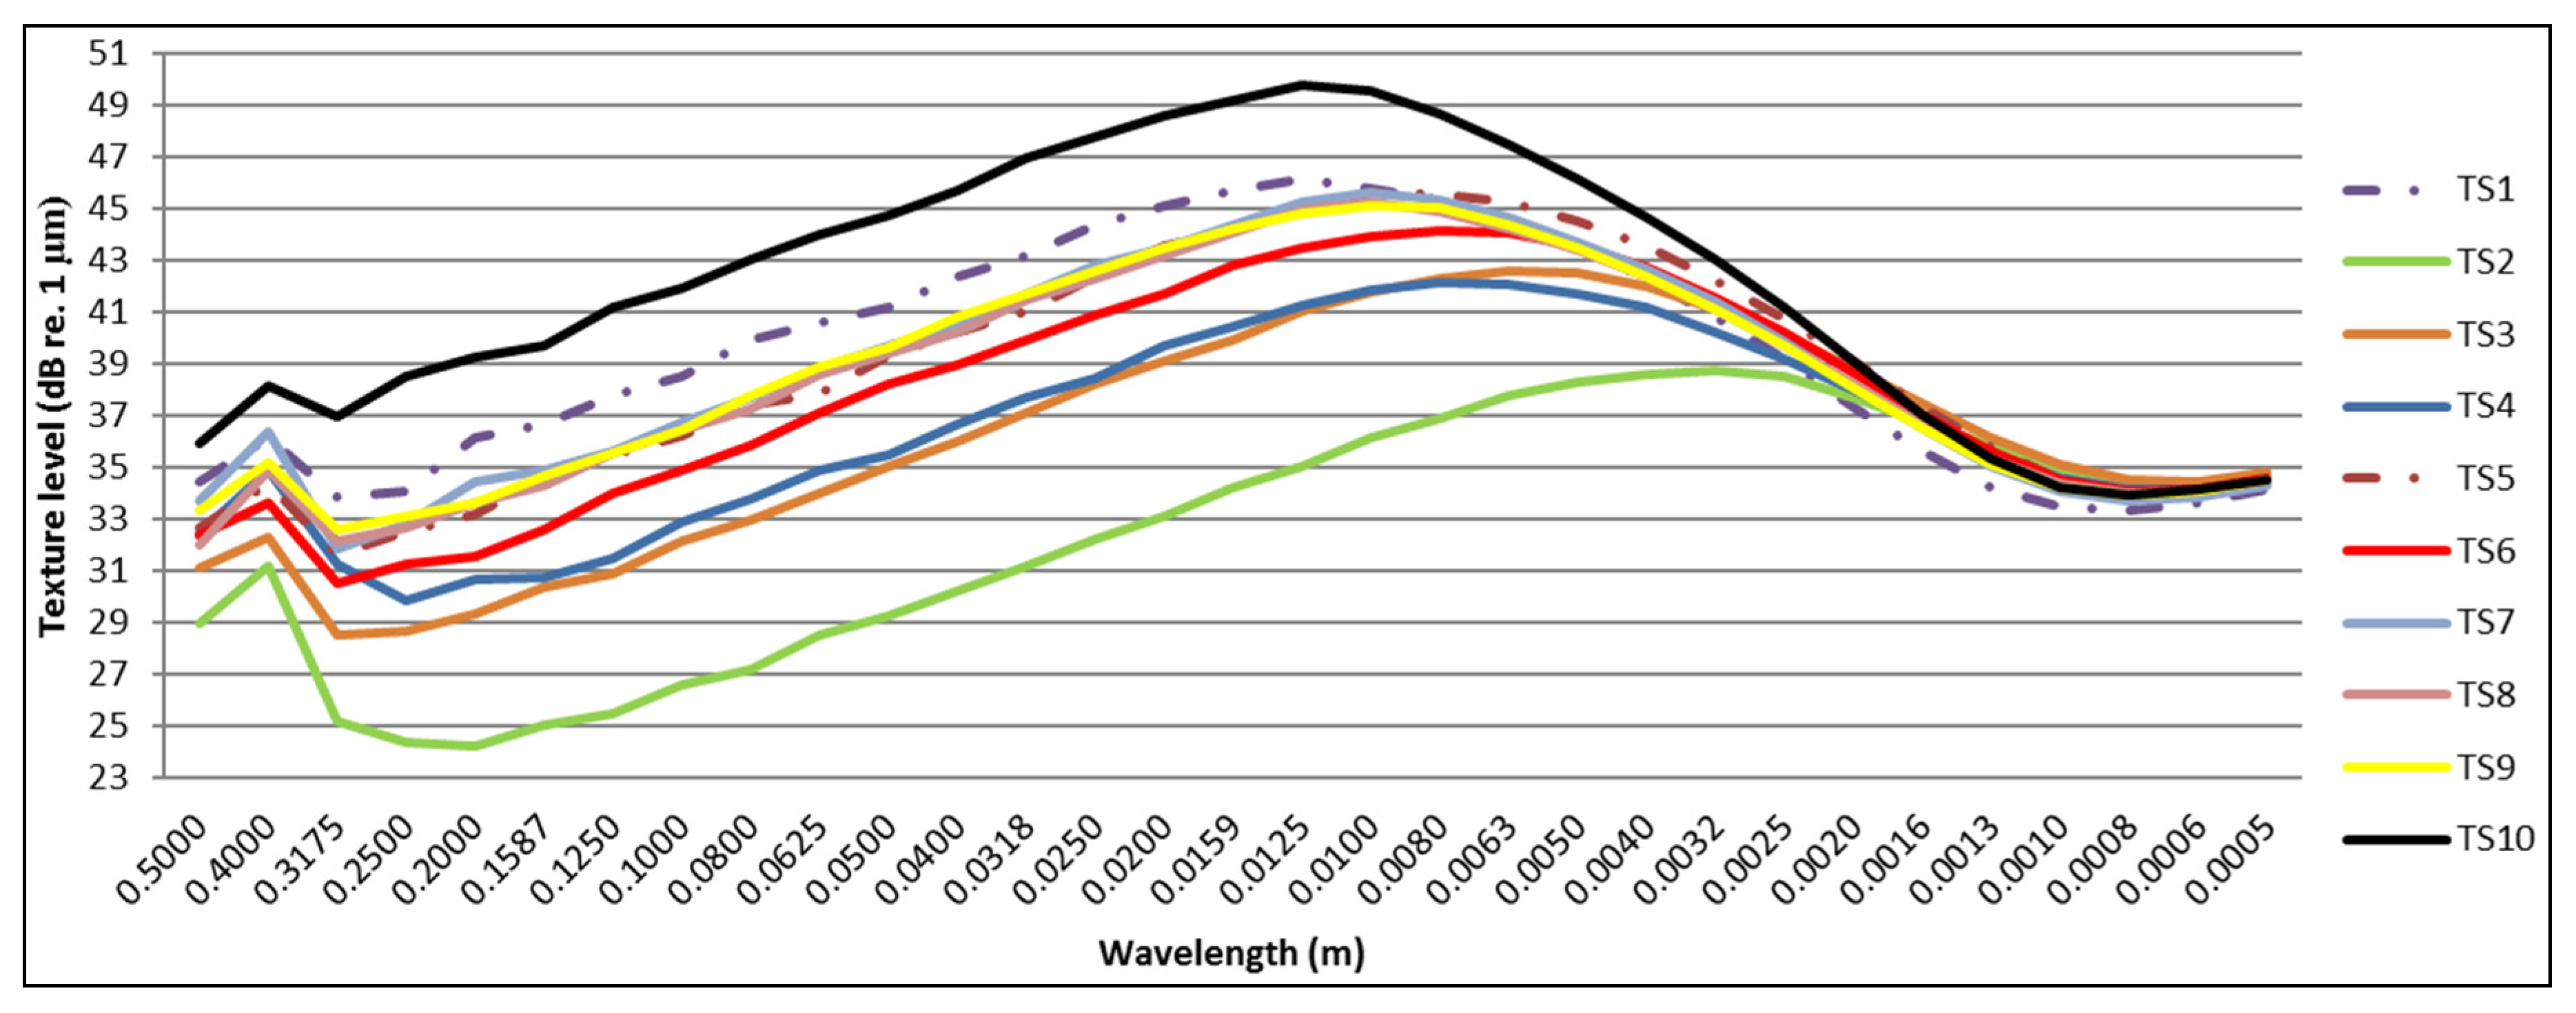
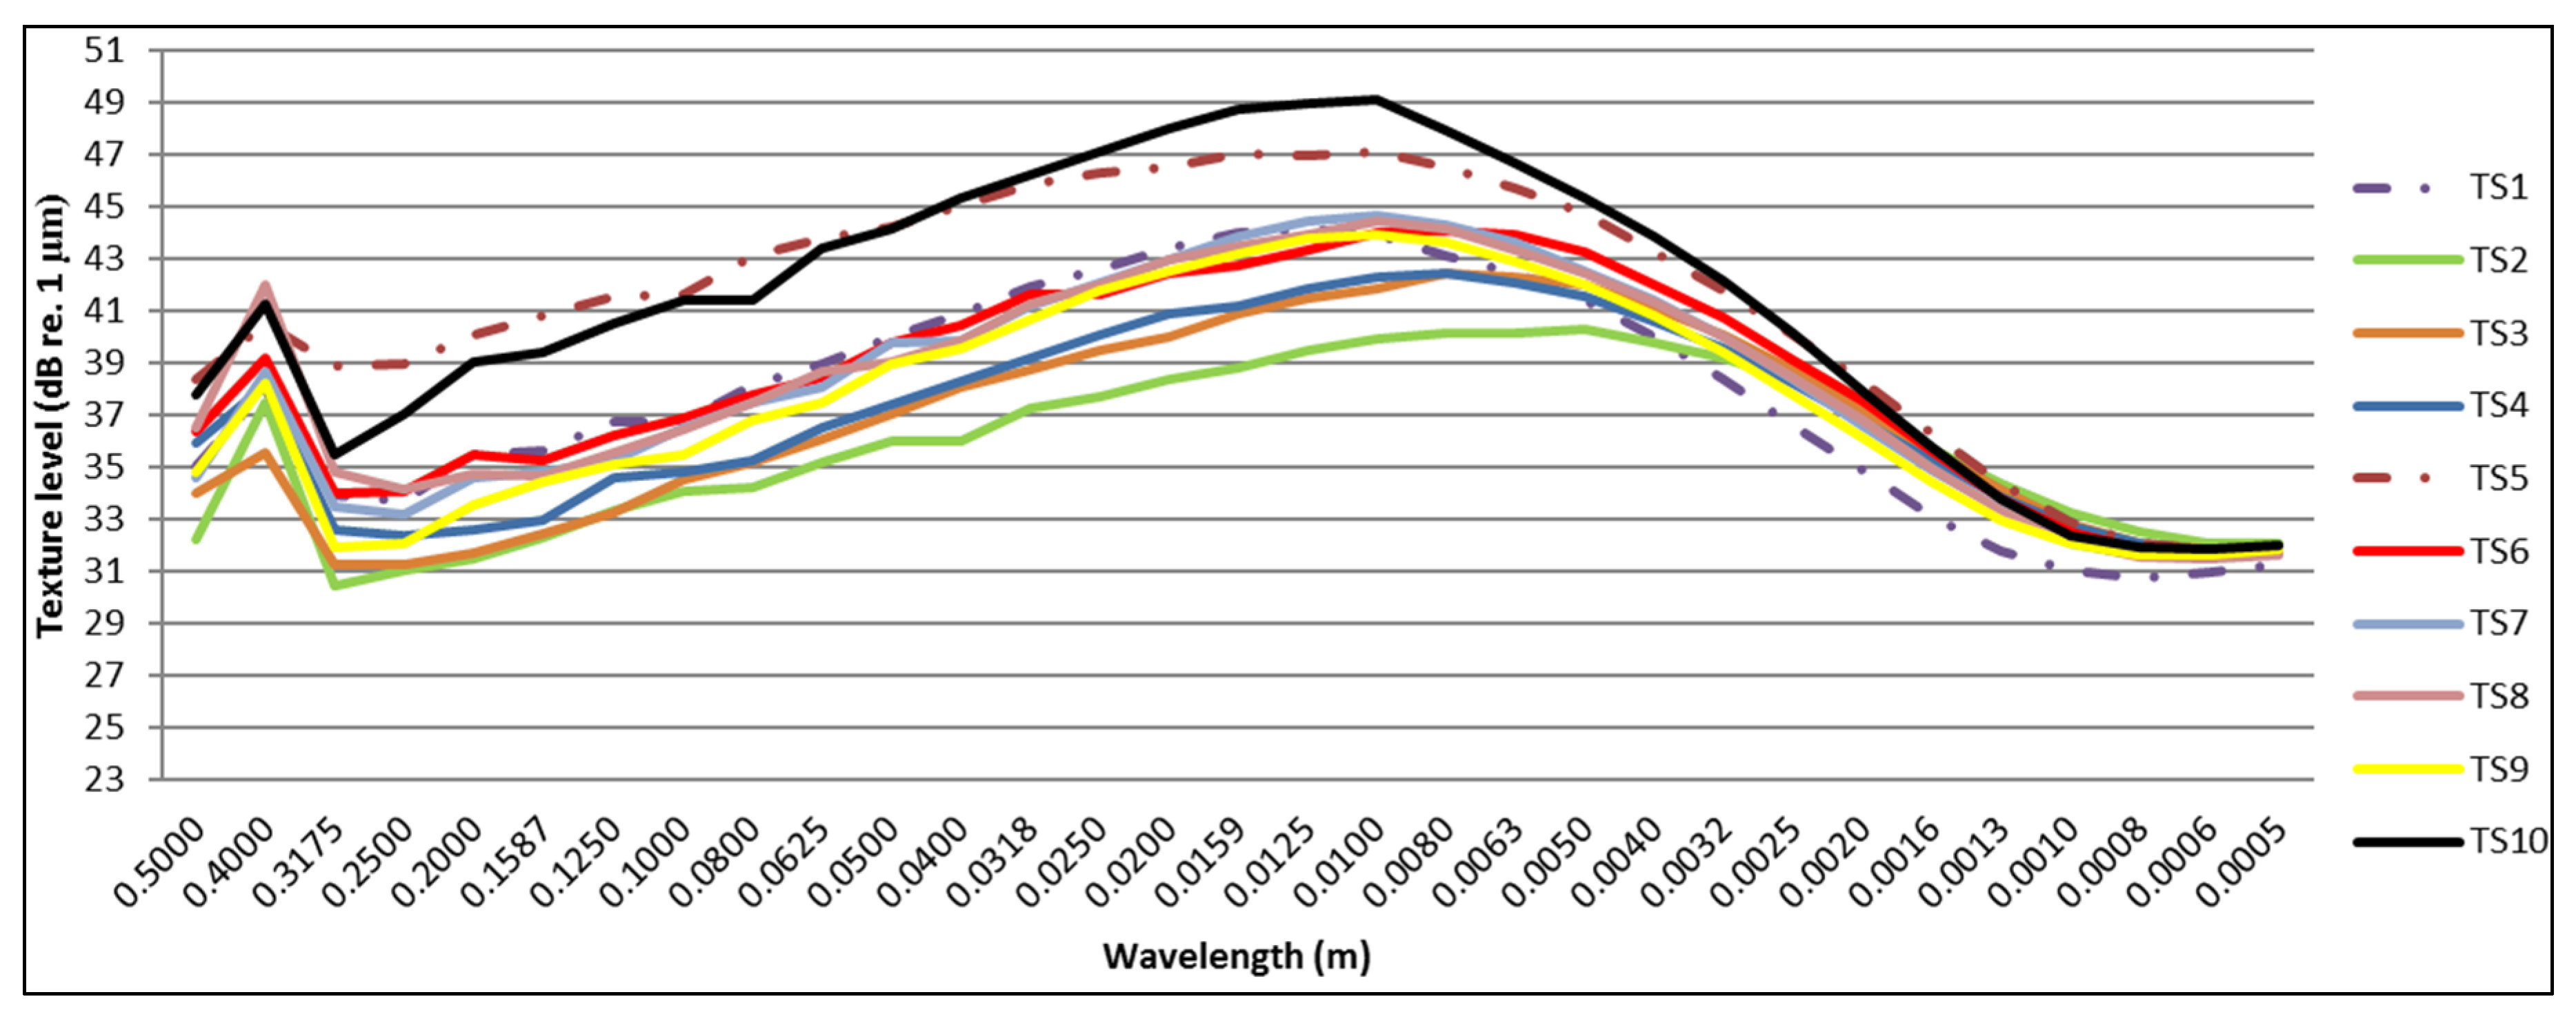
The overall noise increase is clearly linked with raveling, which is determined through visual inspections and repeated texture measurements. A higher sensitivity to raveling was found in the laboratory for the TAL of Test Sections 2 and 3 [25], which can easily be explained by the composition of the mixtures (aggregate grading and bitumen content) and the higher void content. Thin layers are therefore not applicable at places like urban road crossings or others where (heavy) vehicles exert high shear forces on the surface layer. The results indicate that it is difficult to realize an excellent noise reduction and durability at the same time.
Extra care should be taken during construction, as thin layers have a higher sensitivity to weather conditions during paving. Heavy rainfall during the construction of Test Sections 2 and 3 and problems with spraying of the tack coat might have increased raveling or even debonding of the base course. Fast cooling of the thin layers means that there is a smaller time window to achieve the desired density and compaction degree.

Acknowledgments

This research was only made possible by the two contractors who were willing to construct some innovative thin asphalt layers. The authors are grateful to them for their contributions and willingness to participate in this research. The authors would also like to thank the operators from BRRC and AWV for performing the measurements and the following master students of UAntwerp who performed some of the SPB measurements during their master’s thesis: Tatjana Vercauteren, Geert Devroye and Wouter Stuer.

Author Contributions

Cedric Vuye and Anneleen Bergiers wrote the paper and analyzed the measurement results. Anneleen Bergiers and Barbara Vanhooreweder conceived of and designed the practical experiments and were responsible for the actual realization and supervision of the measurement campaigns.

Conflicts of Interest

The authors declare no conflict of interest.

Abbreviations

The following abbreviations are used in this manuscript:
AWVFlemish Agency for Roads and Traffic
BRRCBelgian Road Research Centre
CPBControlled Pass-By method
CPXClose-ProXimity method
DPACDouble-layer Porous Asphalt Concrete
EMIBEnergy and Materials in Infrastructure and Buildings (research group of UAntwerp)
ISOInternational Organization for Standardization
LNEEnvironment, Nature and Energy Department of the Flemish government
PAC 8Porous Asphalt Concrete with a maximum aggregate size of 8 mm
SMAStone Mastic Asphalt
SMNDivision Surface characteristics-Markings-Noise of BRRC
SPBStatistical Pass-By method
SRTTStandard Reference Test Tire
T&EThe European Federation for Transport and Environment
UAntwerpUniversity of Antwerp
VTAC 8A thin layer with a maximum aggregate size of 8 mm
WHOWorld Health Organization

References

  1. WHO Regional Office for Europe. Burden of Disease from Environmental Noise—Quantification of Healthy Life Years Lost in Europe. 2011. Available online: http://www.who.int/quantifying_ehimpacts/publications/e94888/en/ (accessed on 16 May 2016).
  2. LNE. Actieplan Wegverkeerslawaai. 2010. Available online: http://www.lne.be/themas/hinder-en-risicos/geluidshinder/beleid/eu-richtlijn/actieplannen/actieplannen (accessed on 16 May 2016).
  3. Den Boer, L.C.; Schroten, A. Traffic Noise Reduction in Europe—Health Effects, Social Costs and Technical and Policy Options to Reduce Road and Rail Traffic Noise, Report for T & E by CE Delft. 2007. Available online: http://www.cedelft.eu/publicatie/traffic_noise_reduction_in_europe/821 (accessed on 16 May 2016).
  4. Miljković, M.; Radenberg, M. Thin noise-reducing asphalt pavements for urban areas in Germany. Int. J. Pavement Eng. 2012, 13, 569–578. [Google Scholar] [CrossRef]
  5. Li, M.; van Keulen, W.; van de Ven, M.; Molenaar, A.; Tang, G. Investigation on material properties and surface characteristics related to tyre-road noise for thin layer surfacings. Constr. Build. Mater. 2014, 59, 62–71. [Google Scholar] [CrossRef]
  6. Ho, K.-Y.; Hung, W.-T.; Ng, C.-F.; Lam, Y.-K.; Leung, R.; Kam, E. The effects of road surface and tyre deterioration on tyre/road noise emission. Appl. Acoust. 2013, 74, 921–925. [Google Scholar] [CrossRef]
  7. Freitas, E.F. The effect of time on the contribution of asphalt rubber mixtures to noise abatement. Noise Control Eng. 2012, 60. [Google Scholar] [CrossRef]
  8. Freitas, E.F.; Mendonça, C.; Santos, J.A.; Murteira, C.; Ferreira, J.P. Traffic noise abatement: how different pavements, vehicle speeds and traffic densities affect annoyance levels. Transp. Res. D 2012, 17, 321–326. [Google Scholar] [CrossRef]
  9. Skov, R.S.H.; Andersen, B.; Bendtsen, H.; Cesbron, J. Laboratory measurements on noise reducing PERS test slabs. In Proceedings of the Forum Acusticum 2014, Krakow, Poland, 7–12 September 2014; p. 7.
  10. Praticò, F.G.; Anfosso-Lédée, F. Trends and issues in mitigating traffic noise through quiet pavements. Procedia Soc. Behav. Sci. 2012, 53, 203–212. [Google Scholar] [CrossRef]
  11. SILVIA Homepage. Available online: http://www.transport-research.info/project/sustainable-road-surfaces-traffic-noise-control (accessed on 16 May 2016).
  12. SILENCE Homepage. Available online: http://www.silence-ip.org/site/index.html (accessed on 16 May 2016).
  13. OPTHINAL Final Report. Available online: http://vti.diva-portal.org/smash/get/diva2:674028/FULLTEXT02.pdf (accessed on 16 May 2016).
  14. PERSUADE Homepage. Available online: http://persuade.fehrl.org/ (accessed on 16 May 2016).
  15. Sandberg, U. Road traffic noise—The influence of the road surface and its characterization. Appl. Acoust. 1987, 21, 97–118. [Google Scholar] [CrossRef]
  16. Liao, G.; Sakhaeifar, M.S.; Heitzman, M.; West, R.; Waller, B.; Wang, S.; Ding, Y. The effects of pavement surface characteristics on tire-pavement noise. Appl. Acoust. 2014, 76, 14–23. [Google Scholar] [CrossRef]
  17. Mun, S. Sound absorption characteristics of porous asphalt concrete pavements. Can. J. Civil Eng. 2010, 37, 273–278. [Google Scholar] [CrossRef]
  18. Peeters, B.; Ammerlaan, I.; Kuijpers, A. Noise reduction by absorbing road surfaces—Destroying the horn effect. In Proceedings of the International Conference on Noise and Vibration Engineering (ISMA), Leuven, Belgium, 20–22 September 2010; pp. 4053–4064.
  19. Li., M.; van Keulen, M.; Ceylan, H.; Cao, D.; van de Ven, M.L.; Molenaar, A. Pavement stiffness measurements in relation to mechanical impedance. Constr. Build. Mater. 2016, 102, 455–461. [Google Scholar] [CrossRef]
  20. Freitas, E.; Dias Rodrigues, J.; Araújo, J.; Silva, H.M.R.D. Innovative low noise surfaces—Comparison of damping and absorption. In Proceedings of the 43rd International Congress on Noise Control Engineering (Inter-Noise 2014), Melbourne, Australia, 16–19 November 2014.
  21. Sandberg, U. Semi-generic temperature corrections for tyre/road noise. In Proceedings of the Inter-Noise 2004, Prague, Czech Republic, 22–25 August 2004; p. 628.
  22. Anfosso-Lédée, F.; Pichaud, Y. Temperature effect on tyre-road noise. Appl. Acoust. 2007, 68, 1–16. [Google Scholar] [CrossRef]
  23. Bühlmann, E.; Ziegler, T. Temperature effects on tyre/road noise measurements and the main reasons for their variation. In Proceedings of the Inter-Noise 2013, Innsbruck, Austria, 15–18 September 2013; p. 7.
  24. Bühlmann, E.; van Blokland, G. Temperature effects on tyre/road-noise—A review of empirical research. In Proceedings of Forum Acusticum 2014, Kraków, Poland, 7–12 September 2014; p. 6.
  25. Bergiers, A.; de Visscher, J.; Denolf, K.; Destree, A.; Vanhooreweder, B.; Vuye, C. Test sections to study the acoustical quality of thin noise reducing asphalt layers. In Proceedings of the International Conference on Noise and Vibration Engineering (ISMA), Leuven, Belgium, 15–17 September 2014; pp. 1707–1722.
  26. De Visscher, J.; Denolf, K.; Estrée, A.; Vanelstraete, A.; Vansteenkiste, S.; Piérard, N. Validatie van prestatieproeven voor dunne toplagen op de proefvakken N19 Kasterlee. In Proceedings of the 22nd Belgisch Wegencongres, Luik, Belgium, 11–13 September 2013. (In Dutch)
  27. Vanhooreweder, B.; Bergiers, A.; Goubert, L. Stille dunne toplagen: Proefproject N19 Kasterlee. In Proceedings of the 22nd Belgisch Wegencongres, Luik, Belgium, 11–13 September 2013. (In Dutch)
  28. ISO 11819-1-Acoustics—Measurement of the Influence of Road Surfaces on Traffic Noise—Part 1: Statistical Pass-By Method; International Organization for Standardization: Geneva, Switzerland, 1997.
  29. Vercauteren, T. Studie van de Akoestische Kwaliteit van Stille Deklagen en Dubbellaags Zeer Open Asphalt. Master’s Thesis, University of Antwerp, Antwerp, Belgium, 2014. [Google Scholar]
  30. Devroye, G.; Stuer, W. Studie van Stille Wegdekken: Dunne Deklagen, Dubbellaags Zeer Open Asfalt en PERS. Master’s Thesis, University of Antwerp, Antwerp, Belgium, 2015. [Google Scholar]
  31. ISO/DIS 11819-2-Acoustics—Measurement of the Influence of Road Surfaces on Traffic Noise—Part 2: The Close-Proximity Method (Draft Version); International Organization for Standardization: Geneva, Switzerland, 2012.
  32. ISO 13473-2-Characterization of Pavement Texture by Use of Surface Profiles—Part 2: Terminology and Basic Requirements Related to Pavement Texture Profile Analysis; International Organization for Standardization: Geneva, Switzerland, 2002.
  33. ISO 13473-3-Characterization of Pavement Texture by Use of Surface profiles—Part 3: Specification and Classification of Profilometers; International Organization for Standardization: Geneva, Switzerland, 2002.
  34. ISO/TS 13473-4-Characterization of Pavement Texture by Use of Surface Profiles—Part 4: Spectral Analysis of Surface Profiles; International Organization for Standardization: Geneva, Switzerland, 2008.
  35. Bergiers, A.; Goubert, L. An international round robin test to assess the accuracy of the Statistical Pass By method and its “backing board” variant. In Proceedings of the ICSV17, Cairo, Egypt, 18–22 July 2010.
  36. Vanhooreweder, B. Luidheid van Belgische wegdekken. In Proceedings of the Silent Roads Symposium, Mechelen, Belgium, 14 October 2014.
  37. Gardziejczyk, W. The effect of time on acoustic durability of low noise pavements—The case studies in Poland. Transp. Res. D 2016, 44, 93–104. [Google Scholar] [CrossRef]
  38. Bendtsen, H.; Kohler, E.; Lu, Q.; Rymer, B. California-Denmark study on acoustic aging of road pavements. Transp. Res. Rec. 2010, 2158, 122–128. [Google Scholar] [CrossRef]
  39. Van Blokland, G.; Tollenaa, C.; van Loon, R. Report on Acoustic Aging of Road Surfaces, Deliverable D2.2, QUESTIM. Available online: http://www.questim.org/questim.org/downloads (accessed on 16 May 2016).
  40. Muiread, M.; Morris, L.; Stait, R.E. The Performance of Quieter Surfaces over Time; Published Project Report PPR485; Transport Research Laboratory: Wokingham, UK, 2010. [Google Scholar]
  41. Andersen, B.; Bendtsen, H. Noise from heavy vehicles on thin noise reducing surfaces. In Proceedings of the Inter-Noise 2013, Innsbruck, Austria, 15–18 September 2013; p. 129.
  42. Bergiers, A.; Vanhooreweder, B.; Vercauteren, T.; Vuye, C. Pilot study of the acoustical quality of thin noise reducing asphalt layers. In Proceedings of the Inter-Noise 2013, Innsbruck, Austria, 15–18 September 2013.
  43. ROSANNE Homepage. Available online: http://rosanne-project.eu/ (accessed on 16 May 2016).
  44. Kragh, J.; Skov, R.; Oddershede, J.; Anfosso-Ledée, F.; Bartolomaeus, W.; Zöller, M.; Berge, T.; Bergiers, A.; Muirhead, M.; Wehr, R. Report on the Analysis and Comparison of Existing Noise Measurement Methods for Noise Properties of Road Surfaces; ROSANNE Deliverable D2.3; ROSANNE: Brussels, Belgium, 2015. [Google Scholar]
Figure 1. CPX trailer used by AWV.
Coatings 06 00021 g001
Figure 2. Laser profilometer mounted in the right wheel track.
Coatings 06 00021 g002
Figure 3. Overview of SPB results (Lveh,cars) 1, 11, 15, 22, 26 and 30 months after construction (with temperature correction) including 95% confidence intervals. The reference speed is 80 km/h.
Coatings 06 00021 g003
Figure 4. Overview of the noise reduction, based on the SPB results with temperature correction, 1, 11, 15, 22, 26 and 30 months after construction compared to the SMA-10 as a reference road surface at the same time interval.
Coatings 06 00021 g004
Figure 5. Increase over time based on SPB results for (a) Test Section 2 and (b) Test Section 6.
Coatings 06 00021 g005
Figure 6. Overview of CPX measurements performed 1, 5, 11, 15, 22, 26 and 34 months after construction with the P1 tire at 80 km/h (with temperature correction).
Coatings 06 00021 g006
Figure 7. Overview of the noise reduction, based on the CPX results (P1 tire) with temperature correction, 1, 5, 11, 15, 22, 26 and 34 months after construction compared to the SMA-10 as a reference road surface at the same time interval.
Coatings 06 00021 g007
Figure 8. Increase over time based on CPX results (P1 tire) for Test Section 5 (DPAC).
Coatings 06 00021 g008
Figure 9. Overview of CPX measurements performed 1, 5, 11, 15, 22, 26 and 34 months after construction with the H1 tire at 80 km/h (with temperature correction).
Coatings 06 00021 g009
Figure 10. Overview of the noise reduction, based on the CPX results (H1 tire) with temperature correction.
Coatings 06 00021 g010
Figure 11. Increase over time based on CPX results (H1 tire) for Test Section 1 (SMA-10).
Coatings 06 00021 g011
Figure 12. CPX sound pressure level reduction (with temperature correction) of all test sections compared to reference Test Section 1 with the same age, for P1 and H1 tires, (a) one month and (b) thirty-four months after construction.
Coatings 06 00021 g012
Figure 13. CPX third octave band spectra (P1) one and 34 months after construction: (a) SMA-10; (b) DPAC; (c) Test Section 2; and (d) Test Section 6.
Coatings 06 00021 g013aCoatings 06 00021 g013b
Figure 14. Overview of all texture spectra two months after construction.
Coatings 06 00021 g014
Figure 15. Overview of all texture spectra thirty months after construction.
Coatings 06 00021 g015
Figure 16. Change in texture spectra over a period of 30 months for Test Section 6.
Coatings 06 00021 g016
Figure 17. Change in texture spectra over a period of 30 months for Test Section 2.
Coatings 06 00021 g017
Figure 18. Change in texture spectra over a period of 30 months for Test Section 5 (DPAC).
Coatings 06 00021 g018
Figure 19. Change in texture spectra over a period of 30 months for Test Section 8 (25-mm thickness).
Coatings 06 00021 g019
Figure 20. Change in texture spectra over a period of 30 months for Test Section 9 (30-mm thickness).
Coatings 06 00021 g020
Table 1. Mixture properties.
PropertyMax. Aggregate Size (mm)Type of TALVoids Percentage (%)
SMA-10107
Test Section 24Porous-type25
Test Section 34Porous-type25
Test Section 46.3SMA-like11
DPAC top layer6.323
DPAC bottom layer1421
Test Section 66.3SMA-like15
Test Section 76.3SMA-like11
Test Sections 8 and 96.3SMA-like11
Test Section 108SMA-like14
Table 2. SPB measurement equipment.
MeasurementAWVBRRC
Vehicle speedGatsometer type 24Kustom Signals KR10SP
Sound pressure levelMCP 211 ½″B & K 4189 ½″
Table 3. Average noise increase per month and per year calculated from the SPB results.
Test SectionLinear Regression LineCorrelation Coefficient R²Increase per Month (dB)Increase per Year (dB)
1y = 0.038x + 73.230.350.040.45
2y = 0.141x + 69.040.640.141.70
3y = 0.036x + 67.440.100.040.43
4y = 0.080x + 71.990.430.080.96
5y = 0.106x + 67.280.550.111.27
6y = 0.020x + 71.130.290.020.24
7y = 0.101x + 72.130.910.101.21
8y = 0.047x + 73.710.230.050.56
9y = 0.028x + 76.280.060.030.33
10y = 0.061x + 73.640.490.060.73
Table 4. Average noise increase per month and per year calculated from the CPX results (P1 tire).
Test SectionLinear Regression LineCorrelation Coefficient R²Increase per Month (dB)Increase per Year (dB)
1y = −0.008x + 98.280.17−0.01−0.10
2y = 0.199x + 91.200.950.202.39
3y = 0.112x + 92.270.860.111.34
4y = 0.114x + 92.250.820.111.37
5y = 0.204x + 91.240.950.202.45
6y = 0.122x + 92.290.860.121.46
7y = 0.109x + 93.460.920.111.31
8y = 0.094x + 94.370.930.101.13
9y = 0.083x + 94.930.930.081.00
10y = 0.052x + 97.100.790.050.62
Table 5. Average noise increase per month and per year calculated from the CPX results (H1 tire).
Test SectionLinear Regression LineCorrelation Coefficient R²Increase per Month (dB)Increase per Year (dB)
1y = 0.048x + 98.390.790.050.58
2y = 0.129x + 94.900.900.131.55
3y = 0.108x + 95.200.880.111.30
4y = 0.112x + 95.400.890.111.34
5y = 0.171x + 92.880.960.172.05
6y = 0.086x + 93.670.850.091.03
7y = 0.111x + 94.670.970.111.33
8y = 0.127x + 94.970.950.131.52
9y = 0.105x + 95.760.950.111.26
10y = 0.108x + 96.670.940.111.30

