1. Introduction
It is, nowadays, well established that binary lipid mixtures consisting of lipids with melting temperatures
Tm, respectively, higher and lower than room temperature tend to undergo a phase separation, called demixing. Typically, gel phase microdomains enriched in the high-
Tm component are surrounded by a liquid-crystalline phase enriched in the low-
Tm component [
1,
2]. The gel phase is anisotropic, tightly packed, and has limited lateral mobility and axial rotation of the acyl chains. Conversely, the liquid-crystalline phase is isotropic, loosely packed and has a high degree of lateral mobility and axial rotation. Addition of cholesterol (Chol) to these binary mixtures has a disordering effect on the gel phase and an ordering effect on the liquid-crystalline phase. More precisely, in the liquid-crystalline phase cholesterol decreases axial rotation of acyl chains and, at concentrations above 30 mol%, it also decreases lateral diffusion. Conversely, Chol increases lateral diffusion and axial rotation in the gel phase microdomains, causing them to become isotropic [
3]. This is revealed by a morphological investigation of these lipid mixtures by two-photon excitation fluorescence microscopy [
4]. Thus, gel phase microdomains have irregular shapes due to their anisotropic structure. Conversely, the microdomains in the presence of Chol concentrations higher than about 6 mol% have a roundish shape, because they are isotropic like the surrounding liquid-crystalline phase. In this case, the line tension (the energy per unit length of the edge) associated with the edge of the two demixing phases tends to a minimum by optimizing the area-to-perimeter ratio. In other words, Chol causes the microdomains to pass from the gel phase to the so-called “liquid ordered” (l
o) phase. This phase is regarded as “liquid” thanks to its sufficient lateral diffusion, and “ordered” because it is more tightly packed than the liquid-crystalline phase, due to the still modest axial rotation of its acyl chains [
3]. In contraposition with the l
o phase, the liquid-crystalline phase is often referred to as the “liquid disordered” (l
d) phase. Similarly, the gel phase is referred to as the solid ordered (s
o) phase. L
o microdomains, commonly referred to as lipid rafts, are thought to play a role in membrane organization, acting as platforms for the preferential sorting of proteins that interact with each other to carry out cellular functions, such as signal transduction. Coexistance of l
d and l
o phases has been observed and investigated on ternary biomimetic membranes composed of a saturated lipid, such as sphingomyelin (SM), an unsaturated lipid, such as dioleoylphosphatidylcholine (DOPC), and Chol.
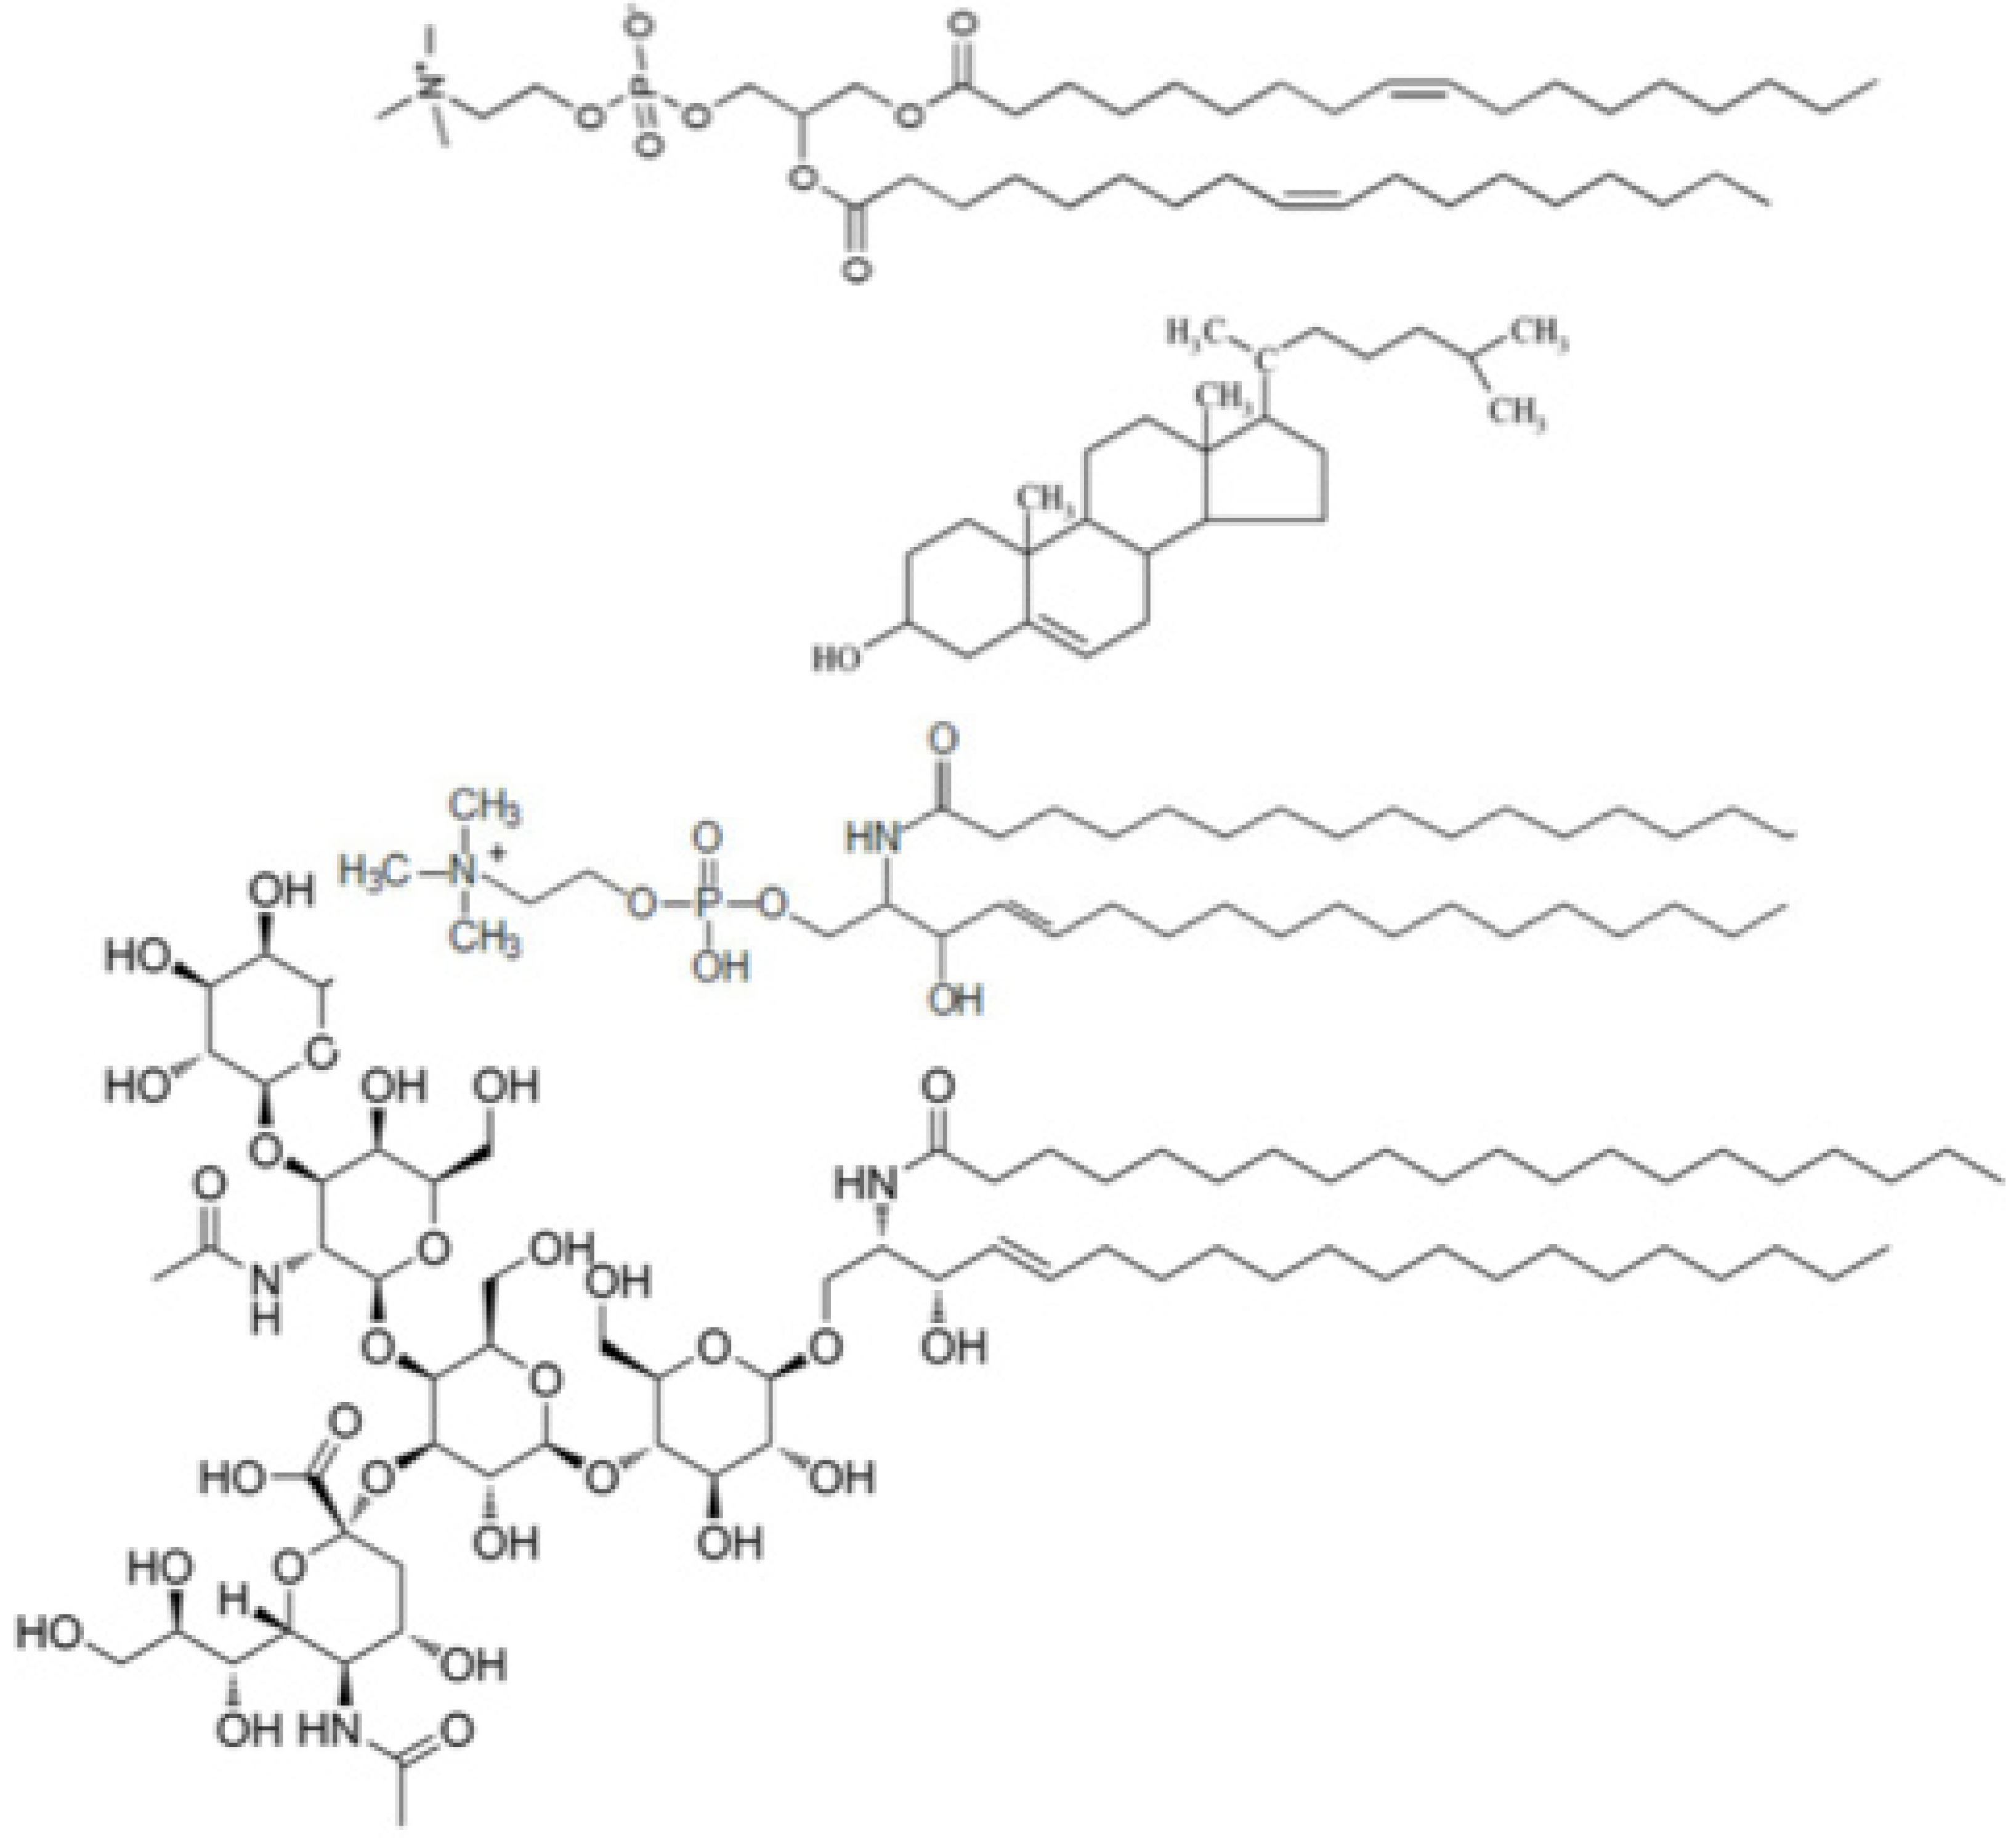
Glycosphingolipids have been shown to exert a strong influence on phase separation in biomembranes, due to their long saturated acyl chains and bulky oligosaccharide hydrophilic headgroups [
5]. These molecules are thought to localize in lipid rafts. The monosialoganglioside GM1 is an extensively investigated glycosphingolipid, which consists of a ceramide residue bound to a sugar chain containing an
n-acetylneuraminic acid residue (see
Chart 1). The sialic acid residue contains a carboxyl group that imparts to the polar head of GM1 a negative charge at pH 7. GM1 is present in the outer leaflet of plasma membranes of neurons, where it regulates axonal determination and growth, signaling and repair. It can be easily incorporated in biomimetic membranes and acts as a specific receptor of the cholera toxin (ChTo) [
6,
7]. This is an enterotoxin of
Vibrio cholerae, composed of two subunits A and B of stoichiometry AB
5, which binds to GM1 via the B subunits [
8,
9].
SM/DOPC/Chol systems in the presence of GM1 have been investigated by fluorescence microscopy on giant unilamellar vesicles, as well as by several surface sensitive techniques, such as epifluorescence imaging, atomic force microscopy (AFM), mean-field scanning optical microscopy, synchrotron X-ray reflectivity and secondary ion mass spectroscopy (SIMS). Fluorescence microscopy on giant unilamellar vesicles is a technique that may unequivocally discriminate l
o from s
o microdomains in a l
d matrix, by the use of appropriate fluorophores, such as laurdan [
10]. Atomic force microscopy (AFM) at mica-supported lipid bilayers may detect changes in bilayer thickness and domain size [
11,
12,
13,
14]. X-ray reflectivity may provide useful information in terms of acyl chain and headgroup electron densities and bilayer thicknesses [
15]. SIMS may provide distinct images of all components of a lipid mixture via isotopic labeling of each of them [
16]. As a rule, measurements carried out by the above techniques point to a tendency of GM1 to be localized in the l
o phase of ternary DOPC/SM/Chol mixtures [
10,
12,
14], due to repulsion between saturated and unsaturated acyl chains. Hydrogen bond formation between GM1 and SM, which are both hydrogen bond donors and acceptors, and of GM1 with Chol, which is a hydrogen bond donor, may also contribute to favor this tendency. However, AFM measurements at GM1 concentrations as high as 5 mol% also show a significant number of high microdomains, ascribable to the long GM1 molecules, in the DOPC-rich l
d matrix [
12]. All surface sensitive techniques use lipid mono- or bilayers deposited on smooth supports, such as mica [
11,
12,
14], silicon wafers [
15], or silanized glass [
10]. Lipid domains in the above solid supports may lack the reversible phase behavior characteristic of fluid membranes, and the domains can be pinned to the supports [
15,
17,
18].
Chart 1.
Primary structures of dioleoylphosphatidylcholine, cholesterol, palmitoylsphingomyelin and GM1 (proceeding downwards).
Chart 1.
Primary structures of dioleoylphosphatidylcholine, cholesterol, palmitoylsphingomyelin and GM1 (proceeding downwards).
An advantage of mercury-supported lipid monolayers over solid-supported ones is represented by their fluidity and by a lateral mobility of the lipid molecules comparable to that of biomembranes, thanks to the liquid state of mercury [
19]. Lipid molecules are readily self-assembled on the perfectly smooth mercury surface, with the hydrocarbon tails directed toward the metal and the polar heads turned toward the aqueous solution. Monolayers of lipid mixtures self-assembled on mercury form spontaneously gel-phase and l
o microdomains, thanks to the fluidity imparted to these monolayers by the liquid metal support [
19]. In particular, monolayers of a binary mixture of a lipid component of high transition temperature
Tm, such as palmitoylsphingomyelin (PSM), and of a low-
Tm component, such as DOPC, form gel phase microdomains; these are typically enriched in the high-
Tm component, and are surrounded by a l
d phase enriched in the low-
Tm component [
1,
2]. The capacitance
Cht of the hydrocarbon tail region was found to increase in parallel with the amount of the gel phase in the mixture [
19]. This behavior can be explained by assuming that
Cht is approximately proportional to the total perimeter of the edge of the gel phase microdomains. Following an AC signal, inorganic ions can move more easily back and forth along the mismatch between anisotropic gel phase microdomains and the surrounding isotropic l
d matrix, causing an increase in differential capacitance. Addition of Chol to binary mixtures of a low-
Tm and a high-
Tm component removes this mismatch, converting gel-phase microdomains into lipid rafts and decreasing the differential capacitance accordingly [
19]. We, therefore, found it interesting to investigate the effect of the addition of 20 mol% GM1 to mercury-supported monolayers consisting either of pure DOPC or of a raft-forming lipid mixture, by using electrochemical impedance spectroscopy (EIS).
3. Results
Lipid monolayers consisting either of pure DOPC or of a DOPC/Chol/PSM mixture of (59:26:15) mol% composition, typical of mammalian plasma membranes, were examined by EIS, both before and after addition of 20 mol% GM1 to both these monolayers. In what follows, the DOPC/Chol/PSM (59:26:15) mixture will be denoted by DCP, for simplicity. According to the phase diagram of the (palmitoyloleoylphosphatidylcholine:POPC)/Chol/PSM lipid mixture estimated by de Almeida
et al. [
27,
28], the (59:26:15) mol% composition adopted herein falls in the middle of the l
o + l
d phase coexistence region. This result can be safely extended to the DOPC/Chol/PSM (59:26:15) mixture, since the two low-
Tm components DOPC and POPC are expected to exhibit practically the same behavior. The DOPC/Chol/PSM/GM1 mixture of (47:21:12:20) mol% composition will be briefly denoted by DCP/GM1. Measurements were carried at −0.55 V. The choice of this potential was dictated by its falling in the middle of the range of stability of Hg-supported lipid monolayers. Thus, the maximum value of the film pressure of a Hg-supported DOPC monolayer in 0.1 M KCl falls at about −0.48 V, which is equivalent to the potential of maximum stability of the lipid monolayer relative to its displacement by water [
24].
The impedance spectra are displayed on a ω
Z′
versus −ω
Z″ plot, where ω is the angular frequency and
Z′,
Z″ are the in-phase and quadrature components of the electrochemical impedance. To interpret impedance spectra, it is necessary to compare them with the electrical response of an equivalent circuit simulating the system under investigation. In this respect, a metal-supported self-assembled monolayer (SAM) can be conveniently regarded as consisting of a series of slabs with different dielectric properties. In an equivalent circuit, a dielectric slab can be represented as a resistance and a capacitance in parallel, namely an
RC mesh. Therefore, an impedance spectrum can be fitted by an equivalent circuit consisting of a series of
RC meshes. In a ω
Z′
versus −ω
Z″ plot, which will be briefly referred to as a M plot (where M stands for modulus), a single
RC mesh yields a semicircle of diameter 1/
C; the angular frequency at the maximum of the semicircle equals the reciprocal of the time constant,
RC, of the mesh [
19]. If the time constants of the different dielectric slabs are too close, the corresponding semicircles may overlap to an appreciable extent, making their resolution relatively inaccurate. Since the frequency increases along the positive direction of the −ω
Z″ axis, the partially overlapping semicircles are aligned in the order of decreasing time constant, when proceeding in this direction. Thus, for a series of
RC meshes, the last semicircle on the right hand side of an M plot is characterized by the lowest time constant.
The number of RC meshes simulating the different slabs of a biomimetic membrane is not uniquely defined. One can try to increase their number as long as it is reasonably possible to separate their contributions, which tend to overlap the more the higher this number is. With SAMs of DOPC, DCP and DOPC/GM1, the minimum number of RC meshes simulating the impedance spectrum, with fitting errors less than 10%, was found to be four; a further increase in this number was found not to improve the fitting. The four RC meshes are considered to simulate (i) the hydrocarbon tail region, (ii) the polar head region, (iii) the diffuse layer, and (iv) the aqueous solution bathing the lipid monolayer. Their time constants, which decrease in the above order, will be denoted by RhtCht, RphCph, RdlCdl and RΩCΩ. In particular, the hydrocarbon tail region has the highest resistance, Rht.
In an aqueous solution of 0.1 M KCl, the capacitance
CΩ and resistance
RΩ of the aqueous solution assume values of about 35 nF·cm
−2 and 3.5 Ω·cm
2, respectively, and are clearly independent of the particular lipid SAM. These two values yield the lowest time constant,
CΩRΩ, which, as such, gives rise to the very large semicircle on the right-hand side of the M plot. In practice, over the frequency range covered by the EIS instrumentation, only a small portion of this very large semicircle, 1/
CΩ in diameter, is visible in the M plot. The diffuse layer has also a low time constant, having a resistance,
Rdl, of the order of 1 Ω·cm
2 but a much higher capacitance,
Cdl, of about 70 µF·cm
−2. The latter value is close to the capacitance expressed by the Gouy-Chapman theory for the aqueous solution of a 1,1-valent electrolyte in contact with an uncharged surface. This result is expected, since the DOPC is neutral and the charge density on the surface of the mercury electrode over the potential range of stability of a lipid SAM ranges from −0.2 to −1.3 µC cm
−2 [
24]. The accuracy in the estimate of
Rdl and
Cdl is low, because the
RC mesh ascribable to the diffuse layer straddles the maximum frequency covered by the EIS instrumentation. Thus, the difference between the fit that includes the
RdlCdl mesh and that which neglects it can only be appreciated over the frequency range from 10
4 and 10
5 Hz and amounts to a maximum of +30% for the DCP/GM1 SAM and of +20% for the DOPC/GM1 SAM. For the other two SAMs it is smaller and comparable with the range of the experimental error.
The M plots for the DOPC, DCP and DOPC/GM1 monolayer are shown in
Figure 1,
Figure 2, and
Figure 3, respectively. In these figures, the calculated contribution to ω
Z′ from each single
RC mesh is plotted against the overall −ω
Z″ quantity. This serves to show how each semicircle is affected by partial overlapping with the neighboring ones. Each contribution is represented by a semicircle that is distorted the more, the higher the overlapping. The contributions to ω
Z′ against −ω
Z″ are represented in blue for the hydrocarbon tails, in red for the polar heads, in brown for the diffuse layer and in green for the aqueous solution. The relatively flat M plot in
Figure 4 for the DCP/GM1 monolayer required a further
RC mesh for the fitting, in addition to the four
RC meshes employed for the other lipid SAMs; its significance will be examined in
Section 4. The
R and
C values for all
RC meshes of the four lipid SAMs are reported in the legends for the corresponding figures; the values for the two
RC meshes ascribable to the hydrocarbon tails and the polar heads of the monolayers of DOPC, DCP, DOPC/GM1 and DCP/GM1 are plotted in
Figure 5, in the above order, to evidence possible trends. The capacitance of the hydrocarbon tails of the DOPC SAM,
Cht = 1.9 µF·cm
−2, is about twice that, between 0.9 and 1 µF·cm
−2, of solvent-free bilayer lipid membranes and in good agreement with the value of 1.80 µF·cm
−2, reported by Nelson [
21].
Addition of 10 nM ChTo B to the aqueous solution bathing the lipid monolayers that incorporate GM1 has a negligible effect on their impedance spectra, even after an incubation time of 1 h.
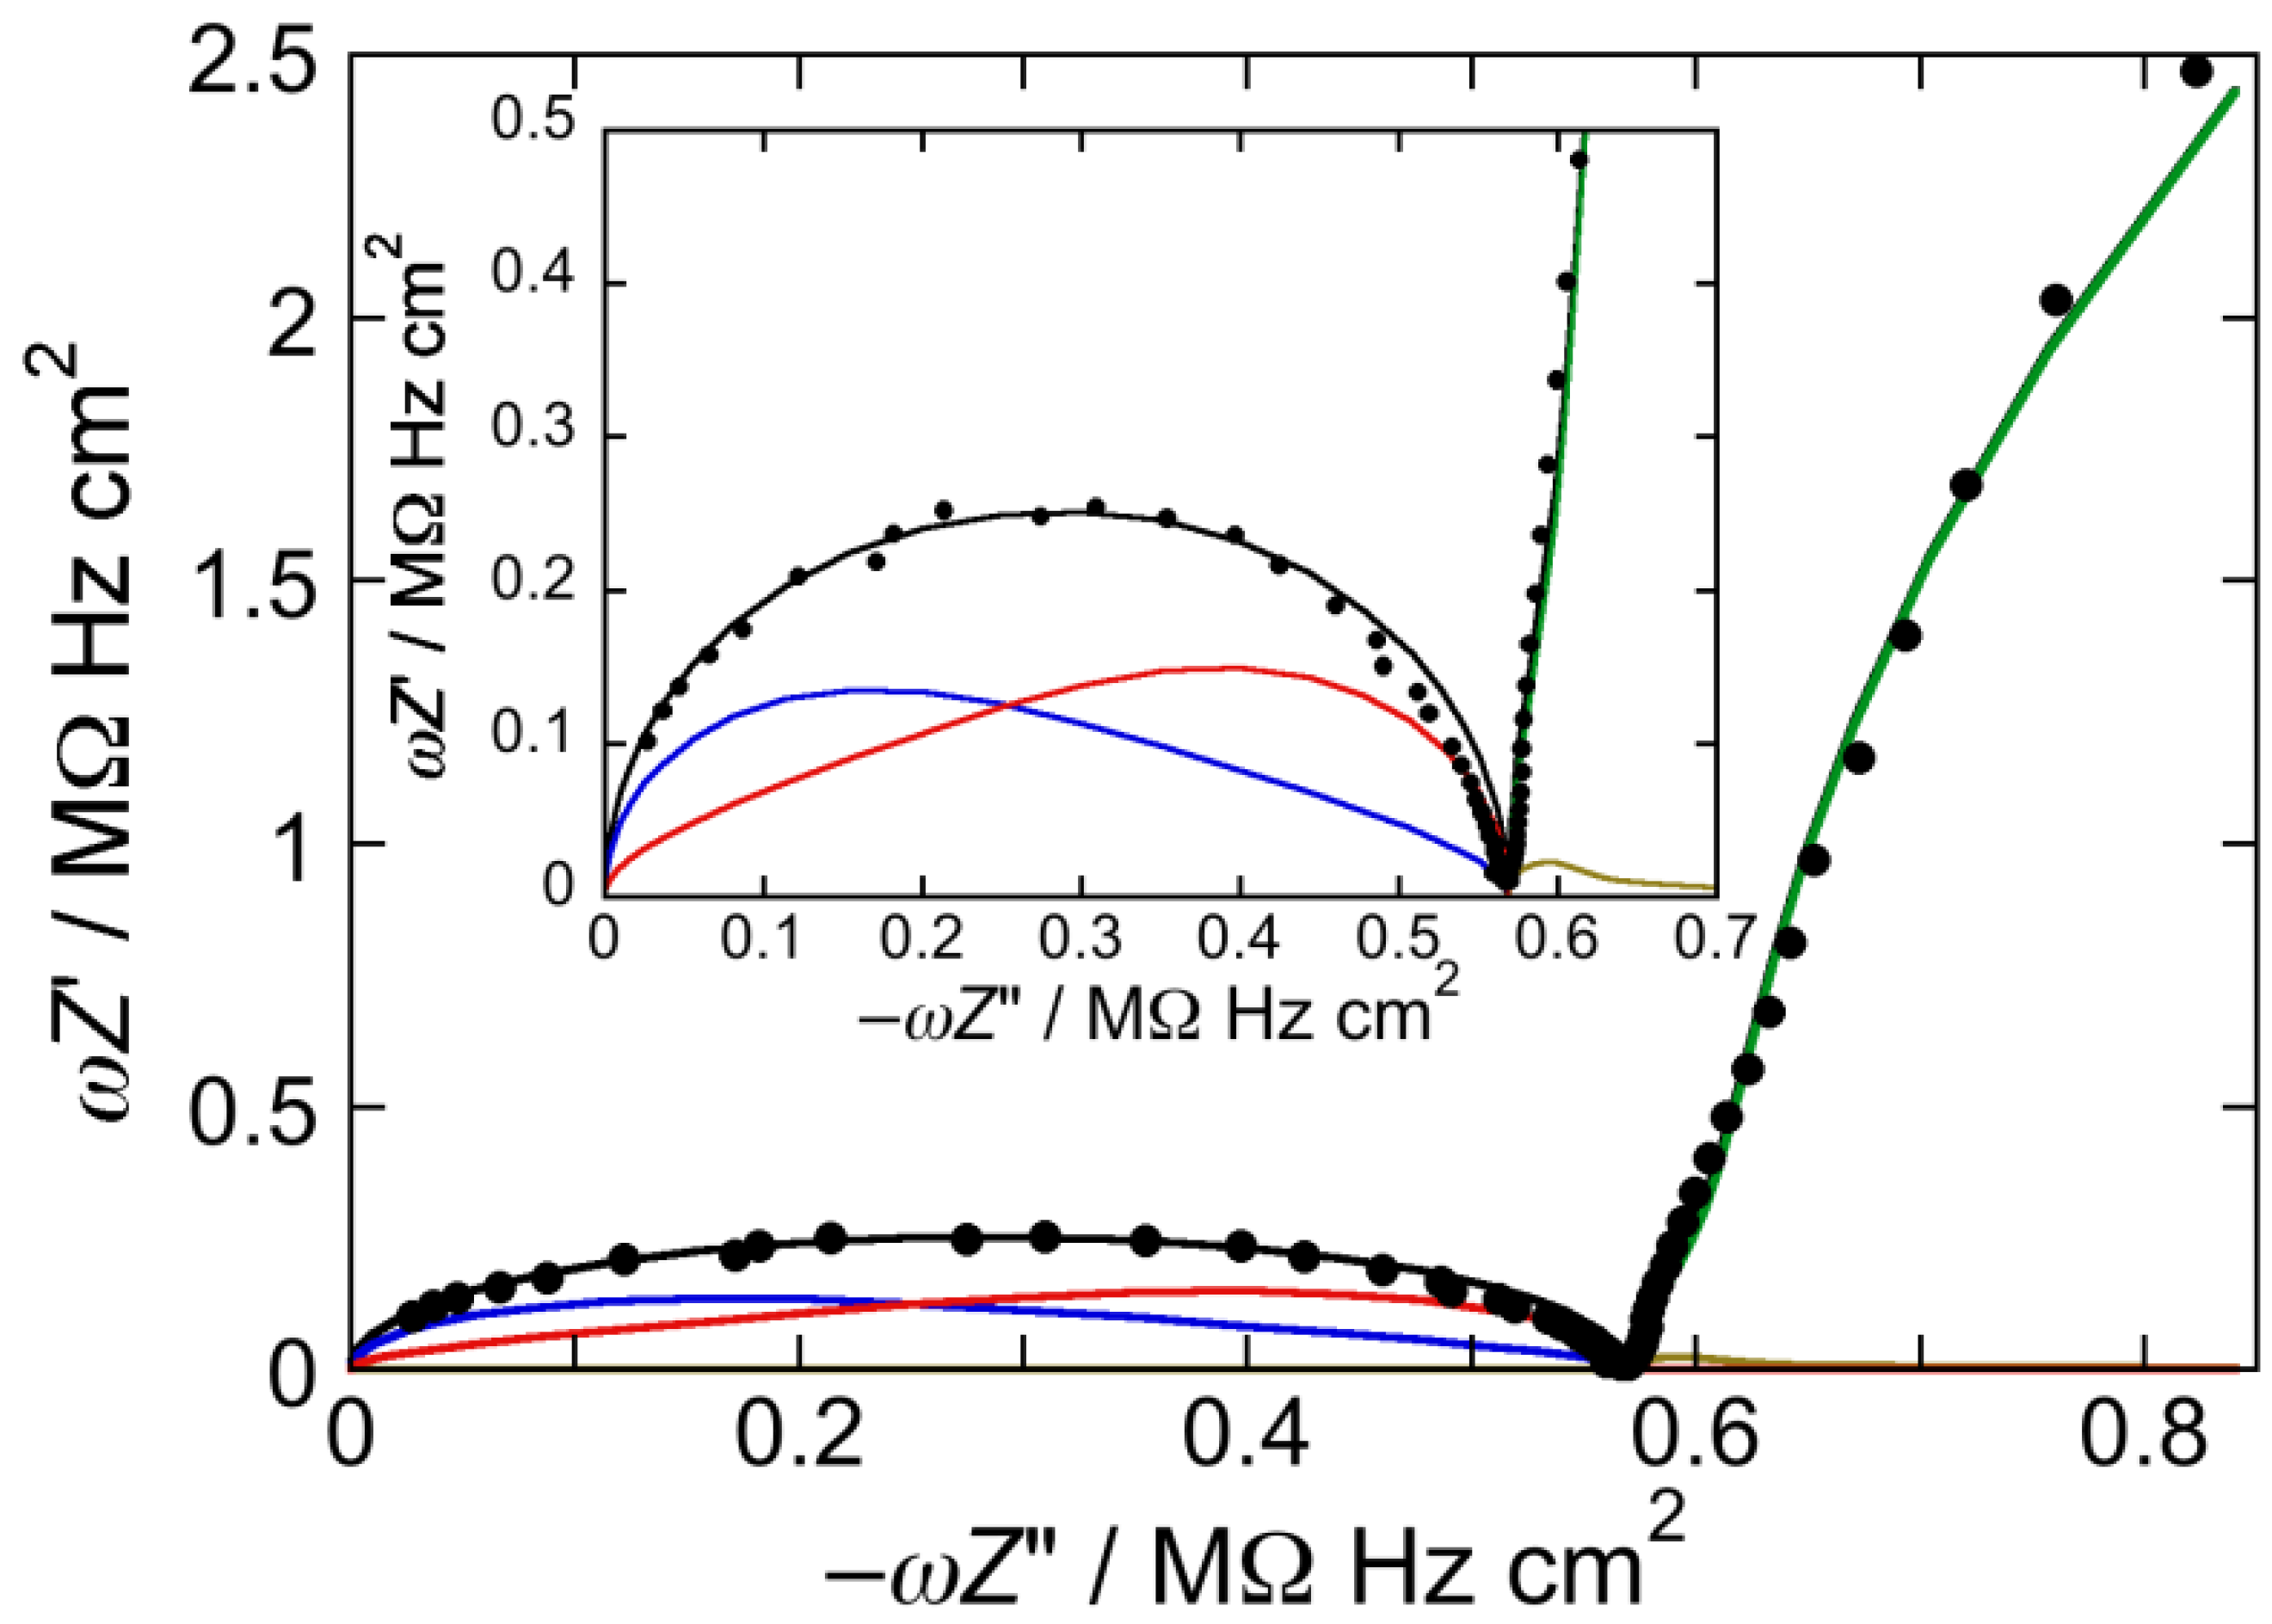
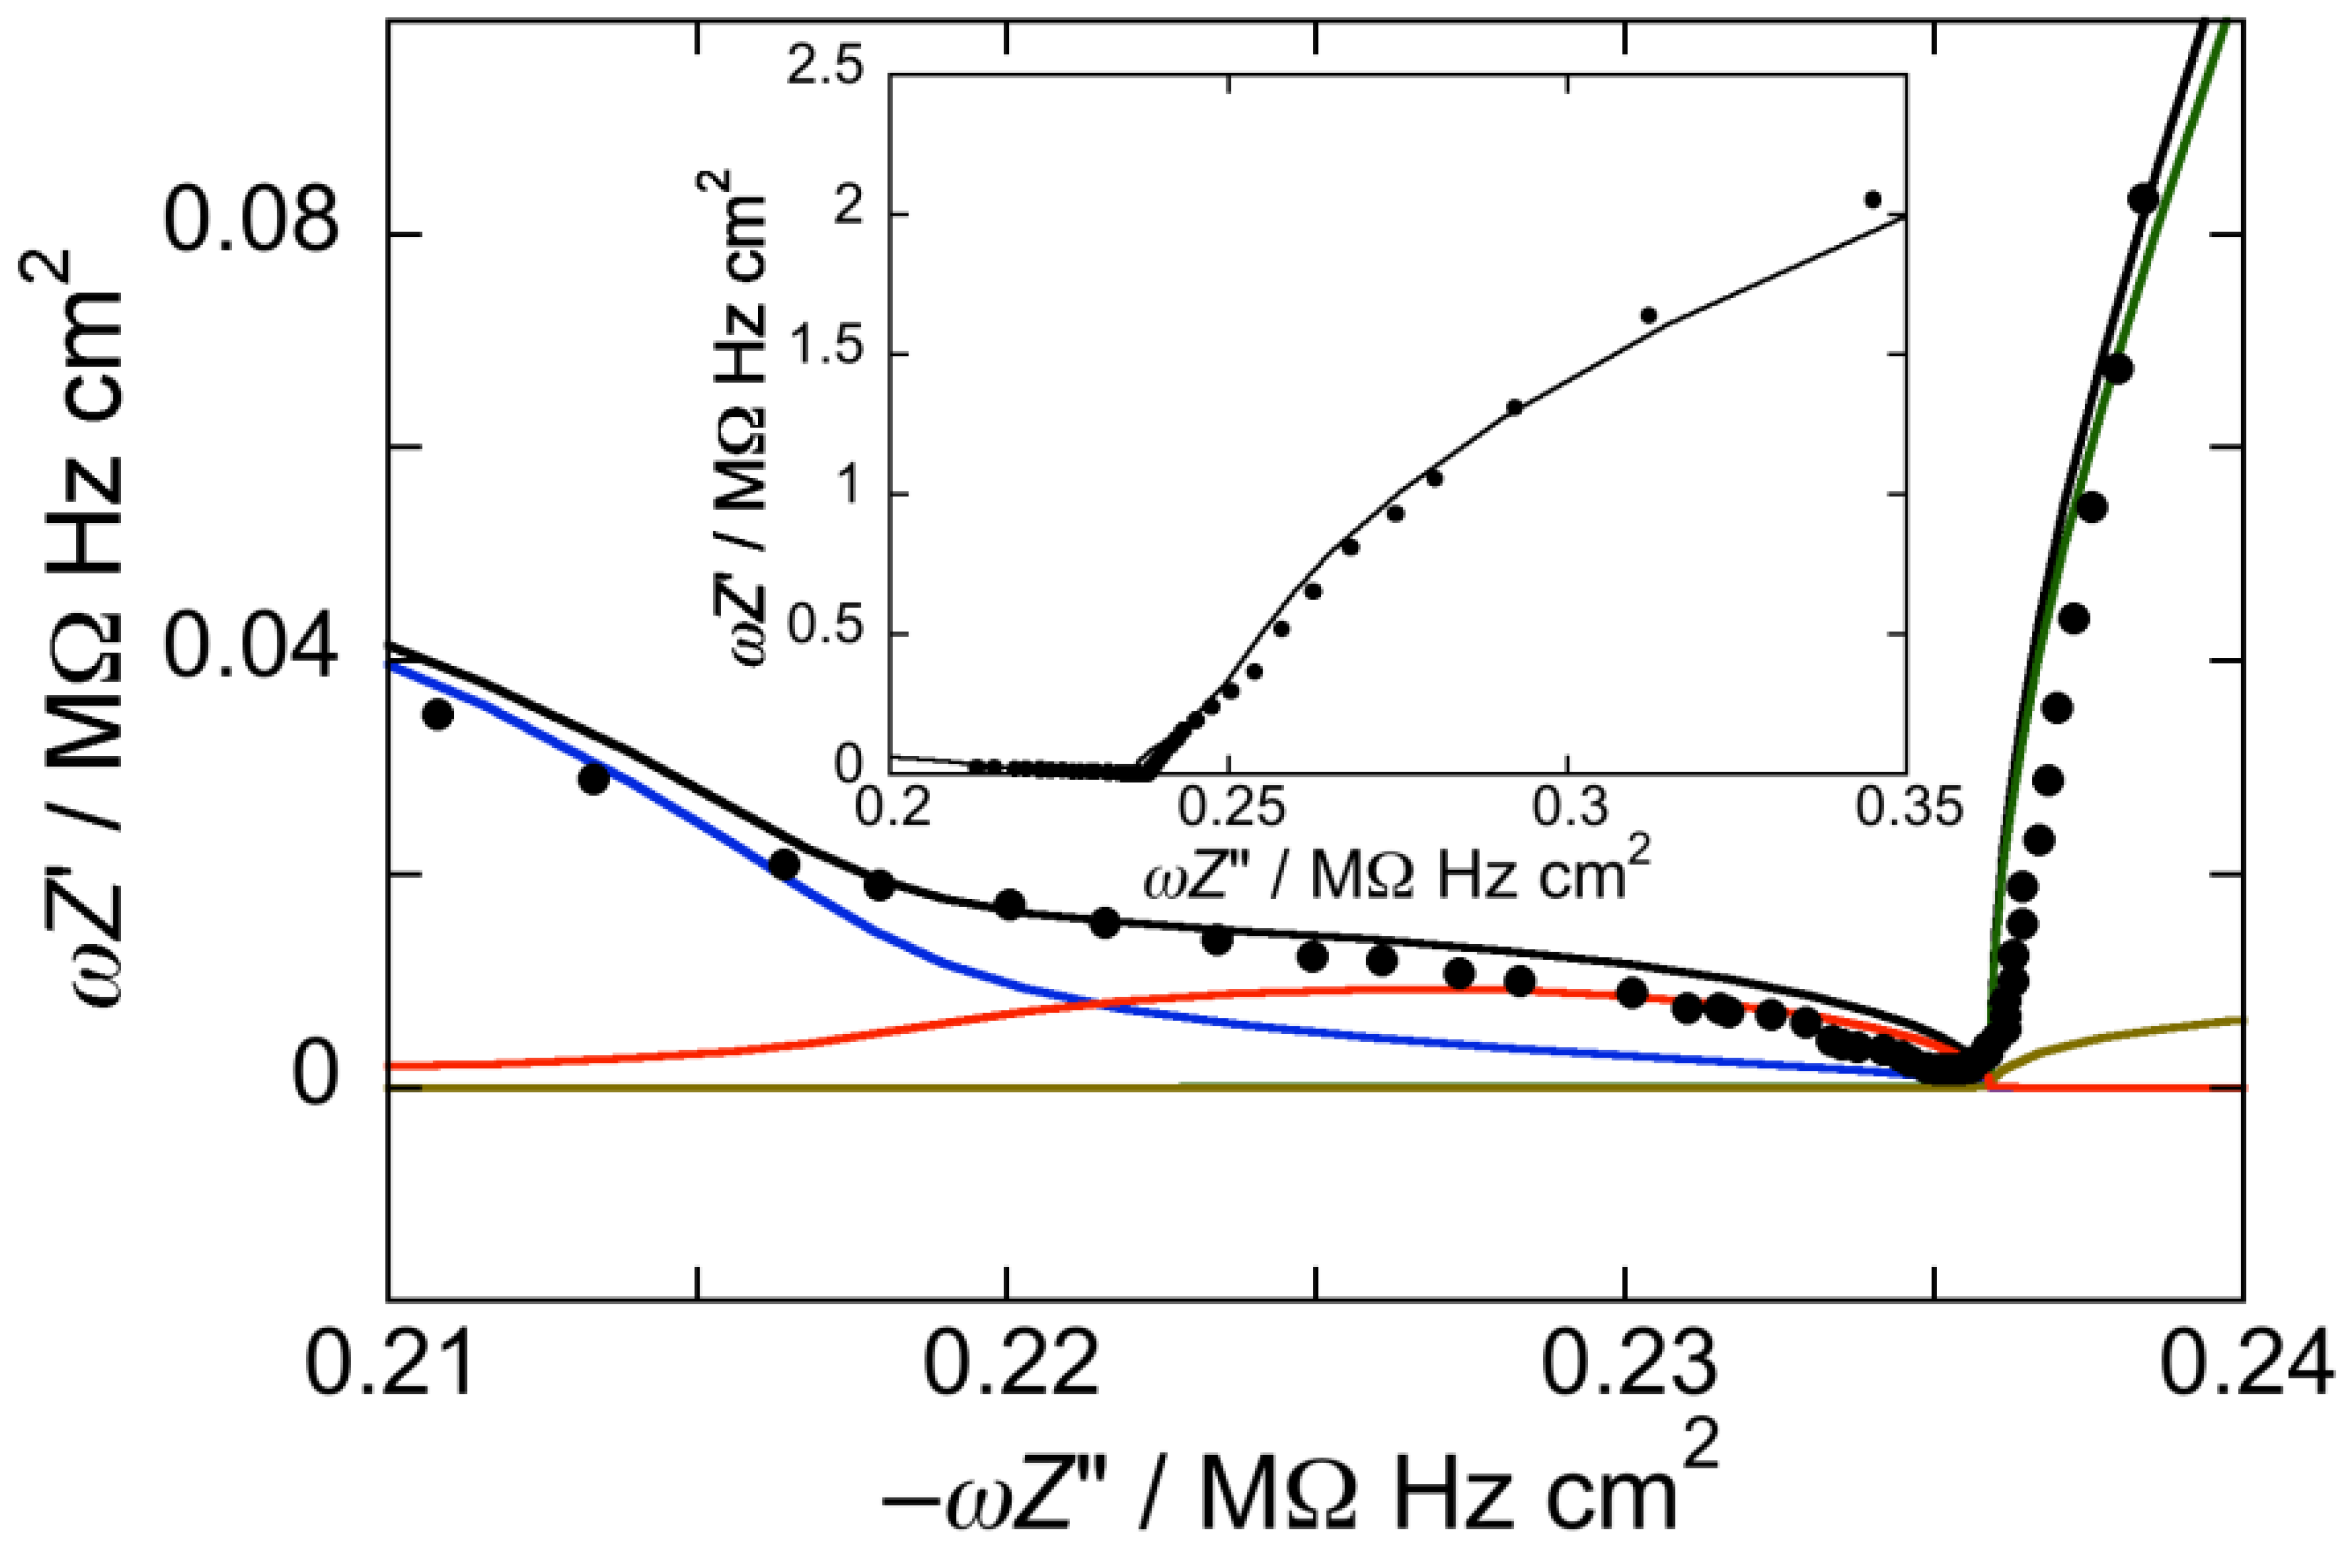
Figure 1.
Plot of ωZ′ against −ωZ″ for a Hg-supported DOPC monolayer in aqueous 0.1 M KCl at −0.550 V. Solid circles are experimental points and the black curve is the best fit to these points by a series of four RC meshes. The contributions to ωZ′ against −ωZ″ are represented in blue for the hydrocarbon tails, in red for the polar heads, in brown for the diffuse layer, and in green for the aqueous solution. Capacitances and resistances of the four RC meshes are: Rht = 3.3 MΩ·cm2, Cht = 1.9 µF·cm−2, Rph = 3.6 kΩ·cm2, Cph = 51 µF·cm−2, Rdl = 1 Ω·cm2, Cdl = 70 µF·cm−2, RΩ = 4.2 Ω·cm2, CΩ = 36 nF·cm−2. The impedance spectrum in the inset covers a broader frequency range encompassing the contribution from the aqueous solution.
4. Discussion
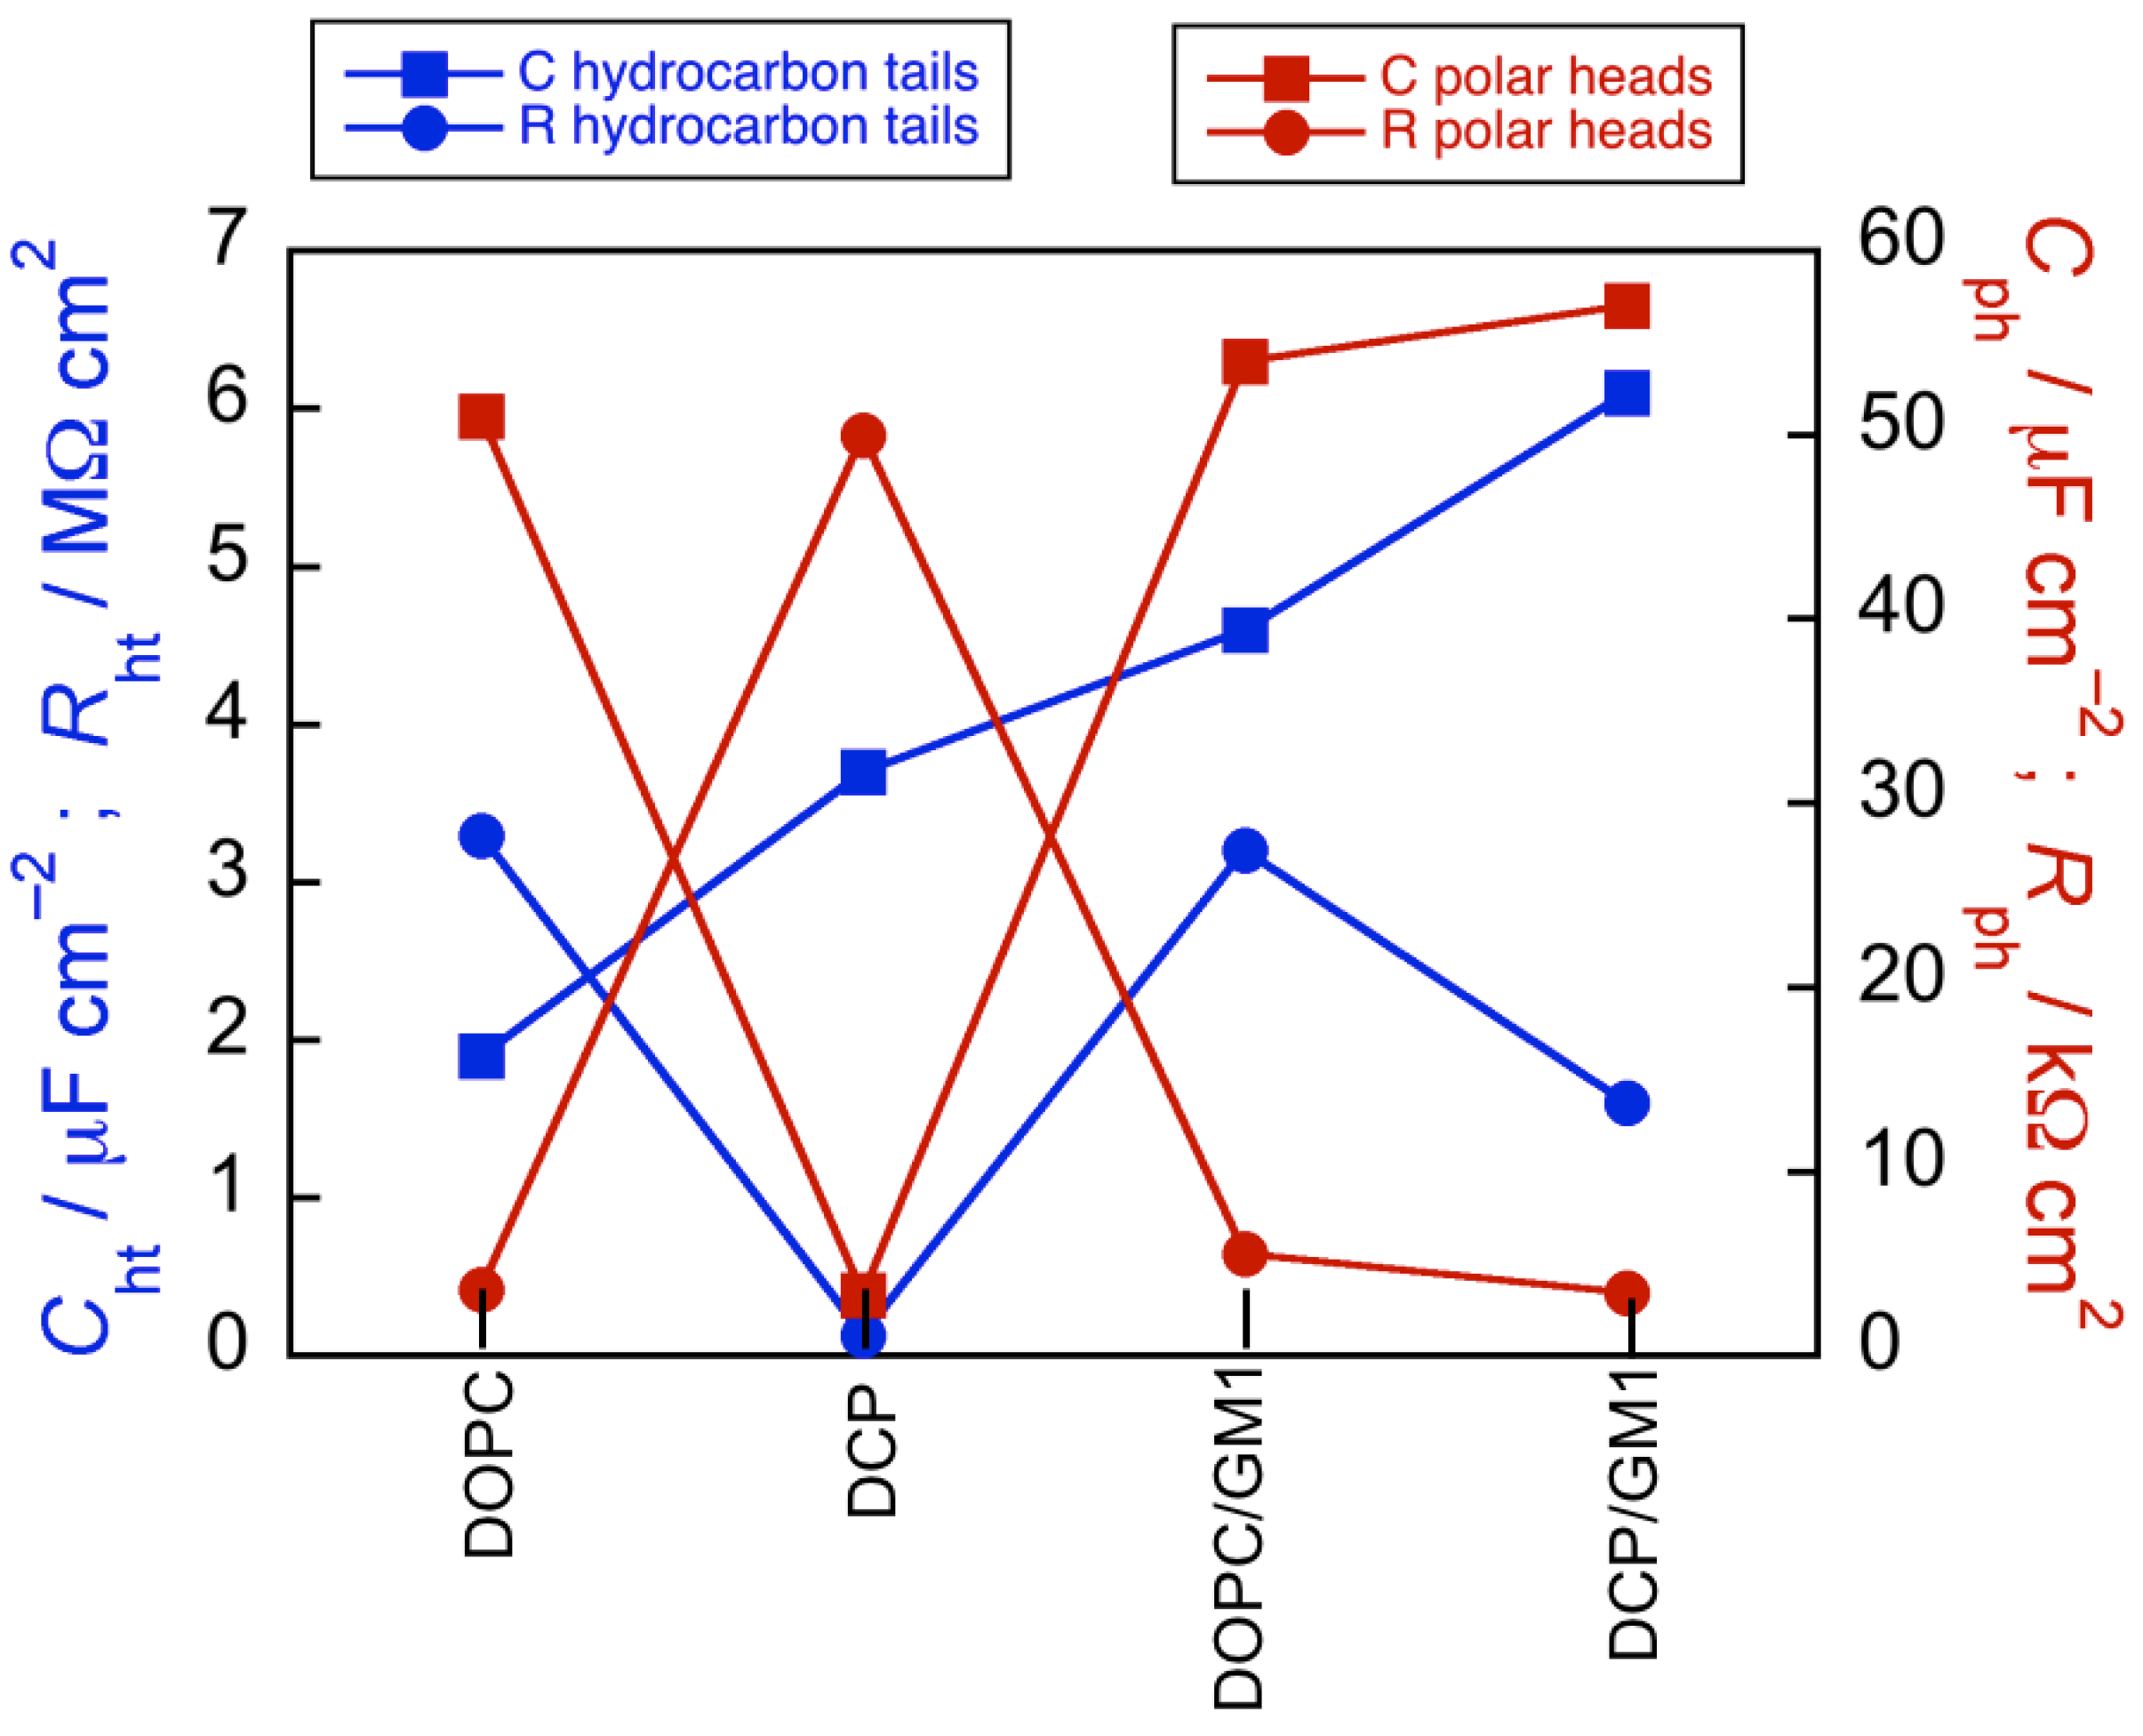
Figure 5 shows the changes in capacitance and resistance of the hydrocarbon tails and polar heads along the DOPC, DCP, DOPC/GM1, DCP/GM1 sequence. The
Cht values increase roughly linearly along this sequence from 1.9 to 6 µF·cm
−2. This behavior may be explained by the gradual increase in the heterogeneity of the mixture of kinked unsaturated and linear saturated hydrocarbon tails decreasing the lipid packing; this facilitates the penetration of small inorganic ions among these tails and an increase in the amount of back and forth movement along them following the AC voltage signal, with a resulting increase in
Cht. The resistance,
Rht, of the hydrocarbon tails ranges between 1.5 and 3.5 MΩ·cm
2 for all lipid SAMs, except for the DCP mixture, whose
Rht value is smaller by more than one order of magnitude. The behavior of the DCP SAM differs notably from that of the other three SAMs even with respect to the polar heads. Thus, the
Cph and
Rph values for the DOPC, DOPC/GM1 and DCP/GM1 SAMs are around 50–55 µF·cm
−2 and 3.5–5.5 kΩ·cm
2, respectively, whereas
Cph for DCP is one order of magnitude smaller and the corresponding
Rph value one order of magnitude higher. In practice, the capacitance of the polar head region of DCP is very close to that of the hydrocarbon tail region.
The low
Cph value and high
Rph value for DCP with respect to those for the other three SAMs is probably to be ascribed to a network of hydrogen bonds of the PSM molecules both between themselves and with Chol molecules; this contributes to stiffening the polar heads. In particular, molecular dynamics simulations of SM/Chol mixtures predict strong hydrogen bonds of the hydroxyl group of Chol with the ceramide functional group and the phosphate group of PSM, whereas SM-SM hydrogen bonds are weak and Chol-Chol ones are hardly observed [
29]. The Chol molecules, with their short, rigid and compact tetracyclic ring structure, span only the distal portion of the lipid monolayer, with their hydroxyl groups forming hydrogen bonds with the PSM polar heads. Thus, on the one hand they create an interstitial space available for ion movement below their small tails, increasing
Cht, and on the other hand they contribute to stiffening the polar head region, decreasing
Cph and increasing
Rph. In practice, in the DCP SAM, the extent of back and forth movement of small inorganic ions along the polar heads matches that along the hydrocarbon tails.
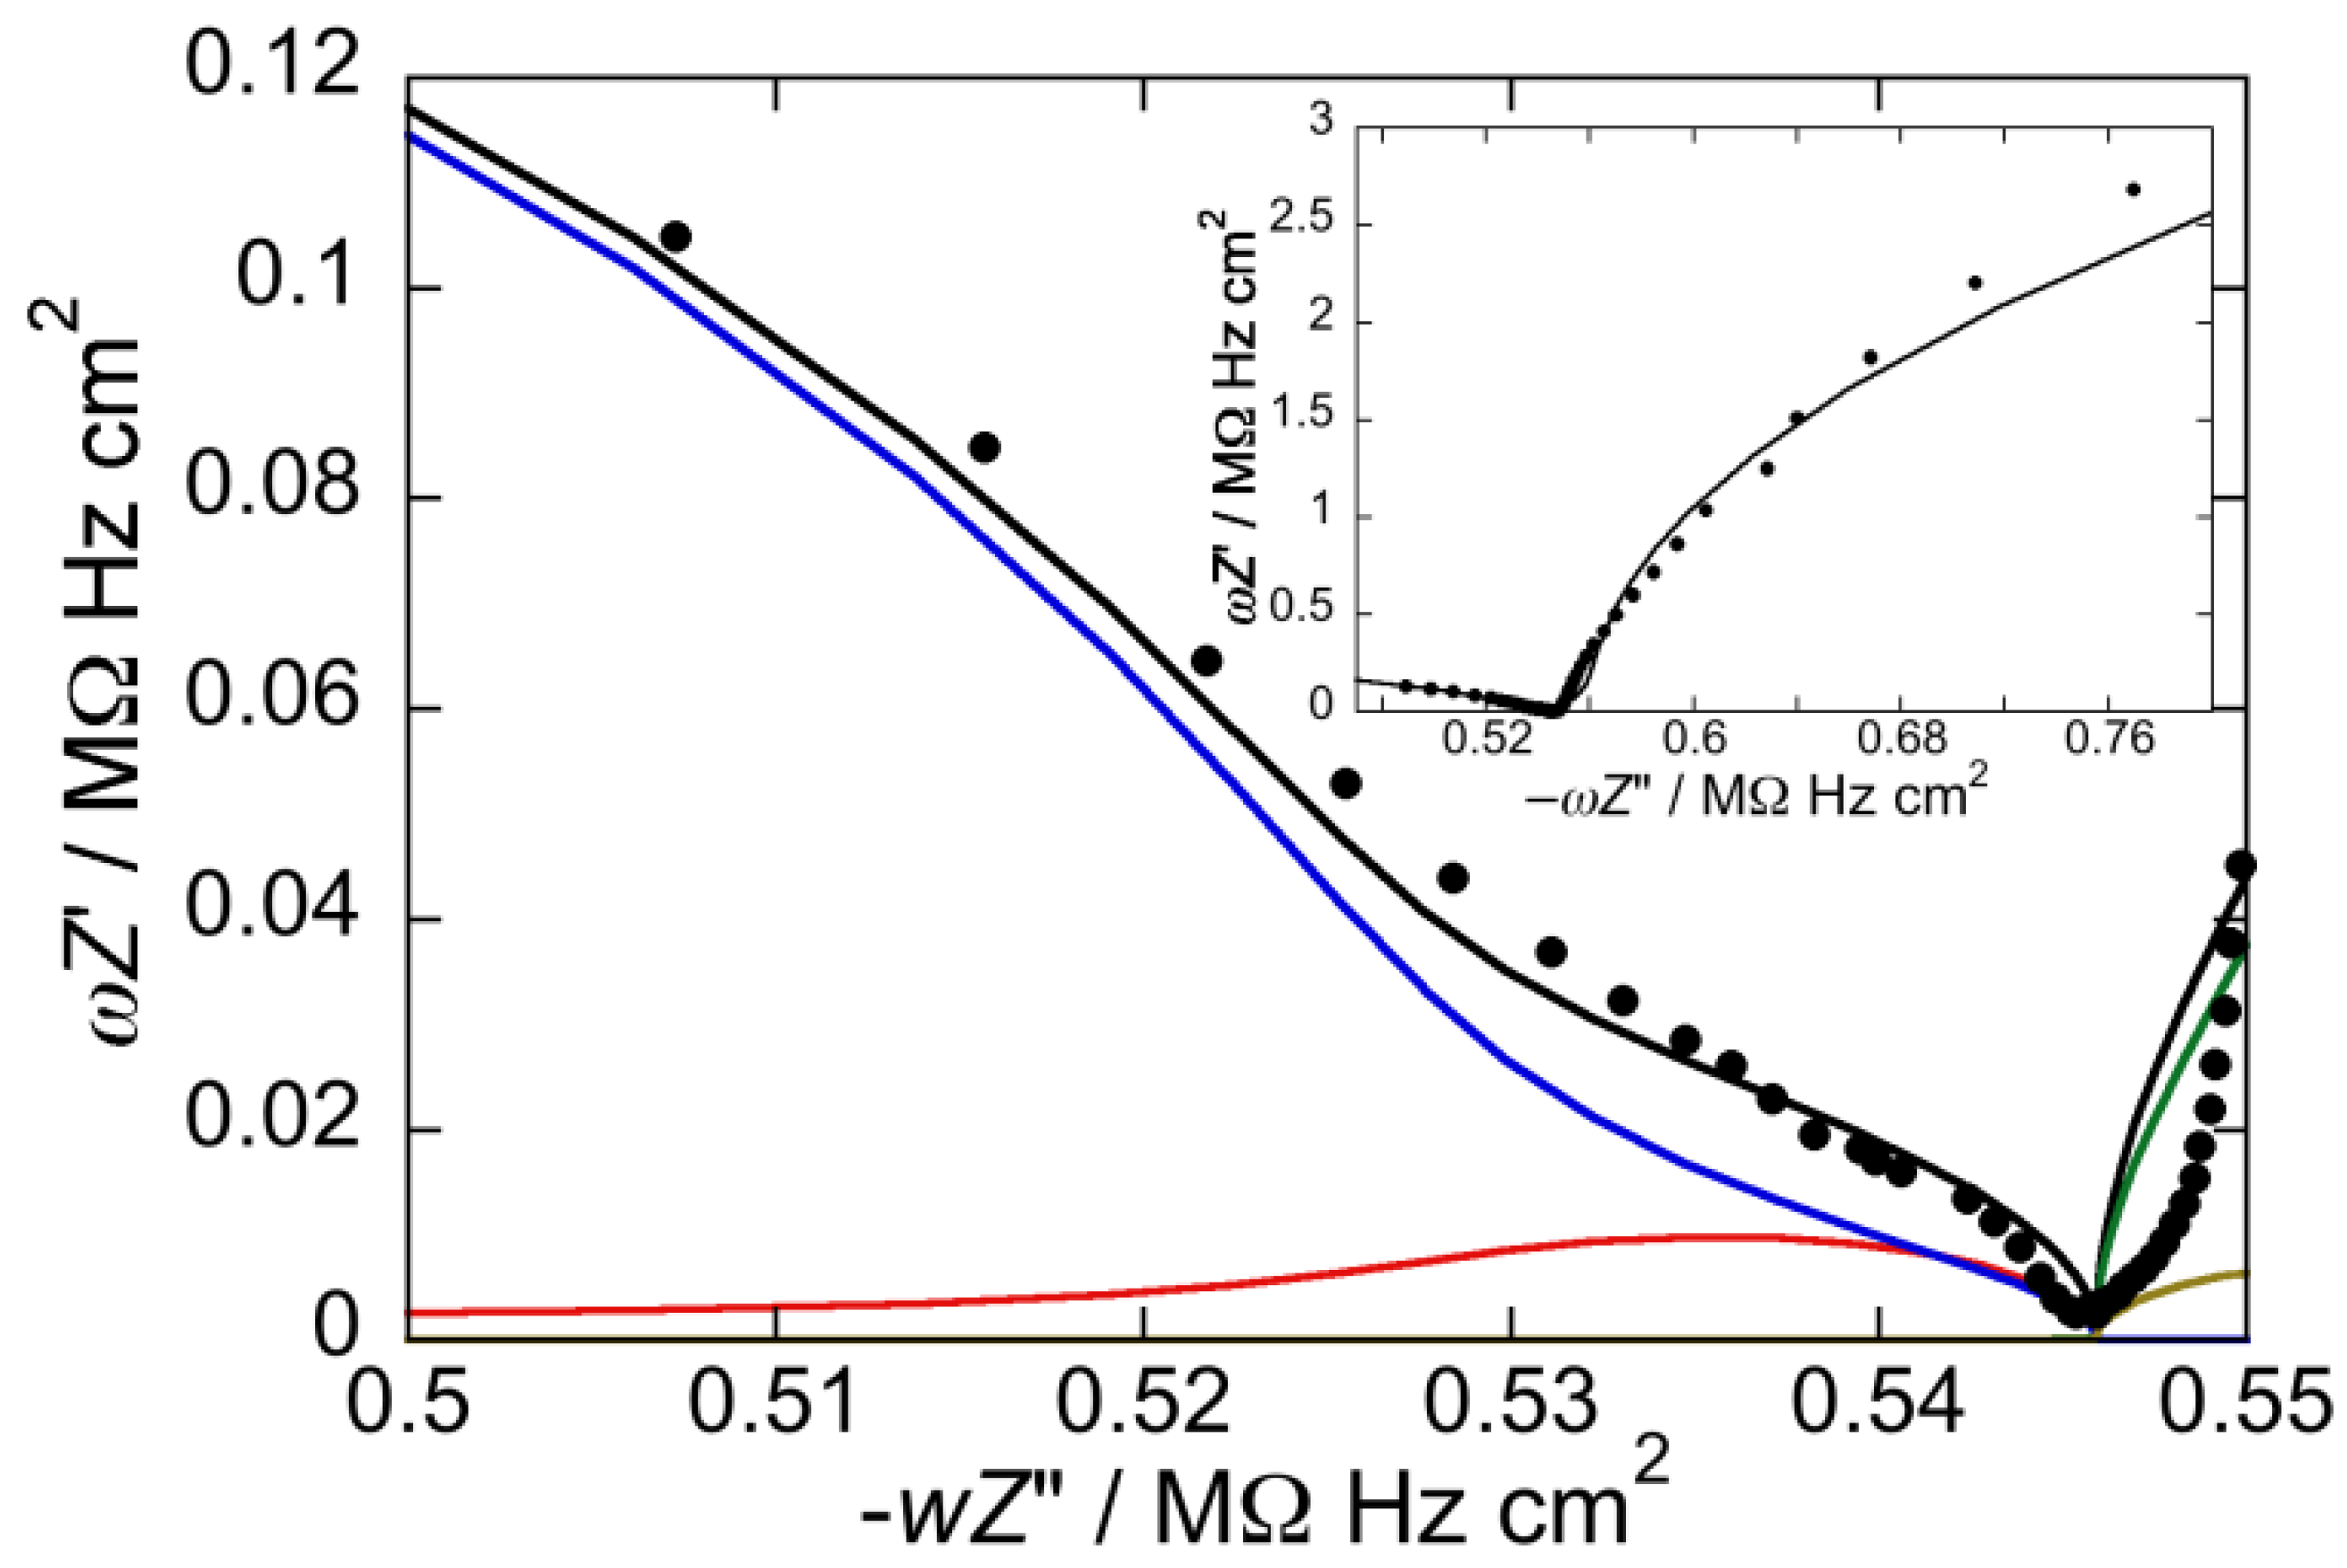
Figure 2.
Plot of ωZ′ against −ωZ″ for a Hg-supported DOPC/Chol/PSM (59:26:15) mol% monolayer in aqueous 0.1 M KCl at −0.550 V. Solid circles are experimental points and the black curve is the best fit to these points by a series of four RC meshes. The contributions to ωZ′ against −ωZ″ are represented in blue for the hydrocarbon tails, in red for the polar heads, in brown for the diffuse layer, and in green for the aqueous solution. Capacitances and resistances of the four RC meshes are: Rht = 0.13 MΩ·cm2, Cht = 3.7 µF·cm−2, Rph = 50 kΩ·cm2, Cph = 3.3 µF·cm−2, Rdl = 0.9 Ω·cm2, Cdl = 50 µF·cm−2, RΩ = 3.8 Ω·cm2, CΩ = 38 nF·cm−2. The impedance spectrum in the inset covers a narrower frequency range.
Figure 3.
Plot of ωZ′ against −ωZ″ for a Hg-supported DOPC/GM1 (80:20) mol% monolayer in aqueous 0.1 M KCl at −0.550 V. Solid circles are experimental points and the black curve is the best fit to these points by a series of four RC meshes. The contributions to ωZ′ against −ωZ″ are represented in blue for the hydrocarbon tails, in red for the polar heads, in brown for the diffuse layer, and in green for the aqueous solution. Capacitances and resistances of the four RC meshes are: Rht = 3.2 MΩ·cm2, Cht = 4.6 µF·cm−2, Rph = 5.5 kΩ·cm2, Cph = 54 µF·cm−2, Rdl = 0.3 Ω·cm2, Cdl = 70 µF·cm−2, RΩ = 3.2 Ω·cm2, CΩ = 25 nF·cm−2. The impedance spectrum in the inset covers a broader frequency range encompassing the contribution from the aqueous solution.
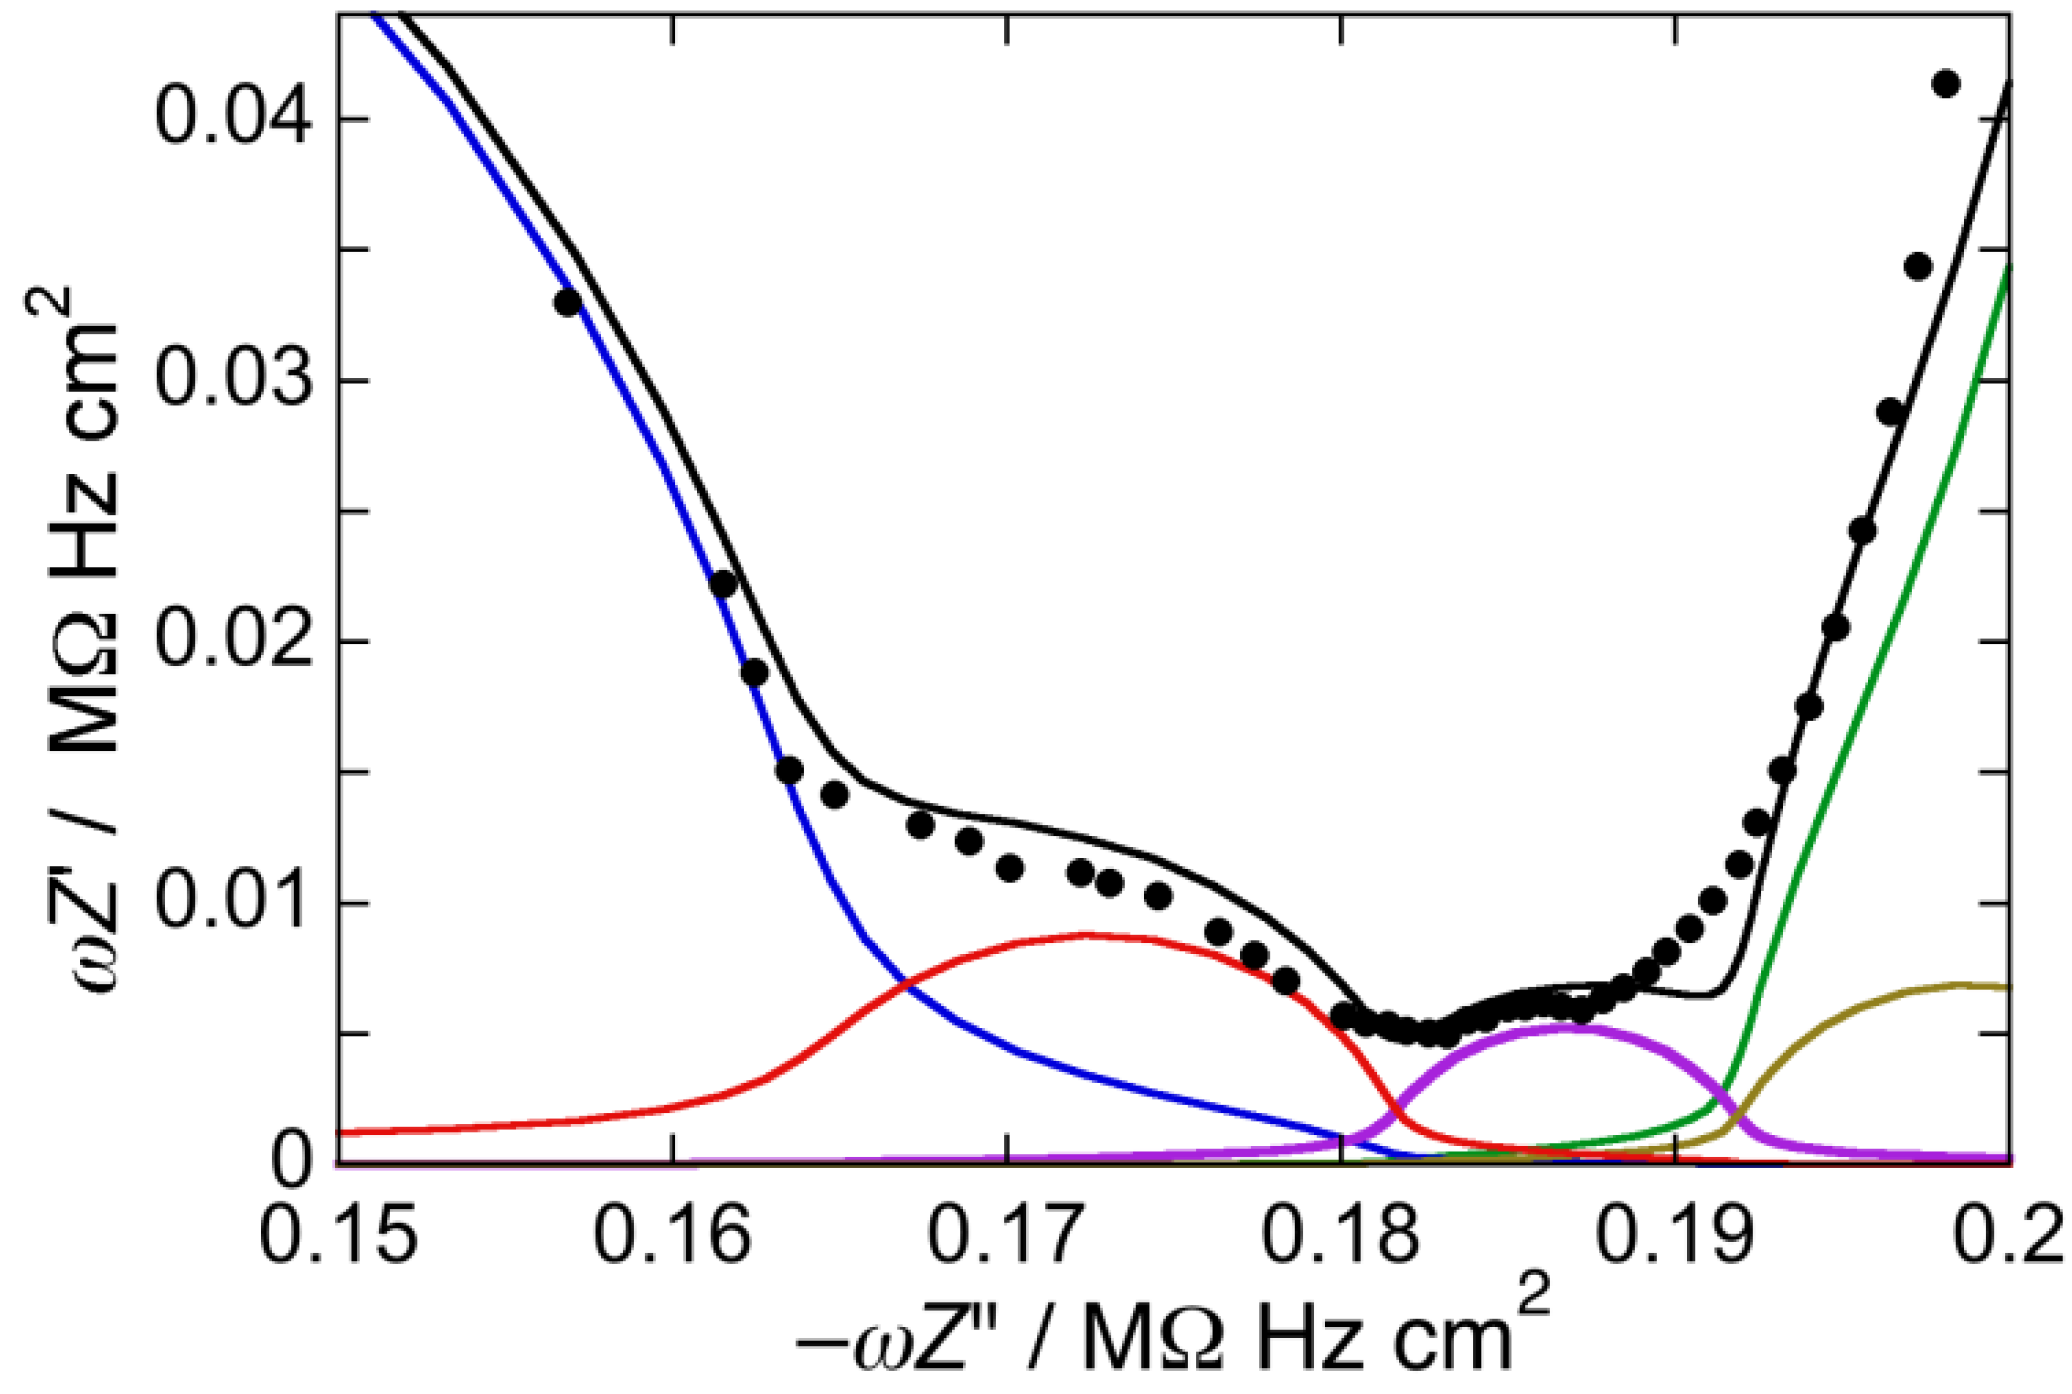
Figure 4.
Plot of ωZ′ against −ωZ″ for a Hg-supported DOPC/Chol/PSM/GM1 (47:21:12:20) mol% monolayer in aqueous 0.1 M KCl at −0.550 V. Solid circles are experimental points and the black curve is the best fit to these points by a series of five RC meshes. The contributions to ωZ′ against −ωZ″ are represented in blue for the hydrocarbon tails, in red for the polar heads, in brown for the diffuse layer, in green for the aqueous solution, and in violet for an additional RilCil mesh, ascribed to the “inner layer”. Capacitances and resistances of the five RC meshes are: Rht = 1.6 MΩ·cm2, Cht = 6.1 µF cm−2, Rph = 3.4 kΩ·cm2, Cph = 57 µF·cm−2, Rdl = 1.6 Ω·cm2, Cdl = 73 µF·cm−2, RΩ = 3.5 Ω·cm2, CΩ = 27 nF·cm−2, Ril = 50 Ω·cm2, Cil = 90 µF·cm−2.
Figure 5.
Capacitance and resistance of hydrocarbon tails and polar heads along the DOPC, DCP, DOPC/GM1, DCP/GM1 sequence.
Figure 5.
Capacitance and resistance of hydrocarbon tails and polar heads along the DOPC, DCP, DOPC/GM1, DCP/GM1 sequence.
It should be noted that the PSM molecules are longer than the DOPC molecules. For the purpose of EIS analysis, we can imagine subdividing the polar head region into two ideal slabs parallel to the mercury surface. The slab closer to the electrode surface contains the polar heads of the shorter lipid (
i.
e., DOPC) as well as the distal portion of the hydrocarbon tails of the longer lipid (
i.
e., PSM). The outer slab contains the polar heads of the PSM molecules intercalated with the water molecules. The presence of this further slab does not yield an additional
RC mesh in the impedance spectrum. This indicates that the PSM molecules are highly dispersed among the water molecules, in the form of single monomers or small aggregates. In this case, the high dielectric constant of water imparts to this slab a high capacitance and a low resistance, making it practically invisible to EIS. In fact, EIS is sensitive to the static dielectric constant, which equals 80 for water and is of the order of 2 for lipid hydrocarbon tails. Hence, it can hardly distinguish a highly hydrated layer from the aqueous solution [
30].
This behavior should be compared with that of Hg-supported DOPC/PSM SAMs with mol% PSM ≥ 20, which are known to form PSM-rich gel phase microdomains [
19,
27,
28]. The impedance spectra of these SAMs require the addition of a further
RC mesh of capacitance 35 ± 10 µF·cm
−2 and resistance 250 ± 50 Ω·cm
2 for a satisfactory fit [
19]. This indicates that, when the PSM molecules are aggregated into sufficiently large and compact microdomains, the dielectric slab consisting of clusters of the protruding PSM polar heads intercalated with water molecules can be detected by EIS. The capacitance of such a slab is expressed by the sum of the capacitance of the clusters of PSM polar heads and that of the water molecules, each multiplied by the corresponding mole fraction, provided edge effects are negligible. The local value of the diffuse layer capacitance in close contact with the microdomains does not necessarily coincide with that predicted by the Gouy-Chapman theory. A numerical estimate of this quantity near ultramicroelectrodes yields values as high as 200 µF cm
−2 [
31]. Thus, we cannot exclude capacitance values of the water molecules around the asperities represented by gel-phase microdomains appreciably higher than those on the flat l
d matrix.
It should be noted that the analysis of the impedance spectra of Hg-supported lipid SAMs does not reveal the presence of an additional RC mesh if the SAM contains lo microdomains (i.e., lipid rafts) but no gel phase microdomains. This is the case with the DCP SAM examined in this work. Only the presence of gel phase microdomains provides evidence for an additional RC mesh in the fitting of the impedance spectrum. This is because the detection of an additional RC mesh by EIS requires that tightly packed microdomains with a low content of water protrude out of the ld matrix. This requirement is not fulfilled by lipid rafts. The detection of an additional RC mesh also requires a molecular level smooth support, such as that provided by the liquid mercury surface, because the protrusion of the gel phase microdomains must be averaged over a macroscopically large area. On solid supports such as mica, a difference in height between gel phase microdomains and the surrounding matrix can only be detected at nanoscale distances along the surface, e.g., by AFM.
Addition of 20 mol% GM1 to the DCP mixture restores a capacitance
Cph close to that for the DOPC and DOPC/GM1 SAMs, thus, disrupting the Chol-PSM hydrogen bonds (see
Figure 5). This behavior can be understood by considering that a satisfactory fit of the impedance spectrum of the DCP/GM1 SAM requires an additional
RC mesh of capacitance 90 ± 10 µF·cm
−2 and a resistance of about 50 Ω·cm
2. The features of this
RC mesh are similar to those of the additional
RC mesh reported for Hg-supported DOPC/PSM SAMs with mol% PSM > 20 [
19], which are known to form PSM-rich gel phase microdomains. The
RC mesh for the DCP/GM1 SAM can be likewise ascribed to GM1-rich gel phase microdomains. The electrostatic repulsion between the negatively charged oligosaccharide headgroups of GM1 and the steric hindrance of its bulky sugar and sialic acid groups can hardy allow the formation of pure GM1 microdomains. The strong hydrogen bonds between the hydroxyl groups and the amide carbonyl groups of the ceramide moieties of GM1 and PSM and, even more so, between PSM and the β-D-glucose and β-D-galactose residues of the GM1 headgroup [
29] strongly suggest the recruitment of PSM molecules by the GM1-rich microdomains. This is more likely to occur within the PSM-rich lipid rafts, which exist prior to the addition of GM1. This process induces the breaking of the hydrogen bonds between PSM and Chol molecules. On the other hand, the presence of Chol molecules in the GM1-rich gel-phase microdomains is expected to be low. In fact, a significant Chol content in the gel phase microdomains would convert them into lipid rafts, eliminating the mismatch at the boundary between the anisotropic gel phase microdomains and the surrounding l
d matrix.
These conclusions are in agreement with an AFM study of GM1 domains in DCP monolayers on mica. AFM images of DOPC/Chol/PSM (1:1:1) mol% monolayers show microdomains higher then the surrounding l
d matrix by about 1.0 nm, ascribable to the l
o phase [
12]. In the presence of GM1, numerous bright dots randomly distributed in the l
o phase are observed, approximately 1.0 nm higher than the latter phase. For GM1 mole fractions higher than 5%, these dots coalesce to form a complex network of filaments. Both dots and filaments are assigned to a GM1-rich phase. Fluorescent confocal microscopy measurements on giant unilamellar vesicles of identical composition show that the l
o domains are enriched with fluorescently labeled GM1 and PSM, while fluorescently labeled dioleoylphosphatidylethanolamine (DOPE) is almost absent in these domains [
32]; however, GM1 and PSM are not completely absent in the l
d phase. A monolayer of GM1/DMPC(dimyristoylphosphatidylcholine)/Chol with mole ratios of 1:6:3, 2:5:3 and 3:4:3 was investigated by Lipkowski and coworkers by AFM [
33]. This monolayer constituted the inner leaflet of a bilayer lipid membrane floating on top of a hydrophilic monolayer of thioglucose anchored to Au(111) and separated from this metal support by a 2-nm water-rich region; the outer leaflet was composed of a 7:3 mole ratio of DMPC/Chol. The 10 and 30 mol% GM1 leaflets are uniform and smooth, with the 30 mol% one probably in a condensed state. Conversely, the 20 mol% GM1 film is phase-separated, with a GM1-rich phase elevated by approximately 1 nm with respect to the surrounding DMPC-rich l
d phase.
The absence of an additional
RC mesh in the impedance spectrum of the DOPC/GM1 SAM, as distinct from the DCP/GM1 SAM, excludes the presence of GM1-rich gel phase microdomains in a DOPC l
d matrix and strongly suggests a random distribution of GM1 molecules in the DOPC monolayer. This conclusion agrees with freeze-etch electron microscopy [
34] and differential scanning calorimetry [
35] investigations of model membranes, according to which mixtures of low-
Tm phosphatidylcholines (PCs) with small quantities of GM1 suggest that GM1 is completely miscible with these PCs in the l
d phase. It is also in keeping with molecular dynamics simulations on GM1/SM/Chol and GM1/POPC lipid bilayers [
29]. These simulations show that the GM1 molecules in the GM1/SM/Chol membrane are condensed, with numerous hydrogen bonds among glycan portions of the GM1 clusters, whereas those in the GM1/POPC membrane are scattered. In other words, the formation of GM1 aggregates is observed only on the GM1/SM/Chol mixed membrane. Yuan and Johnston [
11] report small domains of variable size (50–100 nm) and height in GM1/egg PC (5:95) mol% mixtures on mica by AFM. However, the amount of GM1 in the DOPC-rich phases increases with both increasing surface pressure (in our SAMs, 45 mN/m
2) and GM1 concentration [
12,
13]. Moreover, a combination of two-color fluorescence and AFM, which allows a distinction between monomeric and aggregated GM1, reveals the presence of monomeric GM1 units in the l
o phase of DOPC/DPPC monolayers [
13].
In spite of the appreciable difference between the behavior of 20 mol% GM1 in raft-making lipid monolayers and in pure DOPC monolayers, addition of 10 nM ChTo B has no detectable effect on the impedance spectra of these monolayers. This behavior is in apparent contrast with surface plasmon resonance (SPR) measurements recently carried out by two of us and others on DOPC/GM1 and DCP/GM1 floating bilayers self-assembled on a hydrophilic thiol tethered to a gold slide [
36]. SPR angular spectra at a DCP/GM1 bilayer in aqueous solution of 10 nM ChTo B monitored an optical thickness about twice that at a DOPC/GM1 bilayer. This points to a marked preference of ChTo B for binding to GM1-rich microdomains with respect to GM1 monomers, at constant GM1 mole fraction in the lipid mixture. This apparent discrepancy is to be ascribed to a considerable amount of water in ChTo B molecules on supported lipid layers [
30,
37]. The presence of this large amount of water makes the protein layer bound to GM1 practically invisible to EIS. Conversely, the optical response is proportional to the actual mass coverage, independent of its water content [
30].
