An Environmental Risk Assessment for Human-Use Trimethoprim in European Surface Waters

Abstract
:1. Introduction
2. Results and Discussion
2.1. Trimethoprim Pharmacological Data
2.1.1. TMP Mode of Action
2.1.2. TMP Adsorption, Metabolism and Excretion
2.1.3. TMP Toxicity
2.2. TMP Environmental Fate and Concentrations
2.2.1. Physico-Chemical Data for TMP
2.2.2. Biodegradation, Environmental Fate and Bioaccumulation Data for TMP
2.2.2.1. Biodegradability of TMP (Table A2) [18,19,21,25,26,29,30,31,32,33,34,35]
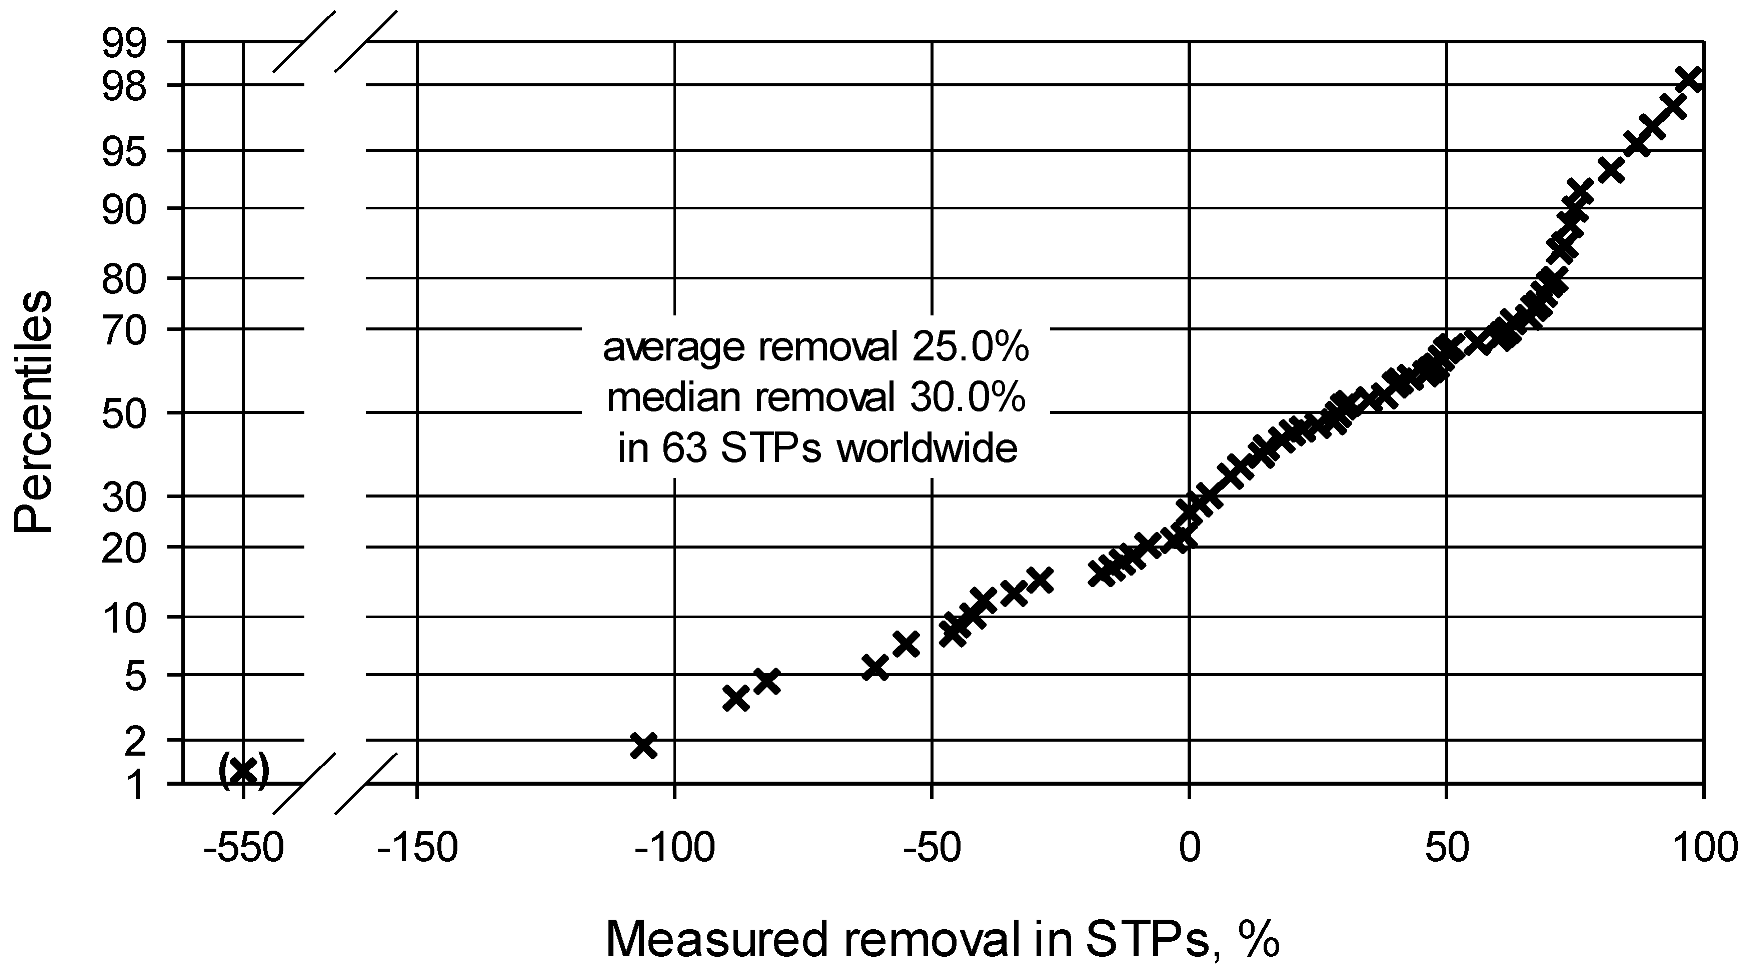
2.2.2.2. Removal of TMP during Sewage Treatment (Table A3) [19,23,25,36,37,38,42,43,44,45,46,47,48,49,50,51,52,53,54,55,56,57,58,59,60,61,62,63,64,65,66,67,68,69,70,71,72,73,74]
2.2.2.3. Environmental Fate of TMP (Table A4) [13,15,16,19,21,36,37,38,39,40,41,72,73,78]
2.2.2.4. Bioaccumulation Data for TMP (Table A5) [9,28,47,67,80,81,82,83,84]
2.3. TMP Environmental Concentrations
2.3.1. PECs and Use Data for Europe

| PEC stage | Surface water PEC, µg/L | Information used | |
|---|---|---|---|
| worst case | best case | ||
| Initial crude | 2.0 | max daily dose, 400 mg [4], EMA ERA guideline [86] | |
| First refinement | 0.253 | 0.198 | actual daily use per inhabitant, 0.5056 mg (maximum, UK) respectively 0.3955 mg (avg., Europe) (based on [87]) |
| Second refinement | 0.202 | 0.119 | excretion rate, 80% respectively 60% |
| Third refinement | 0.152 | 0.089 | STP removal, 25.0% (avg.) respectively 30.0% (median) |
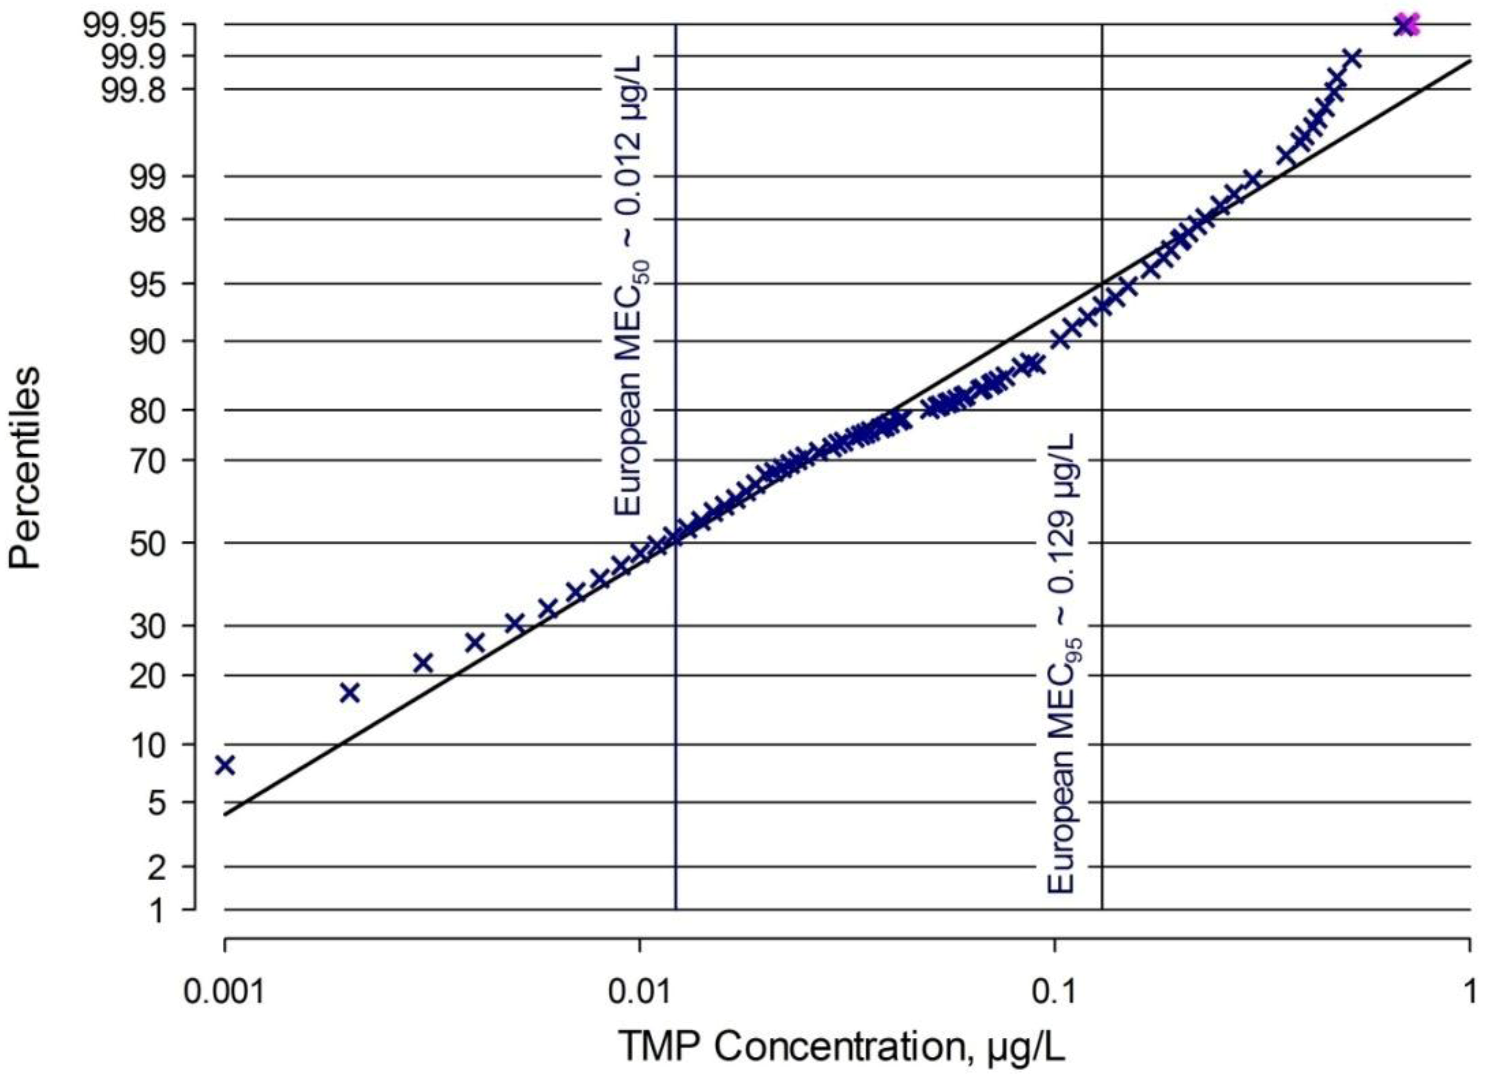
2.3.2. TMP MECs for Europe
2.3.3 Comparison of TMP PECs and MECs for Europe
- The PECs assume that the whole amount sold is also used and excreted. Patient noncompliance seems to be relatively common, however [125,126,127]. Particularly with antibiotics, some patients stop taking the medicines when they start to feel better, without finishing the whole treatment course. As long as these discarded APIs are not drained into the wastewater, this will reduce the surface water PEC.
- The PECs assume that the average and median removal rates in STPs derived here are representative for the whole of Europe. Possibly more STPs have well nitrifying AS that results in higher removal and thereby in a lower surface water PEC.
- The PECs assume a TGD [79] default surface water dilution factor of 10. If the average dilution factor in Europe is higher this would result in a lower PEC.
2.4. TMP Environmental Effects and Predicted No Effect Concentrations
2.4.1. Micro-organism/STP Inhibition
2.4.2. Surface Water Ecotoxicity
2.4.2.1. Acute Ecotoxicity of TMP (Table A7) [9,18,124,129,130,136,137,138,139,140,141,142,143,144,145,146,147,148,149,150]
2.4.2.2. Chronic Ecotoxicity of TMP (Table A8) [136,137,139,140,141,142,143,144,145,146,151,152,153,154]
2.5. TMP Predicted No Effect Concentrations
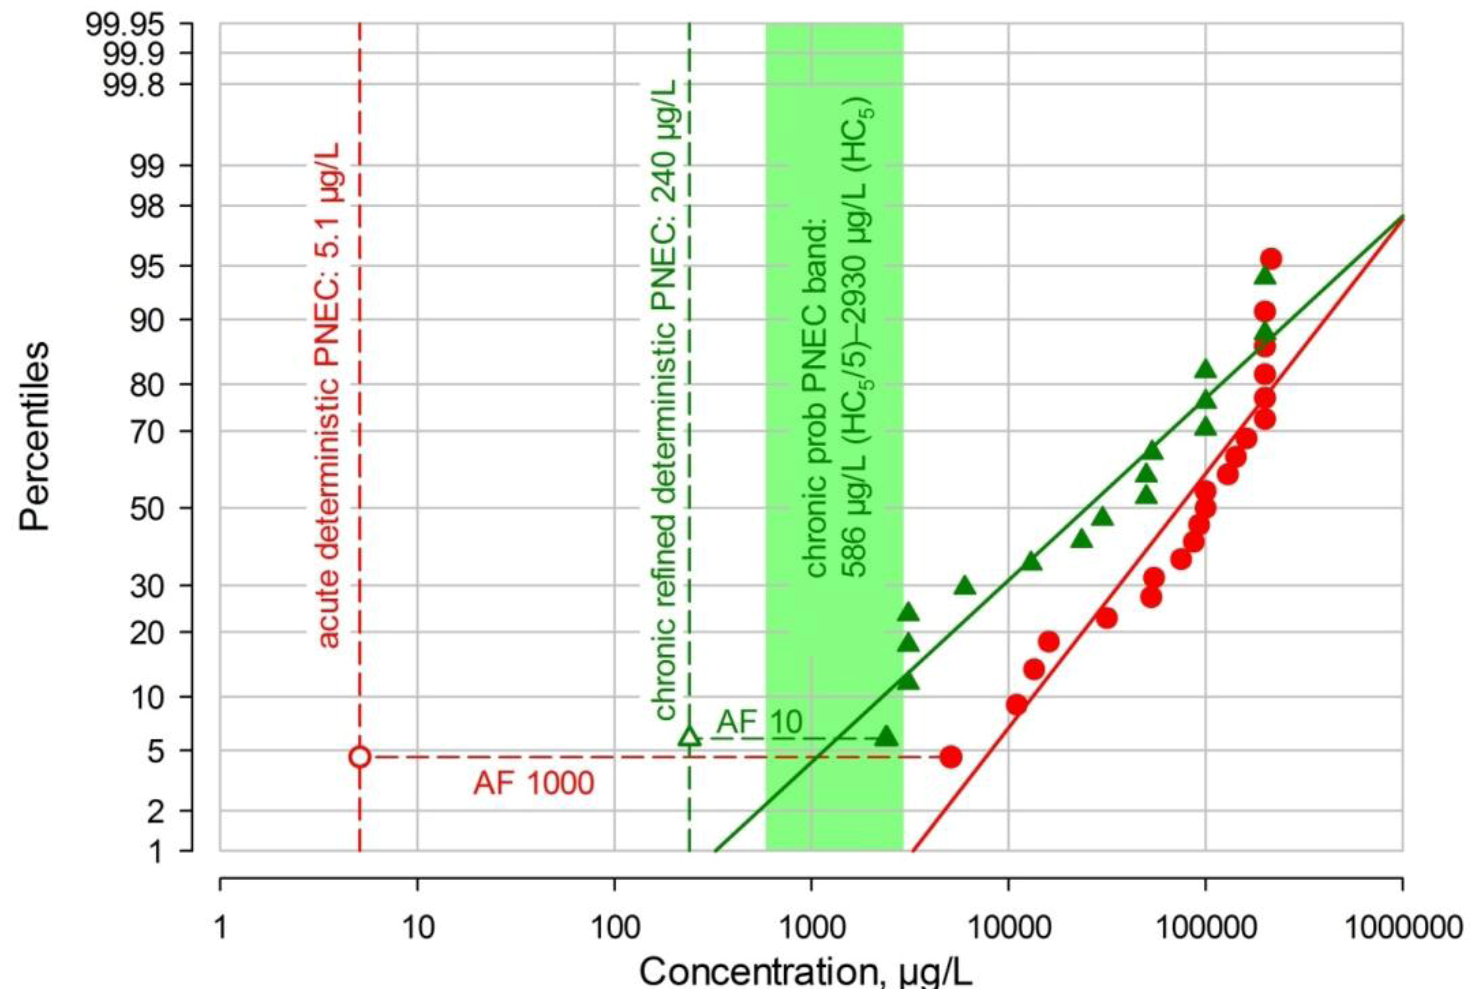
2.5.1. Deterministic TMP PNEC Derivation
2.5.2 Probabilistic PNEC Derivations
2.5.2.1. TGD Probabilistic PNEC

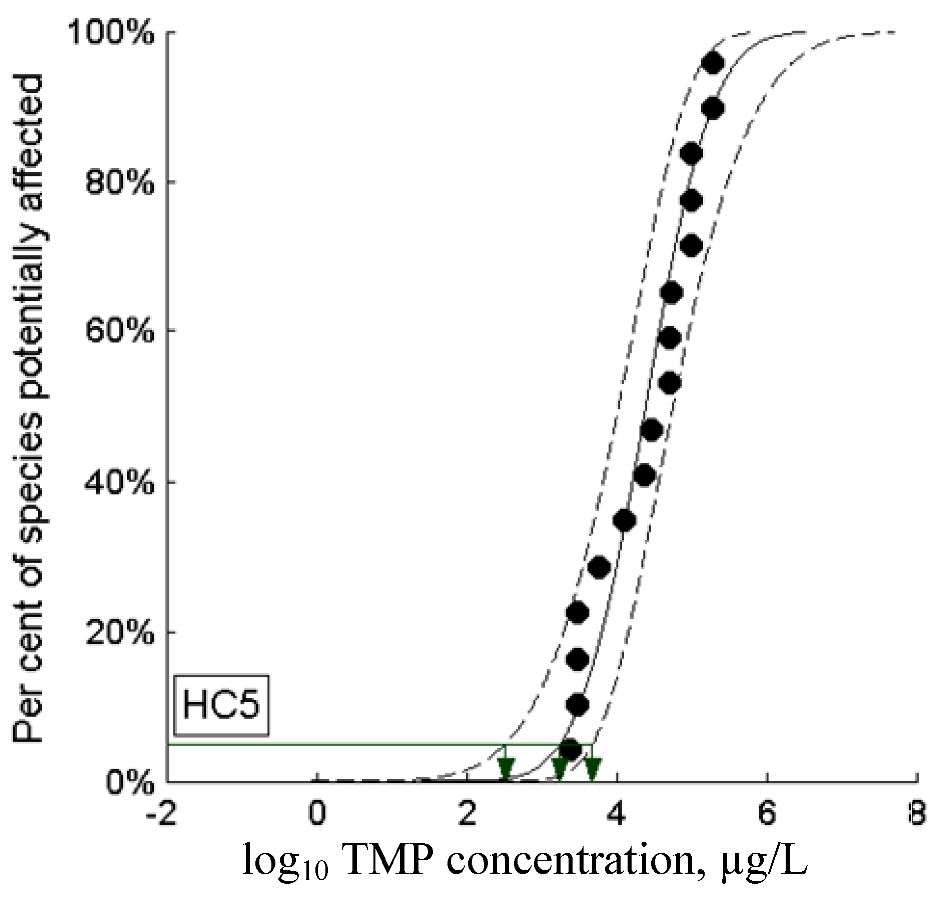
2.5.2.2. Webfram Probabilistic HC5
2.6. Aquatic Environmental Risk Assessment for Human-Use TMP in Europe
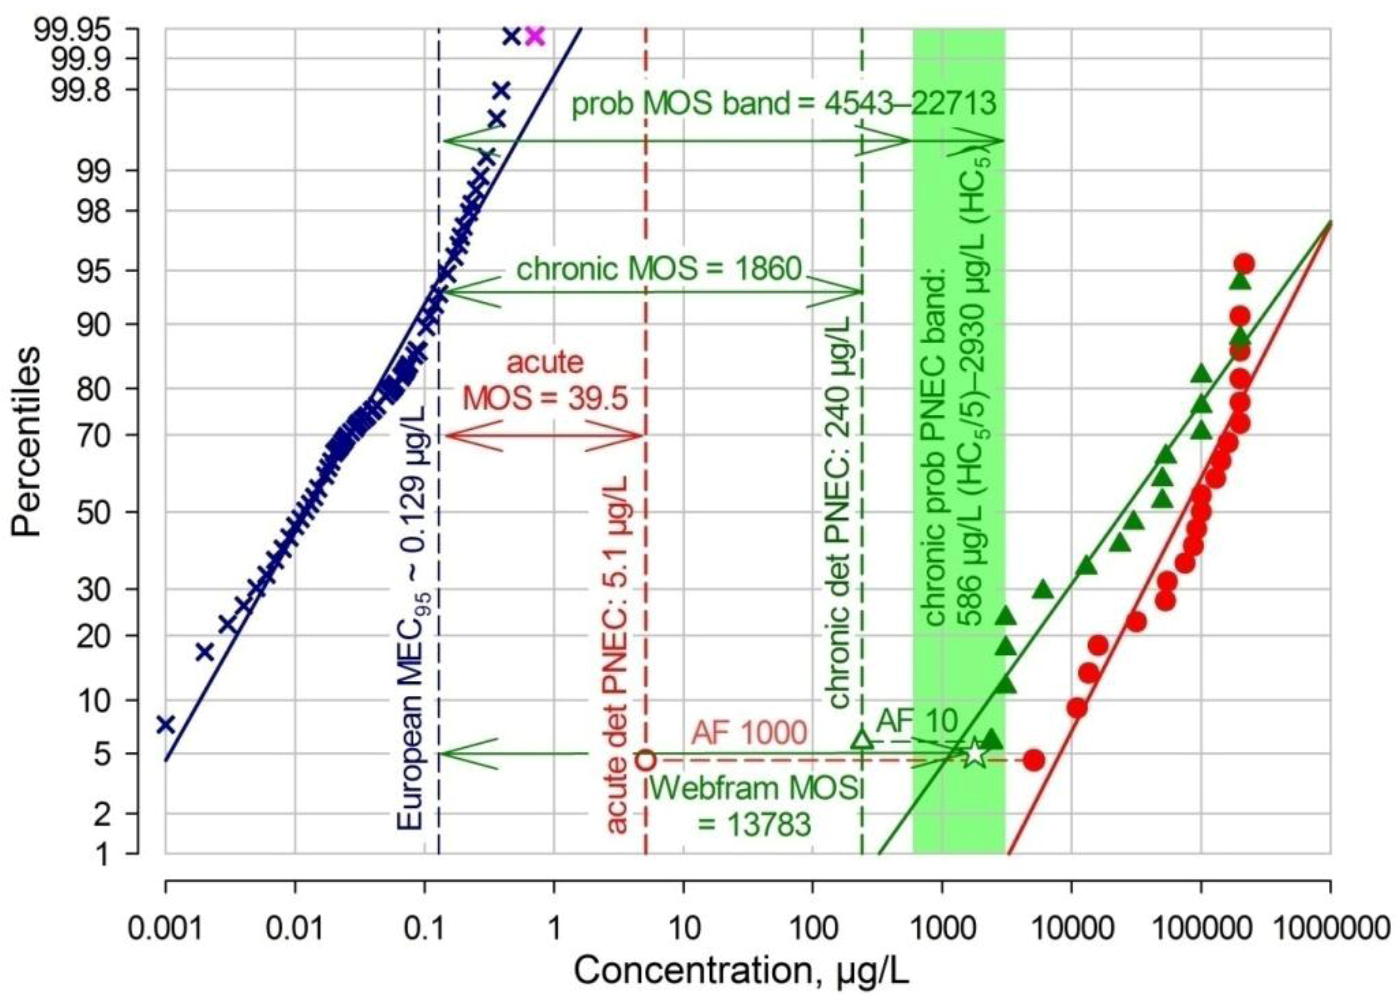
2.6.1. TMP Risk Characterization Ratios
| Environmental concentrations (PECs and MECs) | Predicted no-effect concentrations (PNECs) | Risk ratio (PEC/PNEC or MEC/PNEC) | Margin of safety (inverse of risk ratio) | ||
|---|---|---|---|---|---|
| Derivation | value, µg/L | Derivation | value, µg/L | ||
| EMA crude PEC | 2.0 | acute-det | 5.1 | 0.392 | 2.55 |
| 2.0 | chronic-det | 240 | 0.00833 | 120 | |
| 2.0 | chronic-pr | 586–2930 | 0.00341–0.000683 | 293–1465 | |
| 2.0 | Webfram pr HC5 | 1778 | 0.00112 | 889 | |
| Third refined PEC (incl. actual use, excretion rate, STP removal) [this work] | 0.152–0.089 | acute-det | 5.1 | 0.0299–0.0175 | 33.6–57.3 |
| 0.152–0.089 | chronic-det | 240 | 0.000633–0.000371 | 1579–2697 | |
| 0.152–0.089 | chronic-pr | 586–2930 | 0.000259–0.0000304 | 3855–32921 | |
| 0.152–0.089 | Webfram pr HC5 | 1778 | 0.0000855–0.0000500 | 11697–19978 | |
| European MEC95 [this work, Figure 2] | 0.129 | acute-det | 5.1 | 0.0253 | 39.5 |
| 0.129 | chronic-det | 240 | 0.000538 | 1860 | |
| 0.129 | chronic-pr | 586–2930 | 0.000220–0.0000440 | 4543–22713 | |
| 0.129 | Webfram pr HC5 | 1778 | 0.0000726 | 13783 | |
| European MEC50 [this work, Figure 2] | 0.012 | acute-det | 5.1 | 0.00235 | 425 |
| 0.012 | chronic-det | 240 | 0.00005 | 20000 | |
| 0.012 | chronic-pr | 586–2930 | 0.0000205–0.0000041 | 48833–244167 | |
| 0.012 | Webfram pr HC5 | 1778 | 0.00000675 | 148167 | |
| Maximum European MEC [109] | 0.690 | acute-det | 5.1 | 0.135 | 7.39 |
| 0.690 | chronic-det | 240 | 0.00286 | 348 | |
| 0.690 | chronic-pr | 586–2930 | 0.00118–0.000235 | 849–4246 | |
| 0.690 | Webfram HC5 | 1778 | 0.000388 | 2577 | |
| Maximum MEC located worldwide, USA [124] | 0.710 | acute-det | 5.1 | 0.139 | 7.18 |
| 0.710 | chronic-det | 240 | 0.00296 | 338 | |
| 0.710 | chronic-pr | 586–2930 | 0.00121–0.000242 | 825–4127 | |
| 0.710 | Webfram pr HC5 | 1778 | 0.000399 | 2504 | |
2.6.2. TMP Risk Graph

2.6.3. Limitations of the Present TMP ERA
2.6.3.1. Mixture Assessment
2.6.3.2. Human Plus Veterinary Use of TMP
2.6.3.3. Antibiotic Resistance
2.6.3.4. Further Environmental Compartments
3. Experimental
3.1. Literature Search
3.2. Collation of STP Removal Rates and Surface Water MECs
3.3. Identification of Ecotoxicity Data Gaps and Additional Ecotoxicity Studies
3.4. Risk Assessment Methodology
4. Conclusions
Acknowledgments
Conflict of Interest
Appendix
| Property | Method | Value | Unit | Reference |
|---|---|---|---|---|
| CAS number | 738-70-5 | SDS Roche [2] | ||
| Molecular mass | 290.32 | g/mol | SDS Roche [2] | |
| Melting point | experimental | 199–203 | °C | SDS Roche [2] |
| Vapour pressure | experimental | 9.88 × 10–9 = 1.32 × 10⁻⁶ | mm Hg Pa | Gros et al. 2006 [5] |
| Water solubility | experimental | 400 | mg/L, 25 °C | PhysProp online [6] |
| experimental | 400 | mg/L | Chen et al. 2002 [7] | |
| experimental | 401 | mg/L | Ran et al. 2002 [8] | |
| experimental | 300 | mg/L | SDS Roche [2] | |
| experimental, freshwater & marine | ~75 (both) | mg/L | Bergsjø & Søgnen 1980 [9] | |
| Dissociation constant | experimental | 7.6 | base pKa | Bergsjø & Søgnen 1980 [9] |
| experimental | 7.2; 6.6 | base pKa | Clarke’s online [3] | |
| experimental | 6.6 | base pKa | Roche SDS [2] | |
| experimental | 6.76 ± 0.12; 3.23 ± 0.30 | base pKa1 base pKa2 | Qiang & Adams 2004 [10] | |
| Octanol/water partition coefficient | experimental | 0.64 | logKow | Roche SDS [2] |
| experimental | 0.74, pH 7.4 | logD | Zhu et al. 2002 [11] | |
| experimental | 0.91 | logKow | PhysProp online [6] | |
| experimental | 1.115 | logKow | Zhao et al. 2002 [12] | |
| Adsorption to organic carbon, Koc | experimental | 1680–3990 | L/kg | Boxall et al. 2005 [13] |
| Koc, digested sludge | experimental | 724 (logKoc = 2.86) | L/kg | Barron et al. 2009 [14] |
| Koc, soil | experimental | 224 (logKoc = 2.35) | L/kg | Barron et al. 2009 [14] |
| Koc, soil | experimental, soil pH 4.9 | 719 | L/kg | Liu et al. 2010 [15] |
| Koc, soil | experimental | 4600 | L/kg | Lin & Gan 2011 [16] |
| Koc | QSAR estimate | 2692 | L/kg | Franco & Trapp 2010 [17] |
| Sorption (Kd) to activated sludge (AS) | experimental | 76 | L/kg | Halling-Sørensen et al. 2000 [18] |
| Kd, AS | experimental | 208 ± 49 | L/kg | Göbel et al. 2005 [19] |
| Kd, AS | experimental | ~200–300 | L/kg | McArdell et al. 2005 [20] |
| Kd, AS | experimental inherent bodegradability test | ~1500 (3 h), ~966 (28 d) | L/kg | Gartiser et al. 2007 [21] |
| Kd, AS | experimental | 330 ± 25 | L/kg | Abegglen et al. 2009 [22] |
| Kd, digested sludge | experimental | 68 | L/kg | Barron et al. 2009 [14] |
| Kd, primary sludge | experimental | 427 ± 238 | L/kg | Radjenovic et al. 2009 [23] |
| Kd, AS | experimental | 253 ± 37 | L/kg | Radjenovic et al. 2009 [23] |
| Kd, membrane bioreactor | experimental 2 MBRs | 225 ± 87; 320 ± 117 | L/kg | Radjenovic et al. 2009 [23] |
| Kd, AS | experimental | 68 | L/kg | Power et al. 2009 [24] |
| Sorption to AS | experimental | ‘negligible’ | Batt et al. 2006 [25] | |
| Sorption WWTP | experimental | ‘negligible’ | Göbel et al. 2007 [26] | |
| Kd, AS | experimental | 7.4; but strong adsorption in one soil | L/kg | Lin & Gan 2011 [16] |
| Kd, soil | experimental | 26 | L/kg | Power et al. 2009 [24] |
| Kd, soil | experimental, soil pH 4.9 | 9.7 | L/kg | Liu et al. 2010 [15] |
| Sorption to sludges | experimental | ND in primary, secondary and digested sludge as well as in compost | Martín et al. 2012 [27] |
| Test Type | Inoculum | Endpoint | TMP Conc, mg/L | Duration | Degradation | Reference |
|---|---|---|---|---|---|---|
| Ready biodegradability OECD301F | BOD/ThOD | 19.4 | 0% | Halling-Sørensen et al. 2000 [18] | ||
| Ready biodegradability OECD 301D | BOD/ThOD | 3.25 (TMP-naphtoate) | 28 day | 4% | Alexy et al. 2004 [29] | |
| Ready biodegradability OECD 301D, toxicity control/ cometabolic degradation | BOD/ThOD | 3.25 (TMP-naphtoate) plus sodium acetate | 28 day | 27% | Alexy et al. 2004 [29] | |
| Degradation in a water/leaf system | fallen leaves, natural water | substance loss | 0.04 | 168 h | ~80% | Bundschuh et al. 2009 [30] |
| Inherent respirometric test (Roche-internal) | mixed industrial-municipal AS | BOD/ThOD | 200 | 5 day | 0% | Gröner 1981 [31] |
| Inherent biodegradability | t½ primary degradation | 0.5 | 22–41 day | Halling-Sørensen et al. 2000 [18] | ||
| Inherent biodegradability (combined Zahn-Wellens/ CO2 evolution test) | DOC, BCO2 | 100 mg TOC/l | 28 day | negative (toxic to sludge) | Gartiser et al. 2007 [21] | |
| Inherent biodegradability | nitrifying AS with long SRT (49 d) | substance loss | 0.25 | 96 h | ~70% | Batt et al. 2006 [25] |
| Inherent biodegradability | nitrifying AS with long SRT (49 d) | degradation half-life | 0.25 | ~67 h | Batt et al. 2006 [25] | |
| Inherent biodegradability OECD 303A | AS | substance loss | 0.03 radio-labelled | 21 day | <1% | Junker et al. 2006 [32] |
| Inherent biodegradability | AS with 220 d SRT | substance loss | 0.001 | 74% | Yu et al. 2009 [33] | |
| Inherent bio-degradability, small membrane bioreactor | AS | primary degradation constant kbiol | 0.22 ± 0.022 l × gss–1d–1 | Abegglen et al. 2009 [22] | ||
| (Inherent) Biodegradability | primary sewage | primary degradation | 0.02 | 54 day | ~40%, slow | Pérez et al. 2005 [34] |
| (Inherent) Biodegradability | AS | primary degradation | 0.02 | 54 day | NS/slight increase | Pérez et al. 2005 [34] |
| (Inherent) Biodegradability | nitrifying sludge | primary degradation | 0.02 | 3 day | 100%, rapid | Pérez et al. 2005 [34] |
| Elimination | primary wastewater treatment | –13% to 31% | Göbel et al. 2007 [26] | |||
| Elimination | conventional AS with 10–25 d SRT | –40 ± 20% to 20 ± 11% | Göbel et al. 2007 [26] | |||
| Elimination | AS with 60–80 d SRT | 87%–90% | Göbel et al. 2007 [26] | |||
| Elimination | fixed-bed reactor | 12 ± 11% to 17 ± 11% | Göbel et al. 2007 [26] | |||
| Elimination | pilot membrane bioreactors in a WWTP | substance loss | 50 µg/L | SRT 15 day & HRT 9 h; SRT 30 day & HRT 13 h | 86% SRT 15; 94% SRT 30 | Schröder et al. [35] |
| Elimination | sand filter | 15%–74% | Göbel et al. 2007 [26] | |||
| Elimination | sand filter | 60% | Göbel et al. 2005 [19] |
| Sewage treatment plants (STP) | Type | Measurement | Removal | Reference | |
|---|---|---|---|---|---|
| STPs Germany | AS | substance loss, two analytical methods | 18 ± 14%, 29 ± 17% | Ternes et al. 1999 [42] | |
| STPs Europe (n = 7) | AS | substance loss | 0%, 4×<10%, 30%, 40% | Paxéus 2004 [43] | |
| STPs Switzerland (n = 2) | AS | substance loss | 74% | Göbel et al. 2005 [19] | |
| STP Sweden | AS | substance loss | 49% | Bendz et al. 2005 [44] | |
| STP Sweden (n = 2) | AS | substance loss | –550% (!) to 68% | Lindberg et al. 2005 [45] | |
| STP Sweden | AS | substance loss | −45%, −1%, 40% | Lindberg et al. 2006 [46] | |
| STP France | AS | substance loss | 51% | Paffoni et al. 2006 [47] | |
| STP Spain | AS | substance loss | −128% to 71% | Gros et al. 2007 [48] | |
| STPs Croatia (n = 2) | AS | substance loss | −15%, 49% | Senta et al. 2008 [49] | |
| STPs Wales (n = 2) | AS | substance loss | 47%, 70% | Kasprzyk-Hordern et al. 2009 [50] | |
| STP Spain (n = 2) | AS | substance loss | 40.4 ± 25.4% | Radjenovic et al. 2009 [23] | |
| STPs Spain (n = 2) | membrane bioreactor | substance loss | 66.7 ± 20.6% 47.5 ± 22.5% | Radjenovic et al. 2009 [23] | |
| STPs Canada (n = 2) | AS | substance loss | 14 ± 2%, NS 38 ± 4% | Segura et al. 2006 [51] | |
| STP USA | AS | substance loss | ~50% | Batt et al. 2006 [25] | |
| STP USA | AS | substance loss | 69% | Brown et al. 2006 [52] | |
| STP USA (n = 4) | various | substance loss | 50%, 61%, 66%, 67%, 69%, 83% | Karthikeyan & Meyer 2006 [53] | |
| STP USA | nitrifying AS | substance loss | influent >0.01 µg/L (LOD), effluent <LOD | not quantified | Levine et al. 2006 [54] |
| STPs USA (n = 4) | AS | substance loss | 70%, 76%, 82%, 97% | Batt et al. 2007 [55] | |
| STP Australia | AS | substance loss | 85% | Watkinson et al. 2007 [56] | |
| STPs Japan (n = 4) | different secondary treatments | substance loss | −88%, −82%, −46%, 35%, 63%, 73%, 74% | Ghosh et al. 2009 [57] | |
| STP China (n = 4) | different primary and secondary treatments | substance loss | −42%, −17%, −11%, 42% | Gulkowska et al. 2008 [58] | |
| STP Norway (n = 1) | AS | substance loss | –60% to 28%, values only from graph | Plósz et al. 2010 [59] | |
| STP Sweden (n = 4) | AS | substance loss | 4%, 13%, 63%, 76%; average 39% | Fick et al. 2011 [60] | |
| STPs Ireland (n = 3) | AS | substance loss | 0–94.6% | Lacey et al. 2012 [61] | |
| STPs Hong Kong/China (n = 7) | different secondary treatments | substance loss | 43% overall removal | Leung et al. 2012 [62] | |
| STP Taiwan (n = 1) | primary, seconday & tertiary | substance loss | >99% | Lin et al. 2012 [63] | |
| STPs Spain (n = 2) | AS | substance loss | 8%, 29% | Verlicchi et al. 2012 [64] |
| Endpoint | Medium | Measurement | Conditions | Duration | Result | Reference |
|---|---|---|---|---|---|---|
| Hydrolysis | stable | Lam et al. 2004 [65] | ||||
| Hydrolysis | stable | Michael et al. 2012 [66] | ||||
| Aquatic photodegradation | not readily photodegradable | Boxall et al. 2002 [67] | ||||
| Aquatic photodegradation | 42 day | no photodegradation | Boxall et al. 2004 [68] | |||
| Aquatic photodegradation | seawater, natural sunlight | 21 day | stable | Lunestad et al. 1995 [69] | ||
| Aquatic photodegradation | Hg-Nd lamp, H2O2, tap water | 10 min; 20 min | >90%; >99% | Türk 2007 [70] | ||
| Aquatic photodegradation | <10% UV only; up to 92% with UV, H2O2 and scavengers | Rosario-Ortiz et al. 2010 [71] | ||||
| Aquatic photodegradation | natural sunlight | substance loss | 2 mg/L, pH 4,7&9 | 72 h | slight degradation during daytime only, up to ~2% at 72 h | Wu et al. 2011 [72] |
| Aquatic photodegradation | natural sunlight | substance loss | 2 mg/L, aluminium-wrapped dark control, pH 4,7&9 | 72 h | increased degradation up to ~15% (pH 4 & 7) correlating with temperature | Wu et al 2011 [72] |
| Aquatic photodegradation | natural sunlight | substance loss | 10 mg/L demineralised water | 500 min | increased with Fenton reagent, decreased in simulated and natural wastewater | Michael et al. 2012 [66] |
| Ozonation | rapid destruction | Türk 2007 [70] | ||||
| Environmental half-life | freshwater microcosm | t½ measured | 5.7 ± 0.1 day | Lam et al. 2004 [65] | ||
| Environmental half-life | freshwater | t½ estimate | >42 day | Boxall et al. 2002 [67] | ||
| Environmental half-life | freshwater | t½ estimate | 20–100 day | Zuccato et al. 2001 [73] | ||
| Environmentalhalf-life | marine sediment | t½ estimate | <60–100 day | Boxall et al. 2002 [67] | ||
| Environmental half-life | marine sediment | t½ estimate | 75–100 ayd | Hektoen et al. 1995 [74] | ||
| Elimination | freshwater sediment | primary degradation | 14 h | 15% | Löffler & Ternes 2003 [36] | |
| Riverbank filtration | substance loss | >75% removal | Schmidt et al. 2006 [37] | |||
| Anaerobic biodegradability ISO11734 | methane production | NS | Gartiser et al. 2007 [21] | |||
| Anaerobic degradability | surplus sludge digestion | primary degradation | >99% | Göbel et al. 2005 [19] | ||
| Anaerobic biodegradability VDI 4630 | manure & anaerobic bacteria | primary degradation (LC/MS) | 2.8 mg/kg; 14 mg/kg | 34 day | 98.9% day 8; 99.9% day 9 | Mohring et al. 2009 [38] |
| Anaerobic degradation | pig slurry | rapid degradation | Grote et al. 2004 [39] | |||
| Sewater degradation | seawater | DT50 | 0.001 | >100 day | Benotti & Brownawell 2009 [41] | |
| Soil degradation | soil | DT50 | 110 day | Boxall et al. 2005 [13] | ||
| Soil dissipation | soil | DT50, DT90 | <103 day, >152 day | Boxall et al. 2006 [40] | ||
| Soil dissipation | aerobic, non-sterile | DT50 | 10 mg/kg | 4 day | Liu et al. 2010 [15] | |
| Soil dissipation | aerobic, sterile | DT50 | 10 mg/kg | 64 day | Liu et al. 2010 [15] | |
| Soil dissipation | anaerobic, non-sterile | DT50 | 10 mg/kg | 11 day | Liu et al. 2010 [15] | |
| Soil dissipation | anaerobic, sterile | DT50 | 10 mg/kg | 79 day | Liu et al. 2010 [15] | |
| Soil degradation | aerobic soil | percentage of loss attributed to biodegradation | 10 mg/kg | 49 day | ~28% | Liu et al. 2010 [15] |
| Soil degradation | anaerobic soil | percentage of loss attributed to biodegradation | 10 mg/kg | 49 day | ~56% | Liu et al. 2010 [15] |
| Soil degradation | aerobic soil | 40 µg/kg dry weight | t½ = 26.1 day | note: no significant anaerobic degradation, no degradation in sterilised soil, nor in another soil | Lin & Gan 2011 [16] | |
| Removal during soil passage | aerobic turfgrass soil, sampled at ~90 cm depth | substance loss during leaching | 91%–98% | Bondarenko et al. 2012 [78] |
| Bioaccumulation | Organism | Organ | Dosage | Duration | Result | Reference |
|---|---|---|---|---|---|---|
| Bioconcentration freshwater | fish, trout | autoradiographs | single oral dose | up to 144 h | maximum concentrations given as DPMs only reached at 12–24 h (15 °C) respectively 48 h (7 °C), then rapid decline in both cases | Bergsjø et al. 1979 [80] |
| Bioconcentration freshwater | fish, trout | liver, muscle, plasma | 84 h | ~0.16; ~0.04; ~0.01 | Bergsjø & Søgnen 1980 [9] | |
| Bioconcentration marine | fish, trout | liver, muscle, plasma, | 84 h | ~0.2–0.32; ~0.08–0.12; ~0.03–0.07 | Bergsjø & Søgnen 1980 [9] | |
| Bioconcentration aquatic | physico-chemical activity-modelled | higher predicted TMP concentration in biota at pH 6 than at pH 9 due to increase in sediment concentration at pH 9 | Trapp et al. 2010 [28] | |||
| Depuration marine | fish, Japanese seabass | muscle, blood,liver, kidney | 5 oral doses, one per day, of 125 mg sulfamethazine and 25 mg TMP | minimum holding period after last dose 26 days at 22 °C, 30 days at 16 °C | Fang et al. 2003 [81] | |
| Biomonitoring freshwater USA: 5 wastewater-influenced rivers, 1 pristine control | fish (various local species) | muscle, liver | not measured | permanent (wild fish) | ND (<2.2); ND (<8.0) LODs in ng/g | Ramirez et al. 2009 [82] |
| Biomonitoring freshwater Sweden: 4 wastewater-influenced rivers, 2 pristine controls | fish, perch | muscle | permanent (wild fish) | ND (<0.1 ng/g LOQ) | Fick et al. 2011 [60] | |
| Bioaccumulation plants | lettuce and carrots (Daucus carota) | lettuce leaf, carrot root | 1 mg/kg soil dry weight | 103 days lettuce, 152 days carrots | soil-based uptake factor lettuce 0.06, carrot 0.08; porewater-based uptake factor lettuce 0.68, carrot 0.86 | Boxall et al. 2006 [40] |
| Bioaccumulation plants | 2 cabbage cultivars | leaf/stem root | 232.5 µg/L hydroponic nutrient solution | 51 days | bioaccumulation factor 0.0383–0.3074 (wet weight), 0.0451–7.037 (dry weight) | Herklotz et al. 2010 [83] |
| Bioaccumulation plants | sweet maize, carrot, tomato, potato | field fertilised with dehydrated sewage sludge (biosolids) | equivocal/ NS | Sabourin et al. 2012 [84] |
| Organism/Sludge | Systematic Group | Endpoint | Duration | Value, mg/L | Reference |
|---|---|---|---|---|---|
| AS, OECD209 | EC50 | 17.8 | Halling-Sørensen et al. 2000 [18] | ||
| AS, OECD209 | EC50; EC20 | 3 h | >200; 19 | Oggier/BMG 2011, GLP [128] | |
| Anaerobic sludge inhibition ISO13641 | EC50 | 7 days | >100 | Gartiser et al. 2007 [21] | |
| Vibrio fischeri | bacteria, marine | IC50 | 15 min | 183.3 | Blaise et al. 2006 [129] |
| Vibrio fischeri ISO 11348–3 | bacteria, marine | IC50 | 15 min | 176.7 | Kim et al. 2007 [130] |
| Vibrio fischeri | bacteria, marine | IC50 | 30 min | 23.3 | Isidori et al. 2005 [131] |
| Human nanobacteria | bacteria | MIC | 14 days | 3.9 | Ciftcioglu et al. 2002 [132] |
| AS, OECD209 | bacteria | NOEC; EC10 | 3 h | 100; 0.435 | Oggier/BMG 2011, GLP [128] |
| AS in Closed Bottle ready biodegradation test OECD301D | bacteria | NOEC toxicity control | 3.25 mg/L TMP-naphthoate | Alexy et al. 2004 [29] | |
| AS in Closed Bottle ready biodegradation test OECD301D | bacteria | LOEC colony-forming units | 4.6 µg/L TMP-naphthoate | Alexy et al. 2004 [29] | |
| Pantoea agglomerans | soil bacterium | NOEC | 0.02 | Tappe et al. 2006 [133] | |
| Nitrification inhibition test | nitrifying bacteria | NOEC | 0.05 | Ghosh et al. 2009 [57] | |
| Nitrification inhibition test | nitrifying bacteria | NOEC; EC10 | 96; >96 | Oggier/BMG 2011, GLP [134] | |
| Fungal growth on fallen leaves | fungi | LOEC; NOEC | TMP together with 4 other antibiotics, all at same conc | 40 µg/L; 0.4 µg/L | Bundschuh et al. 2009 [30] |
| Natural soil respiration | all aerobic soil microorganisms | EC10 (0–4 days) | 20 mg/kg soil (dry weight) | Liu et al. 2009 [135] | |
| Natural soil respiration | all aerobic soil microorganisms | after 4 days consistent increase in respiration vs. controls in all concentrations up to the highest of 300 mg/kg soil | 300 mg/kg soil (dry weight) | Liu et al. 2009 [135] | |
| Natural soil | bacteria (colony-forming units) | NOEC/LOEC | 10 mg/kg | Liu et al. 2010 [15] |
| Organism | Systematic Group | Endpoint | Duration | Value, mg/L | Reference |
|---|---|---|---|---|---|
| Anabaena cylindrica | Cyanobacteria | EC50 | 6 days | >200 | Ando et al. 2007 [136] |
| Anabaena flos-aquae | Cyanobacteria | EC50 | 6 days | >200 | Ando et al. 2007 [136] |
| Anabaena variabilis | Cyanobacteria | EC50 | 6 days | 11 | Ando et al. 2007 [136] |
| Microcystis aeruginosa | Cyanobacteria | EC50 | 7 days | 112 | Holten Lützhøft et al. 1999 [138] |
| M. aeruginosa | Cyanobacteria | EC50 | 6 days | 150 | Ando et al. 2007 [136] |
| M. aeruginosa | Cyanobacteria | EC50 | 129.6 | geometrical average | |
| Microcystis wesenbergii | Cyanobacteria | EC50 | 6 days | >200 | Ando et al. 2007 [136] |
| Nostoc sp. PCC7120 | Cyanobacteria | EC50 | 6 days | 53 | Ando et al. 2007 [136] |
| Synechococcus leopoldensis | Cyanobacteria | EC50 | 6 days | >200 | Ando et al. 2007 [136] |
| Synechococcus sp. PCC7002 | Cyanobacteria | EC50 | 6 days | >200 | Ando et al. 2007 [136] |
| Rhodomonas salina ISO 8692 | Algae, marine | EC50 | 72 h | 16 | Holten Lützhøft et al. 1999 [138] |
| Phaeodactylum tricornutum | Algae, marine | EC50 | 72 h | 5.1 | Claessens et al. 2009 [137] |
| Pseudokirchneriella subcapitata (=Selenastrum capricornutum) | Algae | EC50 | 72 h | 40 | Yang et al. 2008 [139] |
| P. subcapitata | Algae | EC50 | 72 h | 80.3 | Eguchi et al. 2004 [140] |
| P. subcapitata | Algae | EC50 | 72 h | 96.7 | Blaise et al. 2006 [129] |
| P. subcapitata OECD 201 | Algae | ErC50 | 72 h | 98 | Bogers 1996a GLP [141] |
| P. subcapitata ISO 8692 | Algae | EC50 | 72 h | 110 | Halling-Sørensen et al. 2000 [18] |
| P. subcapitata | Algae | EC50 | 72 h | 130 | Holten Lützhøft et al. 1999 [138] |
| P. subcapitata | Algae | EC50 | 72 h | 87.1 | geometrical average |
| Lemna gibba | Angiospermae | EC50 | 7 days | >1 HTC | Brain et al. 2004 [142] |
| Lemna minor OECD 221 | Angiospermae | ErC50 | 7 days | 215 | this work, GLP, Oggier 2011 [143] |
| Hydra attenuata | Cnidaria | EC50 | 96 h | >85.3 | Blaise et al. 2006 [129] |
| H. attenuata | Cnidaria | EC50 | 96 h | >100 | Quinn et al. 2008a [144] |
| H. attenuata | Cnidaria | EC50 | 96 h | >92.4 | geometrical average |
| Brachionus koreanus | Rotatoria (brackish) | EC50 | 24 h | 198.5 | Rhee et al. 2012 [145] |
| Daphnia magna | Crustacea | EC50 | 48 h | 92 | Park & Choi 2008 [146] |
| D. magna OECD 202 | Crustacea | EC50 | 48 h | >100 HTC | Bogers 1996b GLP [147] |
| D. magna US EPA 600/4_90/027 | Crustacea | EC50 | 48 h | 123 | Halling-Sørensen et al. 2000 [18] |
| D. magna | Crustacea | EC50 | 48 h | 149 | De Liguoro et al. 2009 [148] |
| D. magna | Crustacea | EC50 | 48 h | 167.4 | Kim et al. 2007 [130] |
| D. magna | Crustacea | EC50 | 96 h | 296 | Iannacone & Alvariño 2009 [149] |
| D. magna | Crustacea | EC50 | 48 h | 142.4 | geometrical average |
| Moina macrocopa | Crustacea | EC50 | 48 h | 54.8 | Choi et al. 2008 [150] |
| Thamnocephalus platyurus | Crustacea | EC50 | 24 h | 161.2 | Blaise et al. 2006 [129] |
| Crassostrea gigas | Mollusca, marine | EC50 embryolarval | 24 h | ~31.6√(10×100) | Claessens et al. 2009 [137] |
| Danio rerio OECD 203 | Fish | NOEC | 72 h | 100 | Halling-Sørensen et al. 2000 [18] |
| D. rerio | Fish | NOEC | 96 h | 100 | Blaise et al. 2006 [129] |
| D. rerio | Fish | LC50 | 96 h | >100 | geometrical average |
| Oryzias latipes | Fish | LC50 | 96 h | >100 | Kim et al. 2007 [130] |
| Oncorhynchus mykiss | Fish | LC50 | 84 h | >75 HTC | Bergsjø & Søgnen 1980 [9] |
| O. mykiss | Fish | LC50 | 96 h | (3) note: miscitation, not a concentration but a dose | miscited in Kolpin et al. [124] |
| Organism | Systematic Group | Endpoint | Duration | Value, mg/L | Reference |
|---|---|---|---|---|---|
| Anabaena cylindrica | Cyanobacteria | NOEC | 6 days | ≥200 | Ando et al. 2007 [136] |
| Anabaena flos-aquae | Cyanobacteria | NOEC | 6 days | ≥200 | Ando et al. 2007 [136] |
| Anabaena variabilis | Cyanobacteria | NOEC | 6 days | 3.1 | Ando et al. 2007 [136] |
| Microcystis aeruginosa | Cyanobacteria | NOEC | 6 days | 100 | Ando et al. 2007 [136] |
| Microcystis wesenbergii | Cyanobacteria | NOEC | 6 days | 3.1 | Ando et al. 2007 [136] |
| Nostoc sp. PCC7120 | Cyanobacteria | NOEC | 6 days | 3.1 | Ando et al. 2007 [136] |
| Synechococcus leopoldensis | Cyanobacteria | NOEC | 6 days | 13 | Ando et al. 2007 [136] |
| Synechococcus sp. PCC7002 | Cyanobacteria | NOEC | 6 days | 50 | Ando et al. 2007 [136] |
| Phaeodactylum tricornutum | Diatom Algae, marine | NOEC | 72 h | 2.4 | Claessens et al. 2009 [137] |
| Pseudokirchneriella subcapitata (=Selenastrum capricornutum) | Green Algae | NOEC | 72 h | 16 | Yang et al. 2008 [139] |
| P. subcapitata | Green Algae | NOEC | 72 h | 25.5 | Eguchi et al. 2004 [140] |
| P. subcapitata | Green Algae | NOEC | 72 h | 32 | Bogers/NOTOX 1996a GLP [141] |
| P. subcapitata | Green Algae | NOEC | 72 h | 23.5 | geometrical average |
| Lemna gibba | Angiospermae | NOEC | 7 days | (>1 HTC) not used* | Brain et al. 2004 [142] |
| Lemna minor | Angiospermae | NOEC | 7 days | 53.5 | this work, GLP Oggier 2001 [143] |
| Hydra attenuata | Cnidaria | NOEC | 96 h | >100 | Quinn et al. 2008a [144] |
| H. attenuata | Cnidaria | NOEC | 96 h | 25 | Quinn et al. 2008b [151] |
| H. attenuata | Cnidaria | NOEC | 96 h | >50 | geometrical average |
| Brachionus koreanus | Rotatoria (brackish) | NOEC/LOEC | 10 days | (0.01/0.1) not used* | Rhee et al. 2012 [145] |
| Daphnia magna | Crustacea | NOEC | 21 days | 6 | Park & Choi 2008 [146] |
| Daphnia magna | Crustacea | NOEC | 6 days | (0.01) not used* | Flaherty & Dodson 2005 [152] |
| Moina macrocopa | Crustacea | NOEC | 21 days | ≥30 HTC | Park & Choi 2008 [146] |
| Danio rerio | Fish | NOEC | 35 days | 100HTC | this work, GLP, Gilberg & Hamberger 2011 [153] |
| Xenopus laevis | Amphibia | EC10 | 96 h | ≥100 | Richards & Cole 2006 [154] |
References and Notes
- Straub, J.O.; Hutchinson, T.H. Environmental Risk Assessment for Human Pharmaceuticals: The Current State of International Regulations. In Human Pharmaceuticals in the Environment: Current and Future Perspectives. Emerging Topics in Ecotoxicology 4; Brooks, B.W., Huggett, D.B., Eds.; Springer: New York, NY, USA, 2012; pp. 17–48. [Google Scholar]
- Roche Safety Data Sheet Trimethoprim, version 02.11.2011; F. Hoffmann-La Roche Ltd: Basle, Switzerland, 2011. Available online: http://www.roche.com/responsibility/environment/ safety_data_sheets/ safety_data_sheets-row.htm (accessed on 25 February 2013).
- Clarke’s Analysis of Drugs and Poisons. Subscription online version. Available online: https://www. medicinescomplete.com/mc/login.htm (accessed on 12 March 2013).
- WHO Collaborating Centre for Drug Statistics Methodology. ATC/DDD Codes. Norwegian Institute of Public Health: Oslo, Norway. Available online: http://www.whocc.no/atc_ddd_index/ (accessed on 12 March 2013).
- Gros, M.; Petrović, M.; Barceló, D. Development of a multi-residue analytical methodology based on liquid chromatography-tandem mass spectrometry (LC-MS/MS) for screening and trace level determination of pharmaceuticals in surface and wastewaters. Talanta 2006, 70, 678–690. [Google Scholar] [CrossRef]
- PhysProp open access online database. Available online: http://www.syrres.com/what-we-do/databaseforms.aspx?id=386 (accessed on 12 March 2013).
- Chen, X.-Q.; Cho, S.J.; Li, Y.; Venkatesh, S. Prediction of aqueous solubility of organic compounds using a QSPR. J. Pharm. Sci. 2002, 91, 1838–1852. [Google Scholar] [CrossRef]
- Ran, Y.; He, Y.; Yang, G.; Johnson, J.L.H.; Yalkowsy, S.H. Estimation of aqueous solubility of organic compounds by using the general solubility equation. Chemosphere 2002, 48, 487–509. [Google Scholar] [CrossRef]
- Bergsjø, T.; Søgnen, E. Plasma and tissue levels of trimethoprim in the rainbow trout, Salmo gairdneri, after absorption from fresh and salt water. Acta Vet. Scand. 1980, 21, 18–25. [Google Scholar]
- Qiang, Z.; Adams, C. Potentiometric determination of acid dissociation constants (pKa) for human and veterinary antibiotics. Water Res. 2004, 38, 2874–2890. [Google Scholar] [CrossRef]
- Zhu, C.; Jiang, L.; Chen, T.-M.; Hwang, K.-K. A comparative study of artificial membrane permeability assay for high throughput profiling of drug absorption potential. Eur. J. Med. Chem. 2002, 37, 399–407. [Google Scholar] [CrossRef]
- Zhao, Y.; Jona, J.; Chow, D.T.; Rong, H.; Semin, D.; Xia, X.; Zanon, R.; Spancake, C.; Maliski, E. High-throughput logP measurement using parallel liquid chromatography/ultraviolet/mass spectrometry and sample pooling. Rapid Commun. Mass Spectrom. 2002, 16, 1548–1555. [Google Scholar] [CrossRef]
- Boxall, A.B.A.; Fogg, L.A.; Baird, D.J.; Lewis, C.; Telfer, T.C.; Kolpin, D.; Gravell, A.; Pemberton, E.; Boucard, T. Targeted Monitoring Study for Veterinary Medicines in the Environment; Science Report: SC030183/SR; UK Environment Agency: Bristol, UK, 2005. Available online: http://www.environment-agency.gov.uk (accessed on 12 March 2013).
- Barron, L.; Havel, J.; Purcell, M.; Szpak, M.; Kelleher, B.; Paull, B. Predicting sorption of pharmaceuticals and personal care products onto soil and digested sludge using artificial networks. Analyst 2009, 134, 663–670. [Google Scholar] [CrossRef]
- Liu, F.; Ying, G.-G.; Yang, J.-F.; Zhou, L.-J.; Tao, R.; Wang, L.; Zhang, L.-J.; Peng, P.-A. Dissipation of sulfamethoxazole, trimethoprim and tylosin in a soil under aerobic and anoxic conditions. Environ. Chem. 2010, 7, 370–376. [Google Scholar] [CrossRef]
- Lin, K.; Gan, J. Sorption and degradation of wastewater-associated non-steroidal anti-inflammatory drugs and antibiotics in soil. Chemosphere 2011, 83, 240–246. [Google Scholar] [CrossRef]
- Franco, A.; Trapp, S. A multimedia activity model for ionisable compounds: Validation study with2,4-dichlorophenoxyacetic acid, aniline and trimethoprim. Environ. Sci. Technol. 2010, 29, 789–799. [Google Scholar]
- Halling-Sørensen, B. ERA of antibiotics: Comparison of mecillinam, trimethoprim and ciprofloxacin. J. Antimicrob. Chemother. 2000, 46, 53–58. [Google Scholar] [CrossRef]
- Göbel, A.; Thomsen, A.; McArdell, C.S.; Joss, A.; Giger, W. Occurrence and sorption behavior of sulfonamides, macrolides and trimethoprim in activated sludge treatment. Environ. Sci. Technol. 2005, 39, 3981–3989. [Google Scholar] [CrossRef]
- McArdell, C.S.; Joss, A.; Alder, A.C.; Felis, E.; Giger, W.; Göbel, A.; Löffler, D.; Siegrist, H.; Zabczynski, S.; Ternes, T.A. Sorption of pharmaceuticals and personal care products to activated sludge. In Poster of the SETAC Europe 15th Annual Meeting, Lille, France, May 2005.
- Gartiser, S.; Urich, E.; Alexy, R.; Kümmerer, K. Anaerobic inhibition and degradation of antibiotics in ISO test schemes. Chemosphere 2007, 66, 1839–1848. [Google Scholar] [CrossRef]
- Abegglen, C.; Joss, A.; McArdell, C.S.; Fink, G.; Schlüsener, M.P.; Ternes, T.A.; Siegrist, H. The fate of selected micropollutants in a single-house MBR. Water Res. 2009, 43, 2036–2046. [Google Scholar] [CrossRef]
- Radjenovic, J.; Petrovic, M.; Barceló, D. Fate and distribution of pharmaceuticals in wastewater and sewage sludge of the conventional activated sludge (CAS) and advances membrane bioreactor (MBR) treatment. Water Res. 2009, 43, 831–841. [Google Scholar] [CrossRef]
- Power, E.; Quinn, B.; Brett, P.; Barron, L. Transport of pharmaceutical residues to the soil environment following biosolid enrichment. In Poster of the SETAC Europe 19th Annual Meeting, Göteborg, Sweden, 31 May to 4 June 2009.
- Batt, A.L.; Kim, S.; Aga, D.S. Enhanced biodegradation of iopromide and trimethoprim in nitrifying activated sludge. Environ. Sci. Technol. 2006, 40, 7367–7373. [Google Scholar] [CrossRef]
- Göbel, A.; McArdell, C.S.; Joss, A.; Siegrist, H.; Giger, W. Fate of sulfonamides, macrolides, and trimethoprim in different wastewater treatment technologies. Sci. Total Environ. 2007, 372, 361–371. [Google Scholar] [CrossRef]
- Martín, J.; Camacho-Muñoz, M.D.; Santos, J.L.; Aparicio, I.; Alonso, E. Distribution and temporal evolution of pharmaceutically active compounds alongside sewage sludge treatment. Risk assessment of sludge application onto soils. J. Environ. Manag. 2012, 102, 18–25. [Google Scholar] [CrossRef]
- Trapp, S.; Franco, A.; Mackay, D. Activity-based concept for transport and partitioning of ionising organcis. Environ. Sci. Technol. 2010, 44, 6123–6129. [Google Scholar] [CrossRef]
- Alexy, R.; Kümpel, T.; Kümmerer, K. Assessment of degradation of 18 antibiotics in the Closed Bottle test. Chemosphere 2004, 57, 505–512. [Google Scholar] [CrossRef]
- Bundschuh, M.; Hahn, T.; Gessner, M.O.; Schulz, R. Antibiotics as a chemical stressor affecting an aquatic decomposer-detritivore system. Environ. Sci. Technol. 2009, 28, 197–203. [Google Scholar]
- Gröner, J. Biochemische Abbaubarkeit verschiedener Substanzen. Interner Bericht TSU/BWL. F.Hoffmann-La Roche AG: Basel, Switzerland, 16 November 1981. [Google Scholar]
- Junker, T.; Alexy, R.; Knacker, T.; Kümmerer, K. Biodegradability of 14C-labeled antibiotics in a modified laboratory scale sewage treatment plant at environmentally relevant concentrations. Environ. Sci. Technol. 2006, 40, 318–324. [Google Scholar] [CrossRef]
- Yu, T.-H.; Lin, A. Y.-C.; Lateef, S.K.; Lin, C.-F.; Yang, P.-Y. Removal of antibiotics and non-steroidal anti-inflammatory drugs by extended sludge age biological process. Chemosphere 2009, 77, 175–181. [Google Scholar] [CrossRef]
- Pérez, S.; Eichhorn, P.; Aga, D.S. Evaluating the biodegradability of sulfamethazine, sulfamethoxazole, sulfathiazole and trimethoprim at different stages of sewage treatment. Environ. Sci. Technol. 2005, 24, 1361–1367. [Google Scholar]
- Schröder, H.F.; Tambosi, J.L.; Sena, R.F.; Moreira, R.F.P.M.; José, H.J.; Pinnekamp, J. The removal and degradation of pharmaceutical compounds during membrane bioreactor treatment. Water Sci. Technol. 2012, 65, 833–839. [Google Scholar] [CrossRef]
- Löffler, D.; Ternes, T.A. Determination of acidic pharmaceuticals, antibiotics and ivermectin in river sediment using liquid chromatography-tandem mass spectrometry. J. Chromatogr. A 2003, 1021, 133–144. [Google Scholar] [CrossRef]
- Schmidt, C.K.; Brauch, H.-J.; Jekel, M. Die Entfernbarkeit polarer Spurenstoffe in der Trinkwasseraufbereitung. In Proceedings of WASSER Berlin, Berlin, Germany, 3–7 April, 2006; Wasserchemische Gesellschaft: Berlin, Germany, 2006. [Google Scholar]
- Mohring, S.A.I.; Strzysch, I.; Reis Fernandes, M.; Kiffmeyer, T.; Tuerk, J.; Hamscher, G. Degradation and elimination of various sulfonamides during anaerobic fermentation: A promising step on the way to sustainable pharmacy? Environ. Sci. Technol. 2009, 43, 2569–2574. [Google Scholar] [CrossRef]
- Grote, A.; Vockel, A.; Schwarze, D.; Mehlich, A.; Freitag, M. Fate of antibiotics in food chain and environment originating from pig fattening (part 1). Fresenius Environ. Bull. 2004, 13, 1216–1224. [Google Scholar]
- Boxall, A.B.A.; Johnson, P.; Smith, E.J.; Sinclair, C.J.; Stutt, E.; Levy, L.S. Uptake of veterinary medicines from soils into plants. J. Agric. Food Chem. 2006, 54, 2288–2297. [Google Scholar]
- Benotti, M.J.; Brownawell, B.J. Microbial degradation of pharmaceuticals in estuarine and coastal seawater. Environ. Pollut. 2009, 157, 994–1002. [Google Scholar] [CrossRef]
- Ternes, T.A.; Hirsch, R.W.; Stumpf, M.; Eggert, T.; Schuppert, B.F.; Haberer, K. Nachweis und Screening von Arzneimittelrückständen,Diagnostika und Antiseptika in der aquatischen Umwelt; ESWE-Institut für Wasserforschung und Wassertechnologie GmbH: Wiesbaden, Germany, 1999. [Google Scholar]
- Paxéus, N.A. Removal of selected non-steroidal anti-inflammatory drugs (NSAIDs), gemfobrozil, carbamazepine, beta-blockers, trimethoprim and triclosan in conventional wastewater treatment plants in five EU countries and their discharge to the aquatic environment. Water Sci. Technol. 2004, 50, 253–260. [Google Scholar]
- Bendz, D.; Paxéus, N.A.; Ginn, T.R.; Loge, F.J. Occurrence and fate of pharmaceutically active compounds in the environment, a case study: Höje River in Sweden. J. Hazard. Mater. 2005, 122, 195–204. [Google Scholar] [CrossRef]
- Lindberg, R.H.; Wennberg, P.; Johansson, M.I.; Tysklind, M.; Andersson, B.A.V. Screening of human antibiotic substances and determination of weekly mass flows in five sewage treatment plants in Sweden. Environ. Sci. Technol. 2005, 39, 3421–3429. [Google Scholar] [CrossRef]
- Lindberg, R.H.; Olofsson, U.; Rendahl, P.; Johansson, M.I.; Tysklind, M.; Andersson, B.A.V. Behavior of fluoroquinolones and trimethoprim during mechanical, chemical and active sludge treatment of sewage water and digestion of sludge. Environ. Sci. Technol. 2006, 40, 1042–1048. [Google Scholar] [CrossRef]
- Paffoni, C.; Welte, B.; Gousailles, M.; Montiel, A. Nouvelles molécules mises en cause par les directives européennes: de la station d'épuration à l'usine de traitement d'eau potable. Eur. J. Water Qual. 2006, 37, 21–38. [Google Scholar]
- Gros, M.; Petrović, M.; Barceló, D. Wastewater treatment plants as a pathway for aquatic contamination by pharmaceuticals in the Ebro River basin (Northeast Spain). Environ. Sci. Technol. 2007, 26, 1553–1562. [Google Scholar]
- Senta, I.; Terzić, S.; Ahel, M. Simultaneous determination of sulfonamides, fluoroquinolones, macrolides and trimpethoprim in wastewater and river water by LC-tandem-MS. Chromatographia 2008, 68, 747–758. [Google Scholar] [CrossRef]
- Kasprzyk-Hordern, B.; Dinsdale, R.M.; Guwy, A.L. The removal of pharmaceuticals, personal care products, endocrine disruptors and illicit drugs during wastewater treatment and its impact on the quality of receiving waters. Water Res. 2009, 43, 363–380. [Google Scholar] [CrossRef]
- Segura, P.A.; Lajeunesse, A.; Gagnon, C.; Sauvé, S. Anti-infectives in urban wastewater effluents in the province of Québec (Canada). In Poster of the 16th SETAC Europe Annual Conference, Hague, The Netherlands, 7–11 May 2005.
- Brown, K.D.; Kulis, J.; Thomson, B.; Chapman, T.H.; Mawhinney, D.B. Occurrence of antibiotics in hospital, residential and dairy effluent, municipal wastewater and the Rio Grande in New Mexikco. Sci. Total Environ. 2006, 366, 772–783. [Google Scholar] [CrossRef]
- Karthikeyan, K.G.; Meyer, M.T. Occurrence of antibiotics in wastewater treatment facilities in Wisconsin, USA. Sci. Total Environ. 2006, 361, 196–207. [Google Scholar] [CrossRef]
- Levine, A.D.; Meyer, M.T.; Kish, G. Evaluation of the persistence of micropollutants through pure-oxygen activated sludge nitrification and denitrification. Water Environ. Res. 2006, 78, 2276–2285. [Google Scholar] [CrossRef]
- Batt, A.L.; Kim, S.; Aga, D.S. Comparison of the occurrence of antibiotics in four full-scale wastewater treamtent plants with varying designs and operations. Chemosphere 2007, 68, 428–435. [Google Scholar] [CrossRef]
- Watkinson, A.J.; Murby, E.J.; Costanzo, S.D. Removal of antibiotics in conventional and advanced wastewater treatment: Implications for environmental discharge and wastewater recycling. Water Res. 2007, 41, 4164–4176. [Google Scholar] [CrossRef]
- Ghosh, G.C.; Okuda, T.; Yamashita, N.; Tanaka, H. Occurrence and elimination of antibiotics at four sewage treatment plants in Japan and their effects on bacterial ammonia oxidation. Water Sci. Technol. 2009, 59, 779–786. [Google Scholar] [CrossRef]
- Gulkowska, A.; Leung, H.W.; So, M.K.; Taniyasu, S.; Yamashita, N.; Yeung, L.W.Y.; Richardson, B.J.; Lei, A.P.; Giesy, J.P.; Lam, P.K.S. Removal of antibiotics from wastewater by sewage treatment facilities in Hong Kong and Shenzhen, China. Water Res. 2008, 42, 395–403. [Google Scholar] [CrossRef]
- Plósz, B.G.; Leknes, H.; Liltved, H.; Thomas, K.V. Diurnal variations in the occurrence and the fate of hormones and antibiotics in activated sludge wastewater treatment in Oslo, Norway. Sci. Total Environ. 2010, 408, 1915–1924. [Google Scholar] [CrossRef]
- Fick, J.; Lindberg, R.H.; Kaj, L.; Brorström-Lundén, E. Results from the Swedish National Screening Programme 2010, Subreport 3, Pharmaceuticals, B2014. Swedish Environmental Research Institute (IVL): Stockholm, Sweden, 2011. Available online: http://www.ivl.se (accessed on 12 March 2013).
- Lacey, C.; Basha, S.; Morrissey, A.; Tobin, J.M. Occurrence of pharmaceutical compounds in wastewater process streams in Dublin, Ireland. Environ. Monit. Assess. 2012, 184, 1049–1062. [Google Scholar] [CrossRef]
- Leung, H.W.; Minh, T.B.; Murphy, M.B.; Lam, J.C.W.; So, M.K.; Martin, M.; Lam, P.K.S.; Richardson, B.J. Distribution, fate and risk assessment of antibiotics in sewage treatment plants in Hong Kong, South China. Environ. Int. 2012, 24, 1–9. [Google Scholar]
- Lin, A.Y.-C.; Tsai, Y.-T.; Yu, T.-H.; Wang, X.-H.; Lin, C.-F. Occurrence and fate of pharmaceuticals and personal care products in Taiwan’s aquatic environment. Desalin. Water Treat. 2012, 32, 57–64. [Google Scholar]
- Verlicchi, P.; Al Aukidy, M.; Galletti, A.; Petrovič, M.; Barceló, D. Hospital effluent: Investigation of the concentrations and distribution of pharmaceuticals and environmental risk assessment. Sci. Total Environ. 2012, 430, 109–118. [Google Scholar]
- Lam, M.W.; Young, C.J.; Brain, R.A.; Johnson, D.J.; Hanson, M.A.; Wilson, C.J.; Richards, S.M.; Solomon, K.R.; Mabury, S.A. Aquatic persistence of eight pharmaceuticals in a microcosm study. Environ. Sci. Technol. 2004, 23, 1431–1440. [Google Scholar]
- Michael, I.; Hapeshi, E.; Osorio, V.; Perez, S.; Petrovič, M.; Zapata, A.; Malato, S.; Barceló, D.; Fatta-Kassinos, D. Solar photocatalytic treatment of trimethoprim in four environmental matrices at a pilot scale: Transformation products and ecotoxicity evaluation. Sci. Total Environ. 2012, 430, 167–173. [Google Scholar] [CrossRef]
- Boxall, A.B.A.; Fogg, L.; Blackwell, P.A.; Kay, P.; Pemberton, E.J. Review of Veterinary Medicines in the Environment. R&D Technical Report P6–012/8/TR. Environment Agency: Bristol, UK, 2002; p. 187. Available online: http://a0768b4a8a31e106d8b0-50dc802554eb38a 24458b98ff72d550b.r19.cf3.rackcdn.com/sp6-012-8-tr-e-e.pdf (accessed on 12 March 2013).
- Boxall, A.B.A.; Fogg, L.A.; Blackwell, P.A.; Kay, P.; Pemberton, E.J.; Croxford, A. Veterinary medicines in the environment. Rev. Environ. Contam. Toxicol. 2004, 180, 1–91. [Google Scholar] [CrossRef]
- Lunestad, B.T.; Samuelsen, O.B.; Fjelde, S.; Ervik, A. Photostability of 8 antibacterial agents in seawater. Aquaculture 1995, 134, 217–225. [Google Scholar] [CrossRef]
- Türk, J. Entwicklung und Anwendung von LC-MS/MS Multimethoden zur Bestimmung von Antibiotika und Zytostatika bei Arbeitsschutz- und Umweltuntersuchungen. Ph.D. Thesis; Universität Duisburg-Essen: Germany, 2007. Available online: http://duepublico.uni-duisburg-essen.de/servlets/DerivateServlet/Derivate-17529/Tuerk_Dissertation_070831.pdf (accessed on 12 March 2013).
- Rosario-Ortiz, F.; Wert, E.C.; Snyder, S.A. Evaluation of UV/H2O2 treatment for the oxidation of pharmaceuticals in wastewater. Water Res. 2010, 44, 1440–1448. [Google Scholar] [CrossRef]
- Wu, Y.; Chen, D.-H.; Kookana, R. Aqueous photodegradation of selected antibiotics under different conditions. Energy Procedia 2011, 11, 2098–2103. [Google Scholar] [CrossRef]
- Zuccato, E.; Bagnati, R.; Fioretti, F.; Natangelo, M.; Calamari, D.; Fanelli, R. Environmental loads and detection of pharmaceuticals in Italy. In Pharmaceuticals in the Environment; Kümmerer, K., Ed.; Springer: Berlin, Germany, 2001; pp. 19–27. [Google Scholar]
- Hektoen, H.; Berge, J.A.; Hormabazal, V.; Ydnestad, M. Persistence of antiobacterial agents in marine sediments. Aquaculture 1995, 133, 175–184. [Google Scholar] [CrossRef]
- Möhle, E.; Metzger, J.W. Drugs in Municipal Sewage Effluents: Screening and Biodegradation Studies. In Pharmaceuticals and Personal Care Products in the Environment; Scientific and Regulatory Issues, ACS Symposium Series 791; Daughton, C.G., Jones-Lepp, T.L., Eds.; American Chemical Society: Washington, DC, USA, 2001; pp. 192–205. [Google Scholar]
- Le-Minh, N.; Khan, S.J.; Drewes, J.E.; Stuetz, R.M. Fate of antibiotics during municipal water recycling treatment processes. Water Res. 2010, 44, 4295–4323. [Google Scholar] [CrossRef]
- Toot-Levy, E.; Foley, F.; Chapman Smith, J.; Granlund, K. Nothing to fear. Screening assessment heps Ohio utility put the risks of pharmaceuticals and personal care products in perspective. Water Environ. Technol. 2011, 23, 40–45. [Google Scholar]
- Bondarenko, S.; Gan, J.; Ernst, F.; Green, R.; Baird, J.; McCullough, M. Leaching of pharmaceuticals and personal care products in trufgrass soils during recycled water irrigation. J. Environ. Quality 2012, 41, 1268–1274. [Google Scholar] [CrossRef]
- European Commission. Technical Guidance Document on Risk Assessment in Support of Commission Directive 93/67/EEC on Risk Assessment for New Notified Substances, Commission Regulation (EC) No 1488/94 on Risk Assessment for Existing Substances, Directive 98/8/EC of the European Parliament and of the Council concerning the Placing of Biocidal Products on the Market. European Union: Brussels, Belgium, 2003. Available online: http://ihcp.jrc.ec.europa.eu/our_activities/health-env/risk_assessment_of_Biocides/doc/tgd/ (accessed on 12 March 2013).
- Bergsjø, T.; Nafstad, I.; Ingebrigtsen, K. The distribution of 35S-sulfadiazine and 14C-trimethoprim in rainbow trout, Salmo gairdneri. Acta Vet. Scand. 1979, 20, 25–37. [Google Scholar]
- Fang, X.-X.; Li, J.; Wang, Q.; Liu, X.-H. Residual characteristics of sulfamethoxazole and trimethoprim in Lateolabrax japonicus at different water temperature. (in Chinese with English abstract). Marine Sci. 2003, 27, 16–20. [Google Scholar]
- Ramirez, A.J.; Brain, R.A.; Usenko, S.; Mottaleb, M.A.; O'Donnell, J.G.; Stahl, L.L.; Wathen, J.B.; Snyder, B.D.; Pitt, J.L.; Perez-Hurtado, P.; et al. Occurrence of pharmaceuticals and personal care products in fish: Results of a national pilot study in the United States. Environ. Sci. Technol. 2009, 28, 2587–2597. [Google Scholar]
- Herklotz, P.A.; Gurung, P.; Vanden Heuvel, B.; Kinney, C.A. Uptake of human pharmaceuticals by plants grown under hydroponic conditions. Chemosphere 2010, 78, 1416–1421. [Google Scholar] [CrossRef]
- Sabourin, L.; Duenk, P.; Bonte-Gelok, S.; Payne, M.; Lapen, D.R.; Topp, E. Uptake of pharmaceuticals, hormones and parabens into vegetables grown in soil fertilised with municipal biosolids. Sci. Total Environ. 2012, 431, 233–236. [Google Scholar] [CrossRef]
- Ternes, T. Personal Communication. German Federal Institute for Water Research (BAfG): Koblenz, Germany, 2011. [Google Scholar]
- Note for Guidance on Environmental Risk Assessment of Medicinal Products for Human Use. CPMP/SWP/4447/00 corr 1. European Medicines Agency: London, UK, 2006. Available online: http://www.ema.europa.eu/docs/en_GB/document_library/Scientific_guideline/2009/10/WC500003978.pdf (accessed on 12 March 2013).
- IMSHealth/IMSMIDASSubscription online database for API use. Copyright IMS Health. TMP data downloaded on 18 January 2012.
- Eurostat. Population in Europe 2000–2011. European Statistics Office: Brussels, Belgium, 2012. Available online: http://epp.eurostat.ec.europa.eu/tgm/download.do?tab=table&plugin=1&language =en&pcode=tps0000 (accessed on 17 January 2012).
- ter Laak, T.; van der Aa, M.; Houtman, C.; Stoks, P.; van Wezel, A. RIWA. Temporal and spatial trends of pharmaceuticals in the Rhine. Rhine Water Works: Nieuwegein, The Netherlands, 2010. Available online: http://www.riwa.org (accessed on 12 March 2013).
- Hirsch, R.; Ternes, T.; Haberer, K.; Kratz, K.-L. Occurrence of antibiotics in the aquatic environment. Sci. Total Environ. 1999, 225, 109–118. [Google Scholar] [CrossRef]
- Sacher, F.; Gabriel, S.; Metzinger, M.; Stretz, A.; Wenz, M.; Lange, F.; Brauch, H.-J.; Blankenhorn, I. Arzneimittelwirkstoffe im Grundwasser – Ergebnisse eines Monitoring-Programms in Baden-Württemberg. Vom Wasser 2002, 99, 183–196. [Google Scholar]
- AGRE (Arbeitsgemeinschaft für die Reinhaltung der Elbe), Arzneistoffe in Elbe und Saale; Ministerium für Landwirtschaft, Umweltschutz und Raumordnung des Landes Brandenburg: Potsdam, Germany, 2002.
- BLAC (Bund/Länderausschuss für Chemikaliensicherheit), Arzneimittel in der Umwelt. Auswertung der Untersuchungsergebnisse. Bericht an die 61. Umweltministerkonferenz (UMK) am 19./20. November 2003 in Hamburg; Freie und Hansestadt Hamburg, Behörde für Umwelt und Gesundheit, Institut für Hygiene und Umwelt: Hamburg, Germany, 2003.
- Christian, T.; Schneider, R.J.; Färber, H.A.; Skutlarek, D.; Meyer, M.T.; Goldbach, H.E. Determination of antibiotic residues in manure, soil and surface waters. Acta Hydrochim. Hydrobiol. 2003, 31, 36–44. [Google Scholar] [CrossRef]
- Christian, T. Antibiotika in Oberflächengewässern Nordrhein-Westfalens – Herkunft, Eintrag, Verbleib und Relevanz. Ph.D. Thesis; Rheinische Friedrich-Wilhelms-Universität: Bonn, Germany, 2004. Available online: http://hss.ulb.uni-bonn.de/2004/0476/0476.htm (accessed on 12 March 2013).
- Wiegel, S.; Aulinger, A.; Brockmeyer, R.; Harms, H.; Löffler, J.; Reincke, H.; Schmidt, R.; Stachel, B.; von Trümpling, W.; Wanke, A. Pharmaceuticals in the river Elbe and its tributaries. Chemosphere 2004, 57, 107–126. [Google Scholar] [CrossRef]
- LANUV (Landesamt für Natur, Umwelt und Verbraucherschutz Nordrhein-Westfalen). Eintrag von Arzneimitteln und deren Verhalten und Verbleib in der Umwelt – Literaturstudie. LANUV-Fachbericht 2; Landesamt für Natur, Umwelt und Verbraucherschutz Nordrhein-Westfalen: Recklinghausen, Germany, 2007. Available online: http://www.lanuv.nrw.de/veroeffentlichungen/ lanuv/vls.htm (accessed on 12 March 2013).
- Skutlarek, D. Analysenmethoden für Antibiotika und perfluorierte Tenside in wässrigen Matrizes mittels LC-MS/MS nach SPE-Anreicherung – Methodenentwicklung, Methodenvalidierung, Datenerhebung. Ph.D. Thesis; Ruprecht-Karls-Universität: Heidelberg, Germany, 2008. Available online: archiv.ub.uni-heidelberg.de/volltextserver/volltexte/2008/8922/pdf/Dissertation_Skutlarek_ Dirk_2008.pdf (accessed on 12 March 2013).
- HLUG (Hessisches Landesamt für Umwelt und Gesundheit). Arzneimittel in nordhessischen Fließgewässern 2007/2008/2009 und 2010; HLUG: Frankfurt, Germany, 2010. Available online: http://www.hlug.de/start/wasser/fliessgewaesser-chemie/spurenstoffe/arzneimittel.html (accessed on 12 March 2013).
- HLUG (Hessisches Landesamt für Umwelt und Gesundheit). Arzneimittel in südhessischen Fließgewässern 2007/2008/2009 und 2010; HLUG: Frankfurt, Germany, 2010. Available online: http://www.hlug.de/start/wasser/fliessgewaesser-chemie/spurenstoffe/arzneimittel.html (accessed on 12 March 2013).
- Lehmann, M. Messprogramme zu Arzneimitteln in Fließgewässern Baden-Württembergs. Presented at UBA-Workshop Monitoring Arzneimittel, Umweltbundesamt Dessau, Germany, 14–15 September 2011; Available online: http://www.umweltbundesamt.de/chemikalien/ arzneimittel/workshop_monitoring_arzneimittel.htm (accessed 12 March 2013).
- Skark, C. Monitoring von Arzneimitteln und organischen Spurenstoffen in der Ruhr. Presented at UBA-Workshop Monitoring Arzneimittel, Umweltbundesamt Dessau, Germany, 14–15 September 2011; Available online: http://www.umweltbundesamt.de/chemikalien/arzneimittel/ workshop_monitoring_arzneimittel.htm (accessed 12 March 2013).
- Triebskorn, R.; Hetzenauer, H. Mikroverunreinigungen in den drei Bodenseezuflüssen Argen, Schussen und Seefelder Aach – eine Literaturstudie. Environ. Sci. Eur. 2012, 24. Available online: http://www.enveurope.com/content/24/1/8 (accessed on 12 March 2013). [CrossRef]
- Tamtam, F.; Mercier, F.; Le Bot, B.; Eurin, J.; Dinh, Q.C.; Clément, M.; Chevreuil, M. Occurrence and fate of antibiotics in the Seine River in various hydrological conditions. Sci. Total Environ. 2008, 393, 84–95. [Google Scholar] [CrossRef]
- RIWA Rhein. Jahresbericht Rhein 2004–2010; RIWA-Rhein, Verband der Flusswasserwerke: Nieuwegein, The Netherlands, 2004–2010. Available online: http://www.riwa.org (accessed on 12 March 2013).
- van Mill, G.M.J.; Verhoeven, B.M.; Rijs, G.B.J./RIZA. Monitoring geneesmiddelen en oestrogenen 2005; Waterschap Aa en Maas & Rijksinstituut voor Integraal Zoetwaterbeheer en Afvalwaterbehandeling (RIZA): Amsterdam, The Netherlands, 2006. [Google Scholar]
- Muñoz, I.; López-Doval, J.C.; Ricart, M.; Villagrasa, M.; Brix, R.; Geiszinger, A.; Ginebreda, A.; Guasch, H.; López de Alda, M.; Romain, A.M.; et al. Bridging levels of pharmaceuticals in river water with biological community structure in the Llobregat river basin (northeast Spain). Environ. Chem. Toxicol. 2009, 28, 2706–2714. [Google Scholar] [CrossRef]
- Fernández, C.; González-Doncel, M.; Pro, J.; Carbonell, G.; Tarazona, J.V. Occurrence of pharmaceutically active compounds in surface waters of the Henare-Jarama-Tajo river system (Madrid, Spain) and a potential risk characterisation. Sci. Total Environ. 2009, 408, 543–551. [Google Scholar]
- Valcárcel, Y.; González Alonso, S.; Rodríguez-Gil, J.L.; Gil, A.; Catalá, M. Detection of pharmaceutically active compounds in the rivers and tap water of the Madrid Region (Spain) and potential ecotoxicological risk. Chemosphere 2011, 84, 1336–1348. [Google Scholar] [CrossRef]
- López-Serna, R.; Postigo, C.; Blanco, J.; Pérez, S.; Ginebreda, A.; López de Alda, M.; Petrović, M.; Munné, A.; Barceló, D. Assessing the effects of tertiary treated wastewater reuse on the presence emerging contaminants in a Mediterranean river (Llobregat, NE Spain), Supporting Information. Environ. Sci. Pollut. Res. 2012, 19, 1000–1012. [Google Scholar] [CrossRef]
- Khalaf, H.; Salste, L.; Karlsson, P.; Ivarsson, P.; Jass, J.; Olsson, P.-E. In vitro analysis of inflammatory responses following environmental exposure to pharmaceuticals and inland waters. Sci. Total Environ. 2009, 407, 1452–1460. [Google Scholar] [CrossRef]
- Alder, A.C.; McArdell, C.S.; Giger, W.; Golet, E.M.; Molnar, E.; Nipales, N.S. Determination of Antibiotics in Swiss Wastewater and in Surface Water. In Presented at the CIWEM East Anglian Region Conference on Antibiotics in the Environment, Cambridge, UK, 2 February 2000; Environment Agency: Bristol, UK, 2000. [Google Scholar]
- Blüm, W.; McArdell, C.S.; Hoehn, E.; Schaubhut, R.; Labhart, W.; Bertschi, S. Organische Spurenstoffe im Grundwasser des Limmattales – Ergebnisse der Untersuchungskampagne 2004. In Zusammenarbeit mit EAWAG; Baudirektion Kanton Zürich, AWEL Amt für Abfall, Wasser, Energie und Luft: Zürich, Switzerland, 2005. [Google Scholar]
- SG/AR/TG/GL, Fliessgewässerüberwachung 2005: Bestimmung von Hormonen und Arzneimittelwirkstoffen in Fliessgewässern der Kantone SG, AR, TG und GL im Auftrag der Kantone. DVGW-Technologiezentrum Wasser (TZW): Karlsruhe, Germany, 2005.
- Keller, A.; Balsiger, C. Risikobeurteilung von Arzneimitteln und endokrin wirksamen Substanzen in Oberflächengewässern des Kantons Zürich. Praktikumsbericht. Baudirektion Kanton Zürich, AWEL Amt für Abfall, Wasser, Energie und Luft: Zürich, Switzerland, 2007. [Google Scholar]
- Bonvin, F.; Rutler, R.; Chèvre, N.; Halder, J.; Kohn, T. Spatial and temporal presence of a wastewater-derived micropollutant plume in Lake Geneva. Environ. Sci. Technol. 2011, 45, 4702–4709. [Google Scholar]
- Ashton, D.; Hilton, M.; Thomas, K.V. Investigating the environmental transport of human pharmaceuticals to streams in the United Kingdom. Sci. Total Environ. 2004, 333, 167–184. [Google Scholar] [CrossRef]
- Roberts, P.H.; Thomas, K.V. The occurrence of selected pharmaceuticals in wastewater effluent and surface waters of the lower Tyne catchment. Sci. Total Environ. 2005, 356, 143–153. [Google Scholar] [CrossRef]
- Kasprzyk-Hordern, B.; Dinsdale, R.M.; Guwy, A.J. Multi-residue method for the determination of basic/neutral pharmaceuticals and illicit drugs in surface water by solid-phase extraction and ultra performance liquid chromatography-positive electrospray ionisation tandem mass spectrometry. J. Chromatogr. A 2007, 1161, 132–145. [Google Scholar] [CrossRef]
- Boxall, A.B.A.; Monteiro, S.C.; Fussell, R.; Williams, R.J.; Bruemer, J.; Greenwood, R.; Bersuder, P. Targeted Monitoring for Human Pharmaceuticals in Vulnerable Source and Final Waters. Drinking Water Inspectorate Project No. WD0805 (Ref DWI 70/2/231), December 2011. UK Department for Environment, Food and Rural Affairs: London, UK, 2012. Available online: http://dwi.defra.gov.uk/research/completed-research/reports/DWI70_2_231.pdf (accessed on 12 March 2013).
- Straub, J.O. Matters of Fact and of Fiction: European PECs and MECs of Ibuprofen. In Poster of the SETAC Europe 16th Annual Meeting, Hague, The Netherlands, 2006.
- Straub, J.O. Deterministic and Probabilistic Environmental Risk Assessment for Diazepam. In Pharmaceuticals in the Environment: Sources, Fate, Effects and Risks, 3rd; Kümmerer, K., Ed.; Springer: Heidelberg, Germany, 2008; pp. 343–383. [Google Scholar]
- Metcalfe, C.D.; Alder, A.C.; Halling-Sørensen, B.; Krogh, K.; Fenner, K.; Larsbo, M.; Straub, J.O.; Ternes, T.A.; Topp, E.; Lapen, D.R.; et al. Exposure Assessment Methods for Veterinary and Human Use Medicines in the Environment: PEC vs. MEC comparisons. In Pharmaceuticals in the Environment: Sources, Fate, Effects and Risks, 3rd; Kümmerer, K., Ed.; Springer: Heidelberg, Germany, 2008; pp. 147–171. [Google Scholar]
- Kolpin, D.W.; Furlong, E.T.; Meyer, M.T.; Thurman, E.M.; Zaugg, S.D.; Barber, L.B.; Buxton, H.T. Pharmaceuticals, hormones and other organic wastewater contaminants in US streams, 1999–2000: A national reconnaissance. Environ. Sci. Technol. 2002, 36, 1202–1211. [Google Scholar] [CrossRef]
- Bound, J.P.; Voulvoulis, N. Household disposal of pharmaceuticals as a pathway for aquatic contamination in the United Kingdom. Environ. Health Persp. 2005, 113, 1705–1711. [Google Scholar] [CrossRef]
- Pharmaceuticals for Human Use: Options of Action for Reducing the Contamination of Water Bodies. A Practical Guide. START Project, ISOE: Frankfurt, Germany, 2008. Available online: http://www.start-project.de/downloads/start_Practical_Guide.pdf (accessed on 12 March 2013).
- Musson, S.E.; Townsend, T.G. Pharmaceutical compound content of municipal solid waste. J. Hazard. Mater. 2009, 162, 730–735. [Google Scholar] [CrossRef]
- Oggier, D. Trimethoprim, Test for Inhibition of Oxygen Consumption by Activated Sludge: Respiration Inhibition Test. BMG A11-00371. BMG Engineering on behalf of F. Hoffmann-La Roche Ltd: Schlieren, Switzerland, 2011; unpublished. [Google Scholar]
- Blaise, C.; Gagné, F.; Eullafroy, P.; Férard, J.-F. Ecotoxicity of selected pharmaceuticals of urban origin discharged to the Saint-Lawrence river (Québec, Canada): A review. Braz. J. Aquat. Sci. Technol. 2006, 10, 29–51. [Google Scholar]
- Kim, Y.; Choi, K.; Jung, J.; Park, S.; Kim, P.-G.; Park, J. Aquatic toxicity of acetaminophen, carbamazepine, cimetidine, diltiazem and six major sulfonamides, and their potential ecological risks in Korea. Environ. Int. 2007, 33, 370–375. [Google Scholar] [CrossRef]
- Isidori, M.; Lavorgna, M.; Nardelli, A.; Pascarella, L.; Parrella, A. Toxic and genotoxic evaluation of six antibiotics on non-target organisms. Sci. Total Environ. 2005, 346, 87–98. [Google Scholar] [CrossRef]
- Ciftcioglu, N.; Miller-Hjelle, M.A.; Hjelle, J.T.; Kajander, E.O. Inhibition of nanobacteria by antimicrobial drugs as measured by a modified microdilution method. Antimicrob. Agents Chemother. 2002, 46, 2077–2086. [Google Scholar] [CrossRef]
- Tappe, W.; Kummer, S.; Zielezny, Y.; Vereecken, H.; Groeneweg, J. Combined Effects of Sulfadiazine and Trimethoprim on Soil Bacteria. In Poster of the 16th SETAC Europe Annual Meeting, Hague, The Netherlands, 7-11 May 2006.
- Oggier, D. TMP Nitrification inhibition test ISO9509. BMG A11–00764; BMG Engineering on behalf of F. Hoffmann-La Roche Ltd: Schlieren, Switzerland, 2011; unpublished. [Google Scholar]
- Liu, F.; Ying, G.-G.; Tao, R.; Zhao, J.-L.; Yang, J.-F.; Zhao, L.-F. Effects of six selected antibiotics on plant growth and soil microbial and enzymatic activities. Environ. Pollut. 2009, 157, 1636–1642. [Google Scholar] [CrossRef]
- Ando, T.; Nagase, H.; Eguchi, K.; Hirooka, T.; Nakamura, T.; Miyamoto, K.; Hirata, K. A novel method using cyanobacteria for ecotoxicity test of veterinary antimicrobial agents. Environ. Toxicol. Chem. 2007, 26, 601–606. [Google Scholar] [CrossRef]
- Claessens, M.; Wille, K.; Vanhaecke, L.; Noppe, H.; De Brabander, H.; Janssen, C. Occurrence and Effects of Pharmaceuticals in the Belgian Coastal Zone. In Poster of the SETAC Europe 19th Annual Meeting, Göteborg, Sweden, 31 May to 4 June 2009.
- Holten Lützhøft, H.-C.; Halling-Sørensen, B.; Jorgensen, S.E. Algal toxicity of antibacterial agents applied in Danish fish farming. Arch. Environ. Contam. Toxicol. 1999, 36, 1–6. [Google Scholar] [CrossRef]
- Yang, L.-H.; Ying, G.-G.; Su, H.-C.; Strauber, J.L.; Adams, M.S.; Binet, M.T. Growth-inhibiting effects of 12 antibacterial agents and their mixtures on the freshwater microalga Pseudokirchneriella subcapitata. Environ. Sci. Technol. 2008, 27, 1201–1208. [Google Scholar]
- Eguchi, K.; Nagase, H.; Ozawa, M.; Enoh, Y.S.; Goto, K.; Hirata, K.; Miyamoto, K.; Yoshimura, H. Evaluation of antimicrobial agents for veterinary use in the ecotoxicity test using microalgae. Chemosphere 2004, 57, 1733–1738. [Google Scholar] [CrossRef]
- Bogers, R. Algal growth inhibition test with Trimethoprim, OECD 201. NOTOX b.v., on behalf of F. Hoffmann-La Roche Ltd: ‘s-Hertogenbosch, The Netherlands, 1996; unpublished. [Google Scholar]
- Brain, R.A.; Johnson, D.A.; Richards, S.M.; Sanderson, H.; Sibley, P.K.; Solomon, K.R. Effects of 25 pharmaceutical compounds to Lemna gibba using a seven-day static-renewal test. Environ. Sci. Technol. 2004, 23, 371–382. [Google Scholar]
- Oggier, D. Trimethoprim, Growth inhibition test with Lemna minor. BMG A11-00372. BMG Engineering, on behalf of F. Hoffmann-La Roche Ltd: Schlieren, Switzerland, 2011; unpublished. [Google Scholar]
- Quinn, B.; Gagné, F.; Blaise, C. The effects of pharmaceuticals on regeneration of the cnidarian, Hydra attenuata. Sci. Total Environ. 2008, 402, 62–69. [Google Scholar] [CrossRef]
- Rhee, J.-S.; Jeong, C.-B.; Kim, B.-M.; Lee, J.-S. P-glycoprotein (P-gp) in the monogonont rotifer, Brachionus koreanus: Molecular characterization and expression in response to pharmaceuticals. Aquat. Toxicol. 2012, 114–115, 104–118. [Google Scholar] [CrossRef]
- Park, S.; Choi, K. Hazard assessment of commonly used agricultural antibiotics on aquatic ecosystems. Ecotoxicology 2008, 17, 526–538. [Google Scholar] [CrossRef]
- Bogers, R. Daphnid immobilisation test with Trimethoprim, OECD 202. NOTOX b.v., on behalf of F.Hoffmann-La Roche Ltd: ‘s-Hertogenbosch, The Netherlands, 1996; unpublished. [Google Scholar]
- De Liguoro, M.; Fioretto, B.; Poltronieri, C.; Gallina, G. The toxicity of sulfamethazine to Daphnia magna and its additivity to other veterinary sulfanomides and trimethoprim. Chemosphere 2009, 75, 1519–1524. [Google Scholar] [CrossRef]
- Iannacone, J.; Alvariño, L. Evaluación del riesgo acuático de siete productos farmacéuticos sobre Daphnia magna. Ecología aplicada 2009, 8, 71–80. [Google Scholar]
- Choi, K.; Kim, Y.; Jung, J.; Kim, M.-H.; Kim, C.-S.; Kim, N.-H.; Park, J. Occurrences and ecological risk of roxithromycin, trimethoprim and chloramphenicol in the Han river, Korea. Environ. Sci. Technol. 2008, 27, 711–719. [Google Scholar]
- Quinn, B.; Gagné, F.; Blaise, C. An investigation into the acute and chronic toxicity of eleven pharmaceuticals (and their solvents) found in wastewater effluent on the cnidarian, Hydra attenuata. Sci. Total Environ. 2008, 389, 306–314. [Google Scholar] [CrossRef]
- Flaherty, C.; Dodson, S.I. Effects of pharmaceuticals on Daphnia survival, growth and reproduction. Chemosphere 2005, 61, 200–207. [Google Scholar] [CrossRef]
- Gilberg, D.; Hamberger, R. Trimethoprim: a study on the toxicity to early-life stages of zebrafish according to OECD Guideline No. 210 “Fish, Early-life stage Toxicity Test”. ECT Oekotoxikologie GmbH, Flörsheim/Main, Germany and CIP Chemisches Institut Pforzheim GmbH, on behalf of F. Hoffmann-La Roche Ltd: Pforzheim, Germany, 2011; unpublished. [Google Scholar]
- Richards, S.M.; Cole, S.E. A toxicity and hazard assessment of fourteen pharmaceuticals to Xenopus laevis larvae. Ecotoxicology 2006, 15, 647–656. [Google Scholar] [CrossRef]
- Technical Guidance for Deriving Environmental Quality Standards. Common Implementation Strategy for the Water Framework Directive (2000/60/EC), Guidance Document No. 27. European Communities: Brussels, Belgium, 2011. Available online: http://ec.europa.eu (accessed on 12 March 2013).
- Binelli, A.; Parolini, M.; Cogni, D.; Pedriali, A.; Provini, A. A multi-biomarker assessment of the impact of the antibacterial trimethoprim on the non-target organism zebra mussel (Dreissena polymorpha). Comp. Biochem. Physiol. C 2009, 150, 329–336. [Google Scholar]
- Escher, B.I.; Hermens, J.L.M. Internal exposure: Linking bioavailability to effects. Environ. Sci. Technol. 2004, 38, 455A–462A. [Google Scholar] [CrossRef]
- DEFRA/Hart, A.; Roelofs, W. Webfram pesticide risk assessment tool. Framework for Addressing Uncertainty and Variability in Pesticide Risk Assessment, Developed on behalf of DEFRA: London, UK. Available online: http://www.webfram.com (accessed on 12 March 2013).
- Roelofs, W. Personal Communication, DEFRA: London, UK, 2008.
- Kortenkamp, A.; Backhaus, T.; Faust, M. State of the Art Report on Mixture Toxicity. Final Report. Study Contract Number 070307/2007/485103/ETU/D.1. The School of Pharmacy, University of London: London UK, 2009. Available online: http://ec.europa.eu/environment/ chemicals/pdf/report_Mixture%20toxicity.pdf (accessed on 12 March 2013).
- DANMAP. Use of antimicrobial agents and occurrence of antimicrobial resistance in bacteria from food animals, food and humans in Denmark. Statens Serum Institute: Copenhagen, Denmark, 2010/2011. Available online: http://www.danmap.org/Downloads/~/media/Projekt%20sites/ Danmap/DANMAP%20reports/ Danmap_2010.ashx (accessed on 23 July 2012).
- Martínez, J.L. Environmental pollution by antibiotics and by antibiotic resistance determinants. Environ. Pollut. 2009, 157, 2893–2902. [Google Scholar] [CrossRef]
- La Para, T.M.; Burch, T.R.; McNamara, P.J.; Tan, D.T.; Yan, M.; Eichmiller, J.J. Tertiary-treated municipal wastewater is a significant point source of antibiotic resistance genes into Duluth-Superior Harbor. Environ. Sci. Technol. 2011, 45, 9453–9459. [Google Scholar]
- Czekalski, N.; Berthold, T.; Caucci, S.; Bürgmann, H. Increased levels of multiresistant bacteria and resistance genes after wastewater treatment and their dissemination into Lake Geneva, Switzerland. Frontiers Microbiol. 2012, 3. [Google Scholar] [CrossRef]
- Forsberg, K.J.; Reyes, A.; Wang, B.; Selleck, E.M.; Sommer, M.O.A.; Dantas, G. The shared antibiotic resistome of soil bacteria and human pathogens. Science 2012, 337, 1107–1111. [Google Scholar] [CrossRef]
- Al-Ahmad, A.; Haiss, A.; Unger, J.; Brunswick-Tietze, A.; Wiethan, J.; Kümmerer, K. Effects of a realistic mixture of antibiotics on resistant and nonresistant sewage sludge bacteria in laboratory-scale treatment plants. Arch. Environ. Contam. Toxicol. 2009, 57, 264–273. [Google Scholar]
© 2013 by the authors; licensee MDPI, Basel, Switzerland. This article is an open access article distributed under the terms and conditions of the Creative Commons Attribution license (http://creativecommons.org/licenses/by/3.0/).
Share and Cite
Straub, J.O. An Environmental Risk Assessment for Human-Use Trimethoprim in European Surface Waters. Antibiotics 2013, 2, 115-162. https://doi.org/10.3390/antibiotics2010115
Straub JO. An Environmental Risk Assessment for Human-Use Trimethoprim in European Surface Waters. Antibiotics. 2013; 2(1):115-162. https://doi.org/10.3390/antibiotics2010115
Chicago/Turabian StyleStraub, Jürg Oliver. 2013. "An Environmental Risk Assessment for Human-Use Trimethoprim in European Surface Waters" Antibiotics 2, no. 1: 115-162. https://doi.org/10.3390/antibiotics2010115