
Design and Characterization of a Sensorized Microfluidic Cell-Culture System with Electro-Thermal Micro-Pumps and Sensors for Cell Adhesion, Oxygen, and pH on a Glass Chip

Abstract
:1. Introduction
2. Experimental Section
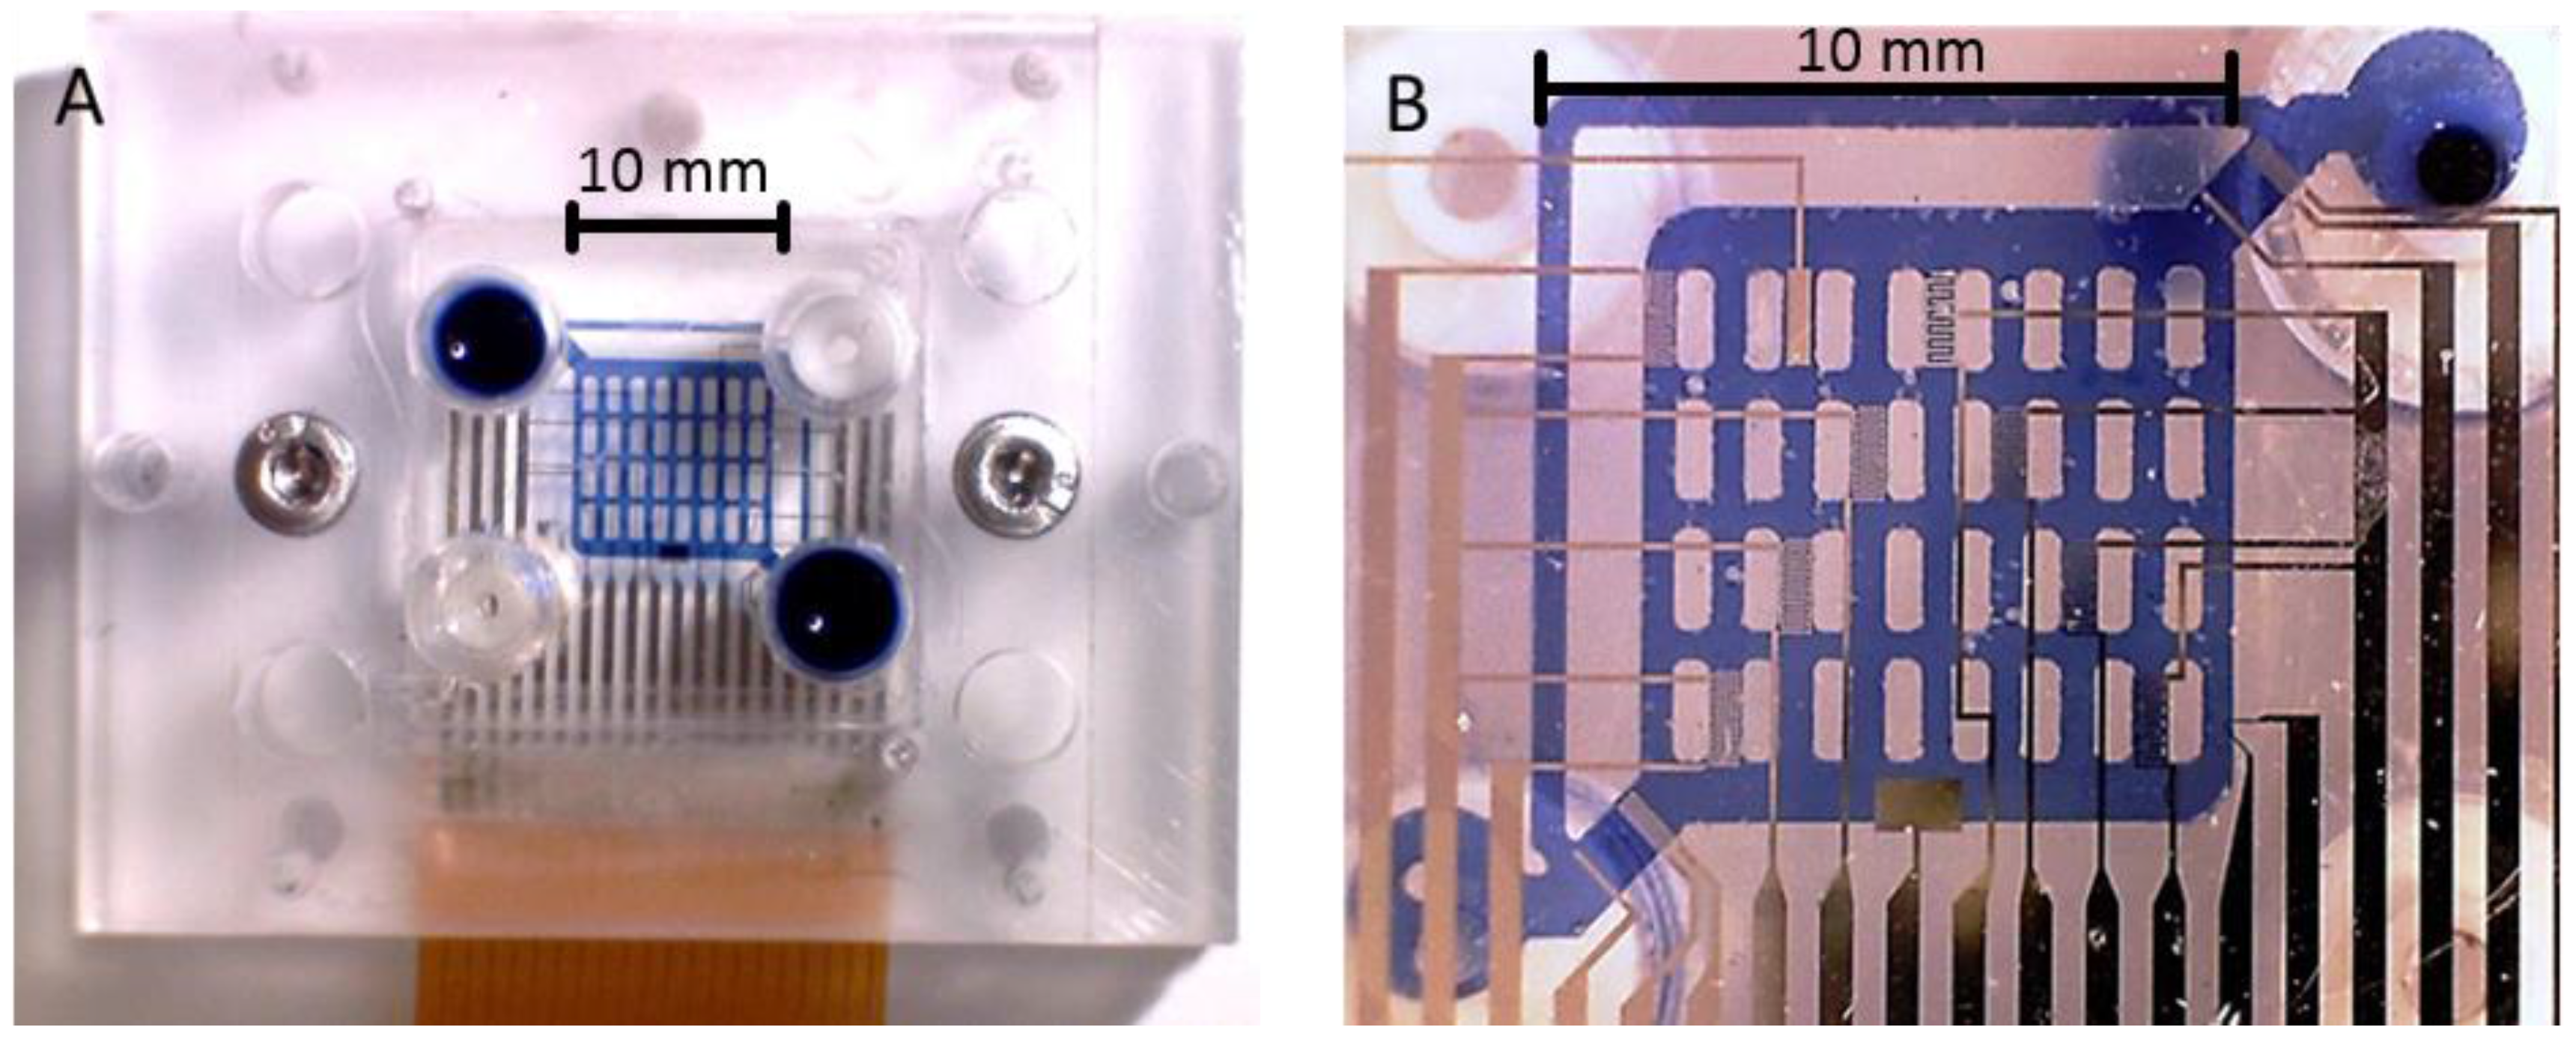
2.1. Fluidic Structures

2.2. Fluidic and Electric Connections

2.3. The on Chip Structures
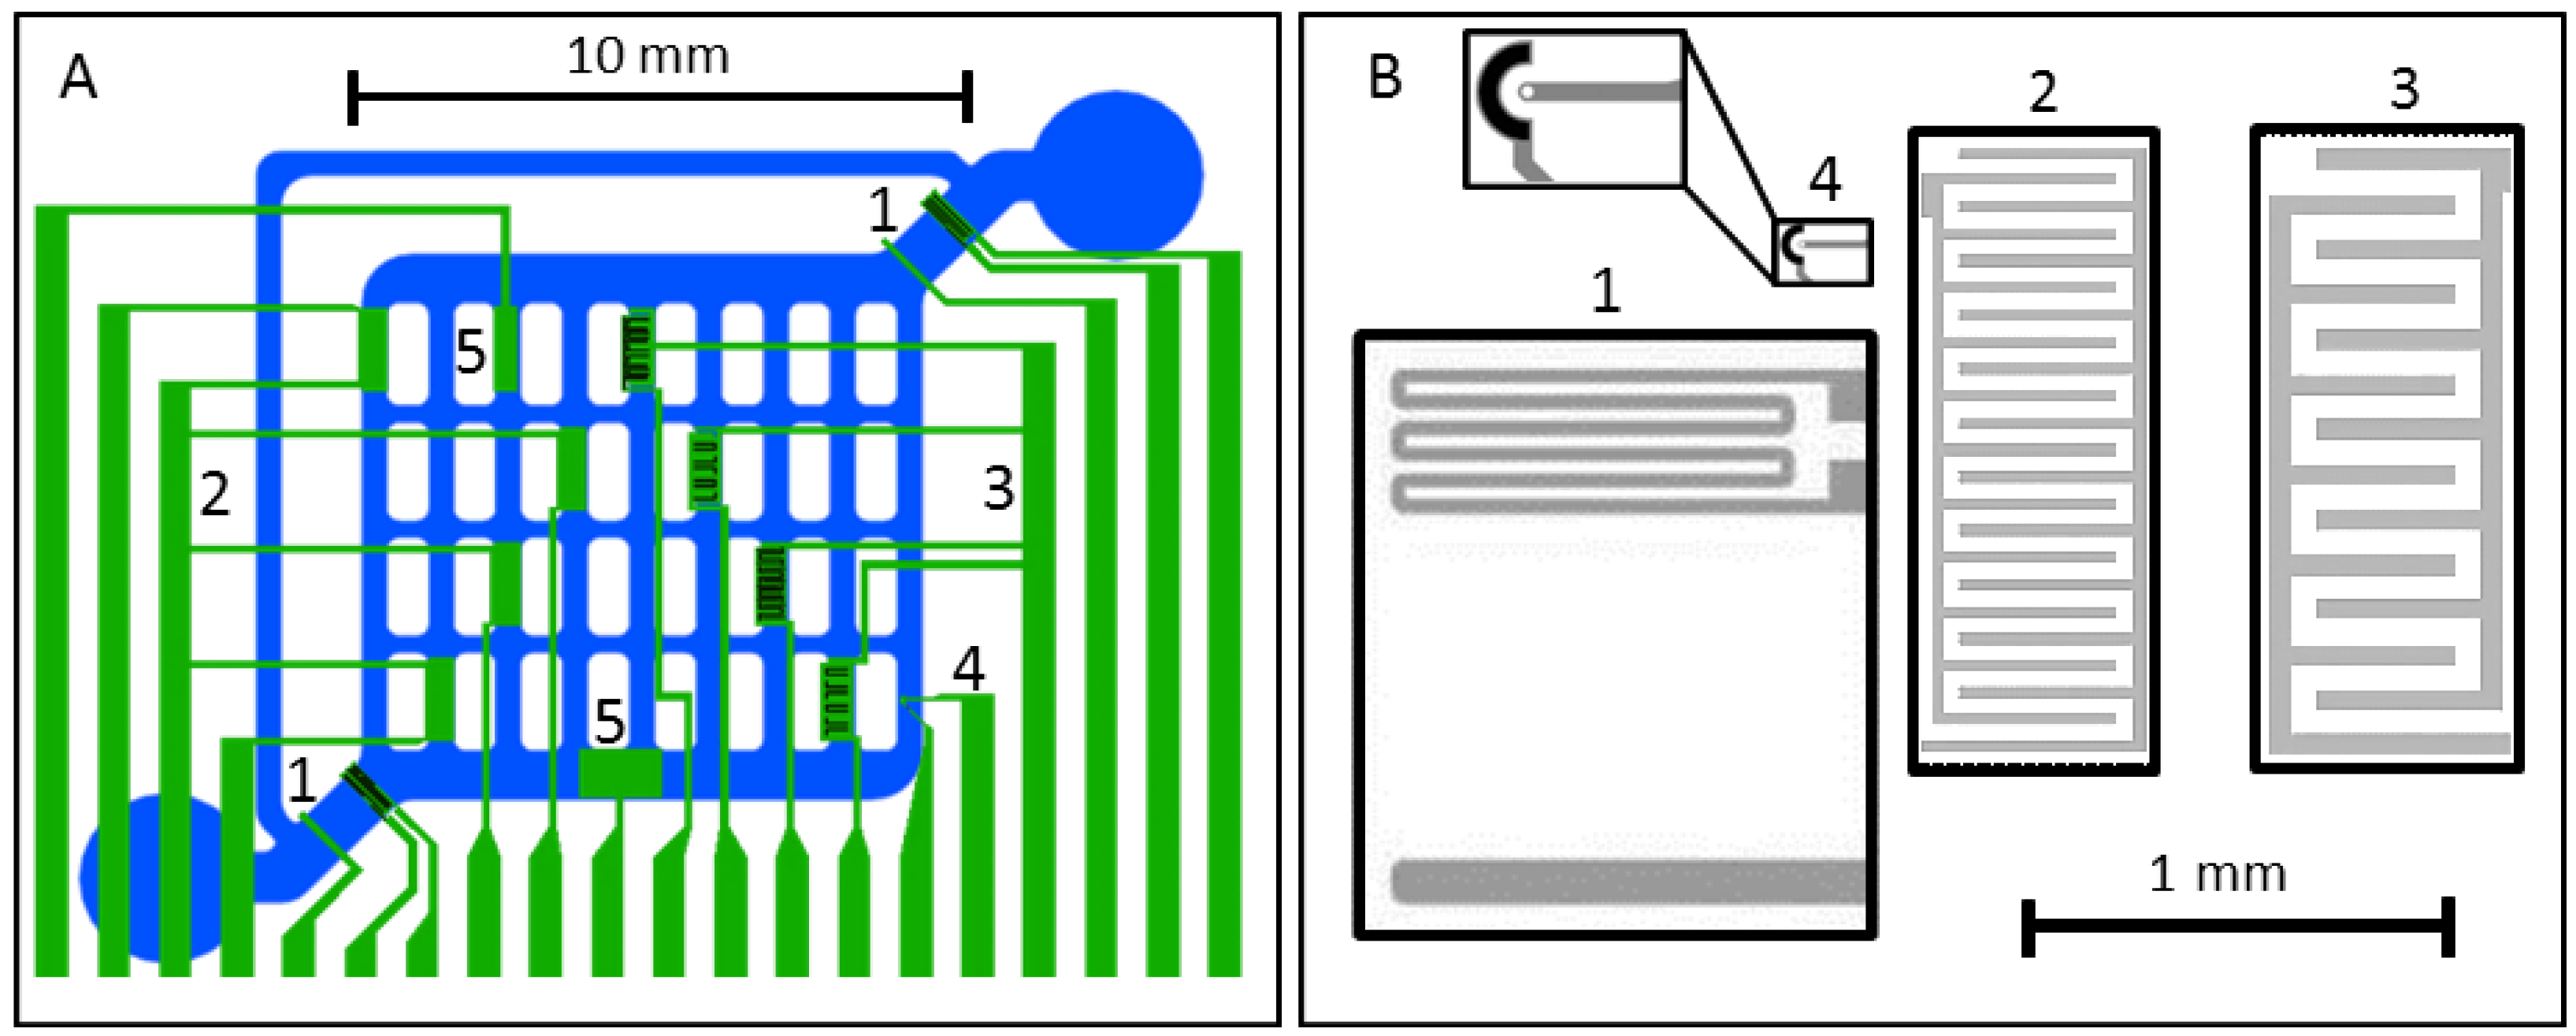
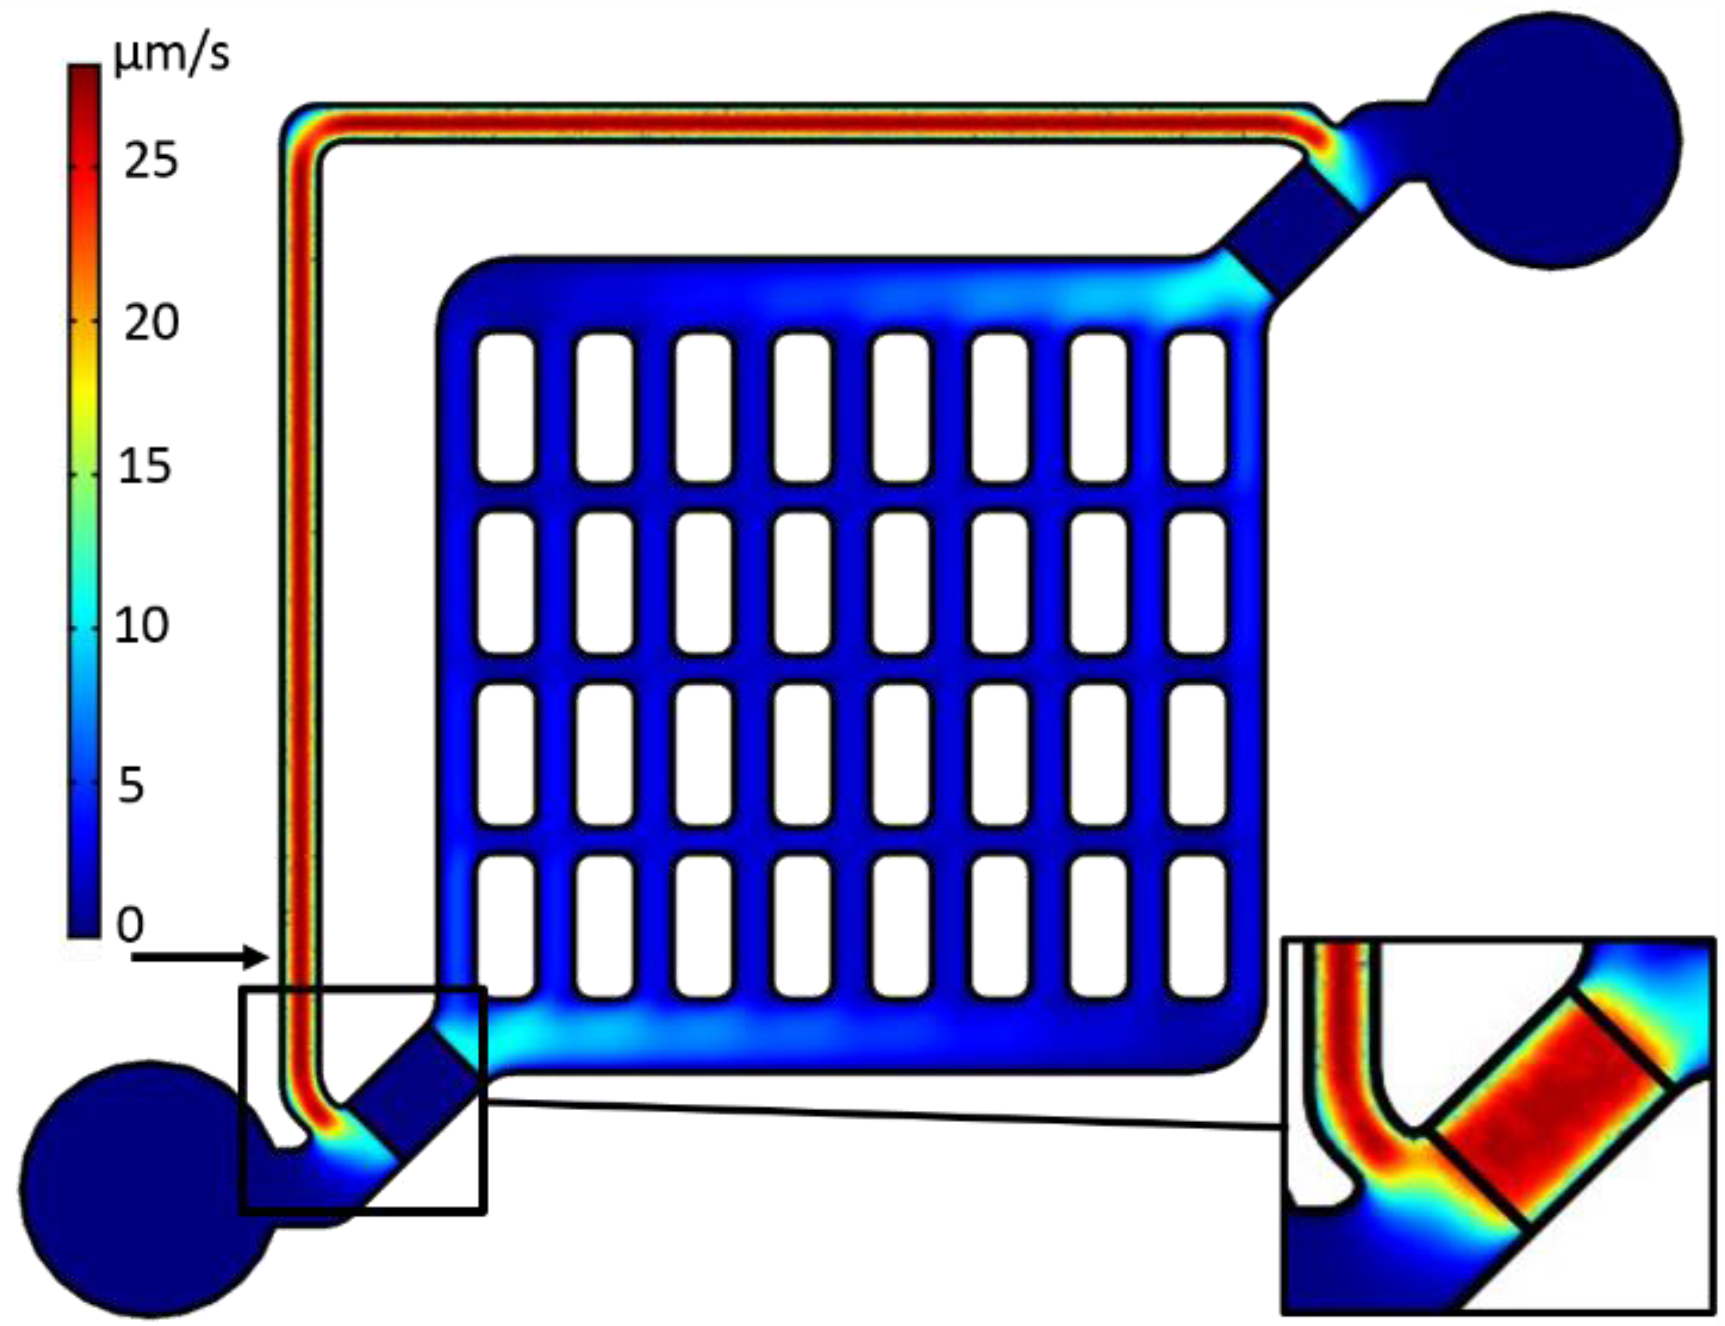
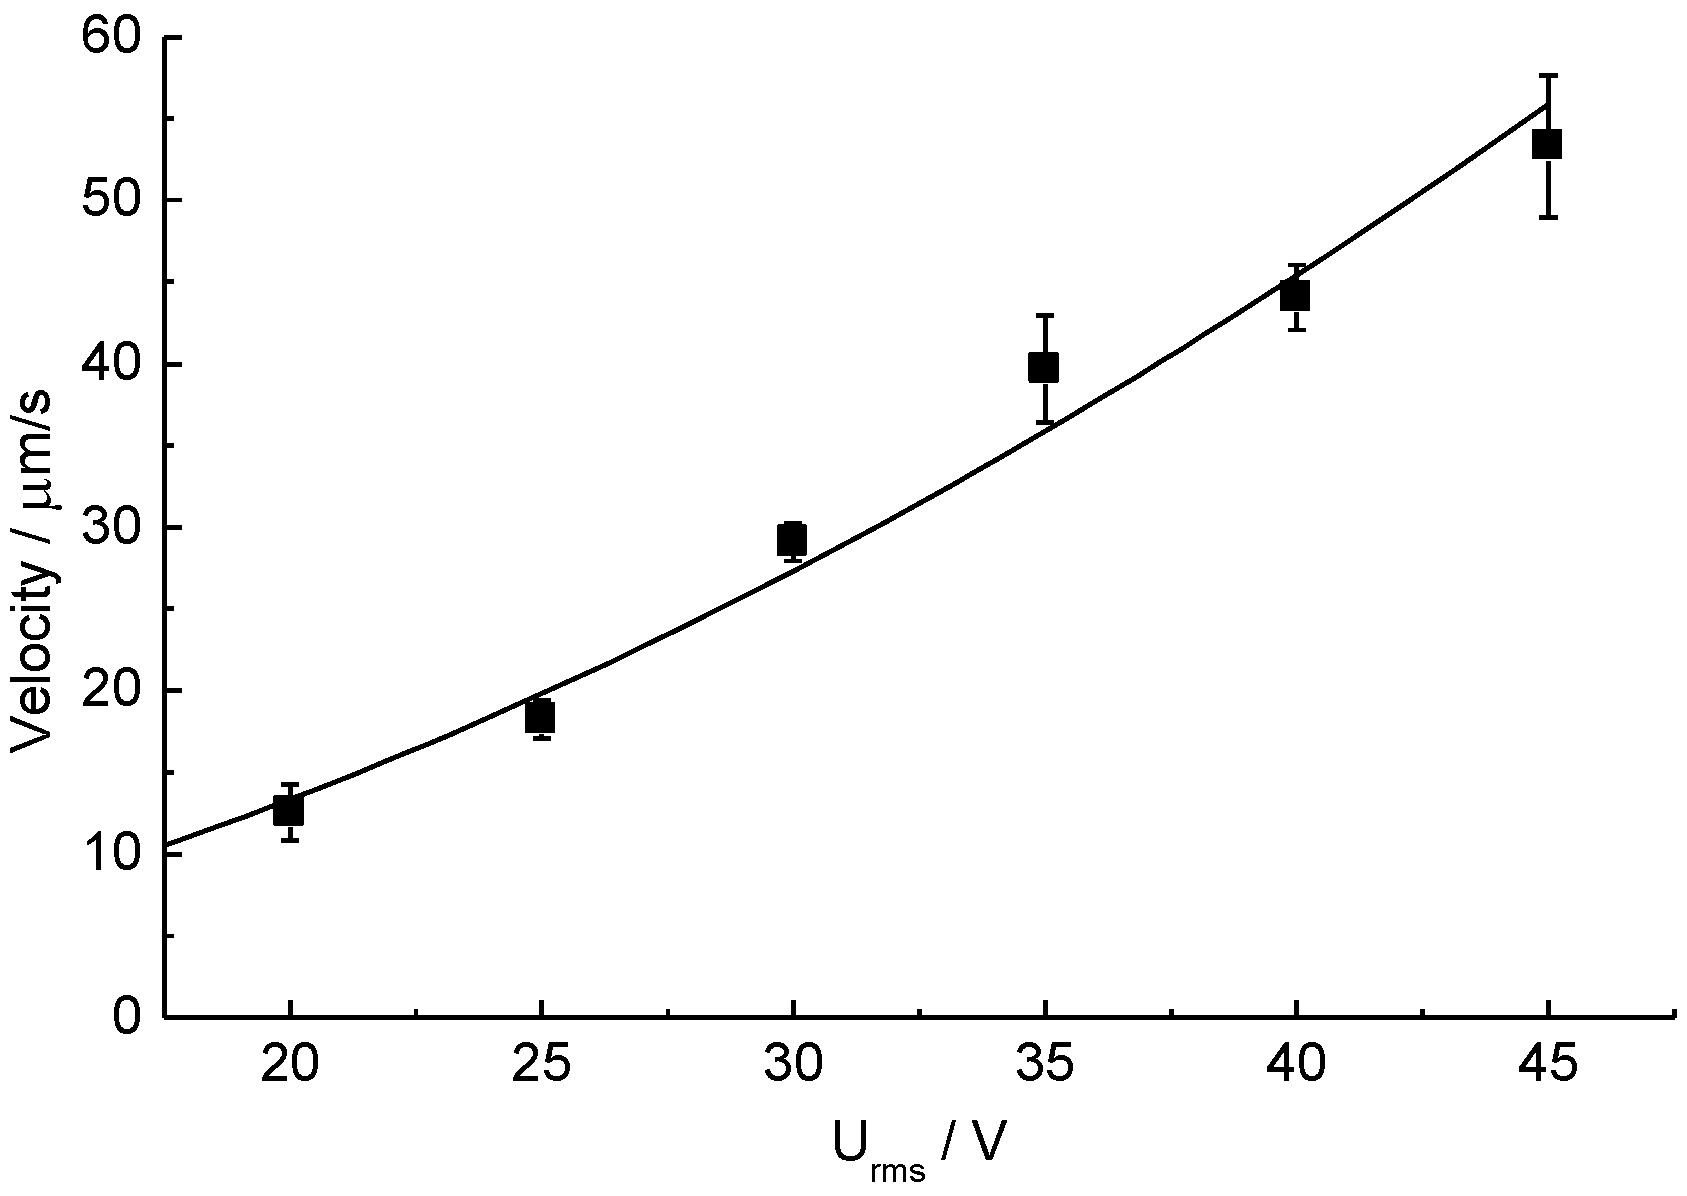
2.4. ETµP
2.5. Interdigitated Electrodes Structures (IDES)
2.6. Oxygen Electrodes
2.7. pH Electrodes
2.8. Cell Culture
3. Results and Discussion
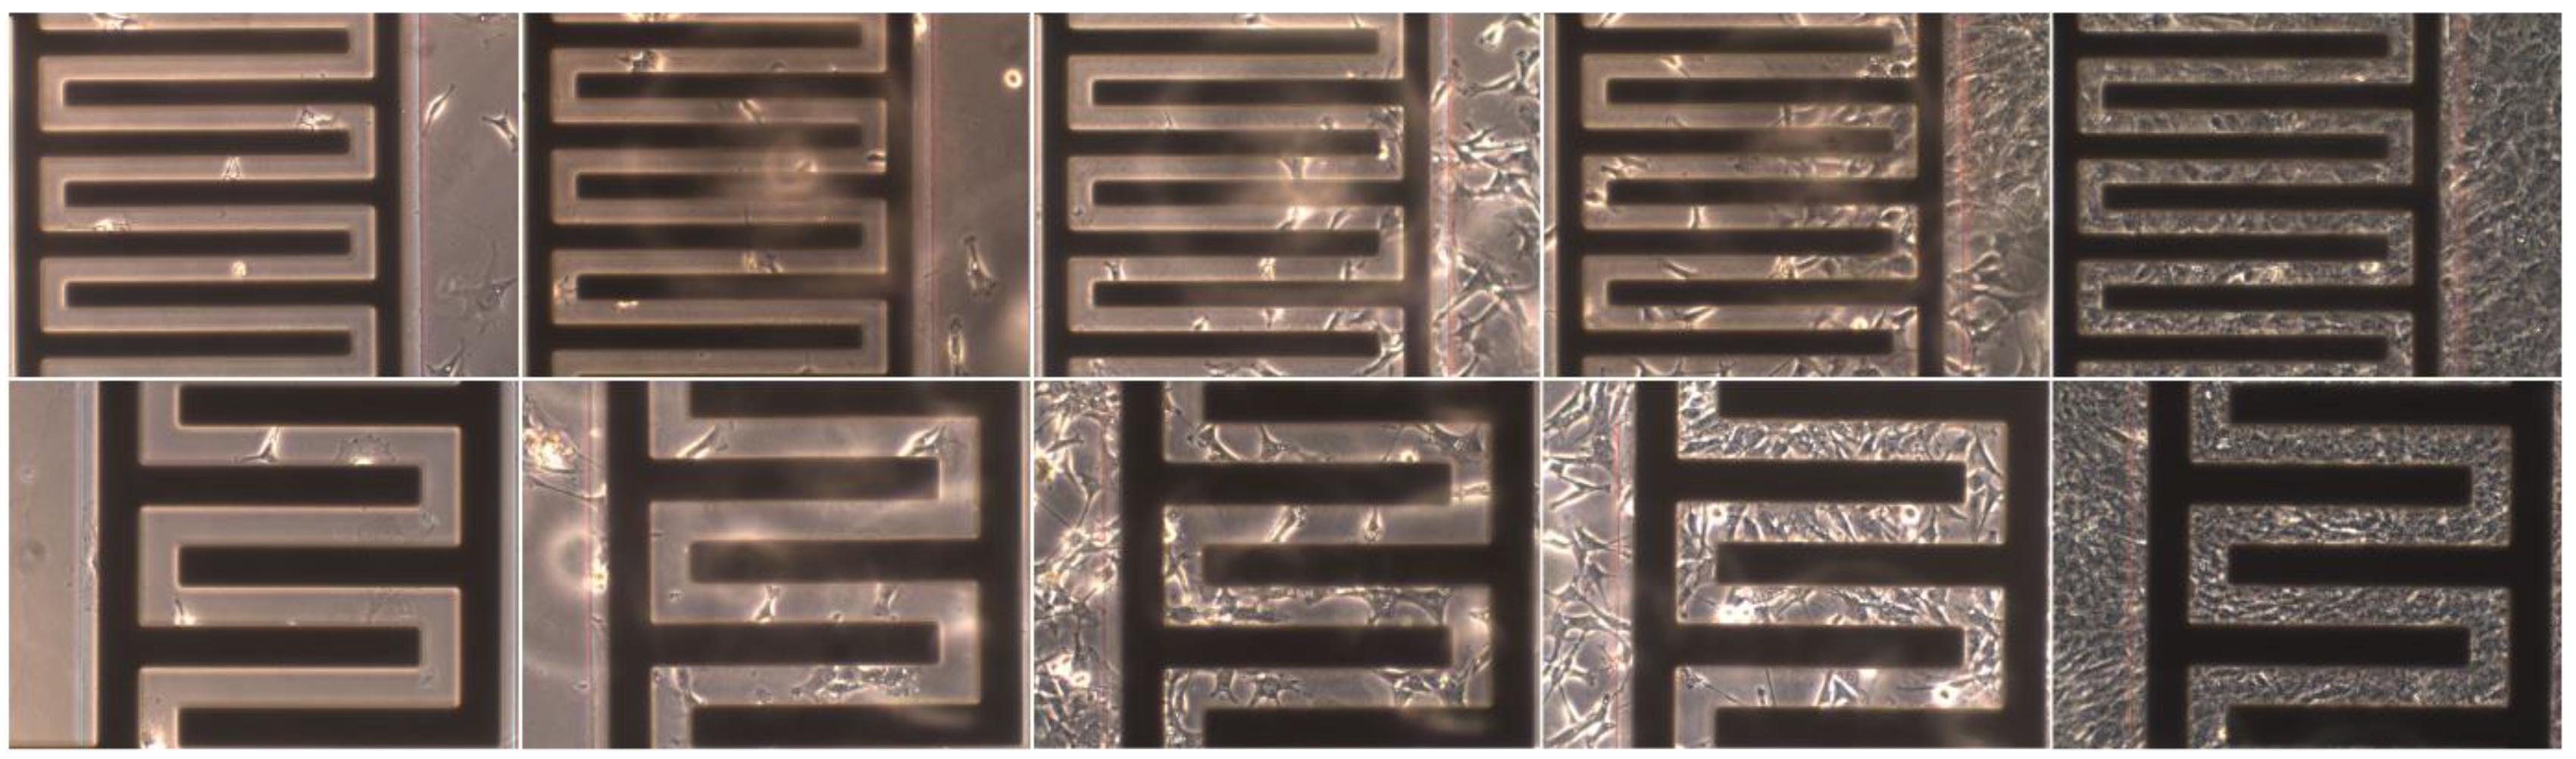
3.1. Cell Culture in the Microfluidic Structure
3.2. ETµPs
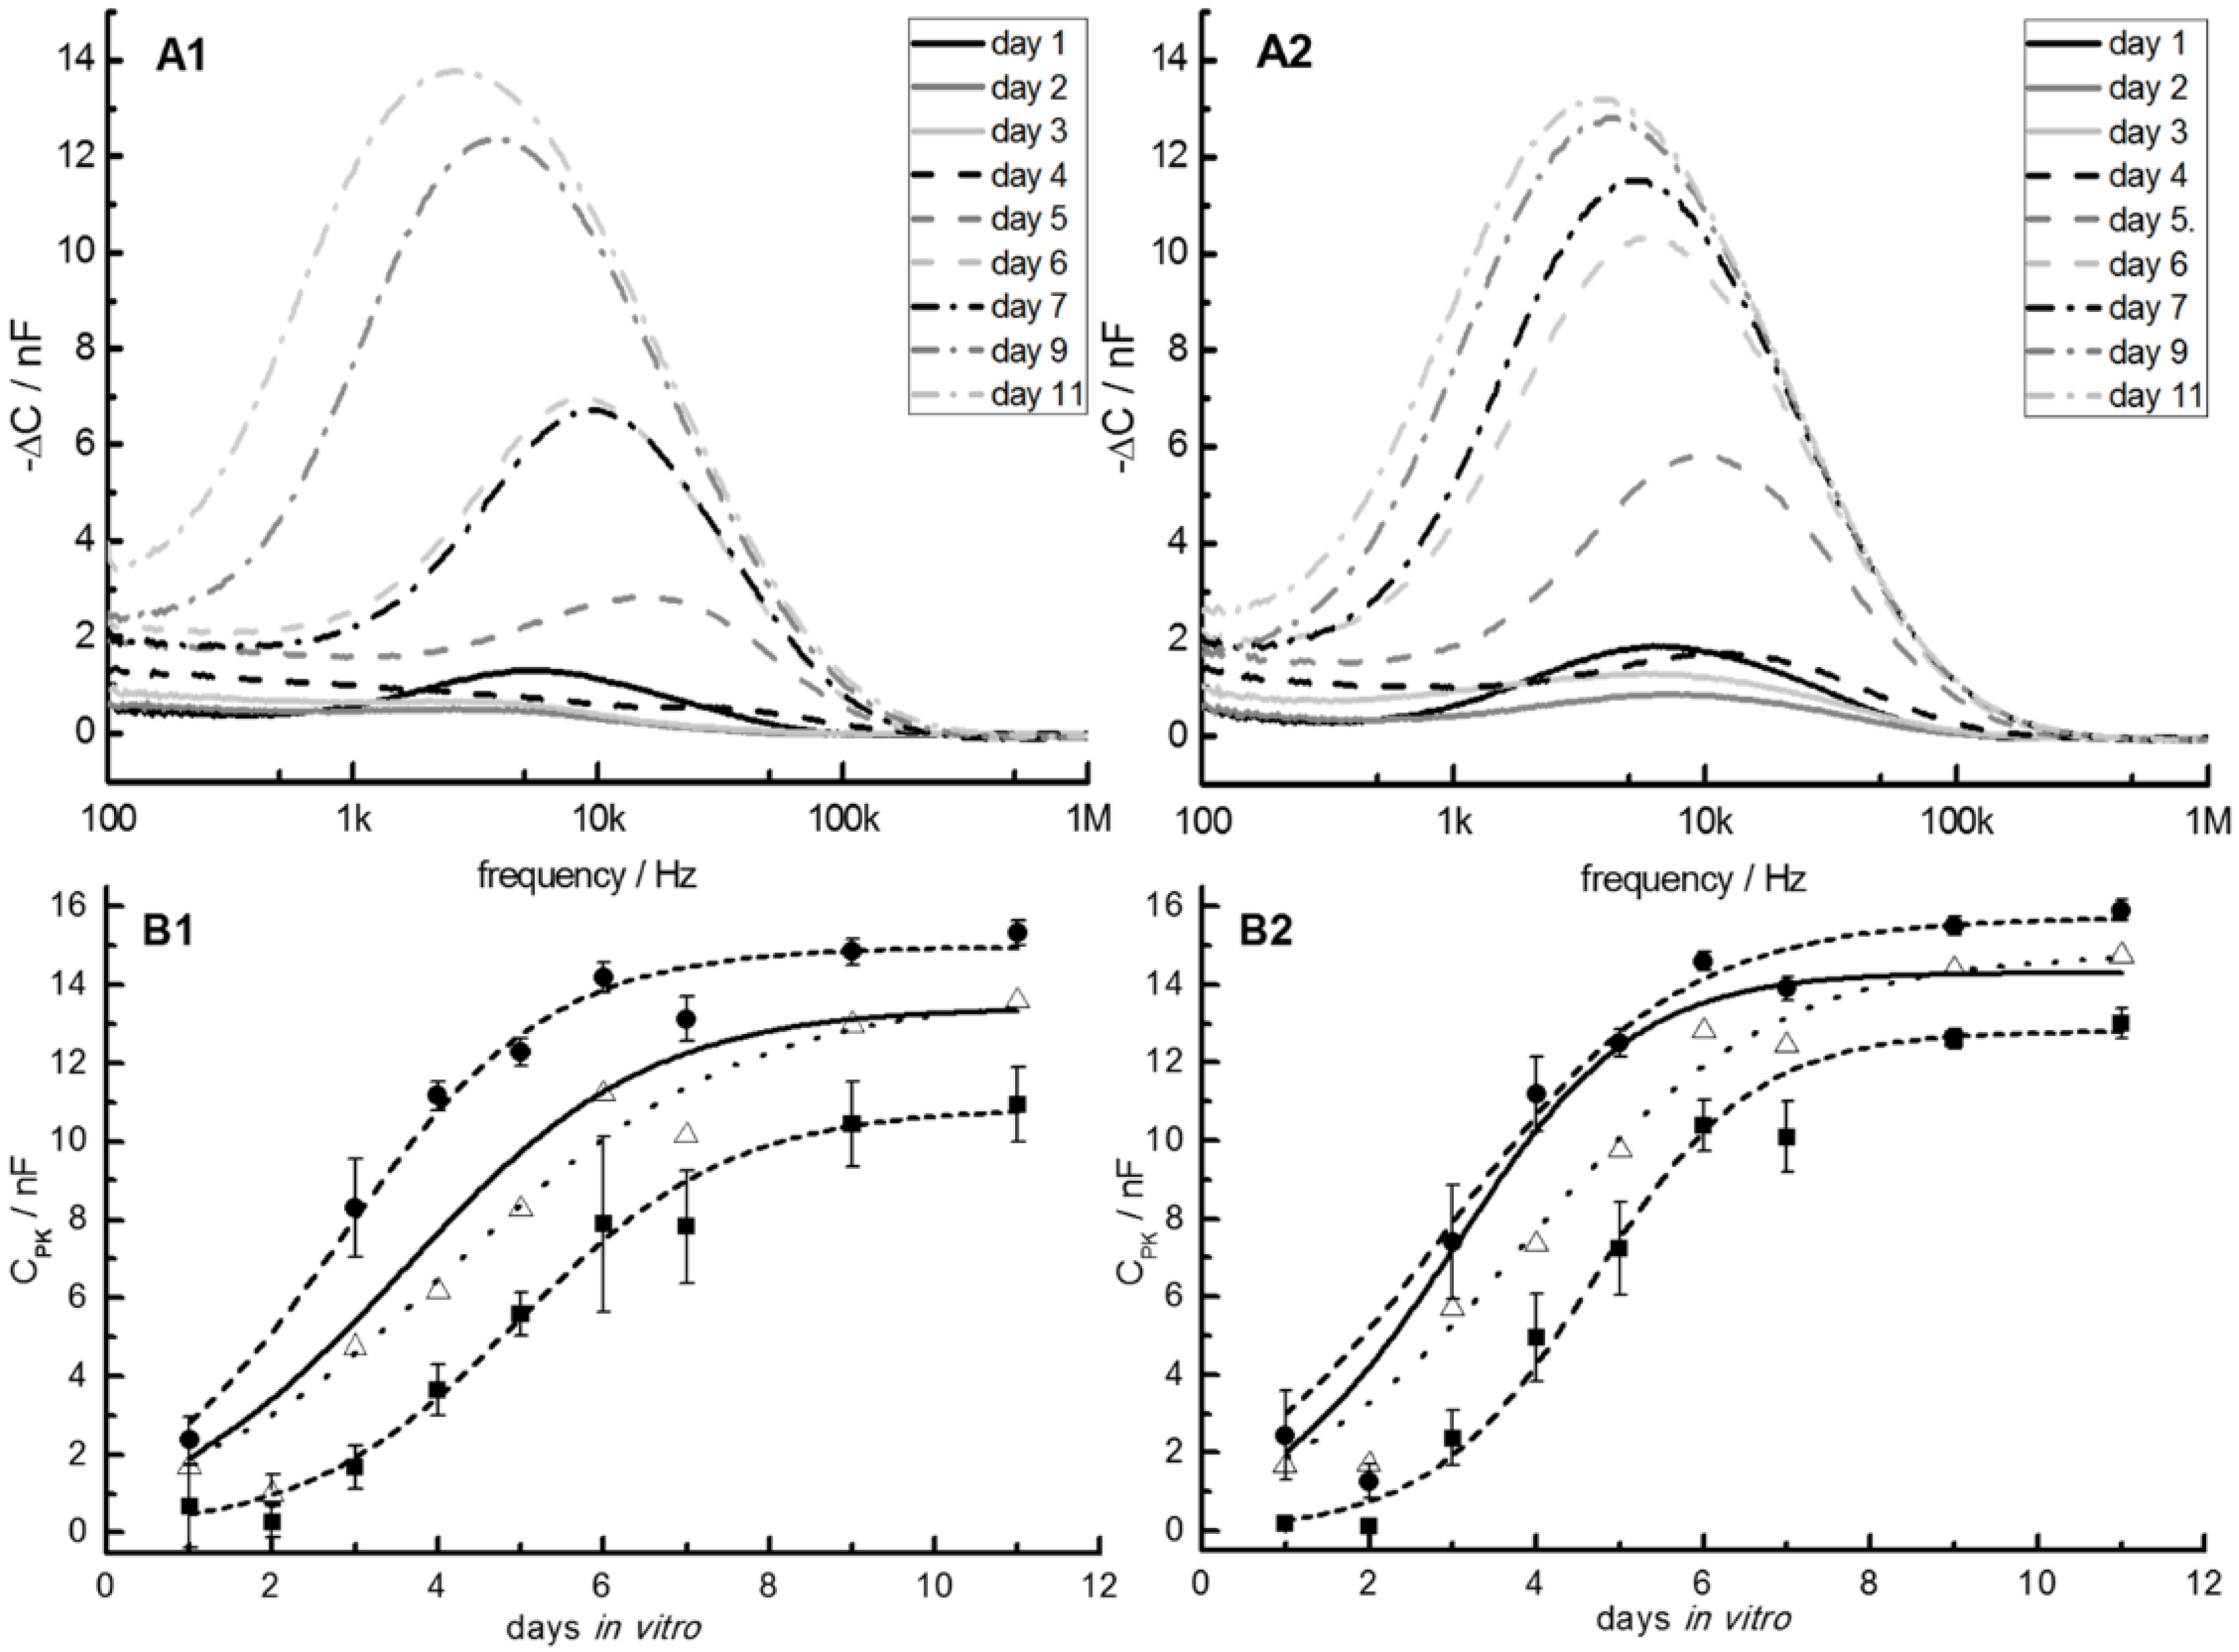
3.3. Interdigitated Electrodes (IDES)


| 50-µm IDES | 30-µm IDES | |||||||
|---|---|---|---|---|---|---|---|---|
| A | B | A | B | |||||
| [nF] | 0.93 | ±1.09 | 0.61 | ±0.51 | 1.14 | ±1.60 | 0.94 | ±0.65 |
| [nF] | 14.77 | ±2.03 | 13.89 | ±1.31 | 13.69 | ±3.43 | 13.29 | ±1.67 |
| T [d] | 1.00 | ±0.28 | 0.69 | ±0.18 | 1.21 | ±0.47 | 0.97 | ±0.19 |
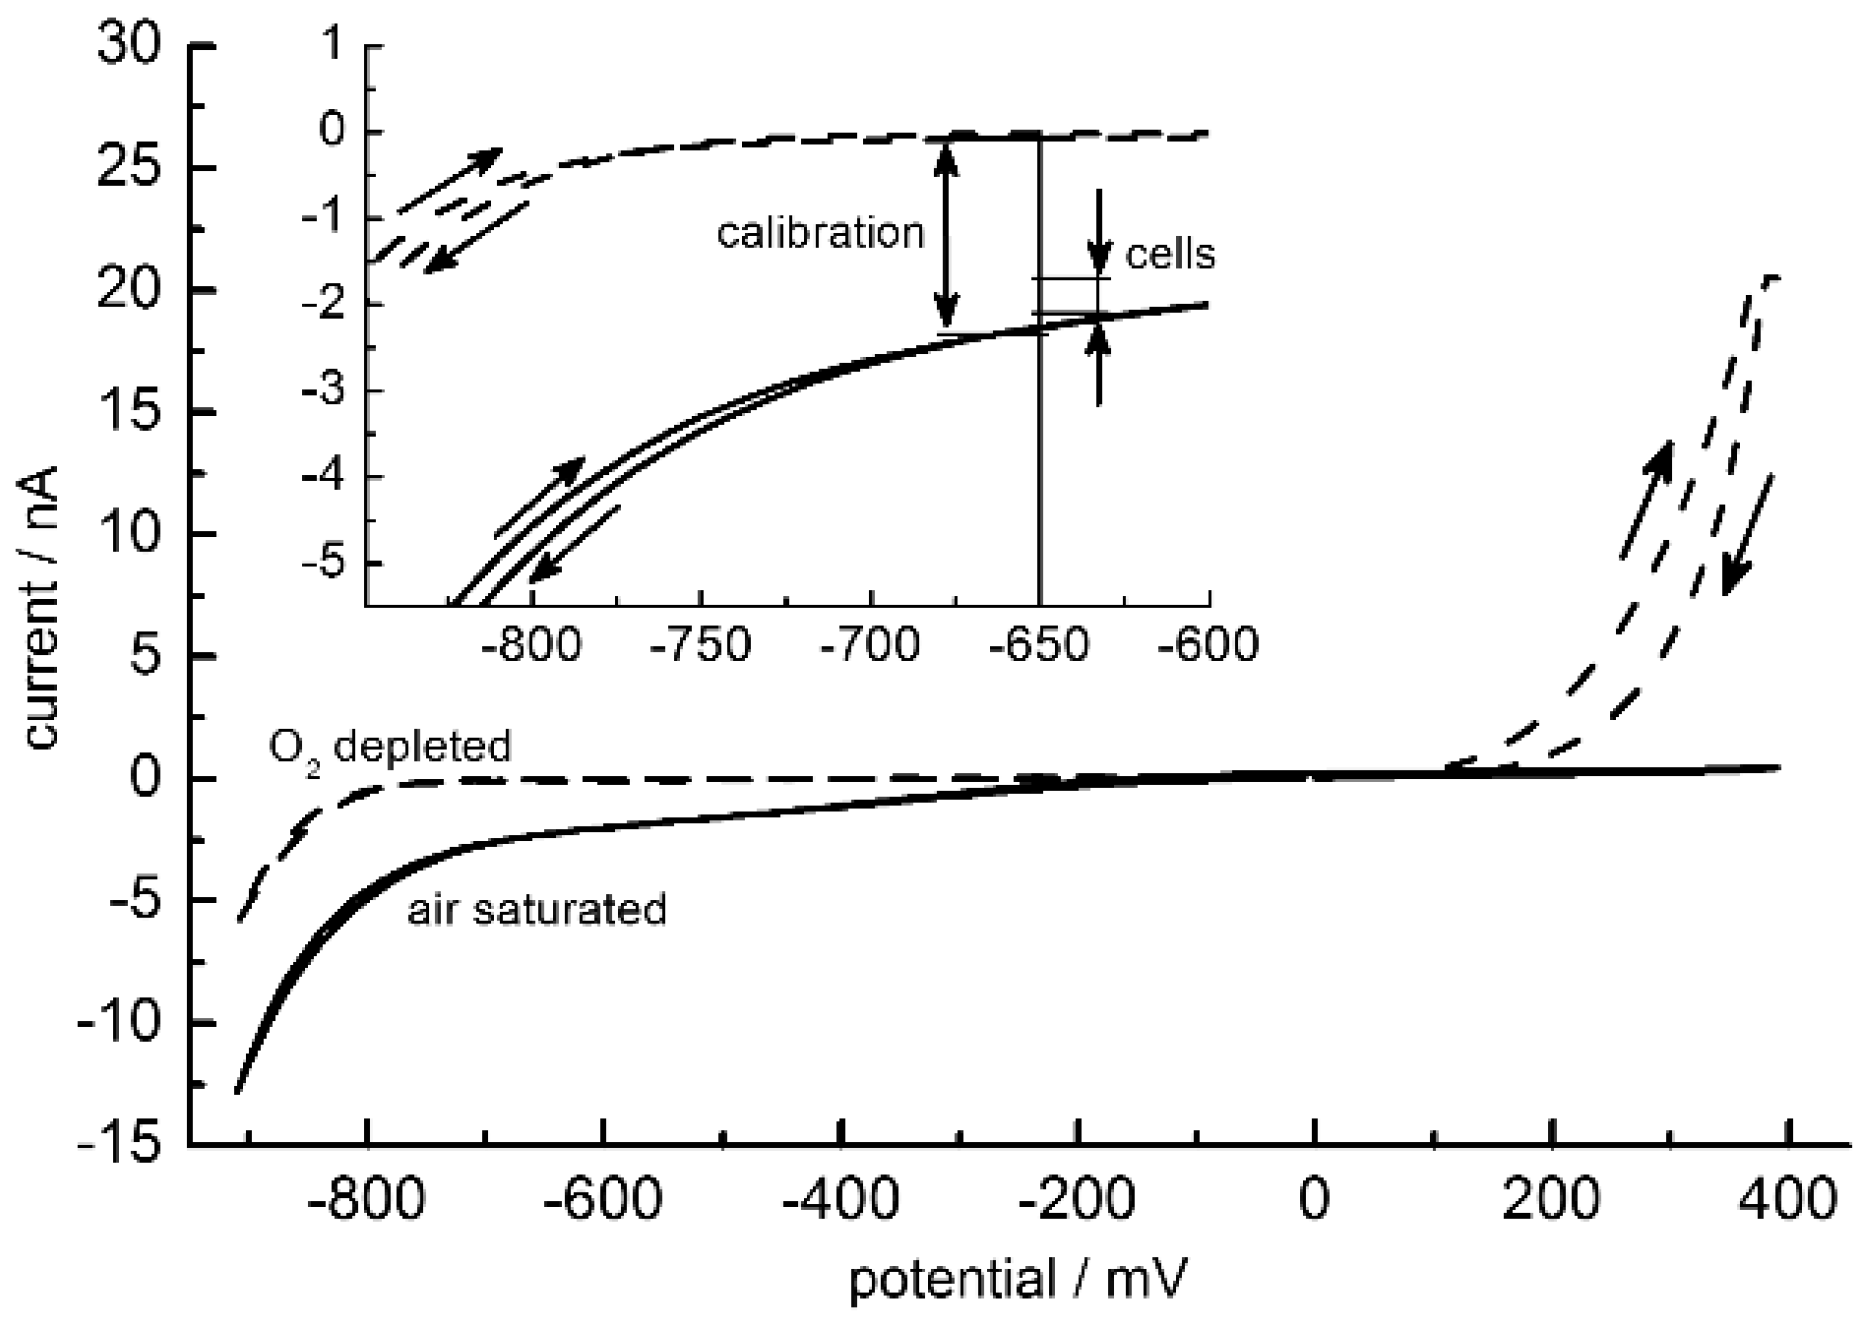
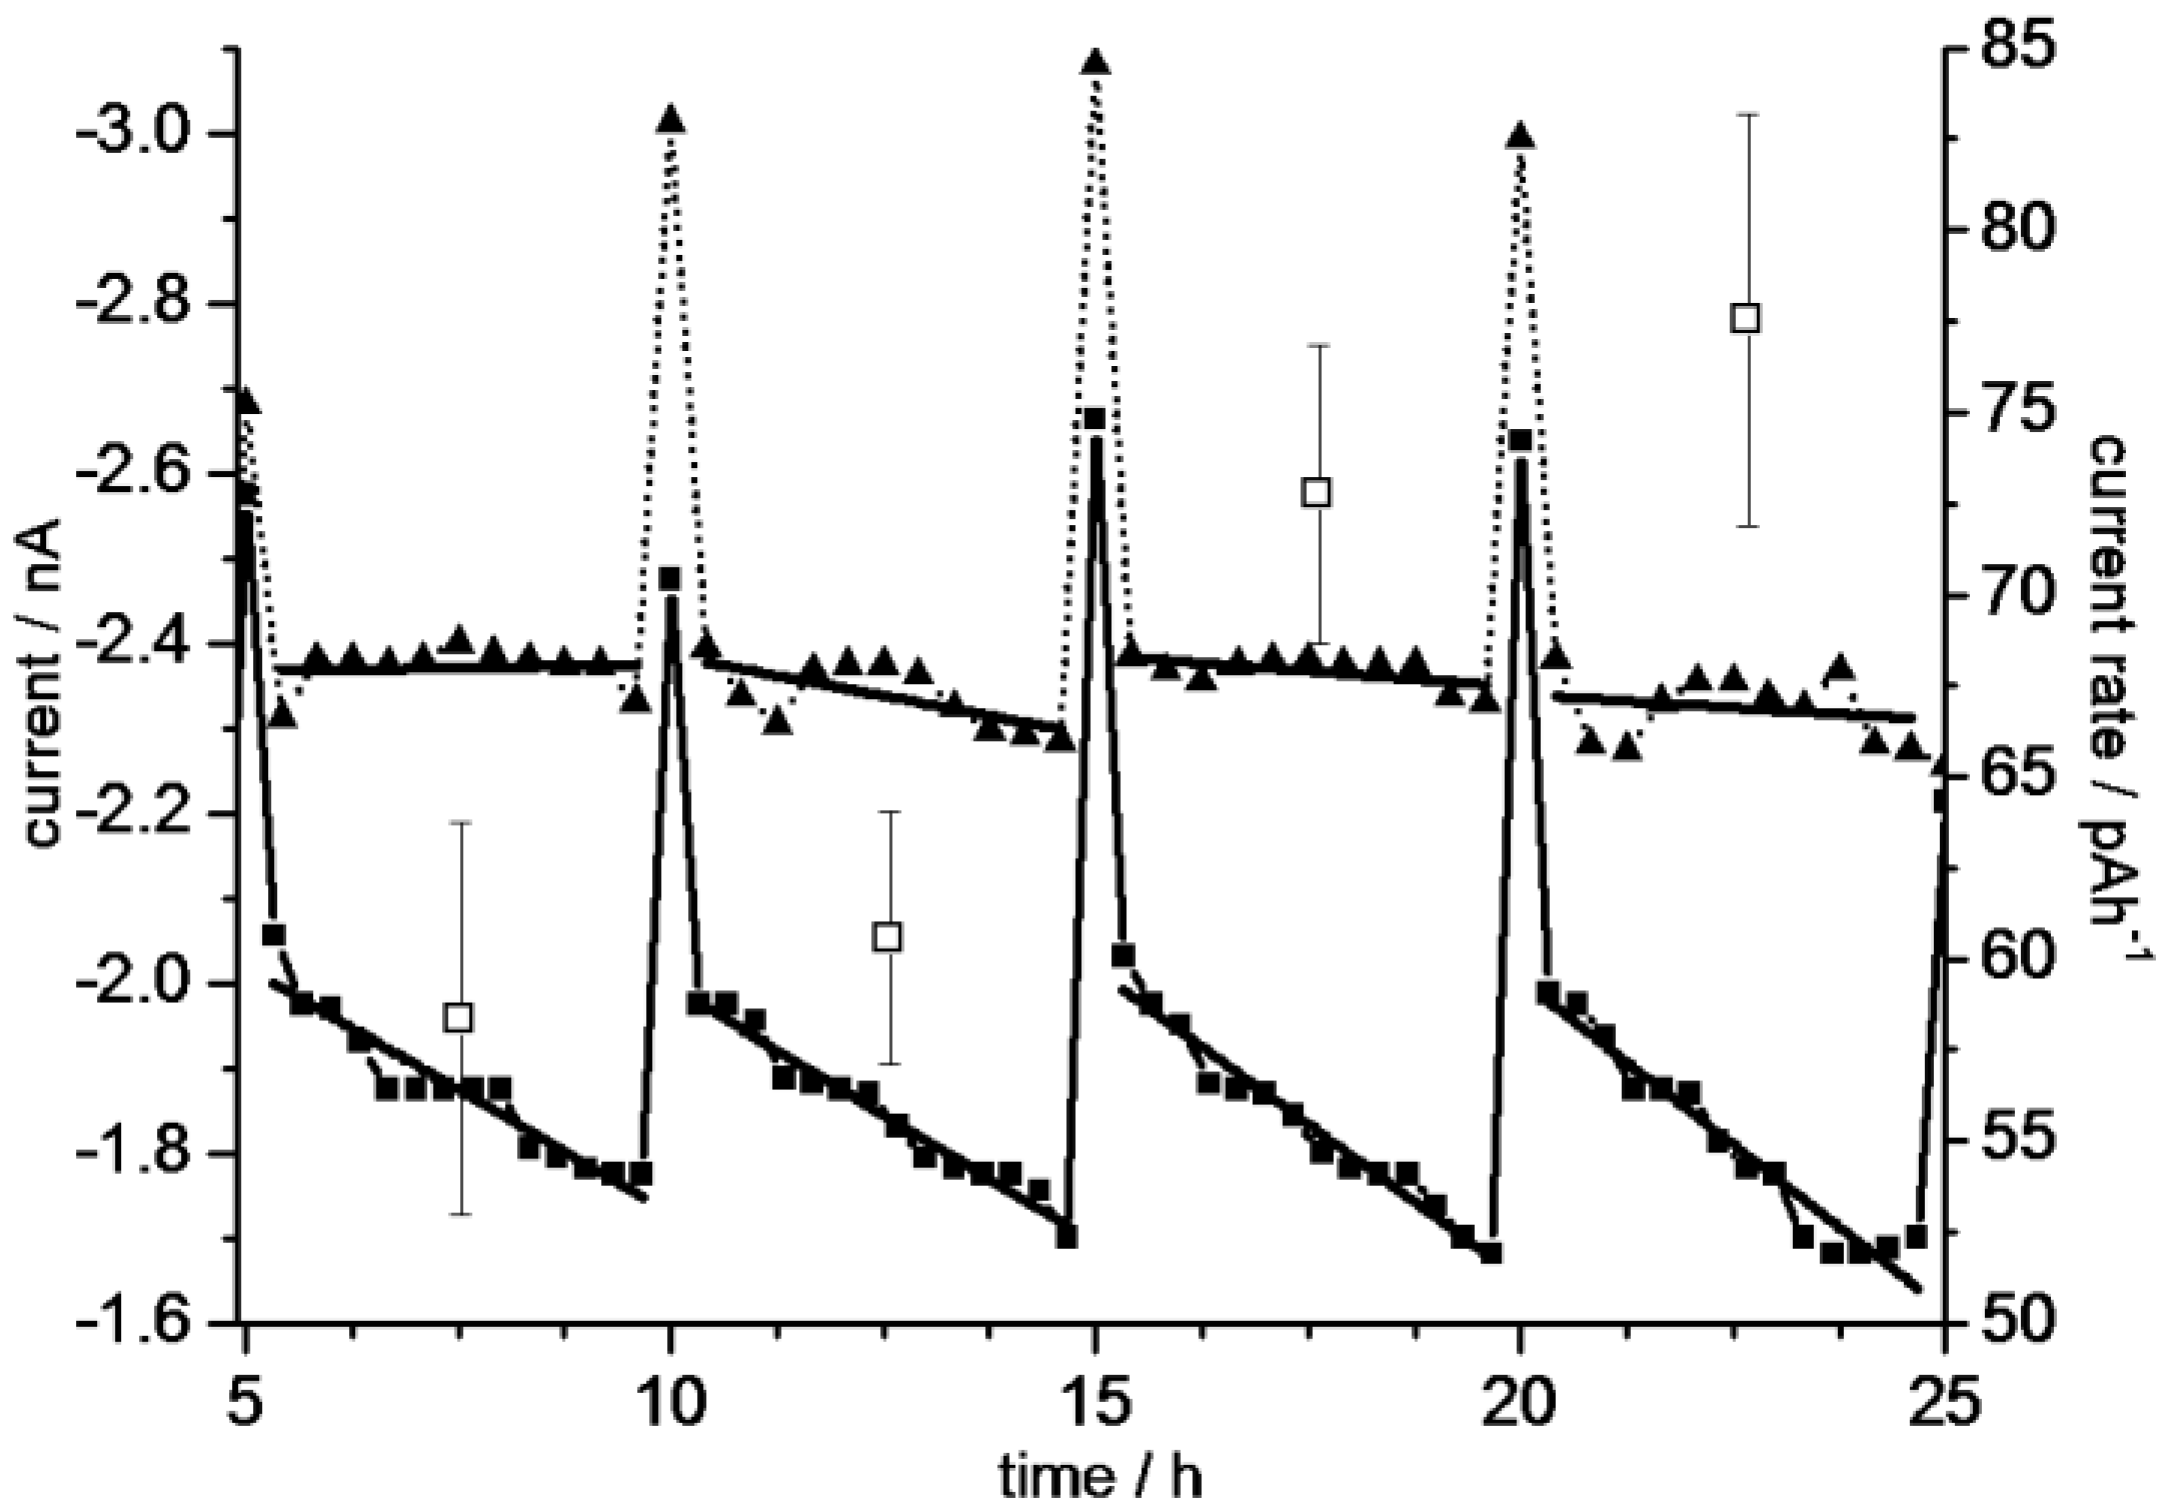
3.4. Oxygen Sensors

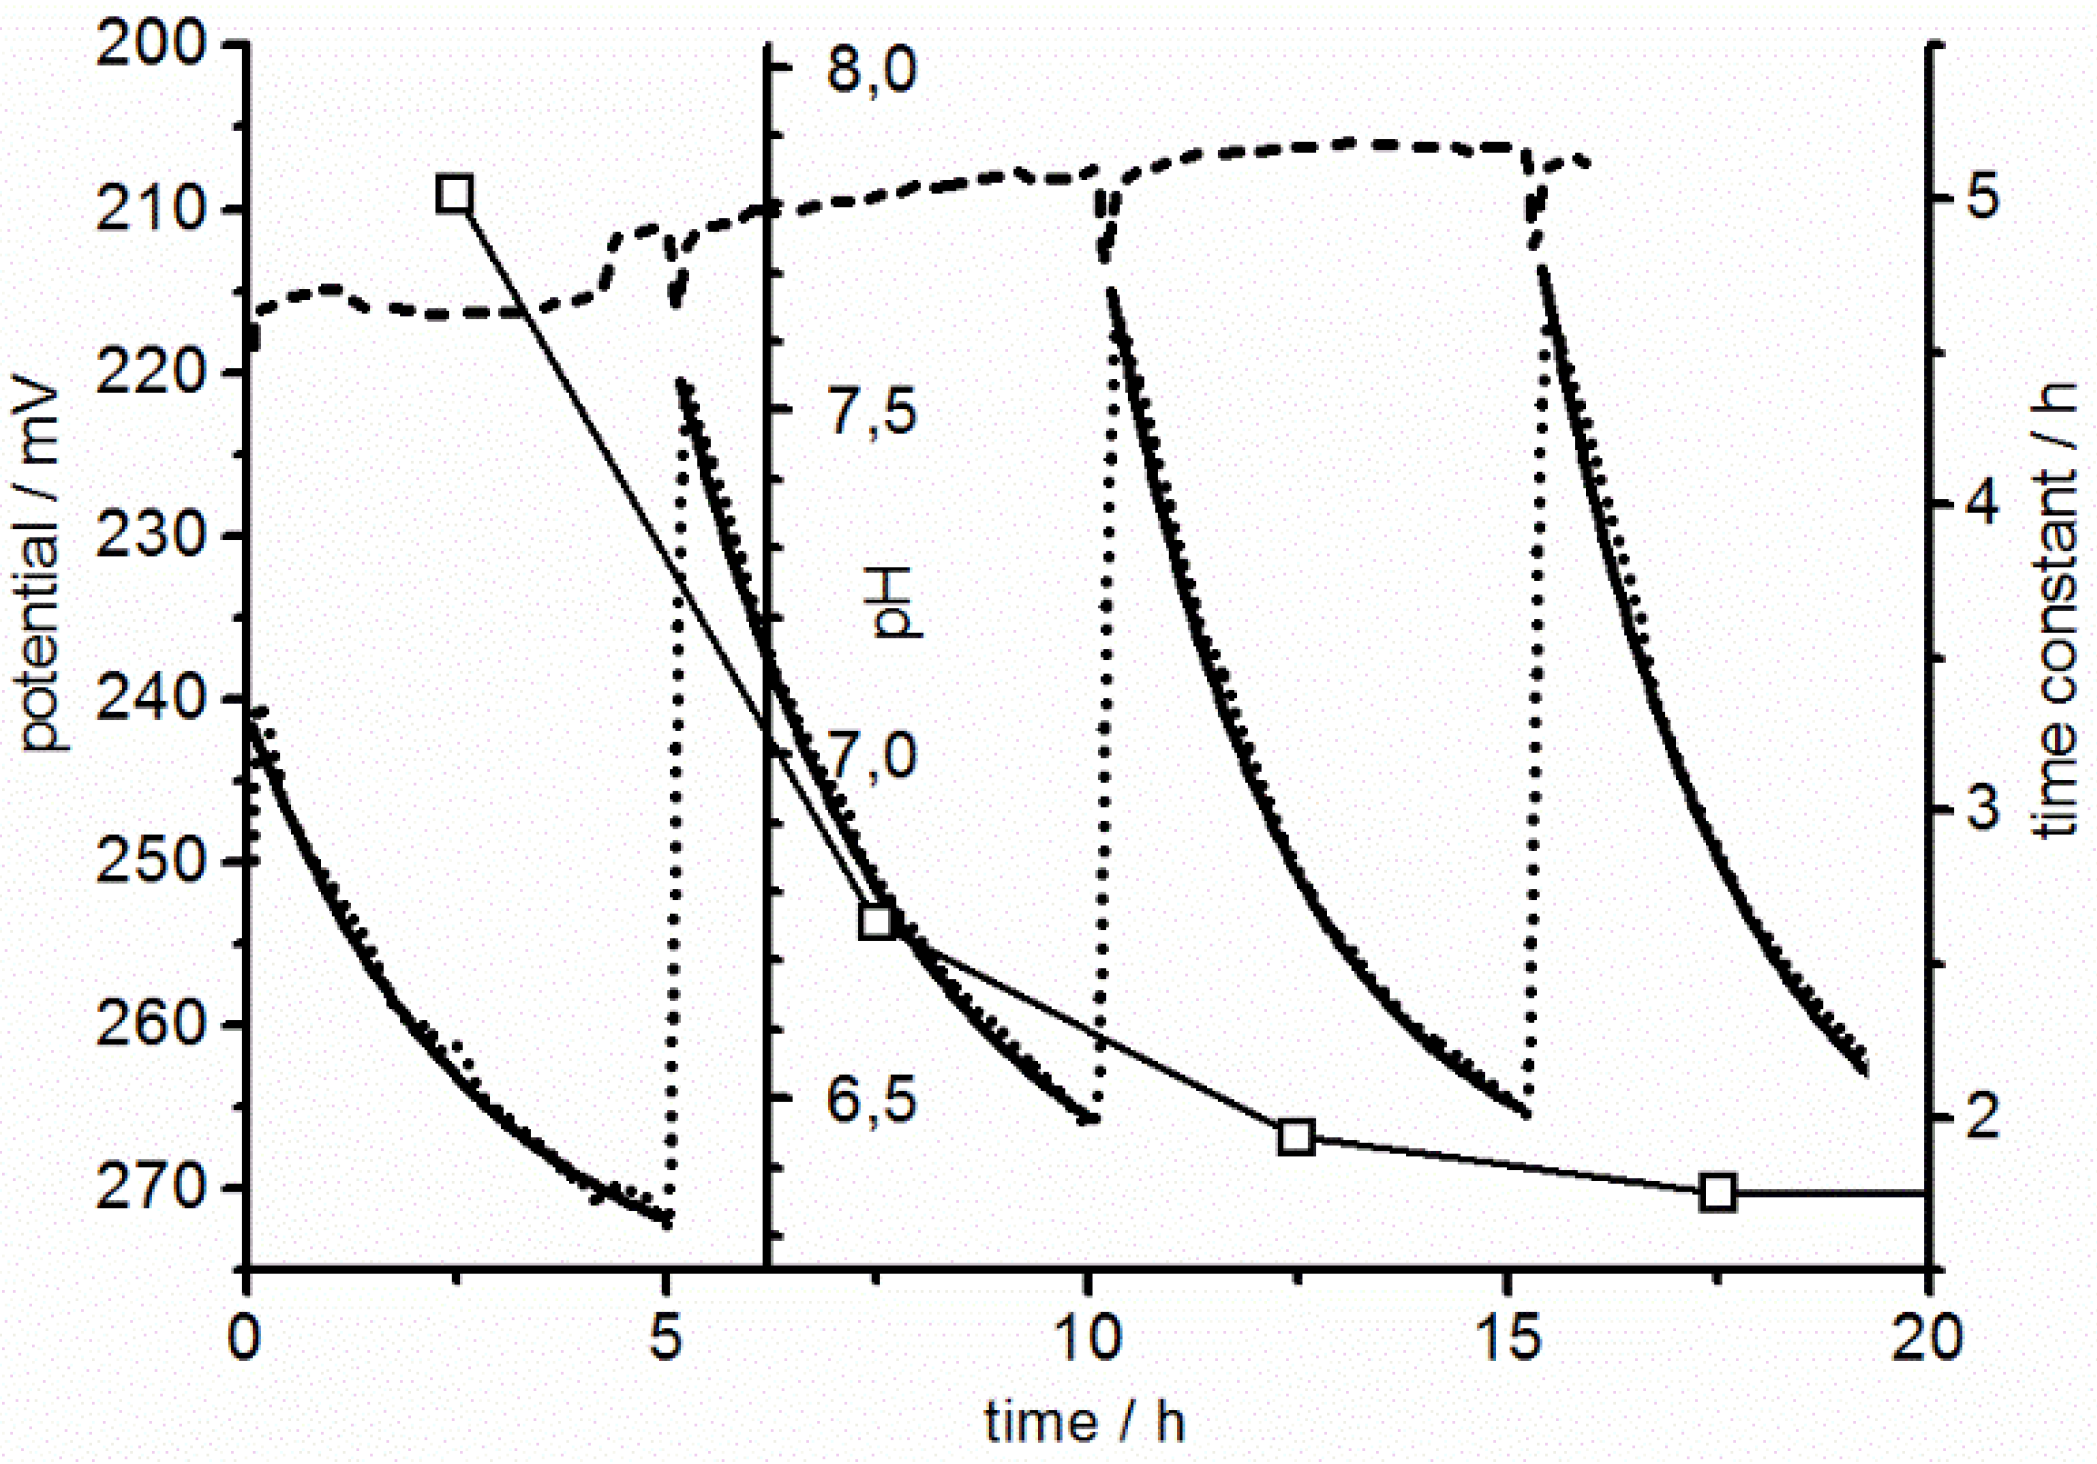
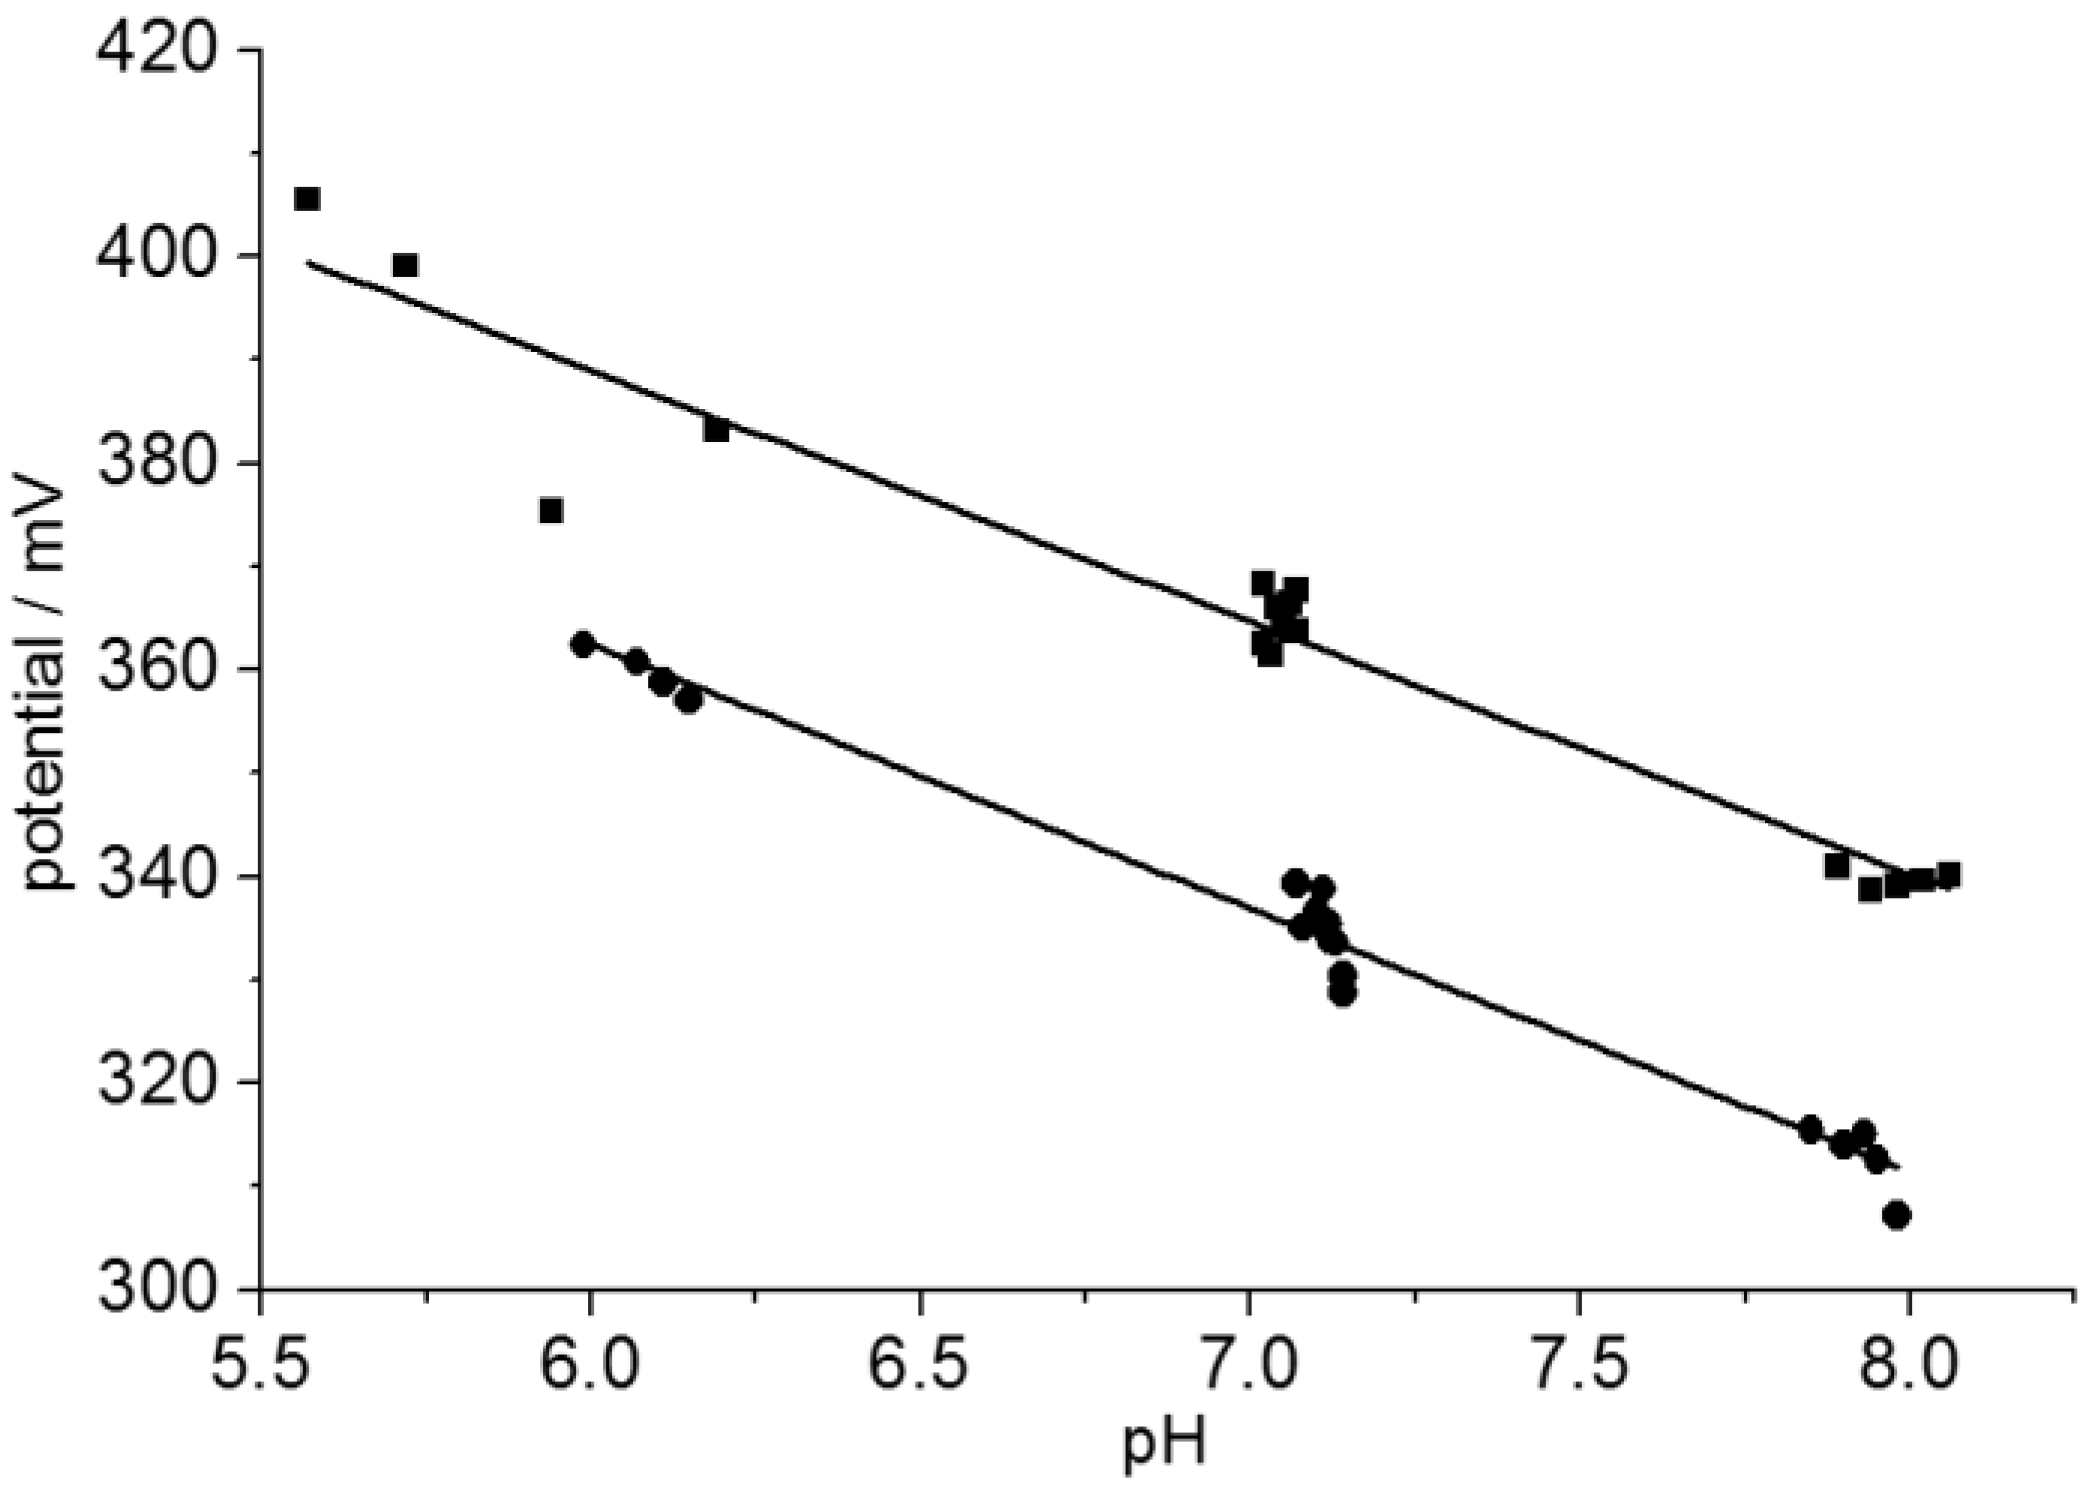
3.5. pH Sensors

3.6. The multi-Parameter Problem
4. Conclusions
Acknowledgments
Author Contributions
Conflicts of Interest
References
- Daridon, A.; Fascio, V.; Lichtenberg, J.; Wuetrich, R.; Langen, H.; Verpoorte, E.; de Rooij, N. Multi-layer microfluidic glass chips for microanalytical applications. Fresenius J. Anal. Chem. 2001, 371, 261–269. [Google Scholar] [CrossRef] [PubMed]
- El-Ali, J.; Sorger, P.K.; Jensen, K.F. Cells on chips. Nature 2006, 442, 403–411. [Google Scholar] [CrossRef] [PubMed]
- Lee, S.-H.; Moon, J.J.; West, J.L. Three-dimensional micropatterning of bioactive hydrogels via two-photon laser scanning photolithography for guided 3D cell migration. Biomaterials 2008, 29, 2962–2968. [Google Scholar] [CrossRef] [PubMed]
- Sung, J.H.; Shuler, M.L. A micro cell culture analog (µCCA) with 3-D hydrogel culture of multiple cell lines to assess metabolism-dependent cytotoxicity of anti-cancer drugs. Lab Chip 2009, 9, 1385–1394. [Google Scholar] [CrossRef] [PubMed]
- Torisawa, Y.; Shiku, H.; Yasukawa, T.; Nishizawa, M.; Matsue, T. Multi-channel 3-D cell culture device integrated on a silicon chip for anticancer drug sensitivity test. Biomaterials 2005, 26, 2165–2172. [Google Scholar] [CrossRef] [PubMed]
- Bonk, S.M.; Oldorf, P.; Peters, R.; Baumann, W.; Gimsa, J. Fast Prototyping of Sensorized Cell Culture Chips and Microfluidic Systems with Ultrashort Laser Pulses. Micromachines 2015, 6, 364–374. [Google Scholar] [CrossRef]
- Ceriotti, L.; Kob, A.; Drechsler, S.; Ponti, J.; Thedinga, E.; Colpo, P.; Ehret, R.; Rossi, F. Online monitoring of BALB/3T3 metabolism and adhesion with multiparametric chip-based system. Anal. Biochem. 2007, 371, 92–104. [Google Scholar] [CrossRef] [PubMed]
- Hagedorn, R.; Fuhr, G.; Lichtwardt-Zinke, K.; Richter, E.; Hornung, J.; Voigt, A. Characterisation of cell movement by impedance measurement on fibroblasts grown on perforated Si-membranes. Biochim. Biophys. Acta BBA Mol. Cell Res. 1995, 1269, 221–232. [Google Scholar] [CrossRef]
- Toh, Y.-C.; Lim, T.C.; Tai, D.; Xiao, G.; van Noort, D.; Yu, H. A microfluidic 3D hepatocyte chip for drug toxicity testing. Lab Chip 2009, 9, 2026–2035. [Google Scholar] [CrossRef] [PubMed]
- Harame, D.L.; Bousse, L.J.; Shott, J.D.; Meindl, J.D. Ion-sensing devices with silicon nitride and borosilicate glass insulators. IEEE Trans. Electron. Devices 1987, 34, 1700–1707. [Google Scholar] [CrossRef]
- Lehmann, M.; Baumann, W.; Brischwein, M.; Gahle, H.J.; Freund, I.; Ehret, R.; Drechsler, S.; Palzer, H.; Kleintges, M.; Sieben, U.; et al. Simultaneous measurement of cellular respiration and acidification with a single CMOS ISFET. Biosens. Bioelectron. 2001, 16, 195–203. [Google Scholar] [CrossRef]
- Poghossian, A.; Ingebrandt, S.; Offenhäusser, A.; Schöning, M.J. Field-effect devices for detecting cellular signals. Semin. Cell Dev. Biol. 2009, 20, 41–48. [Google Scholar] [CrossRef] [PubMed]
- Yeow, T.C.W.; Haskard, M.R.; Mulcahy, D.E.; Seo, H.I.; Kwon, D.H. A very large integrated pH-ISFET sensor array chip compatible with standard CMOS processes. Sens. Actuators B Chem. 1997, 44, 434–440. [Google Scholar] [CrossRef]
- Arquint, P.; van den Berg, A.; van der Schoot, B.H.; de Rooij, N.F.; Buehler, H.; Morf, W.E.; Duerselen, L.F.J. Integrated blood-gas sensor for pO2, pCO2 and pH. Sens. Actuators B Chem. 1993, 13, 340–344. [Google Scholar] [CrossRef]
- Revsbech, N.P.; Ward, D.M. Oxygen microelectrode that is insensitive to medium chemical composition: Use in an acid microbial mat dominated by Cyanidium caldarium. Appl. Environ. Microbiol. 1983, 45, 755–759. [Google Scholar] [PubMed]
- Ceriotti, L.; Ponti, J.; Broggi, F.; Kob, A.; Drechsler, S.; Thedinga, E.; Colpo, P.; Sabbioni, E.; Ehret, R.; Rossi, F. Real-time assessment of cytotoxicity by impedance measurement on a 96-well plate. Sens. Actuators B Chem. 2007, 123, 769–778. [Google Scholar] [CrossRef]
- Baumann, W.H.; Lehmann, M.; Schwinde, A.; Ehret, R.; Brischwein, M.; Wolf, B. Microelectronic sensor system for microphysiological application on living cells. Sens. Actuators B Chem. 1999, 55, 77–89. [Google Scholar] [CrossRef]
- Ehret, R.; Baumann, W.; Brischwein, M.; Schwinde, A.; Wolf, B. On-line control of cellular adhesion with impedance measurements using interdigitated electrode structures. Med. Biol. Eng. Comput. 1998, 36, 365–370. [Google Scholar] [CrossRef] [PubMed]
- Koester, P.J.; Buehler, S.M.; Stubbe, M.; Tautorat, C.; Niendorf, M.; Baumann, W.; Gimsa, J. Modular glass chip system measuring the electric activity and adhesion of neuronal cells—Application and drug testing with sodium valproic acid. Lab Chip 2010, 10, 1579–1586. [Google Scholar] [CrossRef] [PubMed]
- Tourovskaia, A.; Figueroa-Masot, X.; Folch, A. Differentiation-on-a-chip: A microfluidic platform for long-term cell culture studies. Lab Chip 2005, 5, 14–19. [Google Scholar] [CrossRef] [PubMed]
- Zanzotto, A.; Szita, N.; Boccazzi, P.; Lessard, P.; Sinskey, A.J.; Jensen, K.F. Membrane-aerated microbioreactor for high-throughput bioprocessing. Biotechnol. Bioeng. 2004, 87, 243–254. [Google Scholar] [CrossRef] [PubMed]
- Furlani, D.; Li, W.; Pittermann, E.; Klopsch, C.; Wang, L.; Knopp, A.; Jungebluth, P.; Thedinga, E.; Havenstein, C.; Westien, I.; et al. A transformed cell population derived from cultured mesenchymal stem cells has no functional effect after transplantation into the injured heart. Cell Transplant. 2009, 18, 319–331. [Google Scholar] [CrossRef] [PubMed]
- Thedinga, E.; Kob, A.; Holst, H.; Keuer, A.; Drechsler, S.; Niendorf, R.; Baumann, W.; Freund, I.; Lehmann, M.; Ehret, R. Online monitoring of cell metabolism for studying pharmacodynamic effects. Toxicol. Appl. Pharmacol. 2007, 220, 33–44. [Google Scholar] [CrossRef] [PubMed]
- Thedinga, E.; Ullrich, A.; Drechsler, S.; Niendorf, R.; Kob, A.; Runge, D.; Keuer, A.; Freund, I.; Lehmann, M.; Ehret, R. In vitro system for the prediction of hepatotoxic effects in primary hepatocytes. Altex 2007, 24, 22–34. [Google Scholar] [PubMed]
- Weltin, A.; Slotwinski, K.; Kieninger, J.; Moser, I.; Jobst, G.; Wego, M.; Ehret, R.; Urban, G.A. Cell culture monitoring for drug screening and cancer research: A transparent, microfluidic, multi-sensor microsystem. Lab Chip 2014, 14, 138–146. [Google Scholar] [CrossRef] [PubMed]
- Thompson, D.D. Age changes in bone mineralization, cortical thickness, and haversian canal area. Calcif. Tissue Int. 1980, 31, 5–11. [Google Scholar] [CrossRef] [PubMed]
- Kunz, F.; Bergemann, C.; Klinkenberg, E.-D.; Weidmann, A.; Lange, R.; Beck, U.; Nebe, J.B. A novel modular device for 3-D bone cell culture and non-destructive cell analysis. Acta Biomater. 2010, 6, 3798–3807. [Google Scholar] [CrossRef] [PubMed]
- Baumann, W.H. Entwicklung eines Meßsystems zur zellulären Signalanalyse auf Basis von Feldeffekttransistoren. Inaugural-Dissertation, Albert-Ludwigs-Universität, Freiburg im Breisgau, Germany, 1996. [Google Scholar]
- Bousse, L.; Mostarshed, S.; van der Schoot, B.; De Rooij, N.F. Comparison of the hysteresis of Ta2O5 and Si3N4 pH-sensing insulators. Sens. Actuators B Chem. 1994, 17, 157–164. [Google Scholar] [CrossRef]
- Bousse, L.; Hafeman, D.; Tran, N. Time-dependence of the chemical response of silicon nitride surfaces. Sens. Actuators B Chem. 1990, 1, 361–367. [Google Scholar] [CrossRef]
- Köhler, M.; Landgraf, U. pH-ISFET-Strukturen, Herstellung und Untersuchung physikalisch-chemischer Eigenschaften. Ph.D. Thesis, Technische Universität Chemnitz, Chemnitz, Germany, 1990. [Google Scholar]
- Schöning, M.J.; Simonis, A.; Ruge, C.; Ecken, H.; Müller-Veggian, M.; Lüth, H. A (bio-) chemical field-effect sensor with macroporous Si as substrate material and a SiO2/LPCVD-Si3N4 double layer as pH transducer. Sensors 2002, 2, 11–22. [Google Scholar] [CrossRef]
- Stubbe, M.; Holtappels, M.; Gimsa, J. A new working principle for ac electro-hydrodynamic on-chip micro-pumps. J. Phys. Appl. Phys. 2007, 40, 6850–6856. [Google Scholar] [CrossRef]
- Holtappels, M.; Stubbe, M.; Gimsa, J. AC-field-induced fluid pumping in microsystems with asymmetric temperature gradients. Phys. Rev. E 2009, 79, 1–10. [Google Scholar] [CrossRef]
- Stubbe, M.; Gyurova, A.; Gimsa, J. Experimental verification of an equivalent circuit for the characterization of electrothermal micropumps: High pumping velocities induced by the external inductance at driving voltages below 5 V. Electrophoresis 2013, 34, 562–574. [Google Scholar] [CrossRef] [PubMed]
- Stubbe, M.; Gimsa, J. A short review on AC electro-thermal micropumps based on smeared structural polarizations in the presence of a temperature gradient. Colloids Surf. Physicochem. Eng. Asp. 2011, 376, 97–101. [Google Scholar] [CrossRef]
- Bloomfield, V. Computer Simulation and Data Analysis in Molecular Biology and Biophysics. In Biological and Medical Physics, Biomedical Engineering; Springer: New York, NY, USA, 2009; pp. 141–157. [Google Scholar]
- Redlin, H. Physikalische Untersuchung und Technologische Beeinflussung der Langzeitstabilität Ionensensitiver Feldeffekttransitoren. Ph.D. Thesis, Humboldt-Universität, Berlin, Germany, 1987. [Google Scholar]
- Park, H.; Kim, D.; Yun, K.S. Single-Cell Manipulation on Microfluidic Chip by Dielectrophoretic Actuation and Impedance Detection. Sens. Actuators B Chem. 2010, 167–173. [Google Scholar] [CrossRef]
- Buehler, S.; Stubbe, M.; Gimsa, U.; Baumann, W.; Gimsa, J. A decrease of intracellular ATP is compensated by increased respiration and acidification at sub-lethal parathion concentrations in murine embryonic neuronal cells: Measurements in metabolic cell-culture chips. Toxicol. Lett. 2011, 207, 182–190. [Google Scholar] [CrossRef] [PubMed]
- Ullmann, A. The piezoelectric valve-less pump—Performance enhancement analysis. Sens. Actuators Phys. 1998, 69, 97–105. [Google Scholar] [CrossRef]
- Swan, G.W. Cancer chemotherapy: Optimal control using the Verhulst-Pearl equation. Bull. Math. Biol. 1986, 48, 381–404. [Google Scholar] [CrossRef] [PubMed]
- Pan, D.; Chen, J.; Nie, L.; Tao, W.; Yao, S. An amperometric glucose biosensor based on poly(o-aminophenol) and Prussian blue films at platinum electrode. Anal. Biochem. 2004, 324, 115–122. [Google Scholar] [CrossRef] [PubMed]
- Cox, M.E.; Dunn, B. Oxygen diffusion in poly(dimethyl siloxane) using fluorescence quenching. I. Measurement technique and analysis. J. Polym. Sci. Part Polym. Chem. 1986, 24, 621–636. [Google Scholar] [CrossRef]
- Ferrell, R.T.; Himmelblau, D.M. Diffusion coefficients of nitrogen and oxygen in water. J. Chem. Eng. Data 1967, 12, 111–115. [Google Scholar] [CrossRef]
- Ross, B.; Cammann, K.; Mokwa, W.; Rospert, M. Ultramicroelectrode arrays as transducers for new amperometric oxygen sensors. Sens. Actuators B Chem. 1992, 7, 758–762. [Google Scholar] [CrossRef]
- Bousse, L.; Bergveld, P. The role of buried OH sites in the response mechanism of inorganic-gate pH-sensitive ISFETs. Sens. Actuators 1984, 6, 65–78. [Google Scholar] [CrossRef]
- Perdomo, J.; Hinkers, H.; Sundermeier, C.; Seifert, W.; Martı́nez, M.O.; Knoll, M. Miniaturized real-time monitoring system for L-lactate and glucose using microfabricated multi-enzyme sensors. Biosens. Bioelectron. 2000, 15, 515–522. [Google Scholar] [CrossRef]
- Chen, W.; Ren, Q.-Q.; Yang, Q.; Wen, W.; Zhao, Y.-D. In Vivo Electrochemical Biosensors for Reactive Oxygen Species Detection: A Mini-Review. Anal. Lett. 2012, 45, 156–167. [Google Scholar] [CrossRef]
- Sun, S.; Ungerböck, B.; Mayr, T. Imaging of oxygen in microreactors and microfluidic systems. Methods Appl. Fluoresc. 2015, 3. [Google Scholar] [CrossRef]
- Pfeiffer, S.A.; Nagl, S. Microfluidic platforms employing integrated fluorescent or luminescent chemical sensors: A review of methods, scope and applications. Methods Appl. Fluoresc. 2015, 3. [Google Scholar] [CrossRef]
- Kafka, J.; Pänke, O.; Abendroth, B.; Lisdat, F. A label-free DNA sensor based on impedance spectroscopy. Electrochim. Acta 2008, 53, 7467–7474. [Google Scholar] [CrossRef]
- Scheller, F.W.; Wollenberger, U.; Warsinke, A.; Lisdat, F. Research and development in biosensors. Curr. Opin. Biotechnol. 2001, 12, 35–40. [Google Scholar] [CrossRef]
- Szeponik, J.; Möller, B.; Pfeiffer, D.; Lisdat, F.; Wollenberger, U.; Makower, A.; Scheller, F.W. Ultrasensitive bienzyme sensor for adrenaline. Biosens. Bioelectron. 1997, 12, 947–952. [Google Scholar] [CrossRef]
- Brischwein, M.; Grothe, H.; Otto, A.M.; Ressler, J.; Lob, V.; Wiest, J.; Wolf, B. Möglichkeiten und Grenzen der Mikrosensortechnologie in zellulärer Diagnostik und Pharmascreening. Chem. Ing. Tech. 2005, 77, 1955–1959. [Google Scholar] [CrossRef]
- Walther, S.; Bonk, S.; Stubbe, M.; Baumann, W.; Gimsa, J. Mikrofluidik, innere Sensorik und Strukturentwurf für ein 3D-Zellkultursystem. In Knöcherne Geweberegeneration Zellphysiologie im Dreidimensionalen; Neumann, H.-G., Klinkenberg, E.-D., Eds.; Shaker: Aachen, Germany, 2014; pp. 73–111. [Google Scholar]
- Pampaloni, F.; Reynaud, E.G.; Stelzer, E.H. The third dimension bridges the gap between cell culture and live tissue. Nat. Rev. Mol. Cell Biol. 2007, 8, 839–845. [Google Scholar] [CrossRef] [PubMed]
- Van de Waterbeemd, H.; Gifford, E. ADMET in silico modelling: Towards prediction paradise? Nat. Rev. Drug Discov. 2003, 2, 192–204. [Google Scholar] [CrossRef] [PubMed]
- Gimsa, J.; Stubbe, M.; Gimsa, U. A short tutorial contribution to impedance and AC-electrokinetic characterization and manipulation of cells and media: Are electric methods more versatile than acoustic and laser methods? J. Electr. Bioimp. 2014, 5, 74–91. [Google Scholar]
© 2015 by the authors; licensee MDPI, Basel, Switzerland. This article is an open access article distributed under the terms and conditions of the Creative Commons Attribution license (http://creativecommons.org/licenses/by/4.0/).
Share and Cite
Bonk, S.M.; Stubbe, M.; Buehler, S.M.; Tautorat, C.; Baumann, W.; Klinkenberg, E.-D.; Gimsa, J. Design and Characterization of a Sensorized Microfluidic Cell-Culture System with Electro-Thermal Micro-Pumps and Sensors for Cell Adhesion, Oxygen, and pH on a Glass Chip. Biosensors 2015, 5, 513-536. https://doi.org/10.3390/bios5030513
Bonk SM, Stubbe M, Buehler SM, Tautorat C, Baumann W, Klinkenberg E-D, Gimsa J. Design and Characterization of a Sensorized Microfluidic Cell-Culture System with Electro-Thermal Micro-Pumps and Sensors for Cell Adhesion, Oxygen, and pH on a Glass Chip. Biosensors. 2015; 5(3):513-536. https://doi.org/10.3390/bios5030513
Chicago/Turabian StyleBonk, Sebastian M., Marco Stubbe, Sebastian M. Buehler, Carsten Tautorat, Werner Baumann, Ernst-Dieter Klinkenberg, and Jan Gimsa. 2015. "Design and Characterization of a Sensorized Microfluidic Cell-Culture System with Electro-Thermal Micro-Pumps and Sensors for Cell Adhesion, Oxygen, and pH on a Glass Chip" Biosensors 5, no. 3: 513-536. https://doi.org/10.3390/bios5030513