Evaluating the Equilibrium Association Constant between ArtinM Lectin and Myeloid Leukemia Cells by Impedimetric and Piezoelectric Label Free Approaches

 and
and
Abstract
:
1. Introduction
2. Experimental Section
2.1. Reagents and Cells
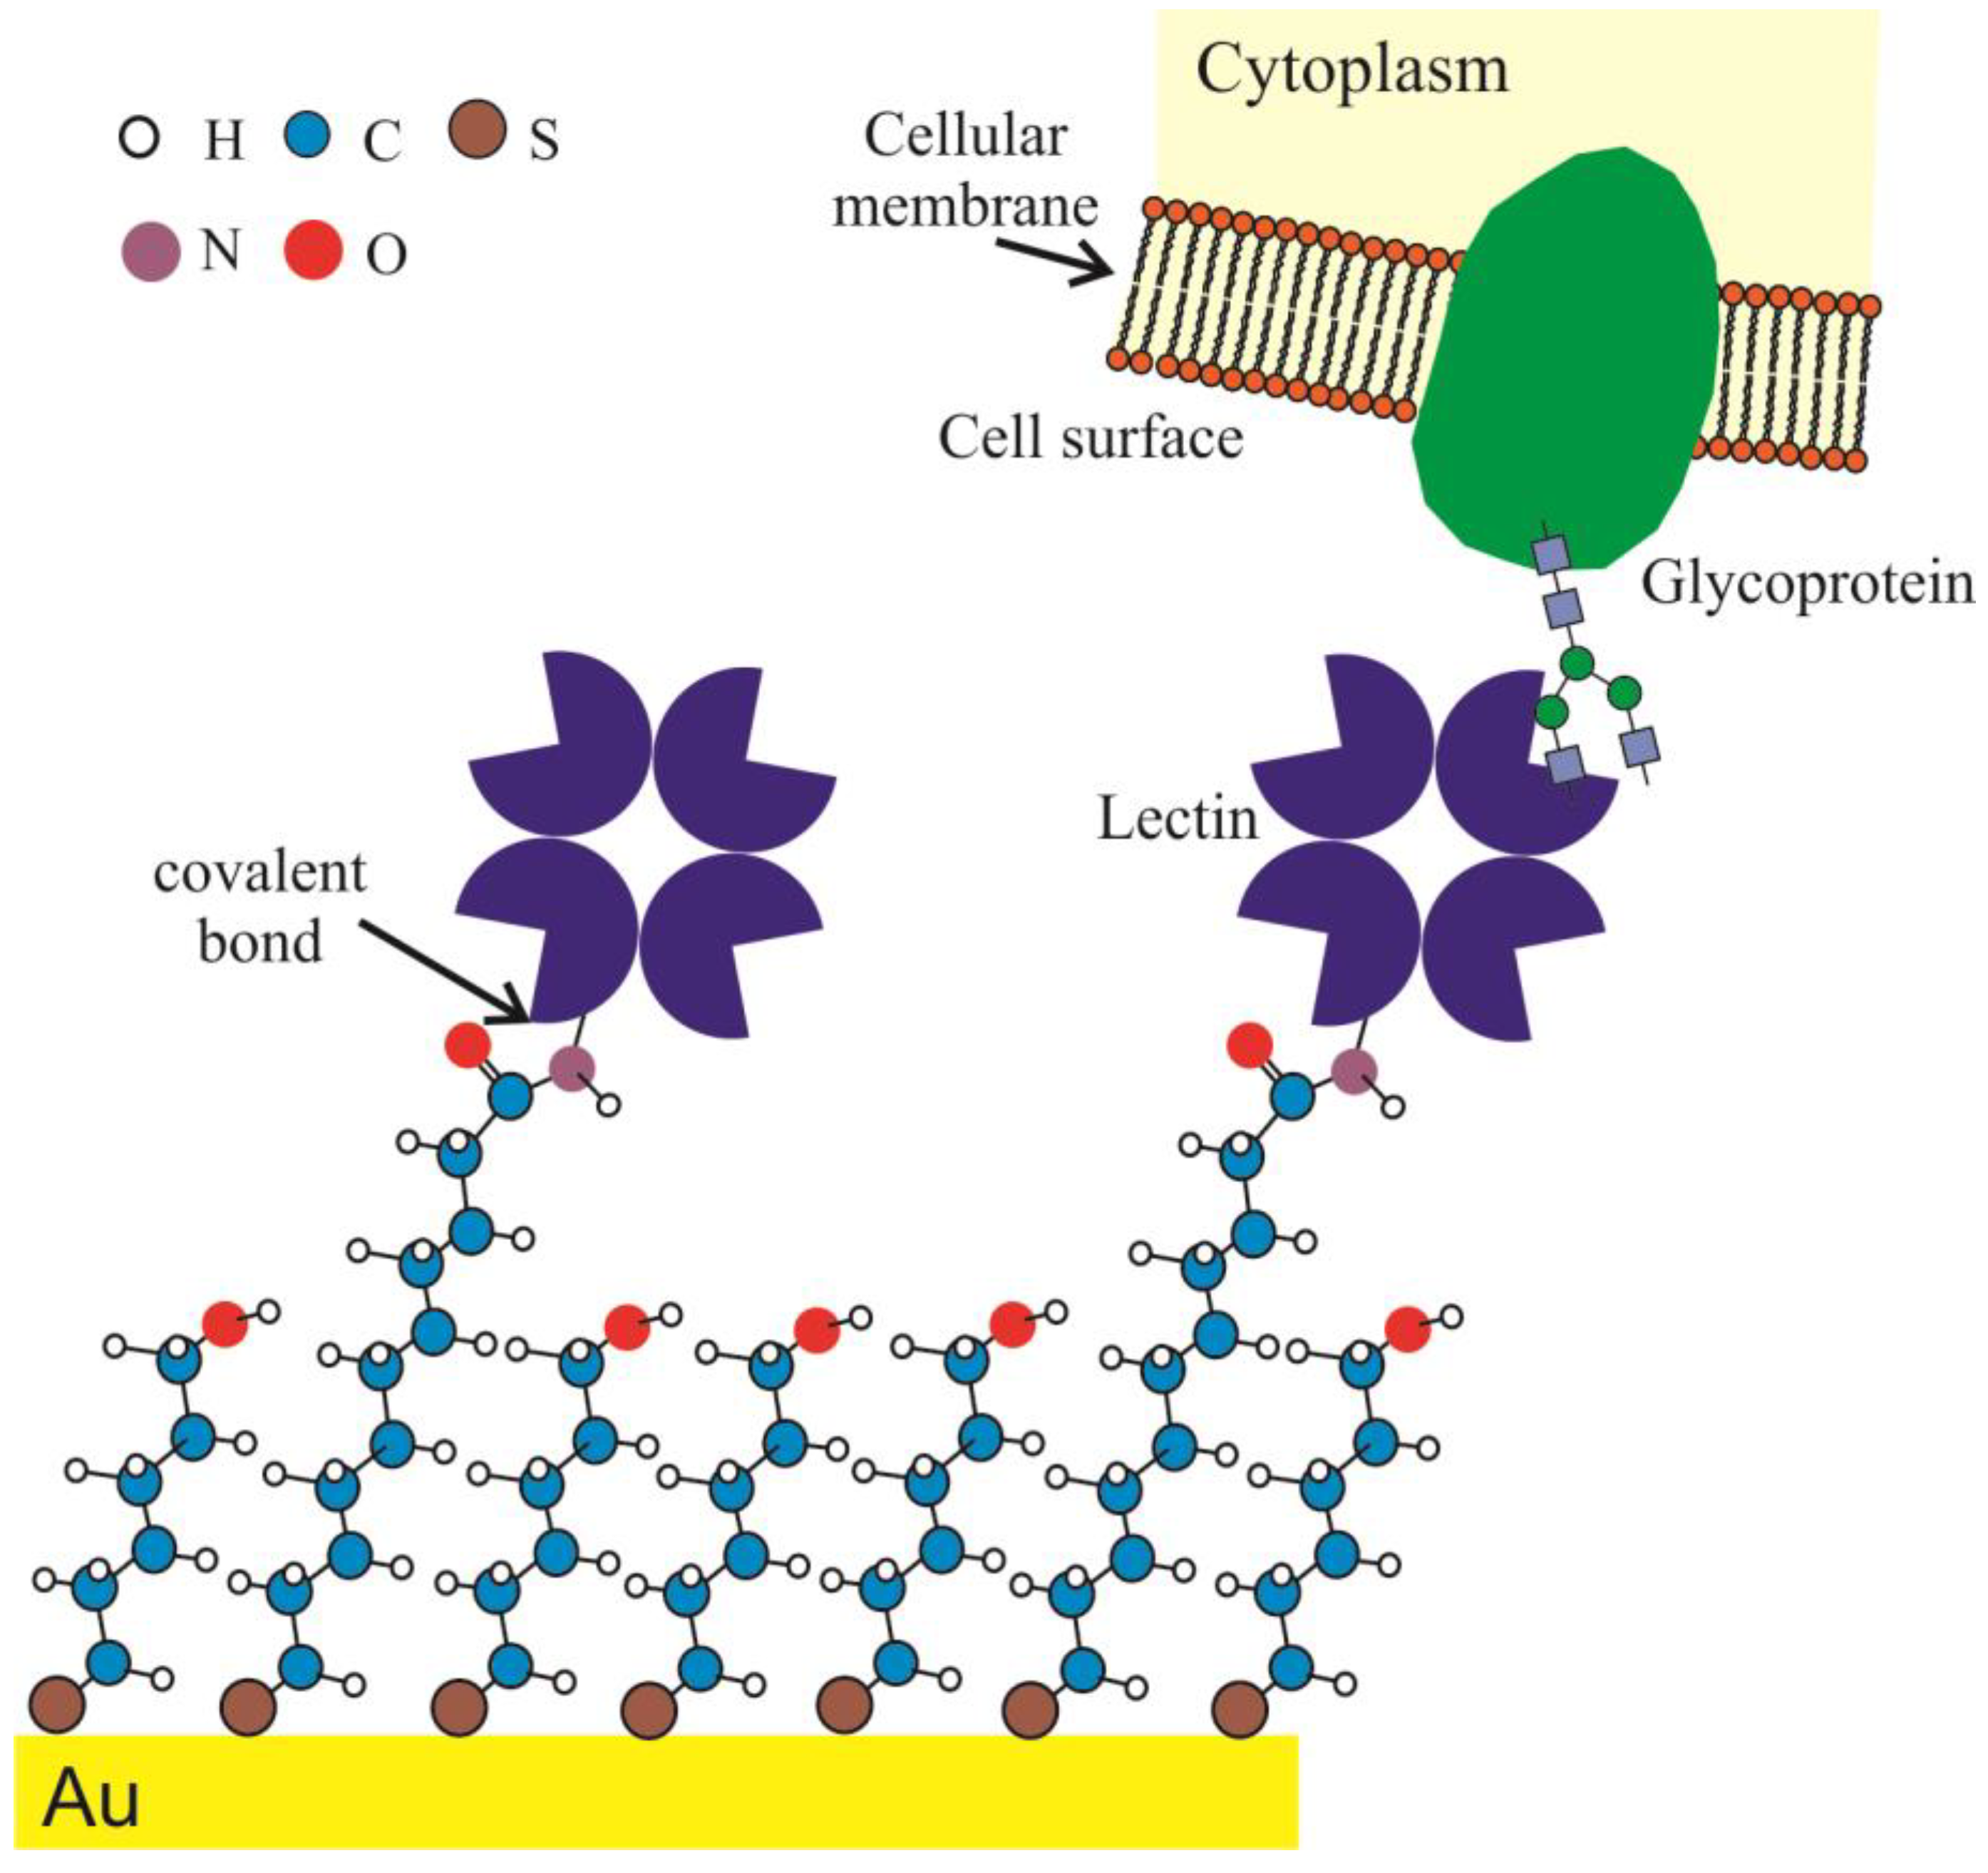
2.2. Surface Engineering and Lectin Sensor Functionalization

2.3. Electrochemical Impedance Spectroscopy (EIS) Analysis
2.4. Quartz Crystal Microbalance (QCM) Analysis
3. Results and Discussion
3.1. Langmuir Isotherm and Determination
3.2. Lectin Biosensor Construction
3.3. Comparison of Obtained by EIS and QCM

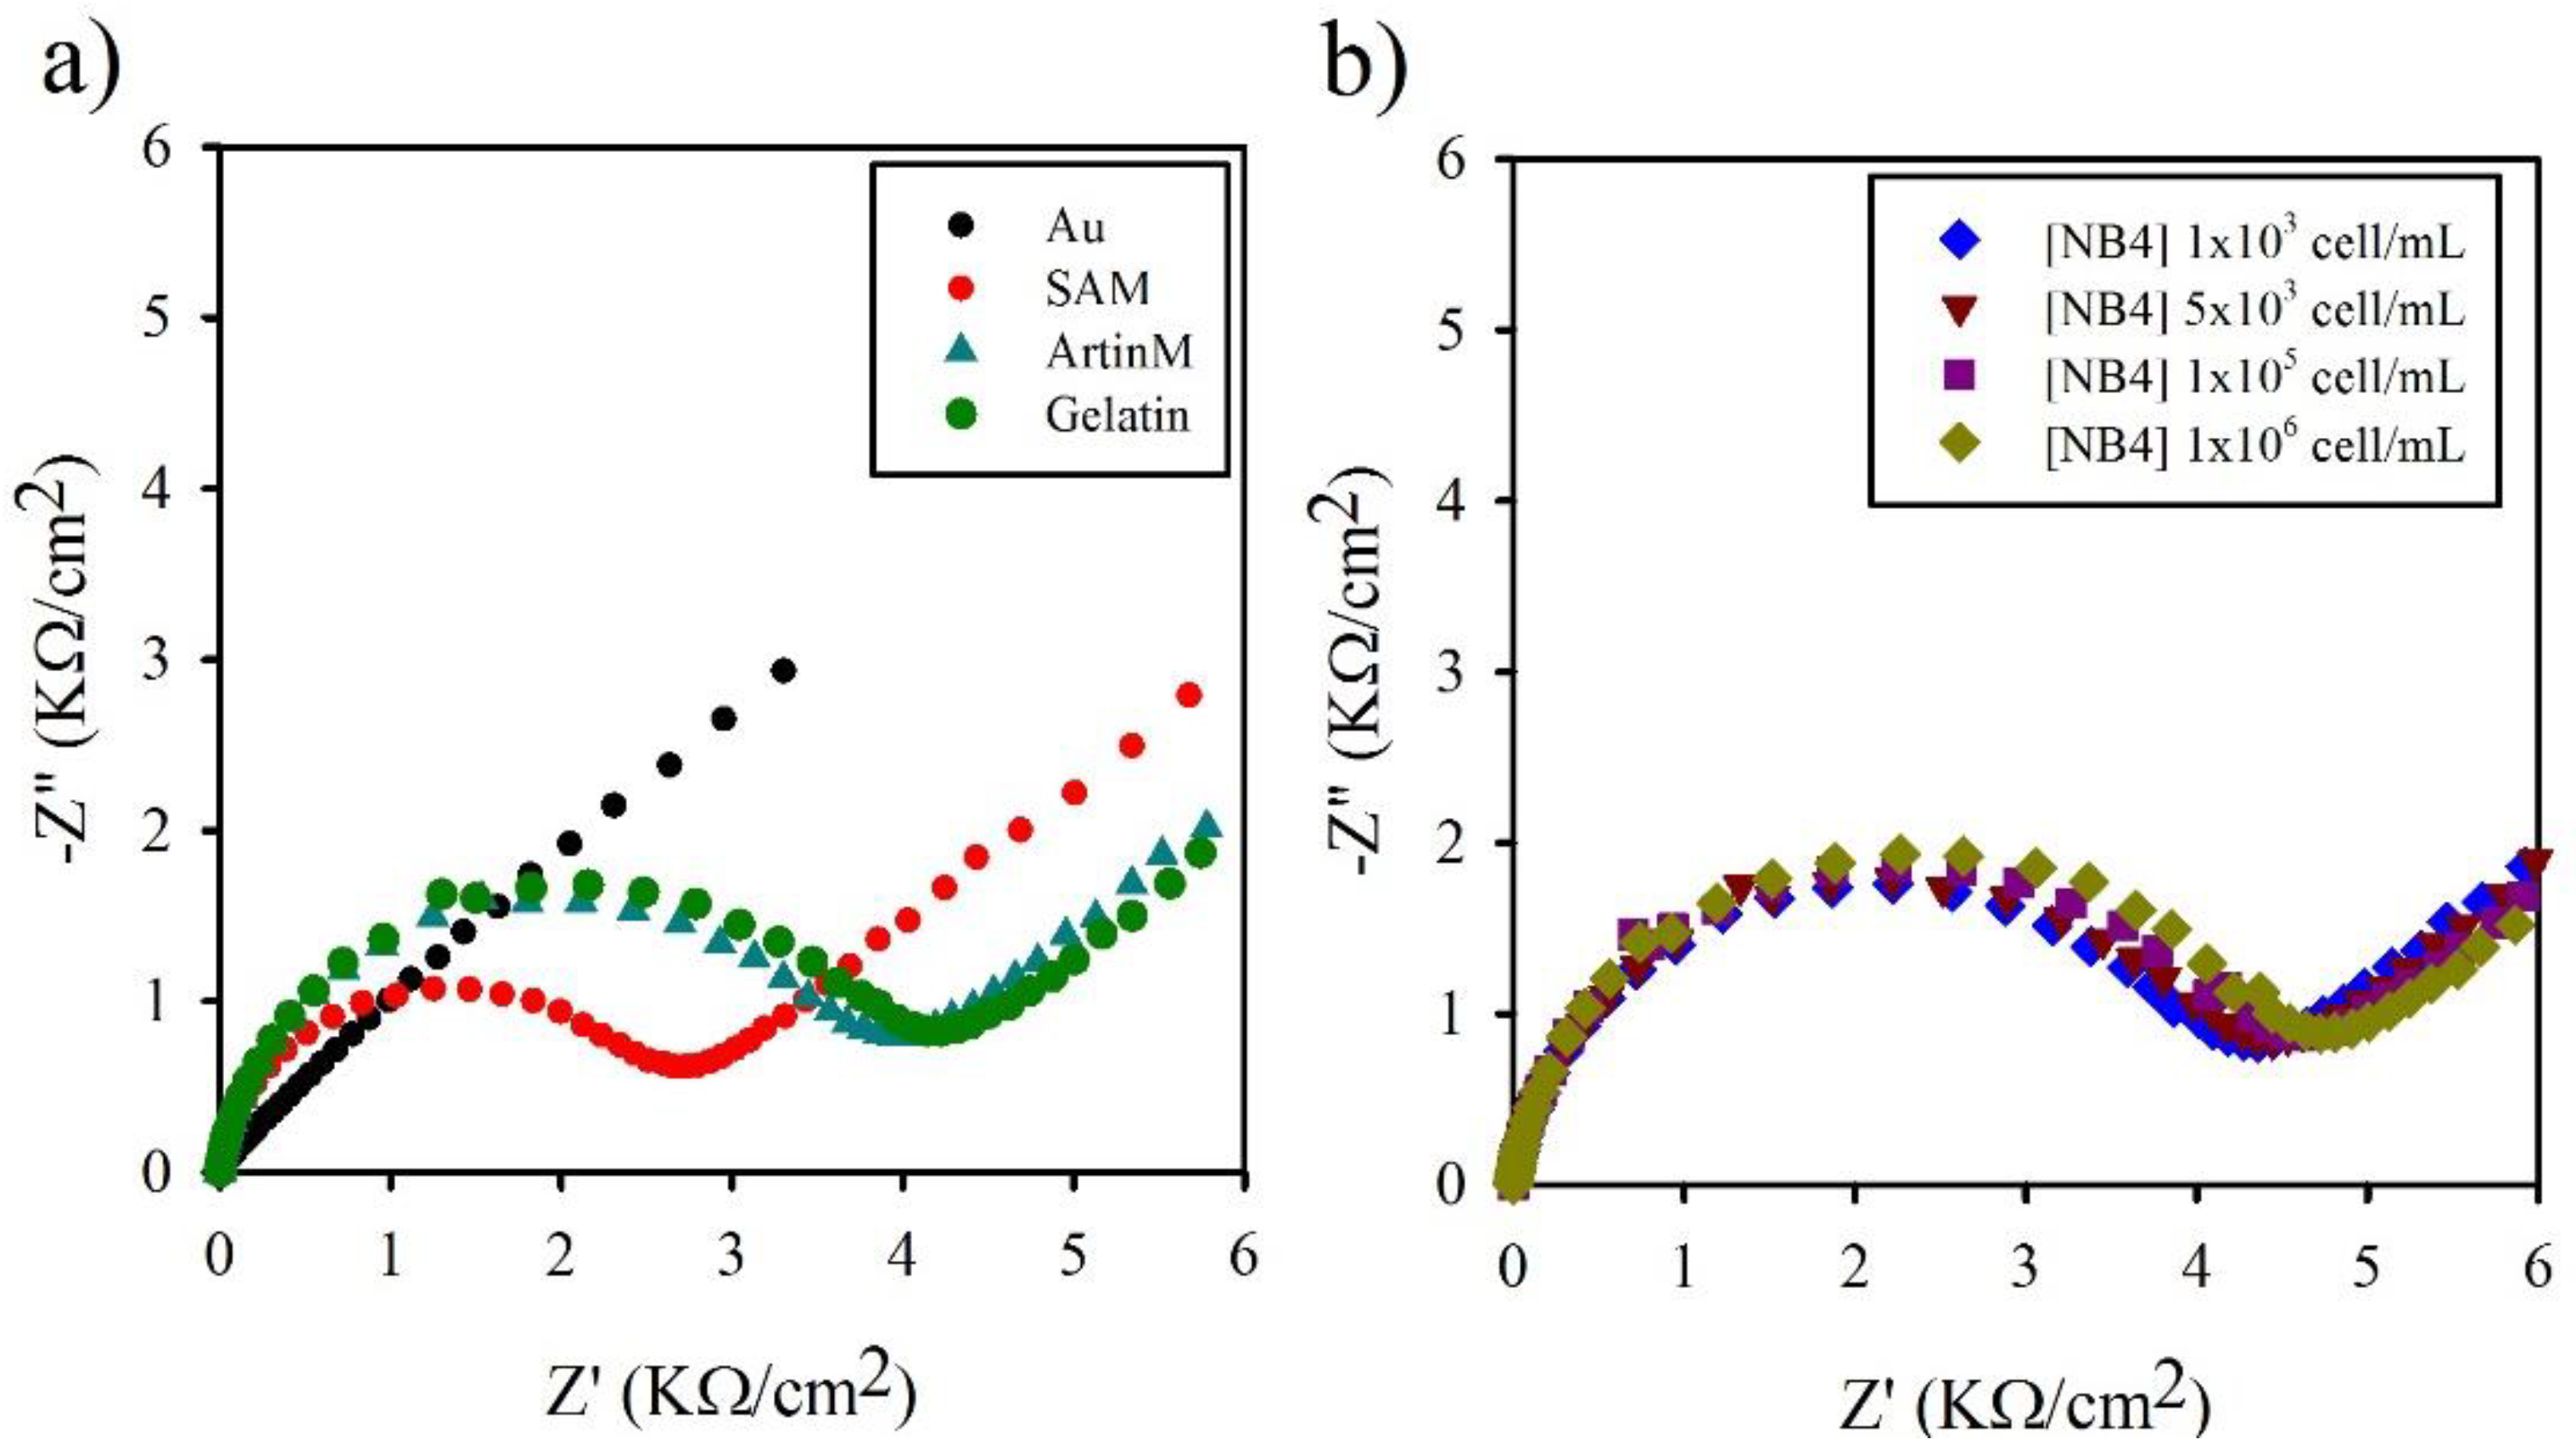
| [NB4] (cell/mL) | ∆Rct (Ω/cm2) | [NB4]/∆Rct (cell·cm2/mL·Ω) |
|---|---|---|
| 1 × 10³ | 186 ± 72 | 05.81 ± 2.25 |
| 5 × 10³ | 273 ± 83 | 19.33 ± 5.05 |
| 1 × 10⁵ | 397 ± 55 | 254.81 ± 34.05 |
| 1 × 10⁶ | 467 ± 54 | 2162.44 ± 270.96 |
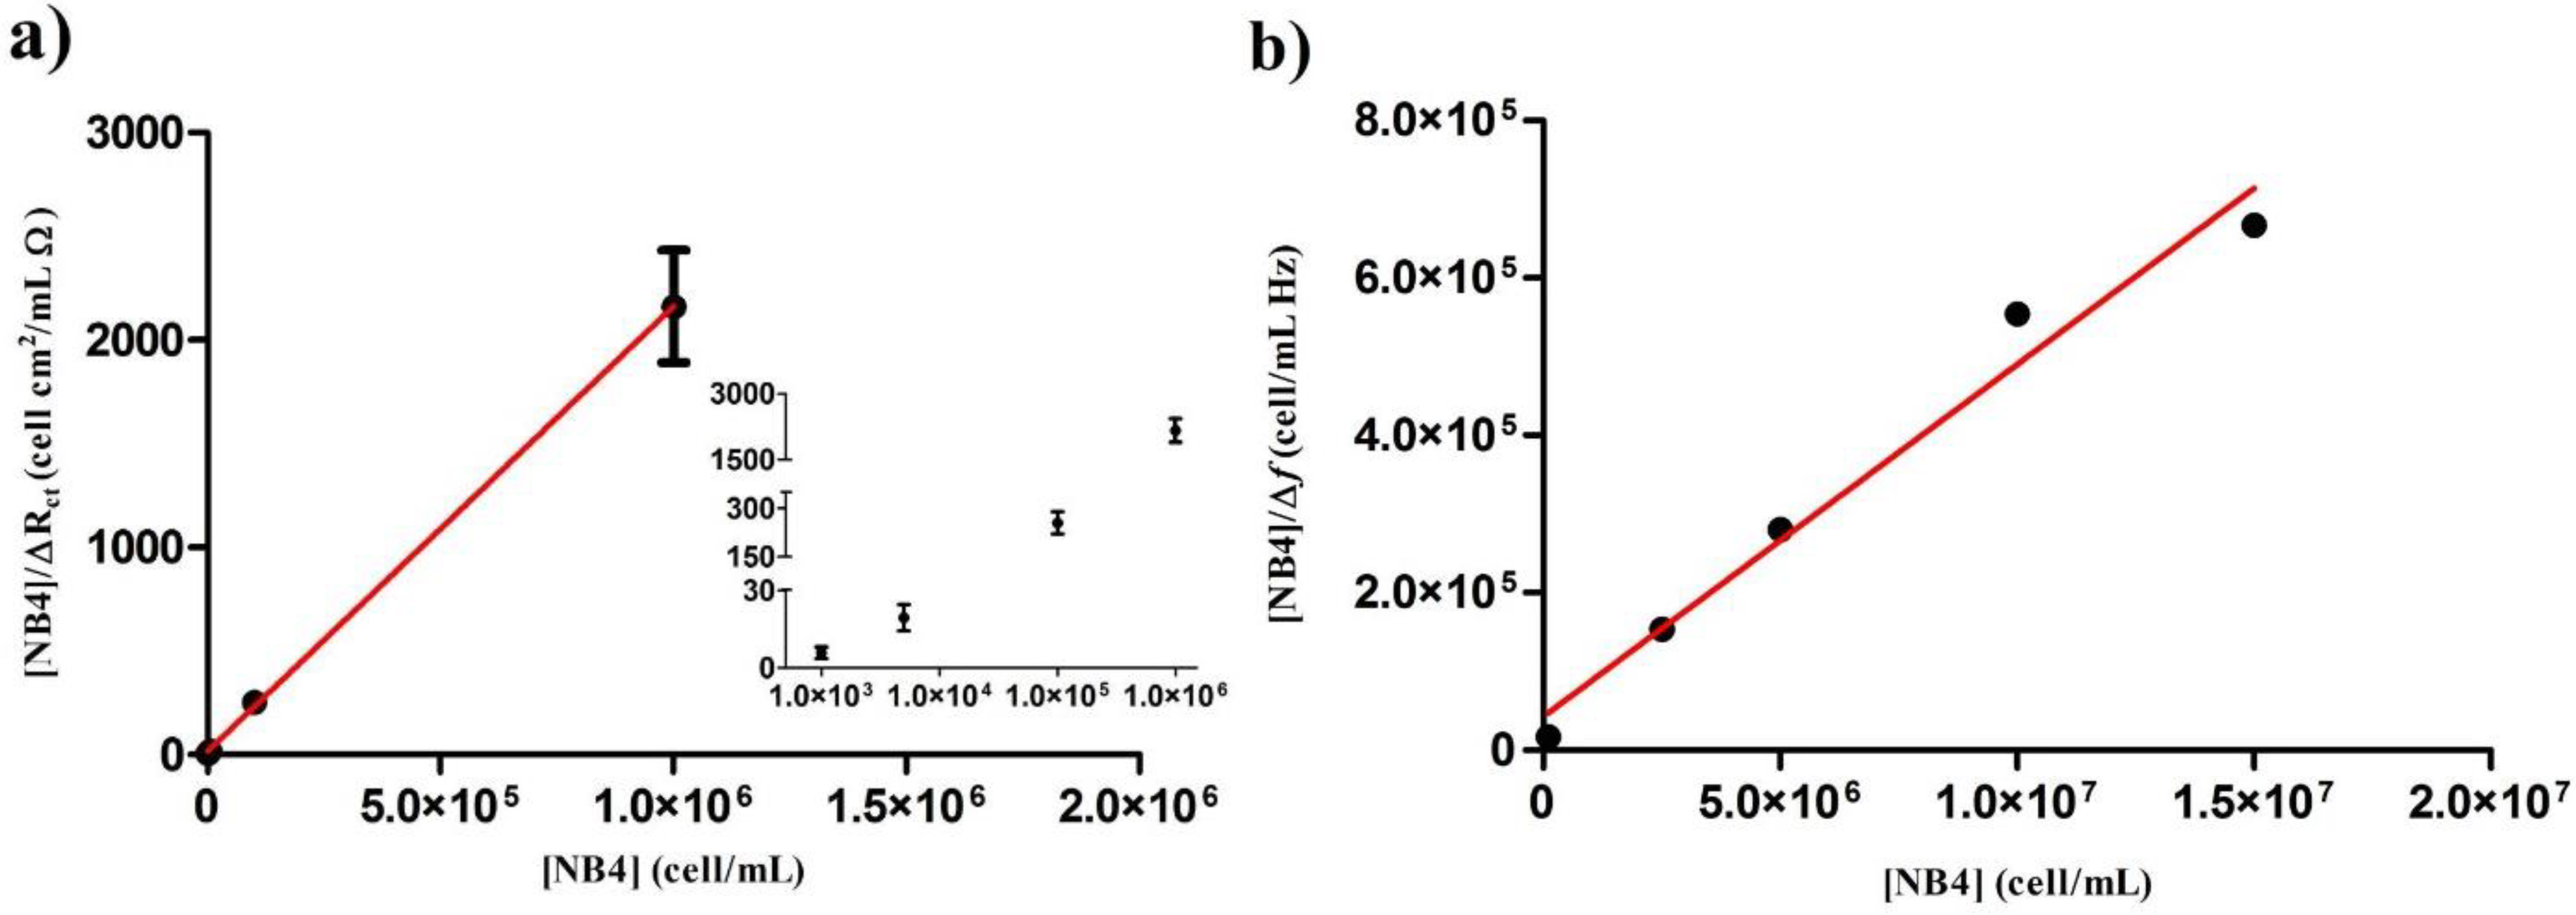
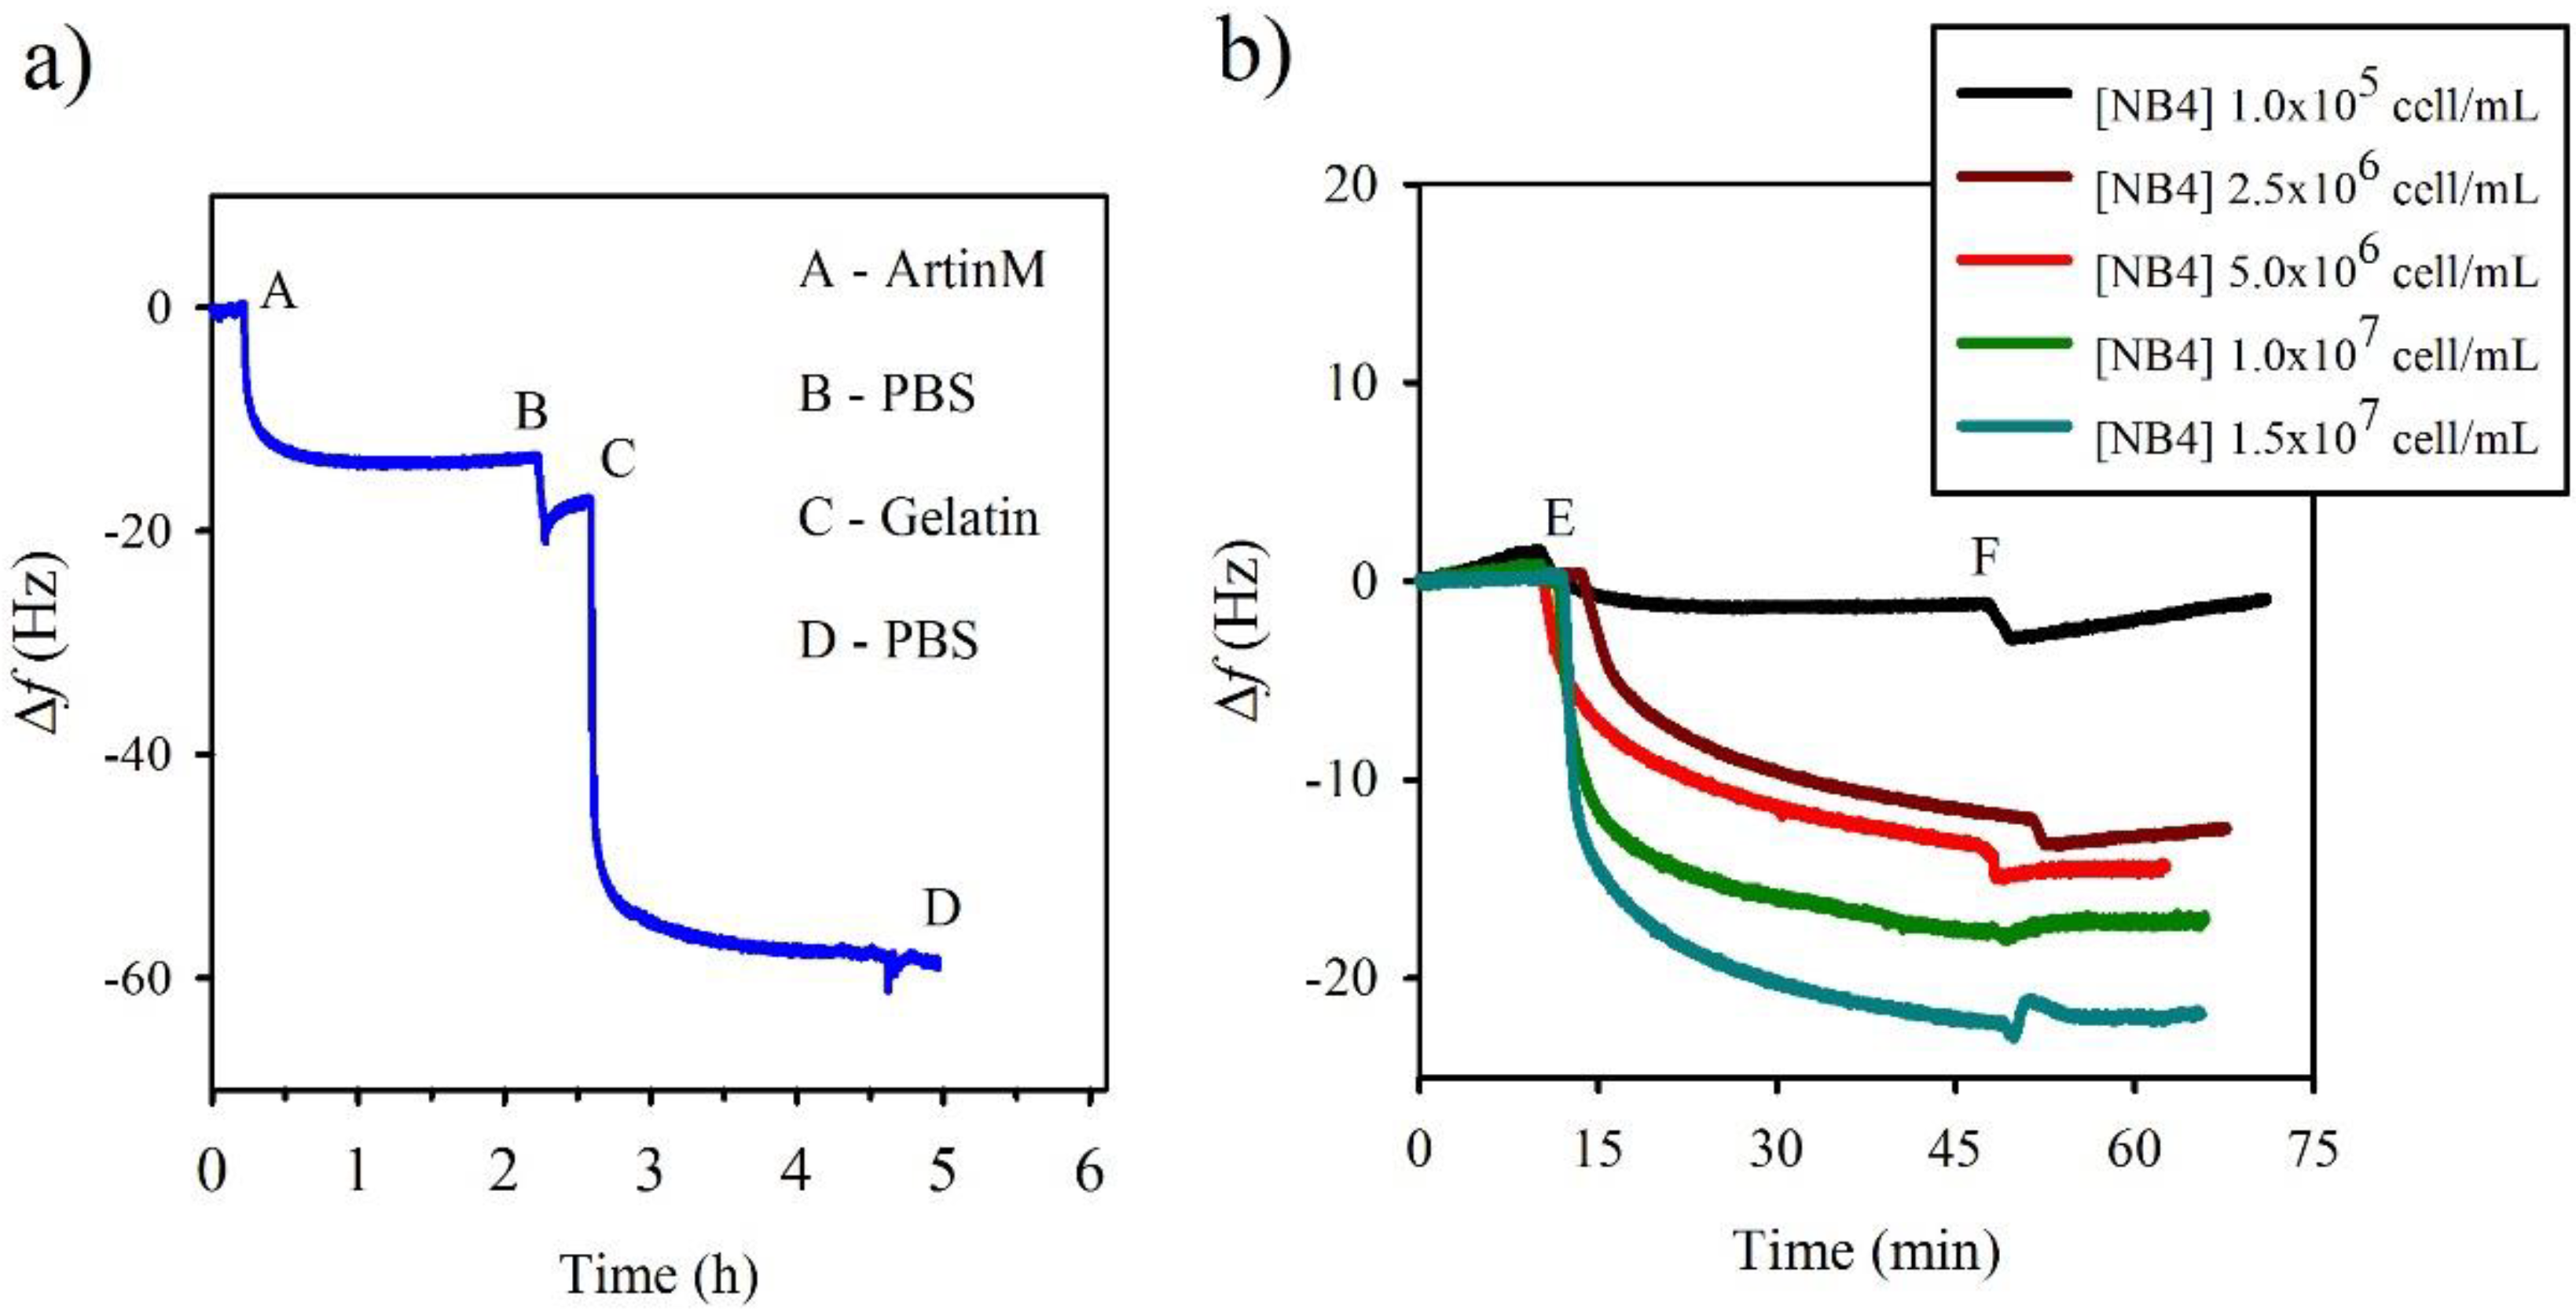
| [NB4] | Δf (Hz) | [NB4]/Δf (cell/mL·Hz) ×105 |
|---|---|---|
| 1.0 × 10⁵ | 05.93 ± 0.89 | 0.17 ± 0.02 |
| 2.5 × 10⁶ | 16.39 ± 1.39 | 1.54 ± 0.13 |
| 5.0 × 10⁶ | 17.83 ± 0.07 | 2.80 ± 0.01 |
| 1.0 × 10⁷ | 18.05 ± 0.01 | 5.54 ± 0.01 |
| 1.5 × 10⁷ | 22.50 ± 0.01 | 6.67 ± 0.01 |
4. Conclusions
Acknowledgments
Author Contributions
Conflicts of Interest
References
- Kim, Y.S.; Yoo, H.S.; Ko, J.H. Implication of aberrant glycosylation in cancer and use of lectin for cancer biomarker discovery. Protein Peptide Lett. 2009, 16. [Google Scholar]
- Naeem, A.; Saleemuddin, M.; Khan, R.H. Glycoprotein targeting and other applications of lectins in biotechnology. Curr. Protein Peptide Sci. 2007, 8. [Google Scholar] [CrossRef]
- Jeyaprakash, A.A.; Srivastav, A.; Surolia, A.; Vijayan, M. Structural basis for the carbohydrate specificities of artocarpin: Variation in the length of a loop as a strategy for generating ligand specificity. J. Mol. Biol. 2004, 338. [Google Scholar]
- Rosa, J.C.; De Oliveira, P.S.L.; Garratt, R.; Beltramini, L.; Resing, K.; Roque-Barreira, M.C.; Greene, L.J. KM+, a mannose-binding lectin from Artocarpus integrifolia: Amino acid sequence, predicted tertiary structure, carbohydrate recognition, and analysis of the beta-prism fold. Protein Sci. 1999, 8. [Google Scholar]
- Pereira-Da-Silva, G.; Moreno, A.N.; Marques, F.; Oliver, C.; Jamur, M.C.; Panunto-Castelo, A.; Roque-Barreira, M.C. Neutrophil activation induced by the lectin KM plus involves binding to CXCR2. BBA-Gen. Subjects 2006, 1760. [Google Scholar] [CrossRef]
- Souza, M.A.; Carvalho, F.C.; Ruas, L.P.; Ricci-Azevedo, R.; Roque-Barreira, M.C. The immunomodulatory effect of plant lectins: A review with emphasis on ArtinM properties. Glycoconjugate J. 2013, 30. [Google Scholar] [CrossRef]
- Chahud, F.; Ramalho, L.N.Z.; Ramalho, F.S.; Haddad, A.; Roque-Barreira, M.C. The lectin KM+ induces corneal epithelial wound healing in rabbits. Int. J. Exp. Pathol. 2009, 90. [Google Scholar] [CrossRef]
- Kim, Y.J.; Carvalho, F.C.; Souza, J.A.C.; Goncalves, P.C.G.; Nogueira, A.V.B.; Spolidorio, L.C.; Roque-Barreira, M.C.; Cirelli, J.A. Topical application of the lectin Artin M accelerates wound healing in rat oral mucosa by enhancing TGF-beta and VEGF production. Wound Repair Regen. 2013, 21. [Google Scholar] [CrossRef]
- Carvalho, F.C.; Soares, S.G.; Tamarozzi, M.B.; Rego, E.M.; Roque-Barreira, M.C. The recognition of N-glycans by the lectin ArtinM mediates cell death of a human myeloid leukemia cell line. PLoS ONE 2011, 6. [Google Scholar] [CrossRef]
- Katrlík, J.; Skrabana, R.; Mislovicová, D.; Gemeiner, P. Binding of D-mannose-containing glycoproteins to D-mannose-specific lectins studied by surface plasmon resonance. Colloid Surface A Physicochem. Eng. Aspect. 2011, 382. [Google Scholar]
- Safina, G.; Duran, I. B.; Alasel, M.; Danielsson, B. Surface plasmon resonance for real-time study of lectin–carbohydrate interactions for the differentiation and identification of glycoproteins. Talanta 2011, 84. [Google Scholar] [CrossRef]
- Olkhov, R.V.; Weissenborn, M.J.; Flitsch, S.L.; Shaw, A.M. Gycosylation characterization of human and porcine fibrinogen proteins by lectin-binding biophotonicmicroarray imaging. Anal Chem. 2014, 86. [Google Scholar] [CrossRef]
- Gimenez-Romero, D.; Bueno, P.R.; Pesquero, N.S.; Monzo, I.S.; Puchades, R.; Maquieira, A. Elucidation of carbohydrate molecular interaction mechanism of recombinant and native ArtinM. J. Phys. Chem. B 2013, 117. [Google Scholar] [CrossRef]
- Lebed, K.; Kulik, A.J.; Forro, L.; Lekka, M. Lectin-carbohydrate affinity measured using a quartz crystal microbalance. J. Colloid Interf. Sci. 2006, 299. [Google Scholar]
- Pedroso, M.M.; Pesquero, N.C.; Thomaz, S.M.O.; Roque-Barreira, M.C.; Faria, R.C.; Bueno, P.R. Jacalin interaction with human immunoglobulin A1 and bovine immunoglobulin G1: Affinity constant determined by piezoelectric biosensoring. Glycobiology 2012, 22. [Google Scholar] [CrossRef]
- Pesquero, N.C.; Pedroso, M.M.; Watanabe, A.M.; Goldman, M.H.S.; Faria, R.C.; Roque-Barreira, M.C.; Bueno, P.R. Real-time monitoring and kinetic parameter estimation of the affinity interaction of jArtinM and rArtinM with peroxidase glycoprotein by the electrogravimetric technique. Biosens. Bioelectron. 2010, 26. [Google Scholar] [CrossRef]
- Yakovleva, M.E.; Safina, G.R.; Danielsson, B. A study of glycoprotein-lectin interactions using quartz crystal microbalance. Anal. Chim. Acta 2010, 668. [Google Scholar] [CrossRef]
- Pei, Z.C.; Anderson, H.; Aastrup, T.; Ramstrom, O. Study of real-time lectin-carbohydrate interactions on the surface of a quartz crystal microbalance. Biosens. Bioelectron. 2005, 21. [Google Scholar] [CrossRef]
- Tan, L.; Jia, X.; Jiang, X.F.; Zhang, Y.Y.; Tang, H.; Yao, S.Z.; Xie, Q.J. Real-time monitoring of the cell agglutination process with a quartz crystal microbalance. Anal. Biochem. 2008, 383. [Google Scholar]
- Loaiza, O.A.; Lamas-Ardisana, P.J.; Jubete, E.; Ochoteco, E.; Loinaz, I.; Cabanero, G.; Garcia, I.; Penades, S. Nanostructured disposable impedimetric sensors as tools for specific biomolecular interactions: Sensitive recognition of Concanavalin A. Anal. Chem. 2011, 83. [Google Scholar] [CrossRef]
- Yang, H.Y.; Li, Z.J.; Wei, X.M.; Huang, R.; Qi, H.L.; Gao, Q.; Li, C.Z.; Zhang, C.X. Detection and discrimination of alpha-fetoprotein with a label-free electrochemical impedance spectroscopy biosensor array based on lectin functionalized carbon nanotubes. Talanta 2013, 111. [Google Scholar] [CrossRef]
- Hiatt, L.A.; Cliffel, D.E. Real-time recognition of Mycobacterium tuberculosis and lipoarabinomannan using the quartz crystal microbalance. Sens. Actuator B Chem. 2012, 174. [Google Scholar] [CrossRef]
- Joergensen, L.M.; Salanti, A.; Dobrilovic, T.; Barfod, L.; Hassenkam, T.; Theander, T.G.; Hviid, L.; Arnot, D.E. The kinetics of antibody binding to Plasmodium falciparum VAR2CSA PfEMP1 antigen and modelling of PfEMP1 antigen packing on the membrane knobs. Malar J. 2010, 9. [Google Scholar] [CrossRef]
- Cooper, M.A.; Singleton, V.T. A survey of the 2001 to 2005 quartz crystal microbalance biosensor literature: Applications of acoustic physics to the analysis of biomolecular interactions. J. Mol. Recognit. 2007, 20. [Google Scholar] [CrossRef]
- Sauerbrey, G. Verwendung Von Schwingquarzen Zur Wagung Dunner Schichten Und Zur Mikrowagung. Zeitschrift Fur Physik 1959, 155. [Google Scholar] [CrossRef]
- Hook, F.; Rodahl, M.; Brzezinski, P.; Kasemo, B. Energy dissipation kinetics for protein and antibody-antigen adsorption under shear oscillation on a quartz crystal microbalance. Langmuir 1998, 14. [Google Scholar]
- Mao, Y.; Wei, W.; He, D.; Nie, L.; Yao, S. Monitoring and kinetic parameter estimation for the binding process of berberine hydrochloride to bovine serum albumin with piezoelectric quartz crystal impedance analysis. Anal. Biochem. 2002, 306. [Google Scholar] [CrossRef]
- Lisdat, F.; Schäfer, D. The use of electrochemical impedance spectroscopy for biosensing. Anal. Bioanal. Chem. 2008, 391. [Google Scholar] [CrossRef]
- Fernandes, F.C.B.; Santos, A.; Martins, D.C.; Góes, M.S.; Bueno, P.R. Comparing label free electrochemical impedimetric and capacitive biosensing architectures. Biosens. Bioelectron. 2014, 57. [Google Scholar] [CrossRef]
- Bryan, T.; Luo, X.; Bueno, P.R.; Davis, J.J. An optimised electrochemical biosensor for the label-free detection of C-reactive protein in blood. Biosens. Bioelectron. 2013, 39. [Google Scholar] [CrossRef]
- Prodromidis, M.I. Impedimetric immunosensors—A review. Electrochim. Acta 2010, 55. [Google Scholar] [CrossRef]
- Pei, Z.C.; Saint-Guirons, J.; Kack, C.; Ingemarsson, B.; Aastrup, T. Real-time analysis of the carbohydrates on cell surfaces using a QCM biosensor: A lectin-based approach. Biosens. Bioelectron. 2012, 35. [Google Scholar] [CrossRef]
- Peiris, D.; Markiv, A.; Curley, G.P.; Dwek, M.V. A novel approach to determining the affinity of protein-carbohydrate interactions employing adherent cancer cells grown on a biosensor surface. Biosens. Bioelectron. 2012, 35. [Google Scholar] [CrossRef]
- Hu, Y.F.; Zuo, P.; Ye, B.C. Label-free electrochemical impedance spectroscopy biosensor for direct detection of cancer cells based on the interaction between carbohydrate and lectin. Biosens. Bioelectron. 2013, 43. [Google Scholar] [CrossRef]
- Santos-de-Oliveira, R.; Dias-Baruffi, M.; Thomaz, S.M.; Beltramini, L.M.; Roque-Barreira, M.C. A neutrophil migration-inducing lectin from Artocarpus integrifolia. J. Immunol. 1994, 153. [Google Scholar]
- Mariano, V. S.; Zorzetto-Fernandes, A.L.; Silva, T.A.; Ruas, L.P.; Nohara, L.L.; Almeida, I.C.; Roque-Barreira, M.C. Recognition of TLR2 N-Glycans: Critical Role in ArtinM Immunomodulatory Activity. PLoS ONE 2014, 9. [Google Scholar] [CrossRef]
- Silva, T.A.; de Souza, M.A.; Cecílio, N.T.; Roque-Barreira, M.C. Activation of spleen cells by ArtinM may account for its immunomodulatory properties. Cell Tissue Res. 2014, in press. [Google Scholar]
- Li, X.; Pei, Y.; Zhang, R.; Shuai, Q.; Wang, F.; Aastrup, T.; Pei, Z. A suspension-cell biosensor for real-time determination of binding kinetics of protein-carbohydrate interactions on cancer cell surfaces. Chem. Commun. 2013, 49. [Google Scholar]
© 2014 by the authors; licensee MDPI, Basel, Switzerland. This article is an open access article distributed under the terms and conditions of the Creative Commons Attribution license (http://creativecommons.org/licenses/by/4.0/).
Share and Cite
Carvalho, F.C.; Martins, D.C.; Santos, A.; Roque-Barreira, M.-C.; Bueno, P.R. Evaluating the Equilibrium Association Constant between ArtinM Lectin and Myeloid Leukemia Cells by Impedimetric and Piezoelectric Label Free Approaches. Biosensors 2014, 4, 358-369. https://doi.org/10.3390/bios4040358
Carvalho FC, Martins DC, Santos A, Roque-Barreira M-C, Bueno PR. Evaluating the Equilibrium Association Constant between ArtinM Lectin and Myeloid Leukemia Cells by Impedimetric and Piezoelectric Label Free Approaches. Biosensors. 2014; 4(4):358-369. https://doi.org/10.3390/bios4040358
Chicago/Turabian StyleCarvalho, Fernanda C., Denise C. Martins, Adriano Santos, Maria-Cristina Roque-Barreira, and Paulo R. Bueno. 2014. "Evaluating the Equilibrium Association Constant between ArtinM Lectin and Myeloid Leukemia Cells by Impedimetric and Piezoelectric Label Free Approaches" Biosensors 4, no. 4: 358-369. https://doi.org/10.3390/bios4040358