Article

Thickness-Dependent Differential Reflectance Spectra of Monolayer and Few-Layer MoS2, MoSe2, WS2 and WSe2

by
Yue Niu
1,2,3,
Sergio Gonzalez-Abad
2,
Riccardo Frisenda
4,
Philipp Marauhn
5,
Matthias Drüppel
5,
Patricia Gant
4,
Robert Schmidt
6,
Najme S. Taghavi
4,7,
David Barcons
2,
Aday J. Molina-Mendoza
8,
Steffen Michaelis De Vasconcellos
6,
Rudolf Bratschitsch
6,
David Perez De Lara
2,
Michael Rohlfing
5 and
Andres Castellanos-Gomez
4,*
1
National Center for International Research on Green Optoelectronics & Guangdong Provincial Key Laboratory of Optical Information Materials and Technology, Institute of Electronic Paper Displays, South China Academy of Advanced Optoelectronics, South China Normal University, Guangzhou 510006, China
2
Instituto Madrileño de Estudios Avanzados en Nanociencia (IMDEA Nanociencia), Campus de Cantoblanco, E-28049 Madrid, Spain
3
National Key Laboratory of Science and Technology on Advanced Composites in Special Environments, Harbin Institute of Technology, Harbin 150001, China
4
Materials Science Factory, Instituto de Ciencia de Materiales de Madrid (ICMM), Consejo Superior de Investigaciones Científicas (CSIC), Sor Juana Inés de la Cruz 3, 28049 Madrid, Spain
5
Institute of Solid-state Theory, University of Münster, 48149 Münster, Germany
6
Institute of Physics and Center for Nanotechnology, University of Münster, 48149 Münster, Germany
7
Faculty of Physics, Khaje Nasir Toosi University of Technology (KNTU), Tehrān 19697 64499, Iran
8
Institute of Photonics, Vienna University of Technology, Gusshausstrasse 27–29, 1040 Vienna, Austria
*
Author to whom correspondence should be addressed.
Nanomaterials 2018, 8(9), 725; https://doi.org/10.3390/nano8090725
Submission received: 13 August 2018 / Revised: 2 September 2018 / Accepted: 7 September 2018 / Published: 14 September 2018

Abstract

:
The research field of two dimensional (2D) materials strongly relies on optical microscopy characterization tools to identify atomically thin materials and to determine their number of layers. Moreover, optical microscopy-based techniques opened the door to study the optical properties of these nanomaterials. We presented a comprehensive study of the differential reflectance spectra of 2D semiconducting transition metal dichalcogenides (TMDCs), MoS2, MoSe2, WS2, and WSe2, with thickness ranging from one layer up to six layers. We analyzed the thickness-dependent energy of the different excitonic features, indicating the change in the band structure of the different TMDC materials with the number of layers. Our work provided a route to employ differential reflectance spectroscopy for determining the number of layers of MoS2, MoSe2, WS2, and WSe2.

1. Introduction

The isolation of atomically thin semiconducting transition metal dichalcogenides (TMDCs) by mechanical exfoliation of bulk layered crystals, aroused the interest of the nanoscience and nanotechnology community on these 2D semiconductors [1,2,3,4,5,6,7]. These materials have a band gap within the visible part of the spectrum, bridging the gap between graphene (zero-gap semiconductor) and hexagonal boron nitride (wide-gap semiconductor). Recently, the band gap of semiconductor TMDCs has been exploited to fabricate optoelectronic devices, such as photodetectors [8,9,10,11,12,13,14] and solar cells [15,16,17,18,19]. Photoluminescence studies also demonstrated that a reduction in thickness has a strong effect on the band structure of MoS2 and other semiconductor TMDCs, including a change in the band gap and a thickness mediated direct-to-indirect band gap crossover [20,21,22,23,24]. The thickness dependent band gap can have a strong influence on other electrical [25] and optical properties, such as the absorption [25,26,27], and it has been also exploited to fabricate photodetectors where their spectral bandwidth is determined by the number of layers of the semiconductor channel [9,11]. However, the determination of the intrinsic quantum efficiency and the photoresponse of photodetectors based on semiconducting TMDCs, requires a comprehensive study of their reflectance and/or transmittance with different numbers of layers in a wide spectral range, which is still lacking.
We systematically study the differential reflectance of single- and few-layer MoS2, MoSe2, WS2, and WSe2, from the near-infrared (1.4 eV) to the near-ultraviolet (3.0 eV). The differential reflectance spectra show prominent features due to excitons, and the thickness dependence of these excitonic features is analyzed.

2. Materials and Method

We prepared MoS2, MoSe2, WS2, and WSe2 nanosheets by mechanical exfoliation with blue Nitto tape (Nitto Denko Co., Tokyo, Japan, SPV 224P), on commercially available polydimethylsiloxane substrates (Gel-Film from Gelpak®, Hayward, CA, USA). MoSe2, WS2, and WSe2 bulk crystals were synthetic (grown by the vapor transport method), with approximate dimensions of 10 × 10 × 0.2 mm3, whilst the MoS2 material employed in this work was a naturally occurring molybdenite crystal (Moly Hill mine, QC, Canada), with approximate dimensions of 50 × 50 × 3 mm3. All the materials studied in the main text were 2H polytype. In the supporting information, we also include results obtained for mechanically exfoliated natural 3R-MoS2 (Mont St. Hilaire, QC, Canada), which occurs in the form of micro-crystals, with an area of 0.5 × 0.5 mm2 on the surface of a quartz mineral. Few-layer flakes were identified under an optical microscope (Nikon Eclipse CI, Tokyo, Japan), and the number of layers was determined by their opacity in transmission mode. The optical properties of the nanosheets were studied with a home-built micro-reflectance/transmittance setup, described in detail in Reference [28].
The calculations of the absorption spectra were conducted using the GW-BSE method, within the LDA + GdW approximation [29]. The dielectric screening was implemented by an atom-resolved model function, based on the random phase approximation. For the structural parameters, we used experimental values, as reported in Reference [30] (with a = 3.160 Å for MoS2 and a = 3.299 Å for MoSe2) and Reference [31] (with a = 3.155 Å for WS2 and a = 3.286 Å for WSe2). We started with a density functional theory (DFT) calculation within the local density approximation (LDA), using a basis set of localized Gaussian orbitals and norm-conserving pseudopotentials, which also included spin-orbit interaction. The resulting wave functions and energies were used for a subsequent GdW calculation, fully considering spin-orbit interaction. For the BSE calculations, we used a 24 × 24 × 1 k-point grid for the mono- and bi-layers, and an 18 × 18 × 3 k-point grid for the bulk crystals. Notably, we used identical meshes for both the quasiparticle corrections and the electron-hole interaction, so no interpolation scheme was needed. The number of valence and conduction bands in the BSE Hamiltonian were doubled, when going from the monolayer (four/six) to the bilayer and bulk crystals (eight/twelve). A detailed analysis of the convergence of the presented calculation is found in the Supporting Information. For all absorption spectra, an artificial broadening of 35 meV was applied.

3. Results and Discussion

Single- and few-layer MoS2, MoSe2, WS2, and WSe2 samples were fabricated by mechanical exfoliation of bulk layered crystals onto a polydimethylsiloxane (PDMS) substrate (Gelfilm from Gelpak®, Hayward, CA, USA, as described in Reference [32]; see the Supporting Information for results obtained with other substrates). We refer the reader to the Materials and Methods section, for more details about the sample fabrication. Moreover, all results shown in the main text were obtained for the 2H polytype, which is the most common in this family of materials. We refer the reader to the Supporting Information, for a comparison between the 2H- and 3R-MoS2 polytypes.
Figure 1a shows a transmission mode optical microscopy image of an exfoliated MoS2 flake, displaying regions with different numbers of layers, as determined from the position of the E2g and A1g lines in their Raman spectra (Figure 1b) [33,34]. Similar optical microscopy images of MoSe2, WS2, and WSe2 samples can be found in the Supporting Information. The quantitative analysis of the red, green, and blue channels of the transmission mode optical images, has recently been proven to be an effective alternative way to determine the number of layers of TMDCs (see description in Reference [35] and Supporting Information in Reference [36]). Figure 1c shows the transmittance T/T0 (T: intensity of the light transmitted through the flake, T0: intensity of the light transmitted through the substrate), extracted from the different regions of the transmission mode optical image shown in Figure 1a. The blue channel showed the largest thickness dependence. Thus, it can be very useful to determine the number of layers. The blue channel transmittance dropped monotonically by ~9% per MoS2 layer, in good agreement with the results reported in Reference [35]. We statistically analyzed the blue channel transmittance of 200 MoS2 flakes to get insight of the flake-to-flake variation, finding a typical value of 2–5%, allowing for the accurate determination of the flake thickness, despite the uncertainty introduced by these flake-to-flake variations. A more comprehensive statistical analysis of the blue channel transmittance in the whole family of TMDCs will be published elsewhere, as it lies out of the scope of the current manuscript.
We also found that the blue channel transmittance showed a strong thickness dependence for other TMDCs studied: WS2, WSe2, or MoSe2 (see the Supporting Information for an analogue of Figure 1c, for these materials). This strong thickness dependence of the blue channel transmittance, might be especially relevant to determine the number of layers of relatively thick MoS2 multilayers, as Raman spectroscopy is only accurate in determining layers thinner than 4 layers. The Raman shift difference between the E2g and A1g, quickly saturates for flakes thicker than 4 layers, see Reference [33]. Furthermore, for WS2, WSe2 or MoSe2, it is not trivial to determine the number of layers with Raman spectroscopy, as one might need a high resolution Raman system or a system capable to resolve shear Raman modes occurring at low Raman shifts [37,38,39,40,41,42] (see the Supporting Information to see the thickness dependent Raman spectra of WS2, WSe2 or MoSe2).
The optical spectra of the fabricated flakes were characterized using a homebuilt micro-reflectance and transmittance setup. We refer the reader to References [28,43], for details on this experimental setup. Briefly, the setup consisted of a Motic BA310 metallurgical microscope equipped with a 50× objective (0.55 numerical aperture and 8.2 mm of working distance), supplemented with a modified trinocular port, which sends part of the reflected light to a multimode fiber-coupled charge coupled device (CCD) spectrometer (Thorlabs CCS200/M, Newton, NJ, USA) to be analyzed. The system can be used to measure differential reflectance and transmittance, with a lateral resolution of ~1 µm. In the Supplementary Information, the reader will find a schematic diagram of the experimental setup configurations used for differential reflectance and transmittance experiments. In the main text, we showed the results of differential reflectance measurements, and we refer the reader to the Supporting Information, for a comparison between differential reflectance and transmittance measurements acquired on the same sample.
The differential reflectance spectrum was calculated as (RR0)/R, and it is related to the absorption coefficient of the material α(λ) as shown in References [26,44]
R R 0 R = 4 n n 0 2 1 α ( λ )
where R is the intensity reflected by the flake, R0 the intensity reflected by the substrate, n is the refractive index of the flake under study, and n0 is the refractive index of the substrate. Figure 2 shows the differential reflectance spectra measured on the single- and few-layer regions, for the different semiconductor TMDCs studied. The spectra acquired for this family of 2D materials showed overall similar features: Pronounced peaks corresponding to the generation of excitons. The exact energy at which these peaks appeared is material-to-material dependent, because those features were determined by the band structures of these different compounds. The exciton peaks in Figure 2 are labelled A, B, and C (and D for WSe2), following the nomenclature employed in the literature to name the different excitons in semiconducting TMDCs [20,21,22]. The A exciton, occurring near the absorption band edge, corresponded to direct band gap transitions at the K point in the Brillouin zone [20,21,22]. This feature is the most studied one, as it is also the dominant one in photoluminescence spectra. Close to the A exciton peak, at slightly higher energy, the transition metal dichalcogenides showed another prominent peak in their differential reflectance spectra, corresponding to another direct band gap transition at the K point, but at higher energy, which yielded the creation of the so-called B excitons. For monolayer TMDCs, the origin of this higher energy transition at the K point was related to the splitting of the valence band, due to the spin-orbit interaction. For multilayer systems, the splitting of the valence band was driven by a combination of spin-orbit and interlayer interaction.
Apart from the narrow A and B exciton peaks, the differential reflectance spectra of MoS2, MoSe2, and WS2, also showed other broader spectroscopic features in an energy range from 2.5 eV to 2.9 eV (referred to as the C exciton peak). This was due to singularities in the joint density of states between the first valence and conduction bands, in a circle around the Γ point (into the local minimum of the lowest conduction band between Γ and K), which led to multiple optical transitions to nearly degenerate in energy [26,27,45,46,47,48,49]. Regarding WSe2, we found that instead of just one broad C exciton feature, two features labeled C and D, were reported in recent absorption measurements [49]. Whilst the C exciton of WSe2 consisted of several transitions along the Γ-K direction, between the highest valence and lowest conduction bands, the D exciton had the largest contributions from the spin-split lower valence band, into the lowest conduction band [49].
The differential reflectance spectra were fit to a sum of Gaussian/Lorentzian peaks, with a broad background to determine the peak position, width, and magnitude of the excitonic features, as a function of the number of layers for the different 2D semiconductor materials. The thin black lines in Figure 2 correspond to the resulting fits for the different measured spectra, and the empty circles highlight the energy values determined for the different excitons from the fits. We found that the flake-to-flake variation in the peak position was the most relevant source for uncertainty, in the analysis of the thickness dependent spectra. In the Supplementary Information, we compare the spectra acquired on 6 single-layers and 4 bilayers of MoS2, to illustrate the typical flake-to-flake variation in the spectra. The exciton positions can shift up to 10–15 meV, and the flake-to-flake variations in intensity can reach 5–10%.
To visualize the thickness dependence of the exciton energies, Figure 3 summarizes the determined exciton energies, as a function of the number of layers for MoS2, MoSe2, WS2, and WSe2. The A exciton peak redshifts as the thickness increases for all the studied materials, in agreement with previous photoluminescence results. The B exciton displayed a non-monotonic thickness dependence, which might arise from the moderate thickness dependence and the 10–15 meV flake-to-flake variation of the peak position. Overall, the B exciton feature also shifted to lower energy with the increasing number of layers. As discussed above, for single layers, the separation between the A and B exciton peaks is due to the spin-orbit splitting of the valence band. Therefore, the larger spin-orbit splitting induced by the heavier W atoms with respect to Mo atoms, is translated to a larger separation of the A and B features in the differential reflectance spectra of W-based TMDCs. Moreover, Se-based dichalcogenides exhibited a larger splitting between the A and B exciton peaks, than that of S-based dichalcogenides. Table 1 summarizes the values of the splitting between the A and B excitons for the single-layer TMDCs studied in this work and compares these values with theoretical values obtained through ab initio calculations (see the Supporting Information for more details about the calculations). The good agreement between predicted A-B splitting and the experimental values, confirms our theoretical calculations captured the essential features to describe the excitonic properties of TMDCs. Note that experimental values for the A-B splitting reported in the literature show variability [49,50,51], e.g., due to different experimental techniques and flake-to-flake variations due to small differences in strain, doping, and/or presence of defects. This explains the variation in discrepancies between our predicted and experimental AB-splittings.
Interestingly, we also found that the C exciton showed a prominent shift with the thickness, even more pronounced than that of the A exciton. Note that the number of works studying the C excitonic feature are still very scarce, as most experiments employ photoluminescence with green laser excitation (E~2 eV–2.3 eV) to observe the generated excitons.

4. Conclusions

In summary, we presented a systematic study of the differential reflectance spectra MoS2, MoSe2, WS2, and WSe2, from the near-infrared (1.4 eV) to the near-ultraviolet (3.0 eV). The differential reflectance spectra showed prominent features due to the generation of excitons, and the energy at which these features appear depends on the thickness of the flakes, because of quantum confinement effects. We proposed employing a combination of a quantitative analysis of transmission mode optical images and differential reflectance measurements, as an alternative method to determine the number of layers.

Supplementary Materials

The following are available online at https://www.mdpi.com/2079-4991/8/9/725/s1, Figure S1: Transmission mode optical images of mechanically exfoliated transition metal dichalcogenides (TMDCs) onto polydimethylsiloxane (PDMS) substrates; Figure S2: Transmittance (extracted from the red, green, and blue channels of the transmission mode optical images), as a function of the number of layers; Figure S3: Blue channel transmittance measured on more than 200 MoS2 flakes with different numbers of layers (ranging from 1 layer to 4 layers); Figure S4: Comparison between the differential reflectance spectra measured for single-layer MoS2 on different substrates: glass, polycarbonate (PC), polypropylene (PP), and polydimethylsiloxane (PDMS); Figure S5: Reflection mode optical images of MoS2, WS2, MoSe2, and WSe2 after transfer onto SiO2/Si substrates (285 nm thick SiO2); Figure S6: Thickness dependence of the optical contrast measured for MoS2, WS2, MoSe2, and WSe2 deposited onto SiO2/Si substrates (285 nm thick SiO2); Figure S7: Raman spectra measured on MoS2, WS2, MoSe2, and WSe2 deposited onto PDMS substrates; Figure S8: Quantitative analysis of the Raman spectra measured on MoS2, WS2, MoSe2, and WSe2 deposited onto PDMS substrates; Figure S9: Comparison between differential reflectance and transmittance measurements, carried out on the same MoS2 flakes on PDMS; Figure S10: Differential reflectance intensity, measured from the differential reflectance spectra shown in Figure S6, at energies outside the excitonic resonance windows; Figure S11: Comparison between different methods to measure the optical properties of 2D materials (using 1L, 2L, and 3L MoS2 as testbeds); Figure S12: Comparison between the crystal structure of the 2H- and 3R-polytypes; Figure S13: Transmission mode optical images of 2H-MoS2 and 3R-MoS2 on PDMS; Figure S14: Transmittance (extracted from the red, green, and blue channels of the transmission mode optical images), as a function of the number of layers for 2H-MoS2 and 3R-MoS2; Figure S15: Differential reflectance spectra, measured as a function of the number of layers for 2H- and 3R-MoS2; Figure S16: Thickness dependence of the exciton energies, extracted from the differential reflectance spectra of 2H-MoS2 and 3R-MoS2; Figure S17: Convergence of the quasiparticle gap at the K point, with respect to the energy cutoff used in the LDA + GdW approach, for the representation of ε and W; Figure S18: Convergence of the A and B exciton for all four TMDCs, with respect to the k-point grid used in the BSE; Figure S19: Convergence of the A and B exciton for the bulk crystal of MoS2, with respect to the k-point grid applied in the BSE; Figure S20: Absorption spectra of MoS2, WS2, MoSe2, and WSe2, for all studied number of layers; Figure S21: Direct comparison between the exciton energies obtained experimentally, and those calculated for MoS2, WS2, MoSe2, and WSe2; Figure S22: Comparison between differential reflectance spectra acquired on different single-layer and bilayer MoS2 flakes, which illustrates how the flake-to-flake variation is the main source of uncertainty in the analysis of the thickness dependent spectra of TMDCs; Figure S23: Schematic of the experimental setup employed for the micro-reflectance and transmittance measurements on TMDCs.

Author Contributions

Y.N., S.G.-A., P.G., A.J.M.-M., R.F., N.S.T., D.B., D.P.D.L. and A.C.-G. fabricated the samples, performed the optical spectroscopy measurements and analyzed the experimental results. R.S., S.M.d.V. and R.B. provided the bulk MoSe2, WS2 and WSe2 crystals. P.M., M.D. and M.R. performed the ab-initio calculations. All the authors discussed the results and contributed in the elaboration of the manuscript.

Funding

This project received funding from the European Research Council (ERC) under the European Union’s Horizon 2020 research, innovation programme (grant agreement No. 755655, ERC-StG 2017 project 2D-TOPSENSE), the EU Graphene Flagship funding (Grant Graphene Core 2, 785219), the Netherlands Organisation for Scientific Research (NWO) through the research program Rubicon with project number 680-50-1515, the MINECO (program FIS2015-67367-C2-1-P), and the China Scholarship Council (File NO. 201506120102).

Acknowledgments

We thank Emilio M. Pérez for his support with the Raman spectroscopy measurements. Andres Castellanos-Gomez and Patricia Gant acknowledge funding from the EU Graphene Flagship funding (Grant Graphene Core 2, 785219). Riccardo Frisenda acknowledges support from the Netherlands Organisation for Scientific Research (NWO), through the research program Rubicon with project number 680-50-1515. David Perez De Lara acknowledges support from the MINECO (program FIS2015-67367-C2-1-P). Yue Niu acknowledges the grant from the China Scholarship Council (File NO. 201506120102). Philipp Marauhn, Matthias Drüppel, and Michael Rohlfing gratefully acknowledge the computing time granted by the John von Neumann Institute for Computing (NIC), and provided on the super-computer JURECA at Jülich Supercomputing Centre (JSC).

Conflicts of Interest

The authors declare no conflict of interest.

References

  1. Novoselov, K.S.; Jiang, D.; Schedin, F.; Booth, T.J.; Khotkevich, V.V.; Morozov, S.V.; Geim, A.K. Two-dimensional atomic crystals. Proc. Natl. Acad. Sci. USA 2005, 102, 10451–10453. [Google Scholar] [CrossRef] [PubMed] [Green Version]
  2. Xu, M.; Liang, T.; Shi, M.; Chen, H. Graphene-like two-dimensional materials. Chem. Rev. 2013, 113, 3766–3798. [Google Scholar] [CrossRef] [PubMed]
  3. Xia, F.; Wang, H.; Xiao, D.; Dubey, M.; Ramasubramaniam, A. Two-dimensional material nanophotonics. Nat. Photonics 2014, 8, 899–907. [Google Scholar] [CrossRef] [Green Version]
  4. Lv, R.; Robinson, J.A.; Schaak, R.E.; Sun, D.; Sun, Y.; Mallouk, T.E.; Terrones, M. Transition metal dichalcogenides and beyond: Synthesis, properties, and applications of single- and few-layer nanosheets. Acc. Chem. Res. 2015, 48, 56–64. [Google Scholar] [CrossRef] [PubMed]
  5. Wang, Q.H.; Kalantar-Zadeh, K.; Kis, A.; Coleman, J.N.; Strano, M.S. Electronics and optoelectronics of two-dimensional transition metal dichalcogenides. Nat. Nanotechnol. 2012, 7, 699–712. [Google Scholar] [CrossRef] [PubMed] [Green Version]
  6. Castellanos-Gomez, A. Why all the fuss about 2D semiconductors? Nat. Photonics 2016, 10, 202–204. [Google Scholar] [CrossRef] [Green Version]
  7. Avouris, P.; Xia, F. Graphene applications in electronics and photonics. MRS Bull. 2012, 37, 1225–1234. [Google Scholar] [CrossRef]
  8. Yin, Z.; Li, H.; Li, H.; Jiang, L.; Shi, Y.; Sun, Y.; Lu, G.; Zhang, Q.; Chen, X.; Zhang, H. Single-layer MoS2 phototransistors. ACS Nano 2012, 6, 74–80. [Google Scholar] [CrossRef] [PubMed]
  9. Lee, H.S.; Min, S.-W.; Chang, Y.-G.; Park, M.K.; Nam, T.; Kim, H.; Kim, J.H.; Ryu, S.; Im, S. MoS2 nanosheet phototransistors with thickness-modulated optical energy gap. Nano Lett. 2012, 12, 3695–3700. [Google Scholar] [CrossRef] [PubMed]
  10. Zhang, W.; Chiu, M.-H.; Chen, C.-H.; Chen, W.; Li, L.-J.; Wee, A.T.S. Role of metal contacts in high-performance phototransistors based on WSe2 monolayers. ACS Nano 2014, 8, 8653–8661. [Google Scholar] [CrossRef] [PubMed]
  11. Choi, W.; Cho, M.Y.; Konar, A.; Lee, J.H.; Cha, G.-B.; Hong, S.C.; Kim, S.; Kim, J.; Jena, D.; Joo, J.; et al. High-detectivity multilayer MoS2 phototransistors with spectral response from ultraviolet to infrared. Adv. Mater. 2012, 24, 5832–5836. [Google Scholar] [CrossRef] [PubMed]
  12. Zhang, W.; Huang, J.-K.; Chen, C.-H.; Chang, Y.-H.; Cheng, Y.-J.; Li, L.-J. High-gain phototransistors based on a CVD MoS₂ monolayer. Adv. Mater. 2013, 25, 3456–3461. [Google Scholar] [CrossRef] [PubMed]
  13. Abderrahmane, A.; Ko, P.J.; Thu, T.V.; Ishizawa, S.; Takamura, T.; Sandhu, A. High photosensitivity few-layered MoSe2 back-gated field-effect phototransistors. Nanotechnology 2014, 25, 365202. [Google Scholar] [CrossRef] [PubMed]
  14. Lopez-Sanchez, O.; Lembke, D.; Kayci, M.; Radenovic, A.; Kis, A. Ultrasensitive photodetectors based on monolayer MoS2. Nat. Nanotechnol. 2013, 8, 497–501. [Google Scholar] [CrossRef] [PubMed]
  15. Ross, J.S.; Klement, P.; Jones, A.M.; Ghimire, N.J.; Yan, J.; Mandrus, D.G.; Taniguchi, T.; Watanabe, K.; Kitamura, K.; Yao, W.; et al. Electrically tunable excitonic light-emitting diodes based on monolayer WSe2 p-n junctions. Nat. Nanotechnol. 2014, 9, 268–272. [Google Scholar] [CrossRef] [PubMed]
  16. Baugher, B.W.H.; Churchill, H.O.H.; Yang, Y.; Jarillo-Herrero, P. Optoelectronic devices based on electrically tunable p-n diodes in a monolayer dichalcogenide. Nat. Nanotechnol. 2014, 9, 262–267. [Google Scholar] [CrossRef] [PubMed]
  17. Pospischil, A.; Furchi, M.M.; Mueller, T. Solar-energy conversion and light emission in an atomic monolayer p-n diode. Nat. Nanotechnol. 2014, 9, 257–261. [Google Scholar] [CrossRef] [PubMed]
  18. Lee, C.-H.; Lee, G.-H.; van der Zande, A.M.; Chen, W.; Li, Y.; Han, M.; Cui, X.; Arefe, G.; Nuckolls, C.; Heinz, T.F.; et al. Atomically thin p–n junctions with van der Waals heterointerfaces. Nat. Nanotechnol. 2014, 9, 676–681. [Google Scholar] [CrossRef] [PubMed] [Green Version]
  19. Groenendijk, D.J.; Buscema, M.; Steele, G.A.; Michaelis de Vasconcellos, S.; Bratschitsch, R.; van der Zant, H.S.J.; Castellanos-Gomez, A. Photovoltaic and photothermoelectric effect in a double-gated WSe2 device. Nano Lett. 2014, 14, 5846–5852. [Google Scholar] [CrossRef] [PubMed]
  20. Splendiani, A.; Sun, L.; Zhang, Y.; Li, T.; Kim, J.; Chim, C.-Y.; Galli, G.; Wang, F. Emerging photoluminescence in monolayer MoS2. Nano Lett. 2010, 10, 1271–1275. [Google Scholar] [CrossRef] [PubMed]
  21. Mak, K.F.; Lee, C.; Hone, J.; Shan, J.; Heinz, T.F. Atomically Thin MoS2: A new direct-gap semiconductor. Phys. Rev. Lett. 2010, 105, 136805. [Google Scholar] [CrossRef] [PubMed]
  22. Zhao, W.; Ghorannevis, Z.; Chu, L.; Toh, M.; Kloc, C.; Tan, P.-H.; Eda, G. Evolution of electronic structure in atomically thin sheets of WS2 and WSe2. ACS Nano 2013, 7, 791–797. [Google Scholar] [CrossRef] [PubMed]
  23. Li, Y.; Li, X.; Yu, T.; Yang, G.; Chen, H.; Zhang, C.; Feng, Q.; Ma, J.; Liu, W.; Xu, H. Accurate identification of layer number for few-layer WS2 and WSe2 via spectroscopic study. Nanotechnology 2018, 29, 124001. [Google Scholar] [CrossRef] [PubMed]
  24. Ottaviano, L.; Palleschi, S.; Perrozzi, F.; D’Olimpio, G.; Priante, F.; Donarelli, M.; Benassi, P.; Nardone, M.; Gonchigsuren, M.; Gombosuren, M. Mechanical exfoliation and layer number identification of MoS2 revisited. 2D Mater. 2017, 4, 45013. [Google Scholar] [CrossRef]
  25. Li, D.; Song, X.; Xu, J.; Wang, Z.; Zhang, R.; Zhou, P.; Zhang, H.; Huang, R.; Wang, S.; Zheng, Y. Optical properties of thickness-controlled MoS2 thin films studied by spectroscopic ellipsometry. Appl. Surf. Sci. 2017, 421, 884–890. [Google Scholar] [CrossRef]
  26. Dhakal, K.P.; Duong, D.L.; Lee, J.; Nam, H.; Kim, M.; Kan, M.; Lee, Y.H.; Kim, J. Confocal absorption spectral imaging of MoS2: Optical transitions depending on the atomic thickness of intrinsic and chemically doped MoS2. Nanoscale 2014, 6, 13028–13035. [Google Scholar] [CrossRef] [PubMed]
  27. Castellanos-Gomez, A.; Quereda, J.; van der Meulen, H.P.; Agraït, N.; Rubio-Bollinger, G. Spatially resolved optical absorption spectroscopy of single- and few-layer MoS2 by hyperspectral imaging. Nanotechnology 2016, 27, 115705. [Google Scholar] [CrossRef] [PubMed]
  28. Frisenda, R.; Niu, Y.; Gant, P.; Molina-Mendoza, A.J.; Schmidt, R.; Bratschitsch, R.; Liu, J.; Fu, L.; Dumcenco, D.; Kis, A.; et al. Micro-reflectance and transmittance spectroscopy: A versatile and powerful tool to characterize 2D materials. J. Phys. D Appl. Phys. 2017, 50, 74002. [Google Scholar] [CrossRef]
  29. Rohlfing, M. Electronic excitations from a perturbative LDA + GdW approach. Phys. Rev. B 2010, 82, 205127. [Google Scholar] [CrossRef]
  30. Böker, T.; Severin, R.; Müller, A.; Janowitz, C.; Manzke, R.; Voß, D.; Krüger, P.; Mazur, A.; Pollmann, J. Band structure of MoS2, MoSe2, and α-MoTe2: Angle-resolved photoelectron spectroscopy and ab initio calculations. Phys. Rev. B 2001, 64, 235305. [Google Scholar] [CrossRef]
  31. Yun, W.S.; Han, S.W.; Hong, S.C.; Kim, I.G.; Lee, J.D. Thickness and strain effects on electronic structures of transition metal dichalcogenides: 2H-MX2 semiconductors (M = Mo, W; X = S, Se, Te). Phys. Rev. B 2012, 85, 33305. [Google Scholar] [CrossRef]
  32. Buscema, M.; Steele, G.A.; van der Zant, H.S.J.; Castellanos-Gomez, A. The effect of the substrate on the Raman and photoluminescence emission of single-layer MoS2. Nano Res. 2014, 7, 561–571. [Google Scholar] [CrossRef]
  33. Lee, C.; Yan, H.; Brus, L.E.; Heinz, T.F.; Hone, Ќ.J.; Ryu, S. Anomalous Lattice Vibrations of Single-and Few-Layer MoS2. ACS Nano 2010, 4, 2695–2700. [Google Scholar] [CrossRef] [PubMed]
  34. Placidi, M.; Dimitrievska, M.; Izquierdo-Roca, V.; Fontané, X.; Castellanos-Gomez, A.; Pérez-Tomás, A.; Mestres, N.; Espindola-Rodriguez, M.; López-Marino, S.; Neuschitzer, M. Multiwavelength excitation Raman scattering analysis of bulk and two-dimensional MoS2: Vibrational properties of atomically thin MoS2 layers. 2D Mater. 2015, 2, 35006. [Google Scholar] [CrossRef]
  35. Zhang, H.; Ran, F.; Shi, X.; Fang, X.; Wu, S.; Liu, Y.; Zheng, X.; Yang, P.; Liu, Y.; Wang, L.; et al. Optical thickness identification of transition metal dichalcogenide nanosheets on transparent substrates. Nanotechnology 2017, 28, 164001. [Google Scholar] [CrossRef] [PubMed]
  36. Castellanos-Gomez, A.; Roldán, R.; Cappelluti, E.; Buscema, M.; Guinea, F.; van der Zant, H.S.J.; Steele, G.A. Local strain engineering in atomically thin MoS2. Nano Lett. 2013, 13, 5361–5366. [Google Scholar] [CrossRef] [PubMed]
  37. Plechinger, G.; Heydrich, S.; Eroms, J.; Weiss, D.; Schüller, C.; Korn, T. Raman spectroscopy of the interlayer shear mode in few-layer MoS2 flakes. Appl. Phys. Lett. 2012, 101, 101906. [Google Scholar] [CrossRef]
  38. Zhao, W.; Ghorannevis, Z.; Amara, K.K.; Pang, J.R.; Toh, M.; Zhang, X.; Kloc, C.; Tan, P.H.; Eda, G. Lattice dynamics in mono-and few-layer sheets of WS2 and WSe2. Nanoscale 2013, 5, 9677–9683. [Google Scholar] [CrossRef] [PubMed]
  39. Zhang, X.; Han, W.P.; Wu, J.B.; Milana, S.; Lu, Y.; Li, Q.Q.; Ferrari, A.C.; Tan, P.H. Raman spectroscopy of shear and layer breathing modes in multilayer MoS2. Phys. Rev. B 2013, 87, 115413. [Google Scholar] [CrossRef]
  40. Zhao, Y.; Luo, X.; Li, H.; Zhang, J.; Araujo, P.T.; Gan, C.K.; Wu, J.; Zhang, H.; Quek, S.Y.; Dresselhaus, M.S. Interlayer breathing and shear modes in few-trilayer MoS2 and WSe2. Nano Lett. 2013, 13, 1007–1015. [Google Scholar] [CrossRef] [PubMed]
  41. Tonndorf, P.; Schmidt, R.; Böttger, P.; Zhang, X.; Börner, J.; Liebig, A.; Albrecht, M.; Kloc, C.; Gordan, O.; Zahn, D.R.T.; et al. Photoluminescence emission and Raman response of monolayer MoS2, MoSe2, and WSe2. Opt. Express 2013, 21, 4908. [Google Scholar] [CrossRef] [PubMed]
  42. Puretzky, A.A.; Liang, L.; Li, X.; Xiao, K.; Wang, K.; Mahjouri-Samani, M.; Basile, L.; Idrobo, J.C.; Sumpter, B.G.; Meunier, V. Low-frequency Raman fingerprints of two-dimensional metal dichalcogenide layer stacking configurations. ACS Nano 2015, 9, 6333–6342. [Google Scholar] [CrossRef] [PubMed]
  43. Ghasemi, F.; Frisenda, R.; Dumcenco, D.; Kis, A.; Perez de Lara, D.; Castellanos-Gomez, A. High Throughput Characterization of Epitaxially Grown Single-Layer MoS2. Electronics 2017, 6, 28. [Google Scholar] [CrossRef]
  44. McIntyre, J.D.E.; Aspnes, D.E. Differential reflection spectroscopy of very thin surface films. Surf. Sci. 1971, 24, 417–434. [Google Scholar] [CrossRef]
  45. Qiu, D.Y.; da Jornada, F.H.; Louie, S.G. Optical Spectrum of MoS2: Many-body effects and diversity of exciton states. Phys. Rev. Lett. 2013, 111, 216805. [Google Scholar] [CrossRef] [PubMed]
  46. Kozawa, D.; Kumar, R.; Carvalho, A.; Kumar Amara, K.; Zhao, W.; Wang, S.; Toh, M.; Ribeiro, R.M.; Castro Neto, A.H.; Matsuda, K.; et al. Photocarrier relaxation pathway in two-dimensional semiconducting transition metal dichalcogenides. Nat. Commun. 2014, 5, 193–335. [Google Scholar] [CrossRef] [PubMed]
  47. Klots, A.R.; Newaz, A.K.M.; Wang, B.; Prasai, D.; Krzyzanowska, H.; Lin, J.; Caudel, D.; Ghimire, N.J.; Yan, J.; Ivanov, B.L.; et al. Probing excitonic states in suspended two-dimensional semiconductors by photocurrent spectroscopy. Sci. Rep. 2014, 4, 6608. [Google Scholar] [CrossRef] [PubMed] [Green Version]
  48. Gibaja, C.; Rodriguez-San-Miguel, D.; Ares, P.; Gómez-Herrero, J.; Varela, M.; Gillen, R.; Maultzsch, J.; Hauke, F.; Hirsch, A.; Abellán, G.; et al. Few-layer antimonene by liquid-phase exfoliation. Angew. Chem. Int. Ed. 2016. [Google Scholar] [CrossRef]
  49. Schmidt, R.; Niehues, I.; Schneider, R.; Drüppel, M.; Deilmann, T.; Rohlfing, M.; de Vasconcellos, S.M.; Castellanos-Gomez, A.; Bratschitsch, R. Reversible uniaxial strain tuning in atomically thin WSe2. 2D Mater. 2016, 3, 21011. [Google Scholar] [CrossRef]
  50. Frisenda, R.; Drüppel, M.; Schmidt, R.; Michaelis de Vasconcellos, S.; Perez de Lara, D.; Bratschitsch, R.; Rohlfing, M.; Castellanos-Gomez, A. Biaxial strain tuning of the optical properties of single-layer transition metal dichalcogenides. NPJ 2D Mater. Appl. 2017, 1, 10. [Google Scholar] [CrossRef]
  51. Arora, A.; Koperski, M.; Nogajewski, K.; Marcus, J.; Faugeras, C.; Potemski, M. Excitonic resonances in thin films of WSe2: From monolayer to bulk material. Nanoscale 2015, 7, 10421–10429. [Google Scholar] [CrossRef] [PubMed]
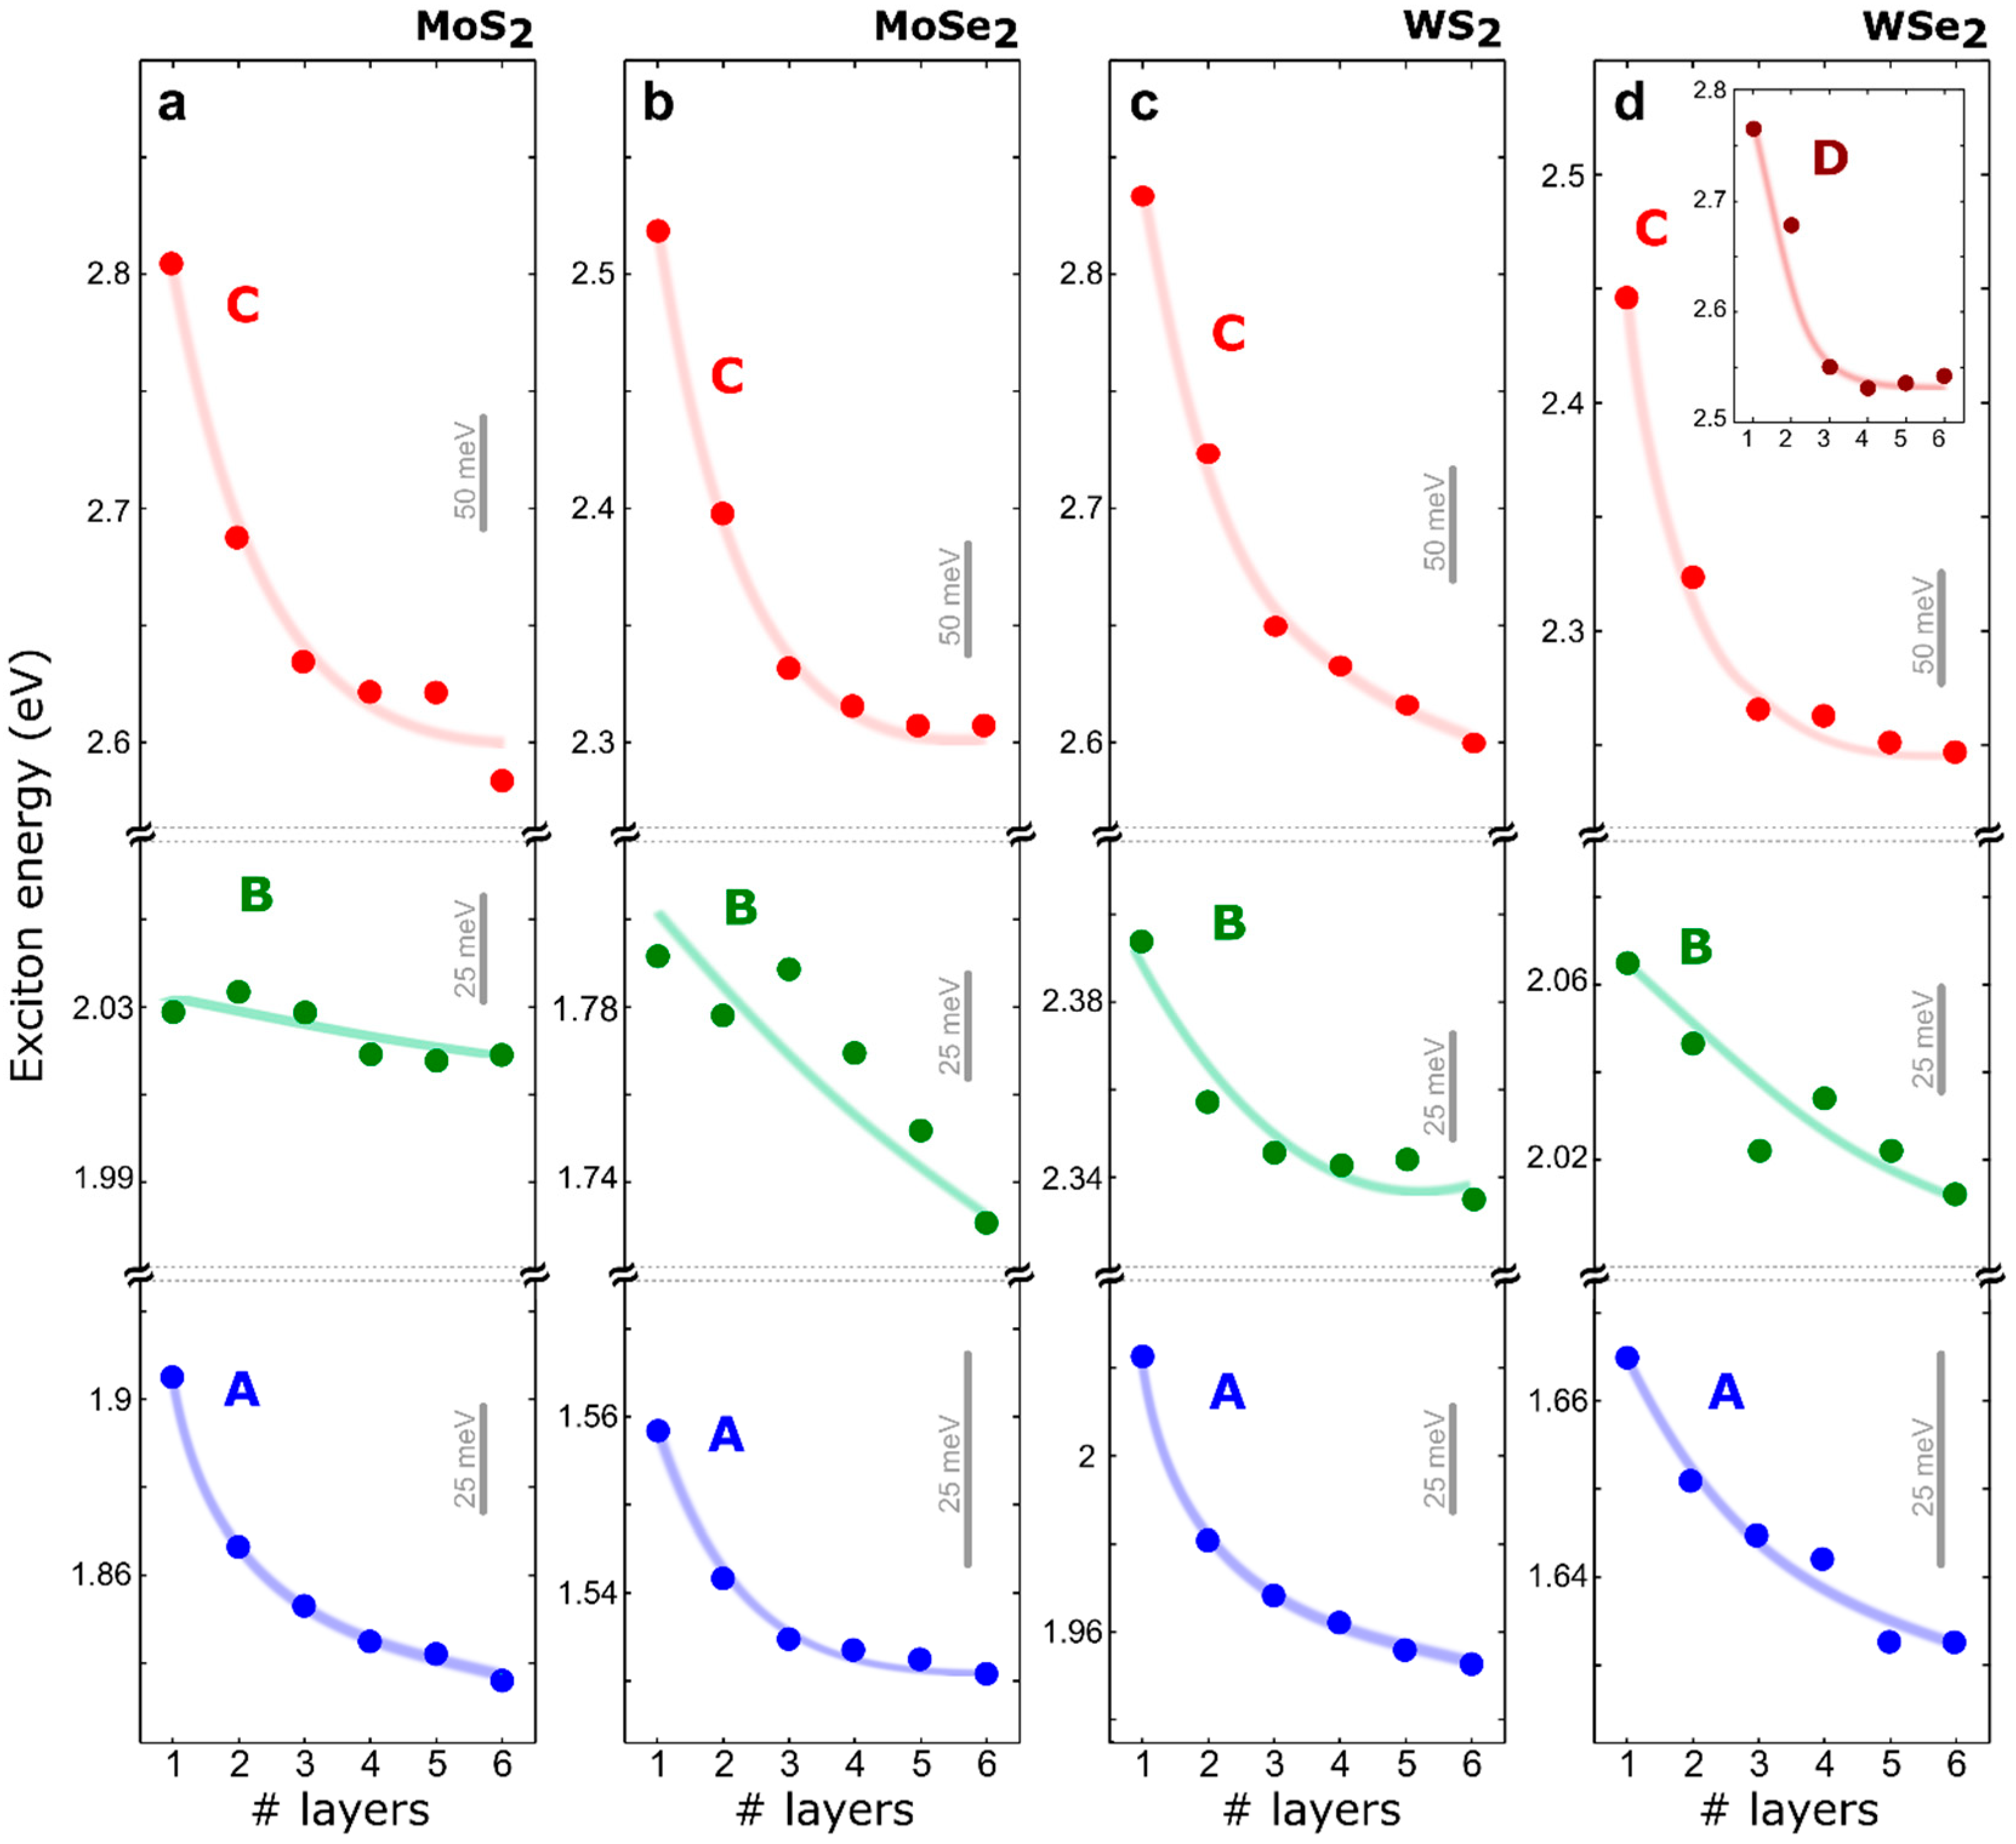
Figure 1. (a) Transmission mode optical image of a mechanically exfoliated MoS2 flake on polydimethylsiloxane (PDMS) substrate; (b) Raman spectra measured on the different regions of the flakes; The thickness of the flake can be determined from the Raman shift difference between the A1g and E2g lines, shown in panel (c). Note that a flake-to-flake variation of up to ~0.5 cm−1 can be found in the exfoliated flakes, and it would be the main cause of uncertainty in thickness determination through Raman spectroscopy; (d) Transmittance of the MoS2 flake (extracted from the red, green, and blue channels of the transmission mode optical images), as a function of the number of layers.
Nanomaterials 08 00725 g001
Figure 2. Differential reflectance spectra, measured as a function of the number of layers for (a) MoS2, (b) WS2, (c) MoSe2, and (d) WSe2. The spectra have been fitted to a sum of Lorentzian/Gaussian peaks (solid thin black lines), to determine the position of the different excitonic features (highlighted by white circles).
Nanomaterials 08 00725 g002
Figure 3. Thickness dependence of the exciton energies, extracted from the measured differential reflectance spectra of (a) MoS2, (b) WS2, (c) MoSe2, and (d) WSe2. The solid lines are guides to the eye.
Nanomaterials 08 00725 g003
Table 1. Comparison of the spin-orbit splitting extracted from the differential reflectance spectra, and those obtained from ab initio calculations, including spin-orbit interaction.
MaterialExperimental A-B Splitting (meV)Theoretical A-B Splitting (meV)
1L—MoS2124 ± 5152
1L—MoSe2219 ± 10218
1L—WS2371 ± 5420
1L—WSe2398 ± 10464

