Article

Investigating the Trimethylaluminium/Water ALD Process on Mesoporous Silica by In Situ Gravimetric Monitoring

by
Verena E. Strempel
1,
Kristian Knemeyer
1,
Raoul Naumann d’Alnoncourt
1,*,
Matthias Driess
1,2 and
Frank Rosowski
1,3
1
BasCat—UniCat BASF JointLab, Technische Universität Berlin, Hardenberstraße 36, 10623 Berlin, Germany
2
Institut für Chemie, Technische Universität Berlin, Straße des 17, Juni 135, 10623 Berlin, Germany
3
Process Research and Chemical Engineering, BASF SE, Carl-Bosch-Straße 38, 67056 Ludwigshafen, Germany
*
Author to whom correspondence should be addressed.
Nanomaterials 2018, 8(6), 365; https://doi.org/10.3390/nano8060365
Submission received: 24 April 2018 / Revised: 19 May 2018 / Accepted: 21 May 2018 / Published: 24 May 2018

Abstract

:
A low amount of AlOx was successfully deposited on an unordered, mesoporous SiO2 powder using 1–3 ALD (Atomic Layer Deposition) cycles of trimethylaluminium and water. The process was realized in a self-built ALD setup featuring a microbalanceand a fixed particle bed. The reactor temperature was varied between 75, 120, and 200 °C. The self-limiting nature of the deposition was verified by in situ gravimetric monitoring for all temperatures. The coated material was further analyzed by nitrogen sorption, inductively coupled plasma-optical emission spectroscopy, powder X-ray diffraction, high-resolution transmission electron microscopy, attenuated total reflection Fourier transformed infrared spectroscopy, and elemental analysis. The obtained mass gains correspond to average growth between 0.81–1.10 Å/cycle depending on substrate temperature. In addition, the different mass gains during the half-cycles in combination with the analyzed aluminum content after one, two, and three cycles indicate a change in the preferred surface reaction of the trimethylaluminium molecule from a predominately two-ligand exchange with hydroxyl groups to more single-ligand exchange with increasing cycle number. Nitrogen sorption isotherms demonstrate (1) homogeneously coated mesopores, (2) a decrease in surface area, and (3) a reduction of the pore size. The experiment is successfully repeated in a scale-up using a ten times higher substrate batch size.

1. Introduction

Today, technological applications of materials with high surface aspect ratios are plentiful. Among these materials, nanoporous solids play an outstanding role for in many applications, e.g., catalysis, fuel cells, and membranes [1]. However, porous materials can feature undesirable surface properties and a precise surface modification or functionalization is required for further application [2]. Especially in heterogeneous catalysis, surface deposits in a submonolayer regime can act as active sites or promoters [3,4]. In consequence, surface coating techniques for porous structures with high uniformity and control over the elemental composition, thickness, and morphology need to be developed. The most promising candidate for the ultra-thin coating of complex high aspect ratio structures is Atomic Layer Deposition (ALD) [5,6].
Traditionally ALD is a thin-film deposition technique that evolved from Chemical Vapor Deposition (CVD) [7]. Just as in CVD, ALD uses two, highly reactive, vapor-phase precursors to form a deposit on a surface. In contrast to CVD, those precursors are separated by time or space. The substrate is sequentially exposed to an overdose of metal and/or non-metal precursors by applying sufficient inert gas purging in between following an A-purge-B-purge-A-purge-B-etc. sequence. The precursor molecules react with surface sites (e.g., OH groups) until saturation. This leads to the unique self-limiting nature of ALD, as the reaction terminates once all the reactive sites on the surface are consumed and/or sterically shielded [8]. By repeating the complete cycle, the thickness of the grown film can be controlled to fractions of a nanometer. The achieved film thickness is therefore solely defined by the reaction temperature, pressure, and the number of reaction cycles [9].
By using ALD for the coating of porous powders in a submonolayer regime, two main challenges have to be handled: (1) The coating of powders is demanding, as ALD is mainly established for flat substrates in absence of pore diffusion phenomena [10,11], e.g., wafers; and (2) the first ALD cycles differ in mechanism and growth from the following cycles since they occur mostly on the surface of the original substrate [12].
Here, we report about the growth of a very thin AlOx layer on an unordered, mesoporous SiO2 powder. The film is built-up by the sequence of trimethylaluminium (TMA) and water on the surface of the heated substrate powder. We have chosen AlOx (Al2O3) as the coating material, because the AlOx process is one of the most-understood ALD processes in literature [13]. The deposition of this material on various substrates at different temperatures is studied with many techniques. The process features a straightforward chemistry between the highly reactive precursor and mainly the OH groups on the surface. In addition, the obtained films possess excellent thermal and chemical stability. The goal of this paper is to provide a comprehensive study of the modification of the SiO2 surface with a (sub)monolayer of AlOx. To achieve such a low loading, the highest number of ALD cycles is three. The mesoporous SiO2 starting material (Davisil, grade 636, 506 m2 g−1) is a widely used support material for heterogeneous catalysts and therefore of particular interest for surface modifications [14,15].
The studies are conducted in a self-built versatile ALD setup using fixed particle beds, presented elsewhere [15]. The fixed-bed offers an excellent gas-solid contact. This reactor geometry is highly suitable for the deposition of very thin films on high surface area materials [16]. Our setup is equipped with a magnetic suspension balance, which measures in situ the mass changes during the ALD. Usually, ALD on flat substrates can be in situ monitored by using a Quartz Crystal Microbalance (QCM). A QCM confirms, in general, the self-limitation of an ALD process, but gives no information about the saturation of the specific sample itself, which is usually placed before the QCM. The in situ gravimetric monitoring is an effective and non-destructive way of studying the self-limitation of the ALD process and measures the deposited mass directly on the powder substrate of interest. The gravimetric data, combined with further chemical and physical analysis of the samples, helps to gain new insights of the first couple of ALD cycles on the porous powder. The determined ALD parameters were transferred and the coating was repeated with a 10× higher substrate batch size to investigate the scale-up possibilities of fixed beds for ALD. In addition, we discuss the experimental data with regard to a possible AlOx monolayer and its structure and dimension.

2. Experimental Section

We used an amorphous, unordered, and mesoporous SiO2 powder (Davisil, Grade 636) as our starting material and coated it with a very thin AlOx deposit via ALD. The SiO2 is a well-known support material especially for heterogeneous catalysts, as it is commercially available in large amounts with varied surface areas, mesh sizes, and average pore diameters.
Trimethylaluminium (TMA) served as the precursor and H2O as the reactant (second precursor). The correct ALD parameters and the self-limiting nature of the reactions were determined in the thermal balance. That followed a scale-up in a large fixed bed reactor. The samples were characterized with the given methods below.

2.1. Chemicals

Silica powder (SiO2, high-purity grade ≥ 99%; Davisil Grade 636; average pore size 60 Å, 35–60 mesh particle size, Sigma-Aldrich, (St. Louis, Mo, USA), 506 m2 g−1) was used as the substrate. Trimethylaluminium (Al(CH3)3, TMA, elec. gr., 99.999% Al) and water (H2O, CHROMASOLV®, for HPLC, Riedel-de Haën/Honeywell Specialty Chemicals Seelze GmbH, Seelze, Germany) served as precursors and were used without further purification. High purity N2, Ar, and He (99.999%) acted as carrier and purging gases.

2.2. AlOx ALD Experimental

AlOx coating experiments were conducted under reactor temperatures between 75–200 °C with 1–3 cycles in a self-built ALD setup comprising a magnetic suspension balance and a large fixed-bed reactor. A detailed setup description and experimental procedure is given elsewhere [15]. The amount of initial substrate varied between 100–600 mg. In contrast to many other ALD setups, the precursors were not pulsed, but sequentially introduced into the reactor in constantly flowing inert carrier gas. As precursors served TMA and H2O in the sequence TMA (in N2)-Ar purge-H2O (in He)-Ar purge. The setup was operated at atmospheric pressure under constant flow conditions with a total gas flow of 50 mL min−1. The setup featured an inert gas line for purging (Ar) and two gas lines flowing through different precursor saturators (N2 for TMA and He for H2O). By a system of switching valves, the different gases were distributed to the ALD reactor or to bypass lines. This design enabled a convenient switching between different gas atmospheres with or without precursors in the ALD reactor while maintaining a constant overall flow and a constant precursor delivery. The TMA saturator was operated with 40 mL min−1 N2, which was diluted in additional 10 mL min−1 N2 for the reactor temperatures of 75 and 200 °C. At 120 °C the flow was reduced to 25 mL min−1 N2 in the saturator and 25 mL min−1 N2 dilution. Typical half-cycle times lay in the range of hours depending on substrate mass. Mass changes were in situ monitored by gravimetry every 25 min for 5 min during the experiment. Atmosphere changes in the reactor, precursor, and byproducts were monitored with an online mass spectrometer. The precursor sequence was finished when the balance reached equilibrium and the MS showed a steady state. Valve switching between the ALD sequence was done manually.
In addition, a scale-up experiment was conducted at 200 °C. The ALD parameters and settings were transferred from the experiments in the balance. The fixed bed was divided by quartz wool into three segments.

2.3. Characterization Methods

N2 physisorption measurements were performed at liquid N2 temperature on a Quantachrome Autosorb-6B analyzer (Quantachrome GmbH & Co. KG, Odelzhausen, Germany). Prior to the measurement, the samples were degassed in dynamic vacuum at 150 °C for 2 h. Full adsorption and desorption isotherms were measured. The specific surface area SBET, the pore size, and pore volume were calculated according to the multipoint Brunauer-Emmett-Teller method (BET) and Barrett-Joyner-Halenda (BJH) method, respectively.
Inductively coupled plasma-optical emission spectroscopy (ICP-OES, Varian 720-ES, Varian Inc., Palo Alto, CA, USA) was used to determine the Al content of the samples. Solutions from the powders were prepared via microwave-assisted acid digestion using concentrated H2SO4 (95%) and concentrated H3PO4 (85%). The sample was treated at 300 °C for 30 min after 12 h of stirring. The spectroscope was five-point calibrated with a commercially available, diluted standard for Al.
Powder X-ray diffraction (XRD) measurements were performed in Bragg-Brentano geometry on a Bruker AXS D8 Advance II theta/theta diffractometer (Bruker AXS GmbH, Kalrsuhe, Germany), using Ni filtered Cu Kα radiation and a position sensitive energy dispersive LynxEye silicon strip detector. The sample powder was filled into the recess of a cup-shaped sample holder, the surface of the powder bed being flush with the sample holder edge.
High-resolution transmission electron microscopy (HRTEM) images were recorded at the Cs-corrected TITAN 80–300 Berlin Holography Special TEM (Thermo Fisher Scientific Inc., Waltham, MA, USA), operated at 300 kV.
Attenuated total reflection Fourier transformed infrared spectroscopy (ATR-FTIR) was performed on a Bruker ALPHA FT-IR spectrometer (Bruker Optik GmbH, Ettlingen, Germany) using a permanently adjusted ROCKSOLID interferometer and a DTGS detector (deuterated triglycinsulphate). The setup was equipped with a single reflection diamond crystal ATR accessory (PLATINUM-ATR). Samples were crushed in a mortar and uniformly distributed on the 2 mm × 2 mm crystal. Each spectrum was acquired by integration of 24 interferograms with a resolution of 4 cm−1 and correcting with atmospheric background.
Elemental analyses were performed on a Thermo Finnigan ThermoFlashEA 1112 Elemental Analyzer with a MAS 200 autosampler (Thermo Fisher Scientific Inc., Waltham, MA, USA) for solid samples. The gaseous compounds are separated via gas chromatography (GC) and detected by a thermal conductivity detector (TCD). Values were averaged over two separate measurements.

3. Results and Discussion

We successfully deposited a very thin AlOx layer with different numbers of TMA and H2O cycles at three substrate temperatures on a mesoporous SiO2 powder. Usually, ALD is used to produce nm thick layers with 50 and more cycles. The highest cycle amount conducted in this study was three, as we were interested in ALD in a submonolayer regime. Samples 200.1c, 200.2c, 200.3c, 120.3c, and 75.3c were synthesized in the thermal balance reactor and the mass gain was measured in situ. The sample family consisted of six samples including the reference SiO2. To give a good general overview, the results for those samples are presented in Table 1. The following sections will be discussed and results presented in detail for thematically grouped samples. The samples produced in the scale-up fixed bed reactor FB.top, FB.middle, and FB.bottomare are presented in Table 2 and are discussed separately.
The reference SiO2 is an often-used support material and was characterized previously with XRD, N2 adsorption for BET/BJH calculations, and ICP-OES. In addition, thermogravimetric analysis combined with mass spectrometry (TG-MS) are presented elsewhere [15]. The results verify that all physisorbed water on the SiO2 is removed by sufficient drying at 72 °C and no further condensation of surface groups occurred.
Usually, the intrinsic self-saturation of the ALD half-reactions is proven by analyzing the amount of surface coating as a function of dosing time. The deposited amount will be independent from the dosing time, when the surface is saturated. This requires at least five experiments or more and the corresponding analytics [17]. Here, we used a setup with in situ gravimetric monitoring and needed only one experiment. The self-limitation of the process revealed itself during the experiment. Our samples, prepared in the balance, showed complete saturation curves, hence self-termination, for all temperatures and all cycles. To stay in the scope of this manuscript, the full curves are shown in the Supplementary Materials and solely the relative mass gains are discussed in the following sections. In addition, the interested reader can find examples for the QMS monitoring elsewhere [15].

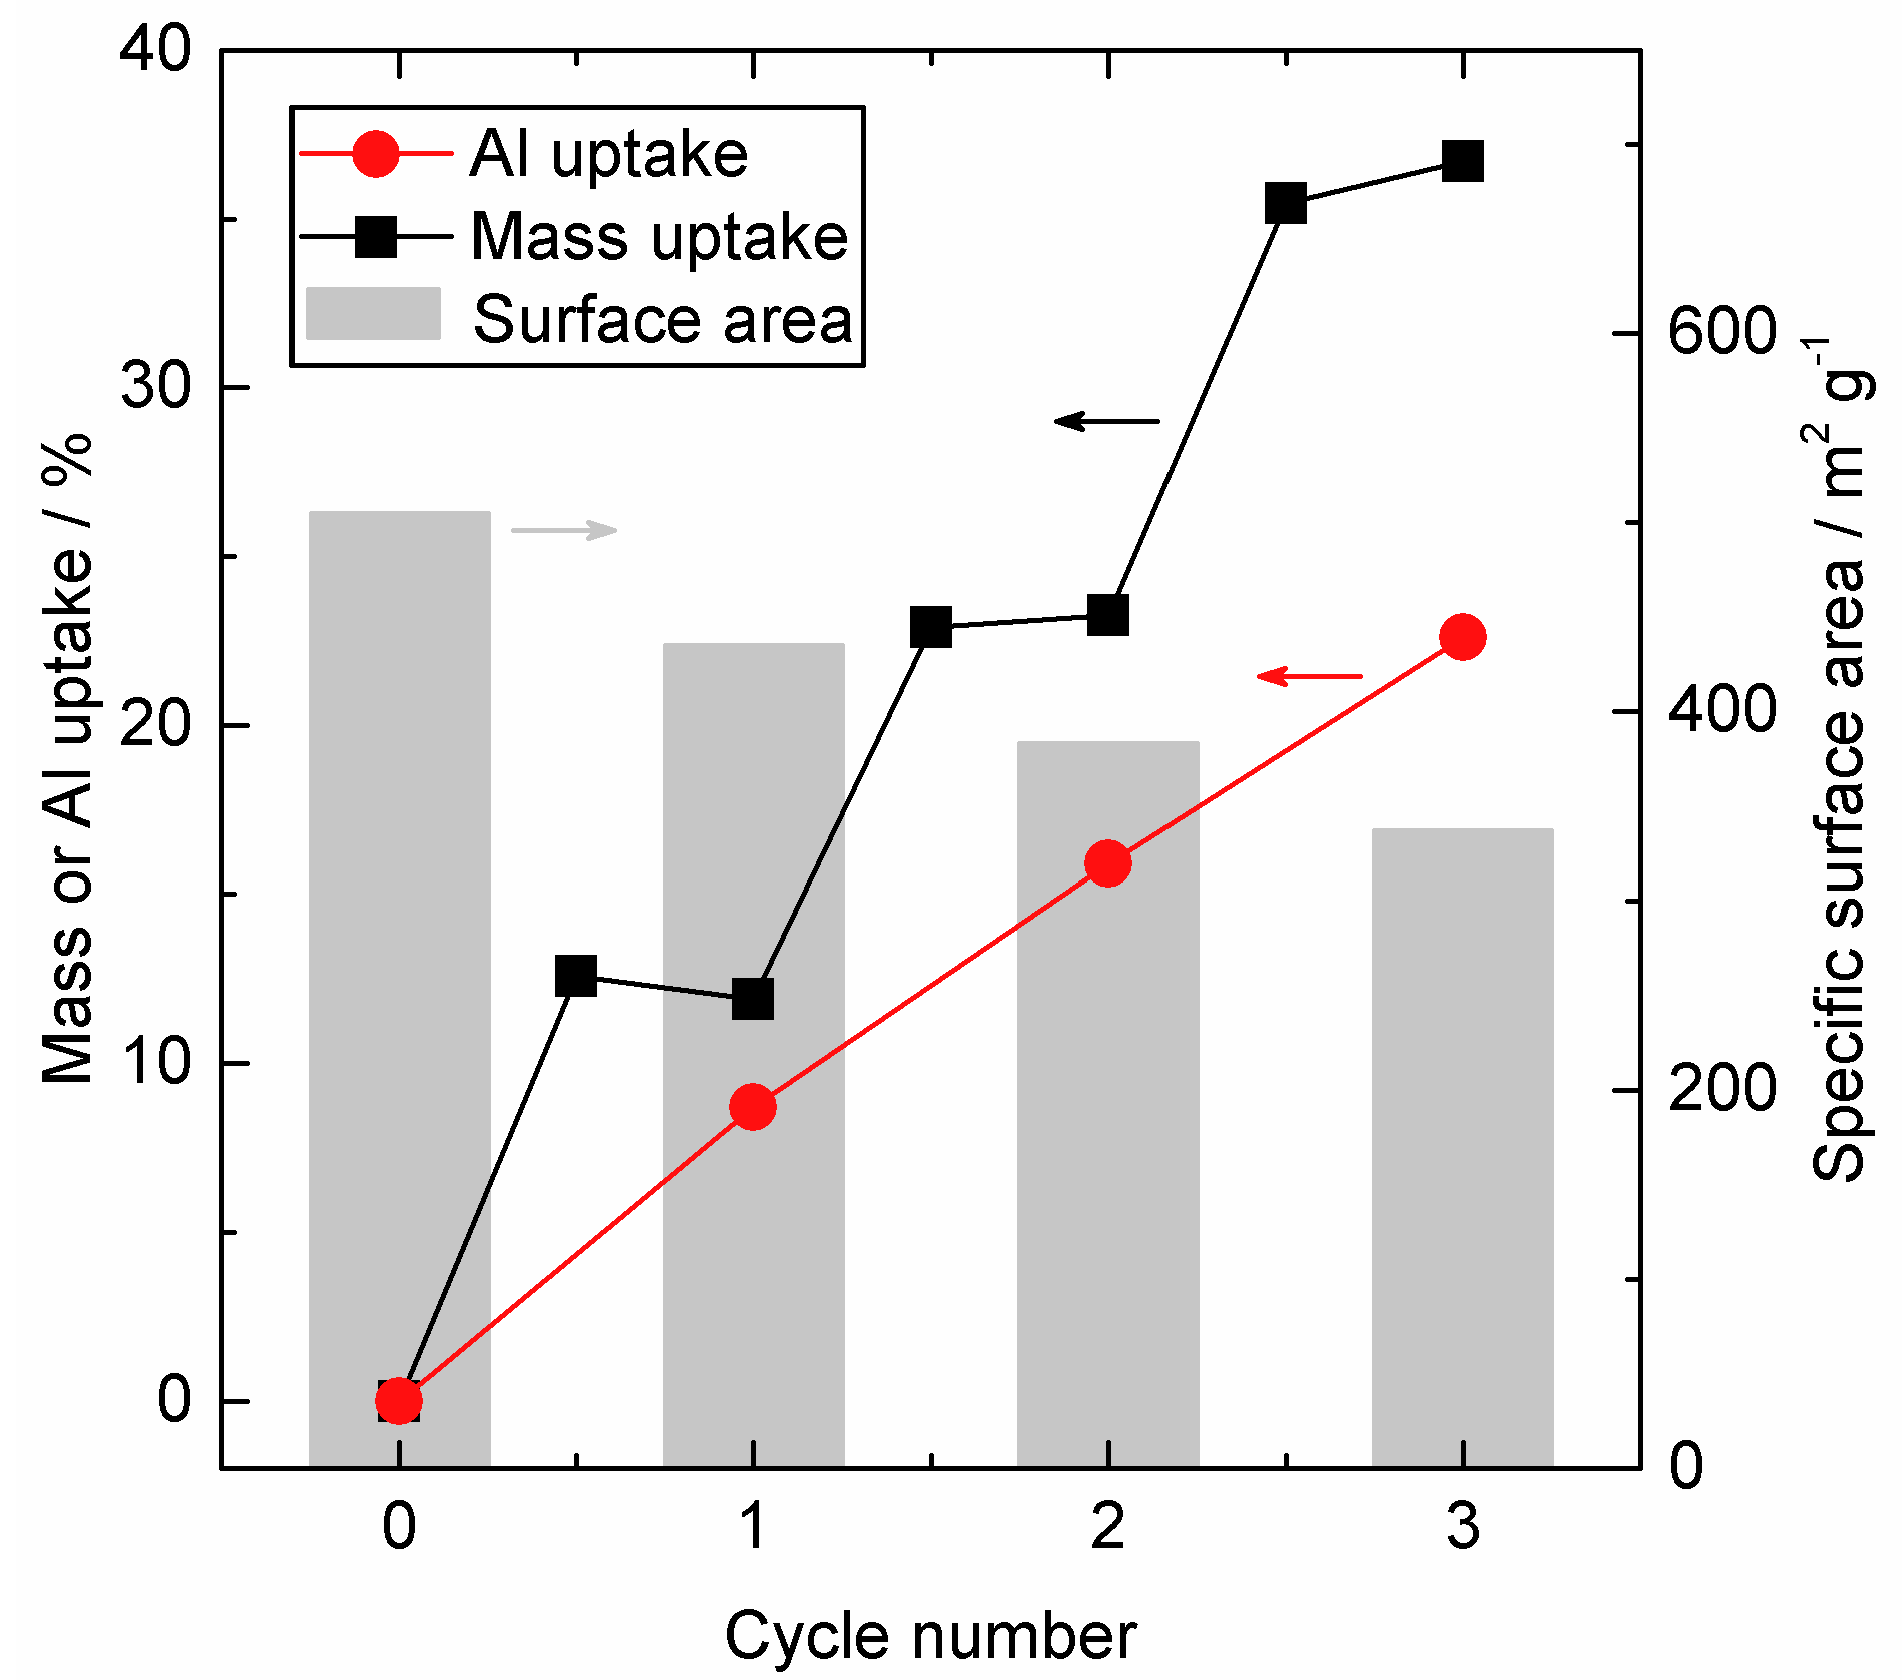
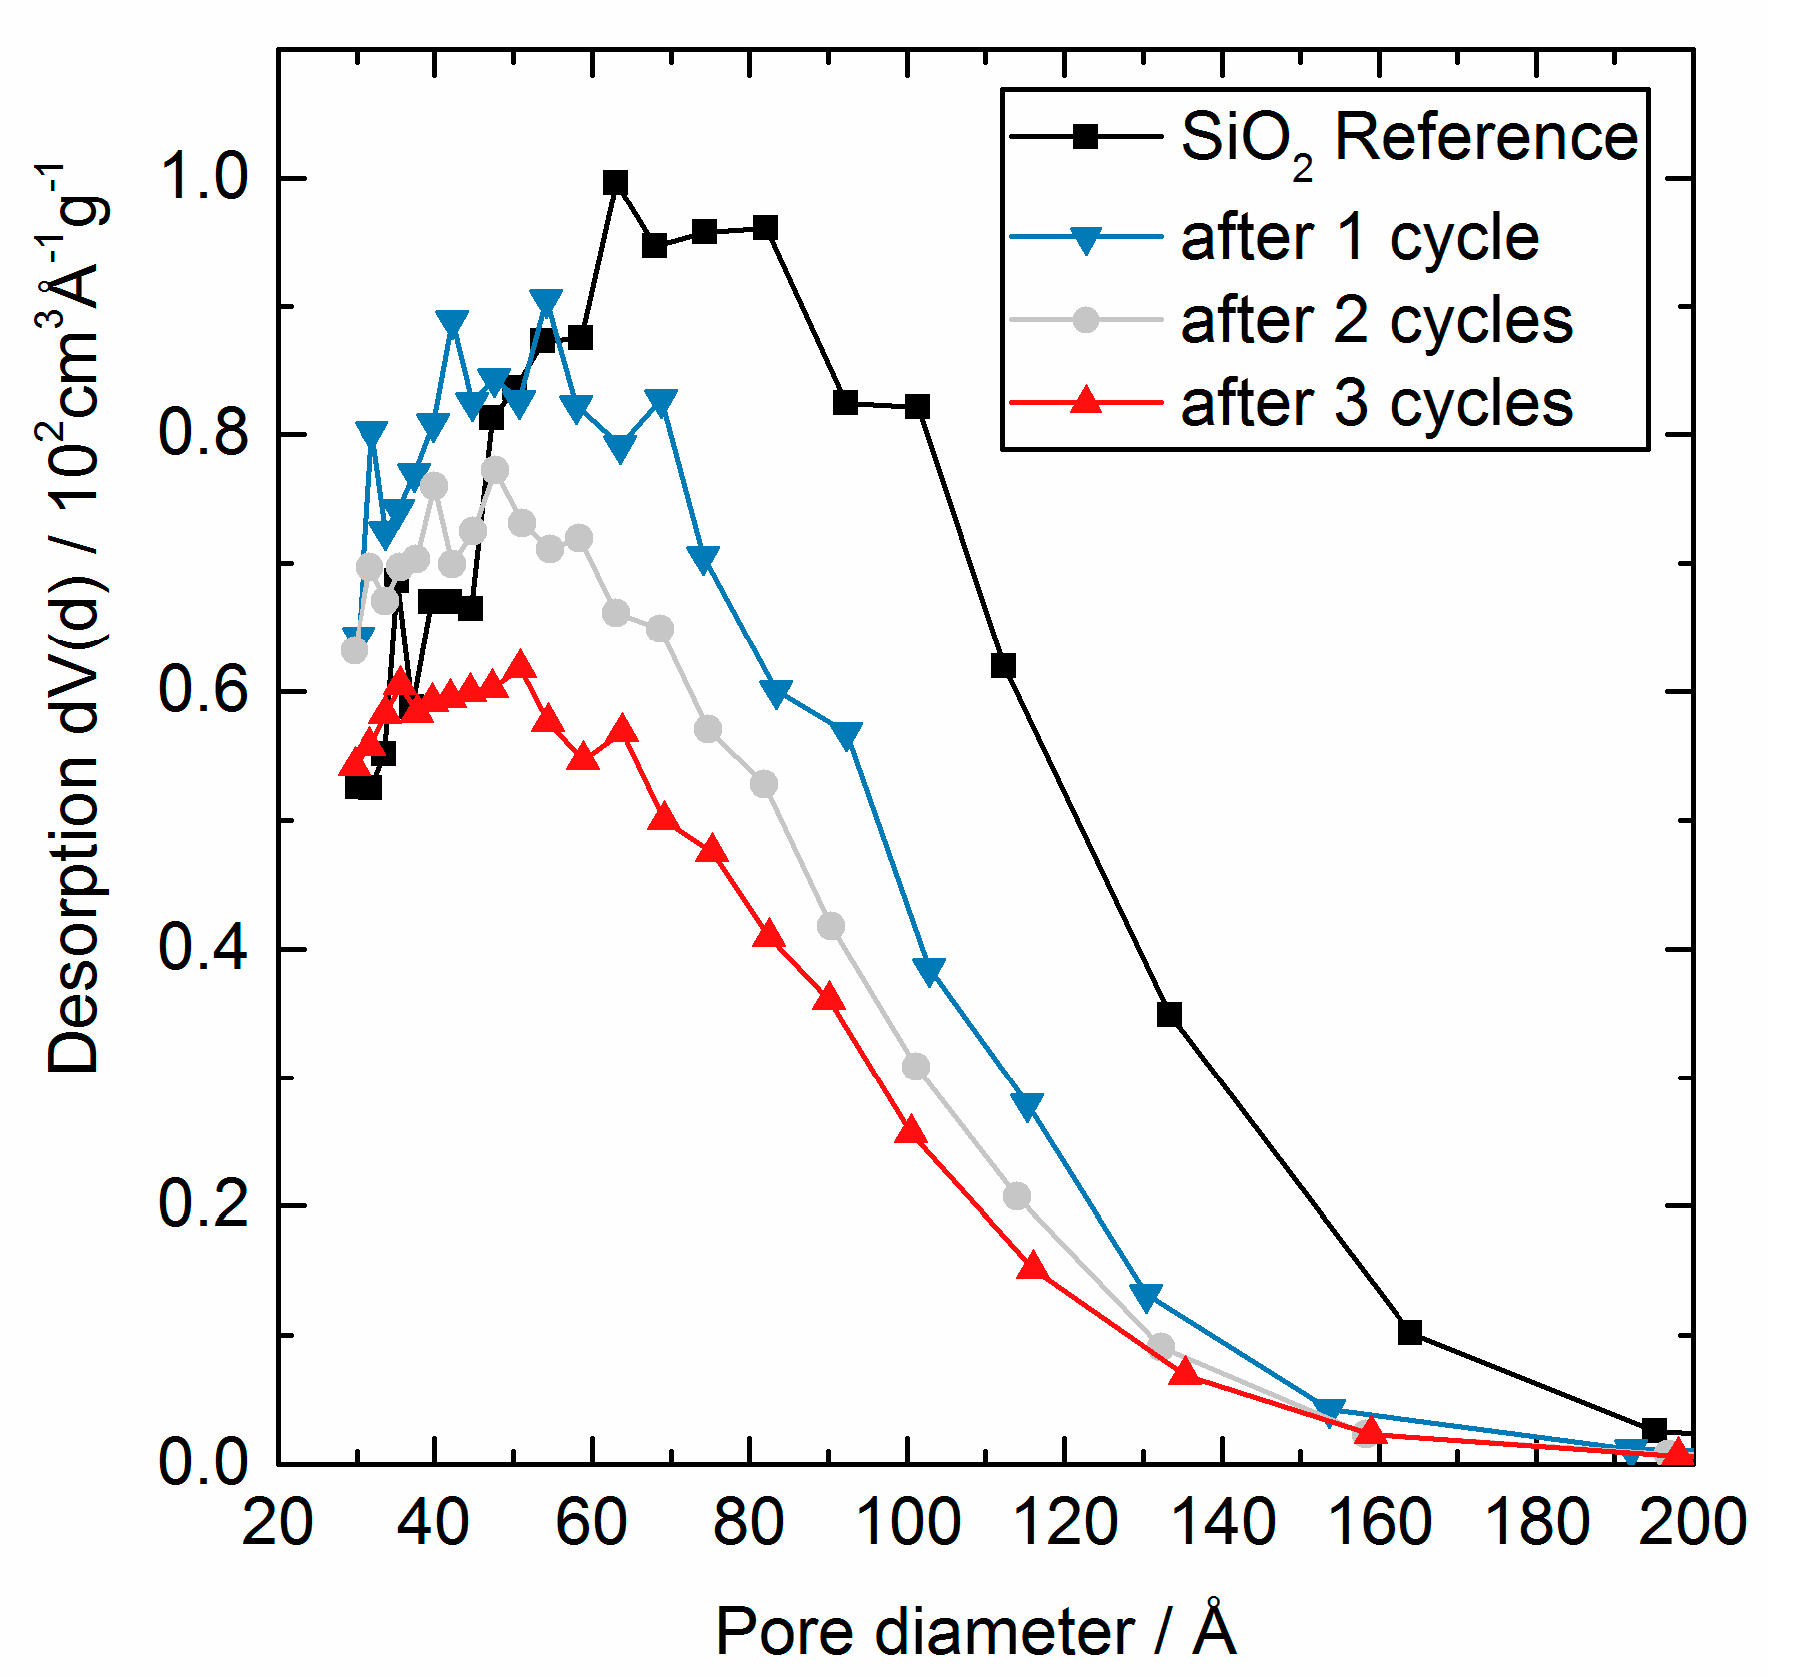
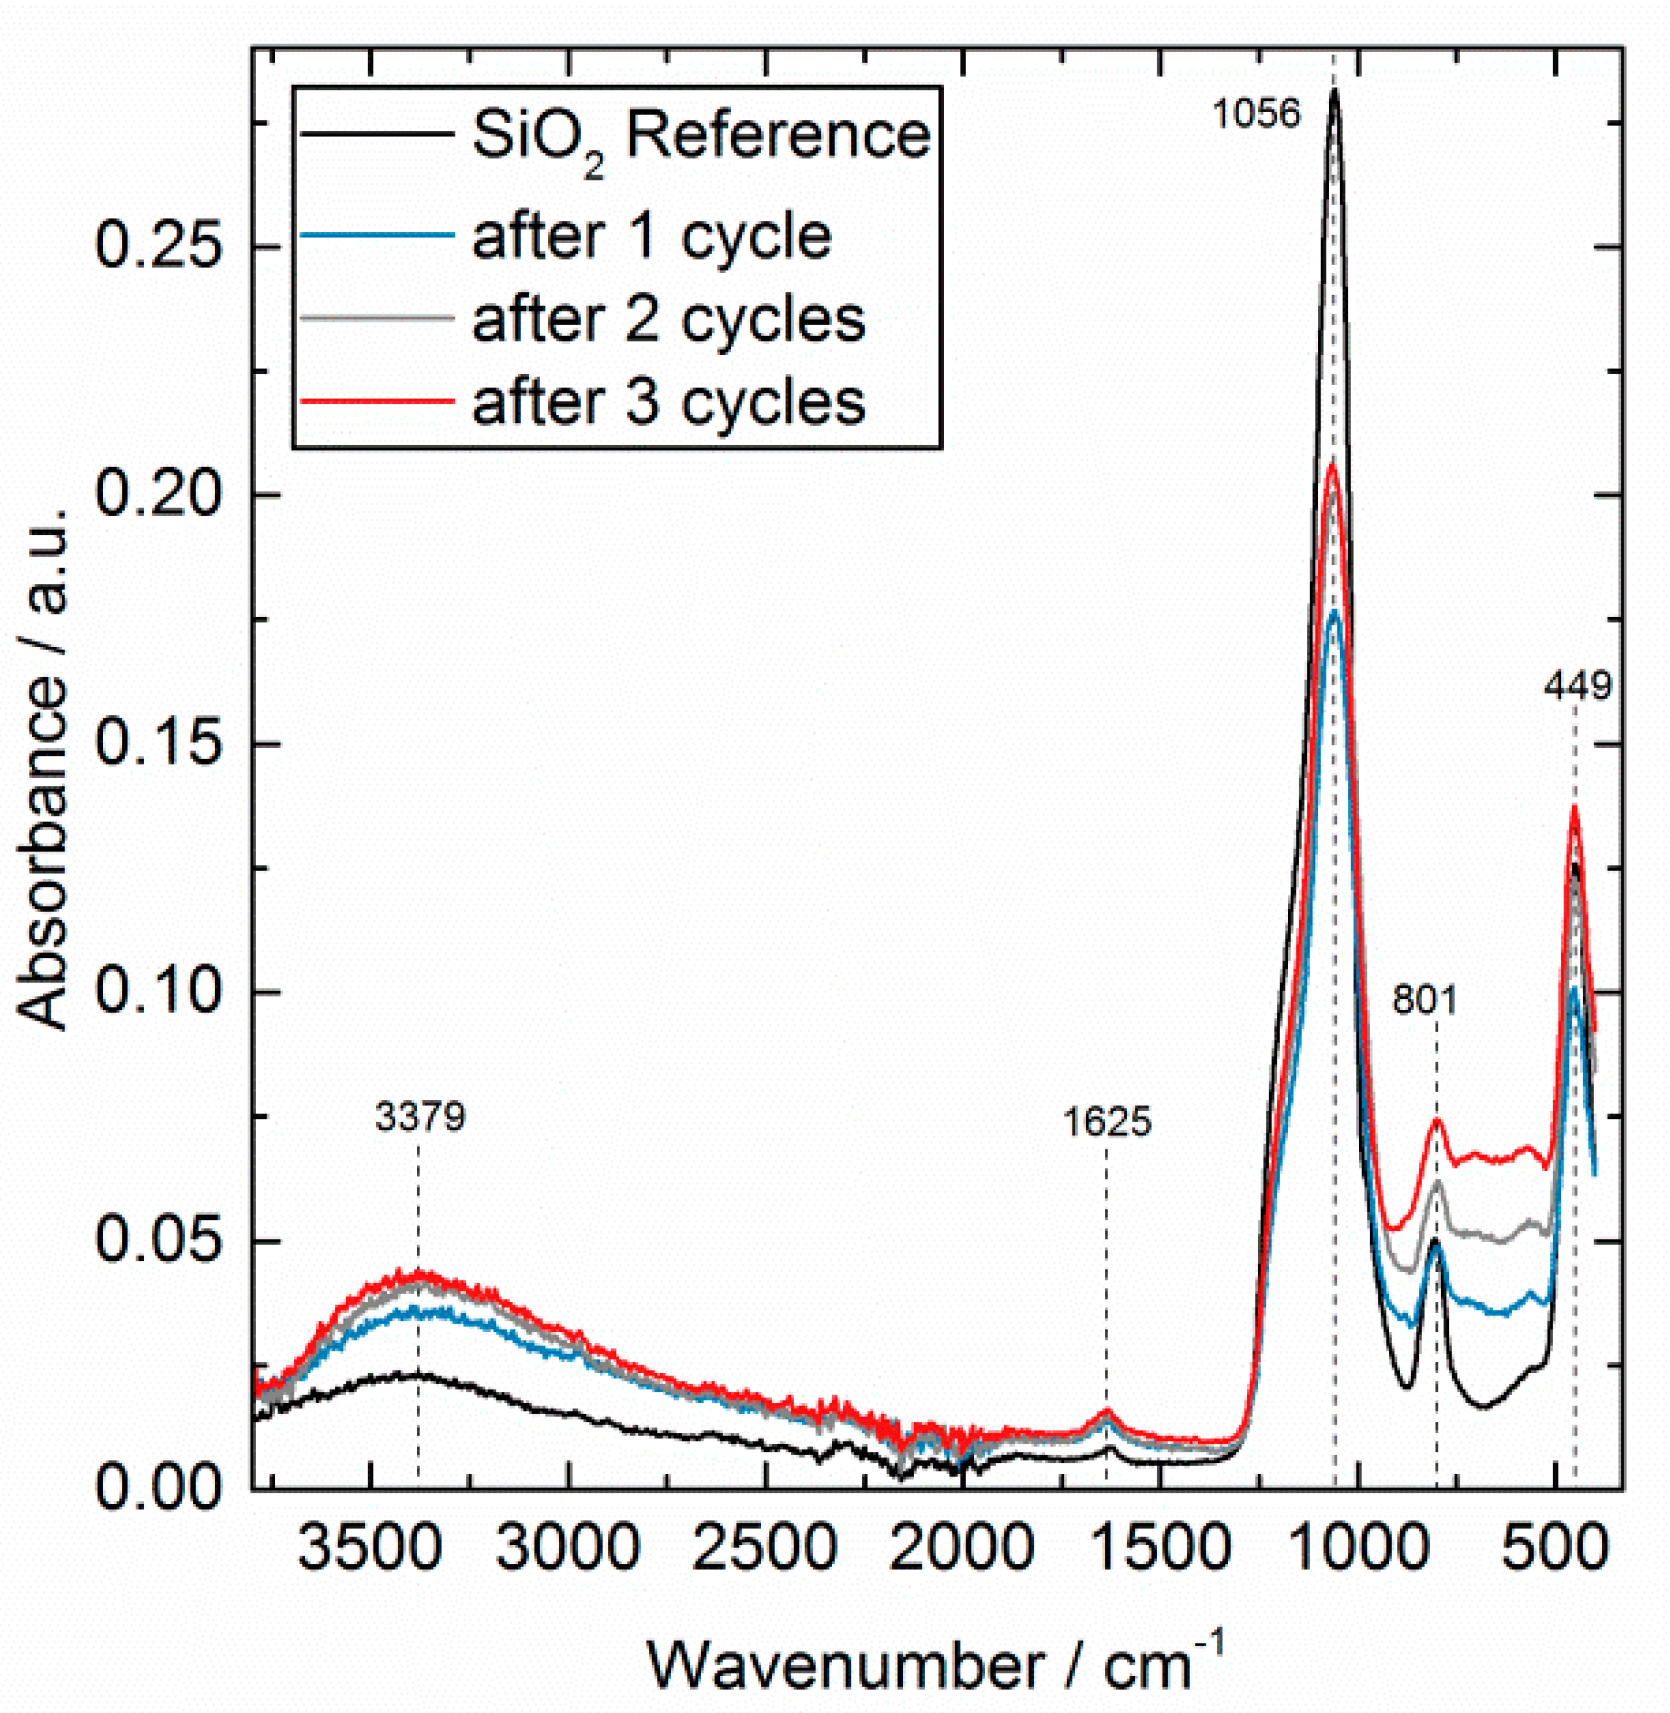
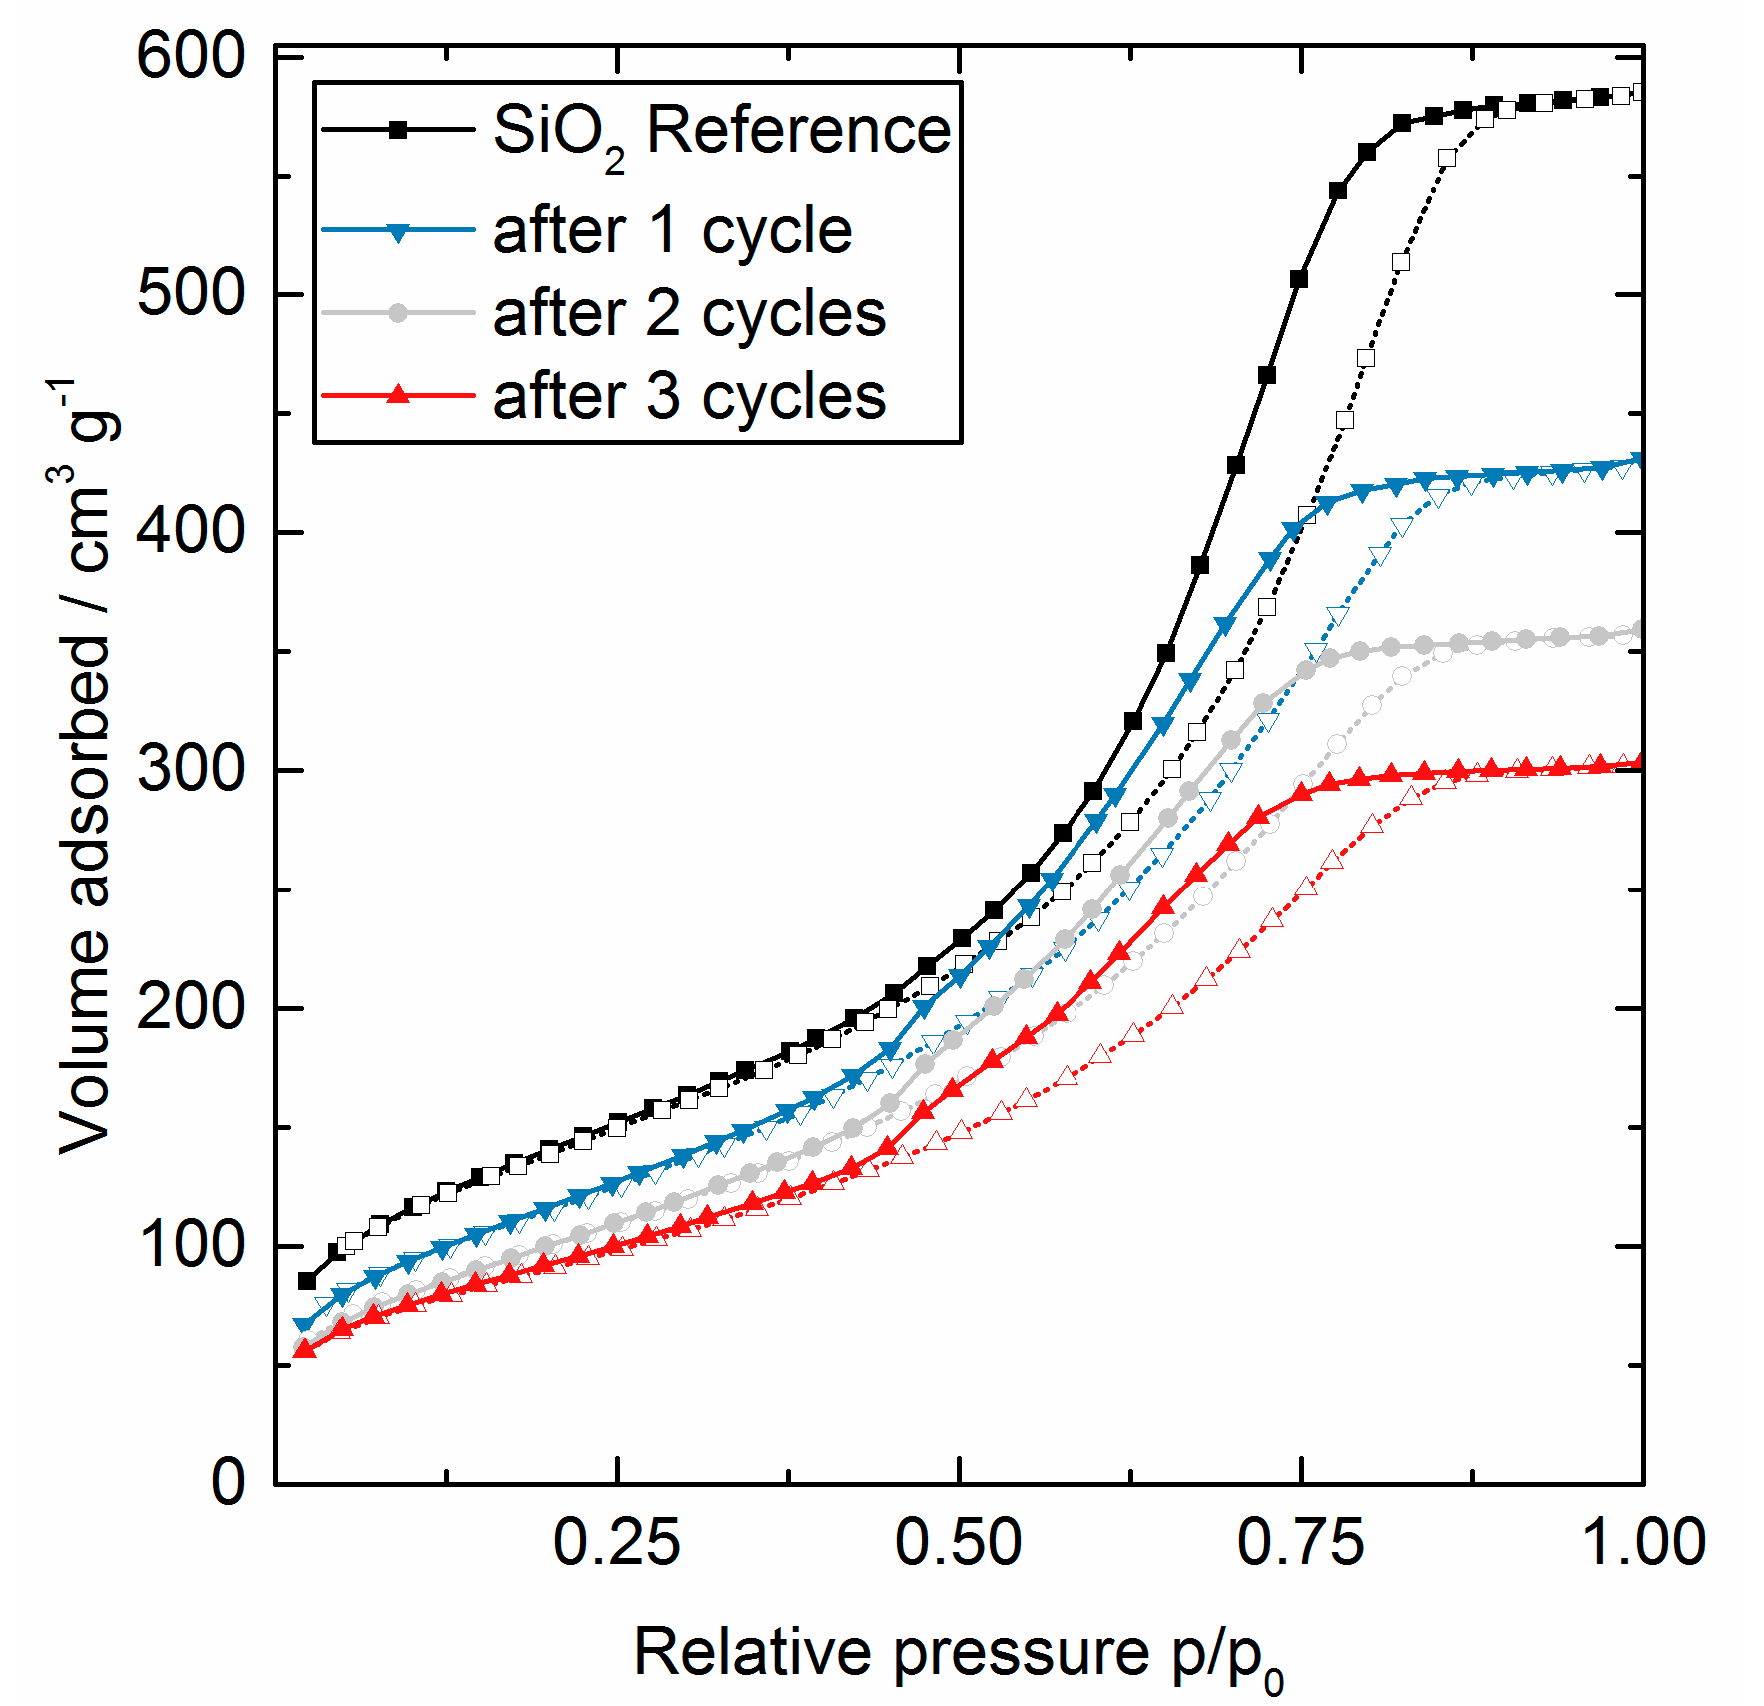
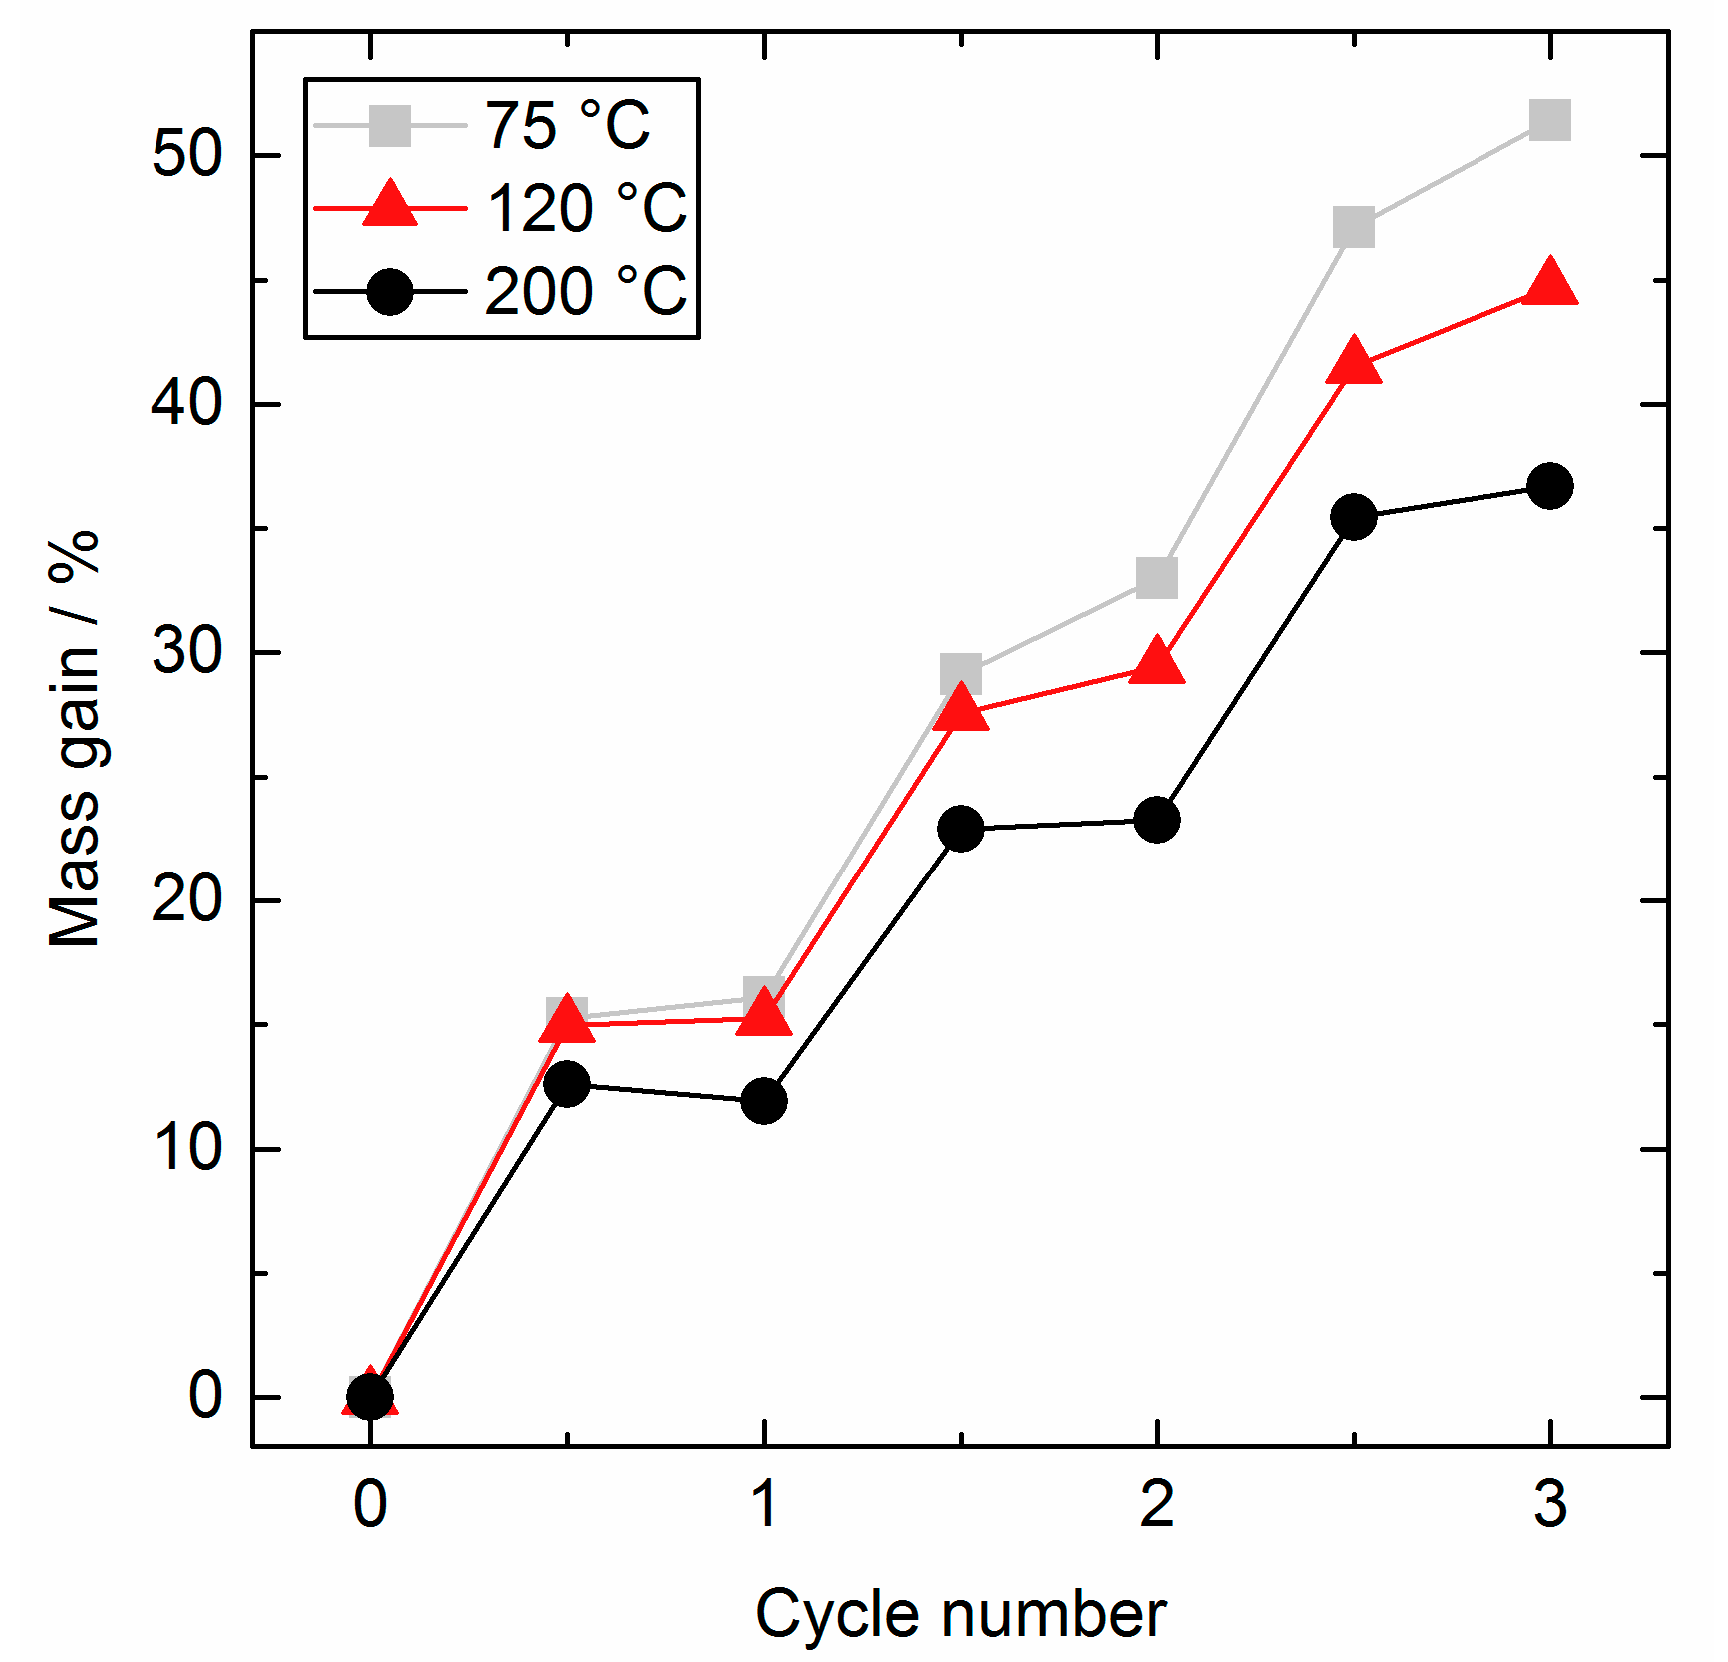
3.1. Influence of Cycle Number

At the reactor temperature of 200 °C samples after one, two, and three cycles were prepared and further analyzed to study the influence of the cycle number on the coating and the pore structure of the SiO2. The relative mass gain per cycle is presented together with the calculated BET surface area and the Al uptake in wt % determined with ICP-OES in Figure 1.
Beside the saturation curves (for details see Supplementary Materials), the in situ gravimetry gives two pieces of information: (1) the total mass gain, which was around 12–13% for each cycle, and (2) the uptake, which is distributed differently between the two half cycles from cycle to cycle. In the first cycle, the H2O half-cycle led to a slight mass loss of −0.7%. With increasing cycle number, the contribution of the H2O half-cycle to the total mass gain increased from 0.4% for cycle two and 1.2% for cycle three.
For an interpretation of this data, it is necessary to have a look at the surface reactions during the ALD. It is known, that TMA can undergo different chemisorption mechanisms on the surface, shown in Equations (1) and (2) (with 1 ≤ x ≤ 3) [17].
x   O H + Al ( CH 3 ) 3   ( g )   ( O ) x Al ( CH 3 ) 3 x   + x   CH 4   ( g )
( O H ) x Al ( CH 3 ) 3 x   + ( 3 x )   H 2 O   ( O ) x Al ( OH ) 3 x   + ( 3 x )   CH 4   ( g )
The molecule has three methyl groups and, if we leave dissociation and association mechanisms out of consideration for convenience, it can react via a single exchange (x = 1), a double ligand exchange (x = 2), or a triple ligand exchange (x = 3). The following H2O cycle hydrolyzes the remaining methyl groups, releasing them as methane and repopulates the surface with hydroxyl groups (Equation (2)). Based on these equations, the additional molar mass per precursor molecule and the contribution from the H2O cycle can be calculated: 60 g molPre−1 for single exchange with 6% mass gain from H2O, 42 g molPre−1 for double exchange with 5% from H2O, and 24 g molPre−1 for triple ligand exchange without contribution from H2O [18] (see as well Figure S4 in Supplementary Materials).
Coming back to our data, the experimental molar mass for the adsorbed Al species can be calculated with the mass gain and Al content in the sample. The results show a clear trend to increasing mass with increasing cycle number: 39 g molPre−1 for cycle one, 43 g molPre−1 for cycle two, and 51 g molPre−1 for the last cycle. This brief calculation correlates with predominantly single and double ligand exchange reactions in our ALD reaction with a larger contribution of single ligand exchanges with increasing cycle number. Yet, the observed mass contributions from H2O were too low to directly fit double and single ligand exchanges. This can be rationalized with possible condensation reactions of two hydroxyl group, either both emerging on Al atoms or one Al-OH group and one Si- OH group. This condensation leads to an additional mass loss and can cancel out other mass gains. In general, the change of the surface reactions with cycle number is thoroughly anticipated, as the surface composition changes during the first ALD cycles from a SiO2 to an AlOx surface [19]. A repetitive cycle with equal mass gains/Al gains will begin, as soon as a reproducible surface is formed.
Furthermore, Figure 1 illustrates the linearly increasing amount of Al with increasing cycle number. For the first cycle, almost all mass gain was built up by Al itself and consequently only a small amount was contributed by additional O and OH incorporation. Though this contribution grew with increasing cycle number. This confirms the previous conclusion of potential condensations of OH groups and a higher measurable impact of the H2O treatment in the following cycles. For comparison, the mass ratio in pure Al2O3 is 53:47 (Al:O), i.e., would lead to 53 wt % mass gain by Al (without considering potential H atoms).
Nitrogen physisorption measurements were performed to analyze the effect of the AlOx deposit on the porous structure of the support. The full desorption and adsorption isotherms are presented in Figure 2 and the calculated differential pore size distribution in Figure 3. The distribution was calculated using the method proposed by Barrett, Joyner, and Halenda (BJH) [20].
All samples gave an H1 type hysteresis loop, with parallel adsorption and desorption branches, due to the capillary condensation of N2 in mesopores. In addition, the data shows a clear decrease in the step height of the isotherms as a function of cycle number, a general downward shift, and an accompanied slight horizontal shift to lower relative pressures, better seen in the resulting decreasing pore size distribution. The combination of the two shifts and reduction in step height verifies a conformal coating of the pores. All other possible growth mechanisms in the pores can be excluded. Those mechanisms would lead to other shaped isotherms, e.g., a gradual filling of the pores with AlOx and/or the covering of the pore entrance do not result in a horizontal shift/a lower pore size [21]. The formation of large AlOx particles in the pores would lead to an H2 type isotherm, characteristic of ‘ink bottle’ type of pores [22].
The BET surface area as a function of cycle number is shown in Figure 1 and the absolute values are as well presented in Table 1. The surface area decreased from 506 m2 g−1 to 337 m2 g−1 during three cycles due to the decrease of the pore volume, when the pore size was continuously reduced. In addition, the covering of micropores can contribute to the observed surface area reduction, as the decreasing intercept of the adsorbed volume may indicate. Literature suggests that an increasing cycle number would influence the surface area less sharply, once all micropores and mesopores are blocked. By adding relatively dense Al2O3 to a SiO2 substrate of low density a general systematic change of the surface area has to be considered as the specific surface area is normalized to mass (g). For clarification, adding 12.5% mass to a given quantity of SiO2 and assuming no change in the exposed surface area would counterintuitively result in a decrease of the mass related specific surface area from 506 m2 g−1 (see Table 1) to 450 m2 g−1 merely due to the added mass. The experimentally measured value here was 435 m2 g−1, in very good agreement with these considerations. In conclusion, the presented values for the surface area fairly represented the general trend, but the absolute values must be treated with reservation. The pore size distribution (see Figure 3) was calculated according to the BJH theory, which is based on the assumption of regular and cylindrical pores without any interconnection. Here again, the general trend of a decreasing pore size can be clearly seen in the calculated values. However, the absolute values were not reliable, as the silica substrate featured an irregular and unknown pore system. A reasonable assumption would be interconnected inkbottle-shaped pores formed by agglomeration of nano-sized primary particles.
The HRTEM images in Figure 4 show exemplary the uncoated and coated SiO2 particles after one and three cycles. The overall morphology and microstructure of the particles was retained during the ALD procedure at 200 °C and the AlOx deposition. The primary particles of around 5 nm feature inner particle voids responsible for the high surface area of the material and the porosity. In general, electron microscopy of amorphous SiO2 in combination with Al is challenging, as they have close atomic numbers. Without advanced imaging techniques, (e.g., scanning transmission electron microscope) very low loadings of AlOx in the surface cannot be observed. However, we did not detect full AlOx layers or clusters. Consequently, the HRTEM images confirm a highly dispersed AlOx on the surface.
The absolute ATR-FTIR spectra of the reference and the coated samples are presented in Figure 5 and prove the growth of an amorphous AlOx on SiO2. All spectra showed three strong bands for SiO2 in the low frequency region (<1200 cm−1). The adsorption bands at 1056 cm−1 and 801 cm−1 are attributed to asymmetrical and symmetrical Si-O-Si stretching, and the band at 449 cm−1 to the corresponding Si-O bending vibrations [23]. By depositing AlOx cycle by cycle, several broad features appeared in the range of 990–450 cm−1, without a notable change related to the position of the Si-O bands. Those new characteristic bands indicate bulk aluminum oxide and mixed Al/Si oxides. The bands superimpose with each other and the SiO2 bulk bands, so a specific band assignment is not appropriate. In general, Si-O-Al stretching vibrations appear usually between 1000–926 cm−1 and Al-O-Si bending vibrations in the range between 800–500 cm−1 [24].
The Al-O stretching and O-Al-O bending led to bands between 850–750 cm−1 and 750–650 cm−1, respectively. One small feature at 1625 cm−1 corresponds to the OH bending mode. This mode was not changed by the ALD deposition, which may indicate those OH sites are inaccessible and/or non-reactive for ALD. The OH stretching appeared very broad around 3379 cm−1 [25]. The new AlOx deposit on the surface led to a quantitative and qualitative change in this mode as expected. Besides the Si-OH, the surface was populated with additional Al-OH groups during the ALD until a full AlOx layer was formed after more cycles.
Possible residues of precursor material can stay on the substrate surface and lead to undesired contamination. We analyzed the carbon contamination in the samples by elemental analysis. Around 1.6% carbon uptake was found after one cycle at 200 °C. The amount of contamination stayed constant at 1.6% after two cycles and then decreases to 1.4% after three cycles. Most of the contamination was accordingly built-in with the first cycle of TMA. The exclusive carbon source in the process is the methyl group from the TMA. Incomplete reaction of the TMA ligand with H2O or trapped/attached carbonaceous species after the reaction with H2O can be safely assumed as the source of the measured residues. The powder surface structure may favor the development of contamination due to its complex porosity, in particular micropores [26]. Longer overall contact with H2O in the following cycles may help to clean the surface of TMA residues.

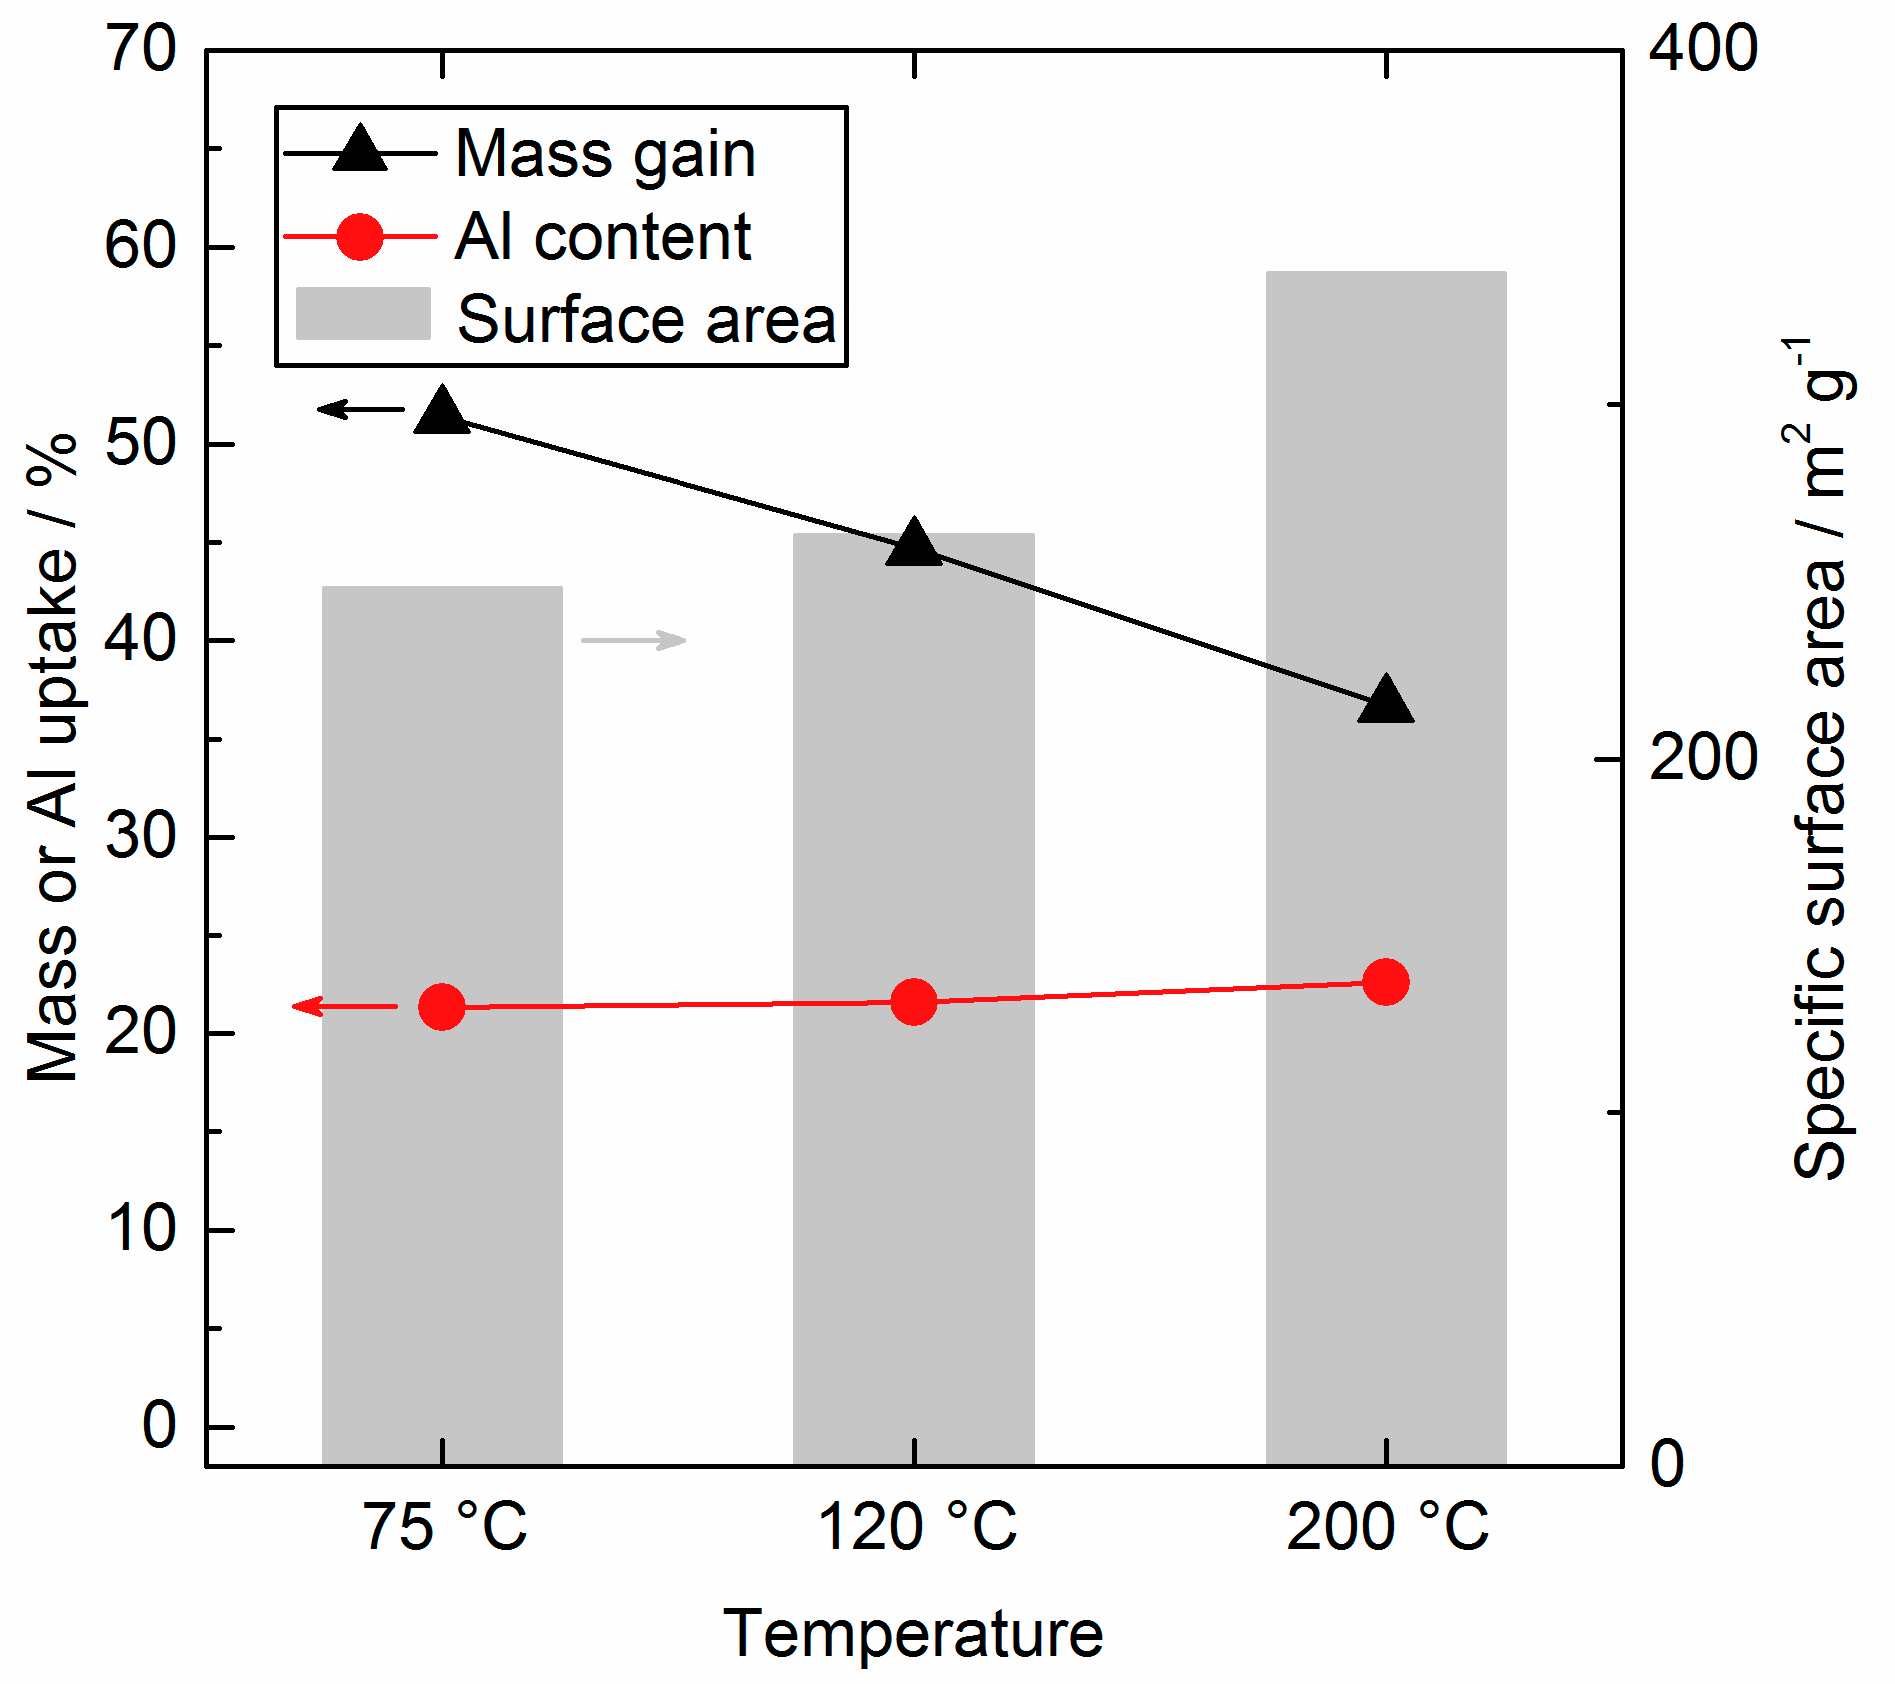
3.2. Influence of Substrate Temperature

The AlOx coating experiment was repeated at 75 °C and 120 °C to study the influence of the substrate temperature. Again, a self-terminating process was found for all temperatures through all three cycles. The percentage mass gain per half cycle is given in Figure 6. Full saturation curves are presented in the Supplementary Materials.
Lower substrate temperatures led to a higher mass gain per cycle and a sharper decrease of surface area, as displayed in Figure 7. The Al uptake increased from 21.3% for 75 °C to 21.6% for 120 °C and up to 22.6% for the 200 °C sample, but are comparable in a reasonable range. As it is discussed in literature, the total amount of deposited Al is significantly influenced by the amount of reactive surface sites [27]. As it was already mentioned, the SiO2 substrate was not profoundly changed in the working temperature range above 72 °C and we expect the same amount of SiO2 surface sites for all temperatures. However, the surface composition changes when AlOx is deposited and different amounts and sorts of surface sites can evolve and their interaction will be influenced by temperature, e.g., more condensation reactions of new OH groups taking place at higher temperatures. The first cycle for all temperatures add up in a comparable mass gain as seen in Figure 6, as the precursor predominantly reacted with the selfsame SiO2 surface. The following cycles diverge much stronger as new surface sites were created. Lower mass gain indicates here an already more interconnected AlOx for higher deposition temperatures and more isolated AlOx species, containing more O and H atoms as well, on the surface of SiO2 at low temperatures, respectively. In other words, the AlOx deposited at 200 °C was much denser than the AlOx deposited at 75 °C. In general, literature reports about an inversely proportional relationship between the process temperature and the growth/mass gain for the TMA/H2O, owing to the temperature influence on the nature and amount of surface sites [13].
To compare our results with common other ALD studies, it is necessary to determine the average growth per cycle, which is generally easy for the deposition on flat substrates. When working with porous powders this value is not directly accessible. Here, the density of 3 g cm−3 at 200 °C from literature for the AlOx deposit for all temperatures is applied to calculate the average layer thickness based on the overall mass gain. The resulting calculated growth rates are 0.81 Å/cycle for 200 °C, 0.98 Å/cycle for 120 °C, and 1.10 Å/cycle for 75 °C, and conform to other literature [28]. However, the assumption of a constant density is inaccurate.
XRD shows (Figure 8), that the SiO2 powder and the as-deposited AlOx coatings were amorphous for all temperatures. One broad reflex at 22° is attributed to amorphous SiO2. No crystalline ad phases or phase changes were found.
When discussing three ALD cycles, the question of a closed monolayer of AlOx on the surface arises. In general, this question is not easy to answer, due to the unknown structure and dimension of such a monolayer [29,30]. The very first layer of a new material on a well-defined crystal structure e.g., SiO2 crystal or Si wafer, most probably follows the already given crystallinity of the support material (epitaxy). The structure will morph from layer to layer and after a certain thickness finally result in the corresponding crystal structure of the deposit material depending on the process temperature and parameters, i.e., Al2O3. In this study, we coated amorphous SiO2 with an amorphous AlOx and therefore cannot definitely rely on known structures. Thus, three different approaches for answering the question of the dimension of a monolayer are discussed below.
Despite the fact that the investigated material is non crystalline, a reasonable starting point for a rough estimate of the space requirement of Al and O containing layer, can be a well-known Al2O3 structure, for instance the corundum structure, α-Al2O3 [31]. It has a hexagonal crystal lattice and is composed of AlO6 octahedra with O tetrahedrally coordinated by Al atoms. The unit cell repeats itself every six layers, as the basal plane features empty Al sites. In this unit cell, the thickness of one layer is 2.166 Å [32]. By combining the lattice parameters and the given fact of two Al atoms per layer (12 per unit cell), the concentration of Al per nm2 in such a layer can be calculated to theoretical 10.2 atomsAl nm−2. Another estimate of the dimension of a monolayer is obtained from the density of the material. By assuming an isotropic and equilateral cube of AlO1.5 and a density of, again, 3 g cm−3 the space requirement of Al is 0.0926 nm2, giving 10.8 atomsAl nm−2. This result is already comparable with the one deriving from the crystal lattice approach. To come back to the experimental data, the height of the deposited layer after three cycles was determined by the already calculated growth per cycle and laid between 2.4–3.3 Å depending on the substrate temperature. Here, the calculated thickness from the experimental data indicates the possibility of an already closed monolayer of AlOx. Still, it is important to keep in mind that the calculated thickness is inaccurate, because the exact density is unknown and most likely differs from the density of around 4 g cm−3 for α-Al2O3 [28] and the calculated height of 2.166 Å in a corundum. On the other hand, the Al surface concentration of our synthesized samples can be straightforwardly calculated from the Al content and the BET surface area. Though, the assumption of a two-dimensional growth of the AlOx process needs to be made, meaning TMA preferably reacted with the original SiO2 surface rather than the AlOx islands [33]. The Al-O species are consequently arranged side by side and not on top of each other. Thereby the experimental values for the surface concentration laid in the range of 8.9–9.9 atomsAl nm−2 and would suggest insufficient Al atoms on the surface for a closed monolayer, irrespective of the above presented theoretical approach to dimension a monolayer. In conclusion, the question of a closed monolayer cannot certainly be answered. Three cycles are definitely on the edge to a closed layer, but might not be enough. Following the presented calculations, it can be safely assumed that less than three cycles will not give a monolayer of AlOx.

3.3. Scale Up in Fixed Bed

Samples FB.top, FB.middle, and FB.bottom were synthesized in the large fixed bed reactor using three AlOx ALD cycles with TMA and H2O. The in situ mass gain was consequently not recorded. Yet, QMS measurement confirmed the changing gas atmosphere and breakthrough curves for all cycles, as it is presented elsewhere [15]. The fixed bed consisted of around 10 g SiO2 powder (10× more, than in the balance) and was segmented in three partitions to investigate the homogeneity of the coating through the entire bed length. The surface area and the wt % Al for all segments corresponds to the 200.3c sample (see Table 1), that was synthesized in the balance with identical process parameters. Therefore, we can conclude homogeneity of all samples along the bed, as well as a homogeneously deposition of AlOx. In addition, the samples showed nearly no carbon contamination, in contrast to the balance samples. Presumably, the gas-solid contact in the large fixed bed reactor was improved compared to the balance system, leading to a lower carbon contamination. This is rationalized by the frequent interruption of the balance system, due to the lifting of the crucible for the mass measurement. During this measurement, the gas-solid contact was largely minimized and most of the precursor bypasses the sample material.

4. Conclusions

We reported about the growth of AlOx via 1–3 ALD cycles of TMA/H2O on mesoporous SiO2 particles. By applying an average density for all deposits, the growth per cycle was calculated to 0.81 Å/cycle for 200 °C, 0.98 Å/cycle for 120 °C, and 1.10 Å/cycle for 75 °C, and is in good agreement with other AlOx processes reported. The in situ gravimetry is a convenient tool to observe the saturation behavior on the substrate surface during the ALD process itself. We verified a self-limiting deposition for all temperatures, half-cycles, and cycles. As the first ALD cycles proceed on the SiO2 surface and not on an Al2O3, the overall mass gain and its distribution between the TMA and H2O cycle changed from cycle to cycle. We conclude predominantly a two-ligand exchange reaction of the TMA molecule with the surface OH groups for the first cycle. With increasing cycle number, more single-ligand exchange was taking place. The Al content is insignificantly influenced by the substrate temperature. The higher mass gain for lower temperatures was consequently based on higher incorporation of O and H in the deposit, leading to a less dense AlOx layer. The very unique feature of ALD to coat high surfaces including highly porous substrates in a conformal manner was proven by nitrogen adsorption experiments. Different approaches to estimate a possible amorphous monolayer of AlOx on the SiO2 surface were discussed and we can safely assume that three ALD cycles were not enough to form this monolayer. Finally, we demonstrated the compelling advantage of the in situ gravimetric monitoring for ALD on powder materials. Further analysis of the TMA/H2O and other ALD processes on other challenging powder substrates, e.g., catalysts, are of high interest and will be the subject in future investigations.

Supplementary Materials

The following are available online at https://www.mdpi.com/2079-4991/8/6/365/s1, Figures S1, S2, and S3: In situ gravimetric monitoring of three cycles TMA/H2O on SiO2 particles at 200 °C/120 °C/75 °C.

Author Contributions

V.E.S., R.N.d.A., and F.R. conceived and designed the experiments; V.E.S. and K.K. performed the experiments; V.E.S., R.N.d.A., M.D., and F.R. analyzed the data; M.D., and F.R. contributed reagents/materials/analysis tools; V.E.S. wrote the paper.

Funding

This research received no external funding. However, we gratefully acknowledge support for the open access publication by the German Research Foundation and the Open Access Publication Funds of TU Berlin.

Acknowledgments

The authors want to thank the following co-workers: Stephen Lohr from BASF SE, MaikeHashagen, Jasmin Allan, and Frank Girgsdies from the Fritz-Haber-Institut der Max-Planck-Gesellschaft (FHI), and Jan Meißner, Benjamin Paul, and KorneliaWeh from the TU Berlin for their help, analytic measurements and discussion. The work was conducted in the framework of the BasCatJointLab between BASF SE, the TU Berlin, and the FHI. We thank the Berlin Cluster of Excellence UniCat for support. We acknowledge support by the German Research Foundation and the Open Access Publication Funds of TU Berlin.

Conflicts of Interest

The authors declare no conflicts of interest. The founding sponsors had no role in the design of the study; in the collection, analyses, or interpretation of data; in the writing of the manuscript, and in the decision to publish the results.

References

  1. Zaera, F. Nanostructured materials for applications in heterogeneous catalysis. Chem. Soc. Rev. 2013, 42, 2746–2762. [Google Scholar] [CrossRef] [PubMed]
  2. Polarz, S.; Smarsly, B. Nanoporous Materials. J. Nanosci. Nanotechnol. 2002, 6, 581–612. [Google Scholar] [CrossRef]
  3. Detavernier, C.; Dendooven, J.; Pulinthanathu Sree, S.; Ludwig, K.F.; Martens, J.A. Tailoring nanoporous materials by atomic layer deposition. Chem. Soc. Rev. 2011, 40, 5242–5253. [Google Scholar] [CrossRef] [PubMed]
  4. Strempel, V.E.; Löffler, D.; Kröhnert, J.; Skorupska, K.; Johnson, B.; Naumann d’Alnoncourt, R.N.; Driess, M.; Rosowski, F. Enhancing of catalytic properties of vanadia via surface doping with phosphorus using atomic layer deposition. J. Vac. Sci. Technol. A Vac. Surf. Films 2016, 34, 01A135. [Google Scholar] [CrossRef]
  5. George, S.M.; Ott, A.W.; Klaus, J.W. Surface Chemistry for Atomic Layer Growth. J. Phys. Chem. 1996, 100, 13121–13131. [Google Scholar] [CrossRef]
  6. Pemble, M.; Povey, I.; Chalvet, F. Developments in the Understanding of ALD Processes and Applications of ALD in Critical Technologies. ECS Trans. 2007, 11, 155–166. [Google Scholar] [CrossRef]
  7. Miikkulainen, V.; Leskelä, M.; Ritala, M.; Puurunen, R.L. Crystallinity of inorganic films grown by atomic layer deposition. J. Appl. Phys. 2013, 113, 2. [Google Scholar] [CrossRef]
  8. Haukka, S.; Lakomaa, E.-L.; Suntola, T. Surface coverage of ALE precursors on oxides. Appl. Surf. Sci. 1994, 82, 548–552. [Google Scholar] [CrossRef]
  9. Zaera, F. Mechanisms of surface reactions in thin solid film chemical deposition processes. Coord. Chem. Rev. 2013, 257, 3177–3191. [Google Scholar] [CrossRef]
  10. van Ommen, J.R.; Valverde, J.M.; Pfeffer, R. Fluidization of nanopowders. J. Nanopart. Res. Interdiscip. Forum Nanoscale Sci. Technol. 2012, 14, 737. [Google Scholar] [CrossRef]
  11. Haukka, S.; Kytökivi, A.; Lakomaa, E.-L.; Lehtovirta, U.; Lindblad, M.; Lujala, V.; Suntola, T. The utilization of saturated gas-solid reactions in the preparation of heterogeneous catalysts. Stud. Surf. Sci. Catal. 1995, 91, 957–966. [Google Scholar] [CrossRef]
  12. Puurunen, R.L. Growth per Cycle in Atomic Layer Deposition. Chem. Vap. Depos. 2003, 9, 327–332. [Google Scholar] [CrossRef]
  13. Puurunen, R.L. Surface chemistry of atomic layer deposition: A case study for the trimethylaluminum/water process. J. Appl. Phys. 2005, 97, 9. [Google Scholar] [CrossRef]
  14. O’Neill, B.J.; Jackson, D.H.K.; Lee, J.; Canlas, C.; Stair, P.C.; Marshall, C.L.; Elam, J.W.; Kuech, T.F.; Dumesic, J.A.; Huber, G.W. Catalyst Design with Atomic Layer Deposition. ACS Catal. 2015, 5, 1804–1825. [Google Scholar] [CrossRef]
  15. Strempel, V.E.; Naumann d’Alnoncourt, R.; Driess, M.; Rosowski, F. Atomic layer deposition on porous powders with in situ gravimetric monitoring in a modular fixed bed reactor setup. Rev. Sci. Instrum. 2017, 88, 074102. [Google Scholar] [CrossRef] [PubMed]
  16. Camacho-Bunquin, J.; Shou, H.; Aich, P.; Beaulieu, D.R.; Klotzsch, H.; Bachman, S.; Marshall, C.L.; Hock, A.; Stair, P. Catalyst synthesis and evaluation using an integrated atomic layer deposition synthesis-catalysis testing tool. Rev. Sci. Instrum. 2015, 86, 084103. [Google Scholar] [CrossRef] [PubMed]
  17. Sneh, O.; Clark-Phelps, R.B.; Londergan, A.R.; Winkler, J.; Seidel, T.E. Thin film atomic layer deposition equipment for semiconductor processing. Thin Solid Films 2002, 402, 248–261. [Google Scholar] [CrossRef]
  18. Rahtu, A.; Alaranta, T.; Ritala, M. In Situ Quartz Crystal Microbalance and Quadrupole Mass Spectrometry Studies of Atomic Layer Deposition of Aluminum Oxide from Trimethylaluminum and Water. Langmuir 2001, 17, 6506–6509. [Google Scholar] [CrossRef]
  19. Jakschik, S.; Schroeder, U.; Hecht, T.; Gutsche, M.; Seidl, H.; Bartha, J.W. Crystallization behavior of thin ALD-Al2O3 films. Thin Solid Films 2003, 425, 216–220. [Google Scholar] [CrossRef]
  20. Barrett, E.P.; Joyner, L.G.; Halenda, P.P. The Determination of Pore Volume and Area Distributions in Porous Substances. I. Computations from Nitrogen Isotherms. J. Am. Chem. Soc. 1951, 73, 373–380. [Google Scholar] [CrossRef]
  21. Mahurin, S.; Bao, L.; Yan, W.; Liang, C.; Dai, S. Atomic layer deposition of TiO2 on mesoporous silica. J. Non-Cryst. Solid 2006, 352, 3280–3284. [Google Scholar] [CrossRef]
  22. Dendooven, J.; Goris, B.; Devloo-Casier, K.; Levrau, E.; Biermans, E.; Baklanov, M.R.; Ludwig, K.F.; van der Voort, P.; Bals, S.; Detavernier, C. Tuning the Pore Size of Ink-Bottle Mesopores by Atomic Layer Deposition. Chem. Mater. 2012, 24, 1992–1994. [Google Scholar] [CrossRef]
  23. Dillon, A.C.; Ott, A.W.; Way, J.D.; George, S.M. Surface chemistry of Al2O3 deposition using Al(CH3)3 and H2O in a binary reaction sequence. Surf. Sci. 1995, 322, 230–242. [Google Scholar] [CrossRef]
  24. Katamreddy, R.; Inman, R.; Jursich, G.; Soulet, A.; Nicholls, A.; Takoudis, C. Post deposition annealing of aluminum oxide deposited by atomic layer deposition using tris(diethylamino)aluminum and water vapor on Si(100). Thin Solid Films 2007, 515, 6931–6937. [Google Scholar] [CrossRef]
  25. Catauro, M.; Bollino, F.; Cattaneo, A.S.; Mustarelli, P. Al2O3 2SiO2 powders synthesized via sol-gel as pure raw material in geopolymer preparation. J. Am. Ceram. Soc. 2017, 100, 1919–1927. [Google Scholar] [CrossRef]
  26. Jakschik, S.; Schroeder, U.; Hecht, T.; Krueger, D.; Dollinger, G.; Bergmaier, A.; Luhmann, C.; Bartha, J.W. Physical characterization of thin ALD-Al2O3 films. Appl. Surf. Sci. 2003, 211, 352–359. [Google Scholar] [CrossRef]
  27. Puurunen, R.L. Correlation between the growth-per-cycle and the surface hydroxyl group concentration in the atomic layer deposition of aluminum oxide from trimethylaluminum and water. Appl. Surf. Sci. 2005, 245, 6–10. [Google Scholar] [CrossRef]
  28. Groner, M.D.; Fabreguette, F.H.; Elam, J.W.; George, S.M. Low-Temperature Al2O3 Atomic Layer Deposition. Chem. Mater. 2004, 16, 639–645. [Google Scholar] [CrossRef]
  29. Ylilammi, M. Monolayer thickness in atomic layer deposition. Thin Solid Films 1996, 279, 124–130. [Google Scholar] [CrossRef]
  30. Grigoras, K.; Sainiemi, L.; Tiilikainen, J.; Säynätjoki, A.; Airaksinen, V.-M.; Franssila, S. Application of ultra-thin aluminum oxide etch mask made by atomic layer deposition technique. Monolayer thickness in atomic layer deposition. J. Phys. Conf. Ser. 561 2007, 61, 369. [Google Scholar] [CrossRef]
  31. Newnham, R.E.; de Haan, Y.M. Refinement of the α-A2O3, Ti2O3, V2O3 and Cr2O3 structures. Z. Kristallogr. 1962, 117, 235–237. [Google Scholar] [CrossRef]
  32. Pezzotti, G.; Zhu, W. Resolving stress tensor components in space from polarized Raman spectra. Phys. Chem. Chem. Phys. PCCP 2015, 17, 2608–2627. [Google Scholar] [CrossRef] [PubMed]
  33. Ott, A.W.; Klaus, J.W.; Johnson, J.M.; George, S.M.; McCarley, K.C.; Way, J.D. Modification of Porous Alumina Membranes Using Al2O3 Atomic Layer Controlled Deposition. Chem. Mater. 1997, 9, 707–714. [Google Scholar] [CrossRef]
Figure 1. Specific surface area (grey, background, right axis), mass uptake in wt % (black, left axis) and uptake Al wt % (red, left axis) for the SiO2 reference and after 1–3 ALD AlOx cycles at 200 °C.
Nanomaterials 08 00365 g001
Figure 2. N2 adsorption (hollow symbols, dotted line) and desorption (full symbols, solid line) isotherms for SiO2 coated with AlOx via ALD using TMA and H2O at 200 °C. Shown are the reference SiO2 (black, ■), after one cycle (blue, ▼), after two cycles (grey, ●), and after three cycles (red, ▲).
Nanomaterials 08 00365 g002
Figure 3. Differential pore volume distribution determined by N2 desorption, calculated applying BJH theory for SiO2 coated with AlOx via ALD using TMA and H2O at 200 °C. Shown are the graphs for reference SiO2 (black, ■), after 1 cycle (blue, ▼), after 2 cycles (grey, ●), and after 3 cycles (red, ▲).
Nanomaterials 08 00365 g003
Figure 4. HRTEM images of (a) SiO2 reference, (b,c) after 1 and 3 ALD cycles with TMA and H2O at 200 °C.
Nanomaterials 08 00365 g004
Figure 5. Absolute ATR-FTIR spectra of the SiO2 reference (black) and the AlOx deposited samples after 1 cycle (blue), 2 cycles (grey), and three cycles (red) at 200 °C using TMA and H2O. Atmospheric background is subtracted.
Nanomaterials 08 00365 g005
Figure 6. Mass gain over cycle number for AlOx coating on SiO2 at different temperatures: 200 °C (black, ●), 120 °C (red, ▲), and 75 °C (grey, ■).
Nanomaterials 08 00365 g006
Figure 7. Specific surface area (grey, background, right axis), mass gain in wt % (black, left axis) and Al wt % (red, left axis) for different substrate temperatures after three cycles.
Nanomaterials 08 00365 g007
Figure 8. XRD pattern of the reference SiO2 and the AlOx coated samples synthesized at different substrate temperatures after three cycles.
Nanomaterials 08 00365 g008
Table 1. Sample family of SiO2 powder coated samples with AlOx using TMA and H2O.
DescriptionNumber of CyclesReactor Temperature/°CMass Uptake + − Cycle 1/%Mass Uptake + − Cycle 2/%Mass Uptake + − Cycle 3/%Mass Uptake + − Total/%Specific Surface Area/m2 g−1Al Content/wt %Al Uptake +/wt %C Content/wt %C Uptake +/wt %
SiO2 reference------5060.00.00.000.00
200.1c120012.5--12.54358.08.71.521.55
200.2c220013.411.6-24.038313.715.91.591.62
200.3c320011.911.413.436.633718.422.61.331.35
120.3c312015.214.215.244.626317.821.62.432.50
75.3c37516.116.918.451.424817.621.32.662.74
+ Mass uptake, Al and uptakes are given as the percent uptake compared to the original substrate.
Table 2. Scale-up samples of SiO2 powder coated samples after 3 cycles at 200 °C using TMA and H2O.
DescriptionSpecific Surface Area m2 g−1Al Content wt %C Content wt %
200.3c33718.41.33
FB.top31116.80.02
FB.middle31117.20.00
FB.bottom30515.80.00

