The Effect of Light Intensity, Temperature, and Oxygen Pressure on the Photo-Oxidation Rate of Bare PbS Quantum Dots


1
School of Physical Science and Technology, ShanghaiTech University, 393 Middle Huaxia Road, Shanghai 201210, China
2
Shanghai Institute of Ceramics, Chinese Academy of Sciences, Shanghai 200050, China
3
University of Chinese Academy of Sciences, Beijing 100049, China
4
Department of Applied Physical Sciences, University of North Carolina at Chapel Hill, Chapel Hill, NC 27599, USA
*
Author to whom correspondence should be addressed.
Nanomaterials 2018, 8(5), 341; https://doi.org/10.3390/nano8050341
Submission received: 17 April 2018
/
Revised: 11 May 2018
/
Accepted: 14 May 2018
/
Published: 18 May 2018
(This article belongs to the Special Issue Nanomaterials for Renewable and Sustainable Energy)
Abstract
:The oxidation speed of PbS quantum dots has been a subject of controversy for some time. In this study, we reveal the precise functional form of the oxidation rate constant for bare quantum dots through analysis of their photoluminescence as a function of temperature, oxygen pressure, and excitation-laser intensity. The combined effect of these factors results in a reduced energy barrier that allows the oxidation to proceed at a high rate. Each absorbed photon is found to have a 10−8 probability of oxidizing a PbS atomic pair. This highlights the importance of photo-excitation on the speed of the oxidation process, even at low illumination conditions. The procedure used here may set up a quantitative standard useful for characterizing the stability of quantum dots coated with ligands/linkers, and to compare different protection schemes in a fair quantitative way.
1. Introduction
Lead sulfide (PbS) quantum dots (QDs) continue to be a material of large scientific and technological interest due their size-dependent optical properties. Above all, PbS QDs present a remarkably tunable optical absorption and luminescence from the visible to the near-infrared range. This particular optical property, coupled with its charge transport characteristics, have led to PbS QDs being considered and already advantageously exploited in many electro-photonic applications, including filed-effect transistors (FETs) [1,2,3], solar cells [4,5,6], and photo detectors [7]. QDs often present unsatisfied dangling bonds at the surface, which give rise to surface defect states in the bandgap. Despite the progress achieved by colloidal synthesis and the molecular surface passivation of those defects, one of the major obstacles that limits the scope of QD applications is the nature and kinetics of environmentally induced QDs chemical instabilities, because these usually lead to deleterious QD compositional changes and degradation of the material’s performance [8].
Several researchers have previously investigated the stability of PbS QDs [9,10]. Most of these inquiries have noted the existence of thermal [11,12] and photo-induced paths for oxidation and degradation [8]. However, in the vast majority of these studies, the physical and chemical changes to the chalcogenide surface are convoluted with the degradation or alterations in the capping or linking ligands, which mask the evolution of the PbS itself under the environmental variables of interest (light, gas and temperature). This is fair in some instances, as for many applications, those molecules are an integral part of the device operation. However, in no few cases, the environmental evolution of the QDs becomes intricately more complex, making it extremely hard to arrive at precise descriptions of the physical-chemical processes. For instance, Peterson et al. [13] found that the photo-oxidation rate of PbS quantum dots was size dependent; this is a very interesting result, but the QDs studied were oleic acid coated and embedded within a polymer, which made the gas-QD surface interaction hard to describe in a quantitative way. When Zhang et al. [14] observed photo-induced luminescence (PL) enhancement in similarly-prepared oleic acid coated PbS QDs in solution, they determined that the light activation was dependent on the solution concentration. However the QD’s surface change or its kinetics induced by the light could not be precisely quantified since the light intensity on the QDs varied with penetration depth and the solution was bound to present convection. Beyond lacking quantitative assessment, Turyanska et al. [15] studied the temperature dependence of the near-infrared PL emission from thiol-capped PbS QDs; finding that such PbS QDs showed no time-dependent change. In contrast, Ihly et al. [11] showed that ethanedithiol-treated PbS QDs in films will oxidize, ripen, and even sinter. Because most of these discrepancies could be traced to non-trivial differences in testing conditions and QDs cappings, to have a clear relationship between light, gas pressure, temperature, and the rate of change at the surface of PbS quantum dots, we propose it is necessary to test the evolution under those environmental variables in non-aggregated ligand-free PbS QDs, with the goal of arriving to precise quantitative reaction rates. The quantitative knowledge from this condition will help to establish a reliable basis upon which to compare all other modified QDs. In this work, we report on the quantitative relationship between the above-mentioned variables and the oxidation of bare PbS QDs directly fabricated by pulsed laser deposition. We found that under relatively intense illumination with photon energy larger than the bandgap, the kinetics of the oxidation process can be fitted to a minimal physical kinetic model to obtain a precise relationship between the environmental conditions and the oxidation rate constant of the process. In particular, we note that when subjected to illumination, the rate of the oxidation was boosted to a linear relationship with light intensity and O2 pressure. Furthermore, under illumination, the temperature of the environment was also played a significant role, with an apparent activation energy barrier of only 0.19 eV. These findings, obtained from easy-to-follow changes in the PL emission under controlled conditions, are significant because they highlight the key role that photo-excitation performs in the material transformation process and the substitutive roles that O2, light intensity, and temperature can play in the oxidation of PbS QDs.
2. Materials and Methods
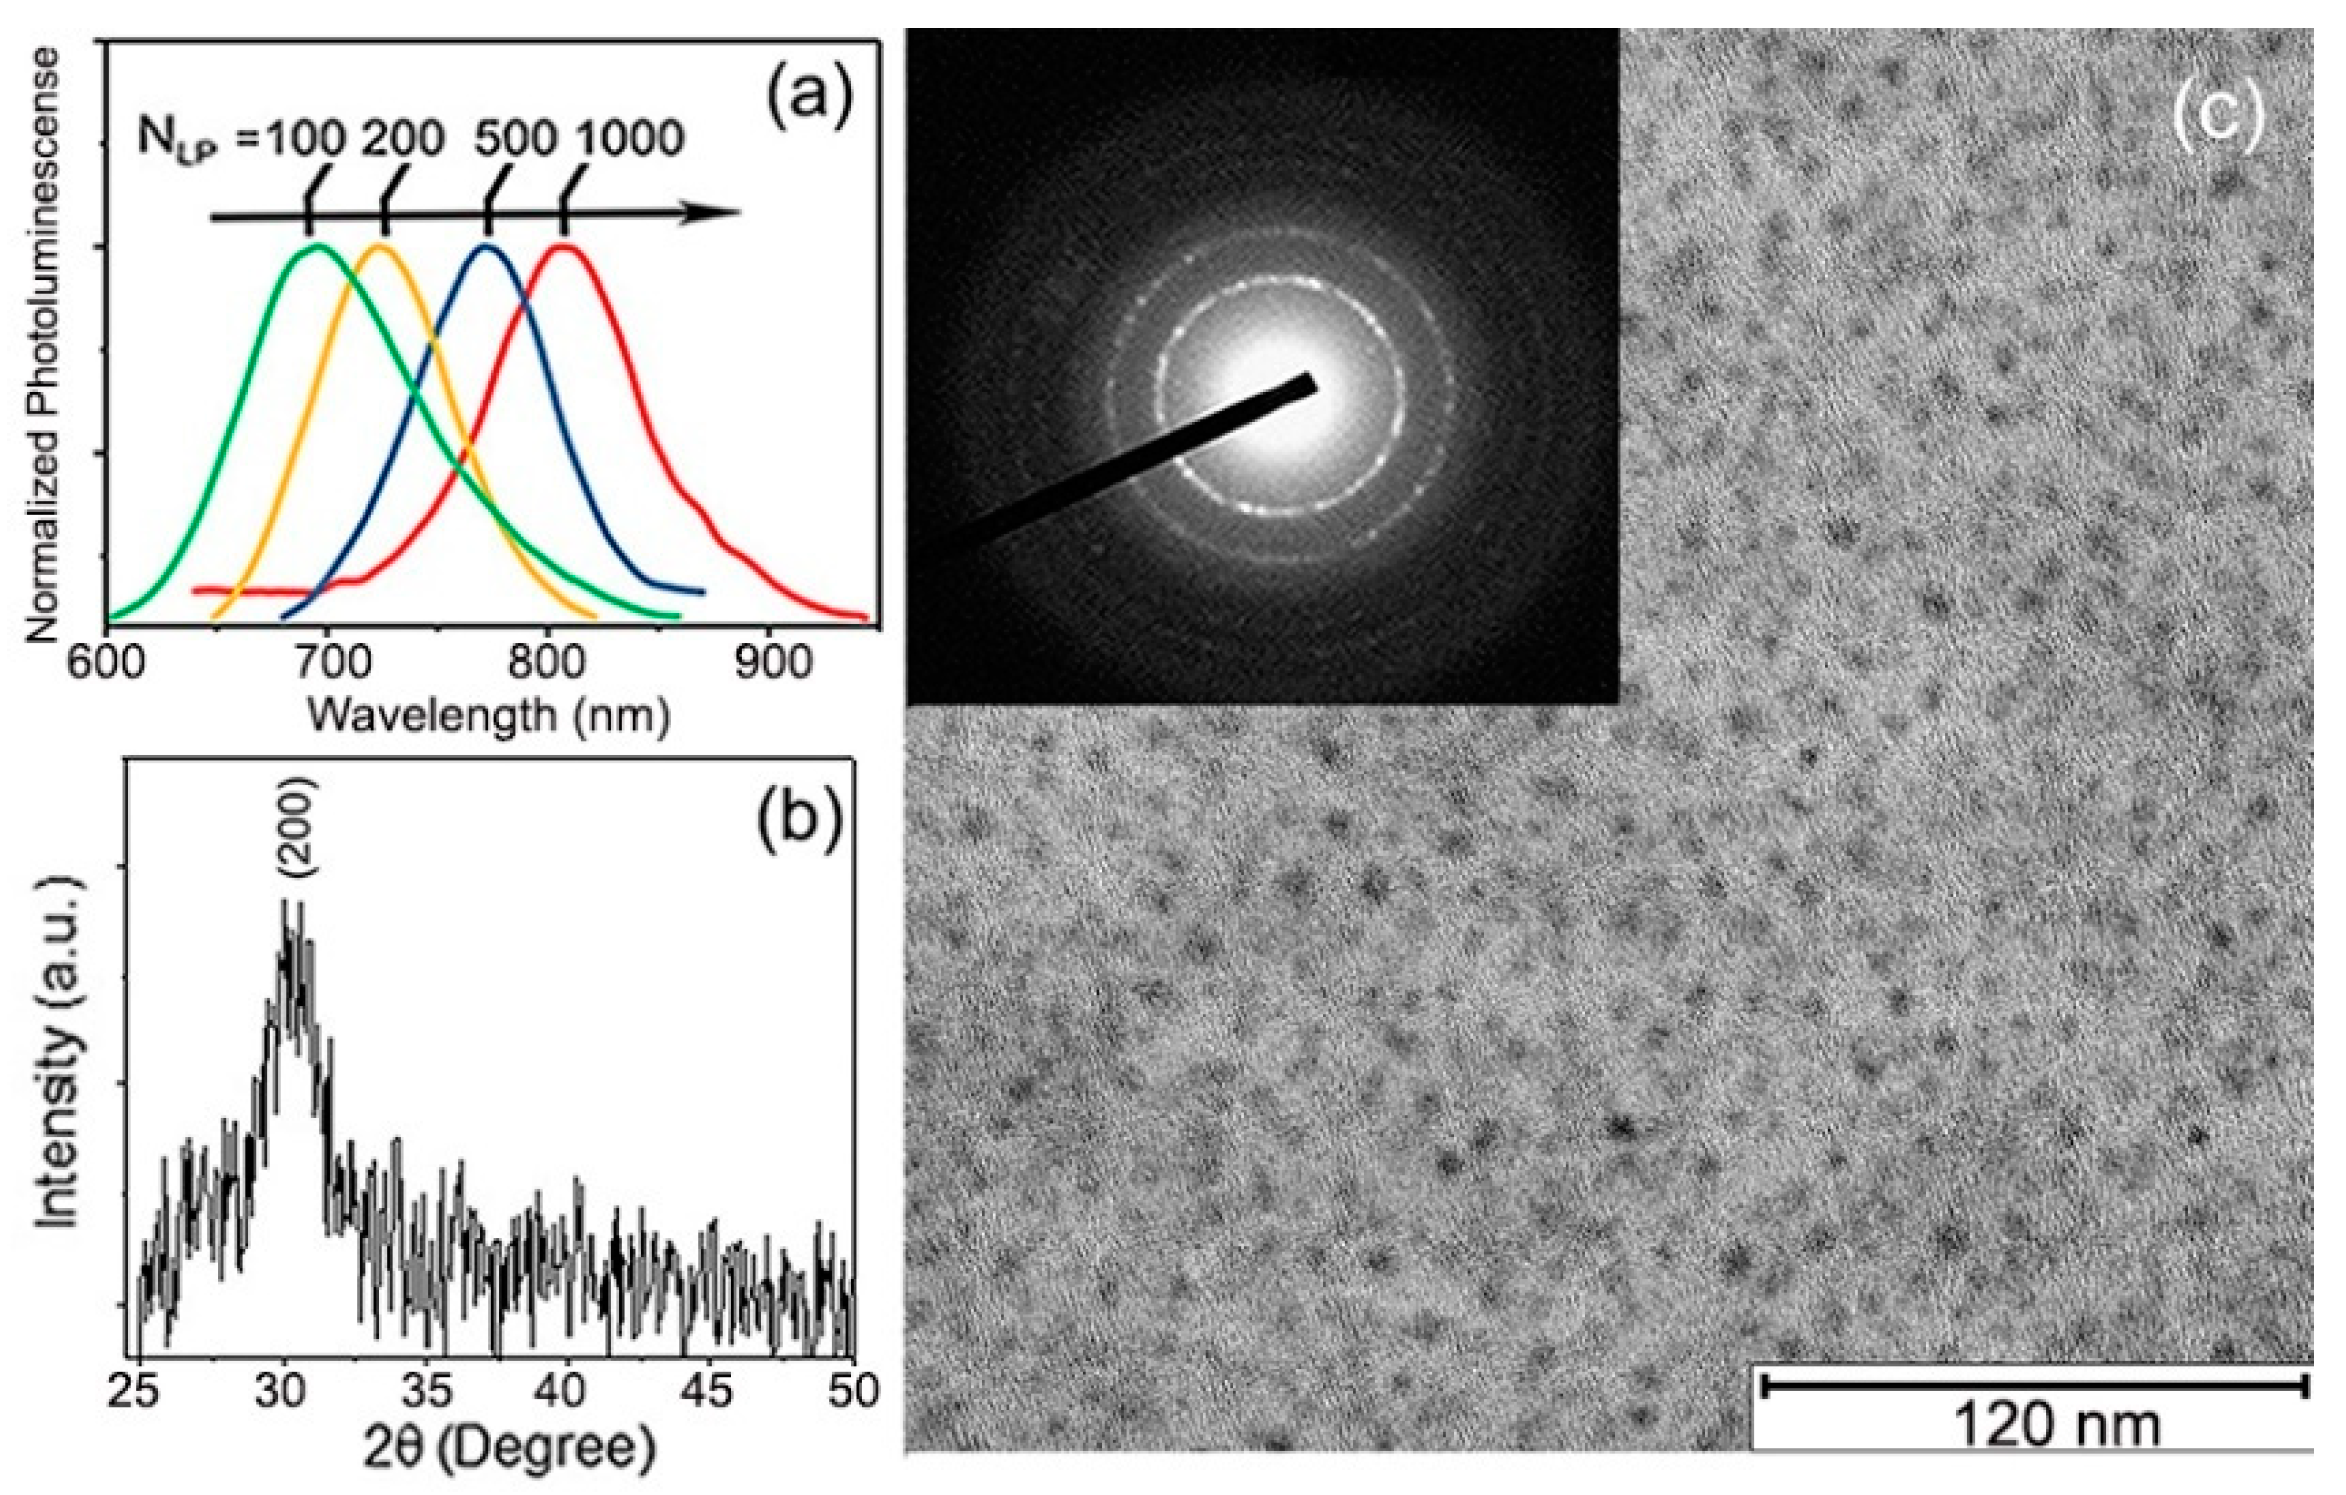
Ligand-free PbS QDs were fabricated using pulsed laser deposition [16] (PLD) by ablation of a pressed PbS powder target using a KrF excimer laser (λ = 248 nm; repetition rate = 10 Hz, fluence = 5 J/cm2) under 500 mTorr of Helium (99.999% pure) background gas pressure that filled the chamber, which, prior to the experiment, was evacuated to . The PbS QDs growth was performed at room temperature onto fuse silica, SiO2/Si substrates, and transmission electron microscopy (TEM) carbon grids simultaneously and placed on a rotating holder parallel to, and 10 cm away, from the target. Although the method allowed for simple QDs size, controlled via the number of laser shots (NLP) (Figure 1a), we selected the samples made with NLP = 500 shots to be the focus of this study to maintain a constant QD size. The QDs obtained under such conditions were ~2.5 nm in average diameter and ±1 nm enclosed the sample size dispersion. Figure 1b shows the X-ray diffraction pattern (XRD) obtained using a Bruker D8 Discover diffractometer (using Cu-Kα radiation) for samples deposited on the fuse silica substrates. With less than one monolayer of QDs, only one X-ray peak is easily distinguishable over the background. The position of this peak perfectly matched the (002) planes of cubic of PbS [17] (PDF card No. 05-0592). Figure 1c shows the TEM micrograph of these QDs, obtained using a JEOL 2100-plus microscope operated at 200 kV. The inset in Figure 1c displays the electron diffraction pattern for this sample, highlighting the crystallinity and random orientation of the QDs. The first few diffraction rings that could be distinguished with clarity corresponded to the (200), (220), and (222) crystal planes of PbS [18].
For this study, the primary tool used to track the evolution of the QDs was their PL. PL measurements were carried out by exciting the sample using 532 nm wavelength emissions from a continuous wave laser. Photoluminescence spectra were recorded by a thermoelectrically-cooled CCD camera. The system is integrated in a confocal microscope using a 50× microscope objective. However, important for our study, the laser instead of having a diffraction limited size was defocused so that the beam spot was at the sample and reached approximately 1.75 µm in radius. Thus, the area from which PL was detected by the collection photonic fiber (3 micrometer cores) was only the ~5% central top of the gaussian beam. This was done to secure a uniform intensity excitation over all the QDs under observation simultaneously. PL from QDs in the skirts of the gaussian beam excitation were not able to enter the microscope collection fiber.
3. Results
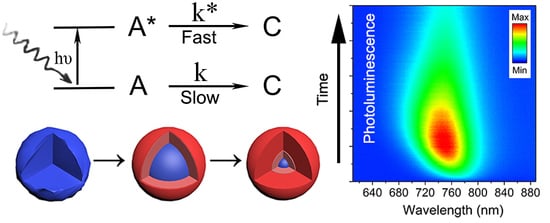
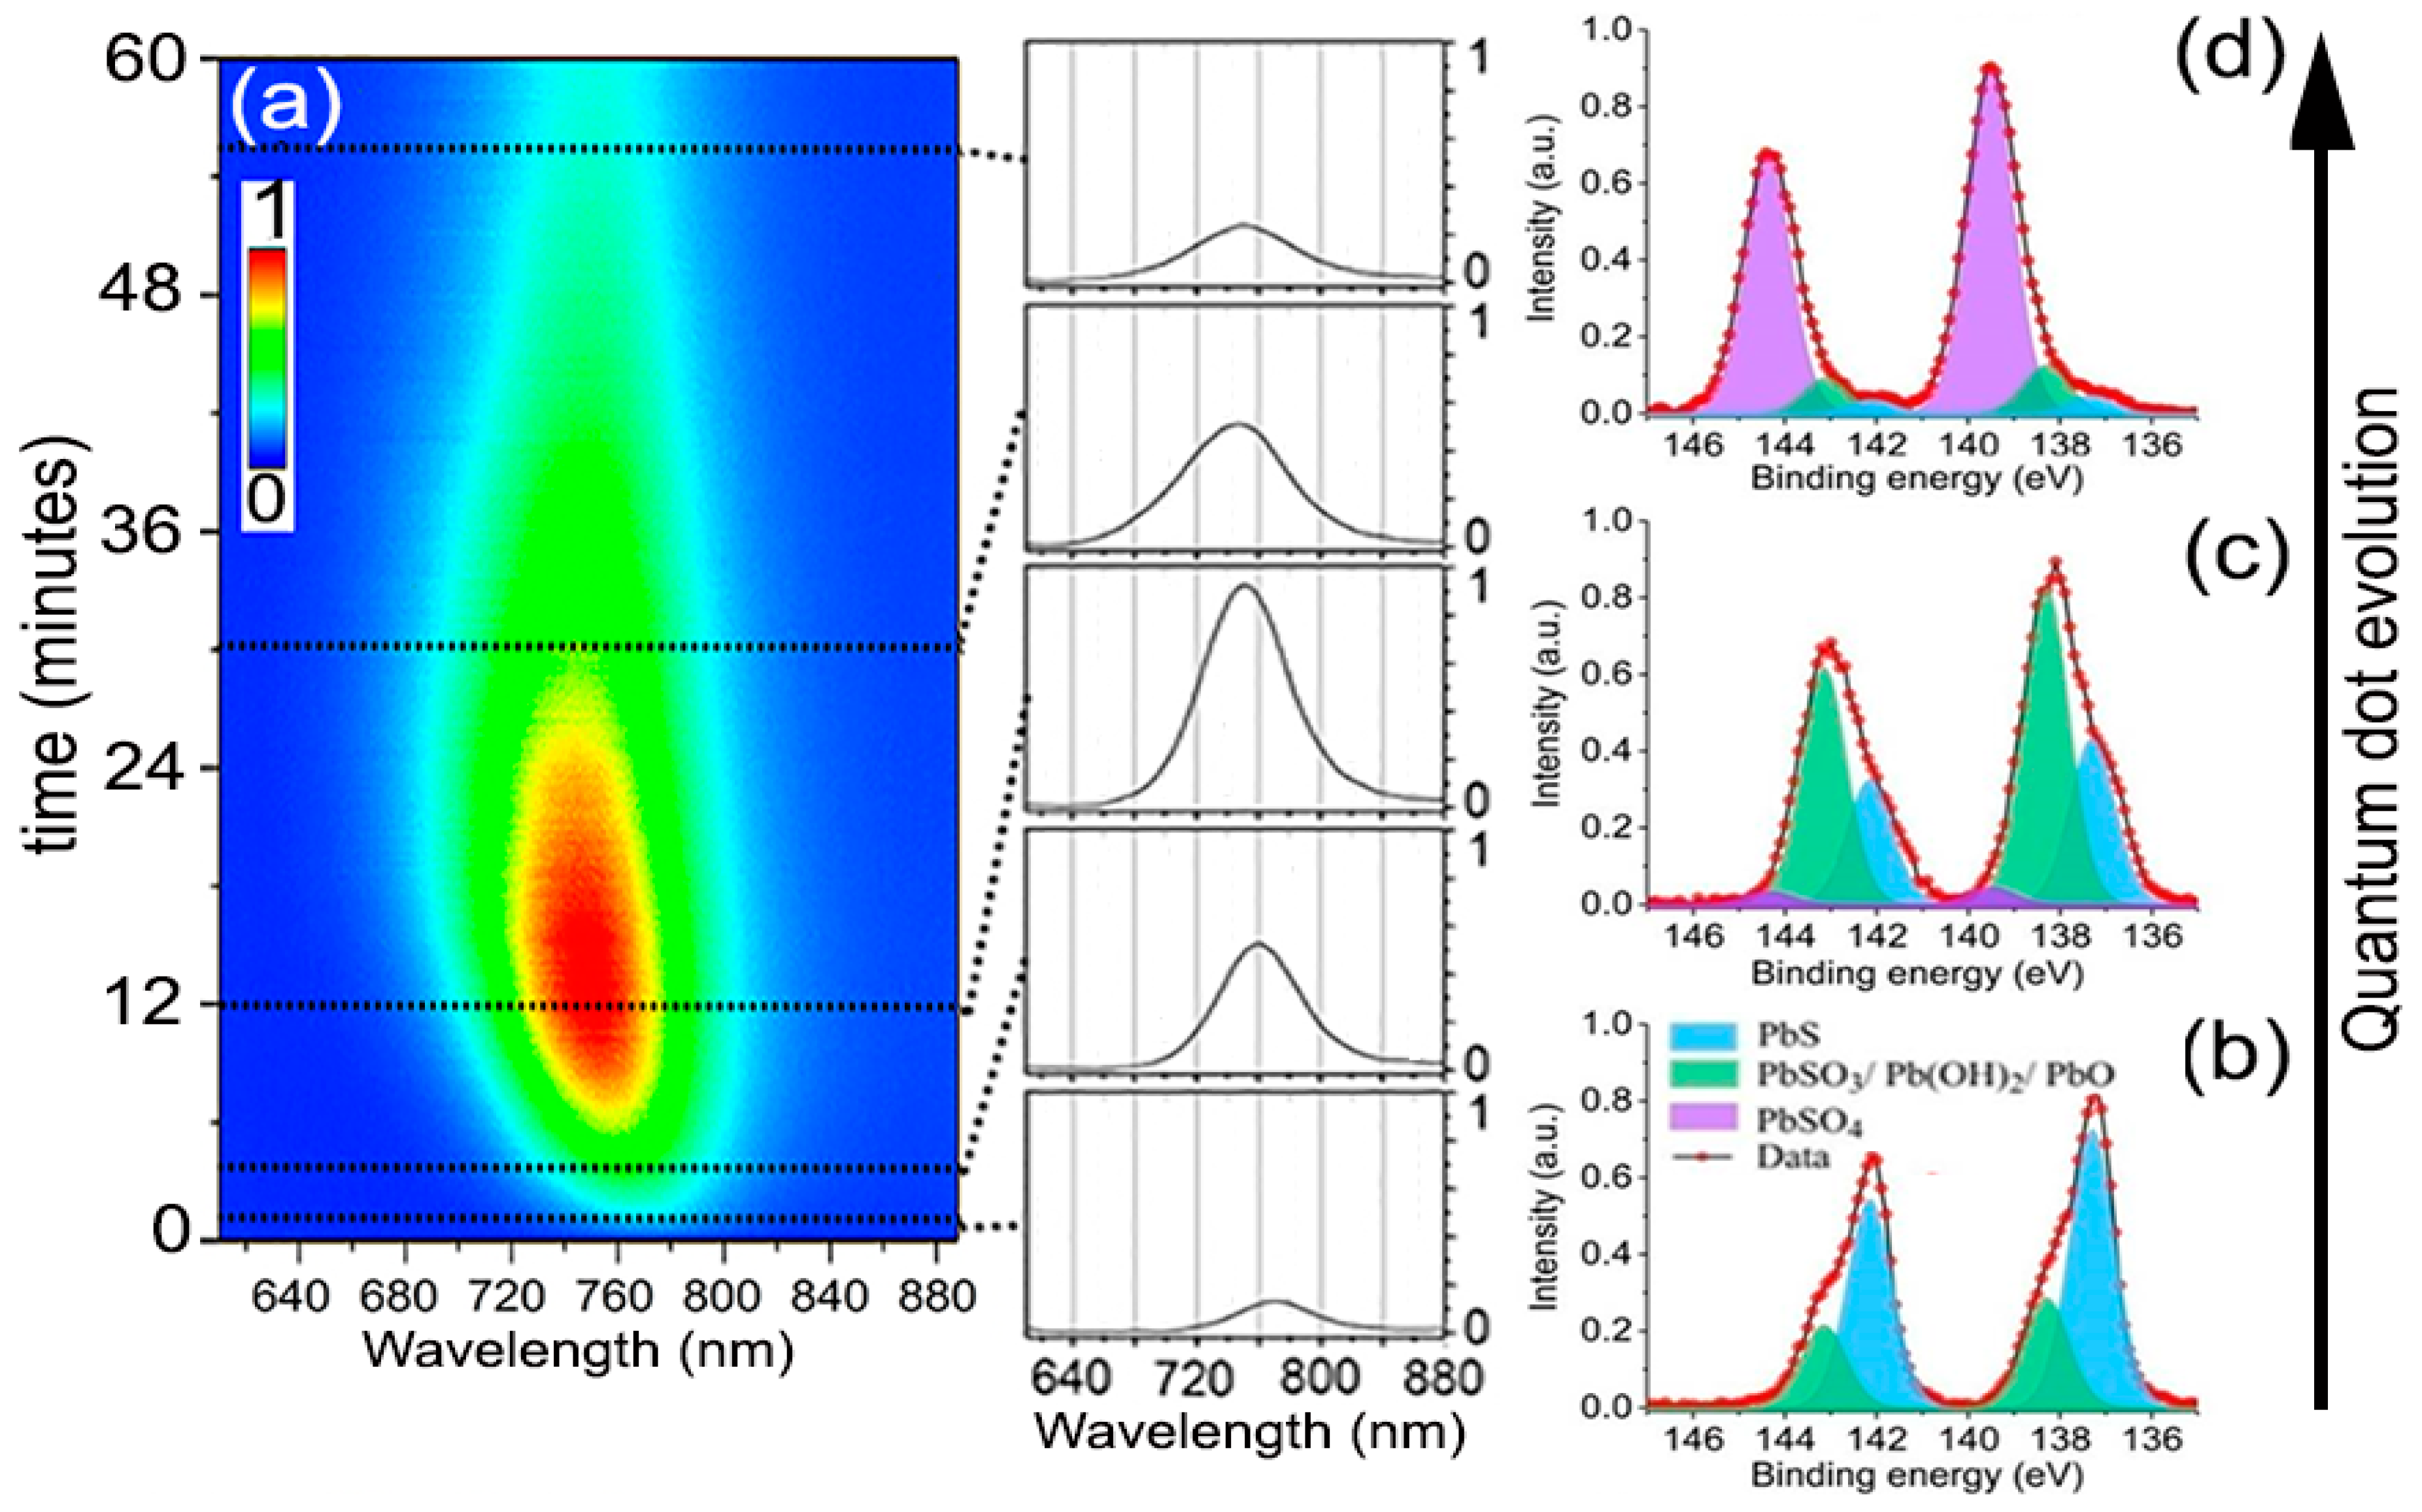
Figure 2 shows the typical PL time evolution for all the experiments performed to analyze the oxidation kinetics of the QDs. The PL always started relatively weak with an emission peak centered at 765 nm wavelength. With time, the PL intensity increased progressively to eventually reach a maximum, for which the magnitude and time stability depended on the specific environmental variables and excitation intensity. Simultaneously, the PL peak could be observed shifting toward shorter wavelengths. After some additional time, lasting from a few seconds to several hours, still under continuous laser excitation, the intensity of the PL signal started to decrease toward low emission yields. Samples on SiO2 and SiO2/Si substrates behaved identically, ruling out possible significant heating effects from laser during this evolution. This process closely resembles the phenomenon of photoactivation extensively documented in CdSe nanocrystals [19,20,21]. Assuming our observations are fully analogous, the oxidation thus should follow a progressive reaction from the surface to the core, giving an initial PL enhancement through early surface oxide passivation, which continues deepening until the core of the QD is transformed. The chemical products of prolonged atmospheric oxidation of PbS QDs, albeit coated with molecular linkers, have been examined by several researchers [10,22,23]. Examination of the laser-irradiated spots (from beginning to end of their PL evolution) by fitting of the Pb 4f7/2 level obtained from X-ray photoelectron spectroscopy (XPS) shows that the chemical state of the Pb atoms can be deconvoluted into three major contributions (Figure 2b–d) of which relative weights vary with time. For the QDs freshly deposited and exposed to air but without any laser-irradiation, the XPS spectrum showed that, besides the 137 eV feature due to PbS, there was already a small but not negligible signal at 138.3 eV due to the initial formation of possible intermediate oxidation products [22,24], Pb(OH)2, PbO, and/or PbSO3. These products cannot be independently quantified here, although other researchers advocate that PbSO3 makes up the majority of the intermediates [10]. Inspection of areas where the experiment was stopped at the time of maximum PL intensity showed that the transformation of the PbS into the intermediate oxidation products had taken a significant fraction of the QDs’ mass (~60%), presumably just the most external atoms, reducing the QDs effective size to ~1.8 nm. Albeit a small fraction, this stage also seemed to correspond with the appearance of PbSO4, which marks the beginning of the PL decline. After a longer period under light exposure, when the PL decreased to a small fraction from its peak value, the Pb 4f7/2 peak shifted almost completely to 140.0 eV, indicating the bulk of each nanocrystal had been transformed into PbSO4 [24].
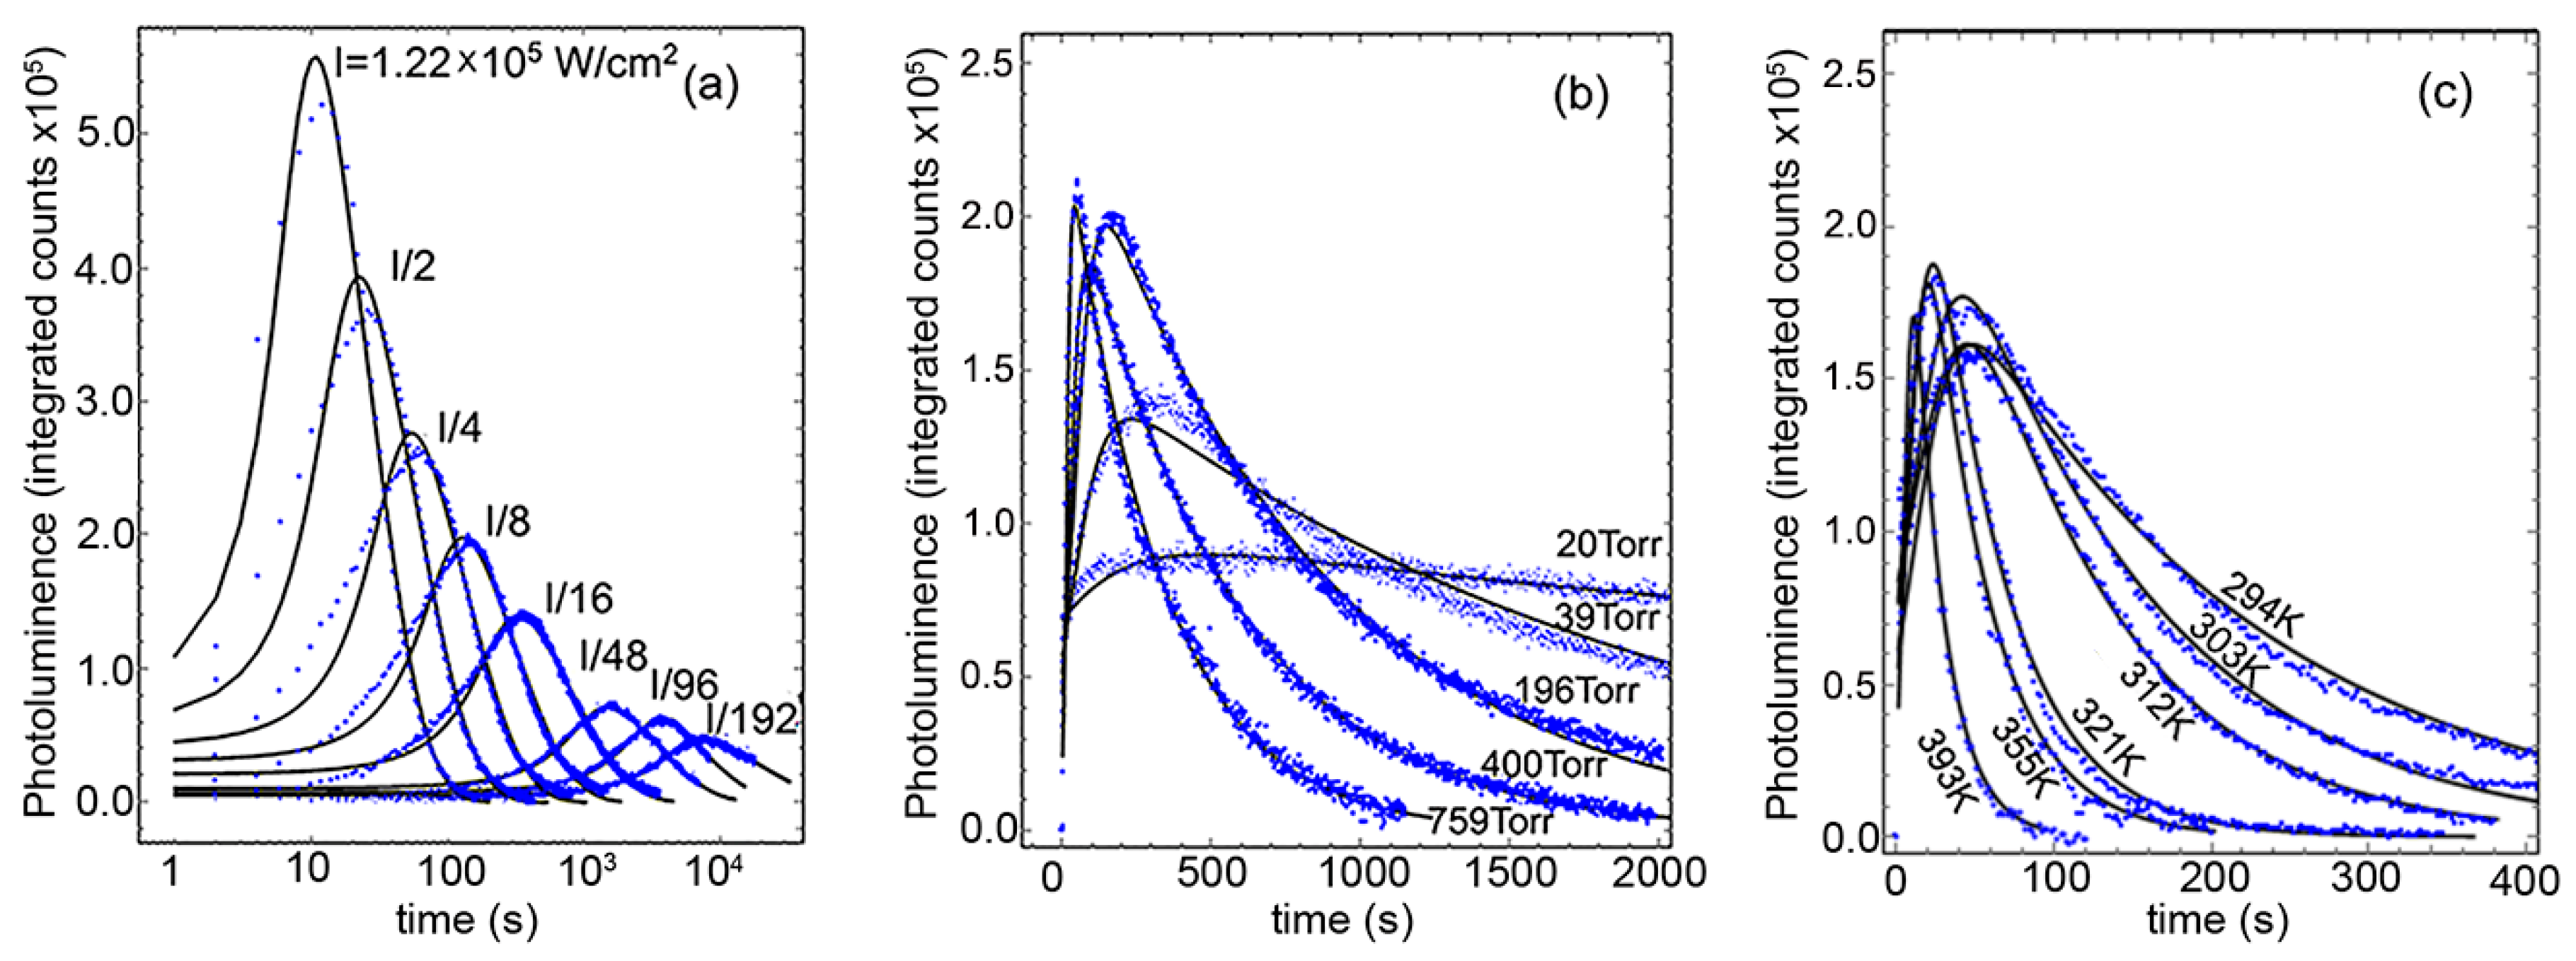
Figure 3 shows the all-wavelength-integrated PL as a function of time under the influence of the three environmental variables under consideration: Light intensity, O2 pressure, and temperature. As observed, the three variables had a direct effect on the rise and subsequent decrease of the total integrated PL counts, but its characteristic times and maxima require a detailed analysis to quantitatively obtain the overall kinetic properties of the oxidation process. To determine the specific mathematical form of the oxidation rate, we employ a simple phenomenological model of the PL under the oxidation process [25]. Here we suppose that in each QD and at all times, there exist NT constant pairs of PbS atoms that, under the oxidation process and illumination, can be found oxidized to some extent (NC), prepared to absorb a photon (NA), or already responsible for one exciton (NA*), such that NT = NA + NA* + NC. We do not specify each PbS pair location inside of the QD as it is assumed that the oxidation proceeds from the outside toward the center, that is, the Nc pairs make a growing outer shell at the expense of the decreasing NA + NA*. Over time, the rate of change of each quantity should follow the following rate equations:
where in α = σI/hν, σ represents the light absorption cross-sectional area per PbS pair, I is the intensity of the incident light, and hν is the photon energy. k and k* are the rate constants for the reaction under dark and light, respectively; and is the lifetime of the exciton allowing for non-radiative (NR) and radiative (R) paths to ground state decay. The first term in Equations (1) and (2) represents the absorption and stimulated emission, and the second term corresponds to the spontaneous emission. The third term in both Equations (1) and (2) represents the oxidation processes that result in an increase of the number of the oxidized pairs (NC), as is correspondingly shown in Equation (3).
As the early oxidation of the surface has a PL-enhancing effect, we can expect that the initial oxidation lengthens the to favor the radiative path of decay. Phenomenologically, we propose the non-radiative life time be inversely related to the number of non-oxidized PbS pairs as , where is an exponent to be determined from the experiment. Because the radiative PL lifetime of PbS QDs has been measured by others and found to be ~1 µs [26], the reaction under light we measured in our experiments happens over ~1–1000 s, and the reaction under dark requires > 1 month [11], to explicitly solve the system of equations we adopted the following approximation ~ 0. In this regime, the photon-mediated process is the only path for oxidation and the huge difference between permit us to solve Equations (1) and (2), simultaneously, in a closed form to obtain quasi-static values for NA and NA*. The values of NA and NA* will then slowly decrease under the rate defined in Equation (3) (detailed solution steps can be found in the Supplementary Information). Since PL ~ , this results in a rather simple explicit expression as the PL integrated counts as a function of time:
with , , and the effective reaction rate . The model assumes all QDs are behaving similarly and does not include explicitly diffusion or any atomic-detail steps that must occur during the oxidation. As detailed work on metal nanoparticle oxidation has demonstrated [27], the complexity of a more detailed theory involves so large a number of parameters, such as a variety of activation energies, preexponential factors of individual oxidation stages, and ion and electron diffusion coefficients, that from the standpoint of the experimental observation, only their collective behavior could be probed. The simple model we employ (Equation (4)) contains just five parameters for determination, namely , with the rest derived from their relationships or fixed from the materials properties or experimental conditions (see the Supplementary Information). Of those five parameters, M is practically arbitrary and has no real importance, as it stands for the number of QDs in the examined area and the efficiency of the whole microscope optical train and detector setup. The remaining four are all physically meaningful, and although they all could in principle depend on the environmental variables, we can expect their sensitivity to them be quite low. , strictly speaking, should be a function of the oxidation, varying as the non-radiative recombination path is changing relevance. By this physical connection, all the environmental variables could affect , but in the approximation taken to solve for the quasi-static value of NA*, it is left to be a constant value, thus it represents an effective exciton lifetime, moving from non-radiative to radiative, over the whole QD oxidation process. The solid line in Figure 4a shows the fit of the A parameter from Equation (4), the amplitude coefficient of the PL counts. Following its functional form , we expect it to be strongly dependent on the light intensity alone. This allows the simultaneous determination of counts, and . Although the model is fairly simple, results in the expected range between the best radiative life times reported and non-radiative values that would prevent PL emission.
Parameters work together to determine the onset behavior of the PL intensity increase. For all the samples and conditions explored, their fitting showed weak dependencies on the environmental variables (verified in the Supplementary Information). This perhaps means that all initial surface atom changes are all similarly fast, leaving the effective rate constant B to carry the weight of the environmental variables’ functionality. Figure 4c,d presents the functional fits of parameter B against laser power, O2 pressure, and temperature. Their functional form was not assumed before the fitting procedure, but as it can be seen, B presents a good simple linear dependence with the light intensity and the oxygen pressure, and an expected Arrhenius behavior with the absolute temperature. The collective information from those fits can be summarized in the following succinct expression, , where is the laser intensity in W/cm2, is the oxygen pressure in atmospheres (during the PL experiment, sample chamber was evacuated to 10−5 torr prior to filling with oxygen 99.999% pure), = 0.19 eV is the apparent energy barrier, is the Boltzman constant, T is the temperature, and is the proportionality constant. To put in context how much lower the oxidation barrier appears under illumination, the free energy of reaction for formation of PbSO4 from PbS and O2 is reported to be −718 kJ/mol (−7.45 eV/PbS pair) [10]. Thus, illumination allows the oxidation to proceed at much higher rate.
4. Discussion
The effect of the light intensity on B has an interesting consequence, under 1 sun intensity ~0.1 W/cm2 for example, the process results in an effective rate of only , a significantly low value that, after early surface passivation, might give the appearance of very constant PL. This is in line with our experience and that from other researchers [11] whose QDs perform well even months after fabrication when stored in the laboratory air and exposed to ambient light. However, note this does not translate directly into the same behavior for the actual rate constant, which the model requires to be (expression obtained from combining the above phenomenological expression for B and the model-required relationship with This expression approaches a non-zero constant at low light intensities, which at 1 atmosphere and room temperature would be a significantly faster rate than B. At low light intensities, the difference is the existence of an factor in , the number of absorbed photons during one relaxation time. The implication of this difference is that the effective rate decreases as light intensity goes down, mostly because the number of attempts made by photons to oxidize the QD is low, but the reaction rate of those few absorbed photons remains relatively high. If, at best, the radiative life time is ~1 µs, then the oxidation reaction probability of an absorbed photon will be ~. Therefore coupled with a large photon flux can bring oxidation very rapidly.
It is also worth remarking that low oxygen content effectively arrests the oxidation without need to reach extremely low pressures. At 20 mTorr we noticed the PL was activated and remained close-to-stable for many hours without significant change. However, crucially, at higher vacuum levels <10 mTorr, the PL yield did not increase at all, marking the environment quality required for a maximum oxygen concentration to protect QDs from oxidation under light utilization. Regarding the influence of temperature on the oxidation process, we can see that moderate above-room-temperature conditions readily enhanced the oxidation process. Due to some limitations in our microscope setup, we did not test low temperature evolution; however, given the functional form that fits our temperature data in the near-above-room-temperature range, only very low temperatures are likely to significantly slow down the oxidation process. On the contrary, under no-illumination conditions and full 1 atmosphere O2 pressure, the same temperature range probed in our experiment had not affected the QDs in any observable way, because after cooling the samples that experienced the thermal treatment under dark, showed PL behavior identical to samples that did not experience this treatment. Another observation we wish to mention is that performing the oxygen concentration experiments with “wet” oxygen (passing the gas through water before filling the chamber) did not change the kinetics at all, which does not support the conjecture that the presence of some water might aid the oxidation process significantly, in contrast to literature examples of QDs in solution where water is attributed an important role in the photo-oxidation [8].
5. Conclusions
The true rate constant for the oxidation of bare PbS QDs was determined through the fit of the PL integrated counts as function of temperature, oxygen pressure, and laser intensity, which highlighted their combined effect on the number photo-excited excitons and their reduced barrier to allow for the oxidation process. Although the oxidation steps and intermediate compounds are complicated, our experiment and model results seem to indicate that the overall oxidation reaction is first order with the oxygen pressure and the light intensity. Thus, even though the k* is very large, the effective oxidation rate is dominated by the oxygen and photon availability. This work may help in setting a quantitative reference upon which characterize the stability of QDs in general, and specifically to encourage the study of the stability of those coated with ligands/linkers in a quantitatively precise and thus comparatively fair way. Identifying whether the source of protection against oxidation might come from blocking the photo-oxidation path, or by simply limiting the oxygen availability, might be important distinction in the design of increasingly more robust PbS QDs stabilization layers. With this distinction in mind, the precise effect of the relevant environmental variables on the changes of more complex QDs systems coated with other participating molecules could be assessed.
Supplementary Materials
The following are available online at https://www.mdpi.com/2079-4991/8/5/341/s1.
Author Contributions
The manuscript was written through contributions of all authors. All authors have given approval to the final version of the manuscript.
Funding
This research was carried out with the financial support of Shanghaitech University. This research received no external funding.
Acknowledgments
The authors also thank Shanghaitech Analytical and Nanofabrication Laboratory personnel for their help in the fabrication and characterization of the materials presented here. The authors in particular thank Tu Sun for his help with the TEM data acquisition.
Conflicts of Interest
The authors declare no conflicts of interest.
References
- Konstantatos, G.; Badioli, M.; Gaudreau, L.; Osmond, J.; Bernechea, M.; De Arquer, F.P.G.; Gatti, F.; Koppens, F.H.L. Hybrid Graphene-quantum Dot Phototransistors with Ultrahigh Gain. Nat. Nanotechnol. 2012, 7, 363–368. [Google Scholar] [CrossRef] [PubMed]
- Hetsch, F.; Zhao, N.; Kershaw, S.V.; Rogach, A.L. Quantum Dot Field Effect Transistors. Mater. Today 2013, 16, 312–325. [Google Scholar] [CrossRef]
- Zhang, Y.; Chen, Q.; Alivisatos, A.P.; Salmeron, M. Dynamic Charge Carrier Trapping in Quantum Dot Field Effect Transistors. Nano Lett. 2015, 15, 4647–4663. [Google Scholar] [CrossRef] [PubMed]
- Chuang, C.-H.M.; Maurano, A.; Brandt, R.E.; Hwang, G.W.; Jean, J.; Buonassisi, T.; Bulović, V.; Bawendi, M.G. Open-Circuit Voltage Deficit, Radiative Sub-Bandgap States, and Prospects in Quantum Dot Solar Cells. Nano Lett. 2015, 15, 3286–3294. [Google Scholar] [CrossRef] [PubMed]
- Wang, R.; Wu, X.; Xu, K.; Zhou, W.; Shang, Y.; Tang, H.; Chen, H.; Ning, Z. Highly Efficient Inverted Structural Quantum Dot Solar Cells. Adv. Mater. 2018, 30. [Google Scholar] [CrossRef] [PubMed]
- Ka, I.; Gonfa, B.; Le Borgne, V.; Ma, D.; El Khakani, M.A. Solar Cells: Pulsed Laser Ablation Based Synthesis of PbS-Quantum Dots-Decorated One-Dimensional Nanostructures and Their Direct Integration into Highly Efficient Nanohybrid Heterojunction-Based Solar Cells. Adv. Funct. Mater. 2014, 24, 4018. [Google Scholar] [CrossRef]
- Sun, Z.; Liu, Z.; Li, J.; Tai, G.A.; Lau, S.P.; Yan, F. Infrared Photodetectors Based on CVD-Grown Graphene and PbS Quantum Dots with Ultrahigh Responsivity. Adv. Mater. 2012, 24, 5878–5883. [Google Scholar] [CrossRef] [PubMed]
- Carrillo-Carrión, C.; Cárdenas, S.; Simonet, B.M.; Valcárcel, M. Quantum Dots Luminescence Enhancement due to Illumination with UV/Vis Light. Chem. Commun. 2009, 35, 5214–5226. [Google Scholar] [CrossRef] [PubMed]
- Chuang, C.M.; Brown, P.R.; Bulović, V.; Bawendi, M.G. Improved performance and stability in quantum dot solar cells through band alignment engineering. Nat. Mater. 2014, 13, 796–801. [Google Scholar]
- Clark, P.C.J.; Radtke, H.; Pengpad, A.; Williamson, A.I.; Spencer, B.F.; Hardman, S.J.O.; Leontiadou, M.A.; Neo, D.C.J.; Fairclough, S.M.; Watt, A.A.R.; et al. The Passivating Effect of Cadmium in PbS/CdS Colloidal Quantum Dots Probed by nm-Scale Depth Profiling. Nanoscale 2017, 9, 6056–6067. [Google Scholar] [CrossRef] [PubMed]
- Ihly, R.; Tolentino, J.; Liu, Y.; Gibbs, M.; Law, M. The Photothermal Stability of PbS Quantum Dot Solids. ACS Nano 2011, 5, 8175–8186. [Google Scholar] [CrossRef] [PubMed]
- Ullrich, B.; Xiao, X.Y.; Brown, G.J. Photoluminescence of PbS Quantum Dots on Semi-Insulating GaAs. J. Appl. Phys. 2010, 108. [Google Scholar] [CrossRef]
- Peterson, J.J.; Krauss, T.D. Photobrightening and Photodarkening in PbS Quantum Dots. Phys. Chem. Chem. Phys. 2006, 8, 3851–3856. [Google Scholar] [CrossRef] [PubMed]
- Zhang, T.; Zhao, H.; Riabinina, D.; Chaker, M.; Ma, D. Concentration-Dependent Photoinduced Photoluminescence Enhancement in Colloidal PbS Quantum Dot Solution. J. Phys. Chem. C 2010, 114, 10153–10159. [Google Scholar] [CrossRef]
- Turyanska, L.; Patanè, A.; Henini, M.; Hennequin, B.; Thomas, N.R. Temperature Dependence of the Photoluminescence Emission from Thiol-Capped PbS Quantum Dots. Appl. Phys. Lett. 2007, 90, 101913. [Google Scholar] [CrossRef] [Green Version]
- Ka, I.; Ma, D.; El Khakani, M.A. Tailoring the Photoluminescence of PbS-Nanoparticles Layers Deposited by Means of the Pulsed Laser Ablation Technique. J. Nanopart. Res. 2011, 13, 2269–2274. [Google Scholar] [CrossRef]
- Wang, Y.; Suna, A.; Mahler, W.; Kasowski, R. PbS in Polymer. From Moleculs to Bulk Solids. J. Phys. Chem. C 1987, 87, 7315–7321. [Google Scholar] [CrossRef]
- Liu, C.; Heo, J.; Zhang, X.; Adam, J. Photoluminescence of PbS Quantum Dots Embedded in Glasses. J. Non-Cryst. Solids 2008, 354, 618–623. [Google Scholar] [CrossRef]
- Nazzal, A.Y.; Wang, X.; Qu, L.; Yu, W.; Wang, Y.; Peng, X.; Xiao, M. Environmental Effects on Photoluminescence of Highly Luminescent CdSe and CdSe/ZnS Core/Shell Nanocrystals in Polymer Thin Films. J. Phys. Chem. B 2004, 108, 5507–5515. [Google Scholar] [CrossRef]
- Nazzal, A.Y.; Qu, L.; Peng, X.; Xiao, M. Photoactivated CdSe Nanocrystals as Nanosensors for Gases. Nano Lett. 2003, 3, 819–822. [Google Scholar] [CrossRef]
- Efros, A.L.; Nesbitt, D.J. Origin and Control of Blinking in Quantum Dots. Nat. Nanotechnol. 2016, 11, 661–671. [Google Scholar] [CrossRef] [PubMed]
- Malgras, V.; Nattestad, A.; Yamauchi, Y.; Dou, S.X.; Kim, J.H. The Effect of Surface Passivation on the Structure of Sulphur-Rich PbS Colloidal Quantum Dots for Photovoltaic Application. Nanoscale 2015, 7, 5706–5711. [Google Scholar] [CrossRef] [PubMed]
- Cant, D.J.H.; Syres, K.L.; Lunt, P.J.B.; Radtke, H.; Treacy, J.; Thomas, P.J.; Lewis, E.A.; Haigh, S.J.; Obrien, P.; Schulte, K.; et al. Surface Properties of Nanocrystalline PbS Films Deposited at the Water-Oil Interface: A Study of Atmospheric Aging. Langmuir 2015, 31, 1445–1453. [Google Scholar] [CrossRef] [PubMed]
- Moulder, J.F.; Stickle, W.F.; Sobol, P.E.; Bomben, K.D. Handbook of X-ray Photoelectron Spectroscopy, 2nd ed.; Chastain, J., Ed.; Perkin-Elmer Corp., Physical Electronics Division: Eden Prairie, MN, USA, 1995. [Google Scholar]
- Bäuerle, D. Laser Processing and Chemistry, 4th ed.; Springer Berlin Heidelberg: Berlin/Heidelberg, Germany, 2011. [Google Scholar]
- Cheng, C.; Li, J.; Cheng, X. Photoluminescence Lifetime and Absorption Spectrum of PbS Nanocrystal Quantum Dots. J. Lumin. 2017, 188, 252–257. [Google Scholar] [CrossRef]
- Chernavskii, P.A.; Peskov, N.V.; Mugtasimov, A.V.; Lunin, V.V. Oxidation of Metal Nanoparticles: Experiment and Model. Russ. J. Phys. Chem. B 2007, 1, 394–411. [Google Scholar] [CrossRef]
Figure 1.
(a) Initial photoluminescence (PL) spectra of PLD-deposited PbS QDs with different number of laser shots (NLP). PL of the PbS QDs shows clearly red shift from 680 to 820 nm. This obvious shift is a consequence of the quantum size effects of the PbS QDs [16]; (b) XRD pattern of PbS QDs deposited with NLP = 500; (c) TEM image of PbS QDs deposited directly onto carbon-filmed-grids; the inset in (c) is their TEM diffraction pattern.

Figure 2.
(a) Typical of the photoluminescence spectrum for the PbS QDs, all the experiments presented similar behavior but with marked time differences depending on the exact environmental conditions. (b–d) XPS Pb 4f7/2 spectrum of the freshly deposited, after laser-irradiation until reached maximum PL intensity, and after PL intensity decayed, respectively. The XPS measurement was conducted using a ThermoFisher ESCALAB 250XI Analyzer with base pressure below 10−10 mbar. Al Kα (1486.6 eV) radiation was used as an X-ray source (15 kV, 159.3 W).

Figure 3.
Time evolution of the photoluminescence integrated intensity for the PbS QDs, under three distinct experimental conditions: (a) Variation over laser power with 1 atmosphere of oxygen pressure and constant temperature (294 K), (b) variation under different oxygen pressures at room temperature and 1.54 × 10⁴ W/cm2 light intensity, and (c) temperature effect at constant pressure (1 atmosphere) and same constant laser power. Solid lines are fit to the physical model described in the text.

Figure 4.
(a,b) parameters A and B under different light intensities at 294 K and 1 atmosphere of oxygen, respectively; (c) Parameter B as function of pressure at 294 K and 1.54 × 10⁴ W/cm2 light intensity; (d) Parameter B as function of temperature at 1 atmosphere and same light intensity. Dots are the specific parameters that produce the fitted curves in Figure 3. Solid lines are best fits to funcional forms of those parameters vs. the controlled enviromental variables as explained in detail in the Discussion section.

© 2018 by the authors. Licensee MDPI, Basel, Switzerland. This article is an open access article distributed under the terms and conditions of the Creative Commons Attribution (CC BY) license (http://creativecommons.org/licenses/by/4.0/).
Share and Cite
MDPI and ACS Style
Liu, H.; Dong, Q.; Lopez, R. The Effect of Light Intensity, Temperature, and Oxygen Pressure on the Photo-Oxidation Rate of Bare PbS Quantum Dots. Nanomaterials 2018, 8, 341. https://doi.org/10.3390/nano8050341
AMA Style
Liu H, Dong Q, Lopez R. The Effect of Light Intensity, Temperature, and Oxygen Pressure on the Photo-Oxidation Rate of Bare PbS Quantum Dots. Nanomaterials. 2018; 8(5):341. https://doi.org/10.3390/nano8050341
Chicago/Turabian StyleLiu, Huiyan, Qian Dong, and Rene Lopez. 2018. "The Effect of Light Intensity, Temperature, and Oxygen Pressure on the Photo-Oxidation Rate of Bare PbS Quantum Dots" Nanomaterials 8, no. 5: 341. https://doi.org/10.3390/nano8050341
Note that from the first issue of 2016, this journal uses article numbers instead of page numbers. See further details here.