Gadolinium-Doped Gallic Acid-Zinc/Aluminium-Layered Double Hydroxide/Gold Theranostic Nanoparticles for a Bimodal Magnetic Resonance Imaging and Drug Delivery System

 , and
, and
Abstract
:
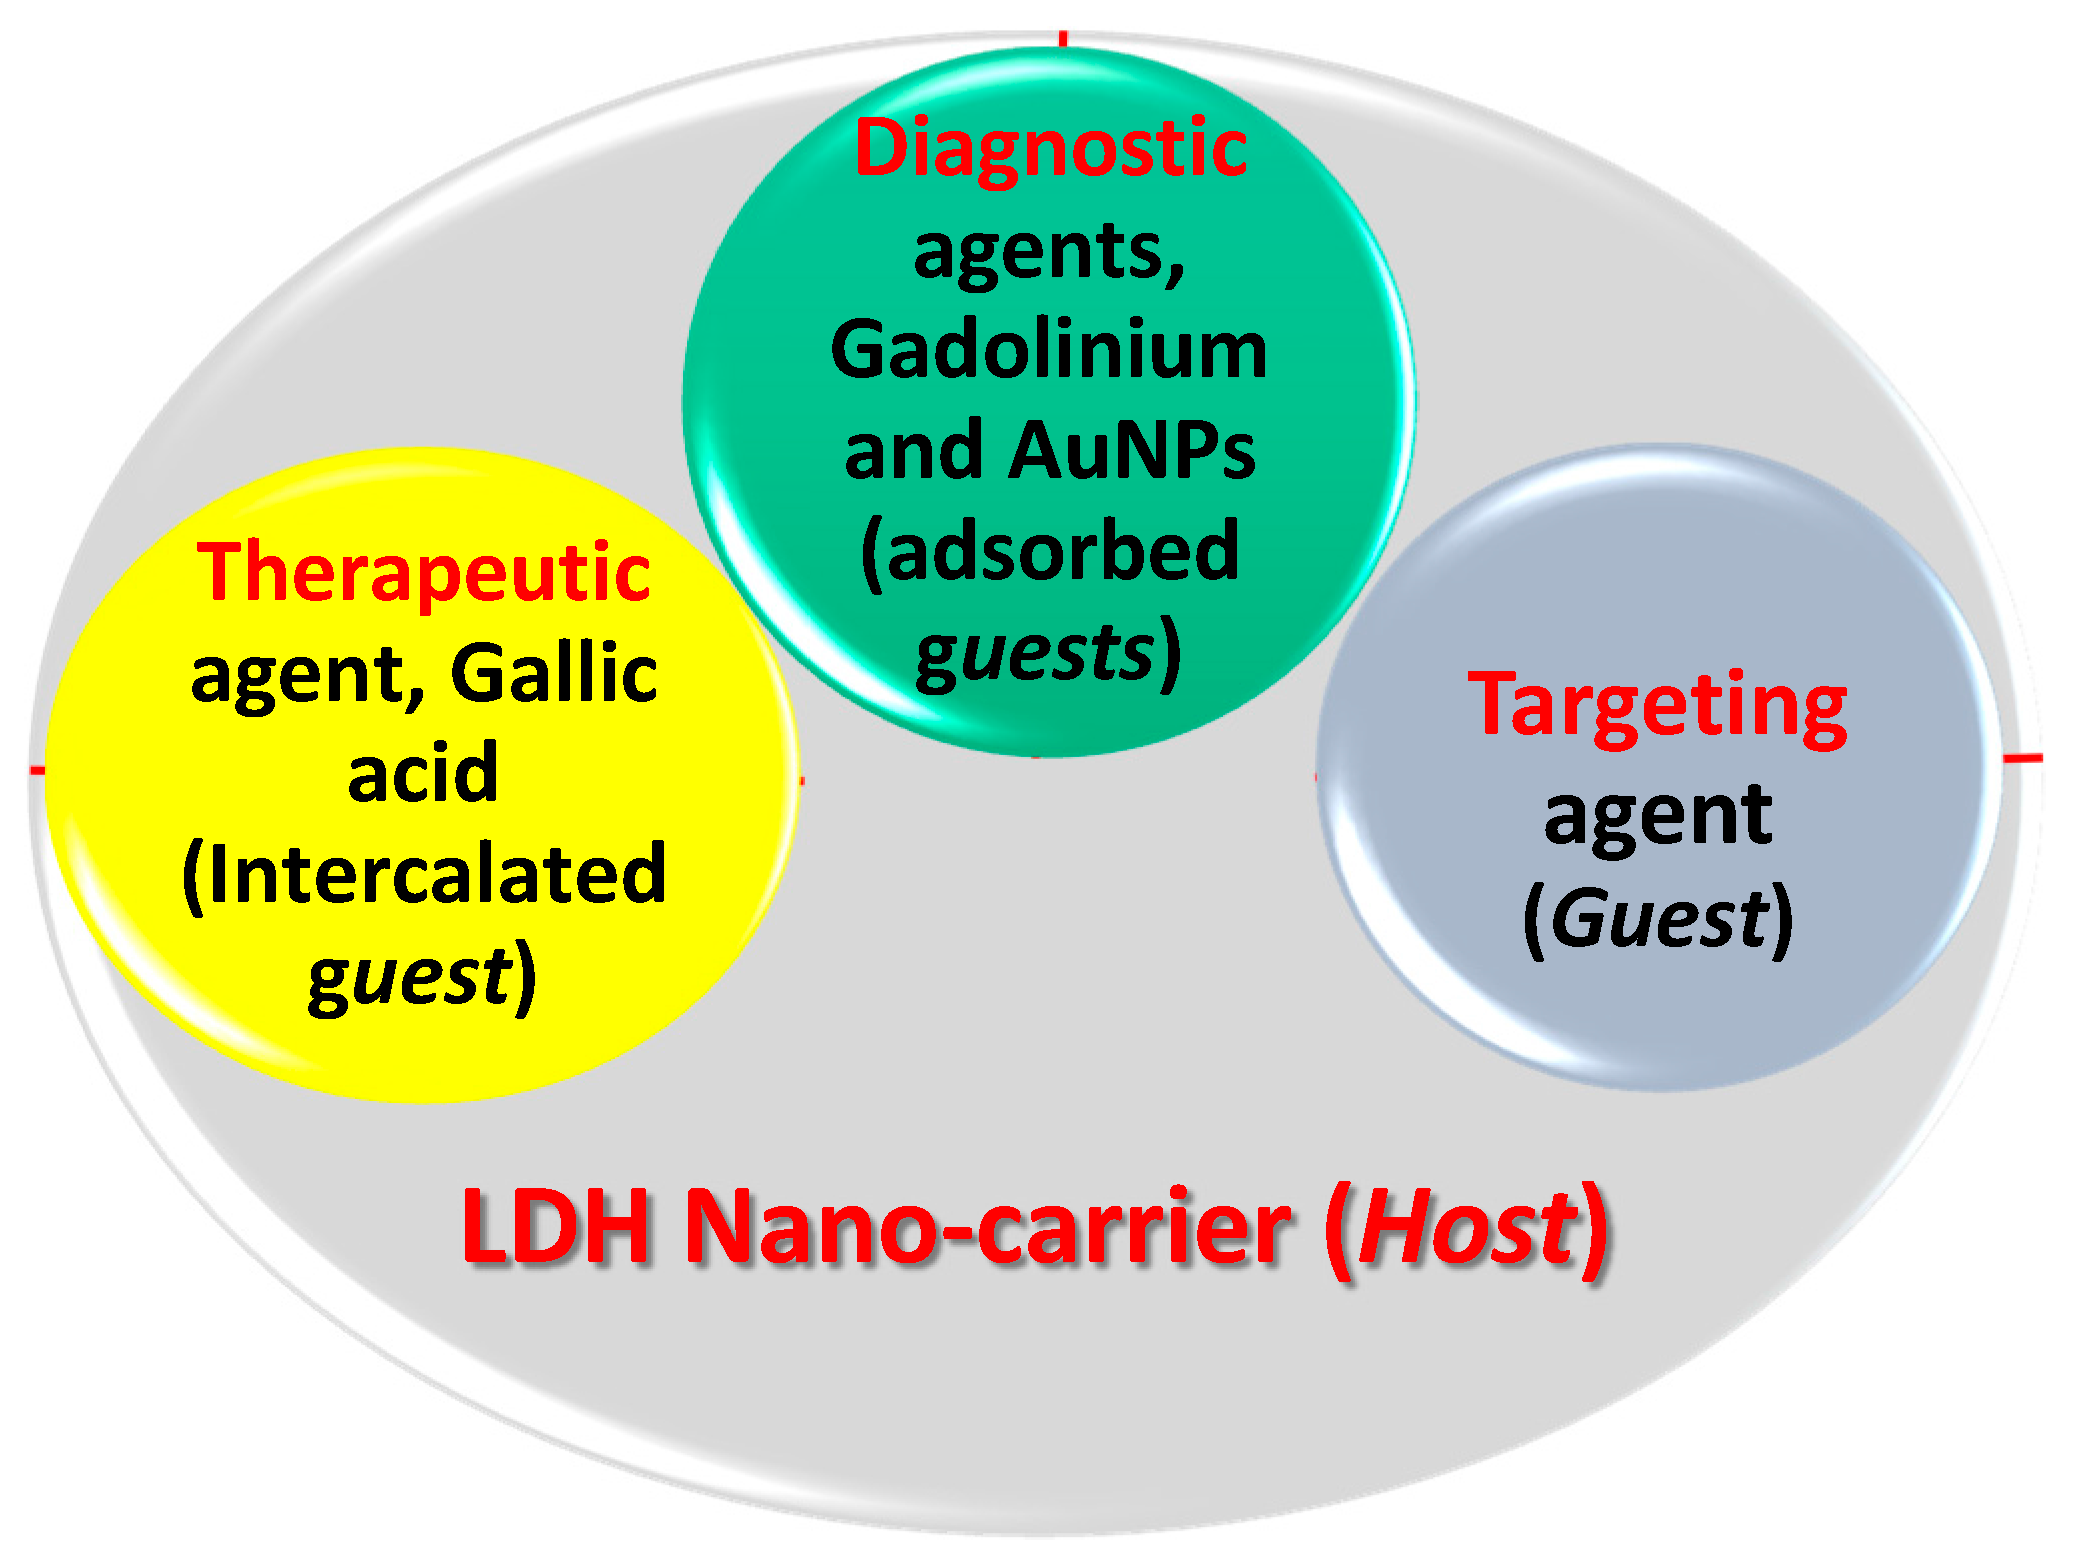
1. Introduction
2. Results and Discussion
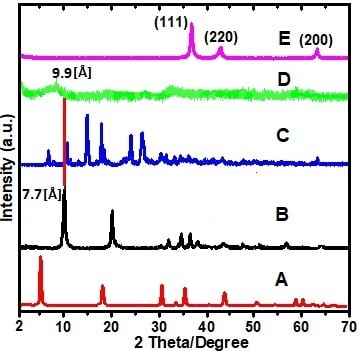
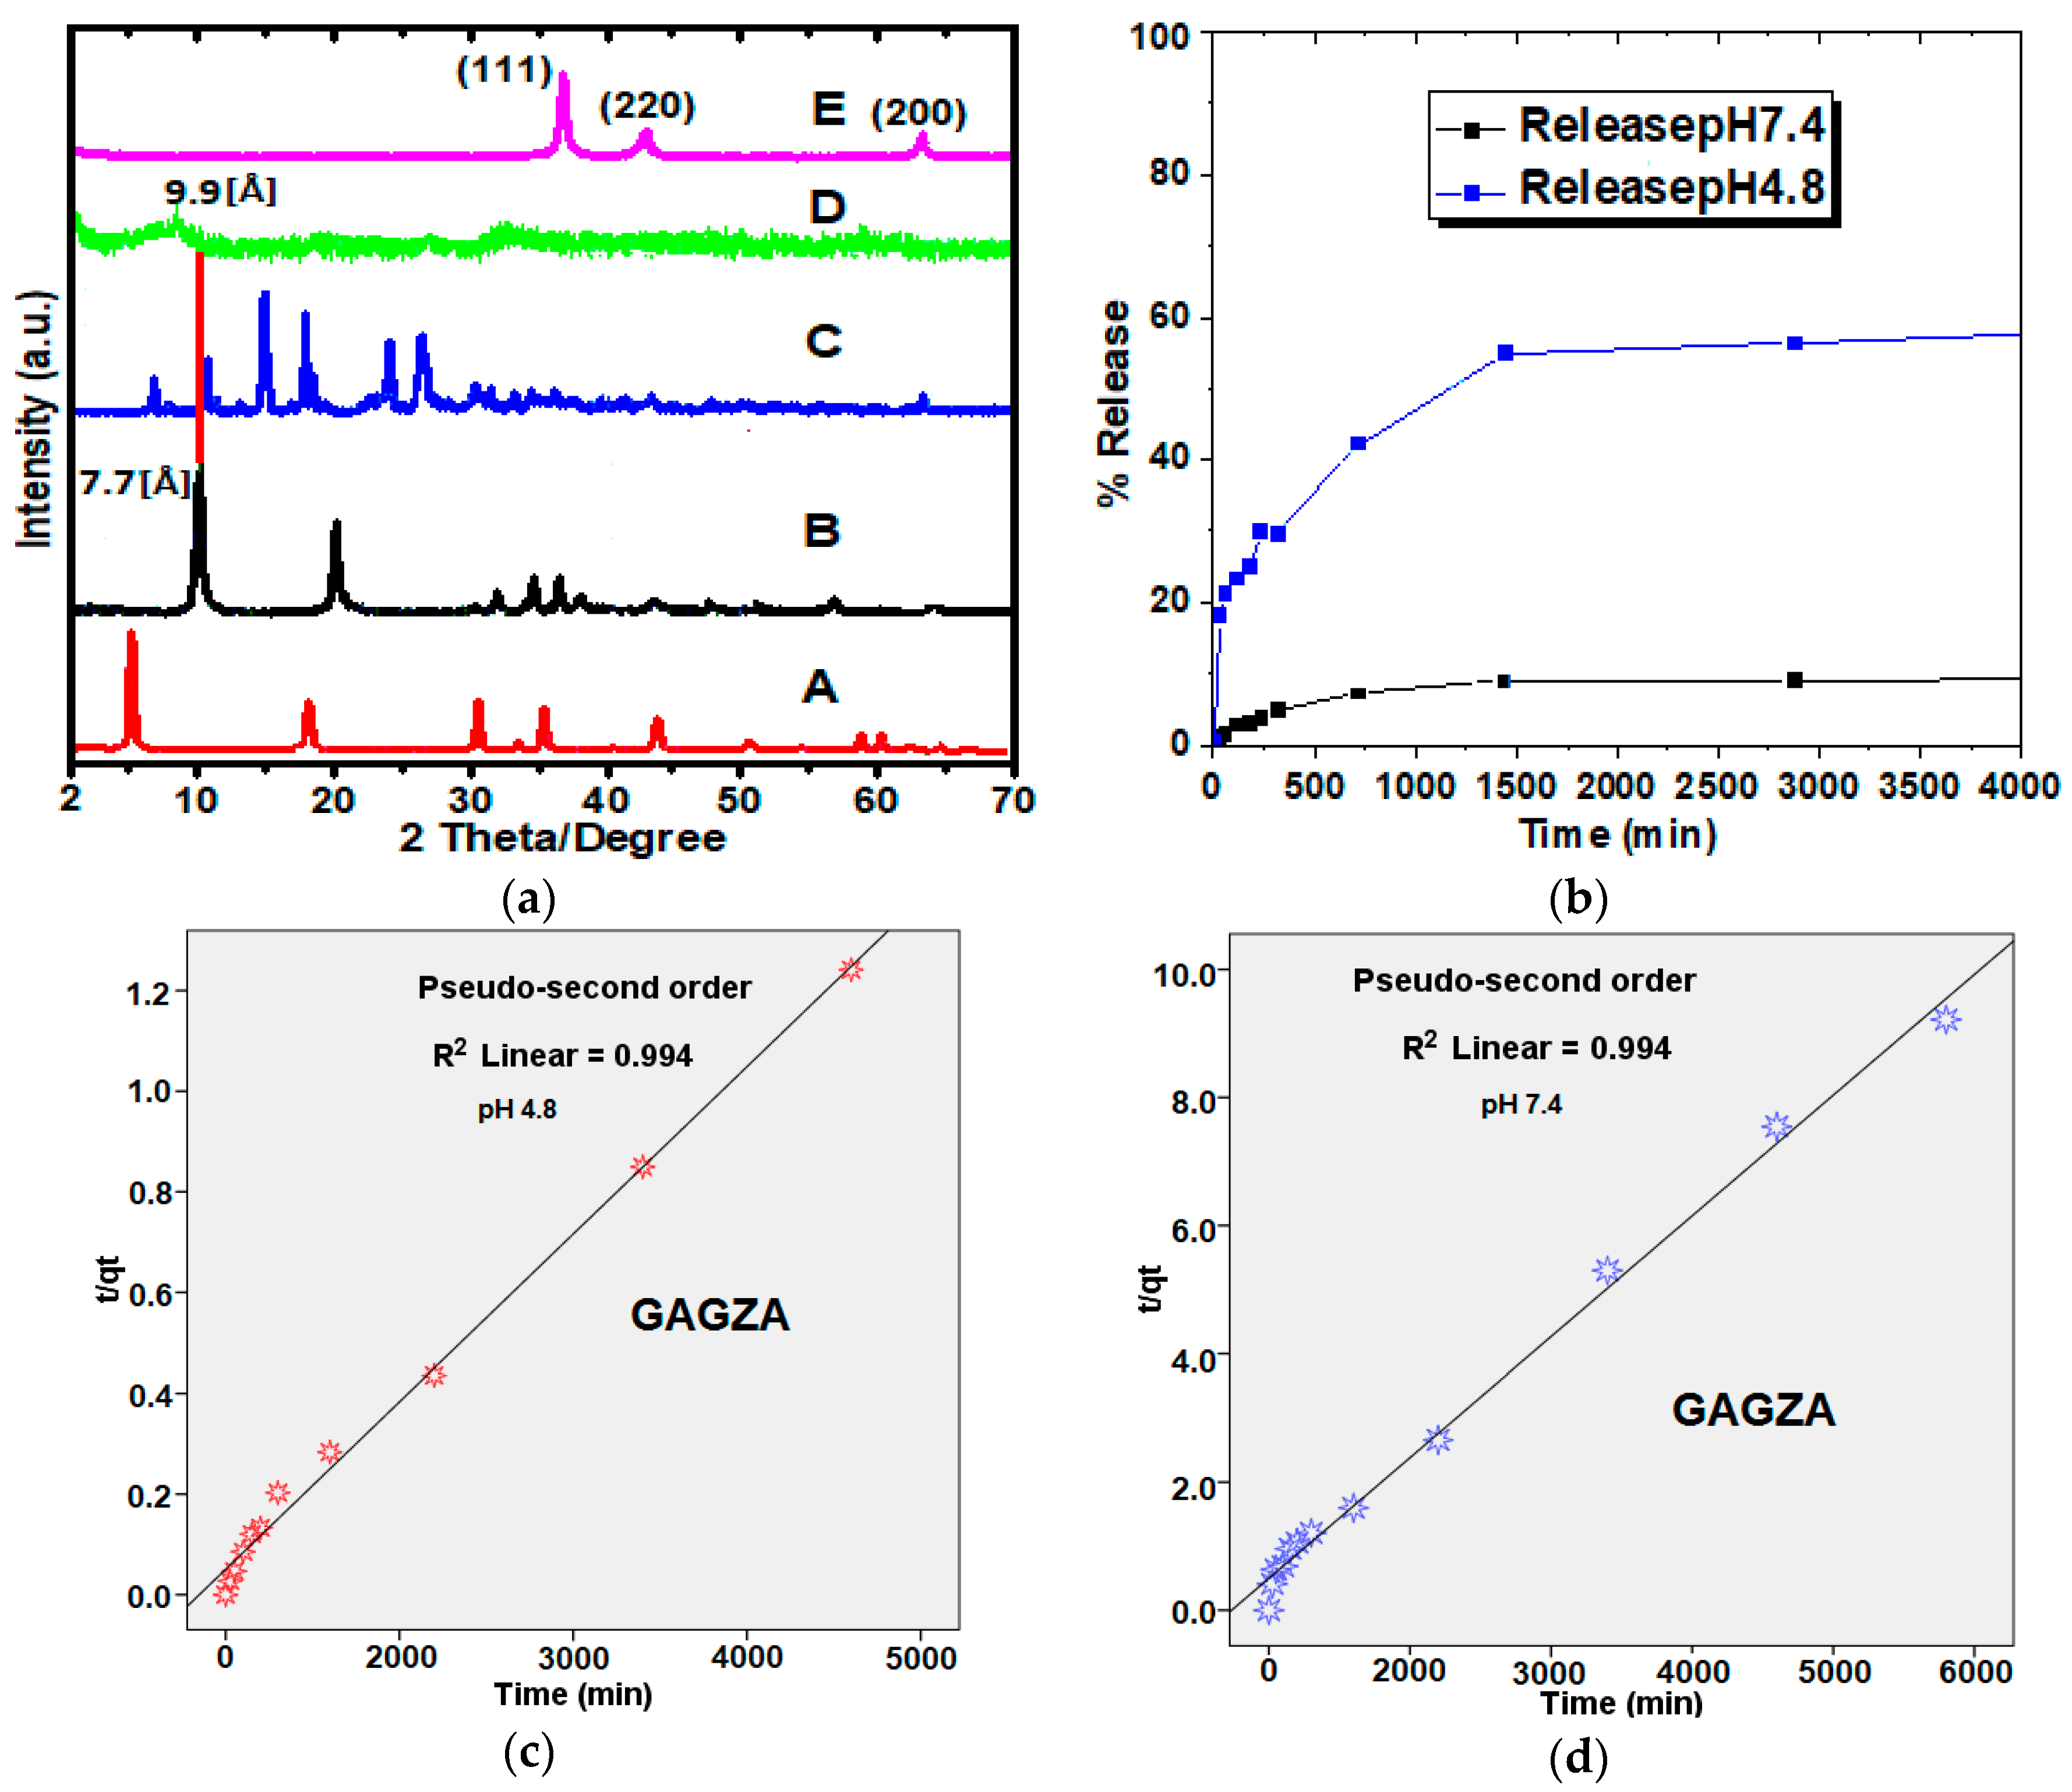
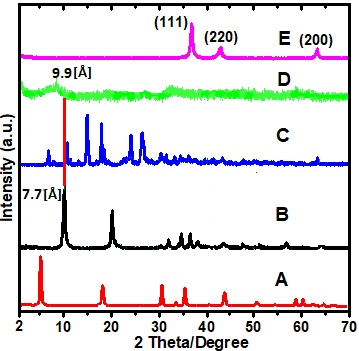
2.1. X-ray Diffraction
2.2. Drug Release Profile and Kinetics from GAGZA Nanocomposite
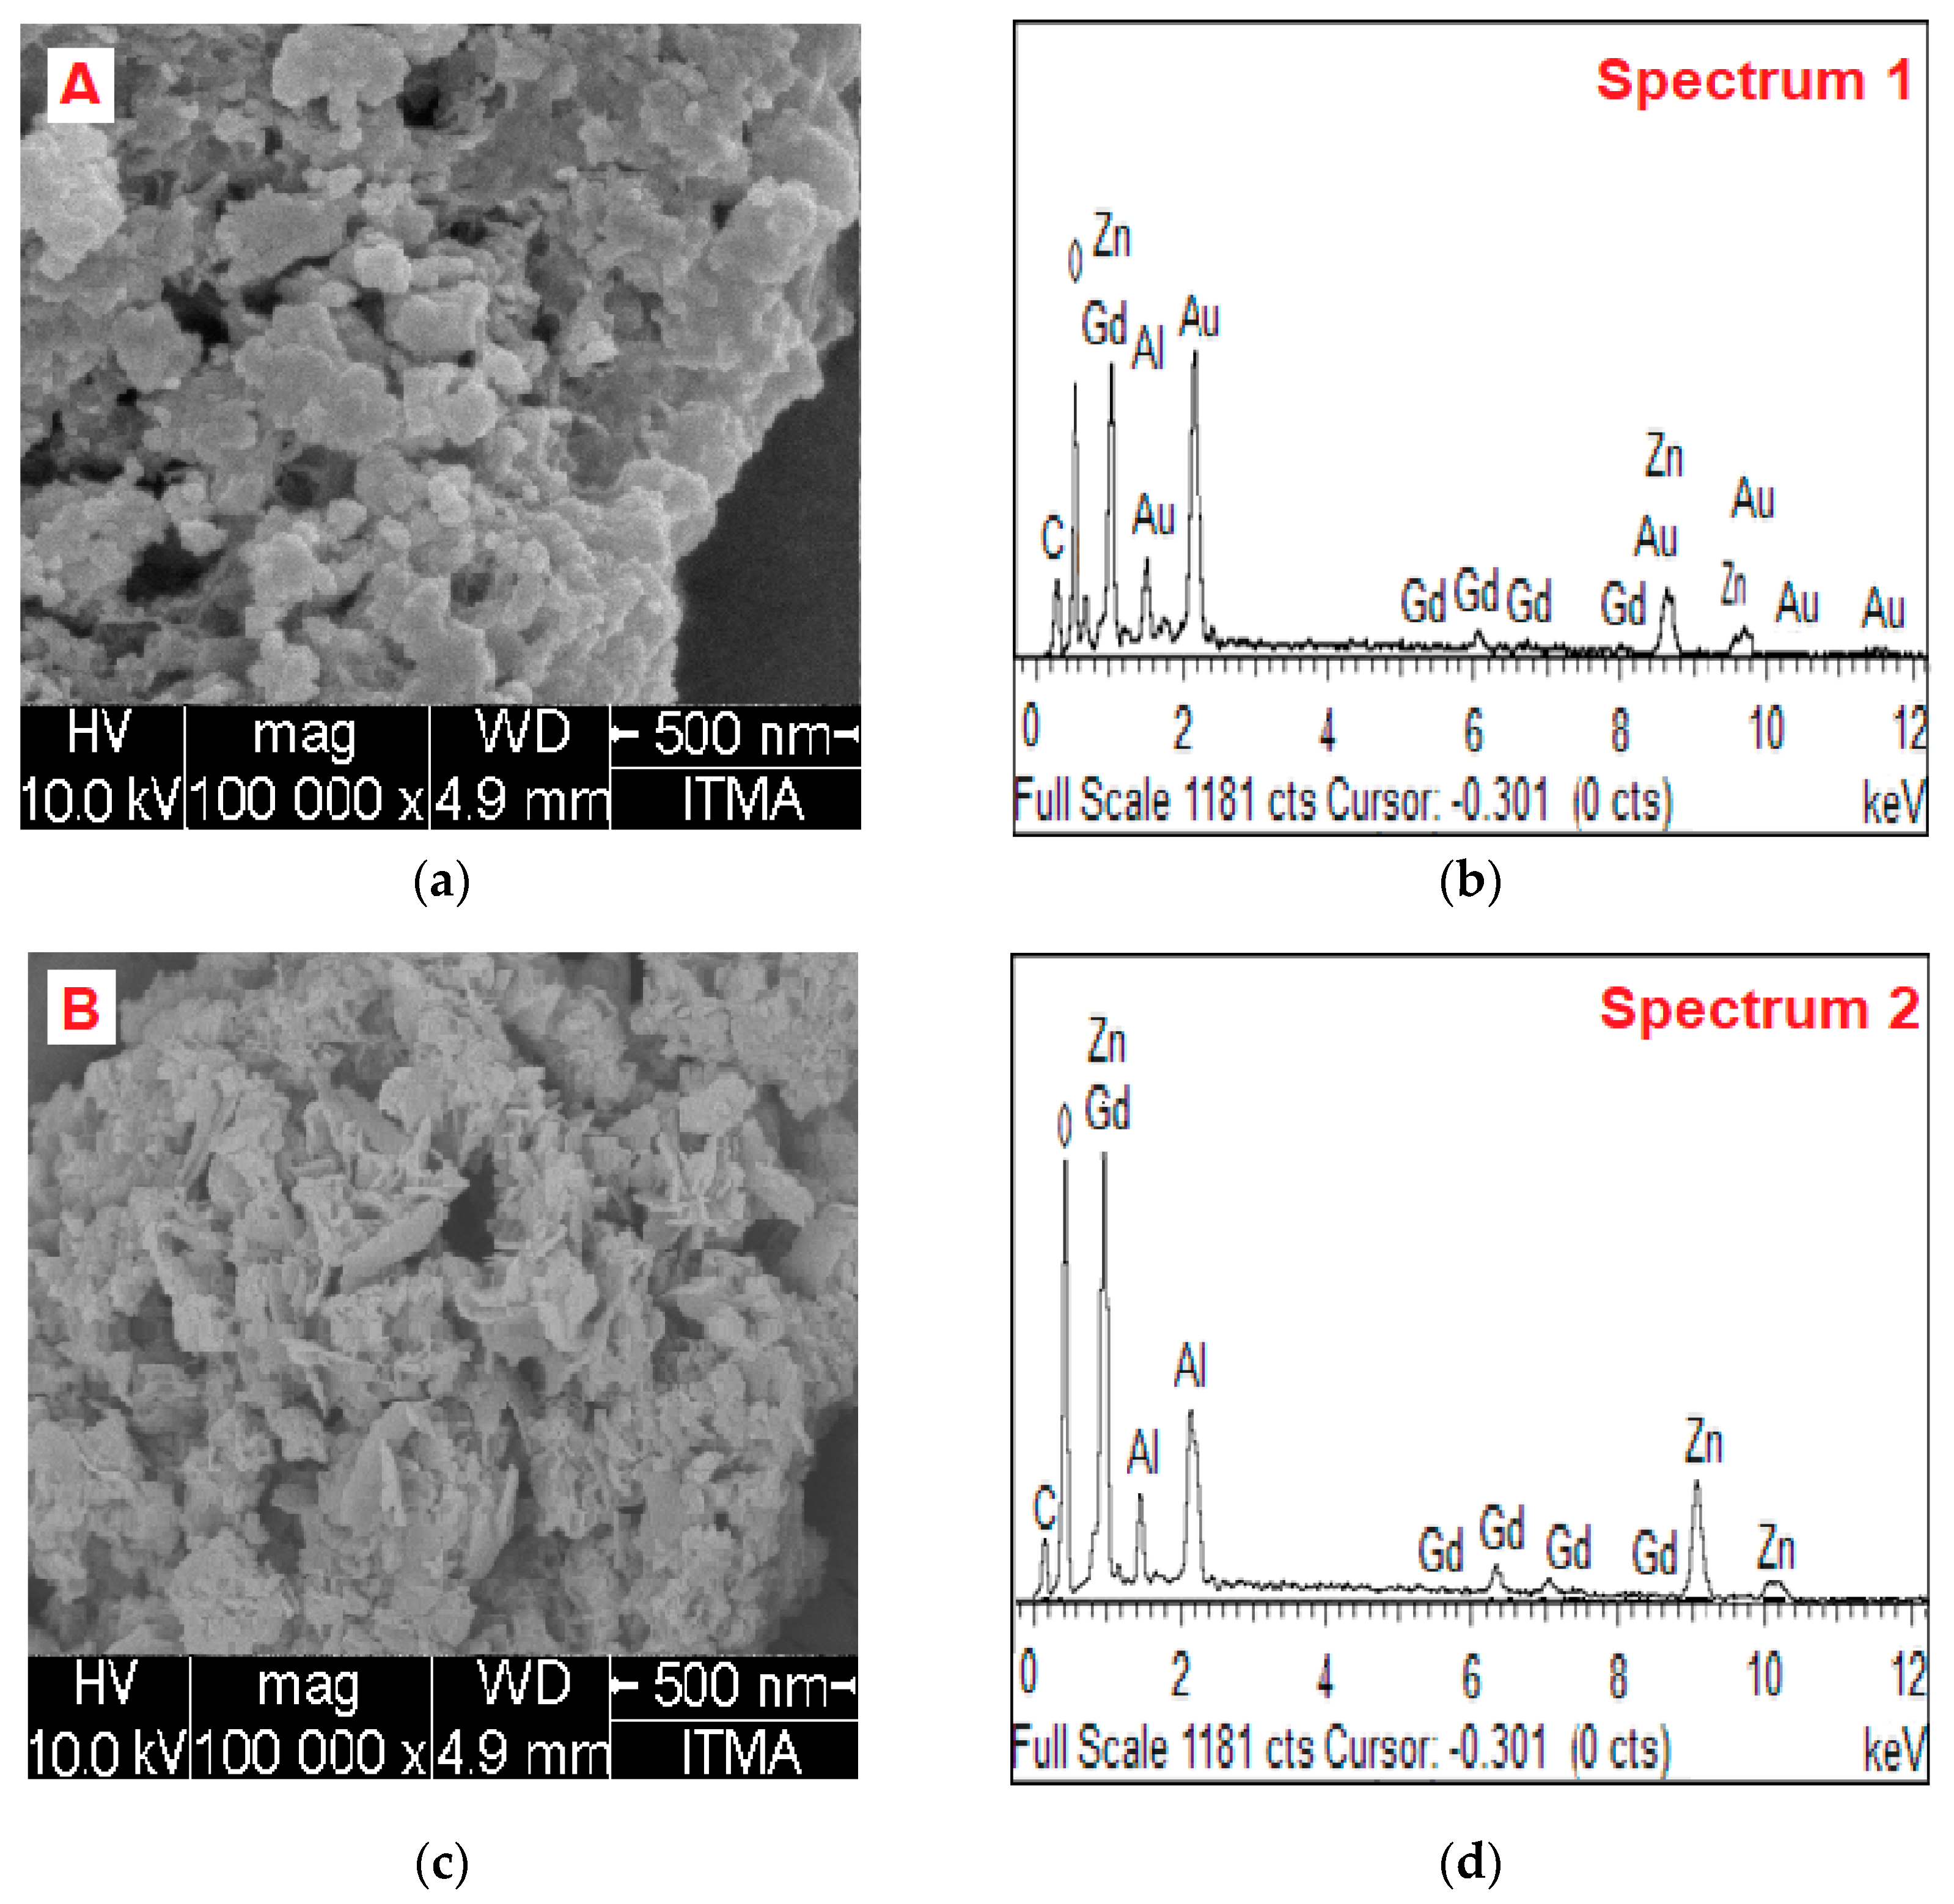
2.3. Surface Morphology and Elemental Content Analysis
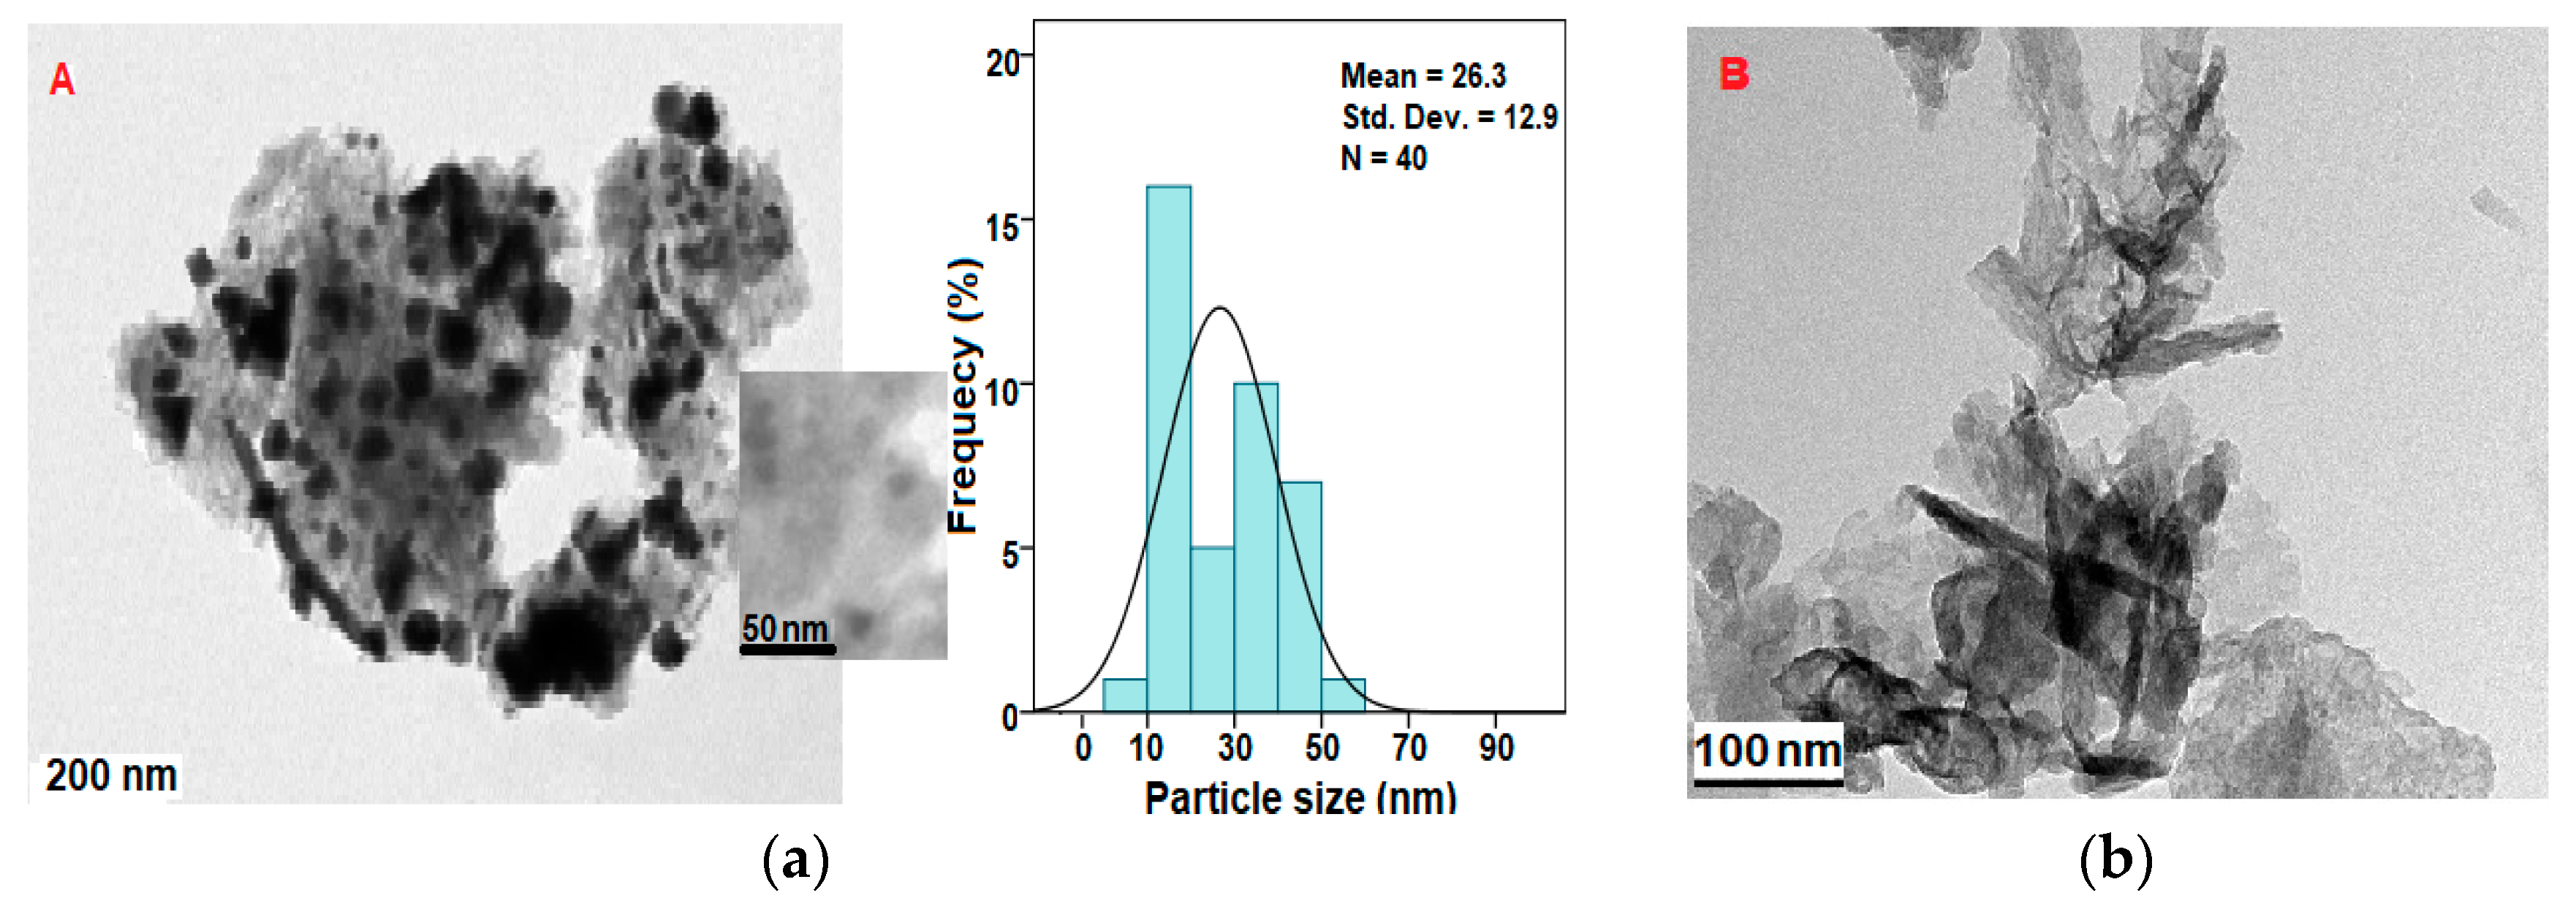
2.4. Size, Shape, and Distribution Analysis
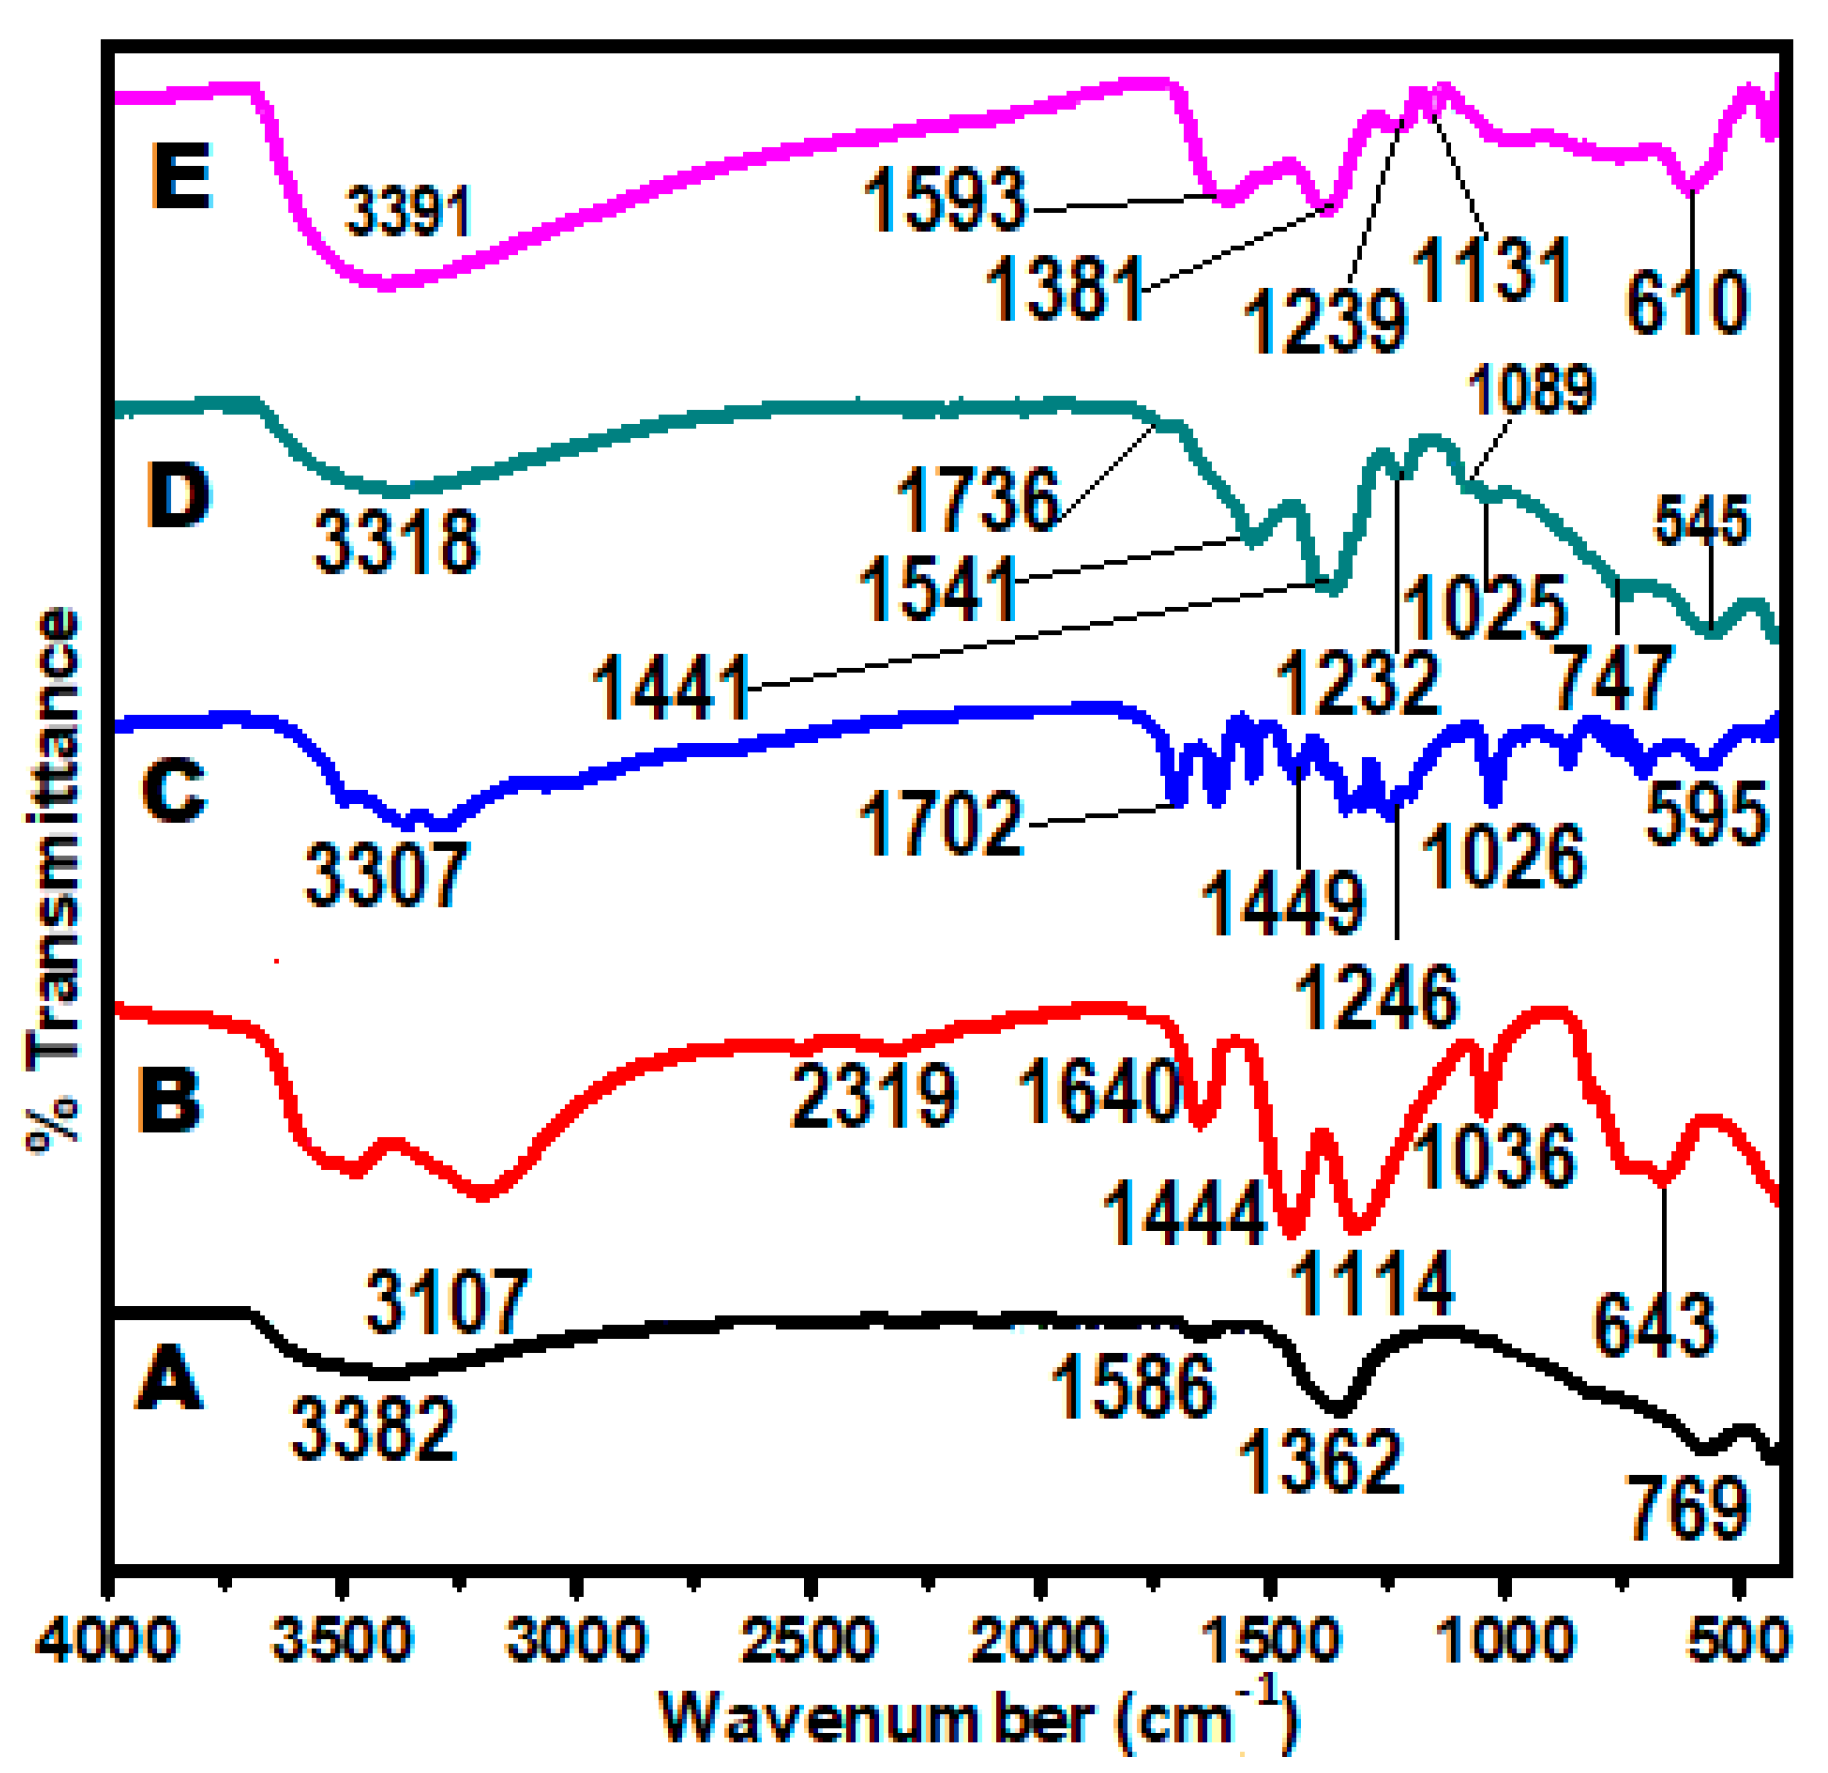
2.5. Chemical Interaction Studies (FT-IR Analysis)
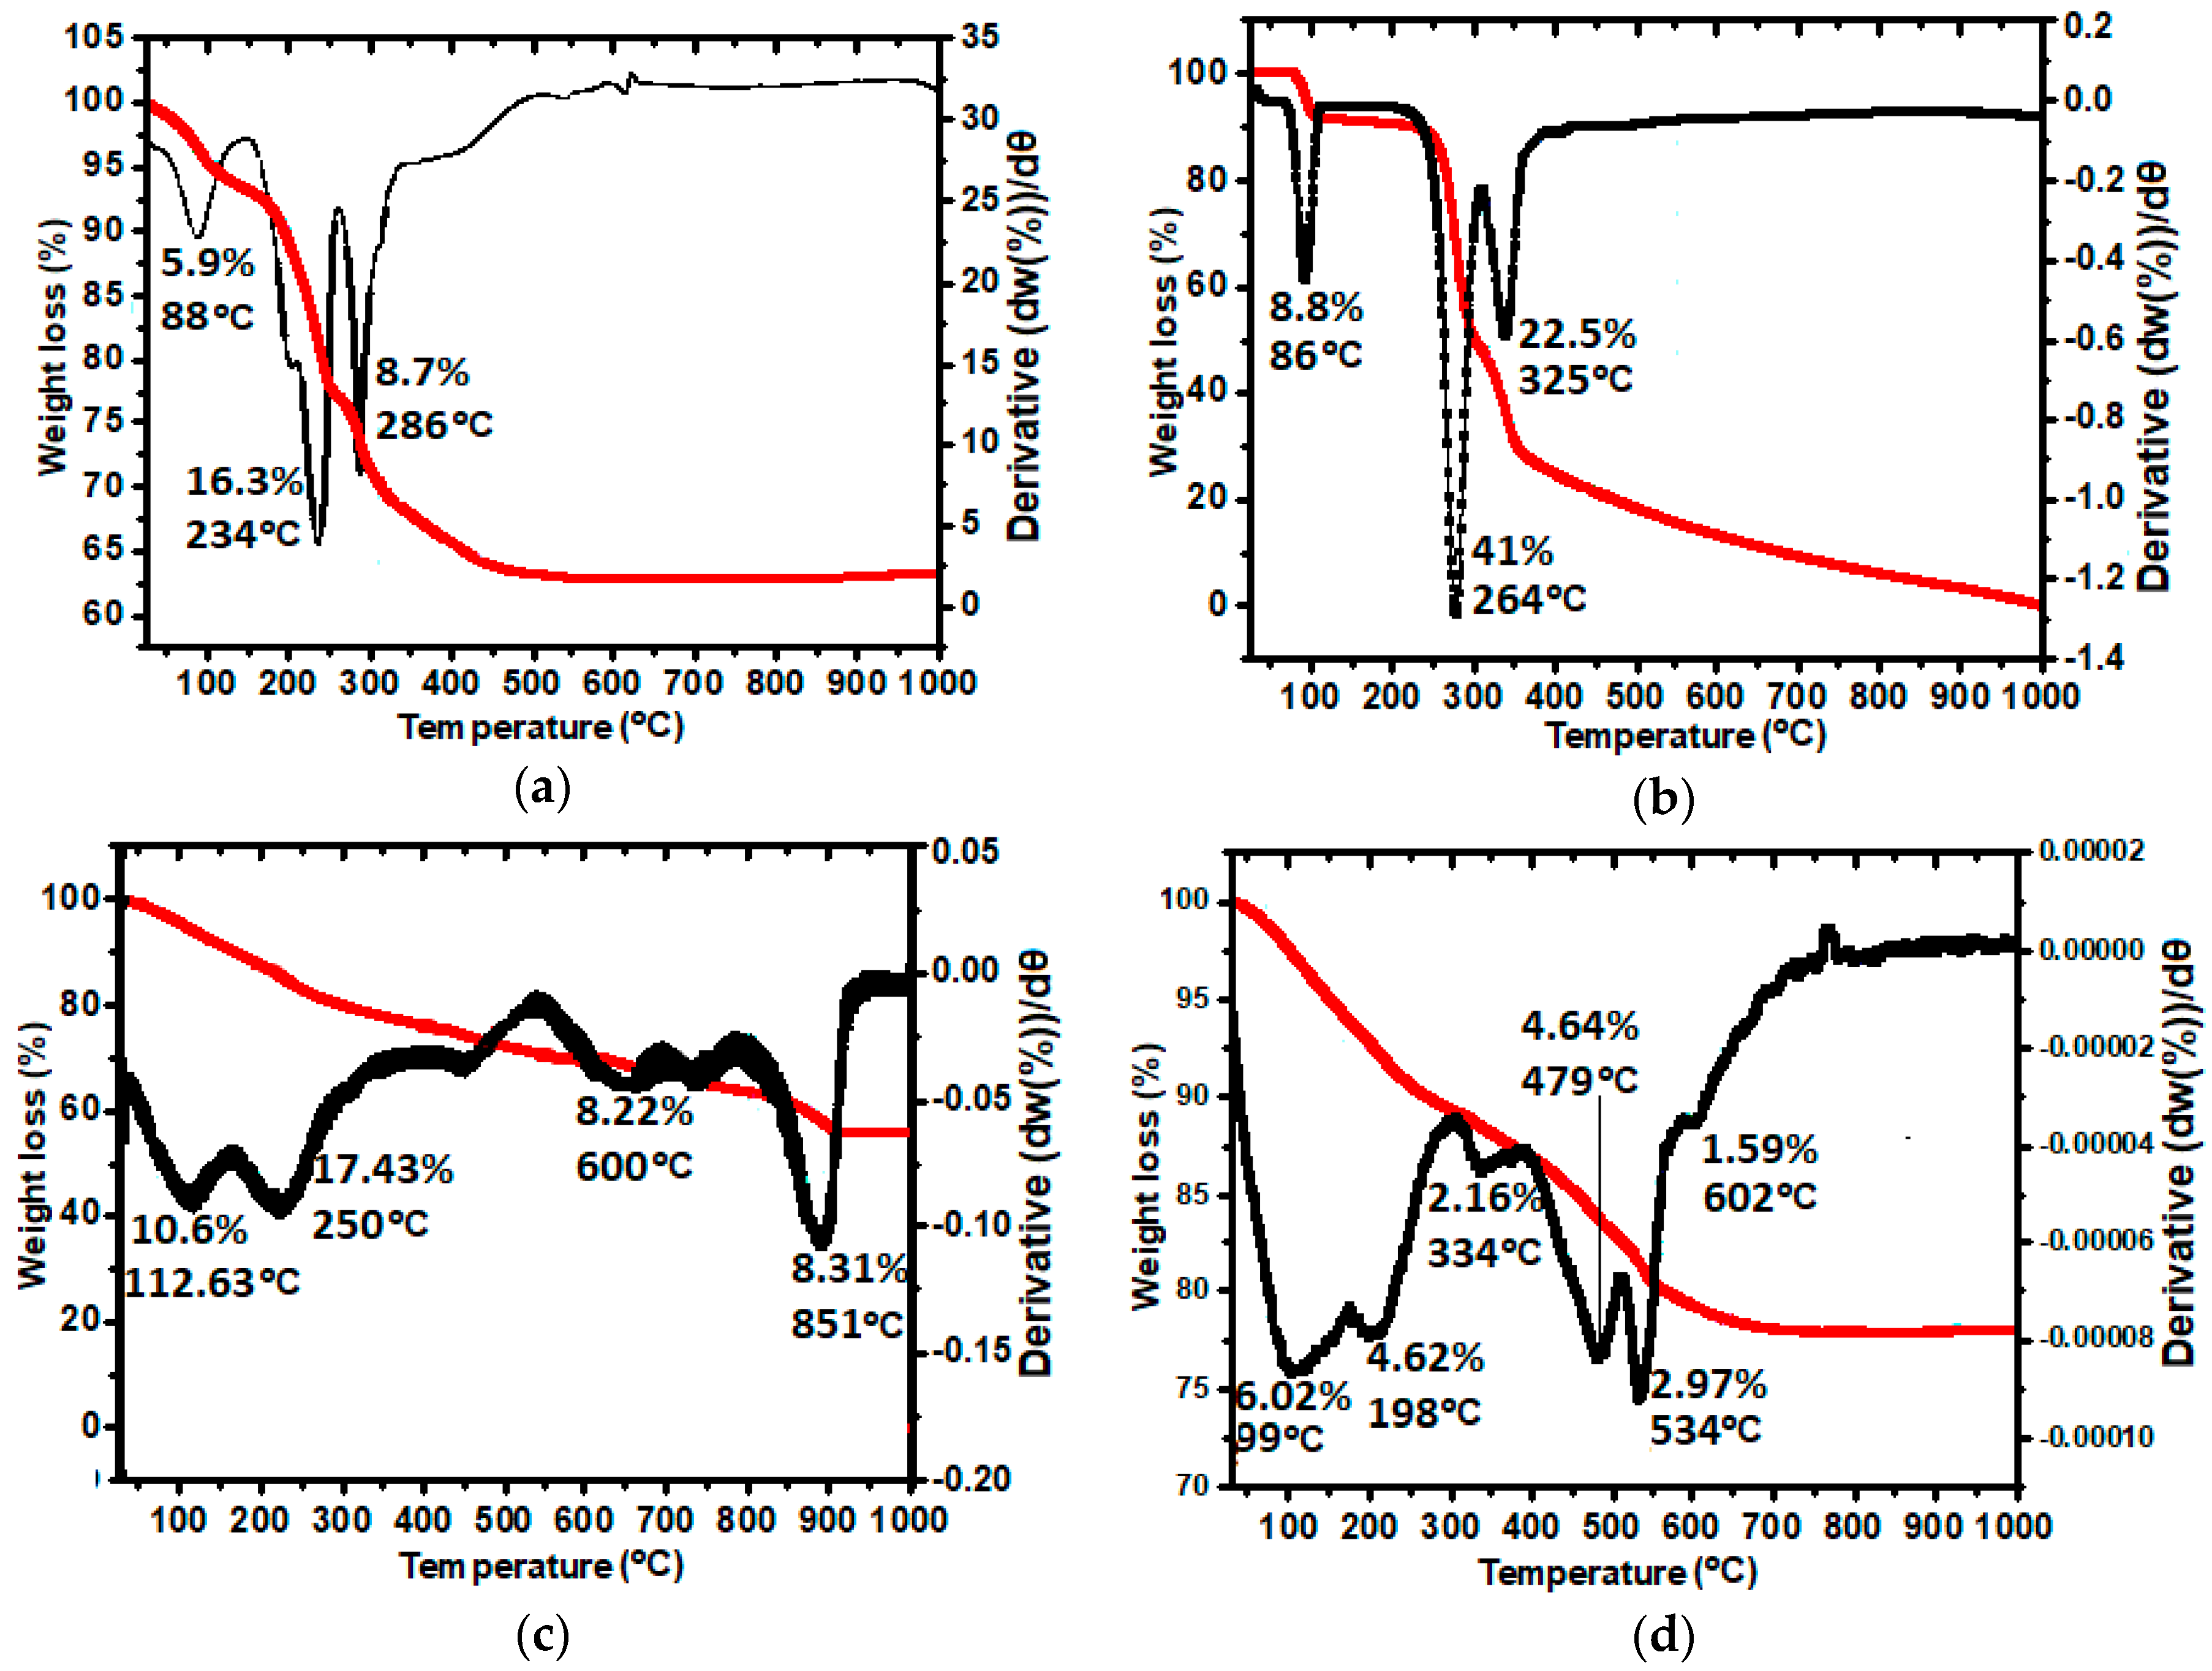
2.6. Thermal Stability Analysis (TGA/DTG)
2.7. CHNS-ICP-ES Analyses
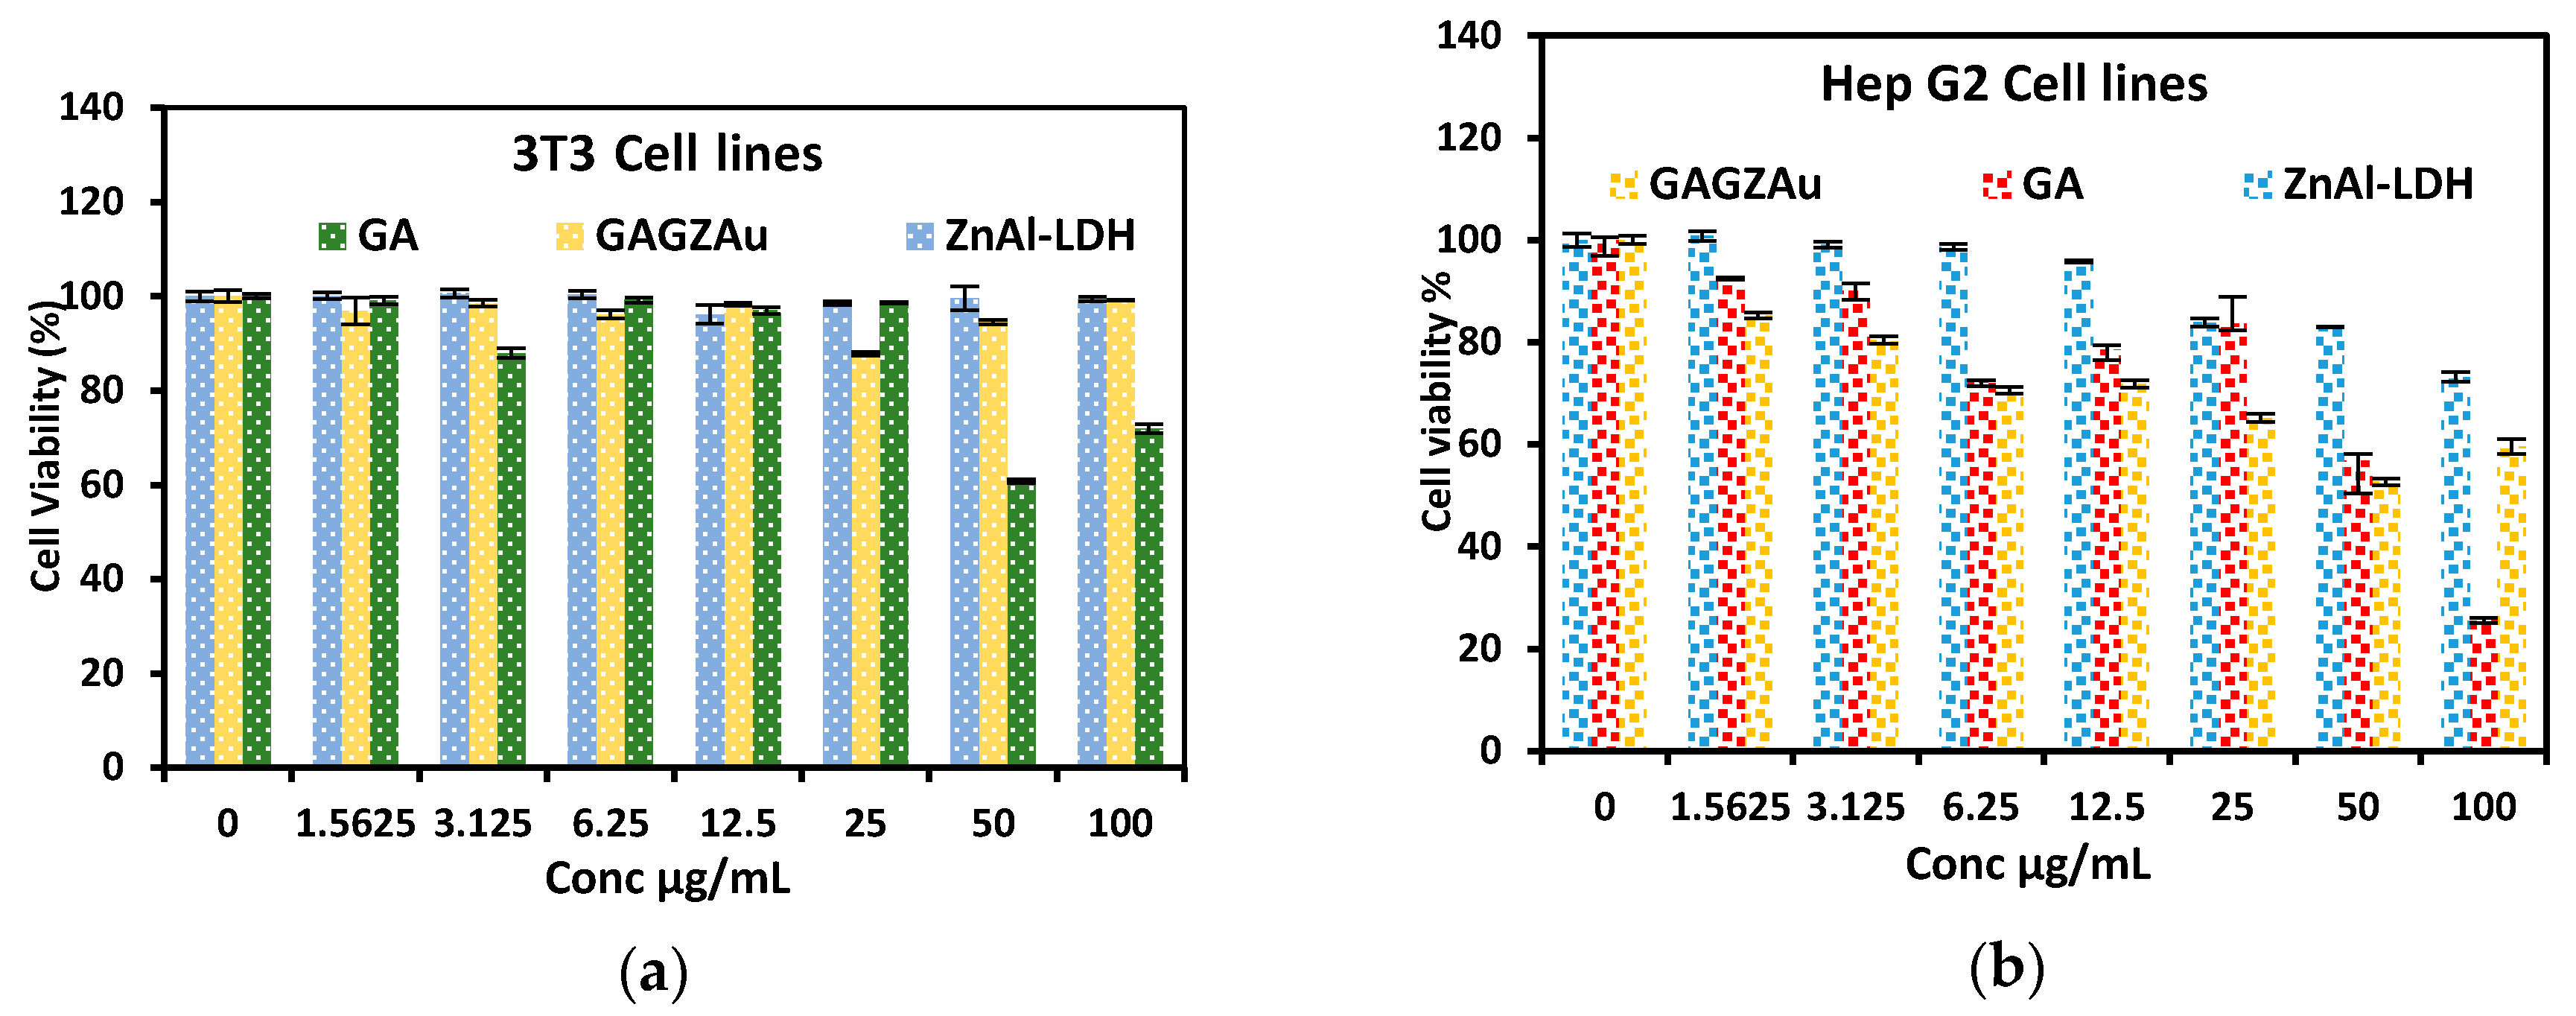
2.8. In Vitro Cytotoxicity Studies against HepG2 and 3T3 Cell Lines
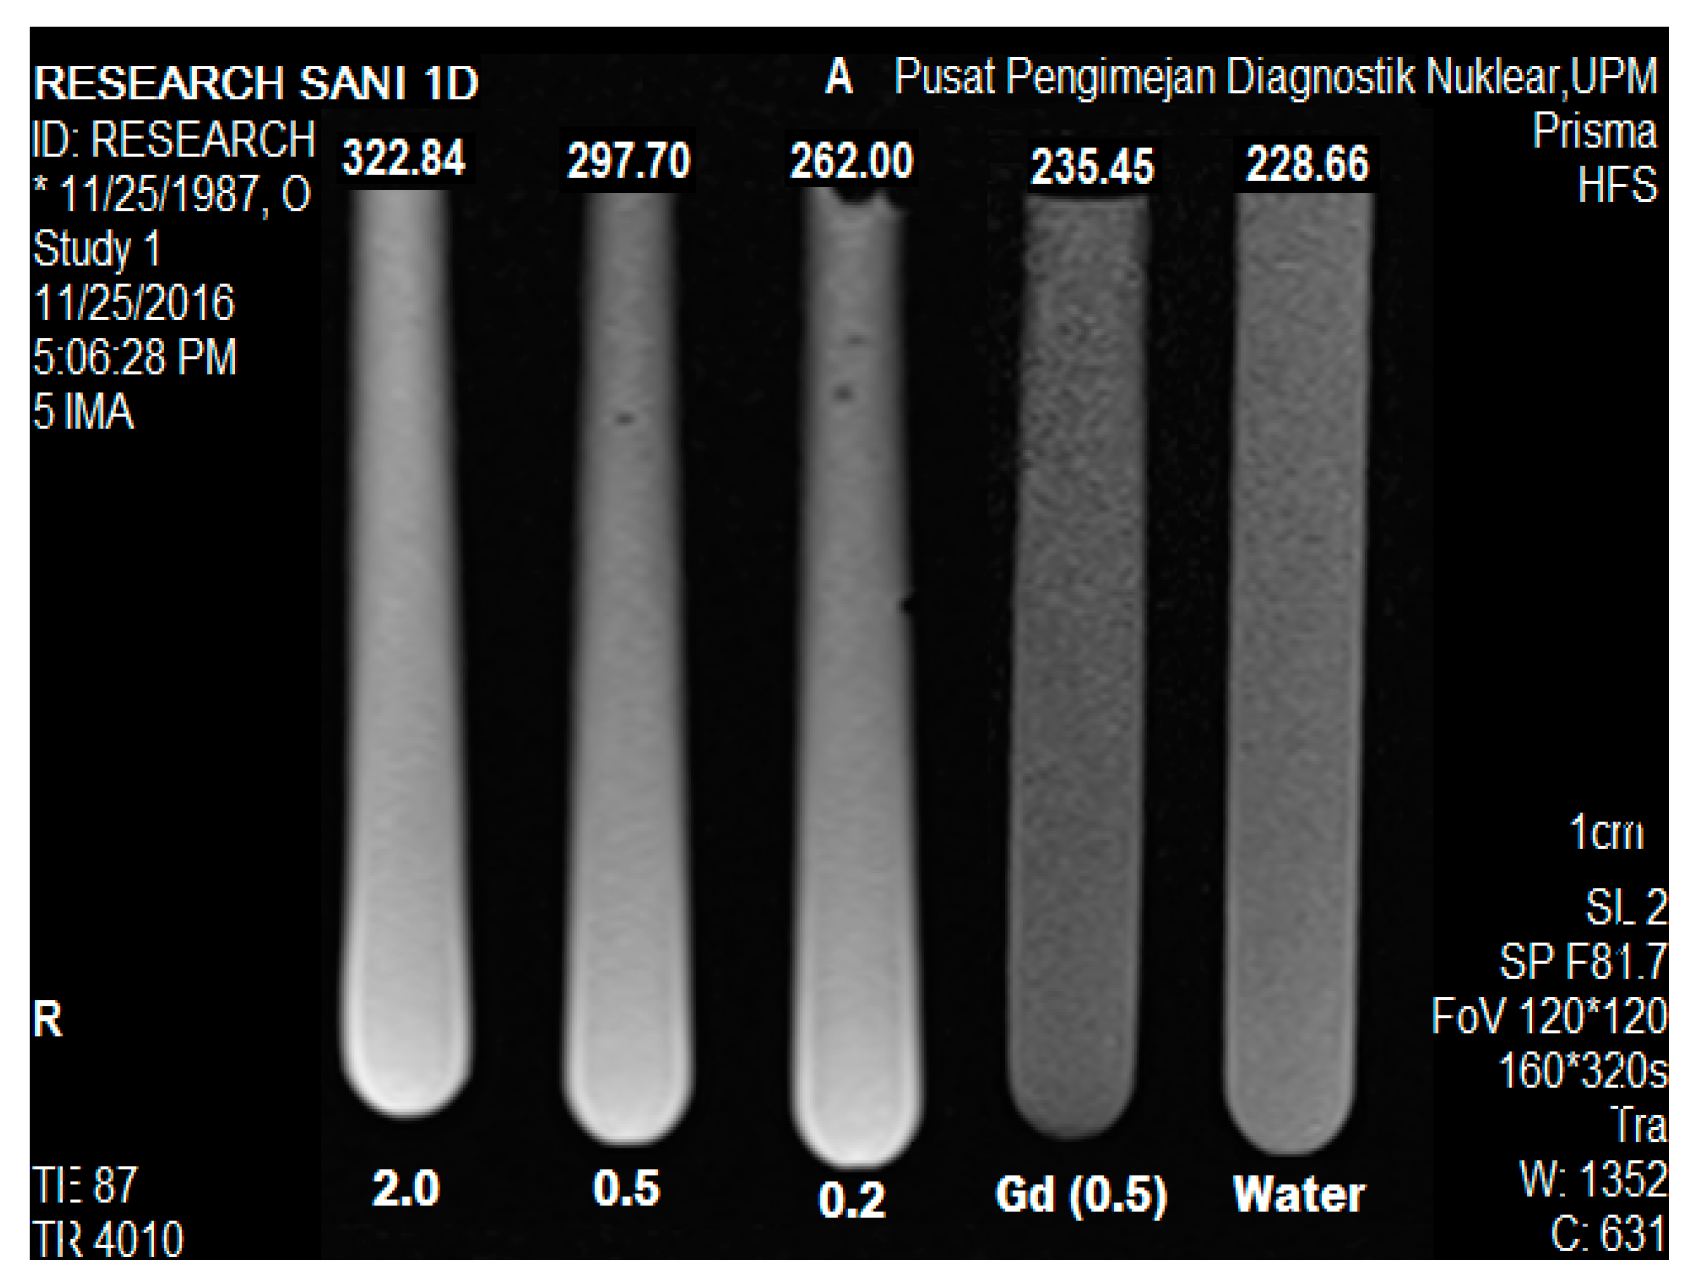
2.9. Magnetic Resonance Imaging
3. Materials and Methods
3.1. Materials
3.2. Synthesis of Gd-Zn/Al-Layered Double Hydroxide
3.3. Loading of Gallic Acid into Gd-Zn/Al-LDH Nanoparticles (GAGZA)
3.4. Doping of Gold Nanoparticles (AuNPs) onto Zn/Al-Gd GA LDH (GAGZAu)
3.5. Characterization
3.6. Drug Release Study
3.7. Cell Culture
3.8. MTT Cell Viability Assays
3.9. MR Imaging Analysis
4. Conclusions
Acknowledgments
Author Contributions
Conflicts of Interest
References
- Usman, M.S.; Ibrahim, N.A.; Shameli, K.; Zainuddin, N.; Yunus, W.M.Z.W. Copper nanoparticles mediated by chitosan: Synthesis and characterization via chemical methods. Molecules 2012, 17, 14928–14936. [Google Scholar] [CrossRef] [PubMed]
- Kovanda, F.; Jindova, E.; Dousova, B.; Kolousek, D.; Plestil, J.; Sedlakova, Z. Layered double hydroxides intercalated with organic anions and their application in preparation of l dh/polymer nanocomposites. Acta Geodyn. Geomater. 2009, 6, 111–119. [Google Scholar]
- Swierczewska, M.; Liu, G.; Lee, S.; Chen, X. High-sensitivity nanosensors for biomarker detection. Chem. Soc. Rev. 2012, 41, 2641–2655. [Google Scholar] [CrossRef] [PubMed]
- Yoo, D.; Lee, J.-H.; Shin, T.-H.; Cheon, J. Theranostic magnetic nanoparticles. Acc. Chem. Res. 2011, 44, 863–874. [Google Scholar] [CrossRef] [PubMed]
- Xu, W.; Kattel, K.; Park, J.Y.; Chang, Y.; Kim, T.J.; Lee, G.H. Paramagnetic nanoparticle T1 and T2 MRI contrast agents. Phys. Chem. Chem. Phys. 2012, 14, 12687–12700. [Google Scholar] [CrossRef] [PubMed]
- Jeong Kim, T.; Seok Chae, K.; Chang, Y.; Ho Lee, G. Gadolinium oxide nanoparticles as potential multimodal imaging and therapeutic agents. Curr. Top. Med. Chem. 2013, 13, 422–433. [Google Scholar] [CrossRef]
- Usman, M.S.; Hussein, M.Z.; Fakurazi, S.; Ahmad Saad, F.F. Gadolinium-based layered double hydroxide and graphene oxide nano-carriers for magnetic resonance imaging and drug delivery. Chem. Cent. J. 2017, 11, 47. [Google Scholar] [CrossRef]
- Cherry, S.R. Multimodality imaging: Beyond PET/CT and SPECT/CT. Semin. Nucl. Med. 2009, 39, 348–353. [Google Scholar] [CrossRef] [PubMed]
- Srinivasan, M.; Rajabi, M.; Mousa, S.A. Multifunctional nanomaterials and their applications in drug delivery and cancer therapy. Nanomaterials 2015, 5, 1690–1703. [Google Scholar] [CrossRef] [PubMed]
- Elgqvist, J. Nanoparticles as Theranostic Vehicles in Experimental and Clinical Applications—Focus on Prostate and Breast Cancer. Int. J. Mol. Sci. 2017, 18, 1102. [Google Scholar] [CrossRef] [PubMed]
- Kim, K.S.; Park, W.; Hu, J.; Bae, Y.H.; Na, K. A cancer-recognizable MRI contrast agents using pH-responsive polymeric micelle. Biomaterials 2014, 35, 337–343. [Google Scholar] [CrossRef] [PubMed]
- Campbell, J.L.; Arora, J.; Cowell, S.F.; Garg, A.; Eu, P.; Bhargava, S.K.; Bansal, V. Quasi-cubic magnetite/silica core-shell nanoparticles as enhanced MRI contrast agents for cancer imaging. PLoS ONE 2011, 6, e21857. [Google Scholar] [CrossRef] [PubMed]
- Gwak, G.-H.; Kim, M.-K.; Oh, J.-M. Composites of quasi-colloidal layered double hydroxide nanoparticles and agarose hydrogels for chromate removal. Nanomaterials 2016, 6, 25. [Google Scholar] [CrossRef] [PubMed]
- Zhang, Y.; Liu, X.; Zhang, C.; He, M.; Lu, X. Interlayer Structures and Dynamics of Arsenate and Arsenite Intercalated Layered Double Hydroxides: A First Principles Study. Minerals 2017, 7, 53. [Google Scholar] [CrossRef]
- Barahuie, F.; Hussein, M.Z.; Arulselvan, P.; Fakurazi, S.; Zainal, Z. Drug delivery system for an anticancer agent, chlorogenate-Zn/Al-layered double hydroxide nanohybrid synthesised using direct co-precipitation and ion exchange methods. J. Solid State Chem. 2014, 217, 31–41. [Google Scholar] [CrossRef]
- Saifullah, B.; Hussein, M.Z.; Hussein-Al-Ali, S.H.; Arulselvan, P.; Fakurazi, S. Sustained release formulation of an anti-tuberculosis drug based on para-amino salicylic acid-zinc layered hydroxide nanocomposite. Chem. Cent. J. 2013, 7, 72. [Google Scholar] [CrossRef] [PubMed] [Green Version]
- Bullo, S.; Hussein, M.Z. Inorganic nanolayers: Structure, preparation, and biomedical applications. Int. J. Nanomed. 2015, 10, 5609. [Google Scholar] [CrossRef] [PubMed]
- Dorniani, D.; Hussein, M.Z.B.; Kura, A.U.; Fakurazi, S.; Shaari, A.H.; Ahmad, Z. Preparation of Fe3O4 magnetic nanoparticles coated with gallic acid for drug delivery. Int. J. Nanomed. 2012, 7, 5745–5756. [Google Scholar] [CrossRef] [PubMed]
- Kura, A.U.; Hussein, M.Z.; Fakurazi, S.; Arulselvan, P. Layered double hydroxide nanocomposite for drug delivery systems; bio-distribution, toxicity and drug activity enhancement. Chem. Cent. J. 2014, 8. [Google Scholar] [CrossRef] [PubMed]
- Choi, S.-J.; Choi, G.E.; Oh, J.-M.; Oh, Y.-J.; Park, M.-C.; Choy, J.-H. Anticancer drug encapsulated in inorganic lattice can overcome drug resistance. J. Mater. Chem. 2010, 20, 9463–9469. [Google Scholar] [CrossRef]
- Long, N.N.; Kiem, C.D.; Doanh, S.C.; Nguyet, C.T.; Hang, P.T.; Thien, N.D.; Quynh, L.M. Synthesis and optical properties of colloidal gold nanoparticles. J. Phys. Conf. Ser. 2009, 187, 012026. [Google Scholar] [CrossRef]
- Hussein, M.Z.B.; Zainal, Z.; Yahaya, A.H.; Wong Vui Foo, D. Controlled release of a plant growth regulator, α-naphthaleneacetate from the lamella of Zn-Al-layered double hydroxide nanocomposite. J. Control. Release 2002, 82, 417–427. [Google Scholar] [CrossRef]
- Oh, J.-M.; Choi, S.-J.; Kim, S.-T.; Choy, J.-H. Cellular uptake mechanism of an inorganic nanovehicle and its drug conjugates: Enhanced efficacy due to clathrin-mediated endocytosis. Bioconjug. Chem. 2006, 17, 1411–1417. [Google Scholar] [CrossRef] [PubMed]
- Dorniani, D.; Kura, A.U.; Hussein-Al-Ali, S.H.; Bin Hussein, M.Z.; Fakurazi, S.; Shaari, A.H.; Ahmad, Z. In vitro sustained release study of gallic acid coated with magnetite-PEG and magnetite-PVA for drug delivery system. Sci. World J. 2014, 416354. [Google Scholar] [CrossRef]
- Raffi, M.; Mehrwan, S.; Bhatti, T.M.; Akhter, J.I.; Hameed, A.; Yawar, W.; ul Hasan, M.M. Investigations into the antibacterial behavior of copper nanoparticles against Escherichia coli. Ann. Microbiol. 2010, 60, 75–80. [Google Scholar] [CrossRef]
- Kong, X.; Jin, L.; Wei, M.; Duan, X. Antioxidant drugs intercalated into layered double hydroxide: Structure and in vitro release. Appl. Clay Sci. 2010, 49, 324–329. [Google Scholar] [CrossRef]
- Zhang, Z.; Liu, W.; Zheng, Y.; Jin, L.; Yao, W.; Gao, X. SGP-2, an acidic polysaccharide from Sarcandra glabra, inhibits proliferation and migration of human osteosarcoma cells. Food Funct. 2014, 5, 167–175. [Google Scholar] [CrossRef] [PubMed]
- Chieng, B.W.; Ibrahim, N.A.; Yunus, W.M.Z.W.; Hussein, M.Z. Poly (lactic acid)/poly (ethylene glycol) polymer nanocomposites: Effects of graphene nanoplatelets. Polymers 2013, 6, 93–104. [Google Scholar] [CrossRef]
- Ghotbi, M.Y.; bin Hussein, M.Z. Gallate–Zn–Al-layered double hydroxide as an intercalated compound with new controlled release formulation of anticarcinogenic agent. J. Phys. Chem. Solids 2010, 71, 1565–1570. [Google Scholar] [CrossRef]
- Mukherjee, P.; Bhattacharya, R.; Bone, N.; Lee, Y.K.; Patra, C.R.; Wang, S.; Lu, L.; Secreto, C.; Banerjee, P.C.; Yaszemski, M.J. Potential therapeutic application of gold nanoparticles in B-chronic lymphocytic leukemia (BCLL): Enhancing apoptosis. J. Nanobiotechnol. 2007, 5, 4. [Google Scholar] [CrossRef] [PubMed]
- Zarabi, M.F.; Arshadi, N.; Farhangi, A.; Akbarzadeh, A. Preparation and Characterization of Gold Nanoparticles with Amino Acids, Examination of Their Stability. Indian J. Clin. Biochem. 2014, 29, 306–314. [Google Scholar] [CrossRef] [PubMed]
- King, S.R.; Shimmon, S.; Gentle, A.R.; Westerhausen, M.T.; Dowd, A.; McDonagh, A.M. Remarkable thermal stability of gold nanoparticles functionalised with ruthenium phthalocyanine complexes. Nanotechnology 2016, 27, 215702. [Google Scholar] [CrossRef] [PubMed]
- Patra, J.K.; Baek, K.H. Novel green synthesis of gold nanoparticles using Citrullus lanatus rind and investigation of proteasome inhibitory activity, antibacterial, and antioxidant potential. Int. J. Nanomed. 2015, 10, 7253. [Google Scholar] [CrossRef]
- Zawada, K.; Waldemar, T.; Elżbieta, M. A smart synthesis of gold/polystyrene core–shell nanohybrids using TEMPO coated nanoparticles. RSC Adv. 2014, 4, 23876–23885. [Google Scholar] [CrossRef]
- Sugano, K.; Kansy, M.; Artursson, P.; Avdeef, A.; Bendels, S.; Di, L.; Ecker, G.F.; Faller, B.; Fischer, H.; Gerebtzoff, G. Coexistence of passive and carrier-mediated processes in drug transport. Nat. Rev. Drug Discov. 2010, 9, 597–614. [Google Scholar] [CrossRef] [PubMed]
- Xu, Z.P.; Lu, G. Layered double hydroxide nanomaterials as potential cellular drug delivery agents. Pure Appl. Chem. 2006, 78, 1771–1779. [Google Scholar] [CrossRef]
- Tian, X.; Shao, Y.; He, H.; Liu, H.; Shen, Y.; Huang, W.; Li, L. Nanoamplifiers synthesized from gadolinium and gold nanocomposites for magnetic resonance imaging. Nanoscale 2013, 5, 3322–3329. [Google Scholar] [CrossRef] [PubMed]
- Thomsen, H.S. Nephrogenic systemic fibrosis: A serious late adverse reaction to gadodiamide. Nephrogenic systemic fibrosis: A serious late adverse reaction to gadodiamide. Eur. Radiol. 2006, 5, 2619–2621. [Google Scholar] [CrossRef] [PubMed]
- Sparreboom, A.; Baker, S.D.; Verweij, J. Paclitaxel repackaged in an albumin-stabilized nanoparticle: Handy or just a dandy? J. Clin. Oncol. 2005, 23, 7765–7767. [Google Scholar] [CrossRef] [PubMed]
- Atabaev, T.S.; Lee, J.H.; Shin, Y.C.; Han, D.-W.; Choo, K.S.; Jeon, U.B.; Hwang, J.Y.; Yeom, J.A.; Kim, H.-K.; Hwang, Y.-H. Eu, Gd-Codoped Yttria Nanoprobes for Optical and T1-Weighted Magnetic Resonance Imaging. Nanomaterials 2017, 7, 35. [Google Scholar] [CrossRef] [PubMed]
- Le, W.; Cui, S.; Chen, X.; Zhu, H.; Chen, B.; Cui, Z. Facile synthesis of gd-functionalized gold nanoclusters as potential MRI/CT contrast agents. Nanomaterials 2016, 6, 65. [Google Scholar] [CrossRef] [PubMed]
- Zhang, L.; Liu, T.; Xiao, Y.; Yu, D.; Zhang, N. Hyaluronic acid-chitosan nanoparticles to deliver Gd-DTPA for MR cancer imaging. Nanomaterials 2015, 5, 1379–1396. [Google Scholar] [CrossRef] [PubMed]
- Caravan, P. Strategies for increasing the sensitivity of gadolinium based MRI contrast agents. Chem. Soc. Rev. 2006, 35, 512–523. [Google Scholar] [CrossRef] [PubMed]
- Shen, A.J.; Li, D.L.; Cai, X.J.; Dong, C.Y.; Dong, H.Q.; Wen, H.Y.; Dai, G.H.; Wang, P.J.; Li, Y.Y. Multifunctional nanocomposite based on graphene oxide for in vitro hepatocarcinoma diagnosis and treatment. J. Biomed. Mater. Res. A 2012, 100, 2499–2506. [Google Scholar] [CrossRef] [PubMed]


| Medium pH | Release Saturation (%) | Rate Constant | (min) | |||
|---|---|---|---|---|---|---|
| Pseudo-First Order | Pseudo-Second Order | Parabolic Diffusion | ||||
| 7.4 | 18 | 0.432 | 0.994 | 0 | 520 | |
| 4.8 | 62 | 0.094 | 0.994 | 0.7 | 400 |
| Sample | Tmax (°C) | Trange (°C) | Delta m (%) |
|---|---|---|---|
| (A) LDH | 234 | 88–286 | 30.9 |
| (B) Gallic acid | 264 | 86–325 | 72.3 |
| (C) GAGZA | 851 | 112–851 | 44.6 |
| (D) GAGZAu | 534 | 99–602 | 22.2 |
| Sample | C% • | H% • | N% • | Zn% •• | Al% •• | Gd% •• | Au% •• | /% •• | Drug% • |
|---|---|---|---|---|---|---|---|---|---|
| Zn/Al-LDH | - | - | 7.3 | 45 | 5.2 | - | - | 0.1 | - |
| GAGZA-Au | 8.714 | 2.186 | 0.4208 | 8.82 | 1.02 | 1.56 | 3.0 | 0.1 | 50 |
© 2017 by the authors. Licensee MDPI, Basel, Switzerland. This article is an open access article distributed under the terms and conditions of the Creative Commons Attribution (CC BY) license (http://creativecommons.org/licenses/by/4.0/).
Share and Cite
Sani Usman, M.; Hussein, M.Z.; Fakurazi, S.; Masarudin, M.J.; Ahmad Saad, F.F. Gadolinium-Doped Gallic Acid-Zinc/Aluminium-Layered Double Hydroxide/Gold Theranostic Nanoparticles for a Bimodal Magnetic Resonance Imaging and Drug Delivery System. Nanomaterials 2017, 7, 244. https://doi.org/10.3390/nano7090244
Sani Usman M, Hussein MZ, Fakurazi S, Masarudin MJ, Ahmad Saad FF. Gadolinium-Doped Gallic Acid-Zinc/Aluminium-Layered Double Hydroxide/Gold Theranostic Nanoparticles for a Bimodal Magnetic Resonance Imaging and Drug Delivery System. Nanomaterials. 2017; 7(9):244. https://doi.org/10.3390/nano7090244
Chicago/Turabian StyleSani Usman, Muhammad, Mohd Zobir Hussein, Sharida Fakurazi, Mas Jaffri Masarudin, and Fathinul Fikri Ahmad Saad. 2017. "Gadolinium-Doped Gallic Acid-Zinc/Aluminium-Layered Double Hydroxide/Gold Theranostic Nanoparticles for a Bimodal Magnetic Resonance Imaging and Drug Delivery System" Nanomaterials 7, no. 9: 244. https://doi.org/10.3390/nano7090244