Article

Synthesis of Ordered Mesoporous CuO/CeO2 Composite Frameworks as Anode Catalysts for Water Oxidation

by
Vassiliki Markoulaki Ι
,
Ioannis T. Papadas
,
Ioannis Kornarakis
and
Gerasimos S. Armatas
*
Department of Materials Science and Technology, University of Crete, Vassilika Vouton, Heraklion 71003, Greece
*
Author to whom correspondence should be addressed.
Nanomaterials 2015, 5(4), 1971-1984; https://doi.org/10.3390/nano5041971
Submission received: 29 September 2015 / Revised: 9 November 2015 / Accepted: 10 November 2015 / Published: 17 November 2015
(This article belongs to the Special Issue Frontiers in Mesoporous Nanomaterials)

Abstract

:
Cerium-rich metal oxide materials have recently emerged as promising candidates for the photocatalytic oxygen evolution reaction (OER). In this article, we report the synthesis of ordered mesoporous CuO/CeO2 composite frameworks with different contents of copper(II) oxide and demonstrate their activity for photocatalytic O2 production via UV-Vis light-driven oxidation of water. Mesoporous CuO/CeO2 materials have been successfully prepared by a nanocasting route, using mesoporous silica as a rigid template. X-ray diffraction, electron transmission microscopy and N2 porosimetry characterization of the as-prepared products reveal a mesoporous structure composed of parallel arranged nanorods, with a large surface area and a narrow pore size distribution. The molecular structure and optical properties of the composite materials were investigated with Raman and UV-Vis/NIR diffuse reflectance spectroscopy. Catalytic results indicated that incorporation of CuO clusters in the CeO2 lattice improved the photochemical properties. As a result, the CuO/CeO2 composite catalyst containing ~38 wt % CuO reaches a high O2 evolution rate of ~19.6 µmol·h−1 (or 392 µmol·h−1·g−1) with an apparent quantum efficiency of 17.6% at λ = 365 ± 10 nm. This OER activity compares favorably with that obtained from the non-porous CuO/CeO2 counterpart (~1.3 µmol·h−1) and pure mesoporous CeO2 (~1 µmol·h−1).

Graphical Abstract

1. Introduction

The oxygen evolution reaction (OER) is a key chemical process in various electrochemical devices, such as rechargeable metal-air batteries and solar fuels. However, OER kinetics hinder the electrochemical oxidation of water to oxygen (2H2O → 4H+ + 4e + O2) and, thus, the overall efficiency of water splitting. This is due to the energetic cost (activation energy and enthalpy of adsorption) required for the dissociation of HO species participating in the OER and the formation of O–O bonds [1,2]. Over the past few years, a diverse range of metal-oxide semiconductors has been synthesized and extensively studied as anode catalysts for oxygen gas production. Typical examples are precious metal oxides, such as RuO2 and IrO2 [3], perovskites, such as BiFeO3 [4] and SrTiO3 [5], and transition-metal oxides (including hydroxides), such as BiVO4 [6], CoOx [7], MnOx [8], FeOx [8] and WO3 [9]. Nevertheless, thus far, little work has been conducted on the synthesis of highly porous rare-earth metal oxides and the investigation of their OER performance. These materials, although showing low solar light absorption (i.e., absorbing light in the UV region), have received special attention in the fields of photovoltaics and photocatalysis because of their excellent electrical conductivity, chemical stability and reversible redox activity [10,11].
In this work, we present the synthesis, structural characterization and OER photocatalytic properties of ordered mesoporous frameworks composed of cerium(IV) oxide and copper oxide (CuO) compounds. Nanostructured CeO2-based materials have drawn attention as promising catalysts for CO oxidation [12,13], water-gas shift reaction [14] and degradation of organic pollutants [15]. Moreover, as an n-type semiconductor (Eg ~ 3–3.2 eV) with strong redox capability, CeO2 has also been used as an active component in several energy storage and conversion systems, including solar cells [16], solid oxide fuel cells [17,18] and solar hydrogen evolution devices [19,20]. To produce the mesoporous binary CuO–CeO2 oxides, we used a hard templating technique. The templated synthesis via the nano-replication route appears to be a versatile method to build porous multicomponent metal oxide materials [21]. In general, this method involves infiltration of suitable metal precursors within the nanopores of a solid template (e.g., carbon or silica) and thermal decomposition/solidification at elevated temperature. The resulting mesoporous solids, left after removal of the template by chemical etching or calcination, feature a three-dimensional (3D) nanoscale porous structure with a regular size and shape imparted by the template pore morphology. The obtained CuO/CeO2 heterostructures possess a 3D open-pore structure with a large internal surface area and exhibit good performance in photocatalytic oxidation of water. Our catalytic results showed that the 38% CuO-loaded CeO2 catalyst affords much higher OER activity than the other mesoporous composites, as well as the non-porous CuO/CeO2 counterpart and pure mesoporous CeO2, giving an oxygen evolution rate of ~19.6 μmol·h−1 under UV-Vis light irradiation.

2. Experimental Section

2.1. Synthesis of Mesoporous Silica

Hexagonal mesoporous Santa Barbara Amorphous-15 (SBA-15) silica was prepared under hydrothermal treatment at 100 °C for 2 days, according to the method reported by Zhu et al. [22]. This procedure uses 3 wt % poly(vinyl alcohol) solution to improve mesopore connectivity. The silica template was characterized by X-ray diffraction (XRD) (Figure S1) and N2 physisorption (Figure S2) measurements. The SBA-15 material was pretreated in air at room temperature for 2 days to increase the hydrophilic nature of the pore surface.

2.2. Synthesis of Mesoporous CuO/CeO2 Composites

In a typical preparation of mesoporous CuO/CeO2 composites, 1.1 mmol of metal nitrates, Ce(NO3)3·6H2O (≥99.5%, Alfa Aesar, Karlsruhe, Germany) and Cu(NO3)2·5H2O (98%, Alfa Aesar, Karlsruhe, Germany), were pre-mixed with 0.15 g of SBA-15 silica in 1.5 mL of hexane. The resulting viscous mixture was ground with an agate mortar for about 30 min to yield a fine paste, dispersed in 5 mL of hexane (≥99.5%, Sigma-Aldrich, Darmstadt, Germany) and, subsequently, stirred for 12 h under reflux at 70 °C. The solid product was isolated by filtration, washed with hexane and dried at 70 °C for 12 h. The resulting powder was then heated to 500 °C (2 deg·min−1 ramping rate) for 5 h to decompose the metal nitrate precursors. Finally, the silica matrix was selectively removed by treating two times with 2 M NaOH solution at room temperature for 2 h each time. The amount of Cu(NO3)2·5H2O used in the reactions was varied between 100, 132, 185 and 205 mg to gives a series of mesoporous CuO(x)/CeO2 materials with a different loading amount of CuO, i.e., x ~ 16, 26, 38 and 45 wt %, respectively, according to the EDS analysis. For the comparison, mesoporous CeO2 (denoted as mp-CeO2) was prepared following a similar procedure, but using dried (at 150 °C for 3 h) mesoporous SBA-15 silica as the template and without the addition of copper(II) nitrate. Nonporous CuO/CeO2 composite with ~38 wt % of CuO content (denoted as b-CuO(38)/CeO2) was also prepared by direct calcination (500 °C, 5 h) of copper(II) and cerium(III) nitrate salts as the reference material.

2.3. Physical Characterization

The XRD patterns were collected on a PANalytical X´Pert Pro MPD X-ray diffractometer operated at 45 kV and 40 mA using Cu Kα radiation (λ = 1.5406 Å) in the Bragg–Brentano geometry. Nitrogen adsorption–desorption isotherms were measured at liquid N2 temperature (77 K) on a NOVA 3200e volumetric analyzer (Quantachrome, Boynton Beach, FL, USA). Before analysis, samples were degassed overnight at 150 °C under vacuum (<10−5 Torr) to remove moisture. The specific surface areas were calculated using the Brunauer–Emmett–Teller (BET) method [23] on the adsorption data in the 0.06–0.25 relative pressure (P/Po) range. The total pore volumes were derived from the adsorbed volume at P/Po = 0.99, and the pore size distributions were obtained by the nonlocal density functional theory (NLDFT) method [24] based on the adsorption data. Elemental microprobe analyses were performed using a JEOL scanning electron microscopy (SEM) system (Model JSM-6390LV, Tokyo, Japan) equipped with an Oxford INCA PentaFETx3 energy-dispersive X-ray spectroscopy (EDS) detector (Oxfordshire, UK). Data acquisition was performed at least four times for each sample using an accelerating voltage of 20 kV and a 100-s accumulation time. Transmission electron microscopy (TEM) was performed using a JEOL Model JEM-2100 (Tokyo, Japan) electron microscope (LaB6 filament) operated at an accelerating voltage of 200 kV. Samples were prepared by sonicating the finely-ground powder in ethanol and depositing a drop of the resulting mixture onto a Cu grid covered with carbon film. Raman spectroscopy was performed at room temperature using a Nicolet Almega XR micro-Raman spectrometer (Thermo Scientific, Hudson, NH, USA) equipped with a 473 nm blue laser (15 mW) as an excitation source. UV-Vis/near-IR diffuse reflectance spectra were obtained on a Perkin Elmer Lambda 950 optical spectrophotometer (Baesweiler, Germany), using an integrating sphere. BaSO4 powder was used as a reflectance standard (100%), and the reflectance data were converted to absorption using the Kubelka–Munk equation: a/S = (1 − R)2/(2R), where R is the reflectance and a and S are the absorption and scattering coefficients, respectively.

2.4. Photocatalytic OER Reactions

The photocatalytic water oxidation reactions were carried out in a water-cooled (20 ± 2 °C) quartz reaction vessel (100 mL) using a 300-W Xe lamp (Variac Cermax, Wiesbaden, Germany). In a typical experiment, 50 mg of the catalyst were dispersed, with stirring, in 50 mL of aqueous solution containing 0.1 M NaOH and 0.02 M Na2S2O8. The reaction mixture was first purged with Ar flow for at least 40 min to ensure complete air removal and then irradiated with UV-Vis light (λ > 360 nm). The produced O2 was analyzed by gas chromatography (Shimadzu GC-2014, TCD detector, Ar carrier gas, Kyoto, Japan). In our studies, all of the examined catalysts yielded a stable colloidal dispersion in water, possibly due to the hydrophilic surface and small size of the particles; typical SEM images showed small agglomerates consisting of several primary particles with sizes of ~0.4–0.5 μm for mp-CeO2 and ~0.3 μm for CuO(38)/CeO2 (Figure S3).
For the quantum efficiency and UV-Vis photon conversion efficiency calculations, the average intensity of incident light was measured using a StarLite power meter equipped with a FL400A-BB-50 fan-cooled thermal sensor (Ophir Optronics Ltd, Jerusalem, Israel). The average intensity of irradiation was measured to be 41.6 mW·cm−2 using a bandpass filter of λ = 365 ± 10 nm (Asahi Spectra, Tokyo, Japan), and the intensity of irradiation in the wavelength range 360–780 nm was measured as 0.51 W·cm−2.

3. Results and Discussion

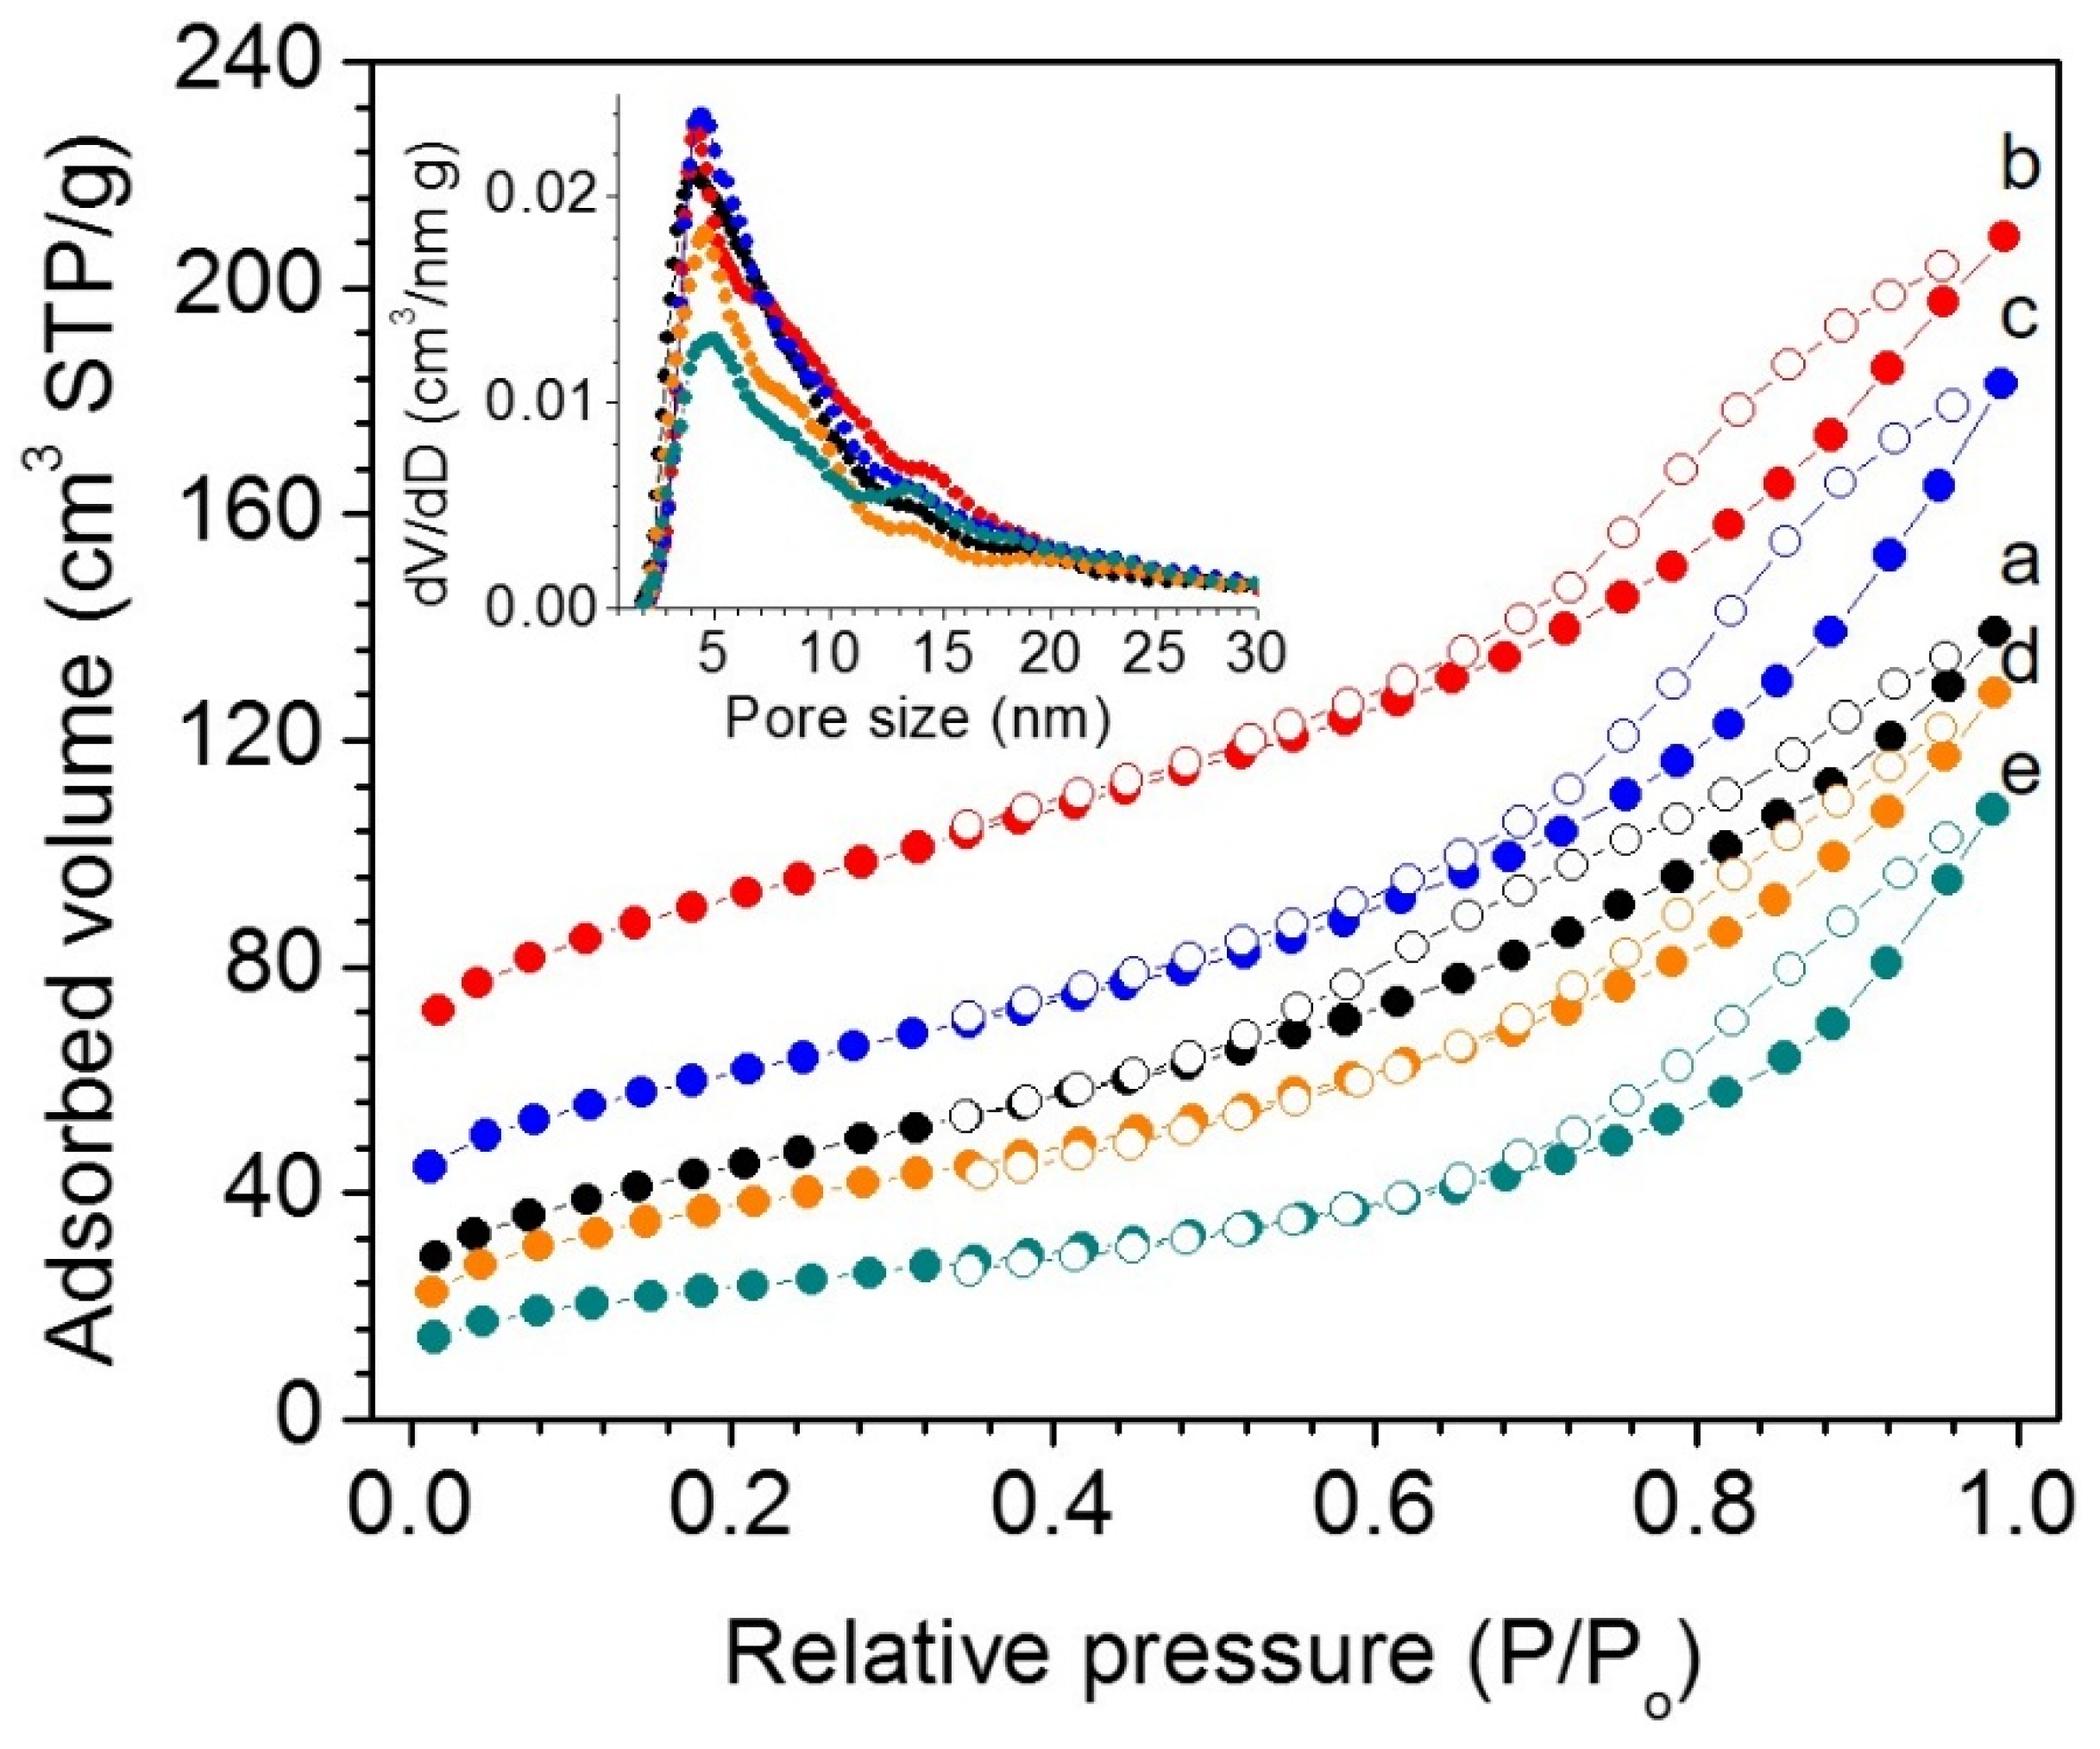
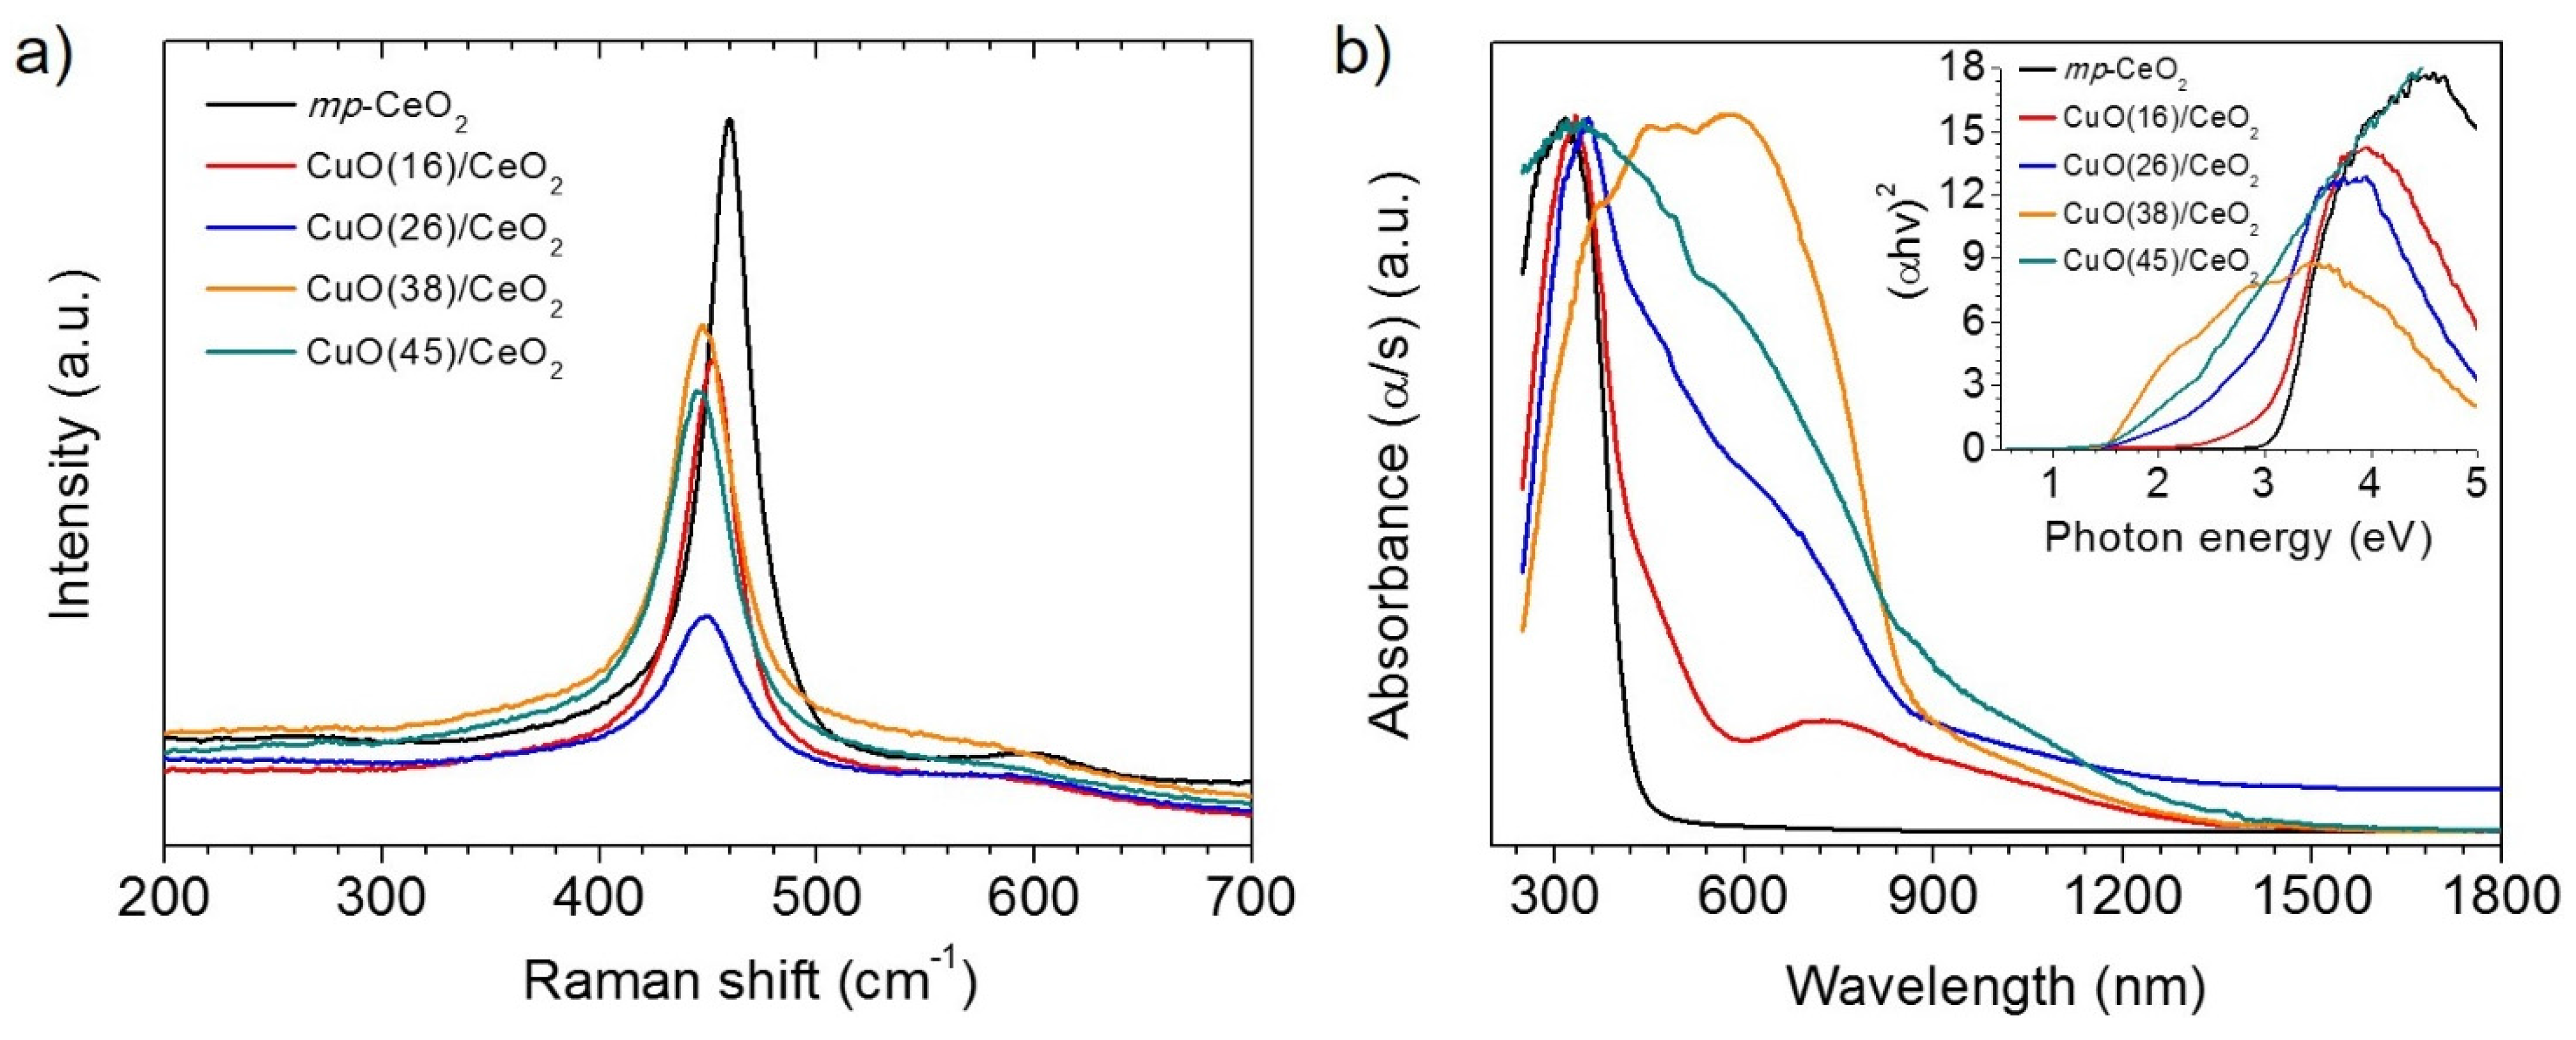
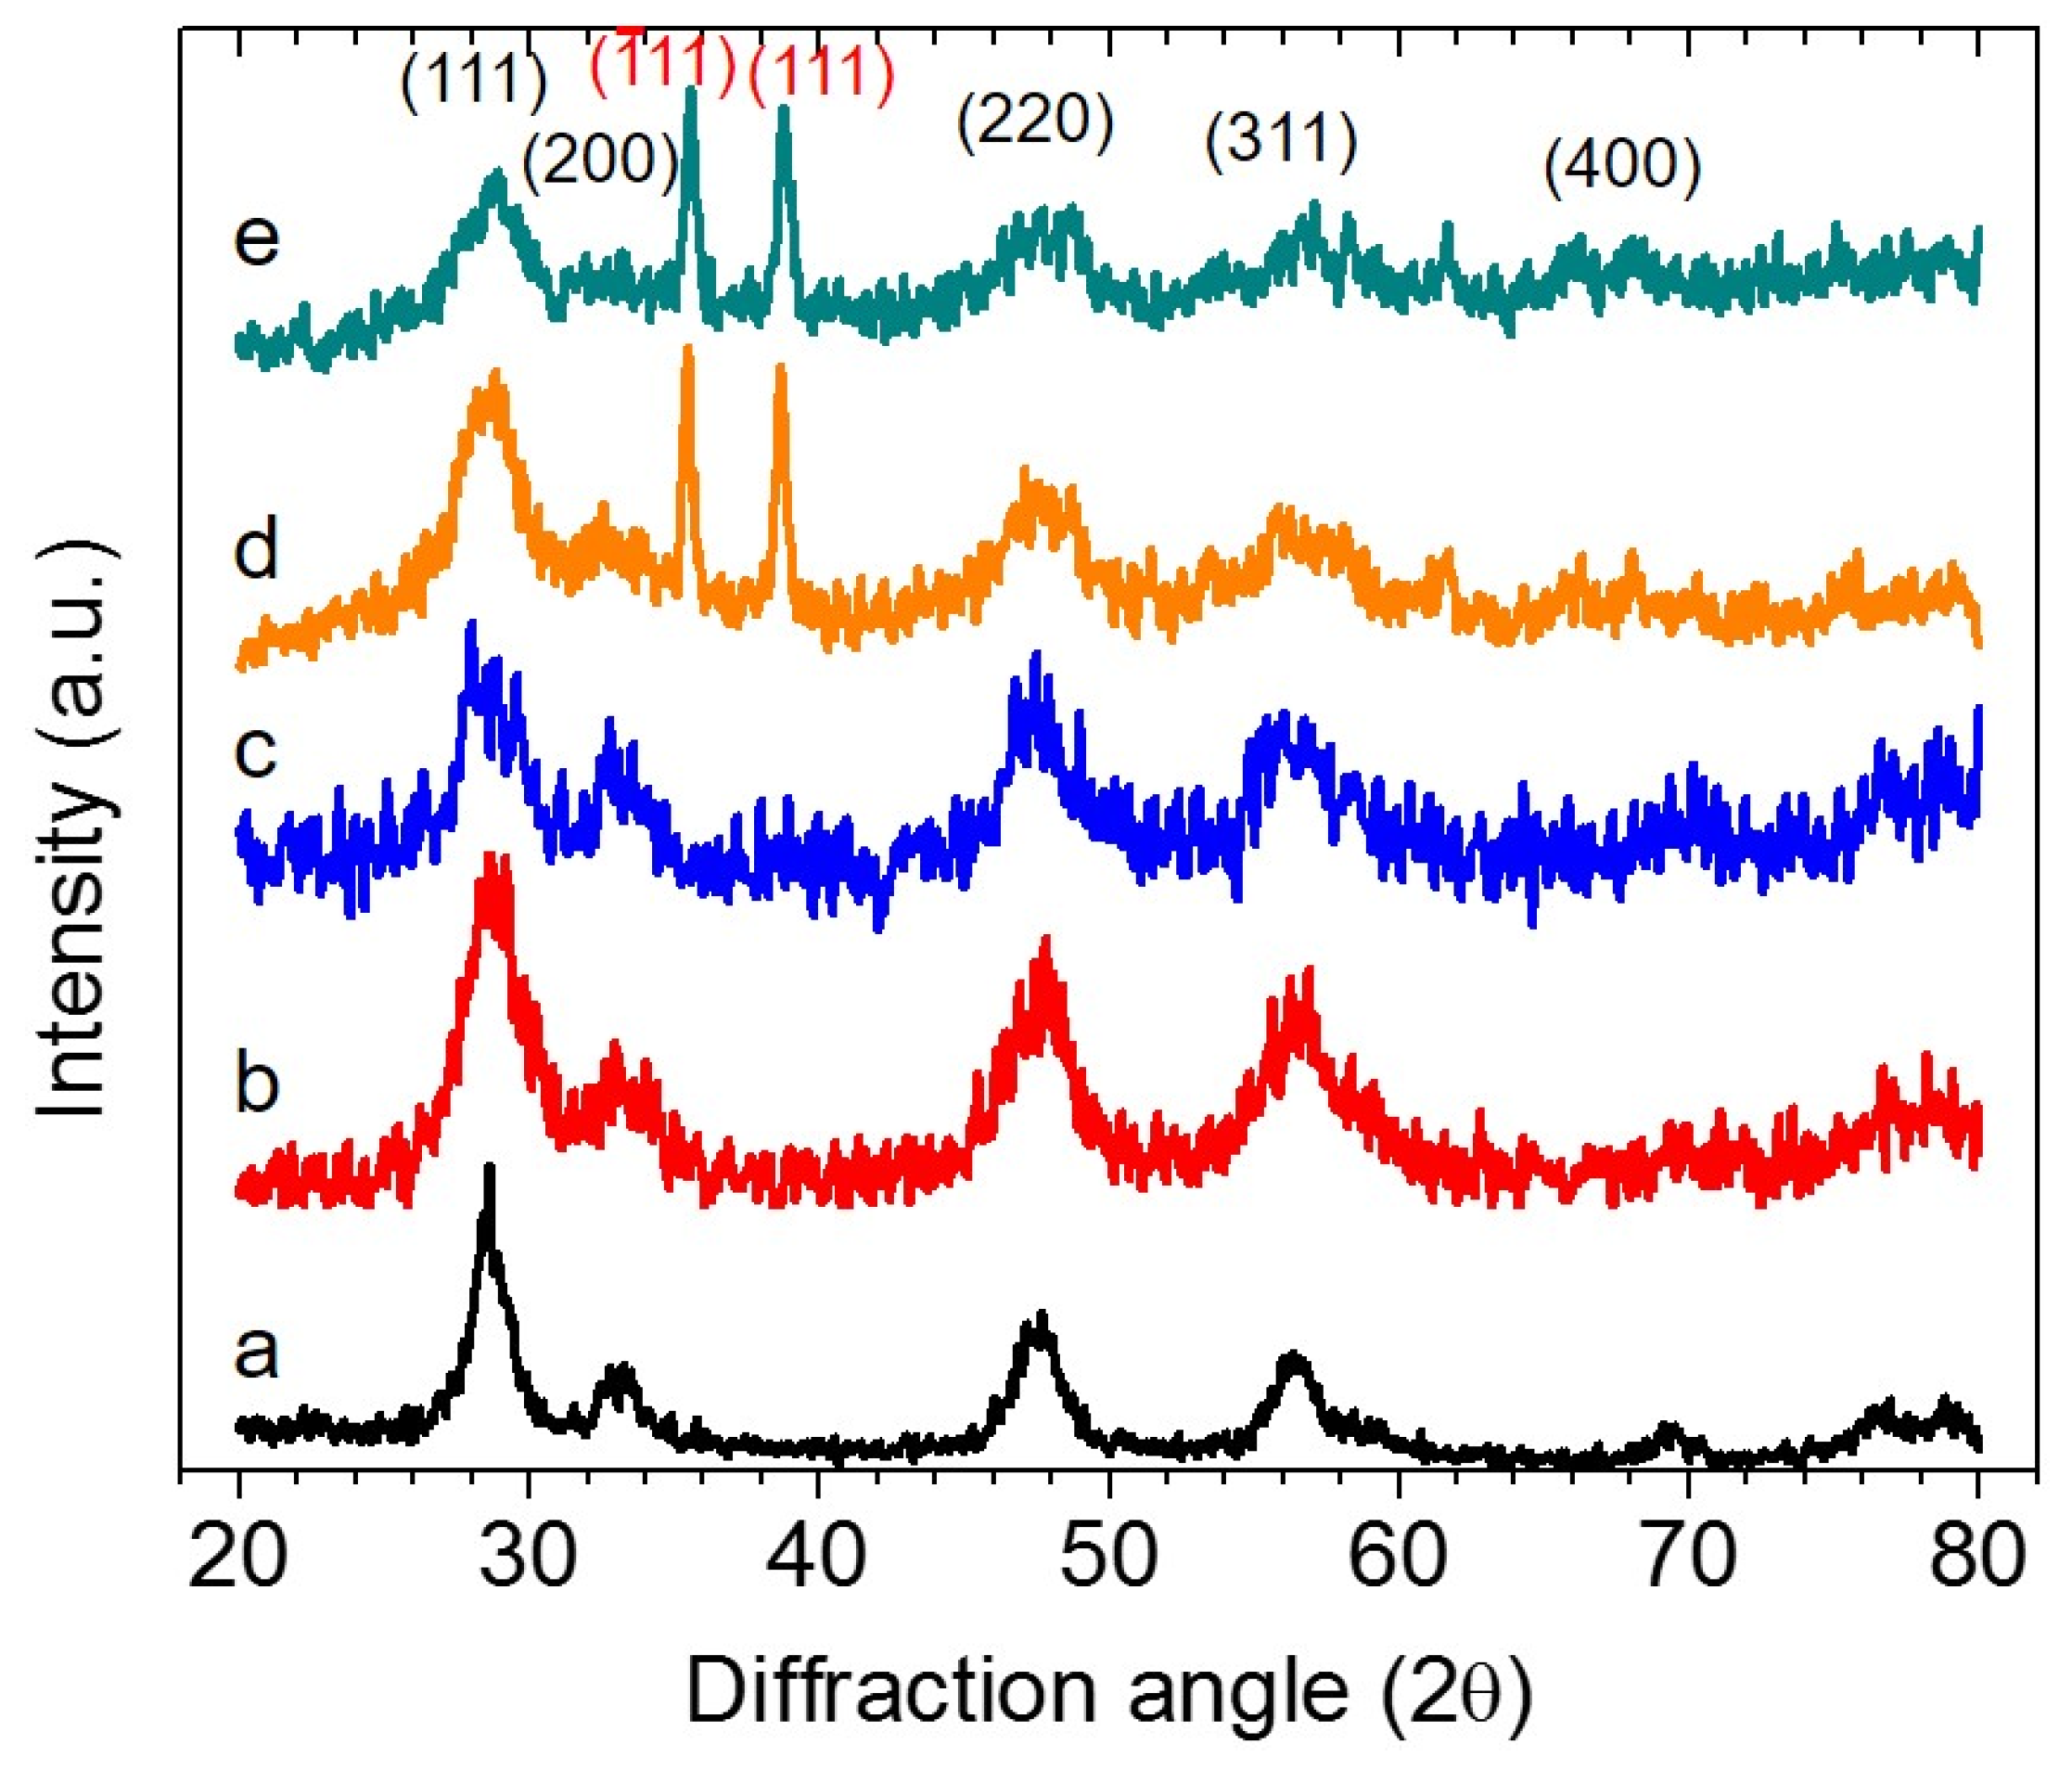
3.1. Morphology and Structural Properties
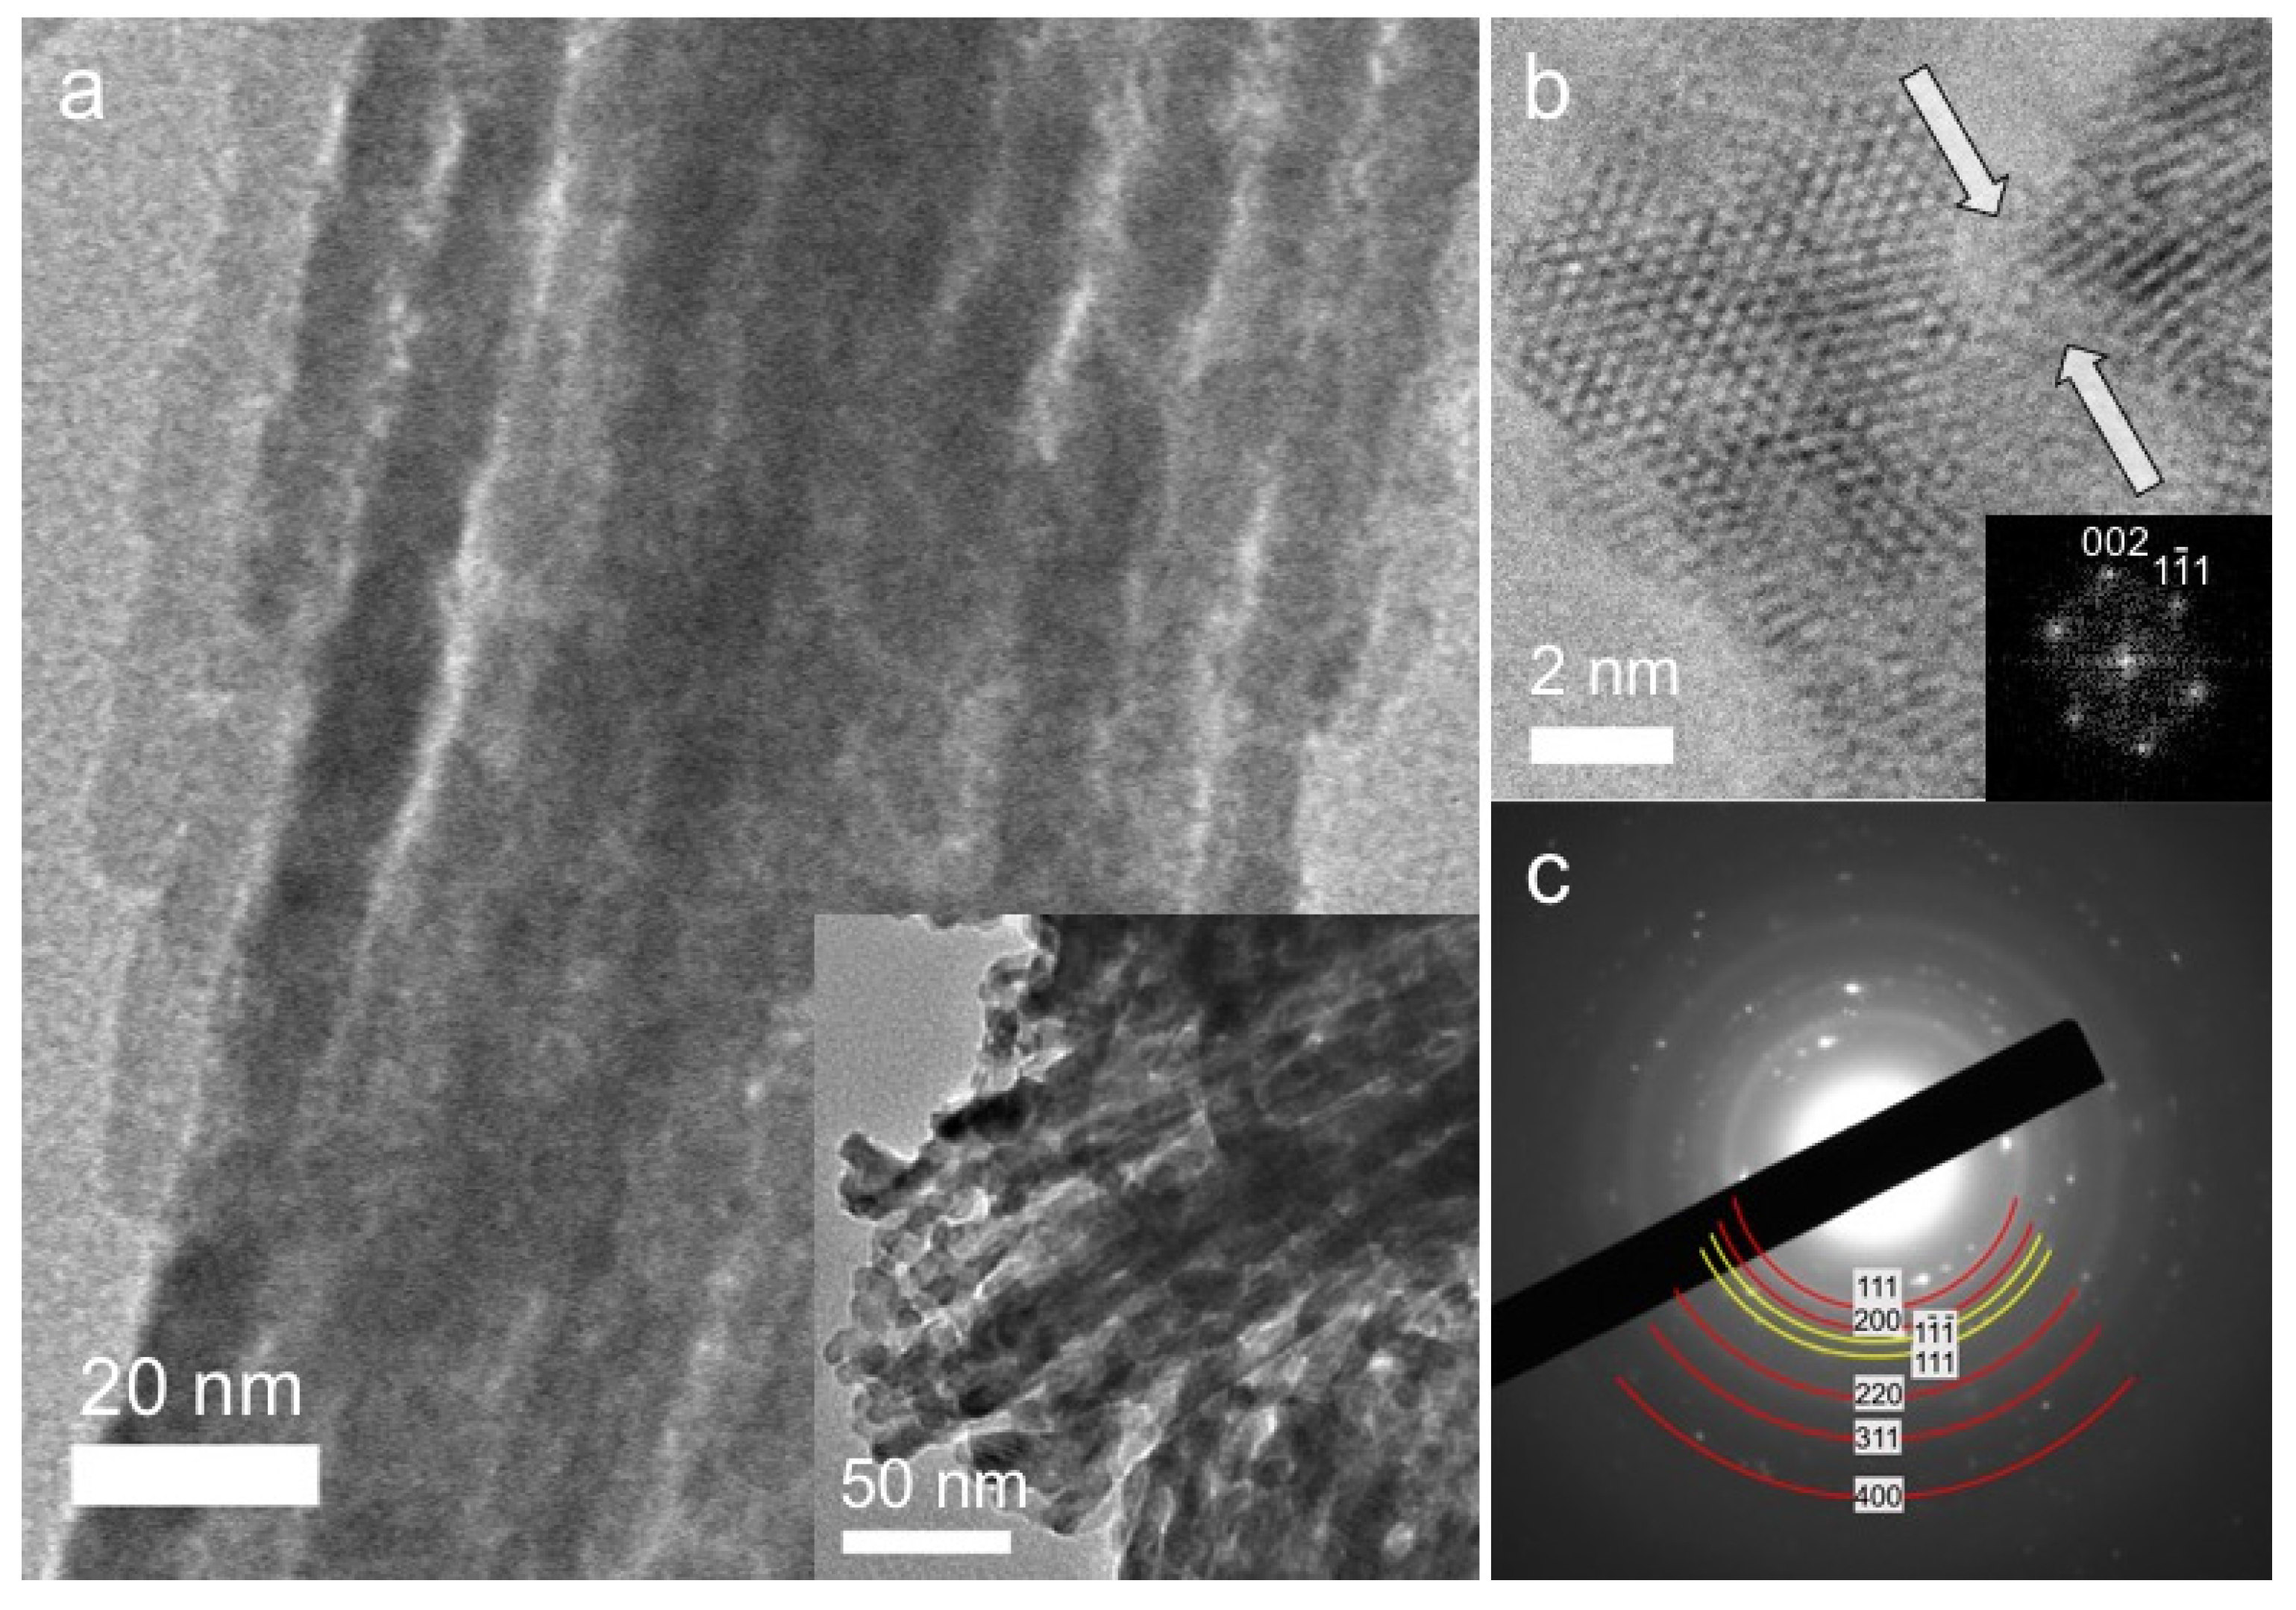
The chemical composition of CuO/CeO2 mesoporous materials was determined by energy dispersive X-ray spectroscopy (EDS). The EDS analysis of the different samples showed the presence of Ce and Cu in an atomic ratio from 0.56 to 2.45, which corresponds to ~16, ~26, ~38 and ~45 wt % of CuO loading; see Table 1. Note here that the CuO contents, as obtained by EDS, are consistently slightly lower than those expected from the stoichiometry of reactions (by 2–3 wt %) probably due to the insufficient infiltration of copper nitrate compounds into the silica template and dissolution of the CuO particles during the template removal process. All of the EDS spectra also showed a weak signal from Si, which is consistent with less than 5 wt % of the SiO2 residue remaining in products.
The mesoporous structure of the templated materials was investigated with transmission electron microscopy (TEM) and X-ray diffraction (XRD). Typical TEM images of the mesoporous CuO(38)/CeO2 sample are provided in Figure 1a. It can be seen that the CuO(38)/CeO2 mesostructure is constructed of uniform nanorods parallel to each other, consistent with the (110) direction of the hexagonal structure of the silica template. On the basis of the TEM analysis, the average diameter of nanorods was found to be ~8 nm, which is fairly close to the pore diameter of the silica template (~9.8 nm; Figure S2), indicating good replication of the silica mesostructure. For the investigation of the crystal structure of CuO(38)/CeO2, high-resolution TEM (HRTEM) images and selected-area electron diffraction (SAED) pattern were reordered. HRTEM taken from a thin area of the mesoporous framework shows well-resolved lattice fringes of (002) and ( 1 1 ¯ 1 ) planes of CeO2 with a d-spacing of 2.7 Å and 3.1 Å, respectively (Figure 1b). The image also shows connecting bridges between the nanorods, which attest to the structural coherence of the porous product. Figure 1c shows the typical SAED pattern of the mesoporous CuO(38)/CeO2. The SAED pattern depicts several Debye–Scherrer diffraction rings that can be indexed to the crystal planes of the CeO2 fluorite-type structure (marker with red lines) and the monoclinic lattice of CuO (marker with yellow lines).
Figure 1. (a) Typical transmission electron microscopy (TEM) images; (b) High-resolution TEM image (the inset shows the corresponding FFT pattern indexed as the (110) zone axis of cubic CeO2) and (c) Selected-area electron diffraction (SAED) pattern of the mesoporous CuO(38)/CeO2 material. In (b), the white arrowheads indicate the bridge region between neighboring nanorods.
Nanomaterials 05 01971 g001
Table 1. Analytical data and textural properties of mesoporous CeO2 (mp-CeO2) and CuO/CeO2 composite materials.
SampleAtomic Ratio a (Ce:Cu)CuO Loading (wt %)Surface Area (m2·g−1)Pore Volume (cm3·g−1)Pore Size (nm)Crystal Size b (nm)Energy Gap (eV)
mp-CeO2 1420.214.15.73.14
CuO(16)/CeO271:29161640.254.23.43.03
CuO(26)/CeO256:44261500.244.63.22.83
CuO(38)/CeO243:57381350.204.73.31.51
CuO(45)/CeO236:6445830.174.83.21.50
a Based on the energy dispersive X-ray spectroscopy (EDS) analysis; b CeO2 crystallite size based on the Scherrer equation D = 0.9λ/βcosθ, where λ is the wavelength of the X-rays and β is the width (full-width at half-maximum) of the X-ray diffraction peak centering at a 2θ angle.
Figure 2 presents wide-angle XRD patterns of the mesoporous mp-CeO2 and CuO/CeO2 materials. It is proven that the nanocast products comprise crystallites of CeO2 and CuO with a small grain size. All of the XRD patterns display several broad Bragg diffraction peaks that can be readily indexed as (111), (200), (220), (311) and (400) diffractions of CeO2 with a fluorite-type structure (JCPDF No. 34–0394). The average domain size of the CeO2 crystallites calculated from Scherrer’s equation [25] and the broadening of the primary (111) peak is about 5 nm for mp-CeO2 and 3–4 nm for the CuO/CeO2 composites. The reduction in crystallite size for composite materials can be attributed to the inhibited grain growth of CeO2 during the conversion process due to the presence of CuO particles; such particles may be located near the grain boundaries, resulting in the formation of nanostructured CeO2 islands. In addition to CeO2 diffractions, the XRD patterns of CuO(38)/CeO2 and CuO(45)/CeO2 materials show intense peaks at ~35.5° ( 1 ¯ 11 ) and ~38.7° (111) due to the crystalline phase of CuO (JCPDS No. 5-0661; space group: C2/c), indicating that copper(II) oxide species are growth within the CeO2 matrix. The structural assignment based on XRD is also collaborated by TEM experiments. The fact that CuO reflections in the XRD profiles of low CuO-loaded samples (CuO(16)/CeO2 and CuO(26)/CeO2) are not visible can be explained by the small grain size and high dispersion of CuO clusters in the ceria lattice.
Figure 2. X-ray diffraction (XRD) patterns of mesoporous (a) mp-CeO2; (b) CuO(16)/CeO2; (c) CuO(26)/CeO2; (d) CuO(38)/CeO2 and (e) CuO(45)/CeO2 materials.
Nanomaterials 05 01971 g002
To evaluate porosity, the surface area and pore size of as-prepared materials were determined using N2 physisorption at 77 K. Figure 3 shows the N2 adsorption–desorption isotherms and the corresponding pore size distribution plots for mesoporous mp-CeO2 and CuO/CeO2 materials. All isotherms exhibit typical type-IV curves with an H3-type hysteresis loop, suggesting mesoporous structures with slit-like pores [26]. The mesoporous CuO/CeO2 composites were found to have Brunauer–Emmett–Teller (BET) surface areas in the range of 83–164 m2·g−1 and total pore volumes in the range of 0.17–0.25 cm3·g−1, while the mesoporous mp-CeO2 exhibited a surface area of 142 m2·g−1 and a total pore volume of 0.21 cm3·g−1. For composite samples with a moderate amount of CuO (less than 26 wt %), the increase in the surface area with the increase of CuO content could be attributed to the lower mass density of incorporated CuO (6.3 g·cm−3) relative to CeO2 (7.2 g·cm−3). As for the high CuO-loaded sample, CuO(45)/CeO2, the reduction of surface area and pore volume can be interpreted as a partial destruction of the pore structure. The pore width in as-prepared materials was determined by using the pore size analysis of the nonlocal density functional theory (NLDFT) adsorption model for slit-shaped pores and was found to be ~4–5 nm (inset of Figure 3). This pore size reflects the void space between the interconnected nanorods. The broad shoulder at 9–11 nm associated the pore size distributions corresponds to the large voids between the partially-interconnected nanorods. Table 1 summarizes the textural properties of mesoporous mp-CeO2 and CuO/CeO2 composite materials.
Figure 3. Nitrogen adsorption–desorption isotherms at 77 K and the corresponding nonlocal density functional theory (NLDFT) pore-size distribution plots calculated from the adsorption branch (inset) for mesoporous (a) mp-CeO2; (b) CuO(16)/CeO2; (c) CuO(26)/CeO2; (d) CuO(38)/CeO2 and (e) CuO(45)/CeO2 materials (STP: standard temperature and pressure). For clarity, the isotherms of (a), (b) and (c) are offset by 5, 40 and 20 cm3·g−1, respectively.
Nanomaterials 05 01971 g003
In order to investigate the molecular and electronic structure of these CuO/CeO2 composites, we performed Raman and diffuse reflectance ultraviolet-visible/near-IR (UV-Vis/NIR) spectroscopy analysis. Raman spectroscopy is an intriguing tool to probe the crystal structure of oxide materials. The Raman spectra of mp-CeO2 and CuO/CeO2 materials, shown in Figure 4a, display an intense peak in the 445–459 cm−1 region that corresponds to the symmetrical stretching mode of {CeO8} units present in the CeO2. Compared to the Raman spectrum of mp-CeO2, the Ce–O absorption peak of composite samples shifts slightly to lower wavenumbers and becomes wider with increasing CuO content. This is due to the lattice distortion and the formation of framework defects (Ce3+ sites and oxygen vacancies) [27,28]. The broad band between 585 cm−1 and 600 cm−1 is associated with oxygen vacancies in the CeO2 lattice [29]. Evidence of CuO absorption was obtained from the Raman spectra of high CuO-loaded samples (i.e., CuO(38)/CeO2 and CuO(45)/CeO2). The shift at 276 cm−1 in these spectra can be assigned to the one-phonon A1g mode of CuO [30].
Figure 4. (a) Raman spectra and (b) ultraviolet-visible/near-IR (UV-Vis/NIR) diffuse reflectance spectra for mesoporous mp-CeO2 and CuO/CeO2 composite samples. Inset of (b) is the corresponding (αhv)2 versus energy curves, where α is the absorption coefficient, h is Planck’s constant and v is the light frequency.
Nanomaterials 05 01971 g004
The UV-Vis/NIR absorption spectrum of mp-CeO2, transformed from the diffuse reflection data according to the Kubelka–Munk method, displays a sharp optical absorption edge at around 395 nm, which is associated with an energy gap at 3.14 eV (Figure 4b). This absorption is interpreted by the O2p → Ce4f electron transition in CeO2. Compared to mp-CeO2, the mesoporous CuO/CeO2 samples showed a significant red-shift in the absorption edge and absorb light in the visible region. In particular, the energy band gap of CuO/CeO2 varies systematically from 3.03 eV to 1.50 eV with increasing the CuO content. This behavior is probably due to the creation of oxygen vacancies in the CeO2 lattice, which allow the formation of the localized energy states between the O 2p (valence band) and Ce 4f states [31], as well as the incorporation of excessive CuO particles that absorb light in the near-infrared region of the spectrum (Eg ~ 1.5 eV).

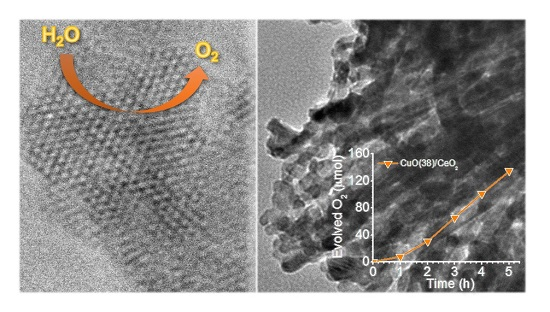
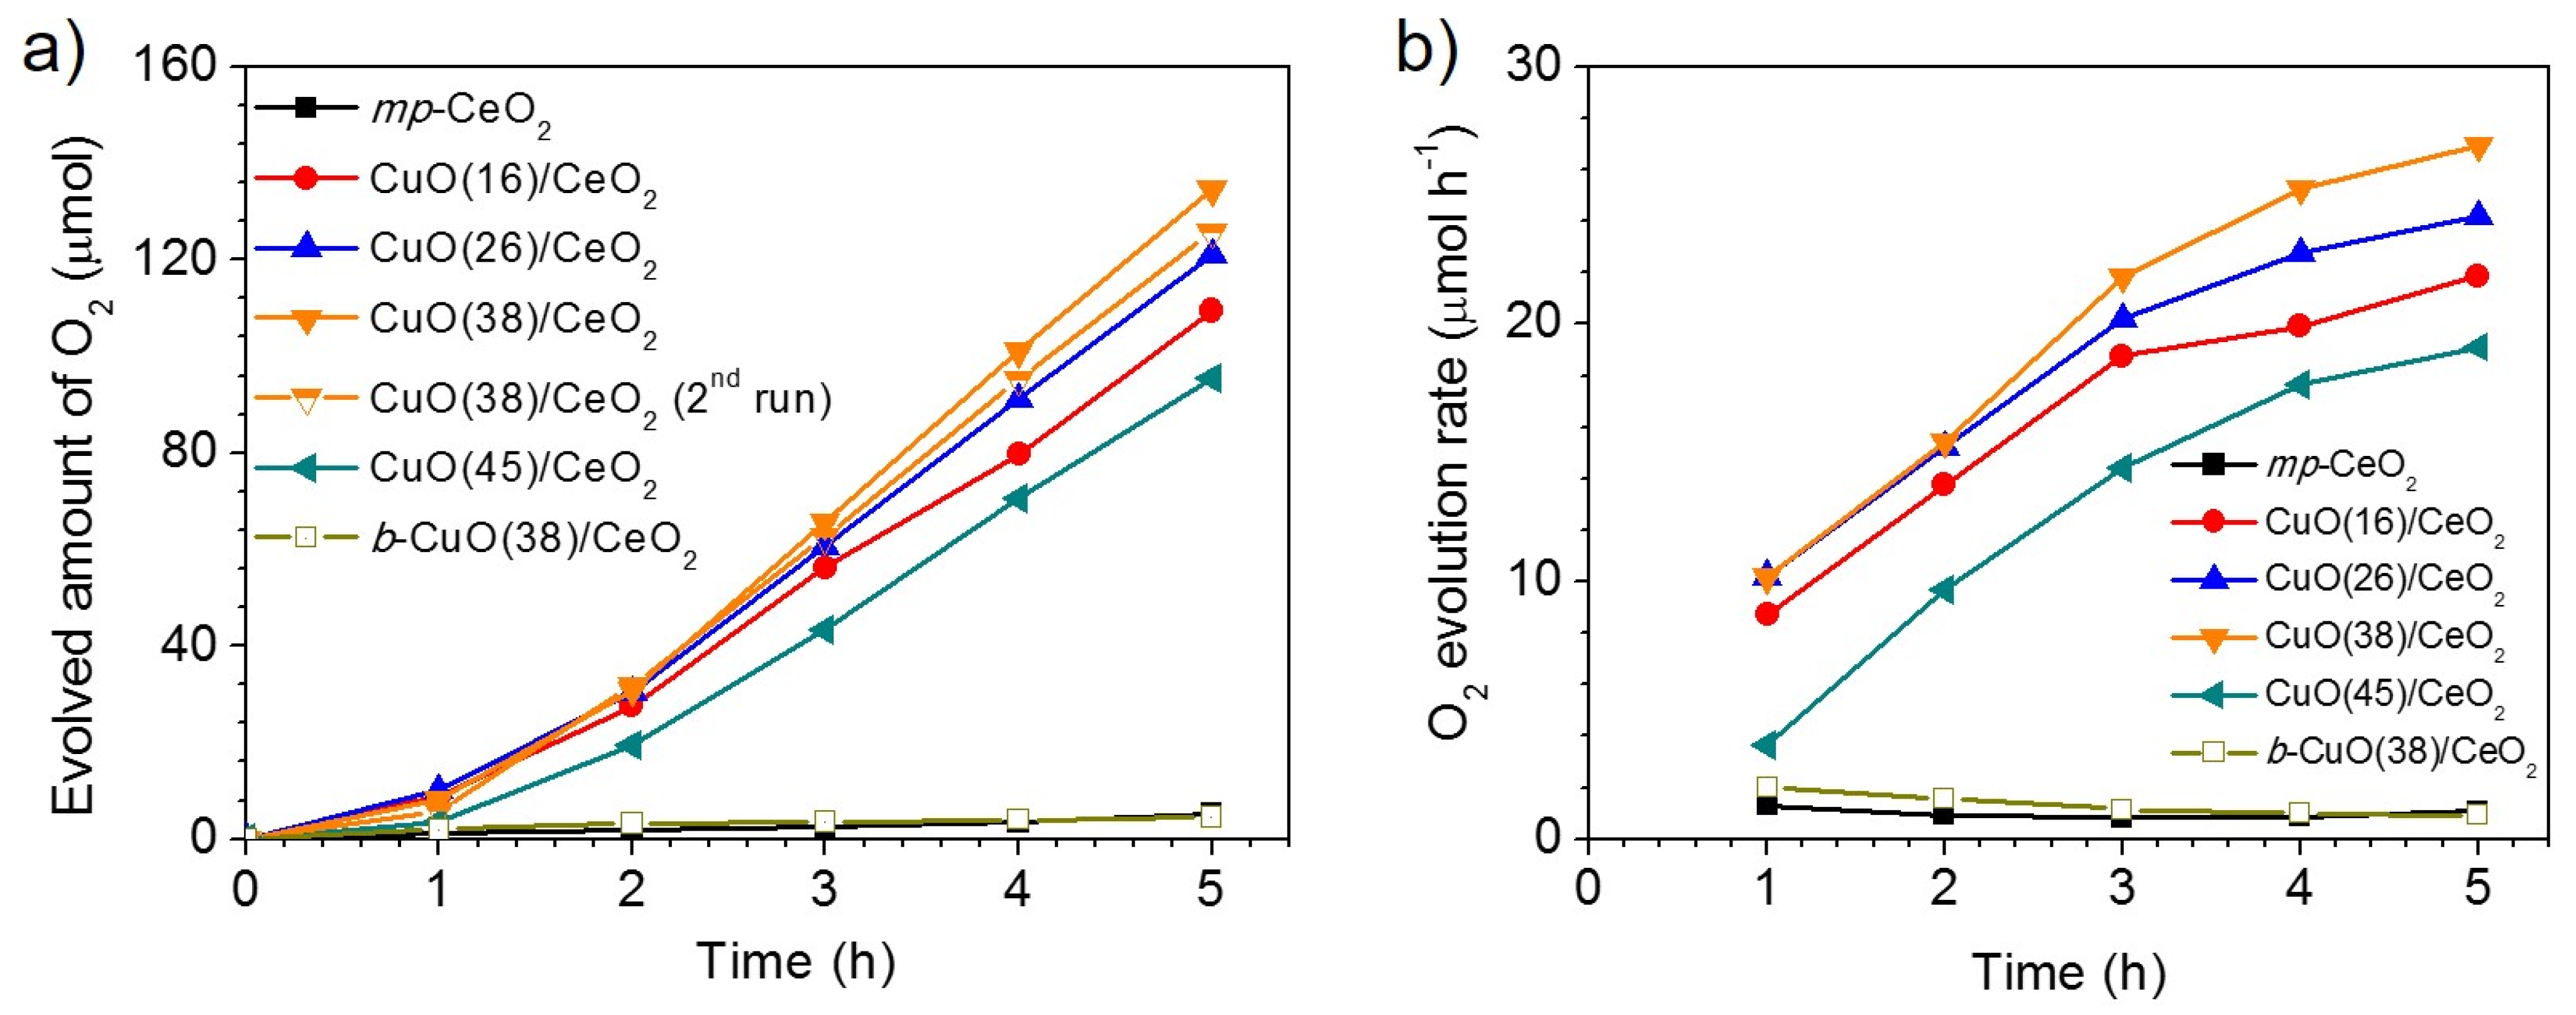
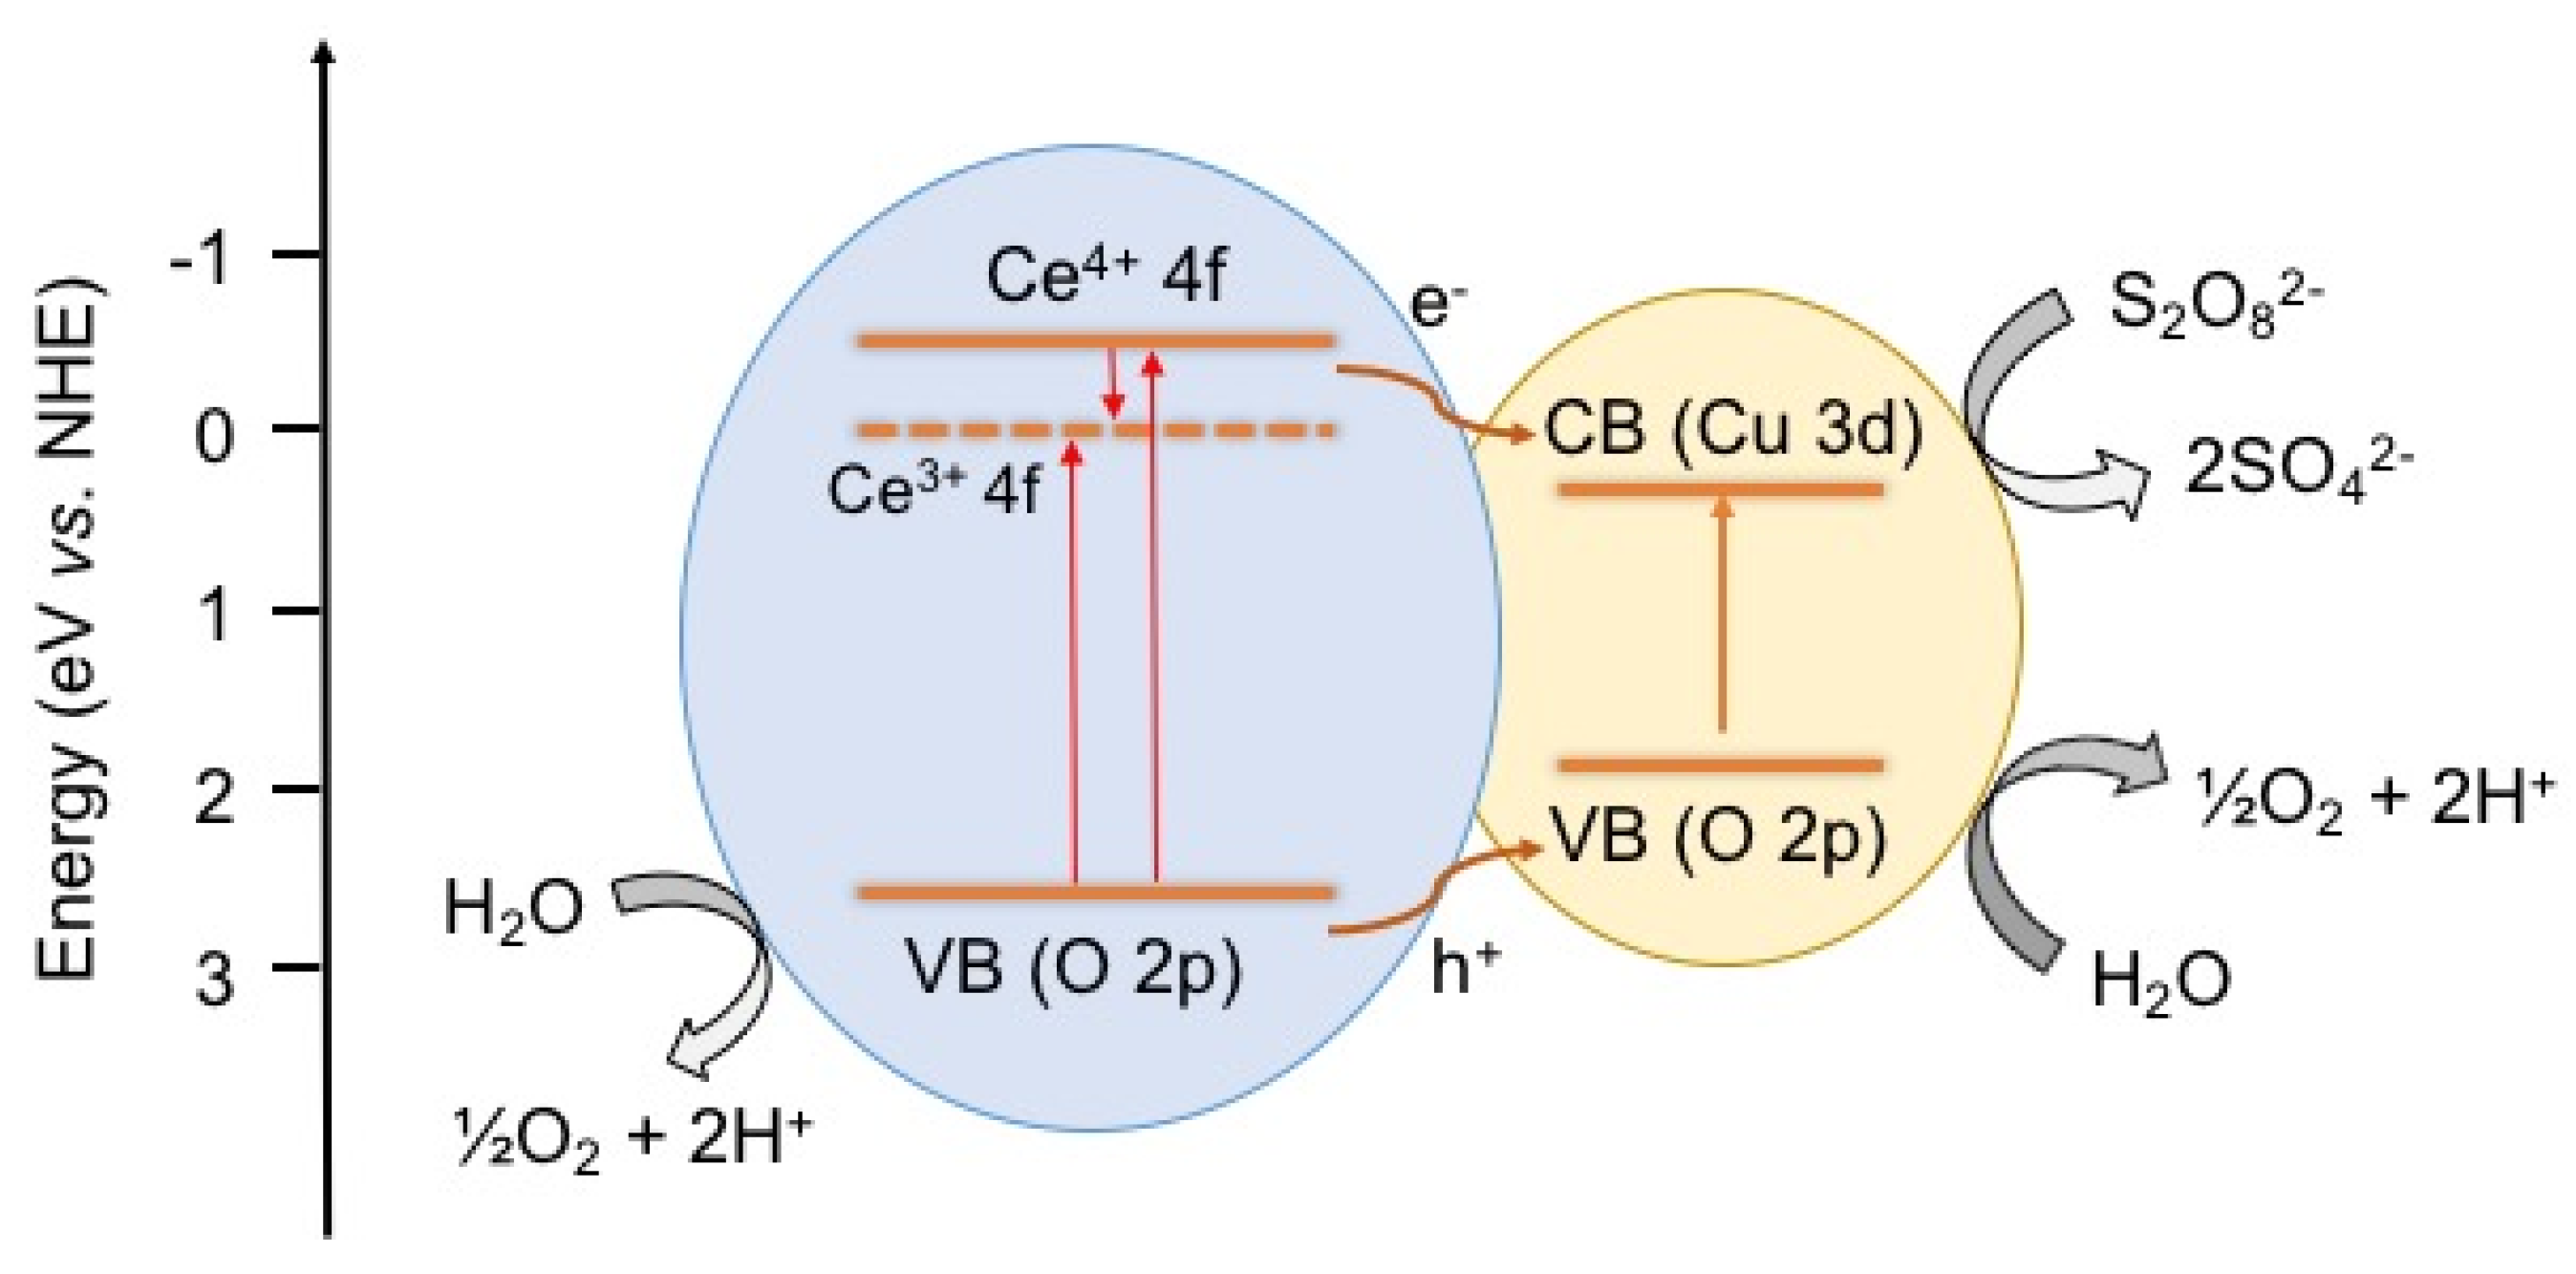
3.2. Photocatalytic OER Reactions

We assessed the OER properties of CuO/CeO2 mesoporous materials in the UV-Vis light (λ > 360 nm)-irradiated oxidation of water using S2O82− as the sacrificial electron acceptor. Similar OER measurements for the pure mesoporous CeO2 (mp-CeO2) and non-templated b-CuO(38)/CeO2 samples were also performed for comparison. The oxygen evolution data in Figure 5a indicate that the mesoporous CuO/CeO2 composite containing a CuO content of ~38 wt % achieves higher OER activity than other examined catalysts, presenting an average O2 evolution rate of ~19.6 µmol·h−1 (or 392 µmol·h−1·g−1) with an apparent quantum efficiency (QE) of 17.6% at λ = 365 ± 10 nm and an incident photon conversion efficiency of around 1.3% under UV-visible light illumination (360–780 nm). The intrinsic OER activity of the examined catalysts was also examined by turnover frequency (TOF), assuming that every atom in the sample is involved in catalysis (Table 2). The mesoporous CuO(38)/CeO2 was found to exhibit the highest TOF of ~2.23 × 10⁻⁵ s1. Remarkably, this OER activity represents a significant improvement compared to that of mesoporous mp-CeO2 (~1 µmol·h−1, TOF ~1.01 × 10⁻⁶ s−1), which indicates that the presence of CuO makes a significant contribution to enhancing the photocatalytic activity.
Figure 5. (a) Oxygen evolution curves and (b) time courses of photocatalytic O2 evolution rates for mesoporous mp-CeO2 and CuO/CeO2 composite materials and bulk b-CuO(38)/CeO2 solid.
Nanomaterials 05 01971 g005
Table 2. Oxygen evolution reaction (OER) photocatalytic activity of the mesoporous mp-CeO2 and CuO/CeO2 materials and bulk b-CuO(38)/CeO2 solid.
CatalystO2 Evolution Rate (µmol·h−1)Evolved O2, 5 h (µmol)TOF a (s−1)
mp-CeO21.05.31.01 × 10−6
CuO(16)/CeO216.7109.51.77 × 10−5
CuO(26)/CeO218.5120.91.89 × 10−5
CuO(38)/CeO219.6 (0.9) b134.72.23 × 10−5
CuO(45)/CeO213.195.61.24 × 10−5
b-CuO(38)/CeO21.36.78.88 × 10−7
a The turnover frequency (TOF) is defined as the number of O2 molecules produced per second per number of atoms in the catalyst; b Average O2 evolution rate under visible light irradiation (λ > 420 nm).
The kinetics of O2 evolution, shown in Figure 5b, indicate that the OER rate of composite samples increases over time, reaching, for example, a value of 26.9 µmol·h−1 after 5 h of illumination over the CuO(38)/CeO2 catalyst. This suggests the high propensity of the CuO/CeO2 materials to oxidize water. Control experiments revealed that no appreciable O2 evolution occurred when the reaction is conducted in dark or without catalyst or Na2S2O8, indicating that oxygen was produced by photocatalytic reactions. The greatly-improved OER activity of the CuO(38)/CeO2 catalyst is presumably a result of the synergistic action of CeO2 and CuO components. Specifically, we postulated that incorporation of CuO compounds within the CeO2 matrix can retard the recombination of photogenerated electrons and holes due to the interfacial electron transfer from CeO2 to CuO, thus enhancing photocatalytic performance. In addition, the introduction of CuO could be helpful for the formation of Ce3+ species (by the formation of framework oxygen defects) on the surface of CeO2; such species are recognized as active sites to enable OER activity [32]. Even through the incorporation of CuO particles in the CeO2 matrix can enhance the visible light absorption of CuO/CeO2 composites by introducing mid-gap states, it does not seem to be a reliable explanation for the increased photoactivity. As we will show, the CuO/CeO2 materials exhibit little photocatalytic activity under visible light. Therefore, we can conclude that when the loading amount of CuO increased, more CuO–CeO2 junctions and oxygen vacancies are formed in the CeO2 structure, resulting in the spatial separation of electron-hole pairs and the increase of the OER activity. The presence of oxygen vacancies in the lattice of CeO2 was also confirmed by Raman spectroscopy. As for the low OER activity of the overloaded CuO(45)/CeO2 sample, the CuO particles presumably shield a large part of the available CeO2 surface and, thus, cause the decrease of photocatalytic efficiency.
Photocatalytic water oxidation was also studied using visible light (λ > 420 nm) in order to examine if the CuO(38)/CeO2 catalyst works for visible energy conversion. It was found that CuO(38)/CeO2 exhibits an O2 evolution rate of ~0.9 µmol·h−1 under these conditions, which is much lower than that under UV-Vis light illumination. From the above observation, it appears that excitation of CuO alone (as CeO2 does not absorb light in the visible range) did not result in appropriate photocatalytic O2 production, and therefore, both CeO2 and CuO components are necessary for the CuO/CeO2 to absorb photons and trigger the photochemical process. Scheme 1 shows a schematic overview of the photocatalytic water oxidation reaction by mesoporous CuO/CeO2. First, photoexcited electrons (e) and holes (h+) are generated, respectively, in the conduction band (CB) and valence band (VB) of both CeO2 and CuO under UV-Vis light illumination. Because of the potential gradient at the CuO–CeO2 interface, the photogenerated electrons on the Ce 4f orbitals of CeO2 can transfer to the CB of CuO and be consumed by the sacrificial agents S2O82−; meanwhile, the photogenerated holes in the VB of CeO2 and CuO could effectively oxidize water to produce O2. As noted above, the Ce3+ cations in the CeO2 lattice (because of the presence of oxygen vacancies) may also act as electron-trap states to prevent the rapid recombination of photogenerated electrons and holes.
Scheme 1. Photocatalytic O2 production mechanism on the CuO/CeO2 interface under UV-Vis light irradiation (VB: valence band, CB: conduction band, NHE: normal hydrogen electrode).
Nanomaterials 05 01971 g006
In addition, the superior OER activity of mesoporous CuO(38)/CeO2 could be attributed to the nanosized framework and highly accessible surface area, which favors easy diffusion of electrolytes. Evidence for this was obtained by comparing the OER activity of mesoporous CuO(38)/CeO2 to that of the non-templated, bulk counterpart (b-Cu(38)/CeO2). EDS, XRD and N2 physisorption measurements indicated that b-Cu(38)/CeO2 have similar composition and the same crystal structure as mesoporous CuO(38)/CeO2, but exhibit a low surface area (ca. 42 m2·g−1) (results not shown). As shown in Figure 5a, the non-templated b-Cu(38)/CeO2 catalyst exhibits poor photocatalytic OER activity with an average O2 evolution rate of ~1.3 µmol·h−1 over a 5-h period (TOF ~8.88 × 10⁻⁷ s−1), much lower than that of mesoporous analogues. Table 2 summarizes the OER activity data of the photocatalysts studied. We note that the OER activity of CuO(38)/CeO2 (~392 µmol·h−1·g−1) compares favorably with that obtained for Au/BiFeO3 nanowires (~380 µmol·h−1·g−1) [33], Pt/SrTiO3:Rh microparticles (~137 µmol·h−1·g−1) [34] and Au/CeO2 nanoparticles (~233 µmol·h−1·g−1) [35] and approaches that of the mesoporous Au/BiFeO3 heterostructure (~586 µmol·h−1·g−1) [4].
Moreover, the CuO(38)/CeO2 catalyst is stable and did not decompose during the photocatalytic process. As shown in Figure 5a, the CuO(38)/CeO2 manifested almost the same O2 production activity (within the experimental error) after two repeated runs. The total amount of O2 produced after 10 h of illumination is ~260.5 µmol (or ~5.8 mL), which is consistent with an average OER rate of ~26 µmol·h−1. Elemental X-ray microanalysis, X-ray diffraction and N2 adsorption–desorption isotherms confirmed that the reused catalyst maintains the chemical composition and textural properties of the fresh CuO(38)/CeO2 material. EDS results showed that the CuO content in reused sample was ~36 wt %, while the XRD data indicated the presence of cubic CeO2 and monoclinic CuO phases in the composite structure (Figure S4). The nitrogen adsorption isotherm evidenced no change in the mesoporous structure after 10 h of catalysis, showing a surface area of 131 m2·g−1 and a pore volume of 0.19 cm3·g−1 (Figure S5).

4. Conclusions

In summary, mesoporous CuO/CeO2 composite semiconductors have been successfully prepared via a nano-replication technique, using mesoporous silica (SBA-15) as a solid template. X-ray diffraction, high-resolution TEM and nitrogen physisorption measurements evidenced that the resultant materials are composed of a parallel arrangement of uniform nanorods and exhibit high BET surface areas and narrow-sized mesopores. The presence of CuO particles within the mesoporous matrix was confirmed by Raman spectroscopy, while the visible light response of CuO/CeO2 heterostructures was verified with diffuse reflectance UV-Vis/NIR spectroscopy. Catalytic results showed that mesoporous CuO/CeO2 materials are active catalysts for O2 production via UV-Vis light-driven water oxidation. At a CuO content of ~38 wt %, the CuO/CeO2 catalyst exerts a high O2 evolution rate of ~19.6 mol·h−1 (or 392 µmol·h−1·g−1) with a QE of 17.6% at λ = 365 ± 10 nm and incident photon conversion efficiency of 1.3% in the 360–780 nm range. The high OER activity is attributed to the presence of Ce3+ states (due to the oxygen vacancies) and CuO–CeO2 junctions that prevent rapid electron-hole recombination and the high specific surface area that promotes fast mass-transfer kinetics. These results demonstrate the potential of the CuO/CeO2 mesoporous heterostructures to serve as efficient and stable anodes for photocatalytic oxygen production.

Supplementary Materials

Supplementary materials can be accessed at: https://www.mdpi.com/2079-4991/5/4/1971/s1.

Acknowledgments

Financial support by the Greek Ministry of Education under the Excellence grant (ARISTEIA-2691) and Thales project (MIS 377365) is gratefully acknowledged.

Author Contributions

V.I.M. performed the synthesis and characterization of mesoporous materials. I.T.P. conducted the photocatalytic experiments. I.K. contributed to efficiency calculations. G.S.A. supervised the experimental work, performed result analysis, and wrote the manuscript.

Conflicts of Interest

The authors declare no conflict of interest.

References

  1. Subbaraman, R.; Tripkovic, D.; Chang, K.C.; Strmcnik, D.; Paulikas, A.P.; Hirunsit, P.; Chan, M.; Greeley, J.; Stamenkovic, V.; Markovic, N.M. Trends in activity for the water electrolyser reactions on 3d M(Ni,Co,Fe,Mn) hydr(oxy)oxide catalysts. Nat. Mater. 2012, 11, 550–557. [Google Scholar] [CrossRef] [PubMed]
  2. Nakamura, R.; Okamura, T.; Ohashi, N.; Imanishi, A.; Nakato, Y. Molecular Mechanisms of Photoinduced Oxygen Evolution, PL Emission, and Surface Roughening at Atomically Smooth (110) and (100) n-TiO2 (Rutile) Surfaces in Aqueous Acidic Solutions. J. Am. Chem. Soc. 2005, 127, 12975–12983. [Google Scholar] [CrossRef] [PubMed]
  3. Wang, G.; Zhang, L.; Zhang, J. A review of electrode materials for electrochemical supercapacitors. Chem. Soc. Rev. 2012, 41, 797–828. [Google Scholar] [CrossRef] [PubMed]
  4. Papadas, I.T.; Christodoulides, J.A.; Kioseoglou, G.; Armatas, G.S. A high surface area ordered mesoporous BiFeO3 semiconductor with efficient water oxidation activity. J. Mater. Chem. A 2015, 3, 1587–1593. [Google Scholar] [CrossRef]
  5. Shi, J.; Ye, J.; Ma, L.; Ouyang, S.; Jing, D.; Guo, L. Site-Selected Doping of Upconversion Luminescent Er3+ into SrTiO3 for Visible-Light-Driven Photocatalytic H2 or O2 Evolution. Chem. Eur. J. 2012, 18, 7543–7551. [Google Scholar] [CrossRef] [PubMed]
  6. Kim, T.W.; Choi, K.-S. Nanoporous BiVO4 Photoanodes with Dual-Layer Oxygen Evolution Catalysts for Solar Water Splitting. Science 2014, 343, 990–994. [Google Scholar] [CrossRef] [PubMed]
  7. Bajdich, M.; García-Mota, M.; Vojvodic, A.; Nørskov, J.K.; Bell, A.T. Theoretical Investigation of the Activity of Cobalt Oxides for the Electrochemical Oxidation of Water. J. Am. Chem. Soc. 2013, 135, 13521–13530. [Google Scholar] [CrossRef] [PubMed]
  8. Trotochaud, L.; Ranney, J.K.; Williams, K.N.; Boettcher, S.W. Solution-Cast Metal Oxide Thin Film Electrocatalysts for Oxygen Evolution. J. Am. Chem. Soc. 2012, 134, 17253–17261. [Google Scholar] [CrossRef] [PubMed]
  9. Liu, B.; Kuo, C.-H.; Chen, J.; Luo, Z.; Thanneeru, S.; Li, W.; Song, W.; Biswas, S.; Suib, S.L.; He, J. Ligand-Assisted Co-Assembly Approach toward Mesoporous Hybrid Catalysts of Transition-Metal Oxides and Noble Metals: Photochemical Water Splitting. Angew. Chem. Int. Ed. 2015, 54, 9061–9065. [Google Scholar] [CrossRef] [PubMed]
  10. Muccillo, E.N.S.; Rocha, R.A.; Tadokoro, S.K.; Rey, J.F.Q.; Muccillo, R.; Steil, M.C. Electrical Conductivity of CeO2 Prepared from Nanosized Powders. J. Electroceramics 2004, 13, 609–612. [Google Scholar] [CrossRef]
  11. Melchionna, M.; Fornasiero, P. The role of ceria-based nanostructured materials in energy applications. Mater. Today 2014, 17, 349–357. [Google Scholar] [CrossRef]
  12. Serre, C.; Garin, F.; Belot, G.; Marie, G. Reactivity of Pt/Al2O3 and Pt-CeO2Al2O3 Catalysts for the Oxidation of Carbon Monoxide by Oxygen: II. Influence of the Pretreatment Step on the Oxidation Mechanism. J. Catal. 1993, 141, 9–20. [Google Scholar] [CrossRef]
  13. Shen, W.; Dong, X.; Zhu, Y.; Chen, H.; Shi, L. Mesoporous CeO2 and CuO-loaded mesoporous CeO2: Synthesis, characterization, and CO catalytic oxidation property. Micropor. Mesopor. Mater. 2005, 85, 157–162. [Google Scholar] [CrossRef]
  14. Wen, C.; Zhu, Y.; Ye, Y.; Zhang, S.; Cheng, F.; Liu, Y.; Wang, P.; Tao, F. Water–Gas Shift Reaction on Metal Nanoclusters Encapsulated in Mesoporous Ceria Studied with Ambient-Pressure X-ray Photoelectron Spectroscopy. ACS Nano 2012, 6, 9305–9313. [Google Scholar] [CrossRef] [PubMed]
  15. Ji, P.; Zhang, J.; Chen, F.; Anpo, M. Ordered Mesoporous CeO2 Synthesized by Nanocasting from Cubic Ia3d Mesoporous MCM-48 Silica: Formation, Characterization and Photocatalytic Activity. J. Phys. Chem. C 2008, 112, 17809–17813. [Google Scholar] [CrossRef]
  16. Corma, A.; Atienzar, P.; Garcia, H.; Chane-Ching, J.-Y. Hierarchically mesostructured doped CeO2 with potential for solar-cell use. Nat. Mater. 2004, 3, 394–397. [Google Scholar] [CrossRef] [PubMed]
  17. Yahiro, H.Y.; Baba, K.; Eguchi, H.; Arai, J. High Temperature Fuel Cell with Ceria-Yttria Solid Electrolyte. J. Electrochem. Soc. 1988, 135, 2077–2080. [Google Scholar] [CrossRef]
  18. Murray, E.P.; Tsai, T.; Barnett, S.A. A direct-methane fuel cell with a ceria-based anode. Nature 1999, 400, 649–651. [Google Scholar] [CrossRef] [PubMed]
  19. Lu, X.H.; Zhai, T.; Cui, H.N.; Shi, J.Y.; Xie, S.L.; Huang, Y.Y.; Liang, C.L.; Tong, Y.X. Redox cycles promoting photocatalytic hydrogen evolution of CeO2 nanorods. J. Mater. Chem. 2011, 21, 5569–5572. [Google Scholar] [CrossRef]
  20. Li, W.; Xie, S.; Li, M.; Ouyang, X.; Cui, G.; Lu, X.; Tong, Y. CdS/CeOx heterostructured nanowires for photocatalytic hydrogen production. J. Mater. Chem. A 2013, 1, 4190–4193. [Google Scholar] [CrossRef]
  21. Yen, H.; Seo, Y.; Guillet-Nicolas, R.; Kaliaguinec, S.; Kleitz, F. One-step-impregnation hard templating synthesis of high-surface-area nanostructured mixed metal oxides (NiFe2O4, CuFe2O4 and Cu/CeO2). Chem. Commun. 2011, 47, 10473–10475. [Google Scholar] [CrossRef] [PubMed]
  22. Zhu, J.; Kailasam, K.; Xie, X.; Schomaecker, R.; Thomas, A. High-Surface-Area SBA-15 with Enhanced Mesopore Connectivity by the Addition of Poly(vinyl alcohol). Chem. Mater. 2011, 23, 2062–2067. [Google Scholar] [CrossRef]
  23. Brunauer, S.; Deming, L.S.; Deming, W.E.; Teller, E. On a Theory of the van der Waals Adsorption of Gases. J. Am. Chem. Soc. 1940, 62, 1723–1732. [Google Scholar] [CrossRef]
  24. Ravikovitch, P.I.; Wei, D.; Chueh, W.T.; Haller, G.L.; Neimark, A.V. Evaluation of Pore Structure Parameters of MCM-41 Catalyst Supports and Catalysts by Means of Nitrogen and Argon Adsorption. J. Phys. Chem. B 1997, 101, 3671–3679. [Google Scholar] [CrossRef]
  25. Patterson, A. The Scherrer Formula for X-Ray Particle Size Determination. Phys. Rev. 1939, 56, 978–982. [Google Scholar] [CrossRef]
  26. Rouquerol, F.; Rouquerol, J.; Sing, K.S.W. Adsorption by Powders and Porous Solids. Principles Methodology and Applications; Academic Press: New York, NY, USA, 1999. [Google Scholar]
  27. Araújo, V.D.; Avansi, W.; de Carvalho, H.B.; Moreira, M.L.; Longo, E.; Ribeiroand, C.; Bernardi, M.I.B. CeO2 nanoparticles synthesized by a microwave-assisted hydrothermal method: Evolution from nanospheres to nanorods. CrystEngComm 2012, 14, 1150–1154. [Google Scholar] [CrossRef]
  28. Lu, X.; Zheng, D.; Zhang, P.; Liang, C.; Liu, P.; Tong, Y. Facile synthesis of free-standing CeO2 nanorods for photoelectrochemical applications. Chem. Commun. 2010, 46, 7721–7723. [Google Scholar] [CrossRef] [PubMed]
  29. Taniguchi, T.; Watanabe, T.; Sugiyama, N.; Subramani, A.K.; Wagata, H.; Matsushita, N.; Yoshimura, M. Identifying Defects in Ceria-Based Nanocrystals by UV Resonance Raman Spectroscopy. J. Phys. Chem. C 2009, 113, 19789–19793. [Google Scholar] [CrossRef]
  30. Wang, W.; Zhou, Q.; Fei, X.; He, Y.; Zhang, P.; Zhang, G.; Peng, L.; Xie, W. Synthesis of CuO nano- and micro-structures and their Raman spectroscopic studies. CrystEngComm 2010, 12, 2232–2237. [Google Scholar] [CrossRef]
  31. Wang, J.; Lin, S.; Han, Z.; Liu, Y. Glutamine-assisted synthesis of Cu-doped CeO2 nanowires with an improved low-temperature CO oxidation activity. RSC Adv. 2015, 5, 28619–28623. [Google Scholar] [CrossRef]
  32. Liang, F.; Yu, Y.; Zhou, W.; Xua, X.; Zhu, Z. Highly defective CeO2 as a promoter for efficient and stable water oxidation. J. Mater. Chem. A 2015, 3, 634–640. [Google Scholar] [CrossRef]
  33. Li, S.; Zhang, J.; Kibria, M.G.; Mi, Z.; Chaker, M.; Ma, D.; Nechache, R.; Rosei, F. Remarkably enhanced photocatalytic activity of laser ablated Au nanoparticle decorated BiFeO3 nanowires under visible-light. Chem. Commun. 2013, 49, 5856–5858. [Google Scholar] [CrossRef] [PubMed]
  34. Konta, R.; Ishii, T.; Kato, H.; Kudo, A. Photocatalytic Activities of Noble Metal Ion Doped SrTiO3 under Visible Light Irradiation. J. Phys. Chem. B 2004, 108, 8992–8995. [Google Scholar] [CrossRef]
  35. Primo, A.; Marino, T.; Corma, A.; Molinari, R.; García, H. Efficient Visible-Light Photocatalytic Water Splitting by Minute Amounts of Gold Supported on Nanoparticulate CeO2 Obtained by a Biopolymer Templating Method. J. Am. Chem. Soc. 2011, 133, 6930–6933. [Google Scholar] [CrossRef] [PubMed]

