Advanced Bio-Inspired System for Noninvasive Cuff-Less Blood Pressure Estimation from Physiological Signal Analysis


1
STMicroelectronics, ADG Group—Central R&D, 95121 Catania, Italy
2
Department of Mathematics and Computer Science, University of Catania, 95125 Catania, Italy
*
Author to whom correspondence should be addressed.
Computation 2018, 6(3), 46; https://doi.org/10.3390/computation6030046
Submission received: 30 July 2018
/
Revised: 20 August 2018
/
Accepted: 23 August 2018
/
Published: 28 August 2018
(This article belongs to the Section Computational Biology)
Abstract
:Blood Pressure (BP) is one of the most important physiological indicators that provides useful information in the field of health-care monitoring. Blood pressure may be measured by both invasive and non-invasive methods. A novel algorithmic approach is presented to estimate systolic and diastolic blood pressure accurately in a way that does not require any explicit user calibration, i.e., it is non-invasive and cuff-less. The approach herein described can be applied in a medical device, as well as in commercial mobile smartphones by an ad hoc developed software based on the proposed algorithm. The authors propose a system suitable for blood pressure estimation based on the PhotoPlethysmoGraphy (PPG) physiological signal sampling time-series. Photoplethysmography is a simple optical technique that can be used to detect blood volume changes in the microvascular bed of tissue. It is non-invasive since it takes measurements at the skin surface. In this paper, the authors present an easy and smart method to measure BP through careful neural and mathematical analysis of the PPG signals. The PPG data are processed with an ad hoc bio-inspired mathematical model that estimates systolic and diastolic pressure values through an innovative analysis of the collected physiological data. We compared our results with those measured using a classical cuff-based blood pressure measuring device with encouraging results of about 97% accuracy.
1. Introduction
Measurement of arterial Blood Pressure (BP) involves the computation of both Systolic (SBP) and Diastolic Blood Pressure (DBP), defined as the highest and lowest pressure values during a cardiac cycle. The main medical approach to measure BP is the so-called auscultatory method, where a physician inflates a cuff around the arm, and by means of a stethoscope, the measure of SBP and DBP is detected. Recent methods exploit digital devices for detecting both SBP and DBP. However, these device systems require the use of a cuff, which is invasive, costly and does not allow continuous monitoring. In this work, we consider cuff-less, non-invasive BP estimation based on advanced mathematical analysis of the PPG signal of the patient sampled through a Silicon Photomultiplier sensor (SiPM), which can be installed in a commercial medical device or just in a common mobile smartphone.
A PPG waveform comprises a pulsatile (“AC”) physiological waveform attributed to cardiac synchronous changes in the blood volume with each heart beat, and it is superimposed on a slowly-varying (“DC”) baseline containing lower frequency components attributed to respiration, thermoregulation, skin tissues, etc. For each cardiac cycle, the heart pumps blood to the periphery, and the pressure pulse reaches the skin, distending the arteries and arterioles in the subcutaneous tissue. If a light reflex/transmit detector device is attached over the skin, a pressure pulse can be seen from the venous plexus, as a small secondary peak. The change in volume caused by the pressure pulse is detected by illuminating the skin with the light from a Light-Emitting Diode (LED), and the transmitted or reflected light is measured by a photodetector, such as a photo-diode. Thus, each cardiac cycle appears as a peak. Since the blood flow to the skin can be modulated by other physiological systems, the PPG can also be used to monitor breathing, hyperglycemia, circulatory conditions, and so on. Moreover, the shape of the PPG waveform differs from subject to subject and varies with the location and manner in which the detecting device is attached. Despite the extensive activity in the area of PPG signal detection and processing, improved solutions facilitating the calculation of blood pressure values (both diastolic and systolic) from PPG signals are desirable.
In this work, we consider a cuff-less and non-invasive BP estimation based on advanced mathematical analysis of the PPG signal sampled through a SiPM that can be integrated in a common embedded device (medical or just in a mobile smartphone). The paper is organized as follows: an overview of the literature about non-invasive cuff-less BP estimation methods is presented in Section 2. A careful description of the system for PPG sampling is described in Section 3. Finally, the proposed algorithm and related results are presented in Section 4 and Section 5, respectively.
2. Related Works
It is well known that blood pressure can be estimated by the analysis of the waves produced at the heart propagated over the arteries. The Moens–Korteweg equation gives the pulse-wave velocity [1] as a function of vessel and fluid characteristics [2], as well as the arterial wall elasticity from which a measure of the average pressure may be obtained [3]. However, this approach (and similar ones based on analytic models) is inapplicable, as it requires the precise knowledge of some vessel physical parameters for each patient. In the literature, there are further approaches for non-invasive BP estimation comprising techniques based on PPG signals. In [4], the authors proposed an approach to non-invasive continuous blood pressure estimation based on Artificial Neural Networks (ANN) trained with 21 ad hoc input parameters extracted from a set of ∼15.000 PPG signals. This approach extracts the different parameters of every pulse of the PPG signal and uses them as the input of the ANN. Then, the network is trained to provide the corresponding BP value at the output. The employed multilayer feed-forward ANN is composed of 21 input neurons (corresponding to the parameters extracted from PPG), two hidden layers and tree output neurons for the prediction of Systolic BP (SBP), Diastolic BP (DBP) and Mean Arterial Pressure (MAP)), respectively. In [5], a new PPG hand-crafted feature, Normalized Harmonic Area (NHA), was investigated with encouraging results. The NHA feature is obtained from the PPG signal in the frequency domain. In particular, the discrete period transform algorithm is exploited to obtain the spectrum of each beat in the frequency domain. The authors showed that the proposed feature had high correlation with blood pressure. The experiments, which involved 28 healthy volunteers aged between 24 and 30 years, showed that the NAH has more significant correlation with BP and smaller error than both Pulse Transmit Time (PTT) and diastolic time [5]. However, the physiological mechanisms of the relation need to be explored. In [6], the authors proposed a new calibration method based on the dicrotic notch of the PPG waveform for SBP estimation using PTT. A new calibration parameter, the Relative Amplitude of the Secondary peak of PPG (RAS), was developed in [6]. It was defined as the amplitude ratio of the main peak and the secondary peak. Experiments showed that RAS is a promising calibration parameter to provide more accurate PTT-SBP estimation. An interesting method was proposed in [7], in which an approach for BP monitoring and estimation based on the relationship between the velocity of the pulse wave [1] and the BP was described. The detection of the velocity of pulse wave was computed by the analysis of the mechanical movements of blood vessel’s walls, as well as by additional information retrieved from the PPG signal. In [8], an algorithm to estimate SBP and DBP using Pulse Arrival Time (PAT) computed from ECG and PPG signals was proposed. They showed good results even though a re-calibration was required. Indeed, after an initial training, the model parameters were re-calibrated at constant intervals using a Recursive Least Squares (RLS) approach combined with smooth bias fixing [8]. They showed good results even though a re-calibration was required. By a careful analysis of the performed testing/validation, the authors of [8] confirmed that they were able to obtain an estimation mean error between −5 and 5 mmHg both for SBP and DBP and standard deviations of 7.77 mmHg and 4.96 mmHg, respectively, with recalibration every 1 h. We have discussed those results with physiologists, who confirmed that those blood pressure estimation accuracy values are acceptable from a medical point of view, even though these results need to be improved when we perform blood pressure monitoring for hypertensive patients.
In [9,10], a detailed survey about the relationship between non-invasive blood pressure and PPG signal features was reported. An interesting approach was presented in [11], in which the authors used PTT with some other biometric parameters (e.g., weight, height, Body Mass Index (BMI), length of arm, circumference of arm, etc.) as input for an ANN aimed to learn BP dynamic. Therefore, in order to estimate BP from PPG, a system able to handle this physiological signal is needed. In [12,13,14], some possible software and hardware solutions for sampling the PPG signal were shown. Finally, some PPG-based cuff-less blood pressure estimation and monitoring algorithms were presented in [15,16,17] using interesting approaches. In particular, in [15], the authors proposed a method to extract a comprehensive set of features by combining PPG signal-based and Heart Rate Variability (HRV)-related features, using a single PPG sensor. These features were fed to a combinatorial neural network model. In particular, separate models for systolic and diastolic pressures were used for training. Three Artificial Neural Network (ANN) regression models for each systolic and diastolic pressures were trained with the Levenberg–Marquardt algorithm. Then, the weighted outputs of the three models were combined to produce the final output. The authors of [17] proposed a cuff-less portable PPG-BP device for continuous BP monitoring, able to detect in real time the temporal intravascular blood volume change based on the Photoplethysmograph (PPG). In [18], the authors proposed a system for the BP estimation using the PPG signal. In particular, this system consisted of two modules. First, the pre-processing module cleaned the PPG signal of most noise and then segmented it into PPG cycles, corresponding to a single heart beat. Then, the machine learning module extracted features describing the PPG signal on a per-cycle basis, selected a subset of relevant features and fed them into regression algorithms that built the prediction models. Considering that the correlation of PTT with the systolic and diastolic blood pressures was highly dependent on each individual physiological property, in [19], a calibration-free blood pressure estimation approach was proposed. Several physiological parameters from the PPG signal were extracted, then signal processing and machine learning algorithms were applied. In summary, the solutions above described presented one or more of the following features:
- classical analytic methods;
- Pulse Transit Time (PTT)-based methods, involving both ElectroCardioGraphy (ECG) and PPG signals;
- heuristic approaches based on key features of PPG standard waveforms;
- (artificial) neural networks/machine learning algorithms;
- mixed ECG-PPG approaches.
However, as previously cited, the various solutions may suffer from certain limitations, such as:
- knowledge of specific physical parameters (arterial vessel elasticity, Moens–Korteweg equation, etc.);
- the related systems, both HW (Hardware) and SW (Software) (PPG/ECG) sensors, data extraction (PTT, PWV), etc., may turn out to be unduly complex;
- a sensitivity/specificity ratio hardly compatible with the related (high) computational costs;
- continuous ECG acquisition may be mandatory, with relates the difficulties of detection in certain contexts such as the automotive sector or smartphone systems;
- those methods that are based on machine learning and (Artificial) Neural Networks (ANNs) may involve high computational costs against a reduced accuracy and/or a high estimation capability limited to a reduced pressure range (80–90/110–130 mmHg);
The authors propose a robust and effective BP estimation and monitoring method based on such ad hoc and innovative analysis of the PPG signal.
3. The Photoplethysmography System (BI-PRS): A Brief Overview
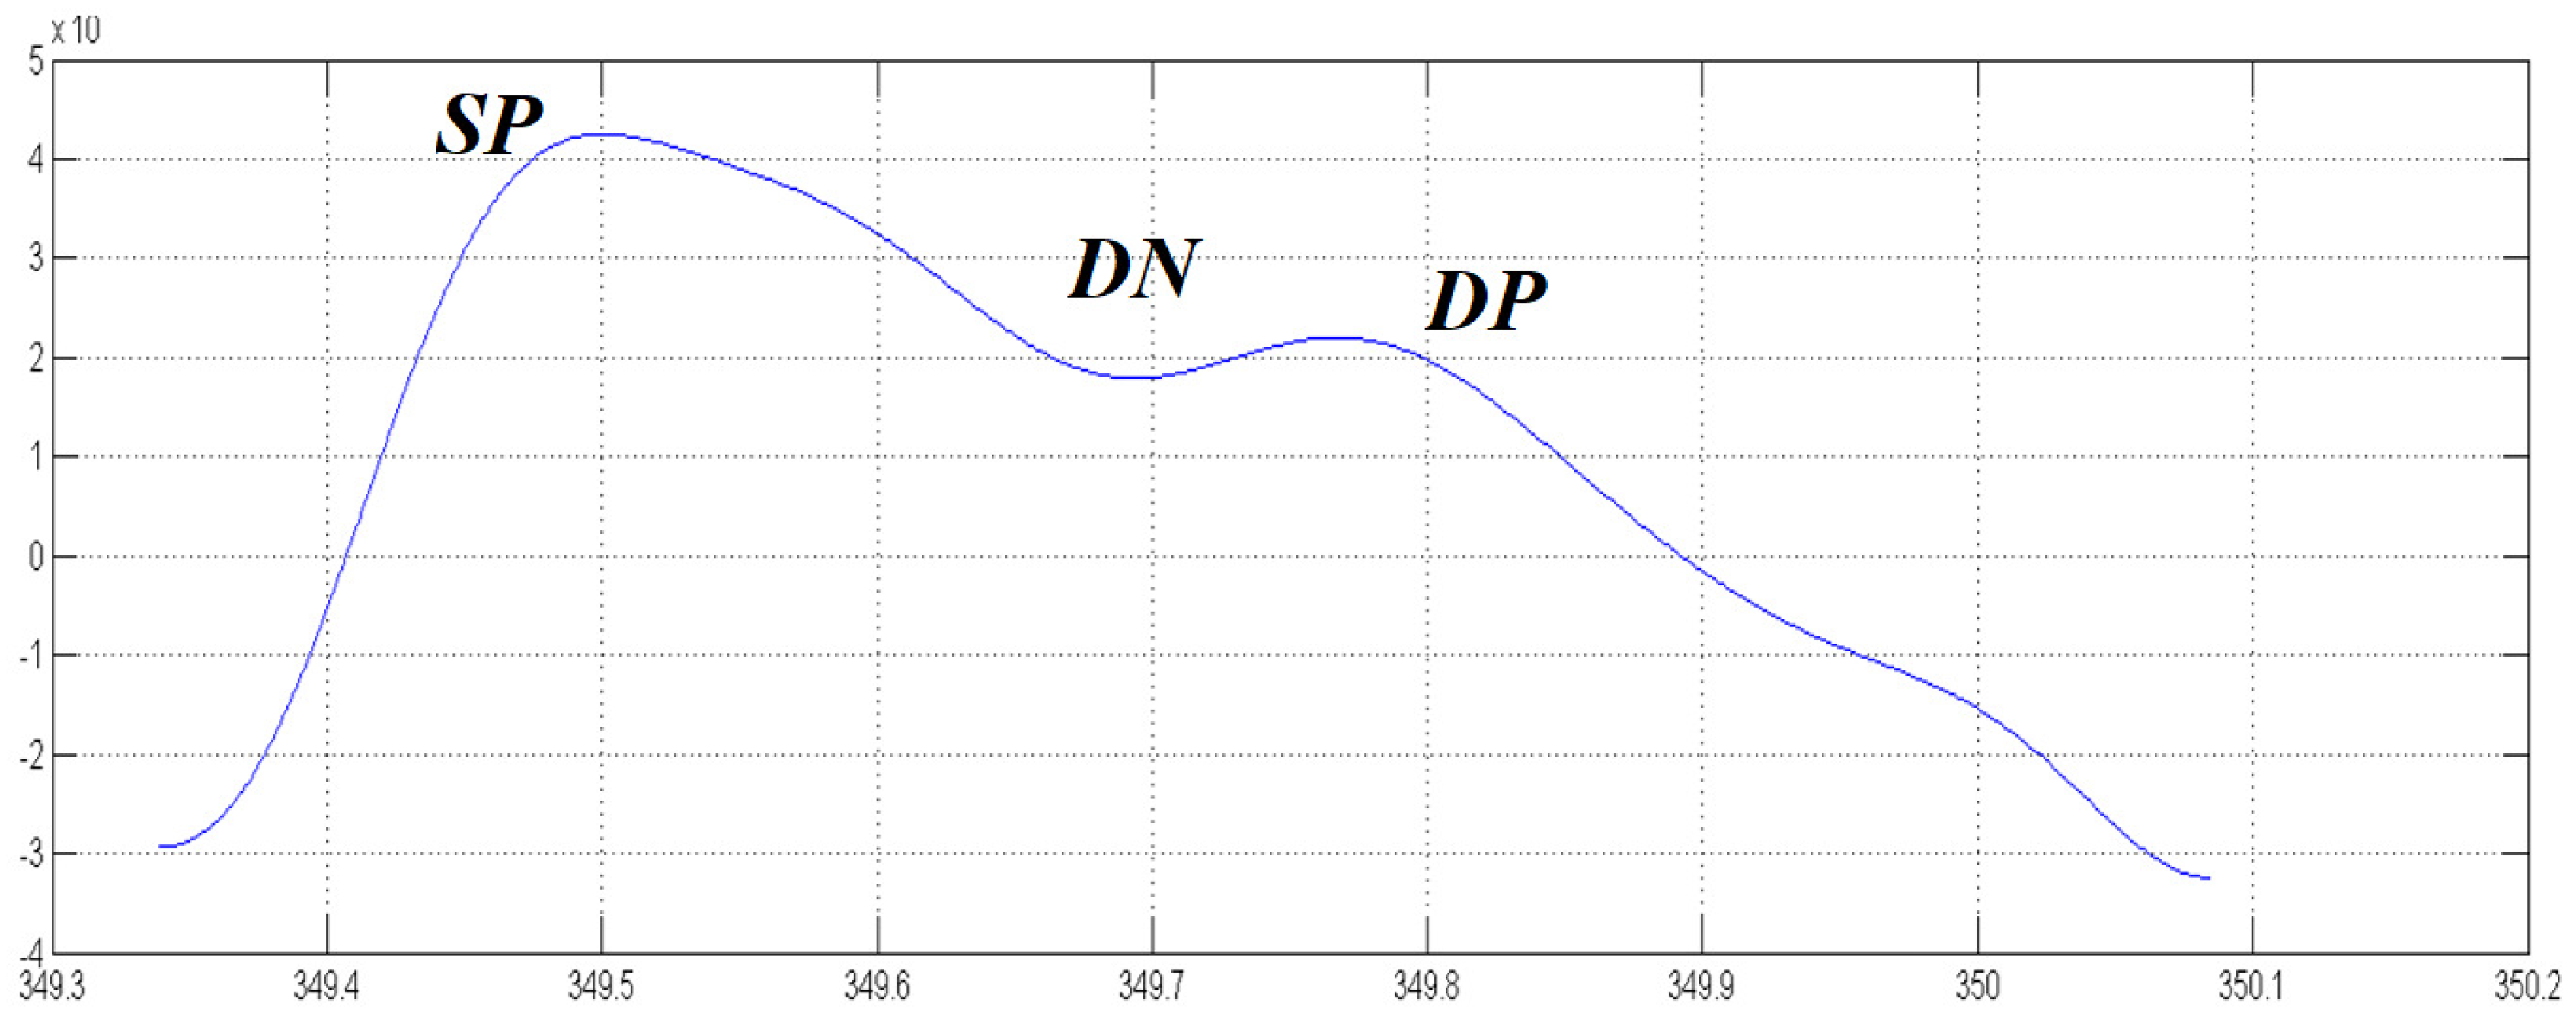
As already mentioned in Section 1, PPG is a non-invasive technique, which is becoming increasingly popular to provide information on the cardiovascular system, in particular for the monitoring of parameters like heart pulse rate, respiratory rate, tissue perfusion and some vascular and cardiac disorders. Parameters like heart pulse rate, respiratory rate, tissue perfusion and some vascular and cardiac disorders can be monitored via PPG. This signal has a great potential for assessing vascular disease, especially for the evaluation of vascular effects of aging, hypertension and atherosclerosis, providing also information on arterial stiffness and elasticity [20]. Use of PPG may be envisaged also in areas different from the medical field. For instance, PPG has been considered for use in the automotive field, e.g., in order to gain useful information on the behavior and/or the reaction of drivers and passengers in various situations that may occur in a motor vehicle [6,7]. A compliant standard PPG waveform comprises:
- a Systolic Peak (SP),
- a Dicrotic Notch (DN),
- a Diastolic Peak (DP) at a value y,
- the Width (W) of the pulse waveform.
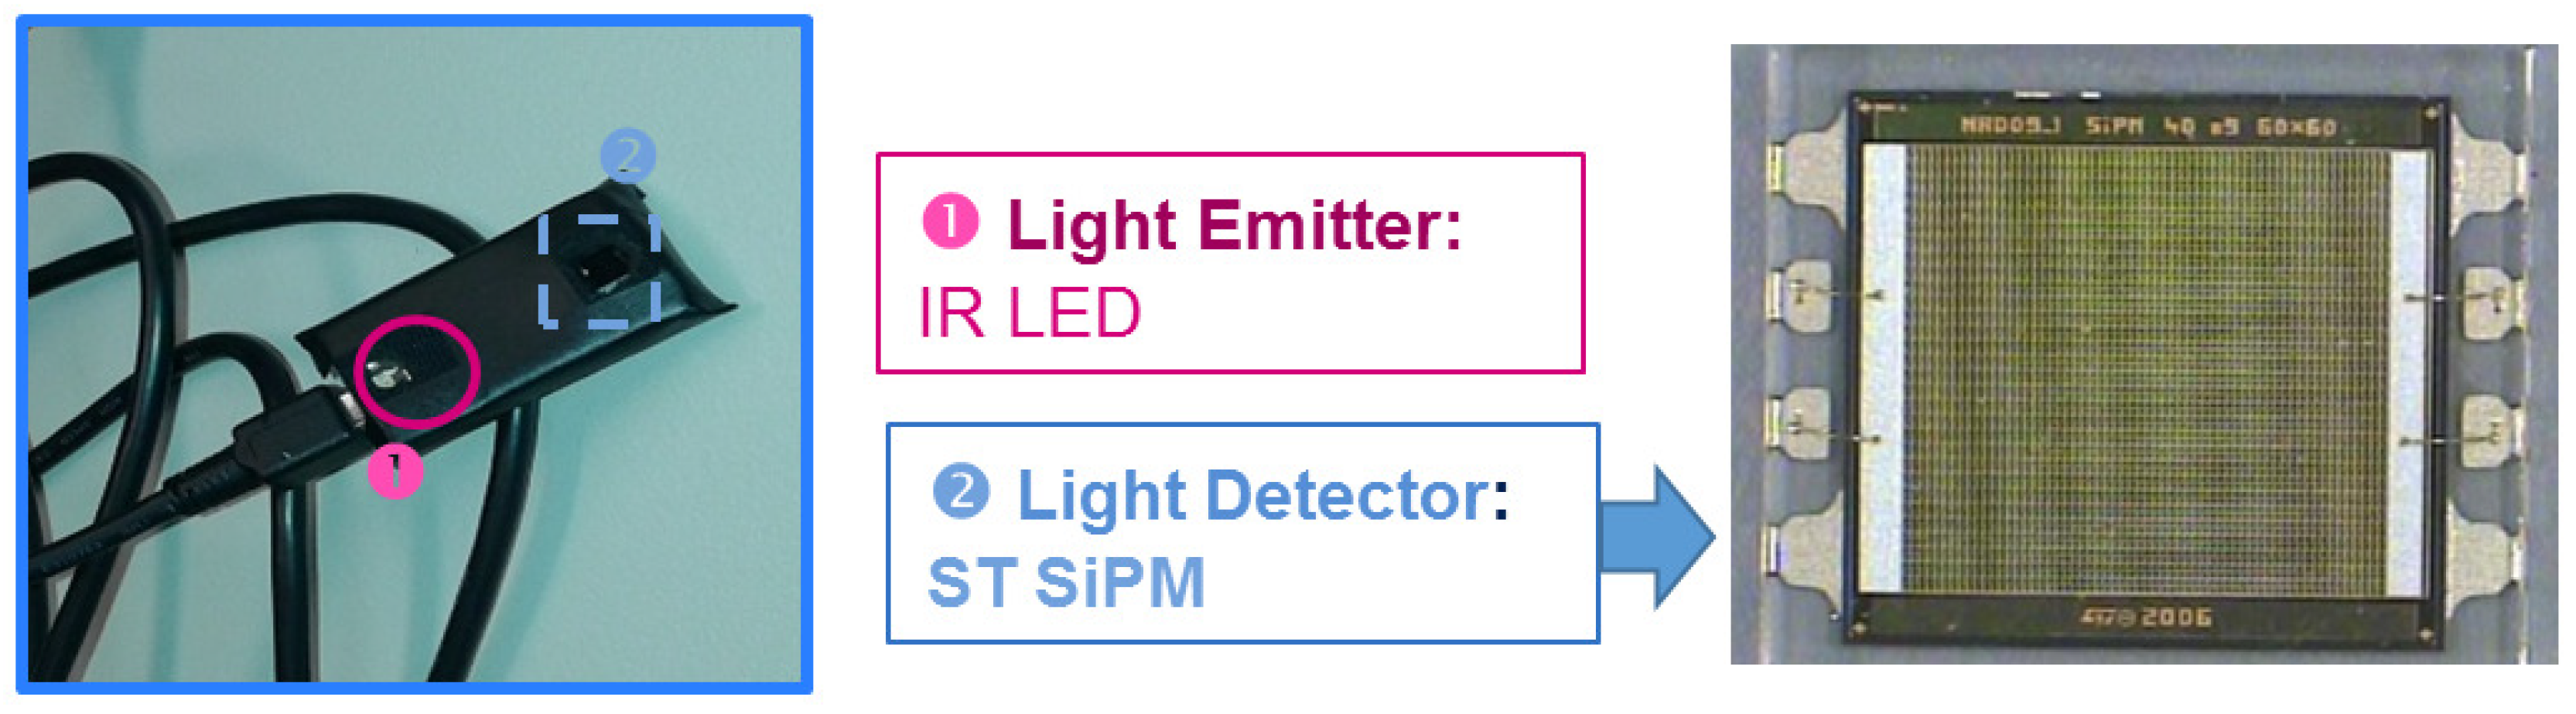
Figure 1 shows a classic compliant standard PPG pattern. Unfortunately, the physiological sampling pipeline shows some noise or PPG signal artifacts (motion artifacts, electronic noises, signal distortion, sensors issue, random noises, etc.) even after a careful filtering of the raw signal. For this reason, a PPG-compliant waveform recognition mechanism is needed in order to improve the robustness of the medical indicators computed from source photoplethysmography data [21]. There are several systems for acquiring the PPG signal of a patient that have been proposed in literature [22,23]. In this context, the authors have proposed a system named BI-P2RS (Bio-Inspired PPG Pattern Recognition System) [24]. The PPG probes used in this paper for the measurements are shown in Figure 2. This is based on the use of a Silicon Photomultiplier (SiPM) photodetector coupled to OSRAM LT M673 LEDs in the SMD package emitting at 529 nm and based on InGaN technology used as optical light sources [25,26,27].
The continuous component of the acquired waveforms is partially eliminated using a differential signal acquisition [24]. LabVIEW software was developed in order to acquire PPG signals. This software allows one to control the 24-bit ADC NI PXle-4303 NI (National instruments, Austin, TX, USA) acquisition system, and it has been completed with a Graphical User Interface (GUI) to display the filtered PPG signal together with its first and second derivatives. Moreover, it is possible to also compare two PPG signals acquired from probes arranged at different body sites and measure their temporal delay. During acquisitions, the working sampling frequency was set to 1 kHz. Finally, all data were stored in a log file that could be selected by the user and handled by the MATLAB-based algorithm for PPG signal pattern recognition. Output data were processed according to the logical scheme-flow reported in Figure 3. In the flow, the first block uses the above-mentioned BI-P2RS pattern recognition method to filter compliant PPG signals and make them robust for further processing, herein described.
4. The Proposed Blood Pressure Estimation System
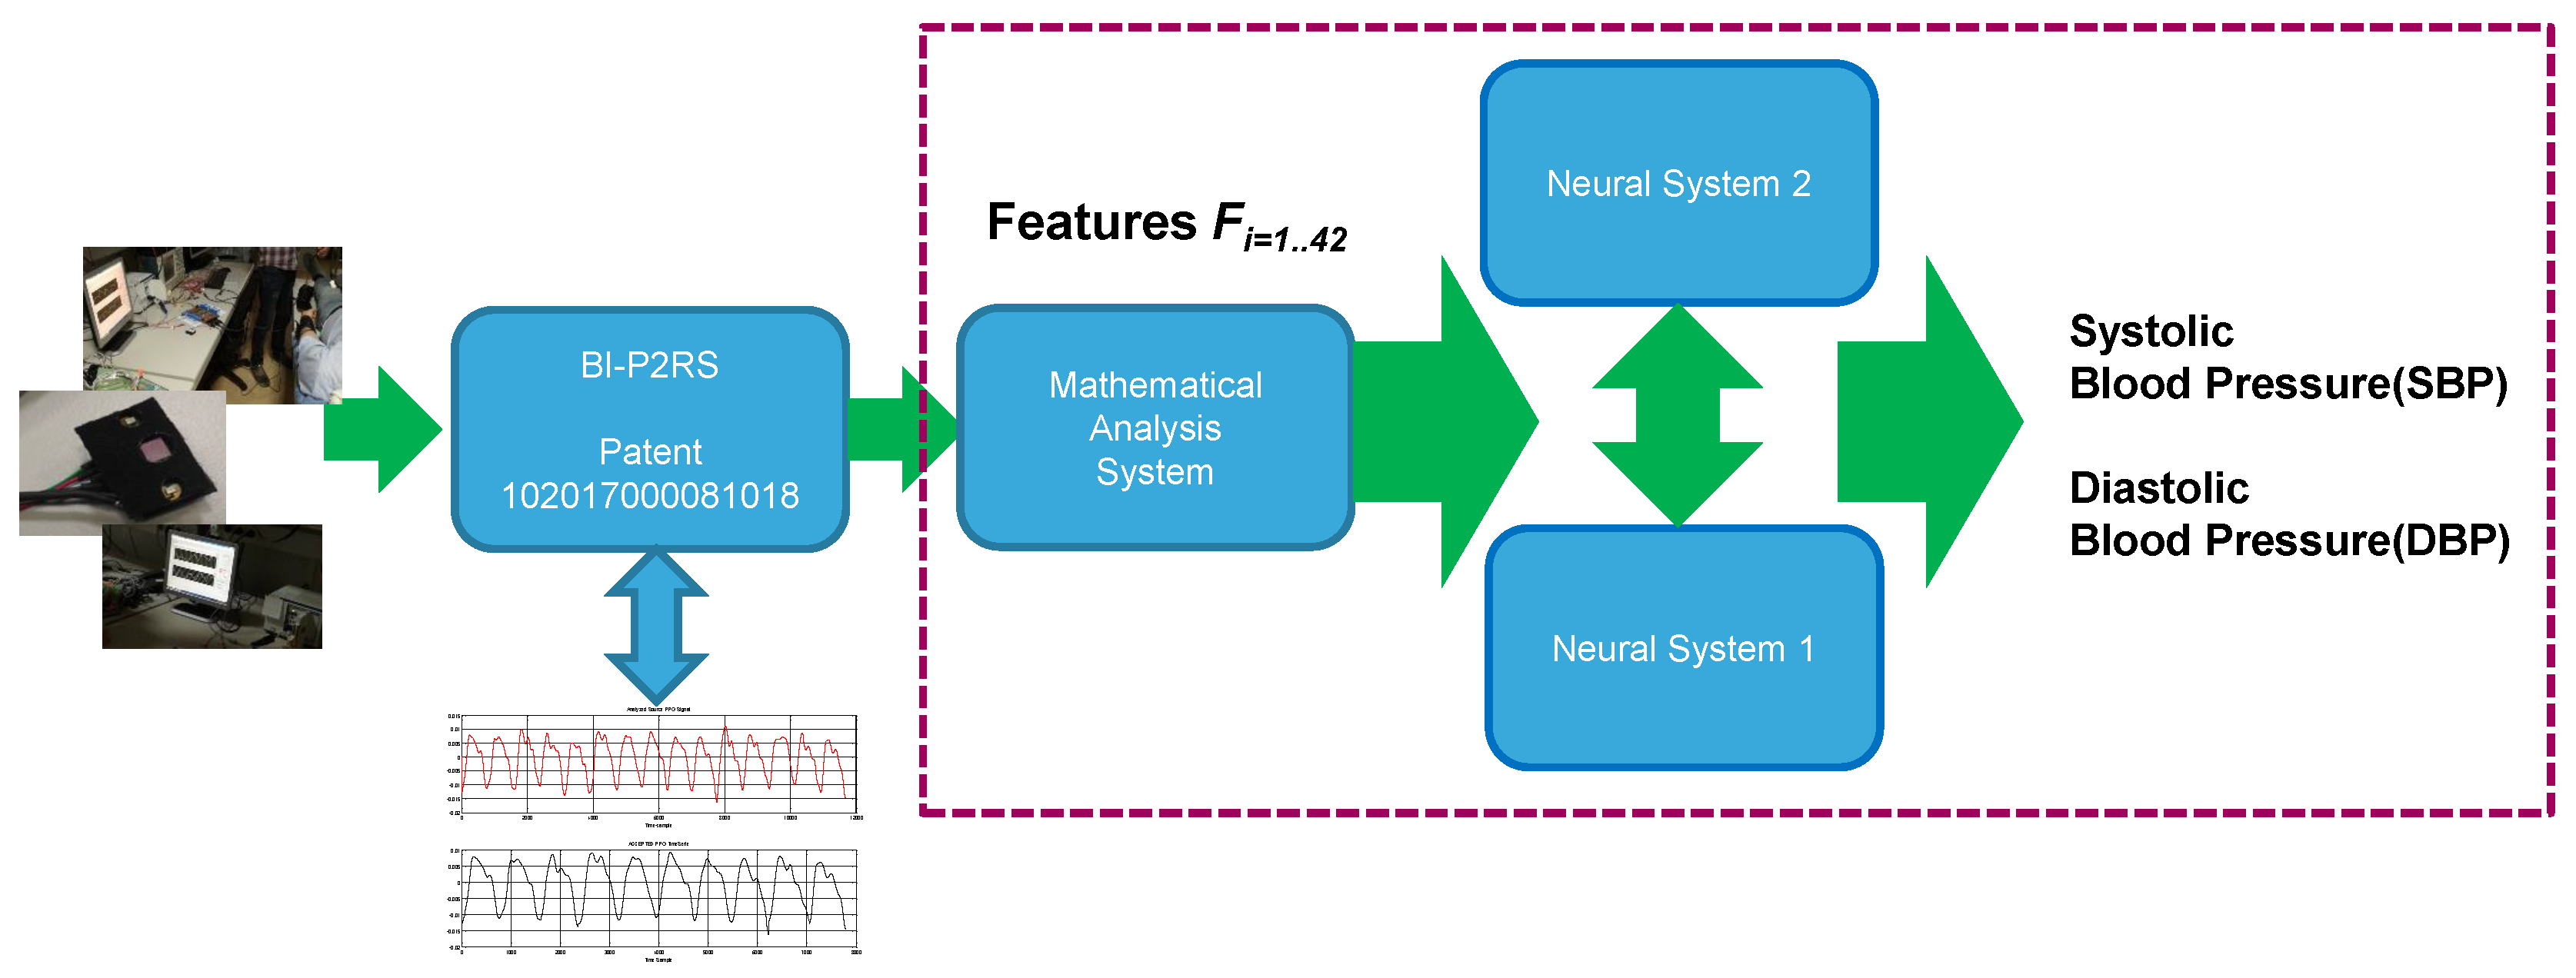
Figure 4 shows the proposed Blood Pressure Estimation pipeline. The pipeline comprises a mathematical analysis circuit, which receives the robust and compliant PPG signals from the system block BI-PRS and provides signals corresponding to the results of mathematical analysis to two different ANN circuit blocks. These blocks gives SBP and DBP output signals indicative of the systolic and diastolic blood pressure of the individual whose PPG signals were detected via the PPG probe. The output signals SBP, DBP can be provided to a “consumer” system such as a display screen, a printer, a recording device, etc., so that the signals SBP, DBP may be made available to support the diagnostic activity of a practitioner in medical and veterinary activities. Figure 4 shows the proposed blood pressure estimation pipeline.
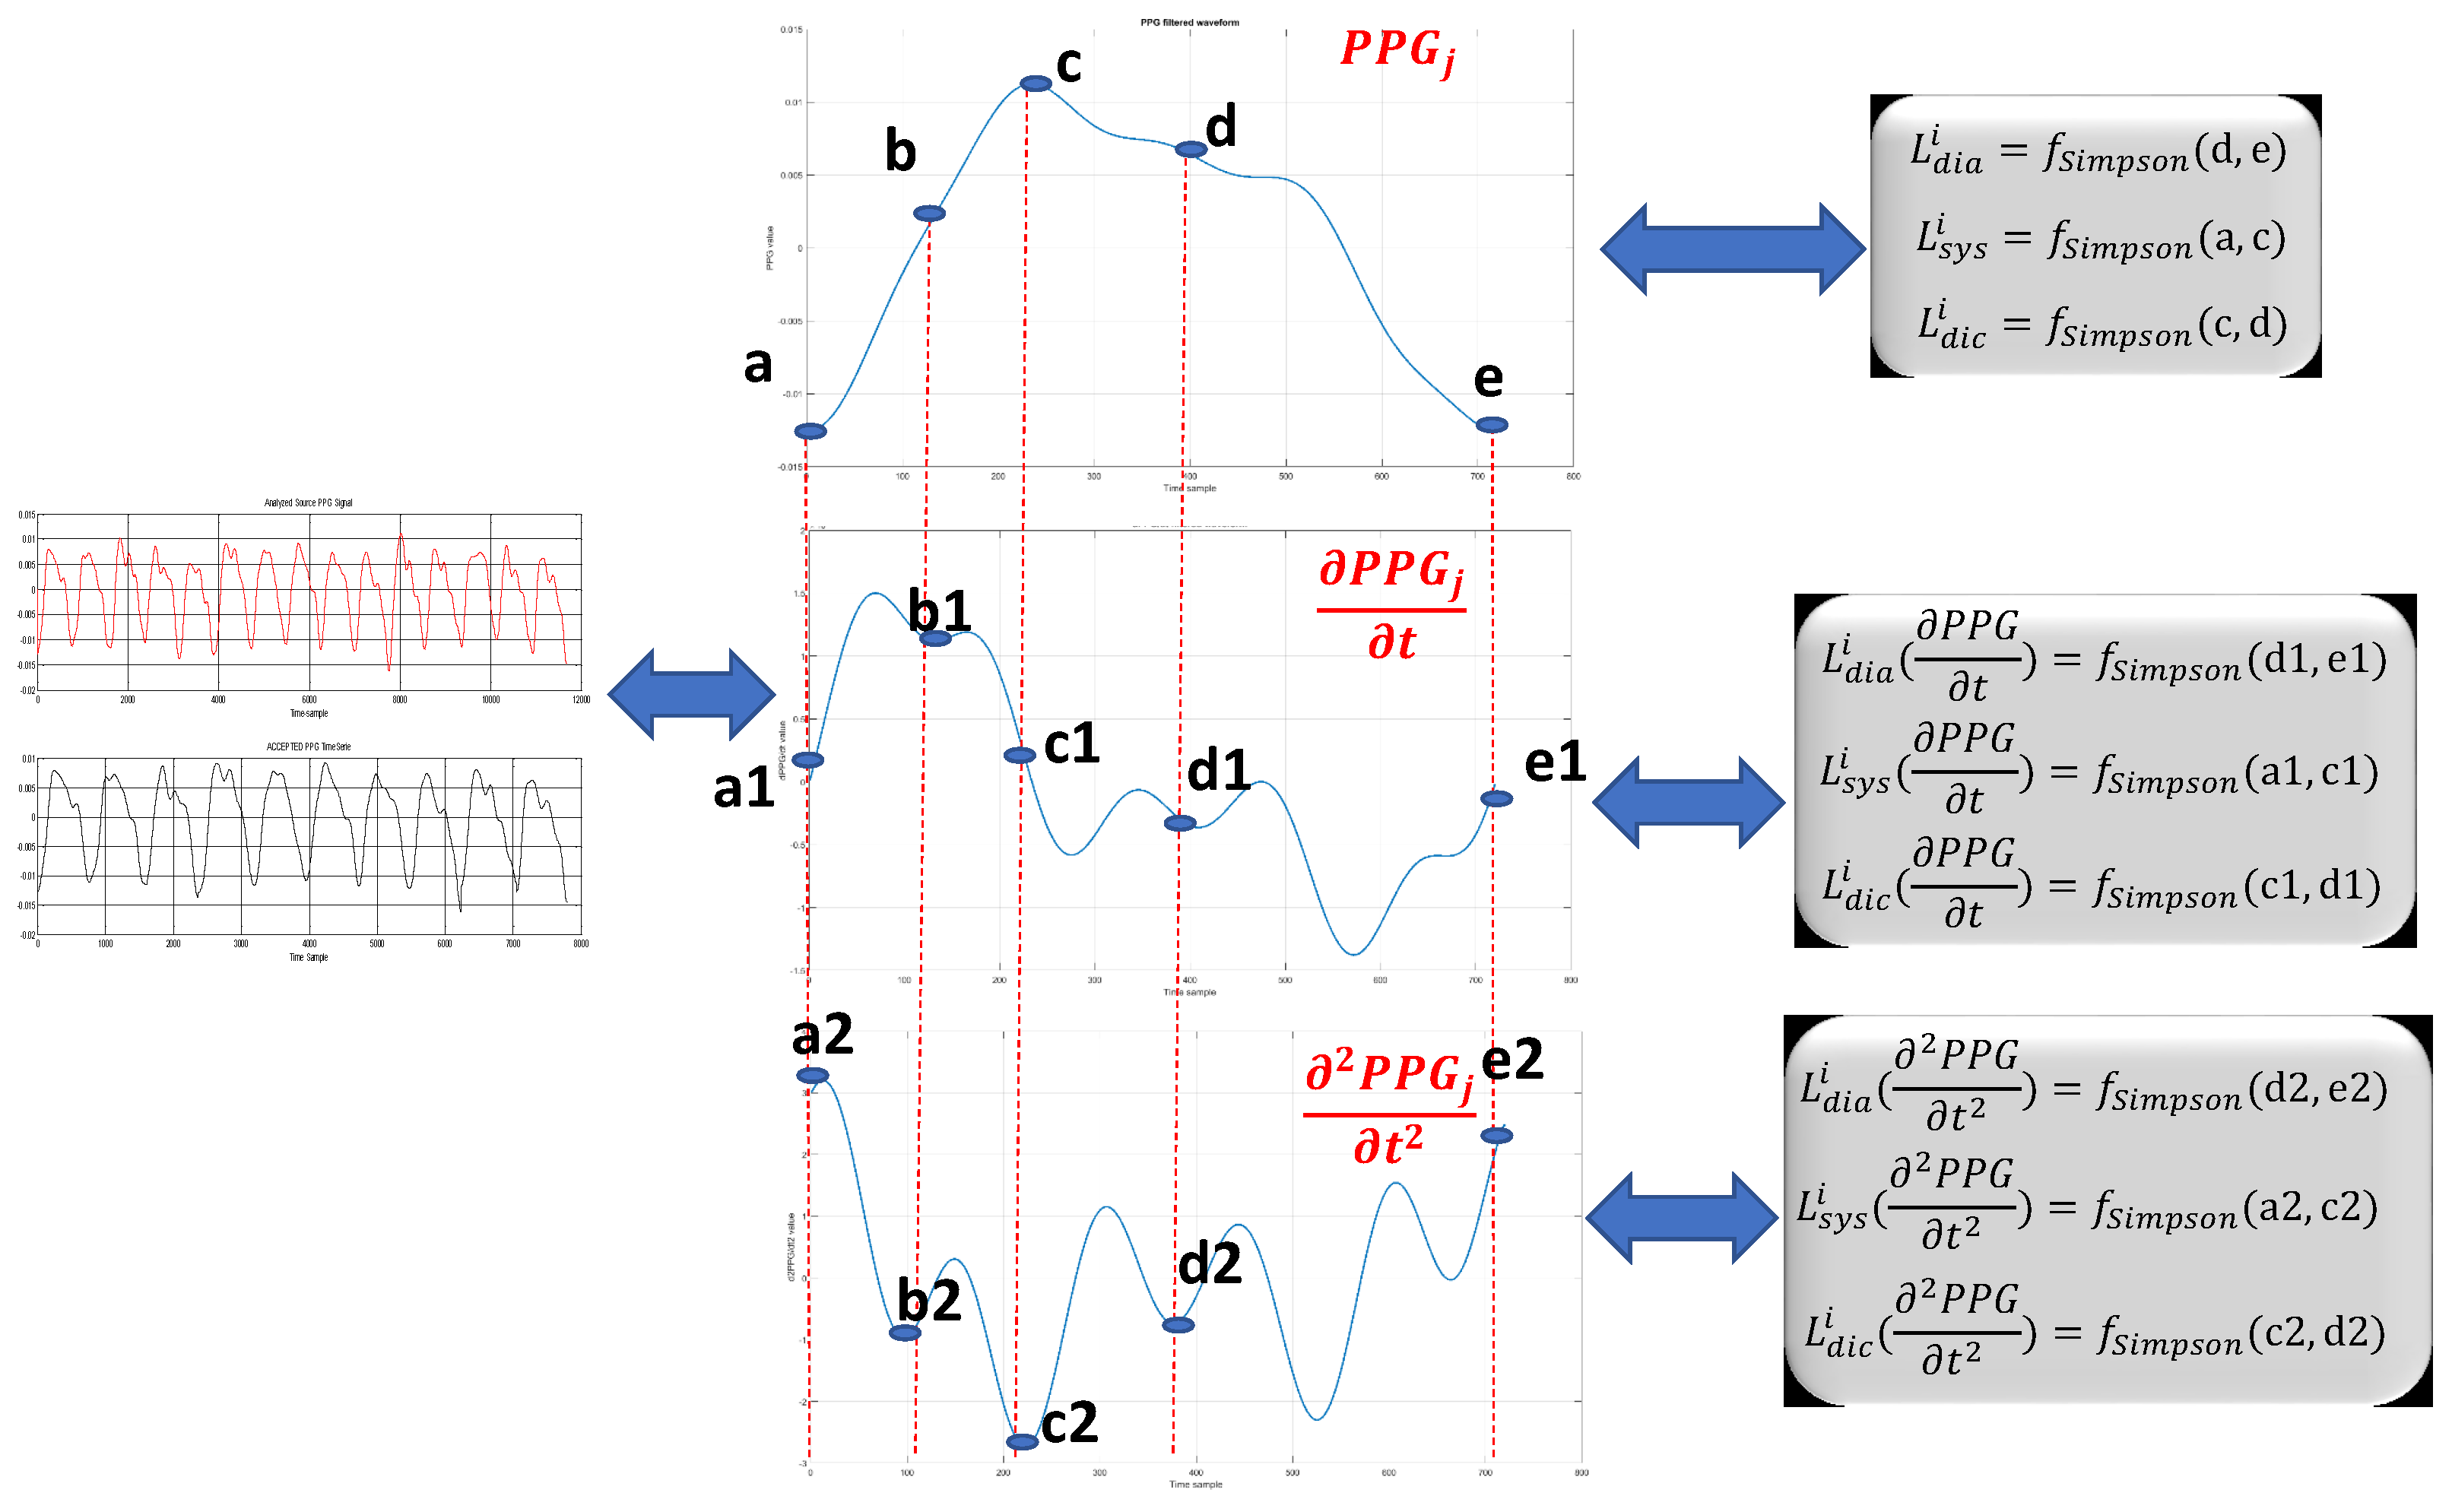
More specifically, the mathematical analysis system block comprises a processor block (e.g., a DSP, or GPU, or similar processor circuit) configured in a manner to generate hand-crafted features to support further processing in the artificial neural network blocks for BP estimation. As a first act, the mathematical analysis system calculates a first set of features of the (filtered) PPG waveform and related first and second (time) derivatives. Figure 5 shows the definitions of such variables used for computing the following described hand-crafted features.
The equations in Table 1 are exemplary of how such a first act of processing can be performed in the proposed approach.
In the equations detailed in Table 1:
- ln denotes the (natural) logarithm;
- N: the number of compliant PPG waveforms over a period of the analyzed PPG signal;
- the suffixes sys, dia and dic denote the systolic, diastolic and dicrotic phases of the PPG signal (see, e.g., Figure 1), which may be identified as the portions a–b, a1–b1, a2–b2 (systolic), b–d, b1–d1, b2–d2 (dicrotic), c–e, c1-e1 and c2–e2 (diastolic) in the diagrams (PPG and its first derivative and second derivative) of Figure 5;
- Lx indicates the length of the sub-curve of the PPG waveform, for the systolic, diastolic and dicrotic phases sys, dia and dic, respectively, and with , N; in the same way, Lx (∂PPG/∂t) represents the length of the sub-curve of the first derivative of the PPG signal, and Lx (∂PPG/∂t) represents the length of the sub-curve of the second derivative of the PPG signal, again for sys, dia and dic, respectively. For the first derivative and second derivative of PPG signal, the Simpson rule can be adopted for computing the length of the curve [28];
- σ the denotes standard deviation for variable Lx.
The aim of the proposed work is to define a cuff-less non-invasive method for blood pressure estimation. Thus, we first addressed this problem by means of the definition of ad hoc mathematical features suitable to characterize the blood pressure dynamics. With this aim, we have studied the correlation between the acquired PPG signal and blood pressure. In order to have a robust and careful analysis of that correlation, our study has been supported by physiologists and cardiologists. In the literature, it is well known that there is a correlation between the PPG signal (or other blood flow-based signals) and blood pressure, as described in some mathematical models such as the Moens–Korteweg equation previously mentioned [1]. However, by taking into account the information retrieved from physiologists and cardiologists, as well as considering preliminary results obtained by the same authors in their previous work (BI-P2RS) in [24], the authors supposed that blood pressure (both SDB and DBP) is correlated with blood flow and its velocity and acceleration in the human arteries, as both measures are related to the cardiac activity. Therefore, we supposed a correlation between blood pressure (both SDP and DBP) and the PPG signal and its first and second derivative dynamics, which are measures of velocity and acceleration, respectively. For this reason, the authors studied ad hoc features to be extracted from the PPG signal and its first and second derivatives. As previously described, the compliant PPG waveform contains information about cardiac cycles (i.e., systolic and diastolic phases), as well as information about the dicrotic notch (correlated with the elasticity of coronary arteries). Thus, we have defined custom hand-crafted features suitable to characterize each cardiac cycle. Specifically, we defined the features – to characterize the dynamic of systolic phase. Likewise, the features – and – are suitable to characterize diastolic and dicrotic dynamics, respectively. For each set of features, we added classic statistical information such as the standard deviation as reported in features –. In order to have a robust correlation model between blood pressure and the PPG signal (i.e., cardiac cycles), we introduced further features suitable to model the “dynamic ratio” between each of the cardiac cycles mathematically, since those ratios are correlated with blood pressure, as confirmed by physiologists. Therefore, we have defined features from – to characterize the dynamic ratio between cardiac cycles dynamics as their changes are strongly affected by proportional blood pressure variations. Finally, the features from – were introduced to better characterize the stability of cardiac cycles, as we analyzed the dynamic of each cycle between two compliant PPG waveforms. We noted that a blood pressure variation showed a proportional change in the dynamics of the cardiac cycles between compliant PPG waveforms, so that representative features of that correlation have been added in order to improve the robustness and efficiency of the proposed approach. Each group of features (i.e., [–], [–] and [–]) are useful to improve the accuracy of the blood pressure estimation. Indeed, if we remove any of those, the performances of the proposed approach decrease significantly.
Essentially, equations F–F, F–F and F–F provide an indication of the “length” of the signal curve or path of the PPG signal (and the first and second derivatives thereof) in the systolic, diastolic and dicrotic phases (that is to say, “how long” each of these signals remains in each phase). By observing Figure 5, it can be noted that, while extending over the same time duration, the PPG signal (Part a in the figure), the first derivative signal (Part b in the figure) and the second derivative signal (Part c) in the figure) have paths of different lengths provided by the Simpson rule [28]. In the same line, Equations F–F, F–F and F–F provide a refined indication of the average (standard deviation) of the path lengths of the PPG signal and the first and second time derivatives thereof in the systolic, diastolic and dicrotic phases.
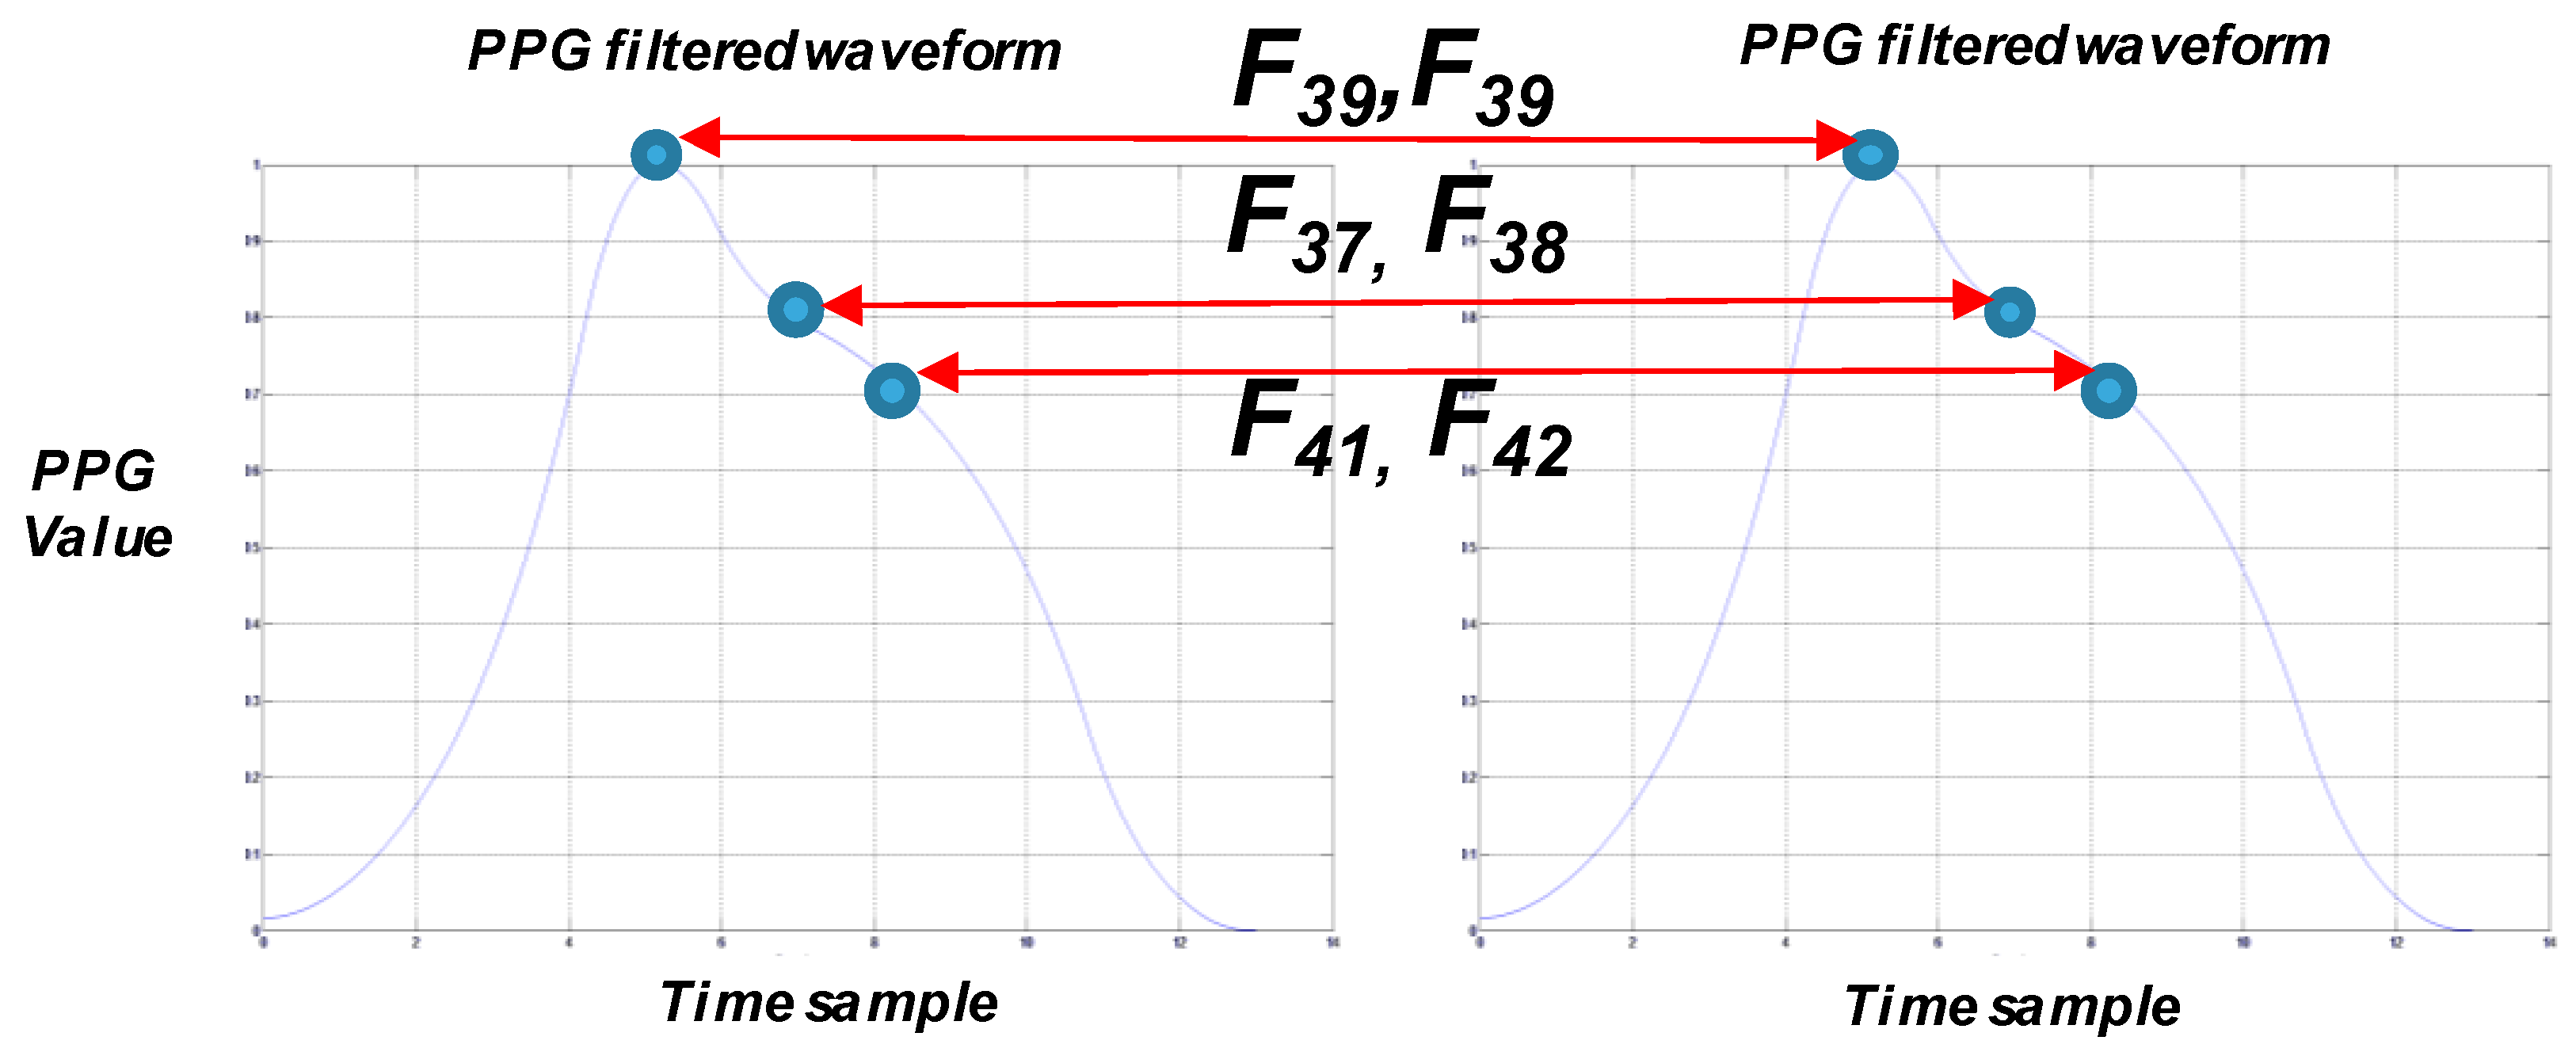
As a second act as exemplified, the mathematical system block calculates a second set of features F–F of the (filtered) PPG, ∂PPG/∂t and ∂PPG/∂t signals, which are indicative of the shape factors of these signals, e.g., relative measures of the systolic, diastolic and dicrotic phases. These relative measures are mathematical representations of how fast/slow the transitions between the systolic, diastolic and dicrotic phases may occur. The equations from F–F detailed in Table 2 are exemplary of how such a second act of processing can be performed in the proposed approach. In the equations, the entities indicated have the same meaning already discussed in connection with equations F–F for the systolic, diastolic and dicrotic phases sys, dia and dic, respectively. Figure 6 employes distances between peaks/valleys in subsequent PPG waveforms (generally denoted as i and ).
Finally, Table 3 reports the remaining hand-crafted feature equations (F–F) we used in our system, where the entities already discussed in connection with equations F–F retain the same meaning and:
- max denotes the point (abscissa) where the PPG waveform has its maximum value (systolic peak SP);
- min denotes the point (abscissa) where the PPG waveform has its minimum value;
- p denotes the dicrotic point (abscissa);
- i and () generally denote two subsequent PPG waveforms.
The entities (e.g., F–F as exemplified in the foregoing) calculated in the mathematical system block will be fed as input to the ANN blocks to perform therein processing intended to correlate the PPG signal with pressure measurements (both diastolic and systolic) available for training the neural network blocks to produce blood pressure signals SBPrec (systolic) and DBPrec (diastolic) reconstructed starting from the PPG signals. Training values, e.g., (systolic) and (diastolic), have been derived from a set of measurements performed on a sample of 32 patients for which blood pressure is measured (e.g., by conventional means such as a sphygmomanometer) concurrently with detecting a PPG signal. These values can be used for training both neural networks represented in the system architecture reported in Figure 4.
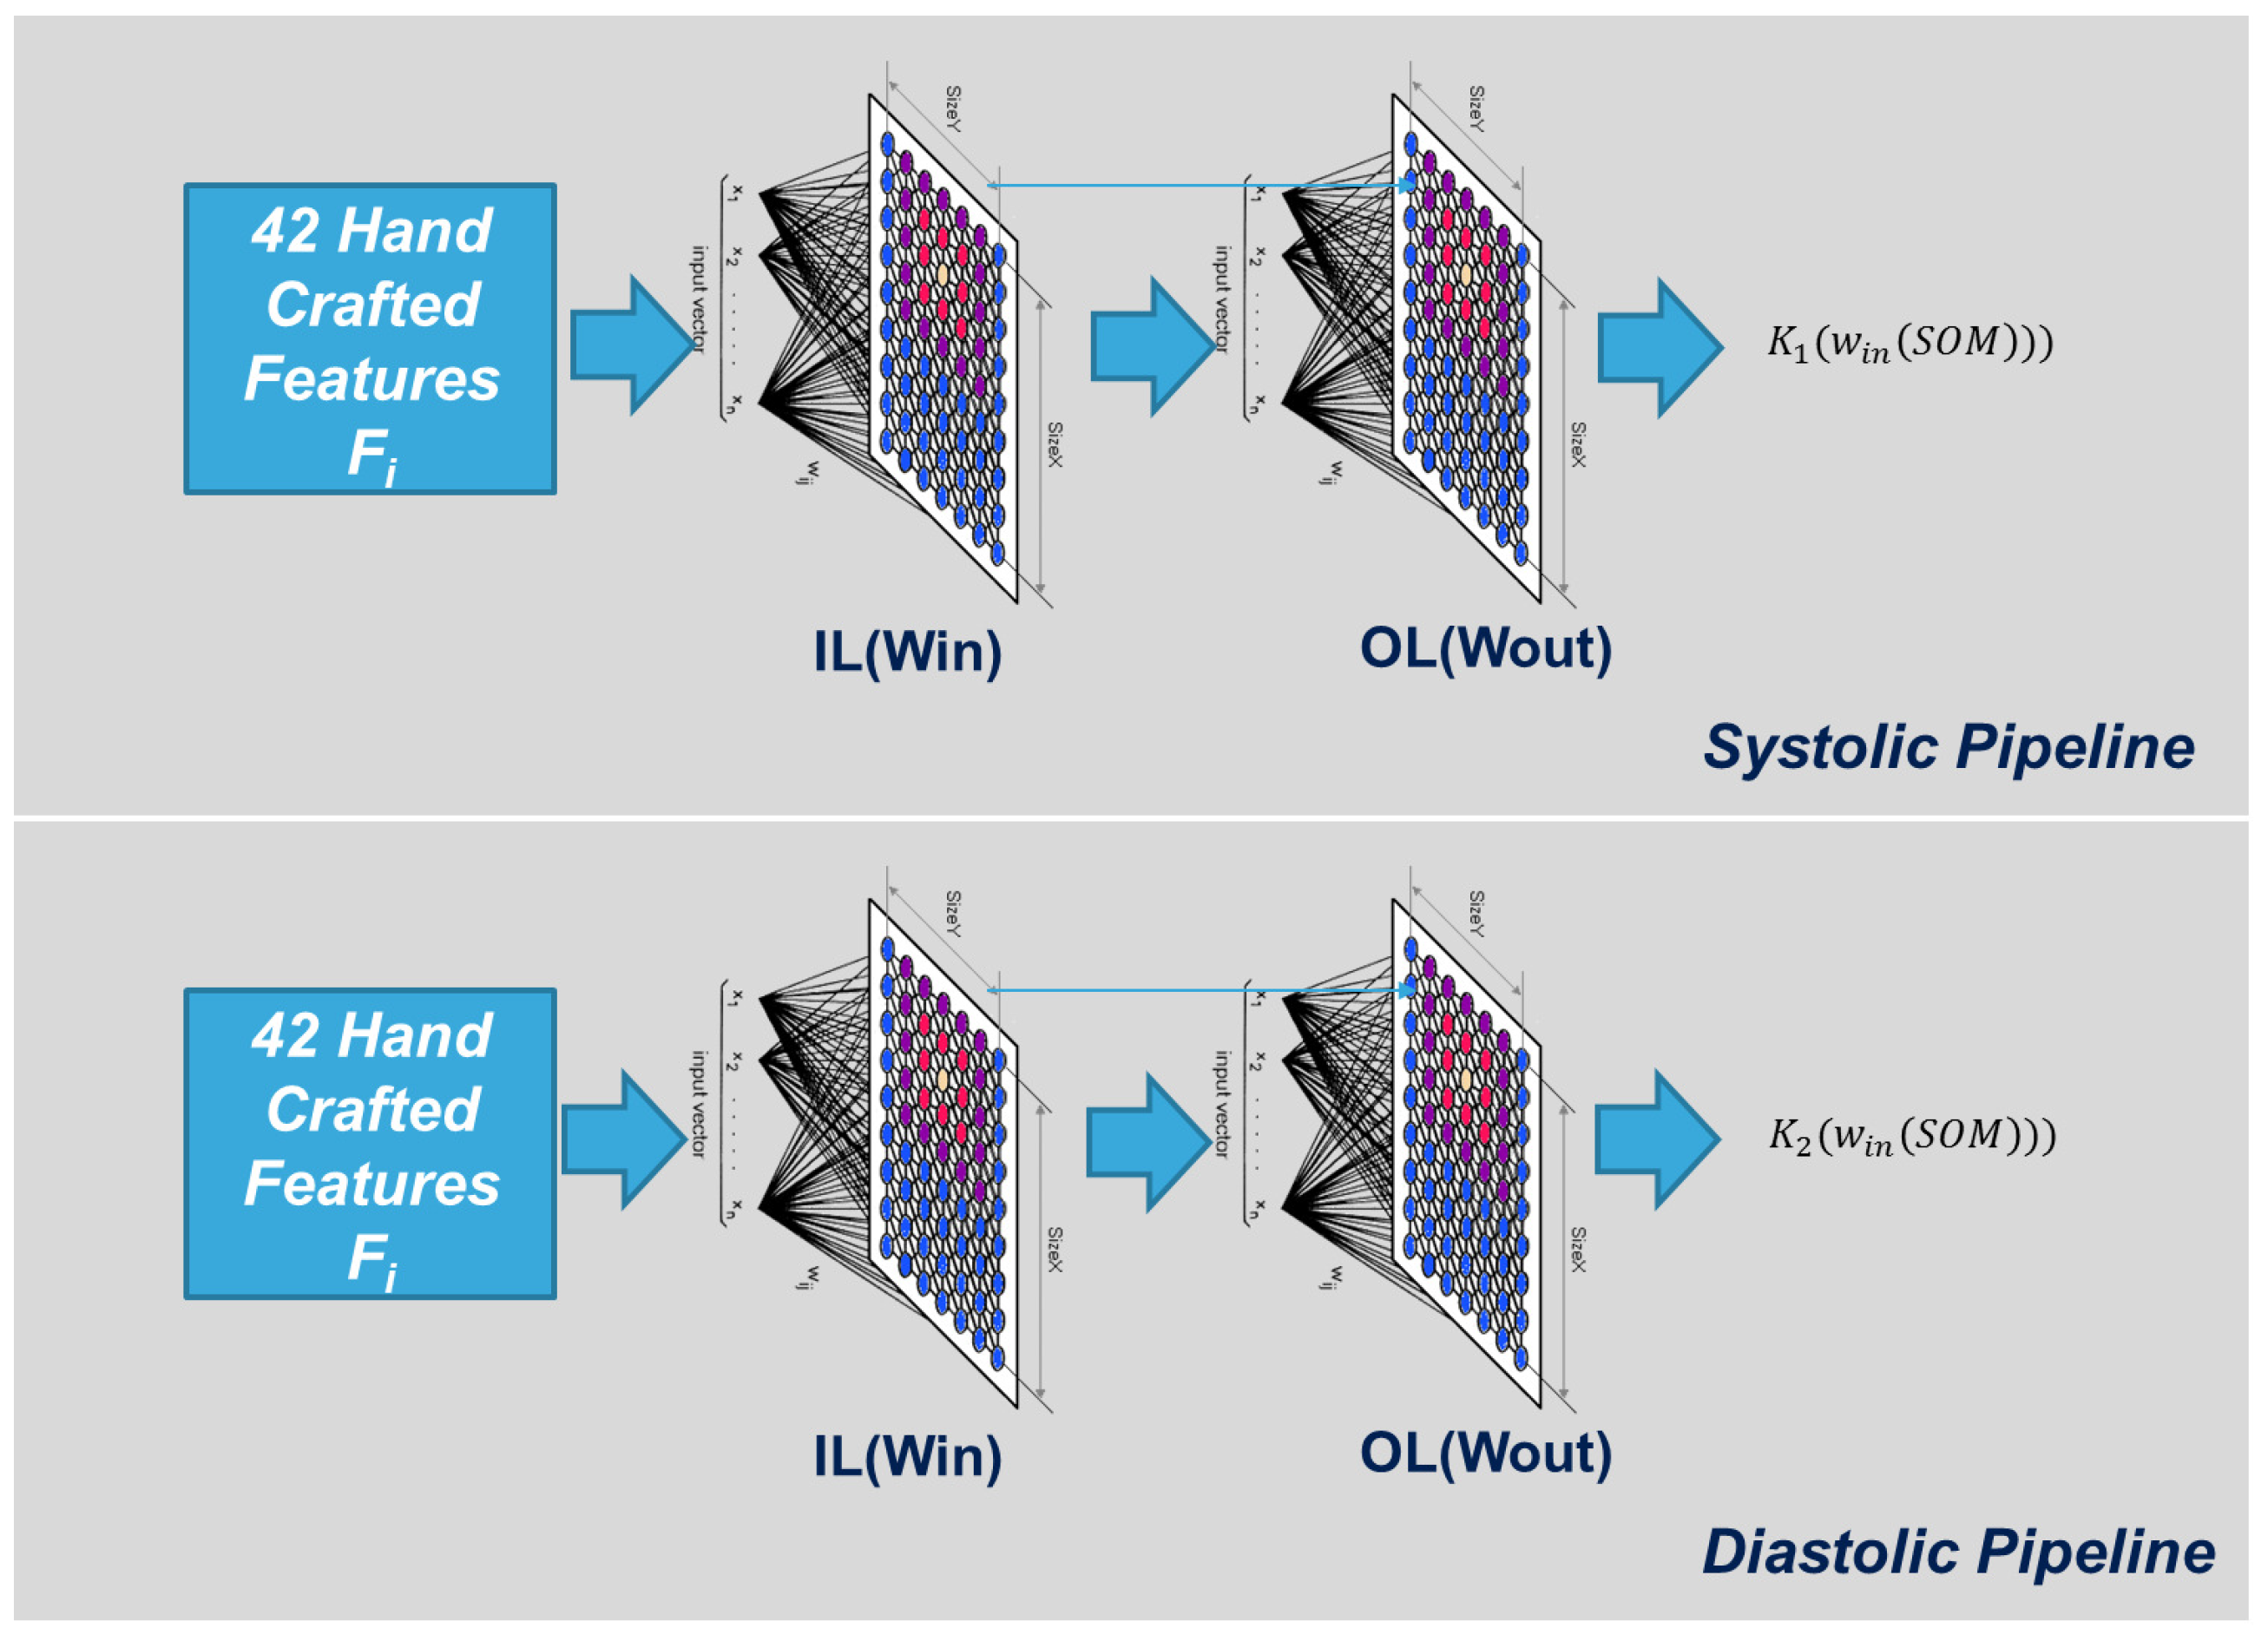
The first used ANN (Neural System 1 as per Figure 4) is a Multi-Layer Perceptron (MLP) with a modified Polak–Ribiere back-propagation learning algorithm [29,30], which was found to be an adequate tool for use in learning a correlation between PPG-based features as discussed previously (e.g., F–F) with blood pressure measurements. During the design/validation of the proposed approach, we performed several tests on the type of neural network to be used in order to get the best trade-off between approximation performance and convergence timing. As described in the classic literature of machine learning, it is well known that basic Back Propagation (BP) algorithm adjusts the weights in the steepest descent direction. With this method, the loss function is decreasing most rapidly, but it does not mean that this approach produces the fastest convergence, as the method is very slow and often finds only the local minima of the function. Some authors suggested the usage of Newton’s method, which has high performances, but it requires calculating the inverse of the Hessian matrix, such that it shows high computational costs. For those reasons, we decided to check the conjugate gradient BP algorithm as we heuristically supposed to model the problem as quadratic. In the conjugate gradient method, the weights’ updating is performed along conjugate directions, which produces generally faster convergence than steepest descent directions and allows avoiding the high computational cost of Newton’s method. For this learning approach, there are more solutions for the searching algorithm, as in our tests, we observed that the Polak–Ribiere achieved the best results, so we decided to use the MLP trained with the BP algorithm modified as per the Polak–Ribiere approach. This artificial neural network will thus be able to perform preliminary reconstruction of the blood pressure of a subject both for systolic (SBP) and diastolic (DBP) values, providing an estimation denoted as f(*) and f(*) for SBP and DBP, respectively. The second used artificial neural network (Neural System 2 as per Figure 4) is an advanced modified version of the Self-Organizing Map (SOM) motor map [31]. This ANN, as per Figure 4, will thus be able to complete such a reconstruction of the blood pressure both for systolic (SBP) and diastolic (DBP) values by detecting a second estimation or component K(*) and K(*) for both systolic and diastolic pressures, respectively.
In fact, final reconstructed blood pressure values, SBP (systolic) and DBP (diastolic), were found to be reliably and accurately estimated as a combination (e.g., as a sum) of non-linear plus linear components in the the following form:
where (*) and (*) represent the output from a functional mapping modeled by (*) (systolic) and (*) (diastolic) as produced by the first neural network (e.g., with Polak–Ribiere learning), which performs non-linear function approximation. The terms K(*) (systolic) and K(*) (diastolic) represent the output from the second neural network (e.g., “extended SOM”), which performs a pseudo-linear function approximation. Consequently, the pressure values SBPrec/DBPrec comprise a non-linear portion (/) and a linear portion (K/K).
An extended SOM as schematically exemplified in Figure 7 (where only the Input Layer (IL) and the Output Layer (OL) are visible) was found to be suited for use in the proposed approach, e.g., due to the presence of an OL that was able to produce the linear correction needed to improve SBP/DBP estimation made by the previous neural Network stage. We organized, for each type of Blood Pressure Estimation system (SBP and DBP) a lattice structure of 8 × 8 neurons having 42 input weights (for each neuron) and one output weight. Both weights matrices are random initialized.
The following equations describe the typical “winner take all” algorithm [32,33] for proper clustering of input hand-crafted signal features vector F:
where (x, y) represents the coordinates of the neurons, which minimize the Euclidean distance between the input weights and the related hand-crafted input vector, while “” and “” represent the learning rate and neighborhood function (Gaussian) of the WTA algorithm. This winner neuron produces the related output per the following equation:
We compute the following learning errors:
If the above error functions are progressive decreasing, i.e.,
the related weights’ updating will be confirmed, and then:
Otherwise, both input and output weight updates will be discarded.
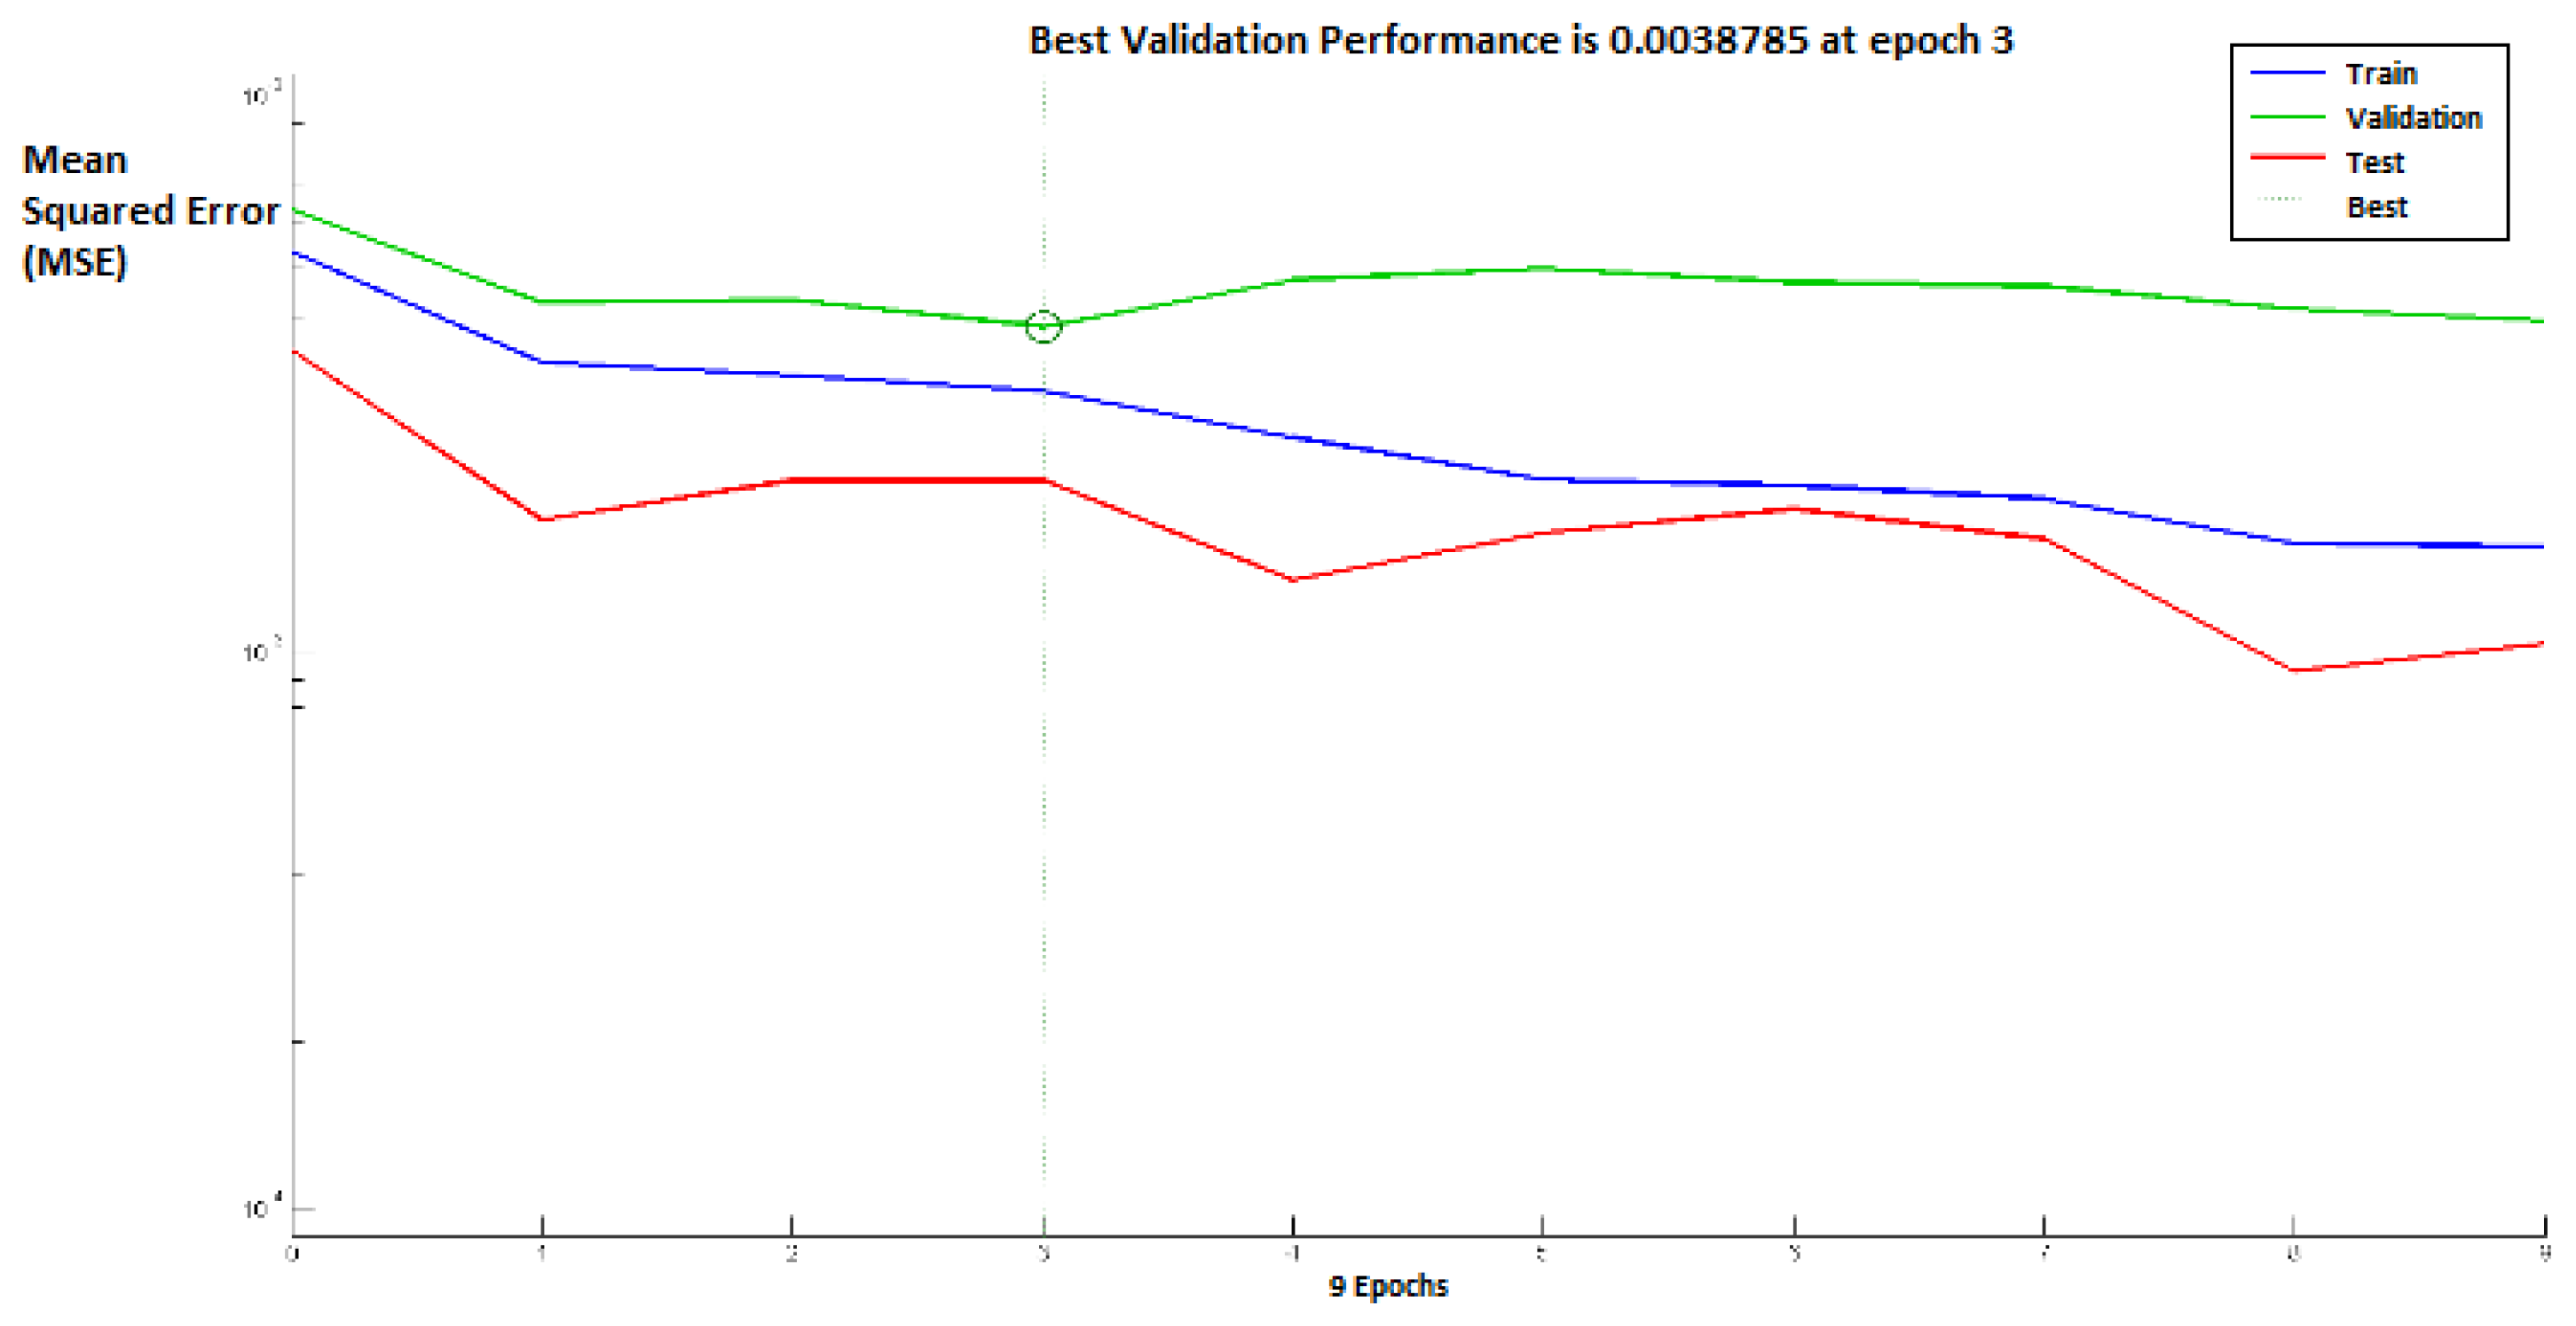
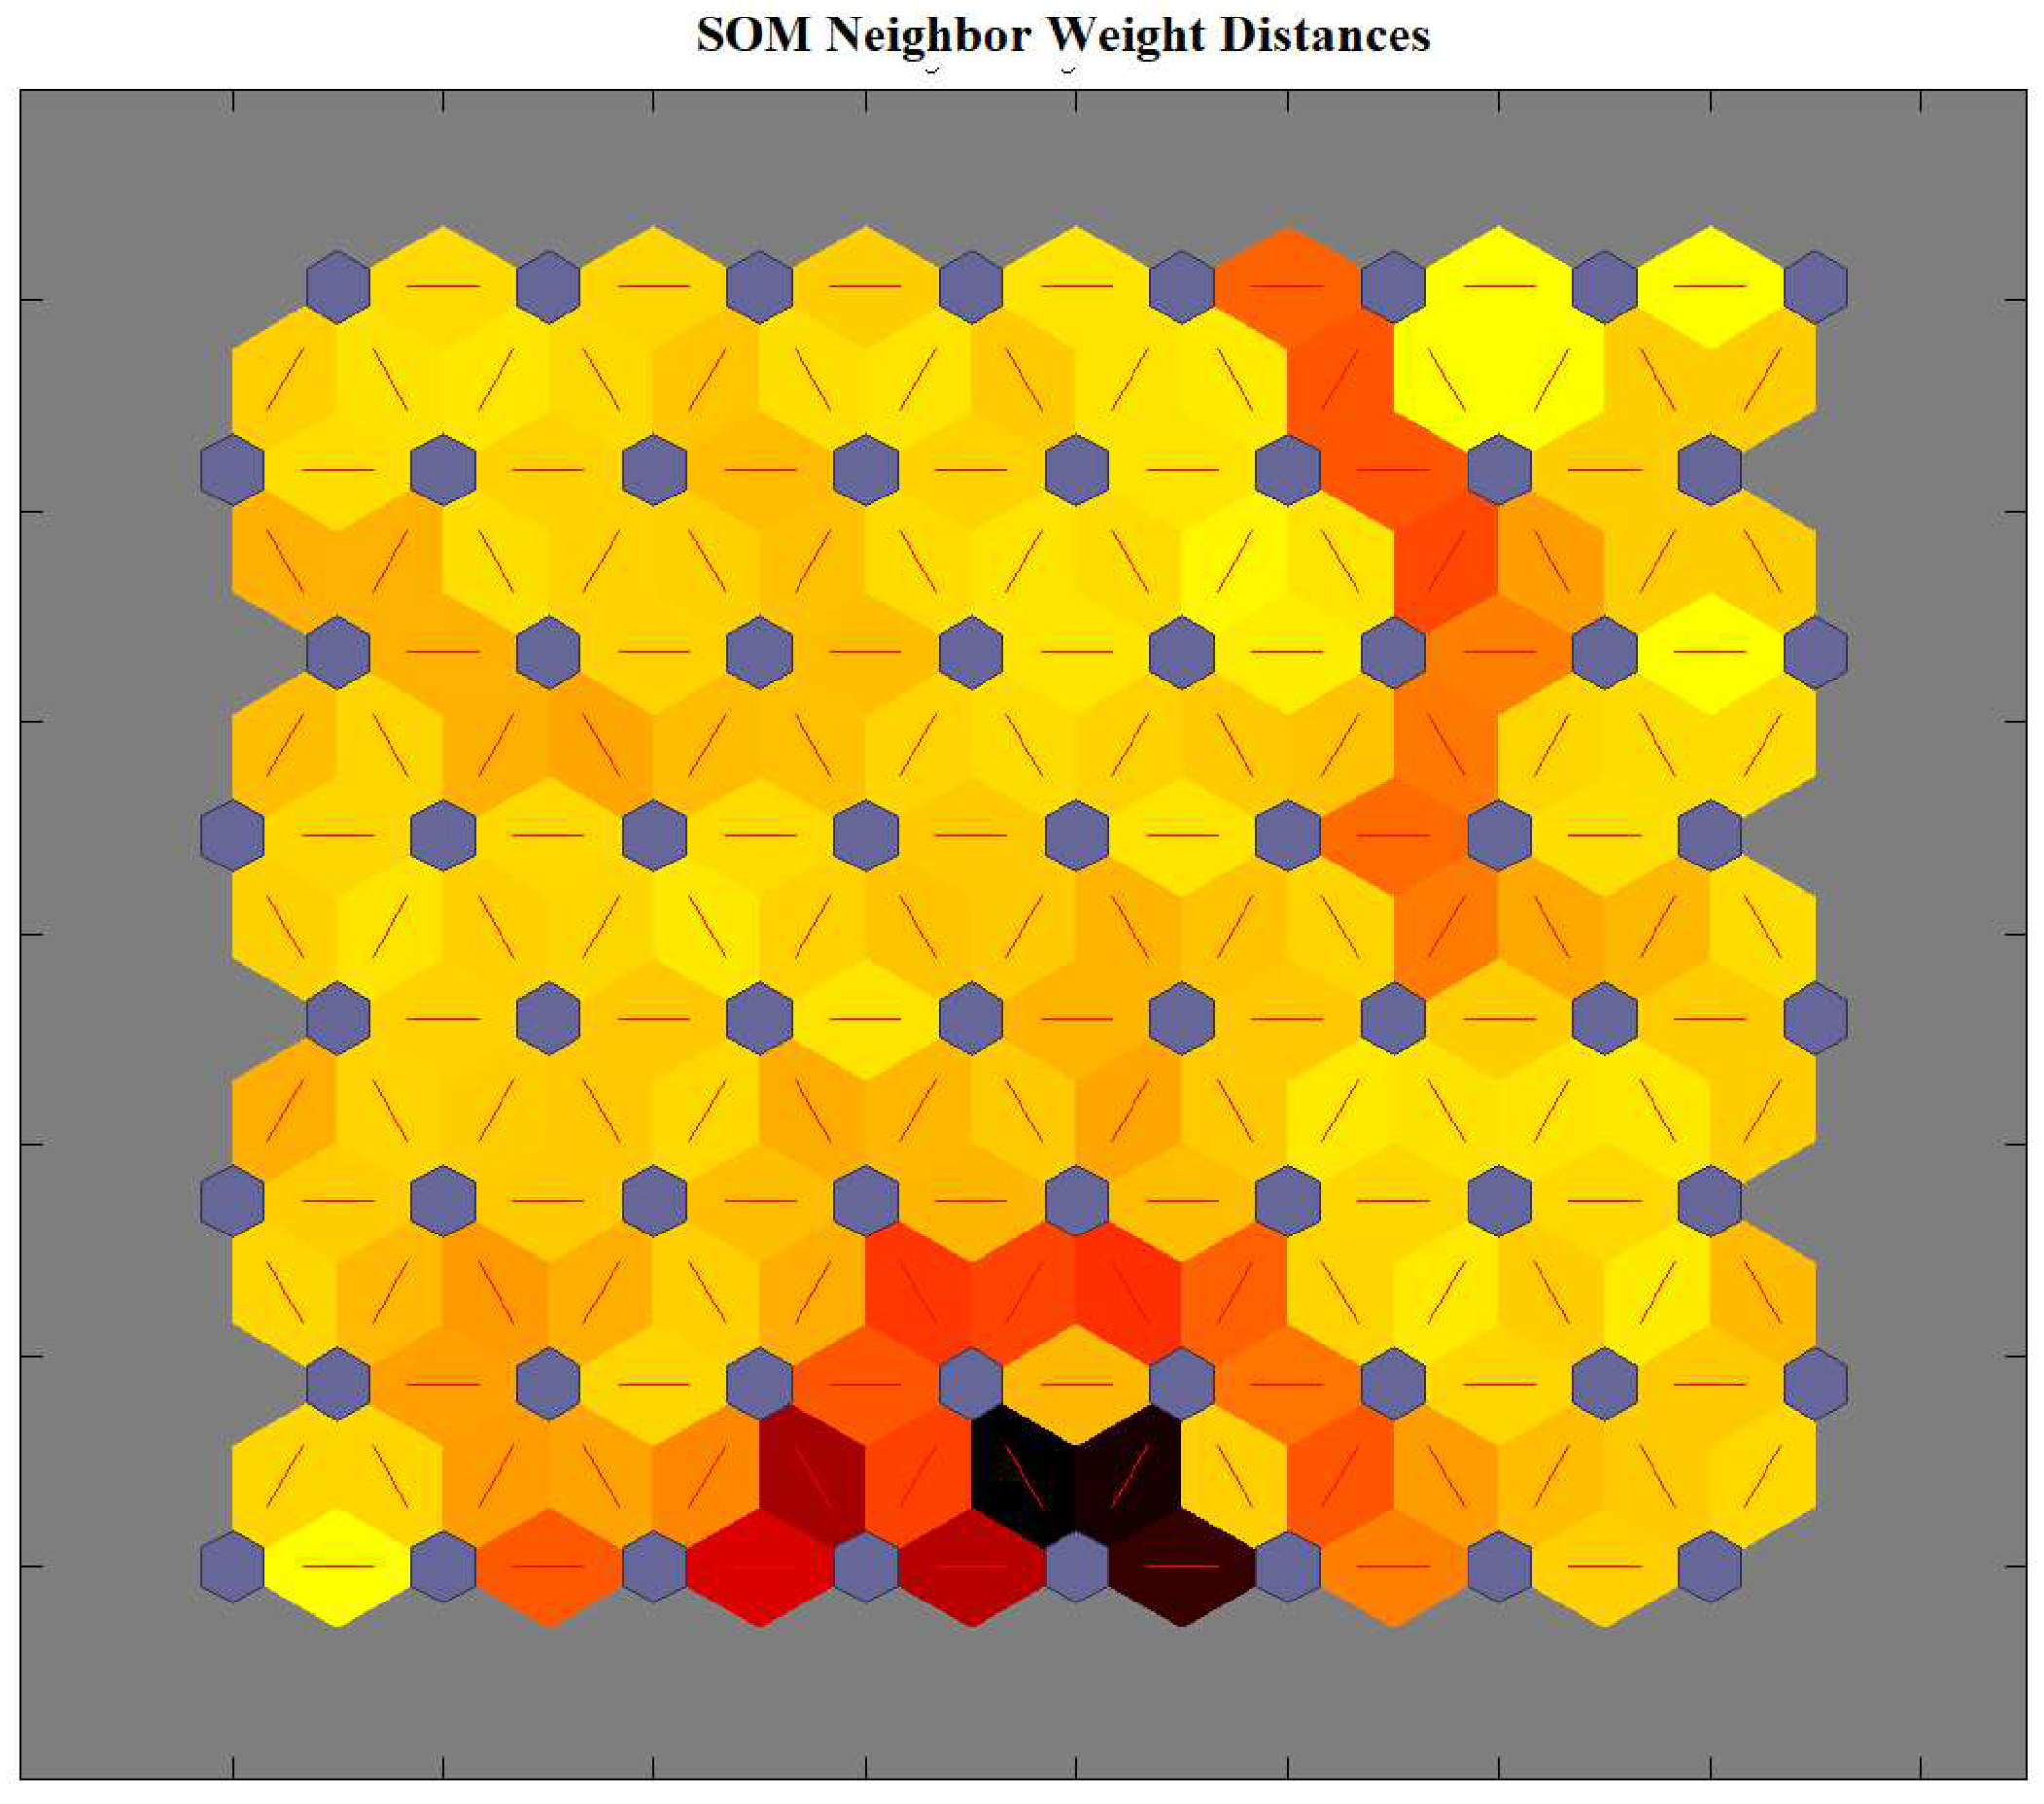
The system as exemplified herein was found to be able to provide a blood pressure estimation (both systolic and diastolic) in a few seconds, with (only) 4–5 s of PPG sampling found to facilitate accurate and reliable reconstruction of a blood pressure signal. Figure 8 shows the performance of the above neural networks during the learning process, whereas the distribution of the winner neurons of the SOM motor map input layer during the learning process is shown in Figure 9.
5. Testing and Future Works
The proposed approach has been extensively tested and validated. We used MATLAB as the software framework, running on a PC i5 quad-core. The PPG signal has been acquired with the hardware and software setup described in [24] as reported in Figure 2. This study was conducted in accordance with the Helsinki Declaration of 1975. All patients provided written informed consent before enrollment. The study was approved by the Ethical Committee Catania 1 (Authorization No. 113/2018/PO). Then, we proceeded to collect 42 patients having different genders (male and female), ages (between 20 and 70 years old) and pathologies (we collected healthy subjects and sick ones with different issues such as cardiac problems, hypertension, diabetes, etc.). In order to have a real and robust blood pressure estimation as a reference, for each patient, we measured the SBP and DBP by a classical sphygmomanometer device. Then, we started the PPG acquisition (for about two minutes). Finally, the proposed pipeline was applied to the acquired raw PPG signal in order to have an estimation of the SBP and DBP (we computed an averaging of the SBPs and DBP obtained by applying the proposed algorithm to the PPG acquired waveforms time series). The reference SBP and DBP measurements (acquired by the sphygmomanometer device) were compared with respect to the SBP and DBP values estimated by the proposed pipeline. For each patient, we performed several testing sessions (in different conditions: in the early morning, before eating, after eating, in the afternoon, etc.), in order to have a robust and efficient comparison of the proposed approach. The accuracy of SBP and DBP estimation was evaluated. For each patient, we compared the classic measurements of blood pressure (by sphygmomanometer device) with the same ones obtained by the proposed approach applied to the PPG signal acquired immediately after the referenced classic measure. All the classic measurements were acquired by physiologists who collaborated in the experiments in order to have a robust and reliable blood pressure estimation. The training/testing ratio was 60/40, as 60% of the data had been used for training the proposed system and the residual 40% for testing the proposed pipeline.
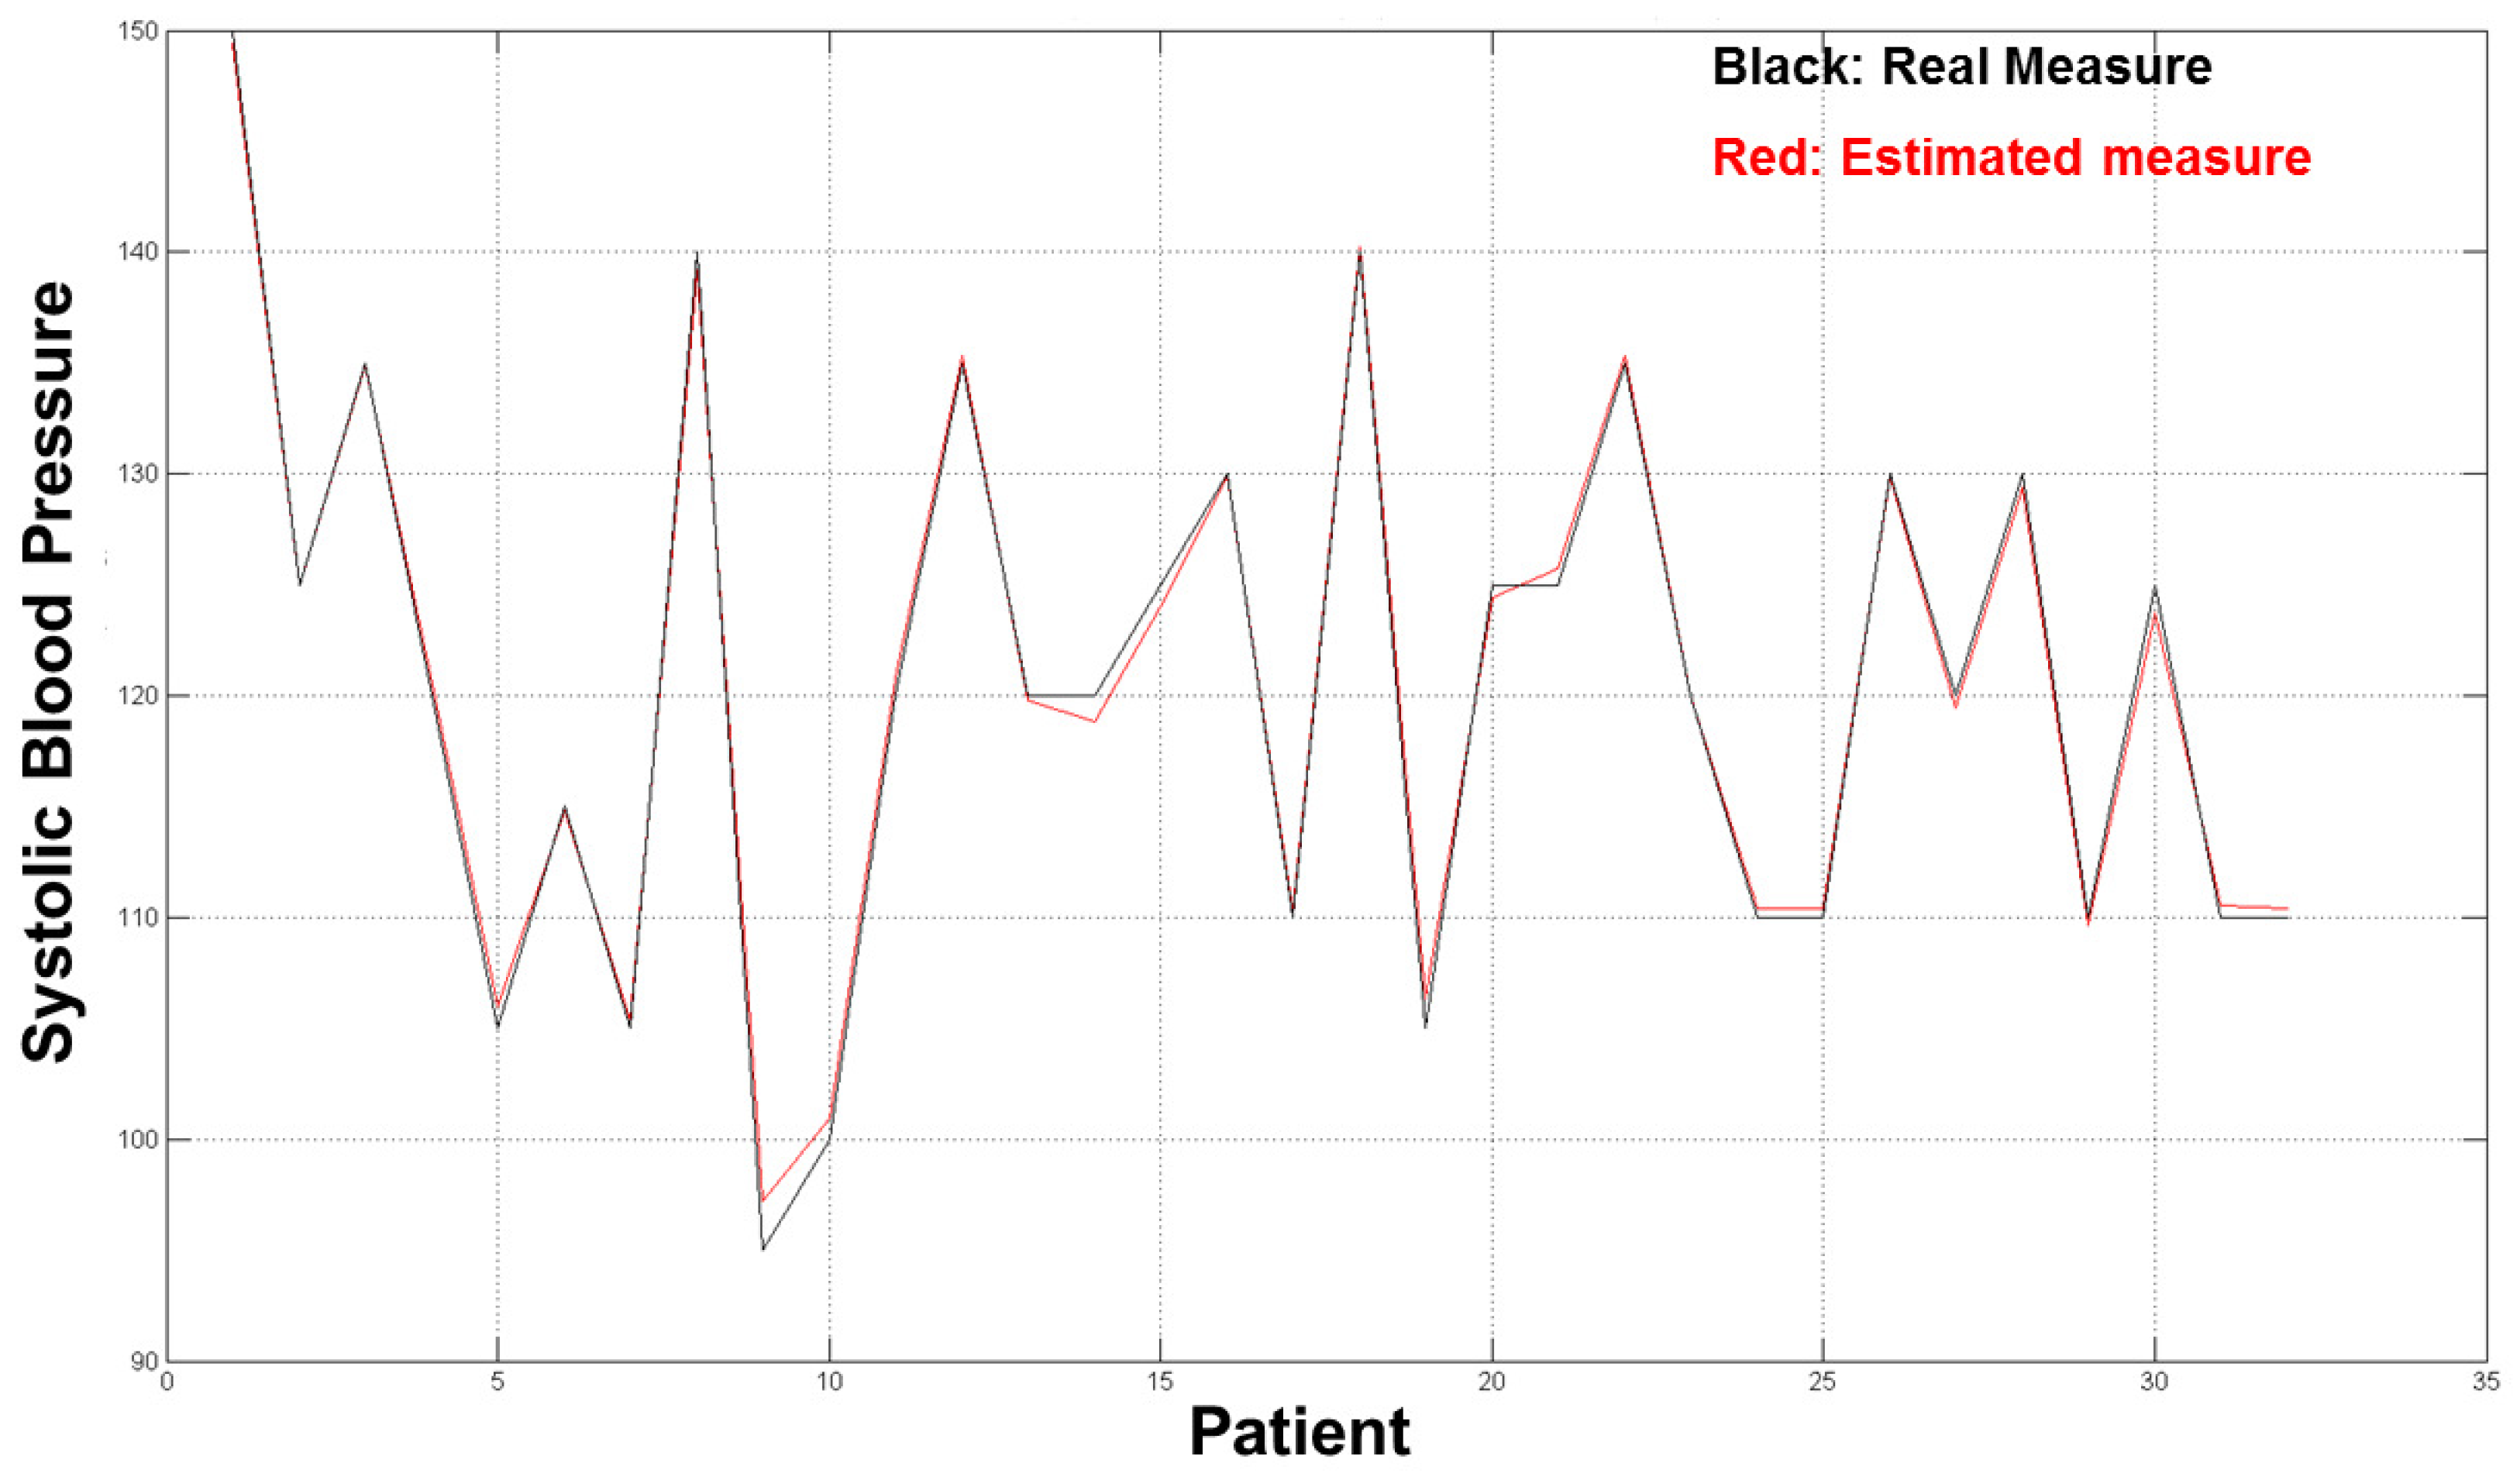
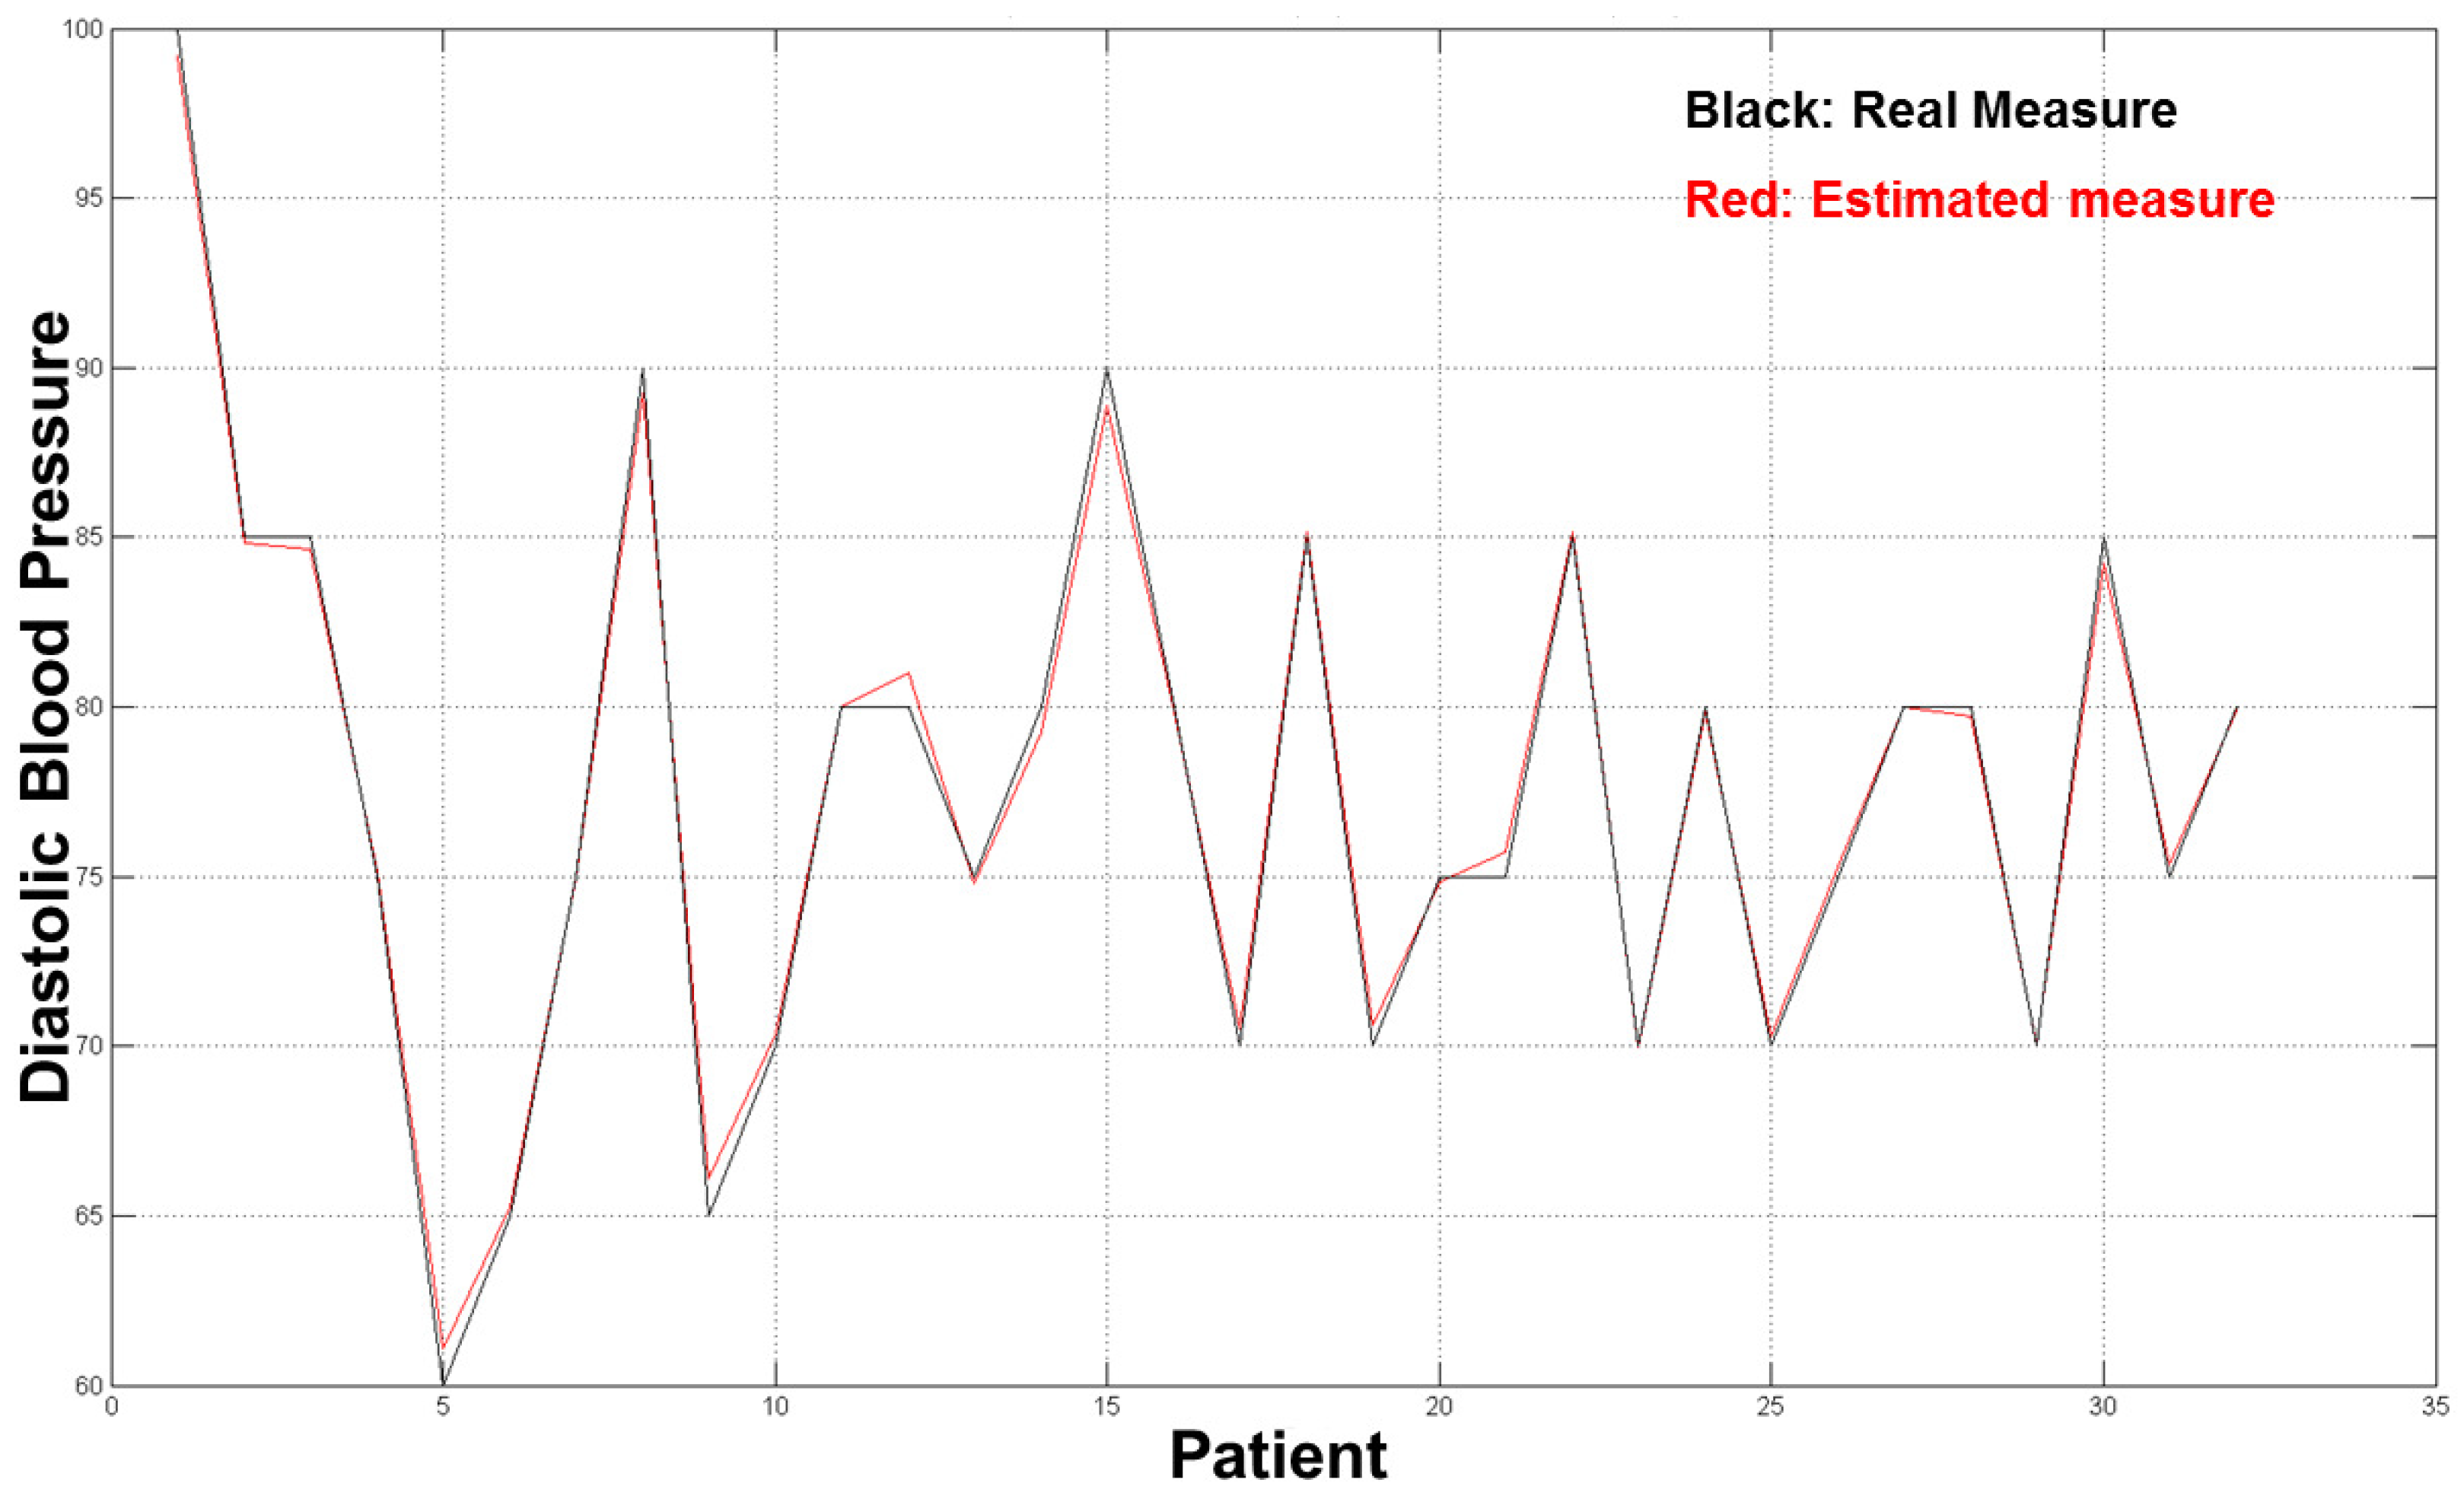
The diagrams in Figure 10 and Figure 11 show the good results we obtained in the validation set (32 residual subjects).
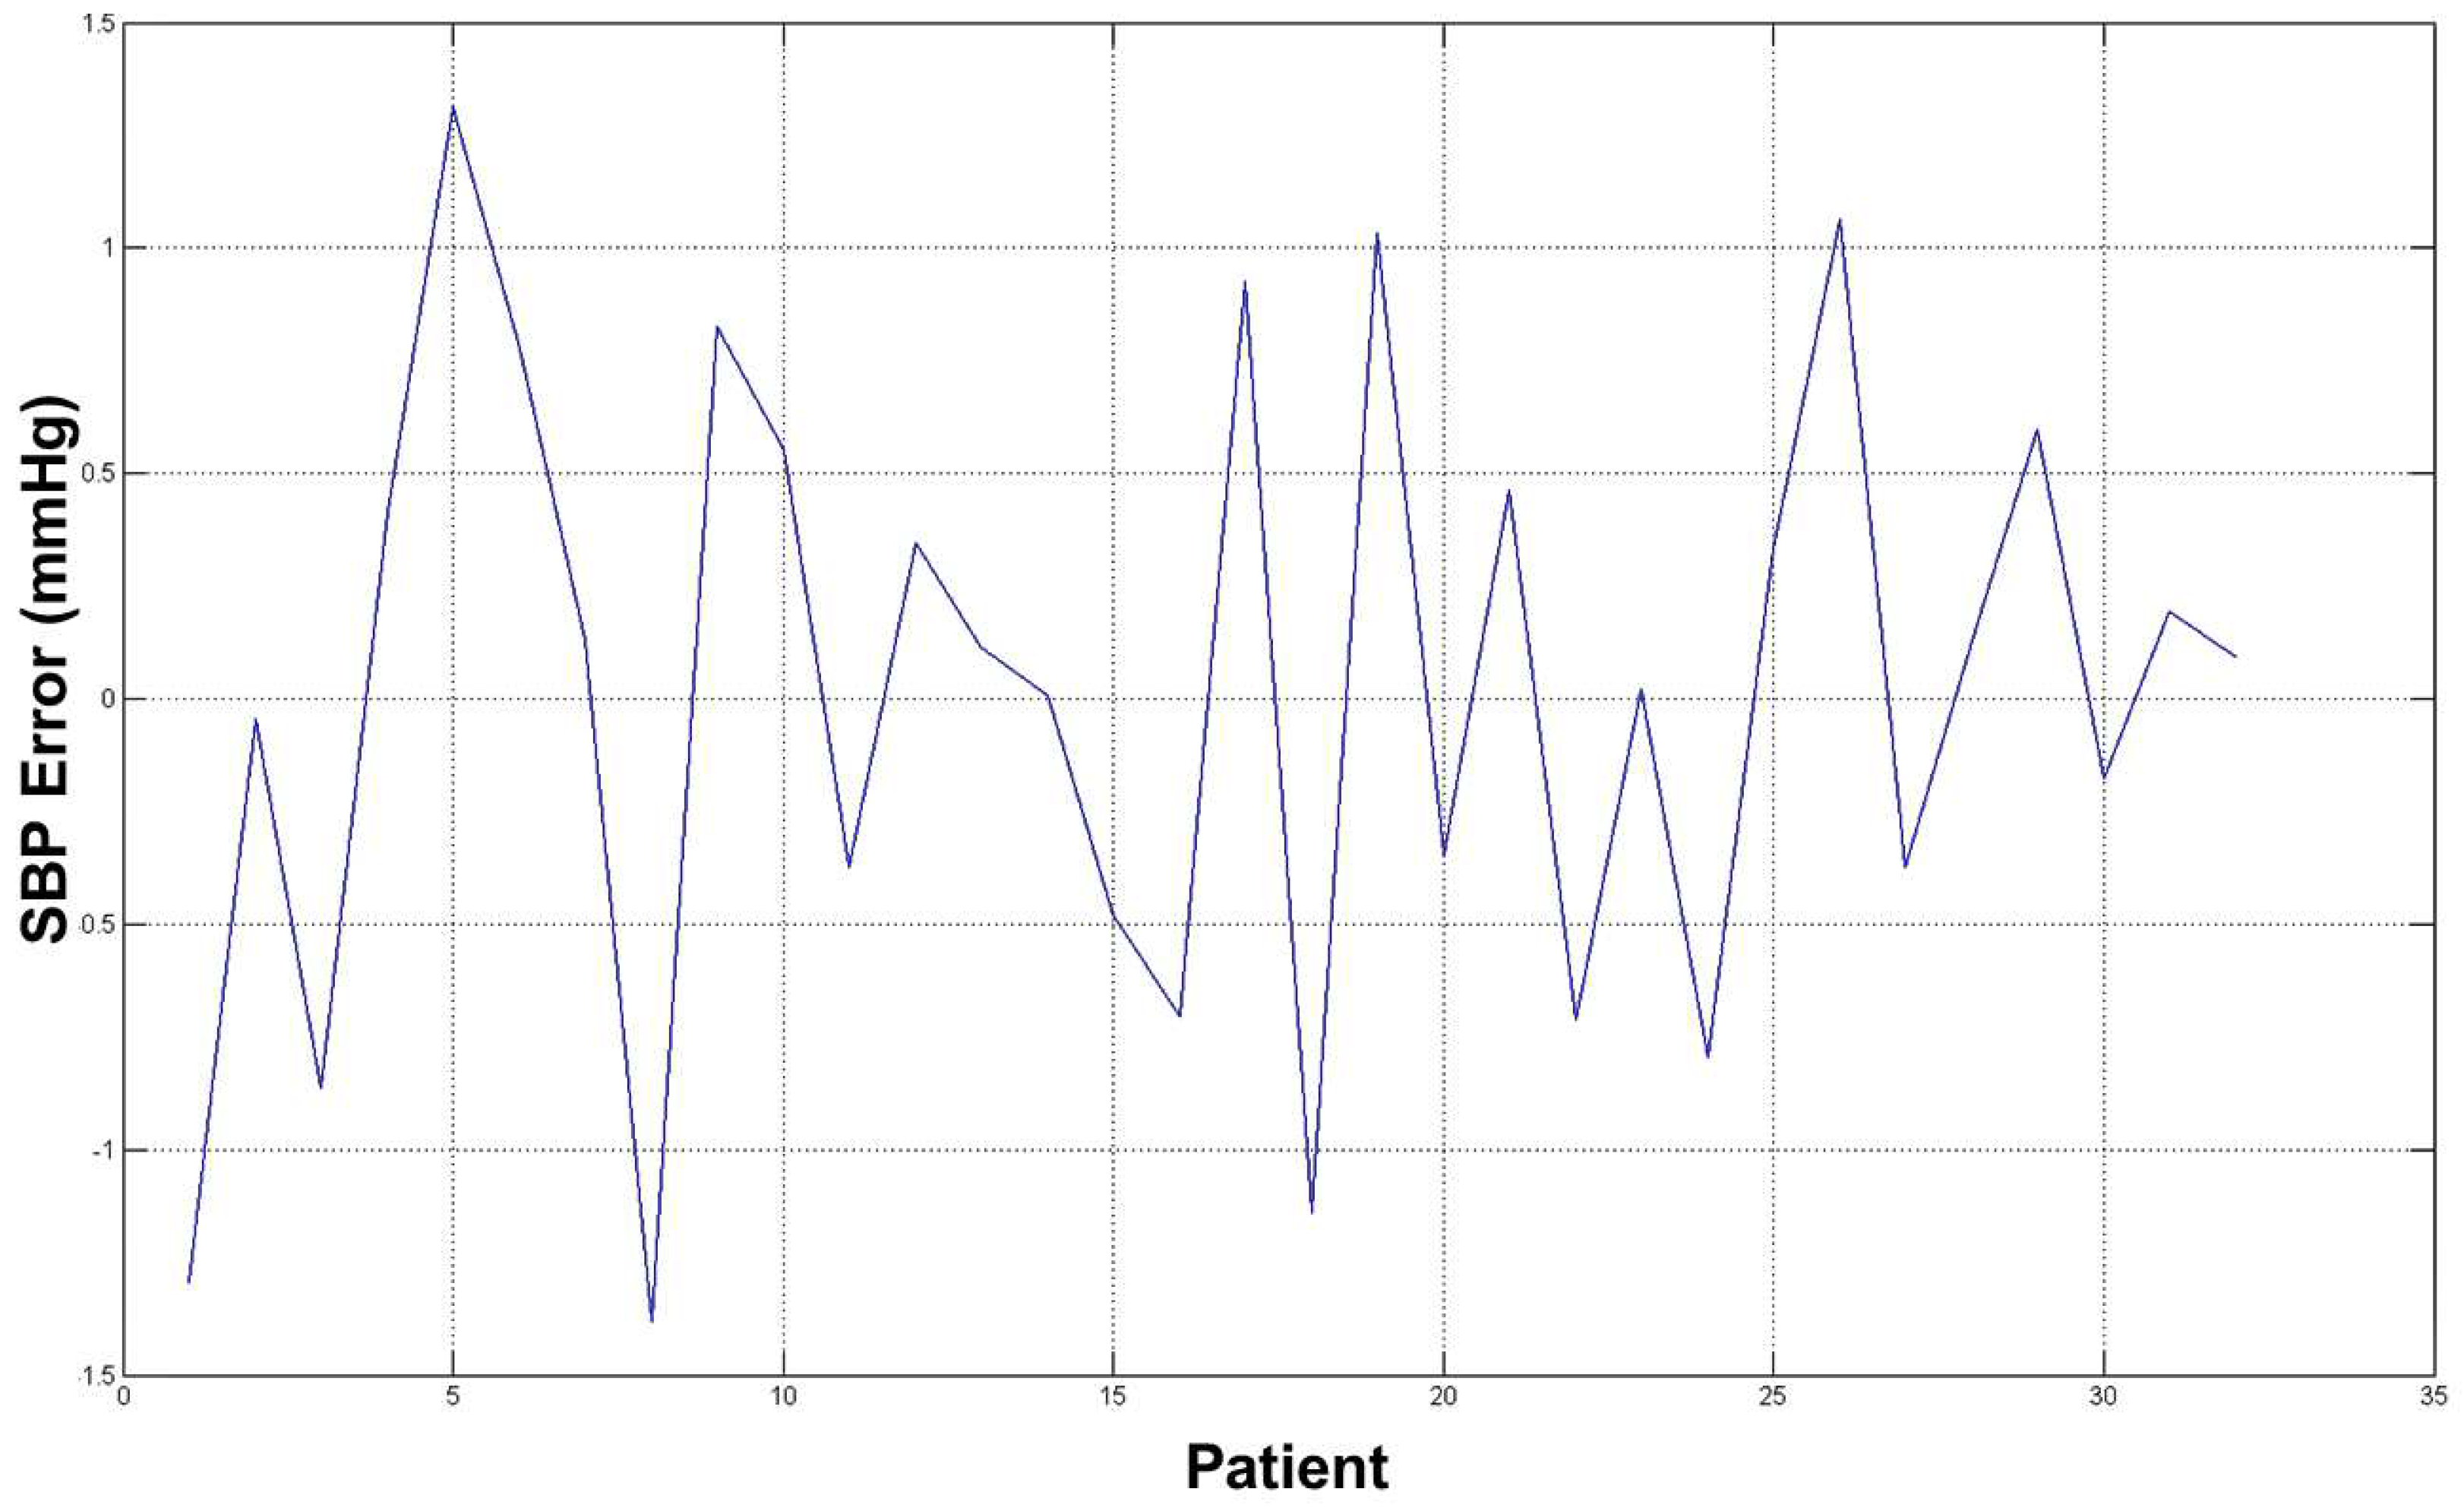
The average error for both estimation (SBP and DBP) was ∼2 mmHg, which is an acceptable result from a medical point of view and with respect to prior word mentioned above as the error estimation was about 10/15% of the real measure. The diagrams in Figure 12 and Figure 13 show the errors for such estimated pressures (both SBP and DBP).
We proposed a non-invasive cuff-less blood pressure system that can be easily embedded in different kinds of devices such as mobile phones to portable medical devices to a general embedded system. Actually, the PPG probe and the computing system can be easily integrated in portable devices (such as mobile phones, embedded devices, PCs, etc.) to reproduce the described system in order to have in a few seconds of PPG sampling an accurate estimation of blood pressure without any other hardware or medical knowledge as needed for instance for the sphygmomanometer-based approach. The proposed approach seems more accurate with respect to classical commercial digital devices as it shows (in the tested training set) a good accuracy ratio.
Future works will aim to improve a better estimation, increasing the training set number and the type of neural system we used. We are performing such simulations by using the recent LSTM (Long-Short-Term Memory) neural network with such a regression layer, as it seems more accurate with respect to the neural networks used in the proposed approach.
Author Contributions
Investigation, F.R.; Validation S.C.; Writing-Review & Editing, A.O. and S.B.
Funding
This research received no external funding.
Conflicts of Interest
The authors declare no conflict of interest.
References
- McCombie, D.B.; Andrew, T.R.; Asada, H.H. Adaptive blood pressure estimation from wearable PPG sensors using peripheral artery pulse wave velocity measurements and multi-channel blind identification of local arterial dynamics. In Proceedings of the 28th Annual International Conference of the IEEE Engineering in Medicine and Biology Society, New York, NY, USA, 30 August–3 Septenber 2006; pp. 3521–3524. [Google Scholar]
- Nichols, W.; O’Rourke, M.F. McDonald’s Blood Flow in Arteries: Theoretical, Experimental and Clinical Principles, 4th ed.; CRC Press: London, UK, 1998. [Google Scholar]
- Tijsseling, A.S.; Anderson, A.A. Isebree Moens and D.J. Korteweg: On the speed of propagation of waves in elastic tubes. BHR Group. In Proceedings of the 11th International Conference on Pressure Surges, Lisbon, Portugal, 24–26 October 2012; Anderson, S., Ed.; pp. 227–245, ISBN 978-1-85598-133-1. [Google Scholar]
- Kurylyak, Y.; Lamonaca, F.; Grimaldi, D. A Neural Network-based method for continuous blood pressure estimation from a PPG signal. In Proceedings of the IEEE International Instrumentation and Measurement Technology Conference (I2MTC), Torino, Italy, 22–25 May 2013; pp. 280–283. [Google Scholar]
- Yan, Y.S.; Zhang, Y.T. Noninvasive estimation of blood pressure using photoplethysmographic signals in the period domain. In Proceedings of the 27th Annual International Conference of the Engineering in Medicine and Biology Society (IEEE-EMBS 2005), Shanghai, China, 1–4 September 2005; pp. 3583–3584. [Google Scholar]
- Gu, W.B.; Poon, C.C.Y.; Zhang, Y.T. A novel parameter from PPG dicrotic notch for estimation of systolic blood pressure using pulse transit time. In Proceedings of the 5th International Summer School and Symposium on Medical Devices and Biosensors (ISSS-MDBS 2008), Hong Kong, China, 1–3 June 2008; pp. 86–88. [Google Scholar]
- Meigas, K.; Kattai, R.; Lass, J. Continuous blood pressure monitoring using pulse wave delay. In Proceedings of the 23rd Annual International Conference of the IEEE Engineering in Medicine and Biology Society, Istanbul, Turkey, 25–28 October 2001; pp. 3171–3174. [Google Scholar] [Green Version]
- Cattivelli, F.S.; Garudadri, H. Noninvasive cuffless estimation of blood pressure from pulse arrival time and heart rate with adaptive calibration. In Proceedings of the Sixth International Workshop on Wearable and Implantable Body Sensor Networks (BSN 2009), Berkeley, CA, USA, 3–5 June 2009; pp. 114–119. [Google Scholar]
- Teng, X.F.; Zhang, Y.T. Continuous and noninvasive estimation of arterial blood pressure using a photoplethysmographic approach. In Proceedings of the 25th Annual International Conference of the IEEE Engineering in Medicine and Biology Society, Cancun, Mexico, 17–21 September 2003; pp. 3153–3156. [Google Scholar]
- Fortino, G.; Giampà, V. PPG-based methods for non invasive and continuous BP measurement: an overview and development issues in body sensor networks. In Proceedings of the IEEE International Workshop on Medical Measurements and Applications (MeMeA’2010), Ottawa, ON, Canada, 30 April–1 May 2010; pp. 10–13. [Google Scholar]
- Kim, J.Y.; Cho, B.H.; Im, S.M.; Jeon, M.J.; Kim, I.Y.; Kim, S.I. Comparative study on artificial neural network with multiple regressions for continuous estimation of blood pressure. In Proceedings of the 27th Annual International Conference of the IEEE Engineering in Medicine and Biology Society, Shanghai, China, 1–4 September 2005; pp. 6942–6945. [Google Scholar]
- Goldberger, A.L.; Amaral, L.A.; Glass, L.; Hausdorff, J.M.; Ivanov, P.C.; Mark, R.G.; Mietus, J.E.; Moody, G.B.; Peng, C.K.; Stanley, H.E. PhysioBank, PhysioToolkit, and PhysioNet: Components of a New Research Resource for Complex Physiologic Signals. Circulation 2000, 101, 215–220. [Google Scholar] [CrossRef]
- Kurylyak, Y.; Lamonaca, F.; Grimaldi, D. Smartphone-Based Photoplethysmogram Measurement. In Digital Image and Signal Processing for Measurement Systems; Duro, R.J., López-Peña, F., Eds.; River Publisher: River City, Denmark, 2012; pp. 135–164. [Google Scholar]
- Lamonaca, F.; Kurylyak, Y.; Grimaldi, D.; Spagnuolo, V. Reliable pulse rate evaluation by smartphone. In Proceedings of the IEEE International Symposium on Medical Measurements and Applications Proceedings (MeMeA 2012), Budapest, Hungary, 18–19 May 2012; pp. 234–237. [Google Scholar]
- Gaurav, A.; Maheedhar, M.; Tiwari, V.N.; Narayanan, R. Cuff-less PPG based continuous blood pressure monitoring—A smartphone based approach. In Proceedings of the 38th Annual International Conference of the IEEE Engineering in Medicine and Biology Society (EMBC), Orlando, FL, USA, 16–20 August 2016; pp. 607–610. [Google Scholar]
- Datta, S.; Banerjee, R.; Choudhury, A.D.; Sinha, A.; Pal, A. Blood pressure estimation from photoplethysmogram using latent parameters. In Proceedings of the 2016 IEEE International Conference on Communications (ICC), Kuala Lumpur, Malaysia, 22–27 May 2016; pp. 1–7. [Google Scholar]
- Kao, Y.H.; Paul, C.-P.C.; Wey, C.-L. A PPG sensor for continuous cuffless blood pressure monitoring with self-adaptive signal processing. In Proceedings of the 2017 International Conference on Applied System Innovation (ICASI), Sapporo, Japan, 13–17 May 2017; pp. 357–360. [Google Scholar]
- Slapničar, G.; Luštrek, M.; Marinko, M. Continuous Blood Pressure Estimation from PPG Signal. Informatica 2018, 42, 33–42. [Google Scholar]
- Kachuee, M.; Kiani, M.M.; Mohammadzade, H.; Shabany, M. Cuff-less high-accuracy calibration-free blood pressure estimation using pulse transit time. In Proceedings of the 2015 IEEE International Symposium on Circuits and Systems (ISCAS), Lisbon, Portugal, 24–27 May 2015; pp. 1006–1009. [Google Scholar]
- Oreggia, D.; Guarino, S.; Parisi, A.; Pernice, R.; Adamo, G.; Mistretta, L.; Di Buono, P.; Fallica, G.; Cino, C.A.; Busacca, A.C. Physiological parameters measurements in a cardiac cycle via a combo PPG-ECG system. In Proceedings of the AEIT International Annual Conference, Naples, Italy, 14–16 October 2015; pp. 1–6. [Google Scholar]
- Vinciguerra, V.; Ambra, E.; Maddiona, L.; Oliveri, S.; Romeo, M.F.; Mazzillo, M.; Rundo, F.; Fallica, G. Progresses towards a Processing Pipeline in Photoplethysmogram (PPG) based on SiPMs. In Proceedings of the 23 European Conference on Circuit Theory and Design, Catania, Italy, 4–6 September 2017. [Google Scholar]
- Tang, S.K.D.; Goh, S.; Wong, M.L.D.; Lew, Y.E. PPG signal reconstruction using a combination of discrete wavelet transform and empirical mode decomposition. In Proceedings of the 6th International Conference on Intelligent and Advanced Systems (ICIAS), Kuala Lumpur, Malaysia, 15–17 August 2016; pp. 1–4. [Google Scholar]
- Yadhuraj, S.R.; Sudarshan, B.G. GUI creation for removal of motion artifact in PPG signals. In Proceedings of the 3rd International Conference on Advanced Computing and Communication Systems (ICACCS), Coimbatore, India, 22–23 January 2016; pp. 1–5. [Google Scholar]
- Rundo, F.; Conoci, S.; Ortis, A.; Battiato, S. An Advanced Bio-Inspired PhotoPlethysmoGraphy (PPG) and ECG Pattern Recognition System for Medical Assessment. Sensors 2018, 18, 405. [Google Scholar] [CrossRef] [PubMed]
- Mazzillo, M.; Maddiona, L.; Rundo, F.; Sciuto, A.; Libertino, S.; Lombardo, S.; Fallica, G. Characterization of sipms with nir long-pass interferential and plastic filters. IEEE Photonics J. 2018, 10, 1–12. [Google Scholar] [CrossRef]
- Mazzillo, M.; Nagy, F.; Sanfilippo, D.; Valvo, G.; Carbone, B.; Piana, A.; Fallica, G. Silicon photomultiplier technology for low-light intensity detection. Sensors 2013, 13, 1–4. [Google Scholar] [CrossRef]
- Mazzillo, M.; Mello, D.; Barbarino, P.P.; Romeo, M.F.; Musienko, Y.; Sciuto, A.; Libertino, S.; Lombardo, S.A.; Fallica, G. Electro-Optical Characterization of SiPMs With Green Bandpass Dichroic Filters. IEEE Sens. J. 2017, 17, 4075–4082. [Google Scholar] [CrossRef]
- Matthews, J.H. Simpson’s 3/8 Rule for Numerical Integration. Numerical Analysis-Numerical Methods Project. California State University, Fullerton Archived from the original on 4 December 2008. Retrieved 11 November 2008. Available online: http://mathfaculty.fullerton.edu/mathews/N340/Math340.htm (accessed on 28 August 2018).
- Fletcher, R.; Reeves, C.M. Function minimizazion by conjugate gradients. Comput. J. 1964, 7, 149–154. [Google Scholar] [CrossRef]
- Hagan, M.T.; Demuth, H.B.; Beale, M.H.; De Jesús, O. Neural Network Design; PWS Publishing: Boston, MA, USA, 1996; pp. 9-15–9-22. [Google Scholar]
- Arena, P.; Bucolo, M.; Fortuna, L.; Frasca, M. Motor map for nonlinear control. In Proceedings of the 6th Experimental Chaos Conference, Potsdam, Germany, 22–26 July 2001. [Google Scholar]
- Battiato, S.; Rundo, F.; Stanco, F. An Improved Image Re-Indexing Technique by Self Organizing Motor Maps. In International Workshop on Computational Color Imaging; Springer: Berlin/Heidelberg, Germany, 2009. [Google Scholar]
- Battiato, S.; Rundo, F.; Stanco, F. Self organizing motor maps for color-mapped image re-indexing. IEEE Trans. Image Process. 2007, 16, 2905–2915. [Google Scholar] [CrossRef] [PubMed]
Figure 1.
A compliant standard PPG waveform. The different signal components are detailed: Systolic Peak (SP), Dicrotic Notch (DN) and Diastolic Peak (DP).
Figure 1.
A compliant standard PPG waveform. The different signal components are detailed: Systolic Peak (SP), Dicrotic Notch (DN) and Diastolic Peak (DP).

Figure 2.
Silicon Photomultiplier (SiPM) detector filter and PPG probe.

Figure 3.
Detailed description of the whole PPG signal sampling system and pattern recognition pipeline. PTT, Pulse Transmit Time.
Figure 3.
Detailed description of the whole PPG signal sampling system and pattern recognition pipeline. PTT, Pulse Transmit Time.
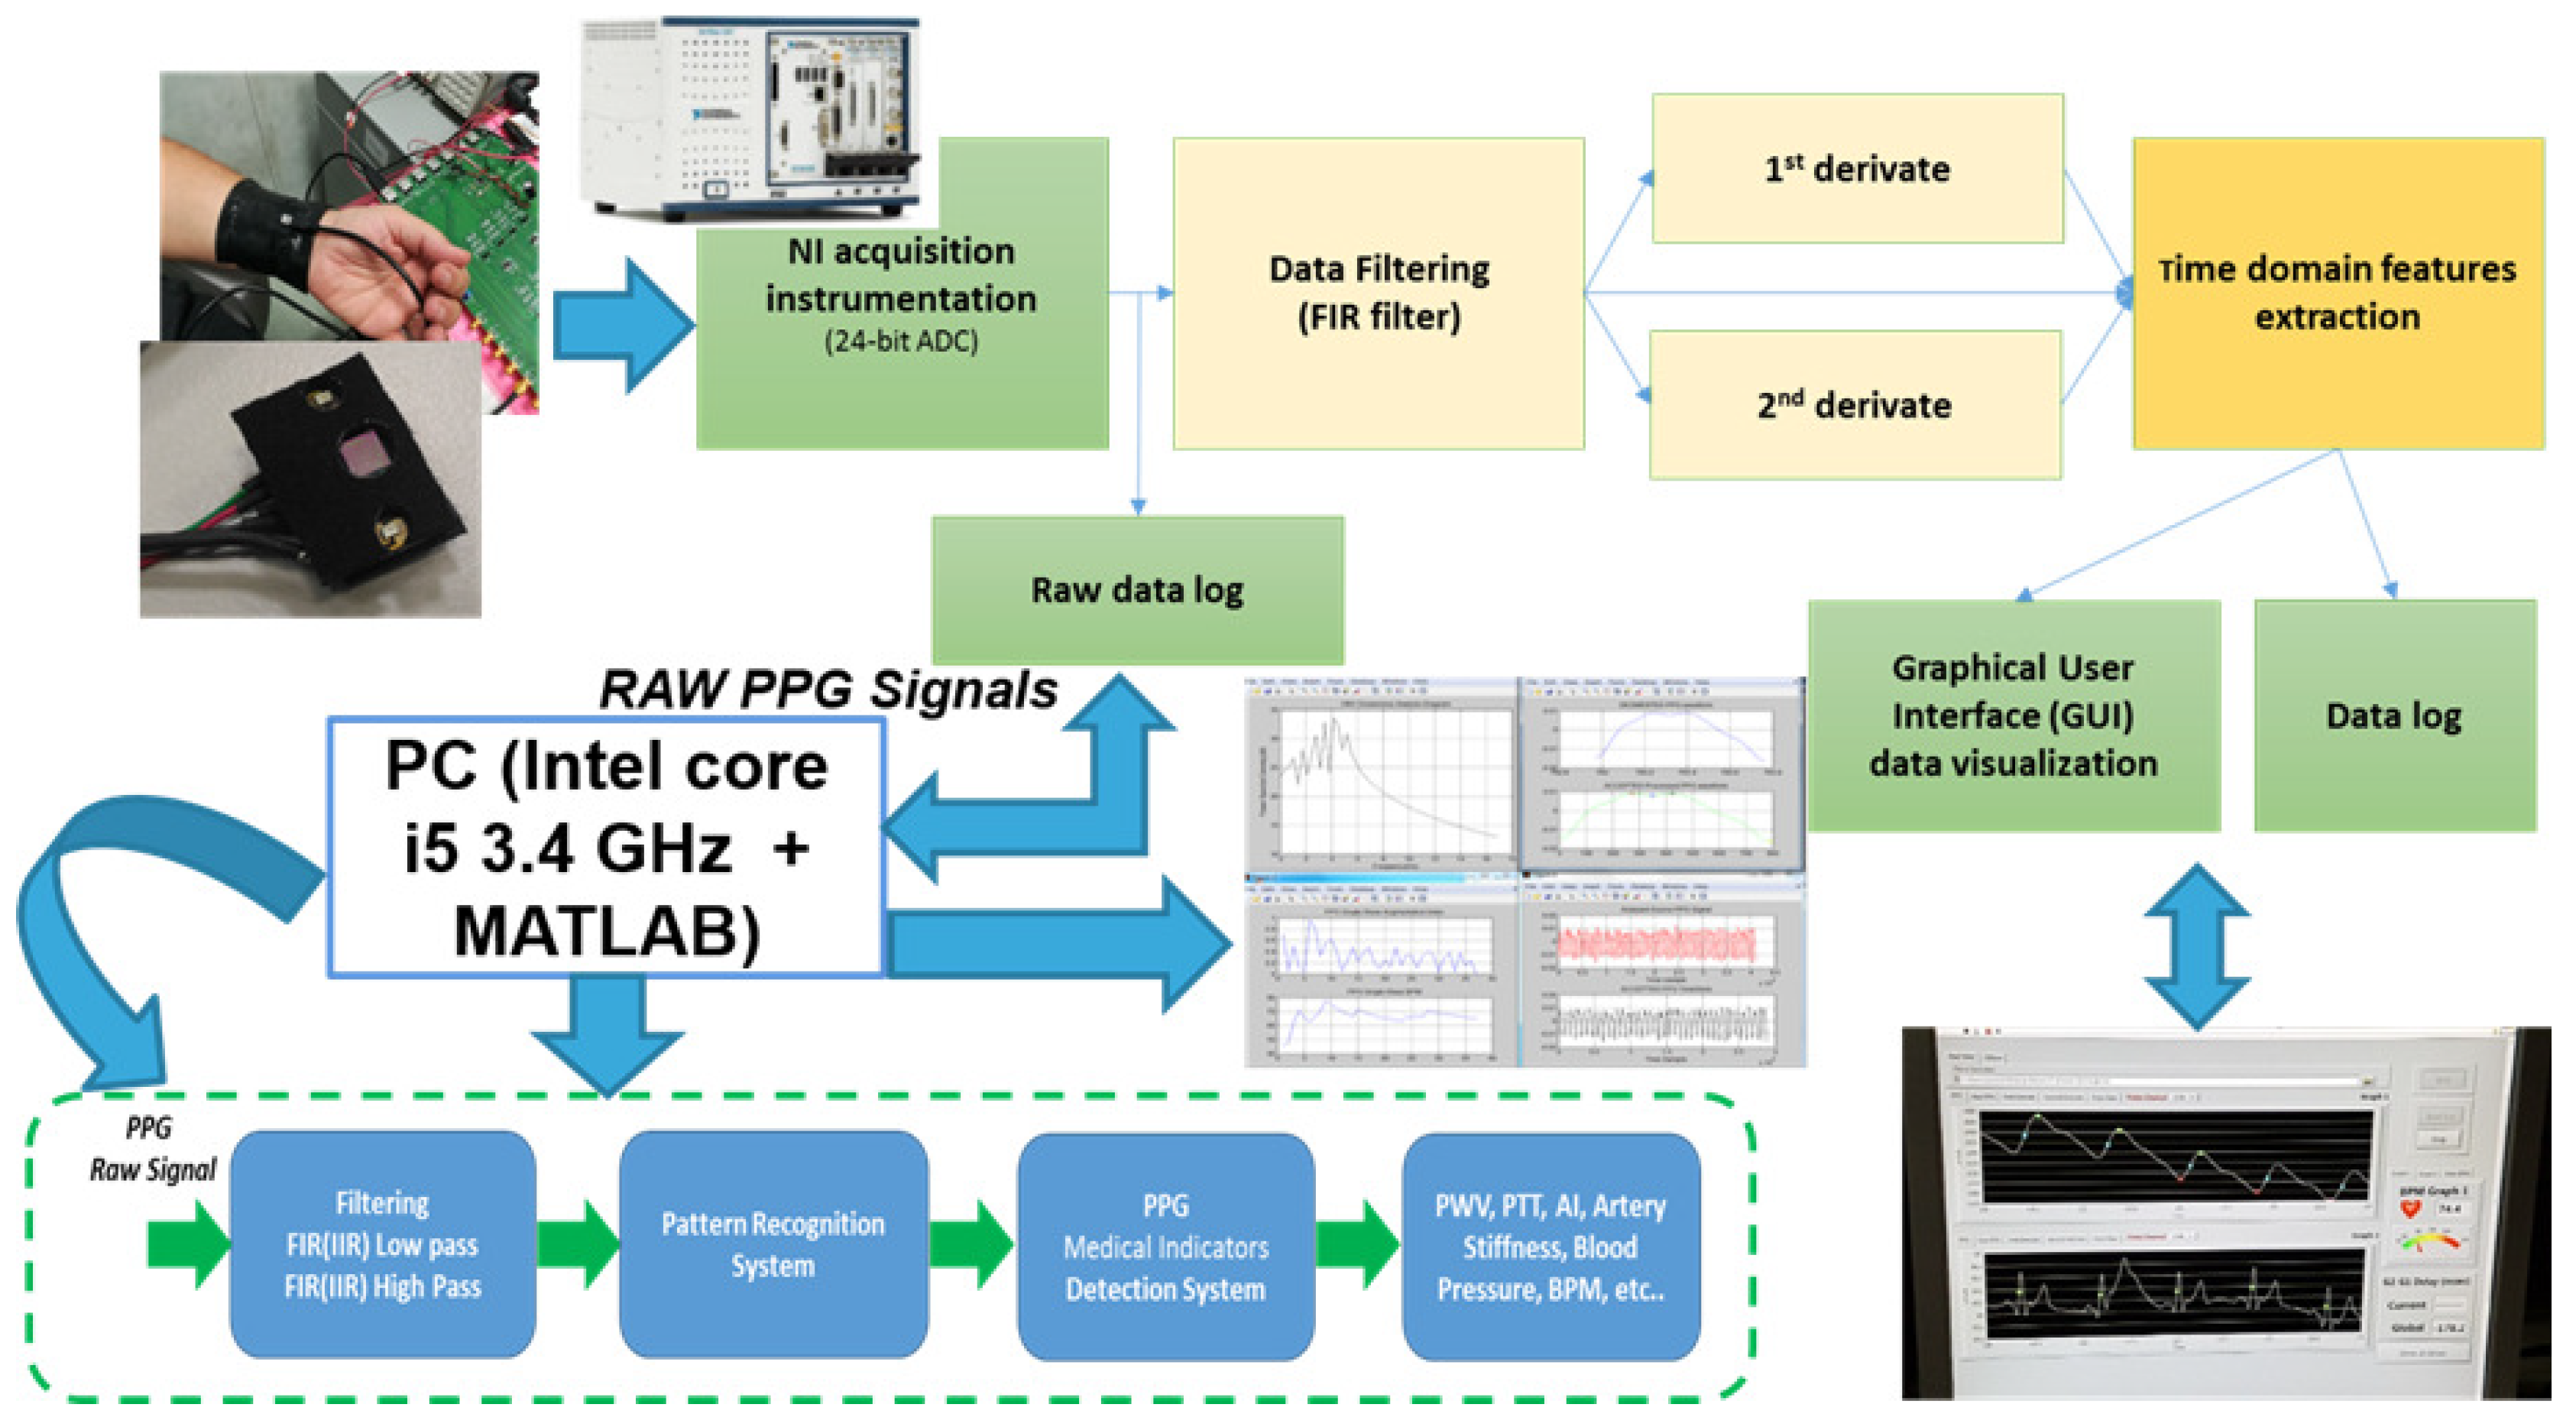
Figure 4.
Detailed description of the proposed blood pressure estimation algorithm. BI-P2RS, Bio-Inspired PPG Pattern Recognition System.
Figure 4.
Detailed description of the proposed blood pressure estimation algorithm. BI-P2RS, Bio-Inspired PPG Pattern Recognition System.
Figure 5.
Detailed description of the key-points of PPG, first and second derivative.

Figure 6.
Detailed description of the variables used for hand-crafted features F–F.
Figure 7.
Self-Organizing Map (SOM) motor map proposed pipeline. IL, Input Layer; OL, Output Layer.

Figure 8.
Performance diagrams of the Polak–Ribiere neural network over nine epochs (blue: learning/green: validation).
Figure 8.
Performance diagrams of the Polak–Ribiere neural network over nine epochs (blue: learning/green: validation).

Figure 9.
SOM motor map input layer winner neuron distribution (red neurons) during the learning process.
Figure 9.
SOM motor map input layer winner neuron distribution (red neurons) during the learning process.
Figure 10.
SBP estimation performance diagram.

Figure 11.
DBP estimation performance diagram.
Figure 12.
SBP estimation error diagram.
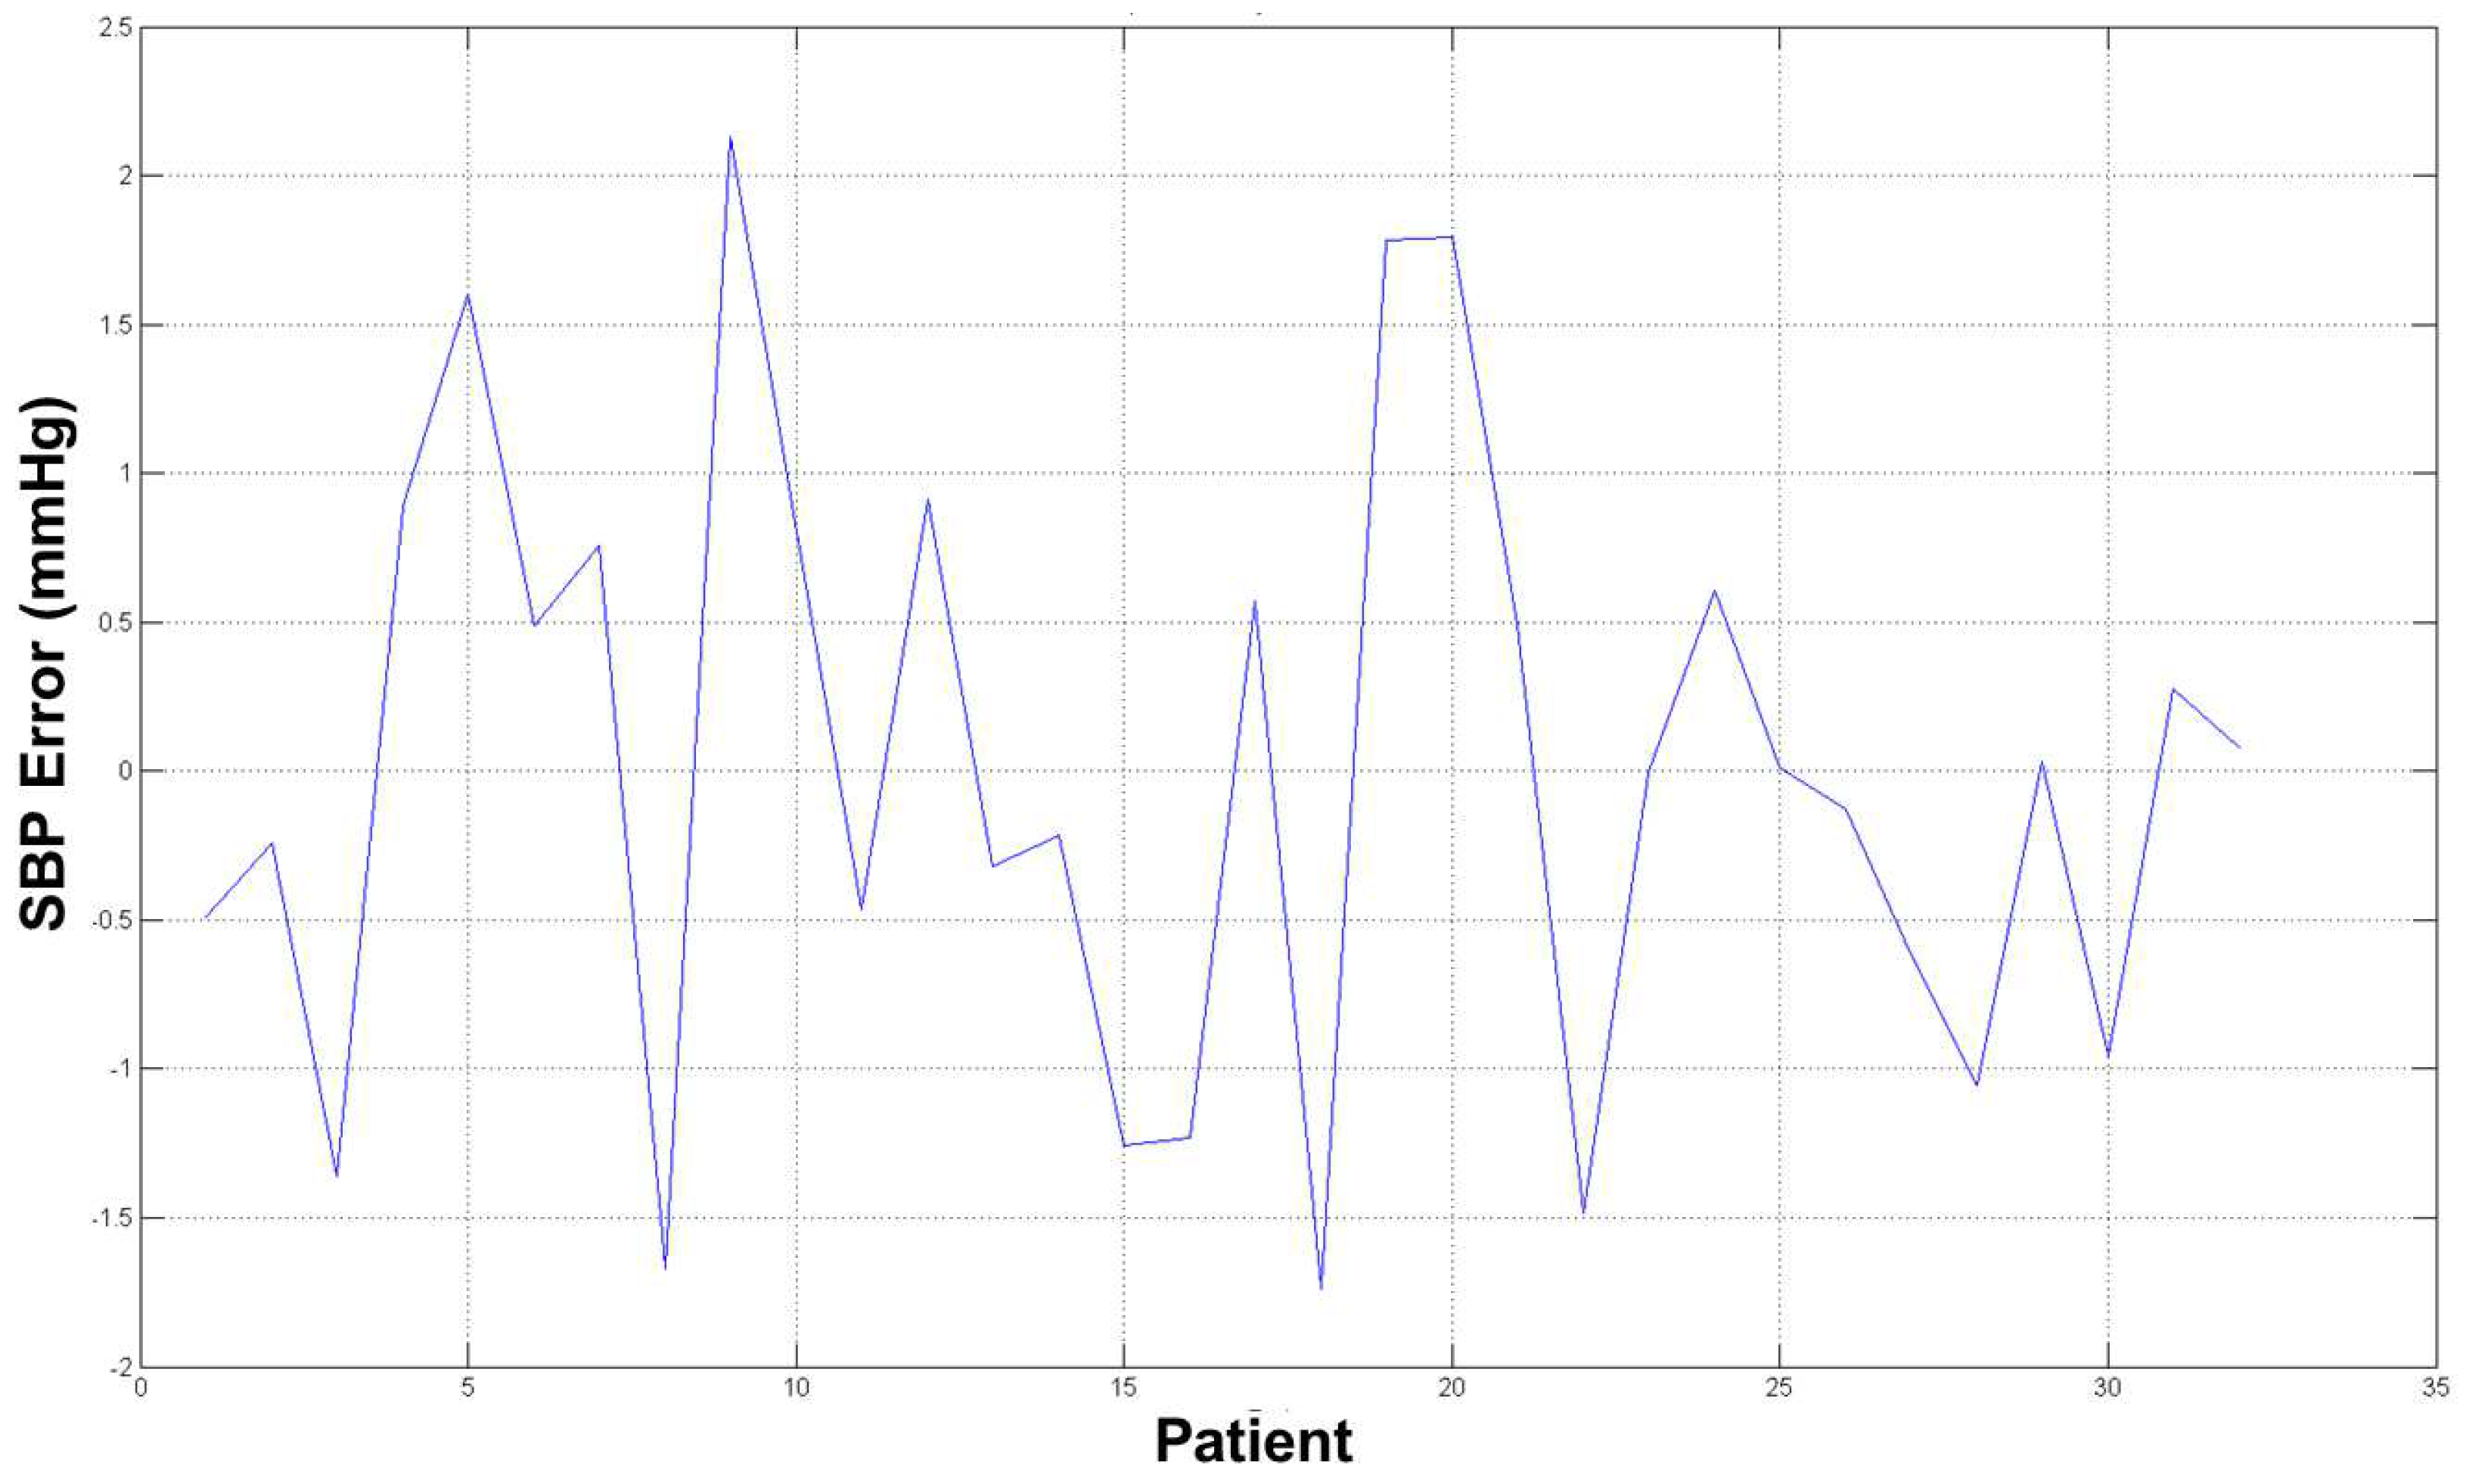
Figure 13.
DBP estimation error diagram.


Table 1.
Features from –.
Table 2.
Features from –.
Table 3.
Features from –.
© 2018 by the authors. Licensee MDPI, Basel, Switzerland. This article is an open access article distributed under the terms and conditions of the Creative Commons Attribution (CC BY) license (http://creativecommons.org/licenses/by/4.0/).
Share and Cite
MDPI and ACS Style
Rundo, F.; Ortis, A.; Battiato, S.; Conoci, S. Advanced Bio-Inspired System for Noninvasive Cuff-Less Blood Pressure Estimation from Physiological Signal Analysis. Computation 2018, 6, 46. https://doi.org/10.3390/computation6030046
AMA Style
Rundo F, Ortis A, Battiato S, Conoci S. Advanced Bio-Inspired System for Noninvasive Cuff-Less Blood Pressure Estimation from Physiological Signal Analysis. Computation. 2018; 6(3):46. https://doi.org/10.3390/computation6030046
Chicago/Turabian StyleRundo, Francesco, Alessandro Ortis, Sebastiano Battiato, and Sabrina Conoci. 2018. "Advanced Bio-Inspired System for Noninvasive Cuff-Less Blood Pressure Estimation from Physiological Signal Analysis" Computation 6, no. 3: 46. https://doi.org/10.3390/computation6030046
Note that from the first issue of 2016, this journal uses article numbers instead of page numbers. See further details here.