
Computational Analysis of Natural Ventilation Flows in Geodesic Dome Building in Hot Climates


Abstract
:
1. Introduction
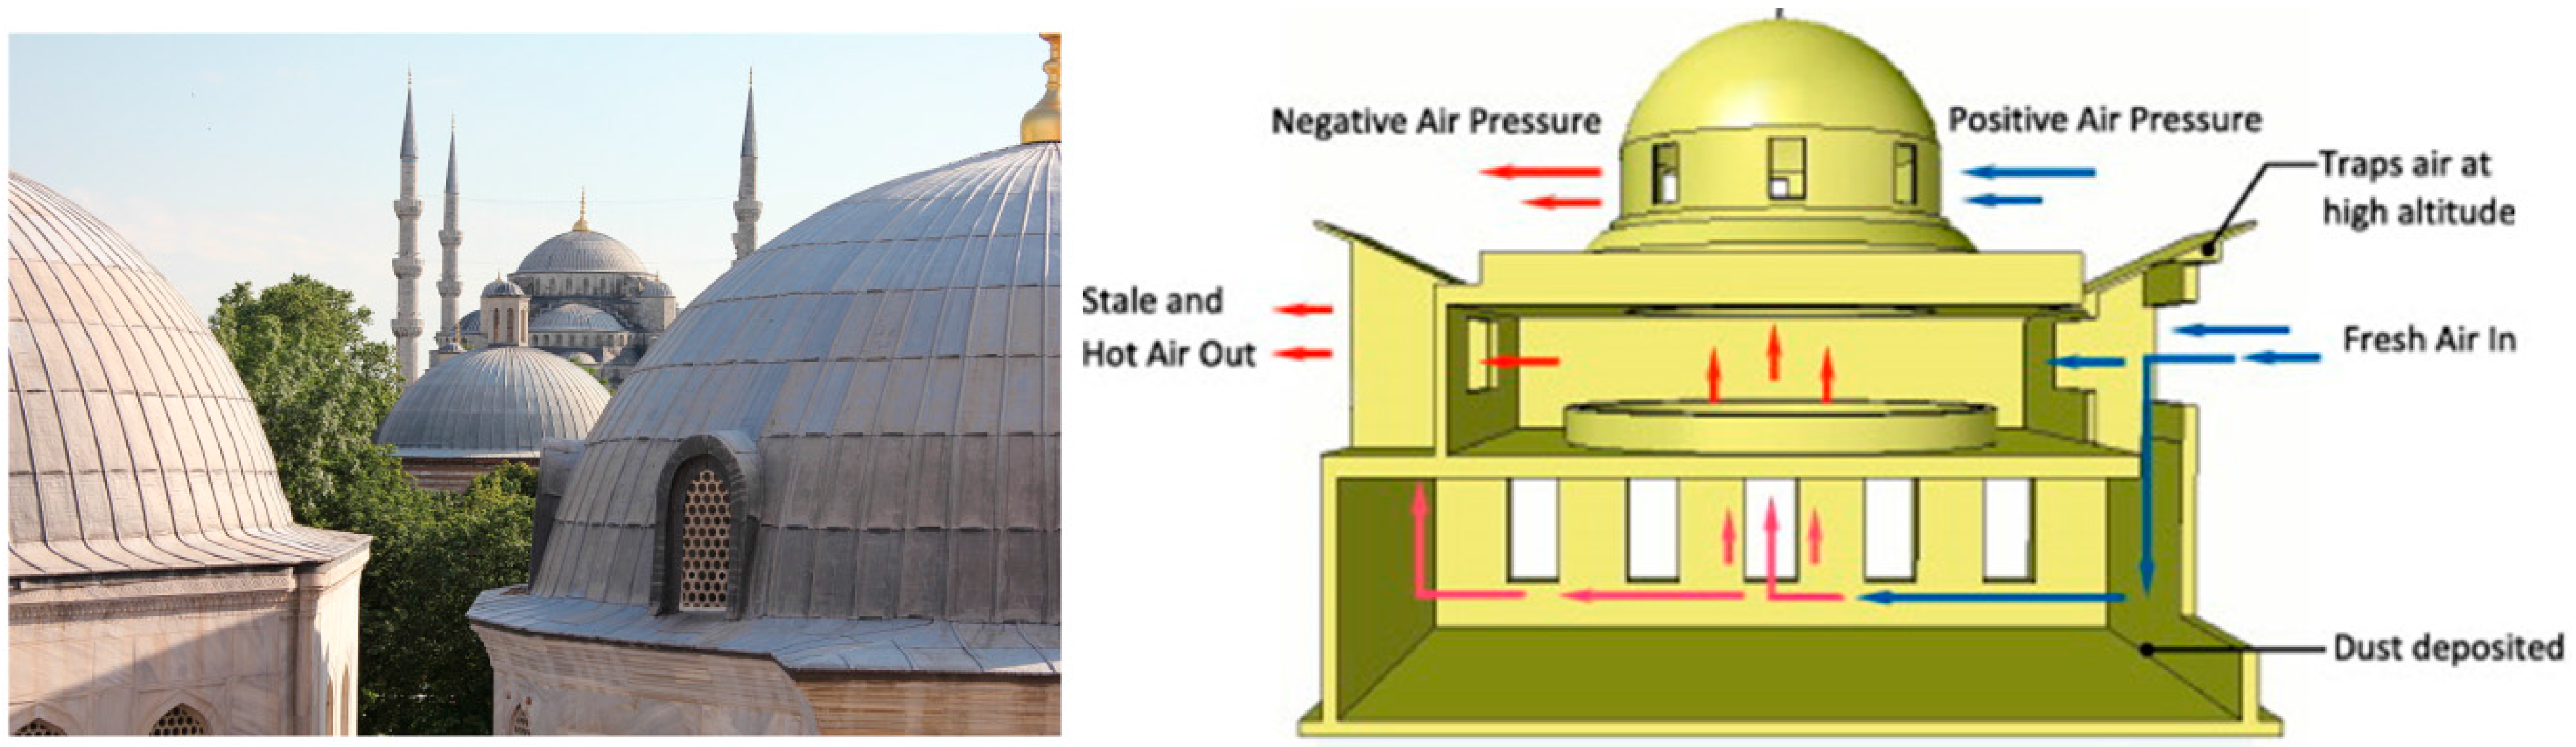
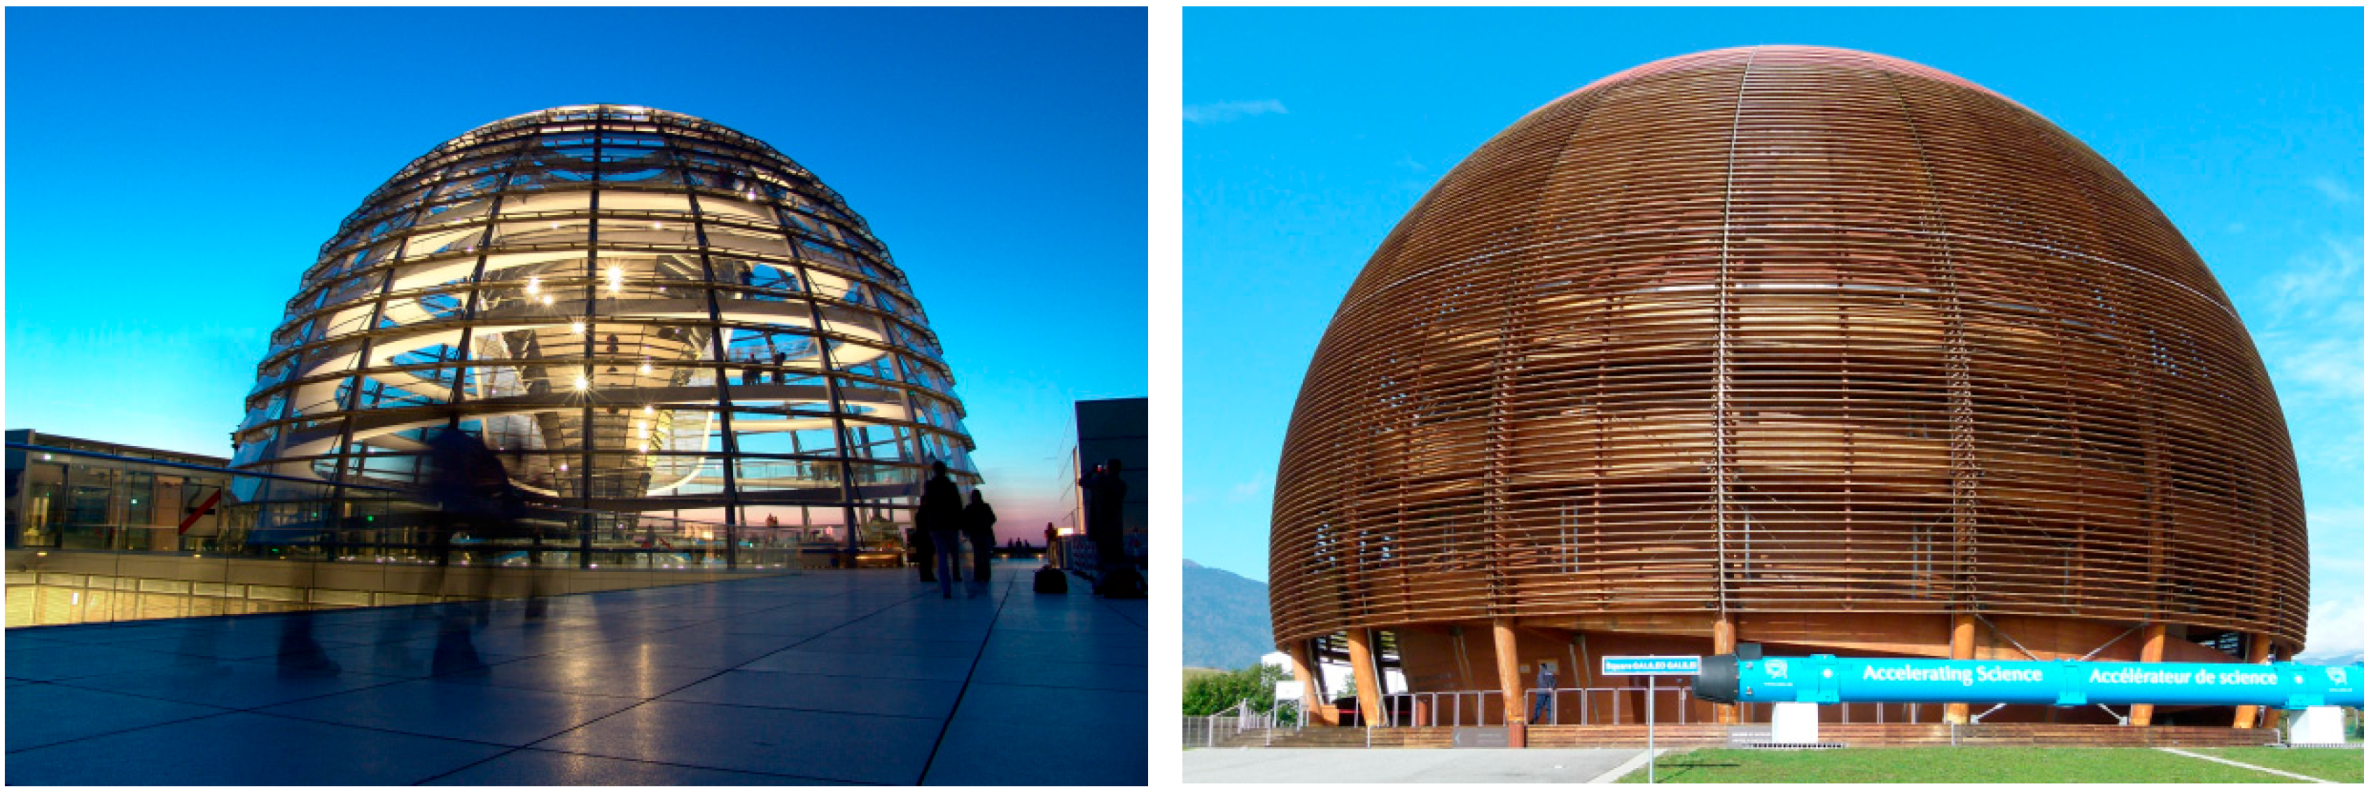
2. Literature Review
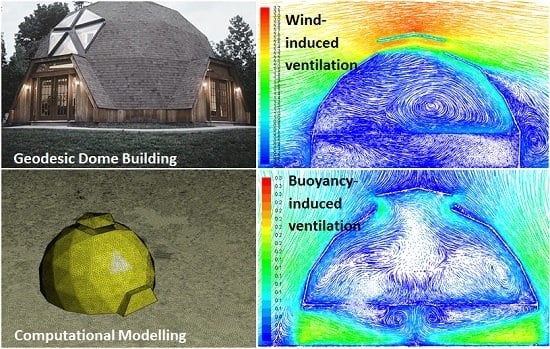
3. Computational Modelling
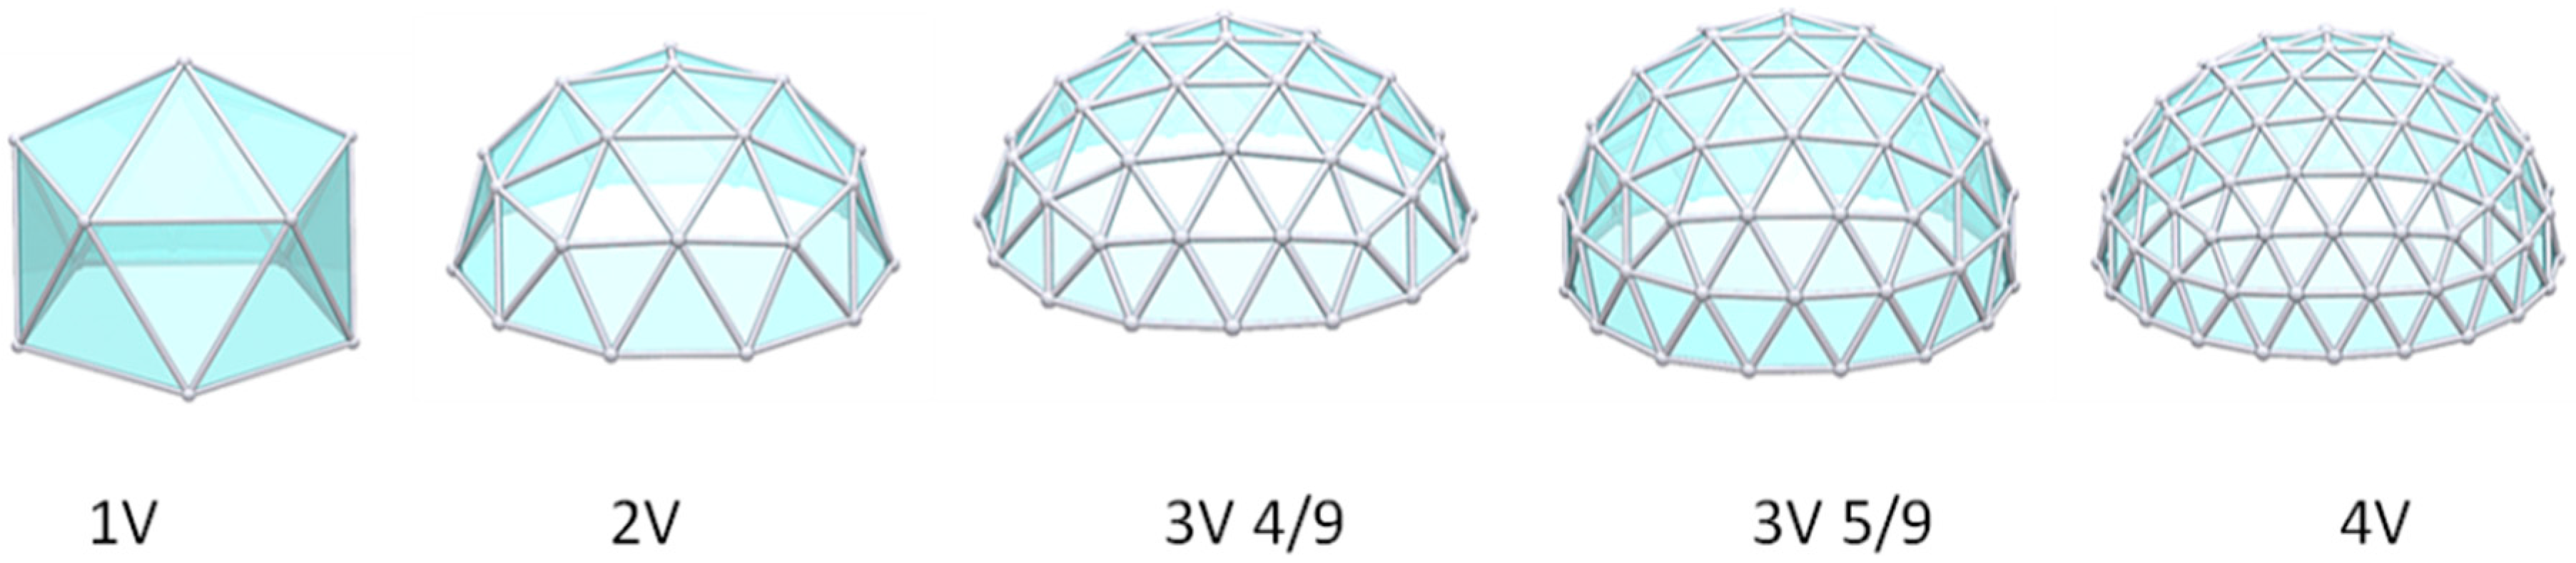
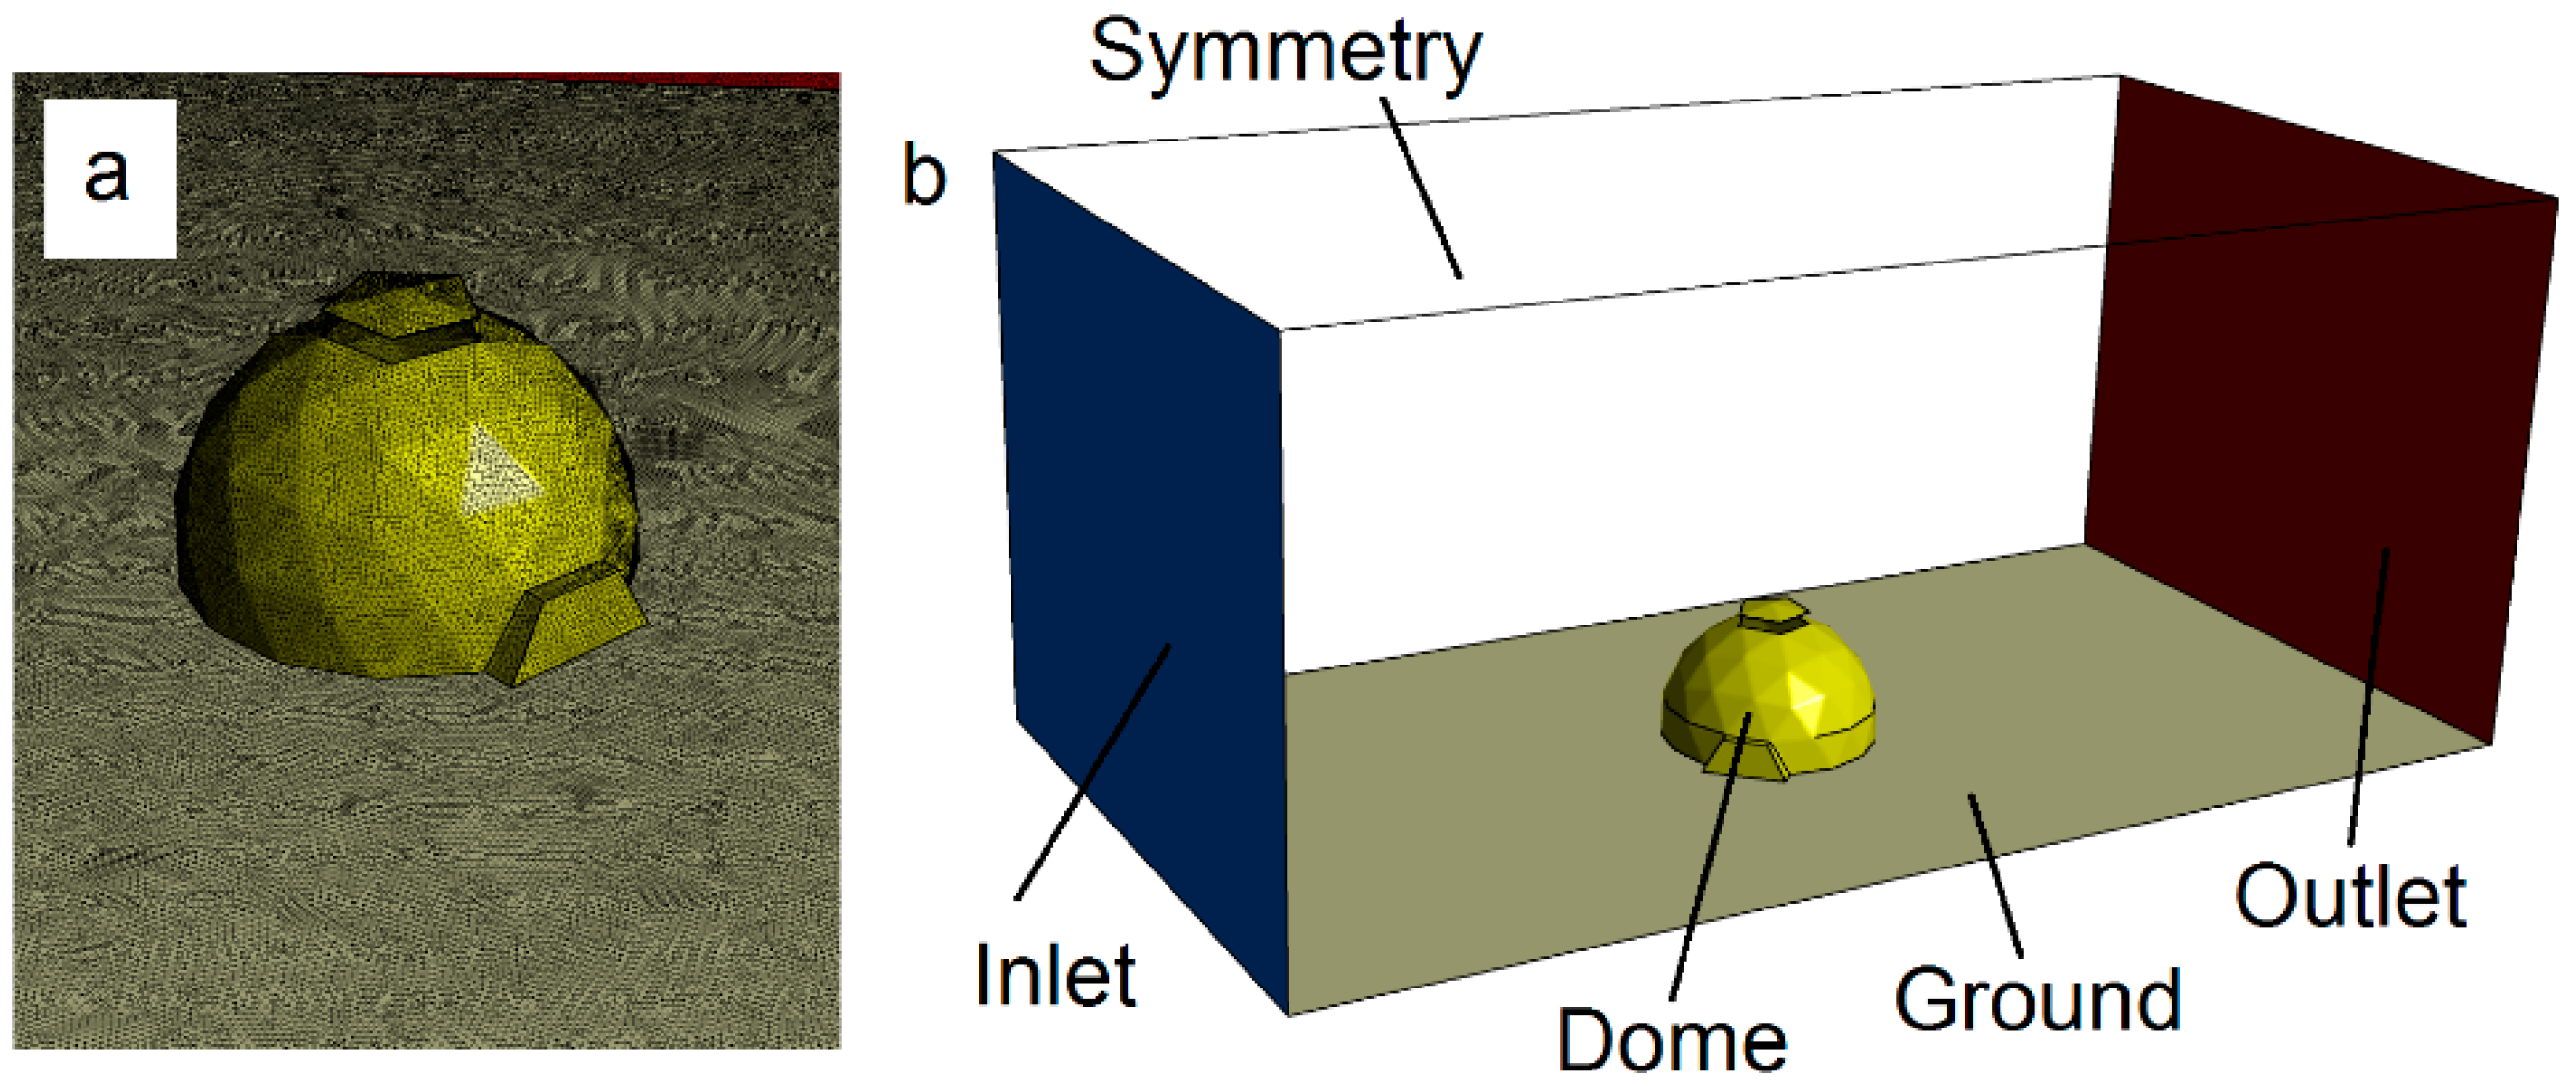
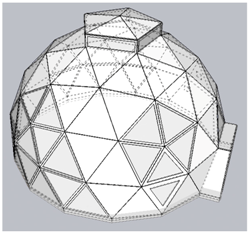
3.1. Model Geometry
3.2. Computational Mesh Design
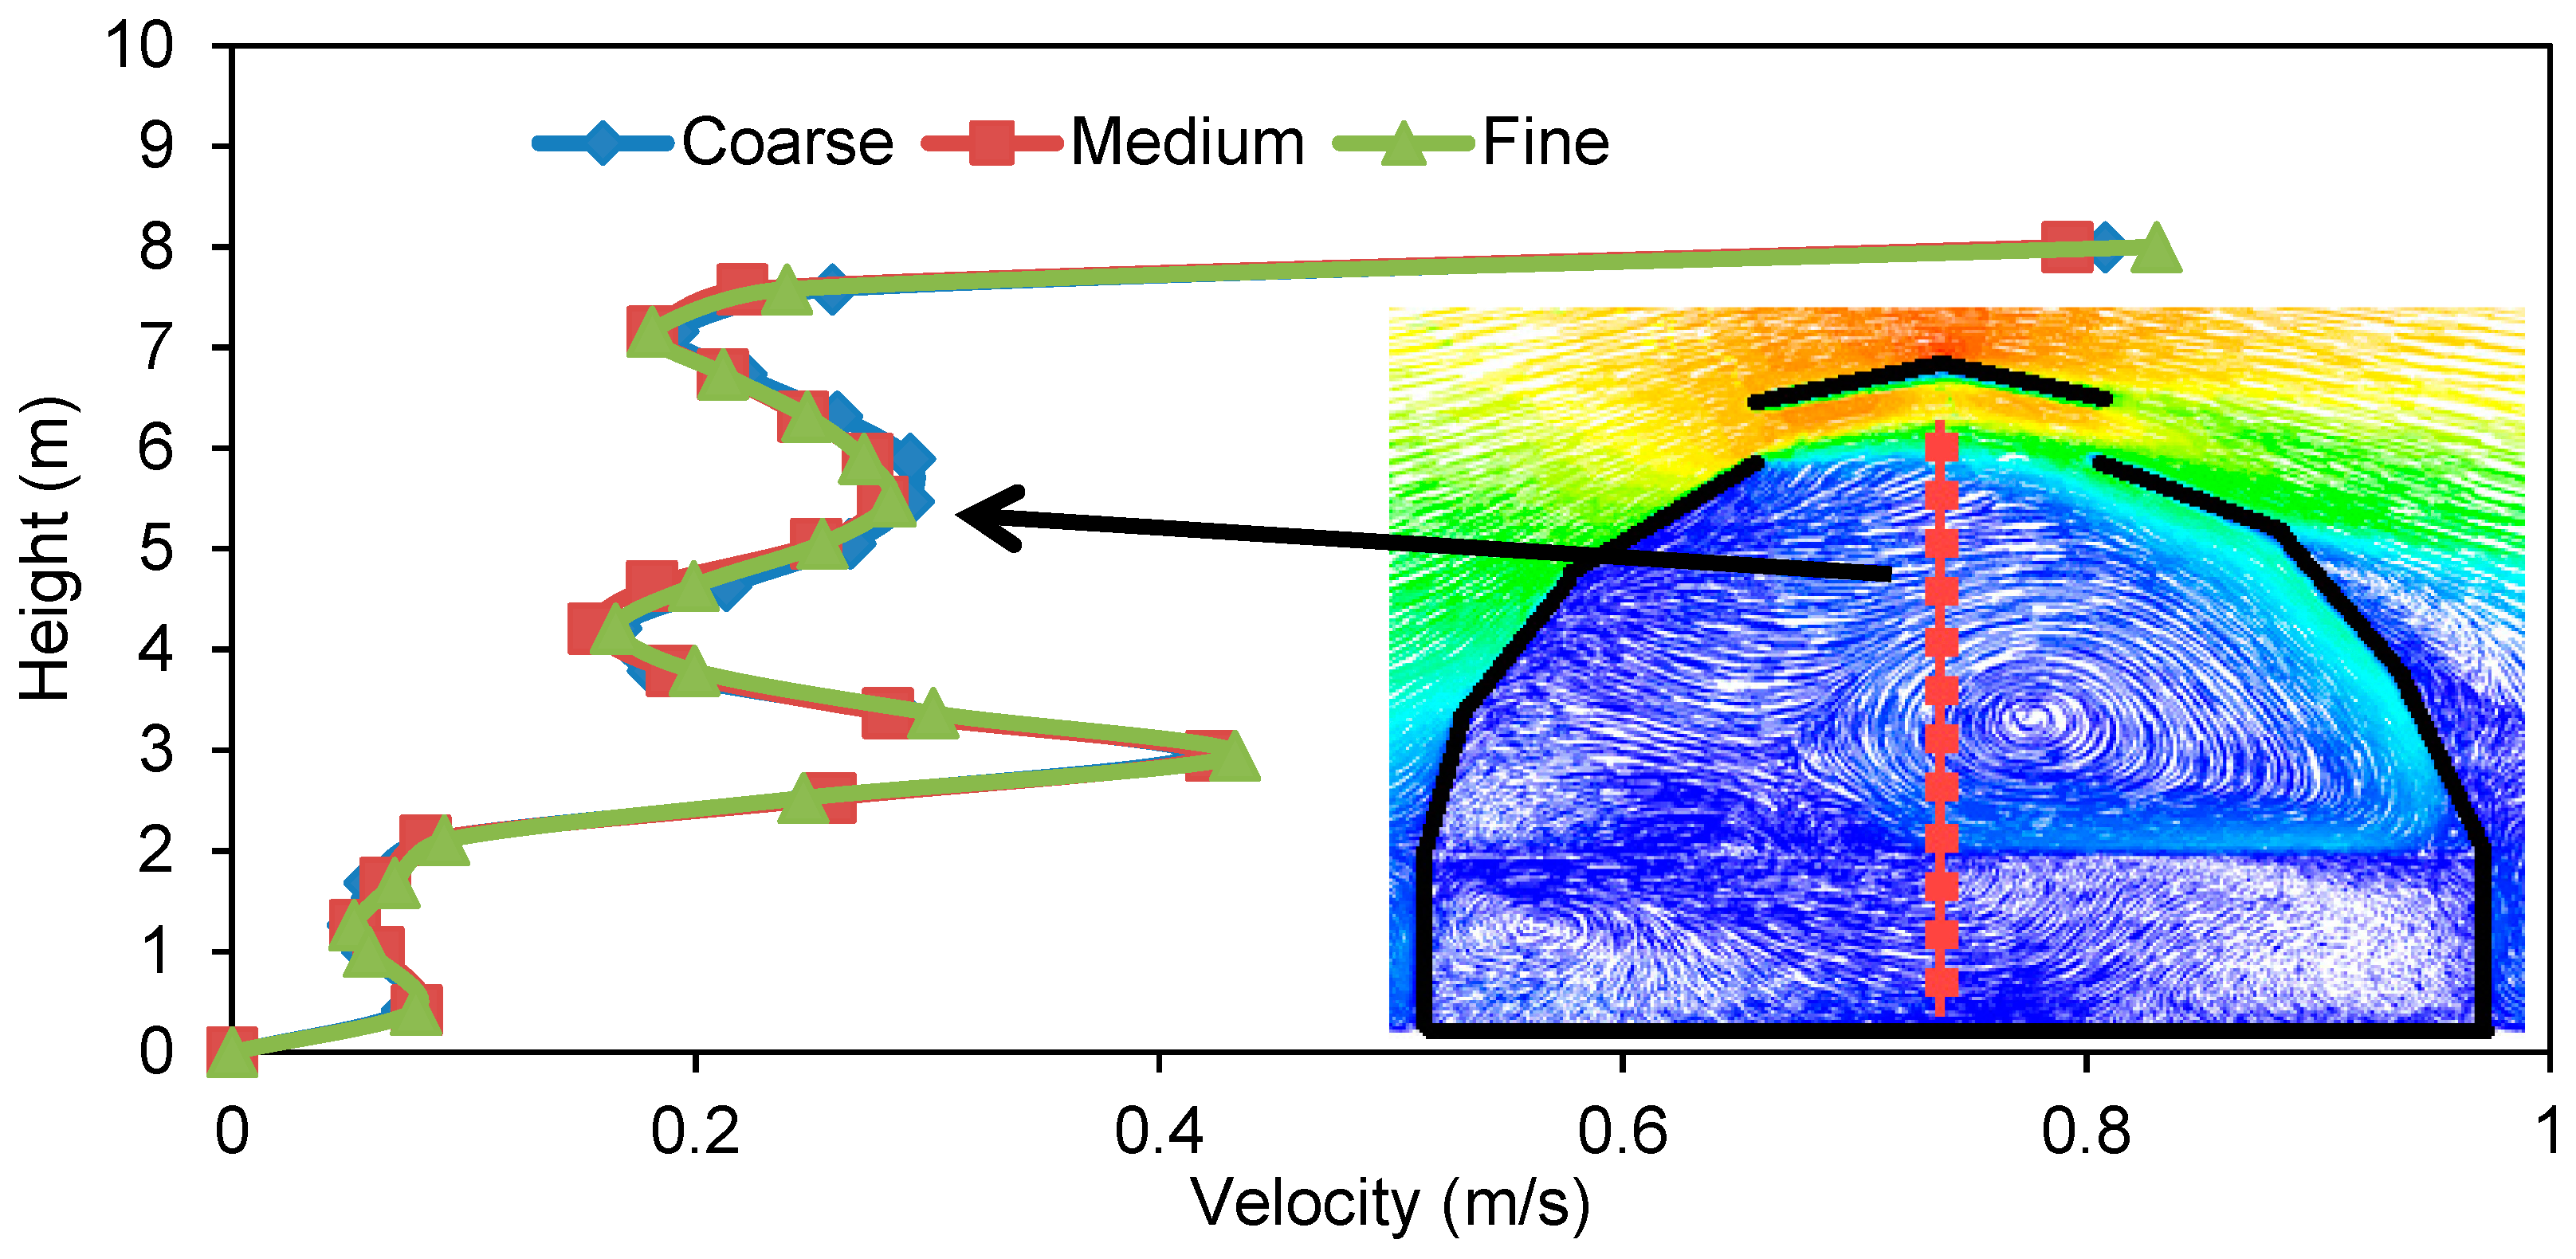
3.3. Sensitivity Analysis
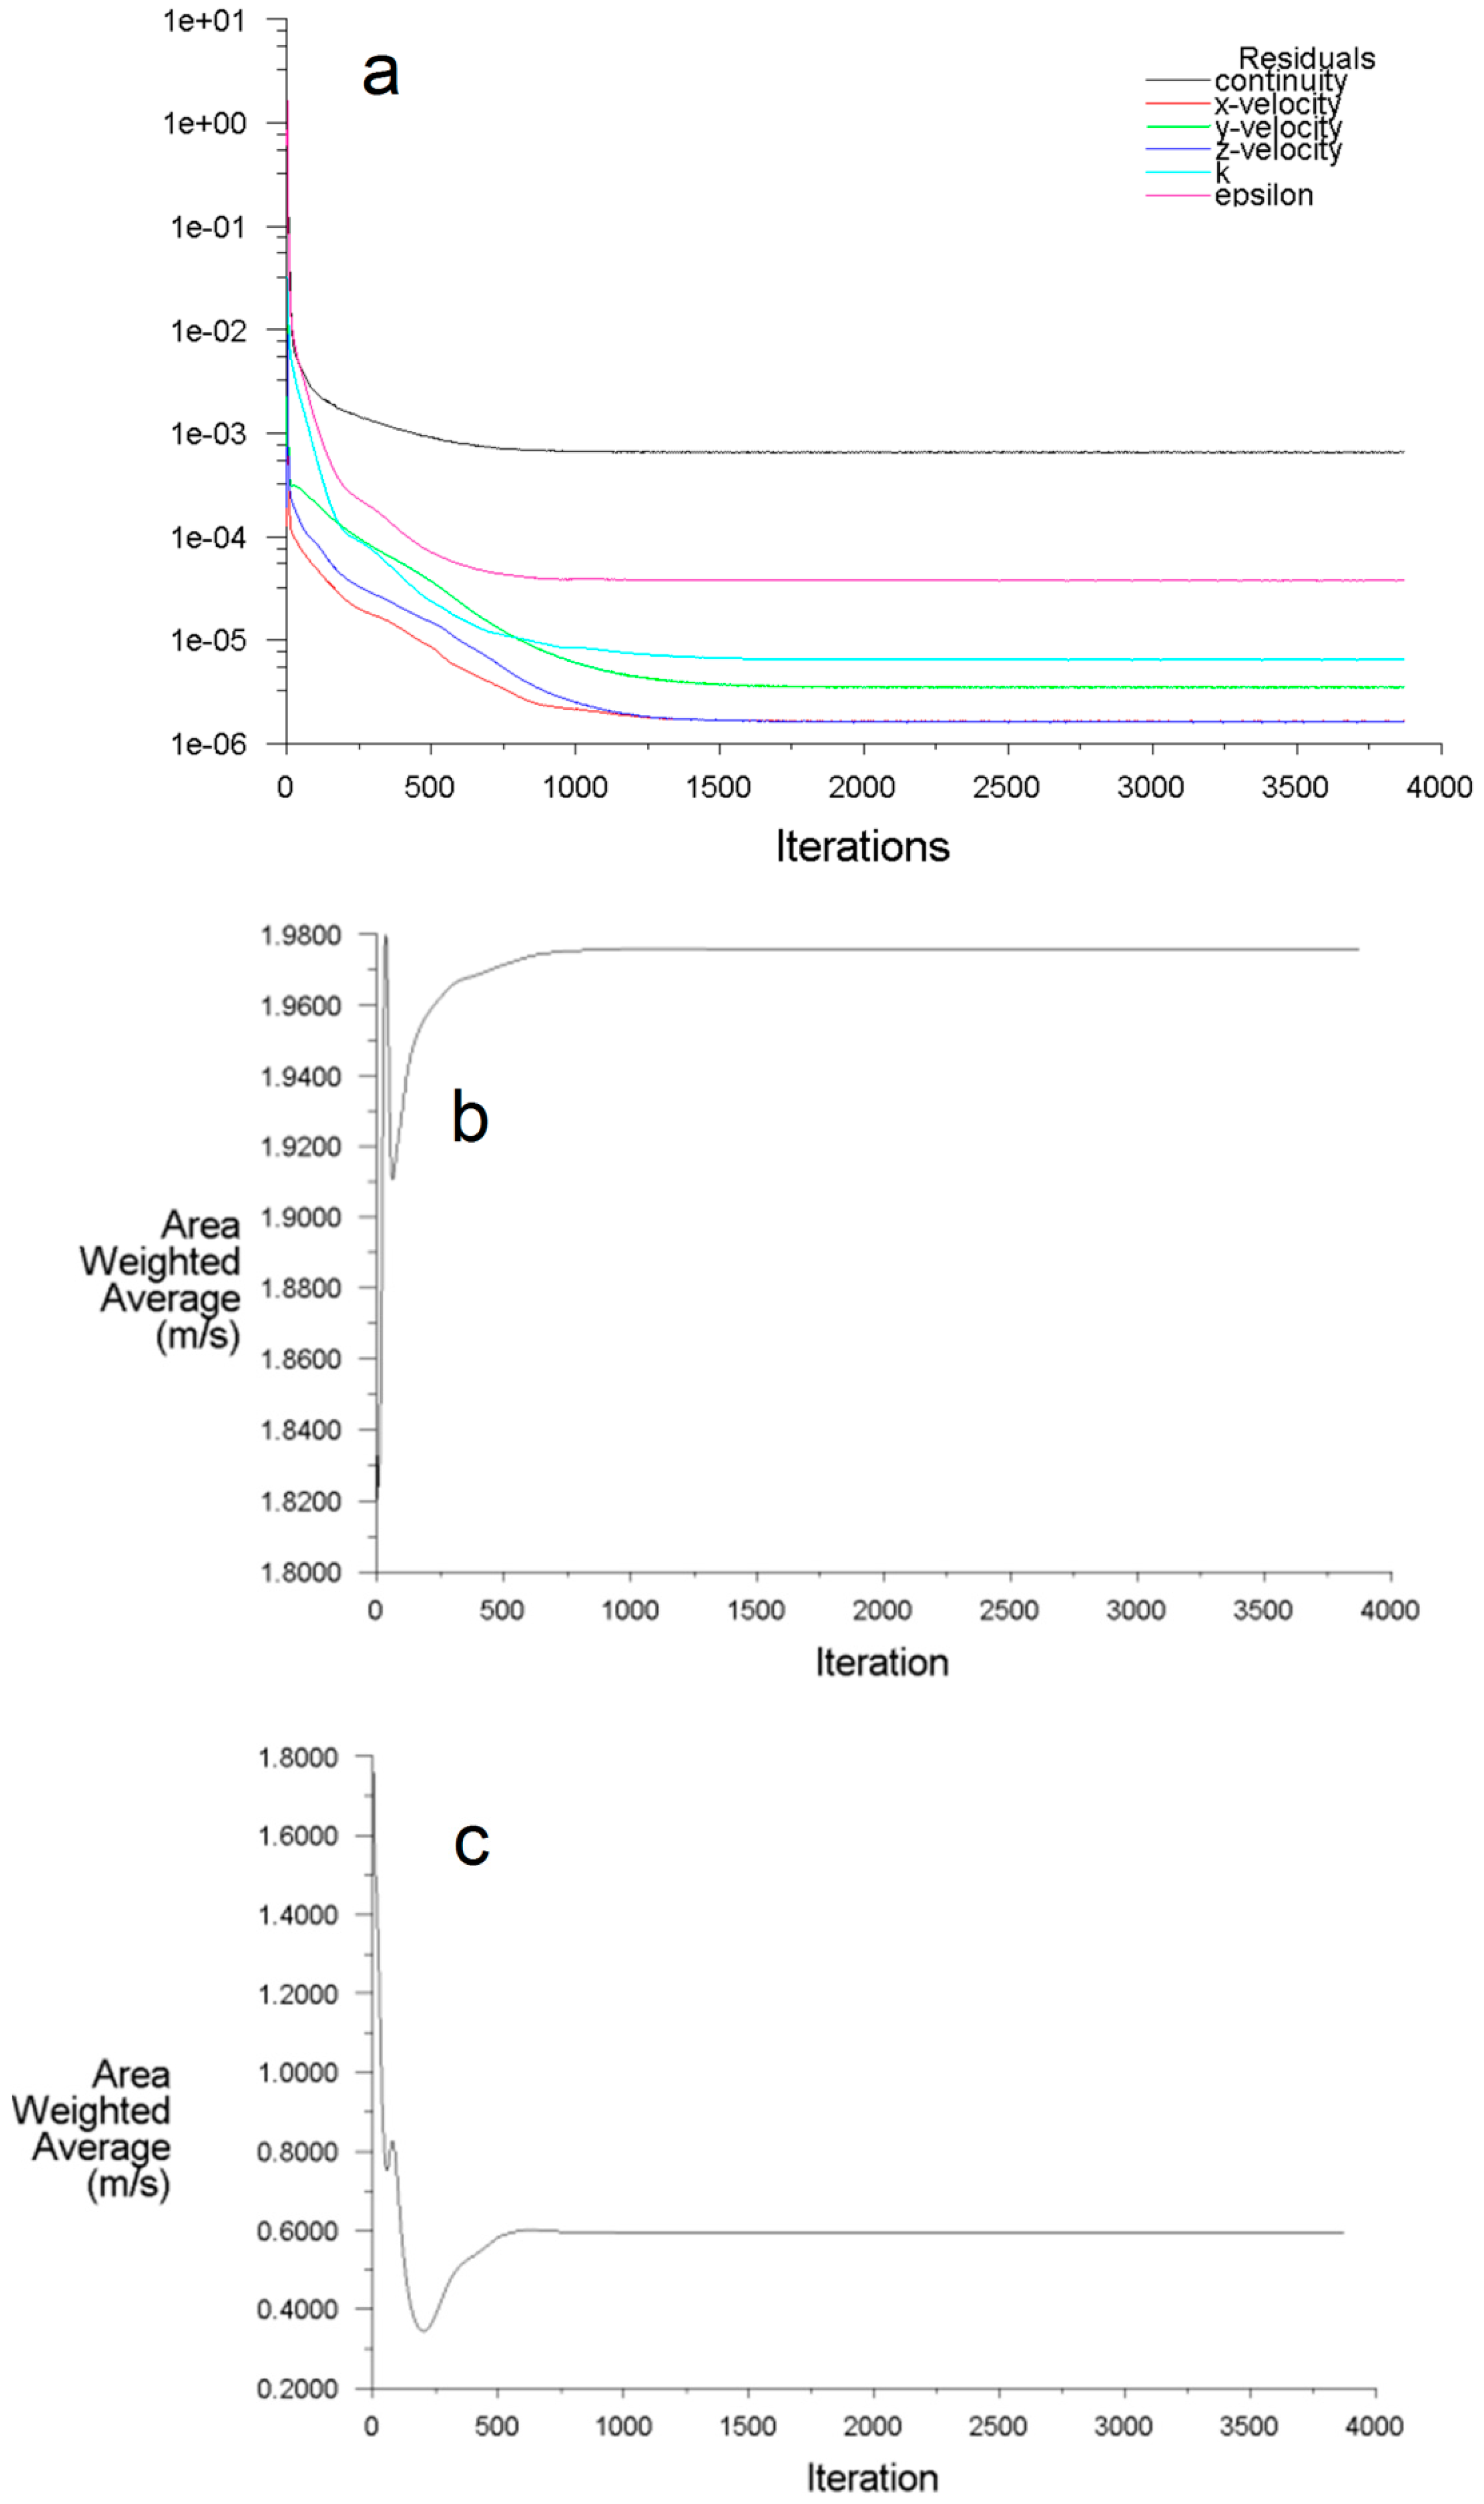
3.4. Convergence of Solution and Conservation of Property
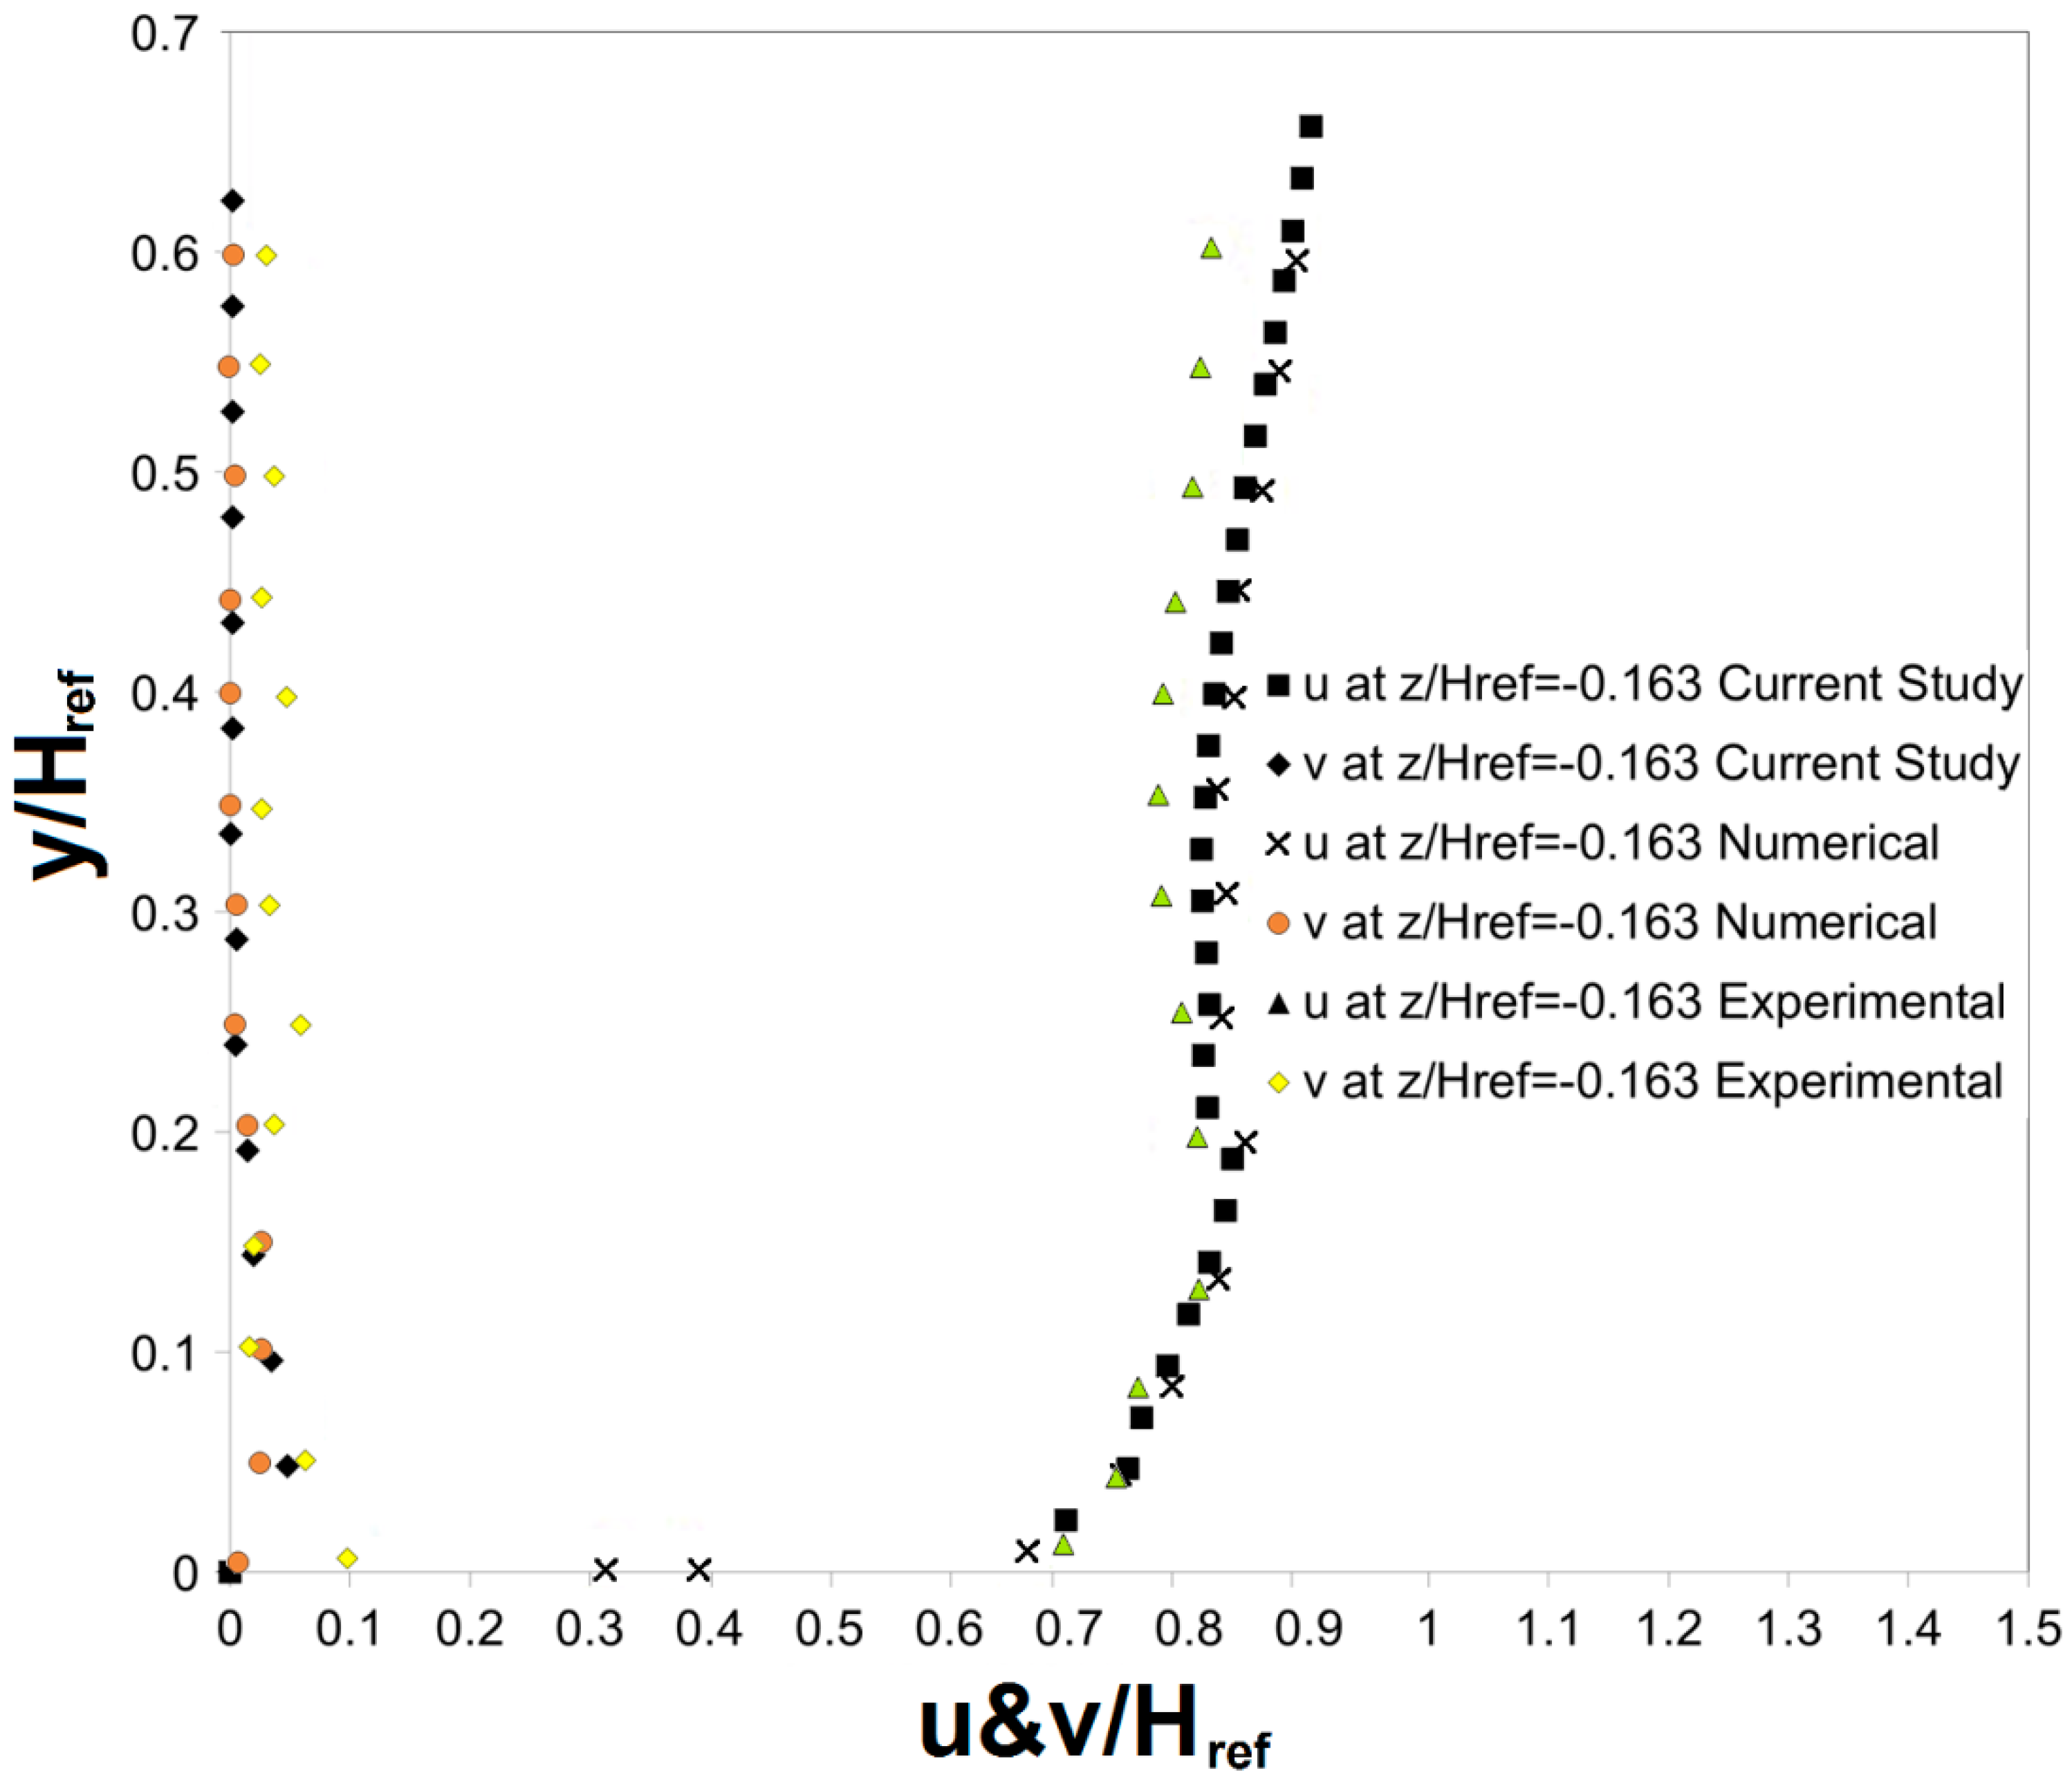
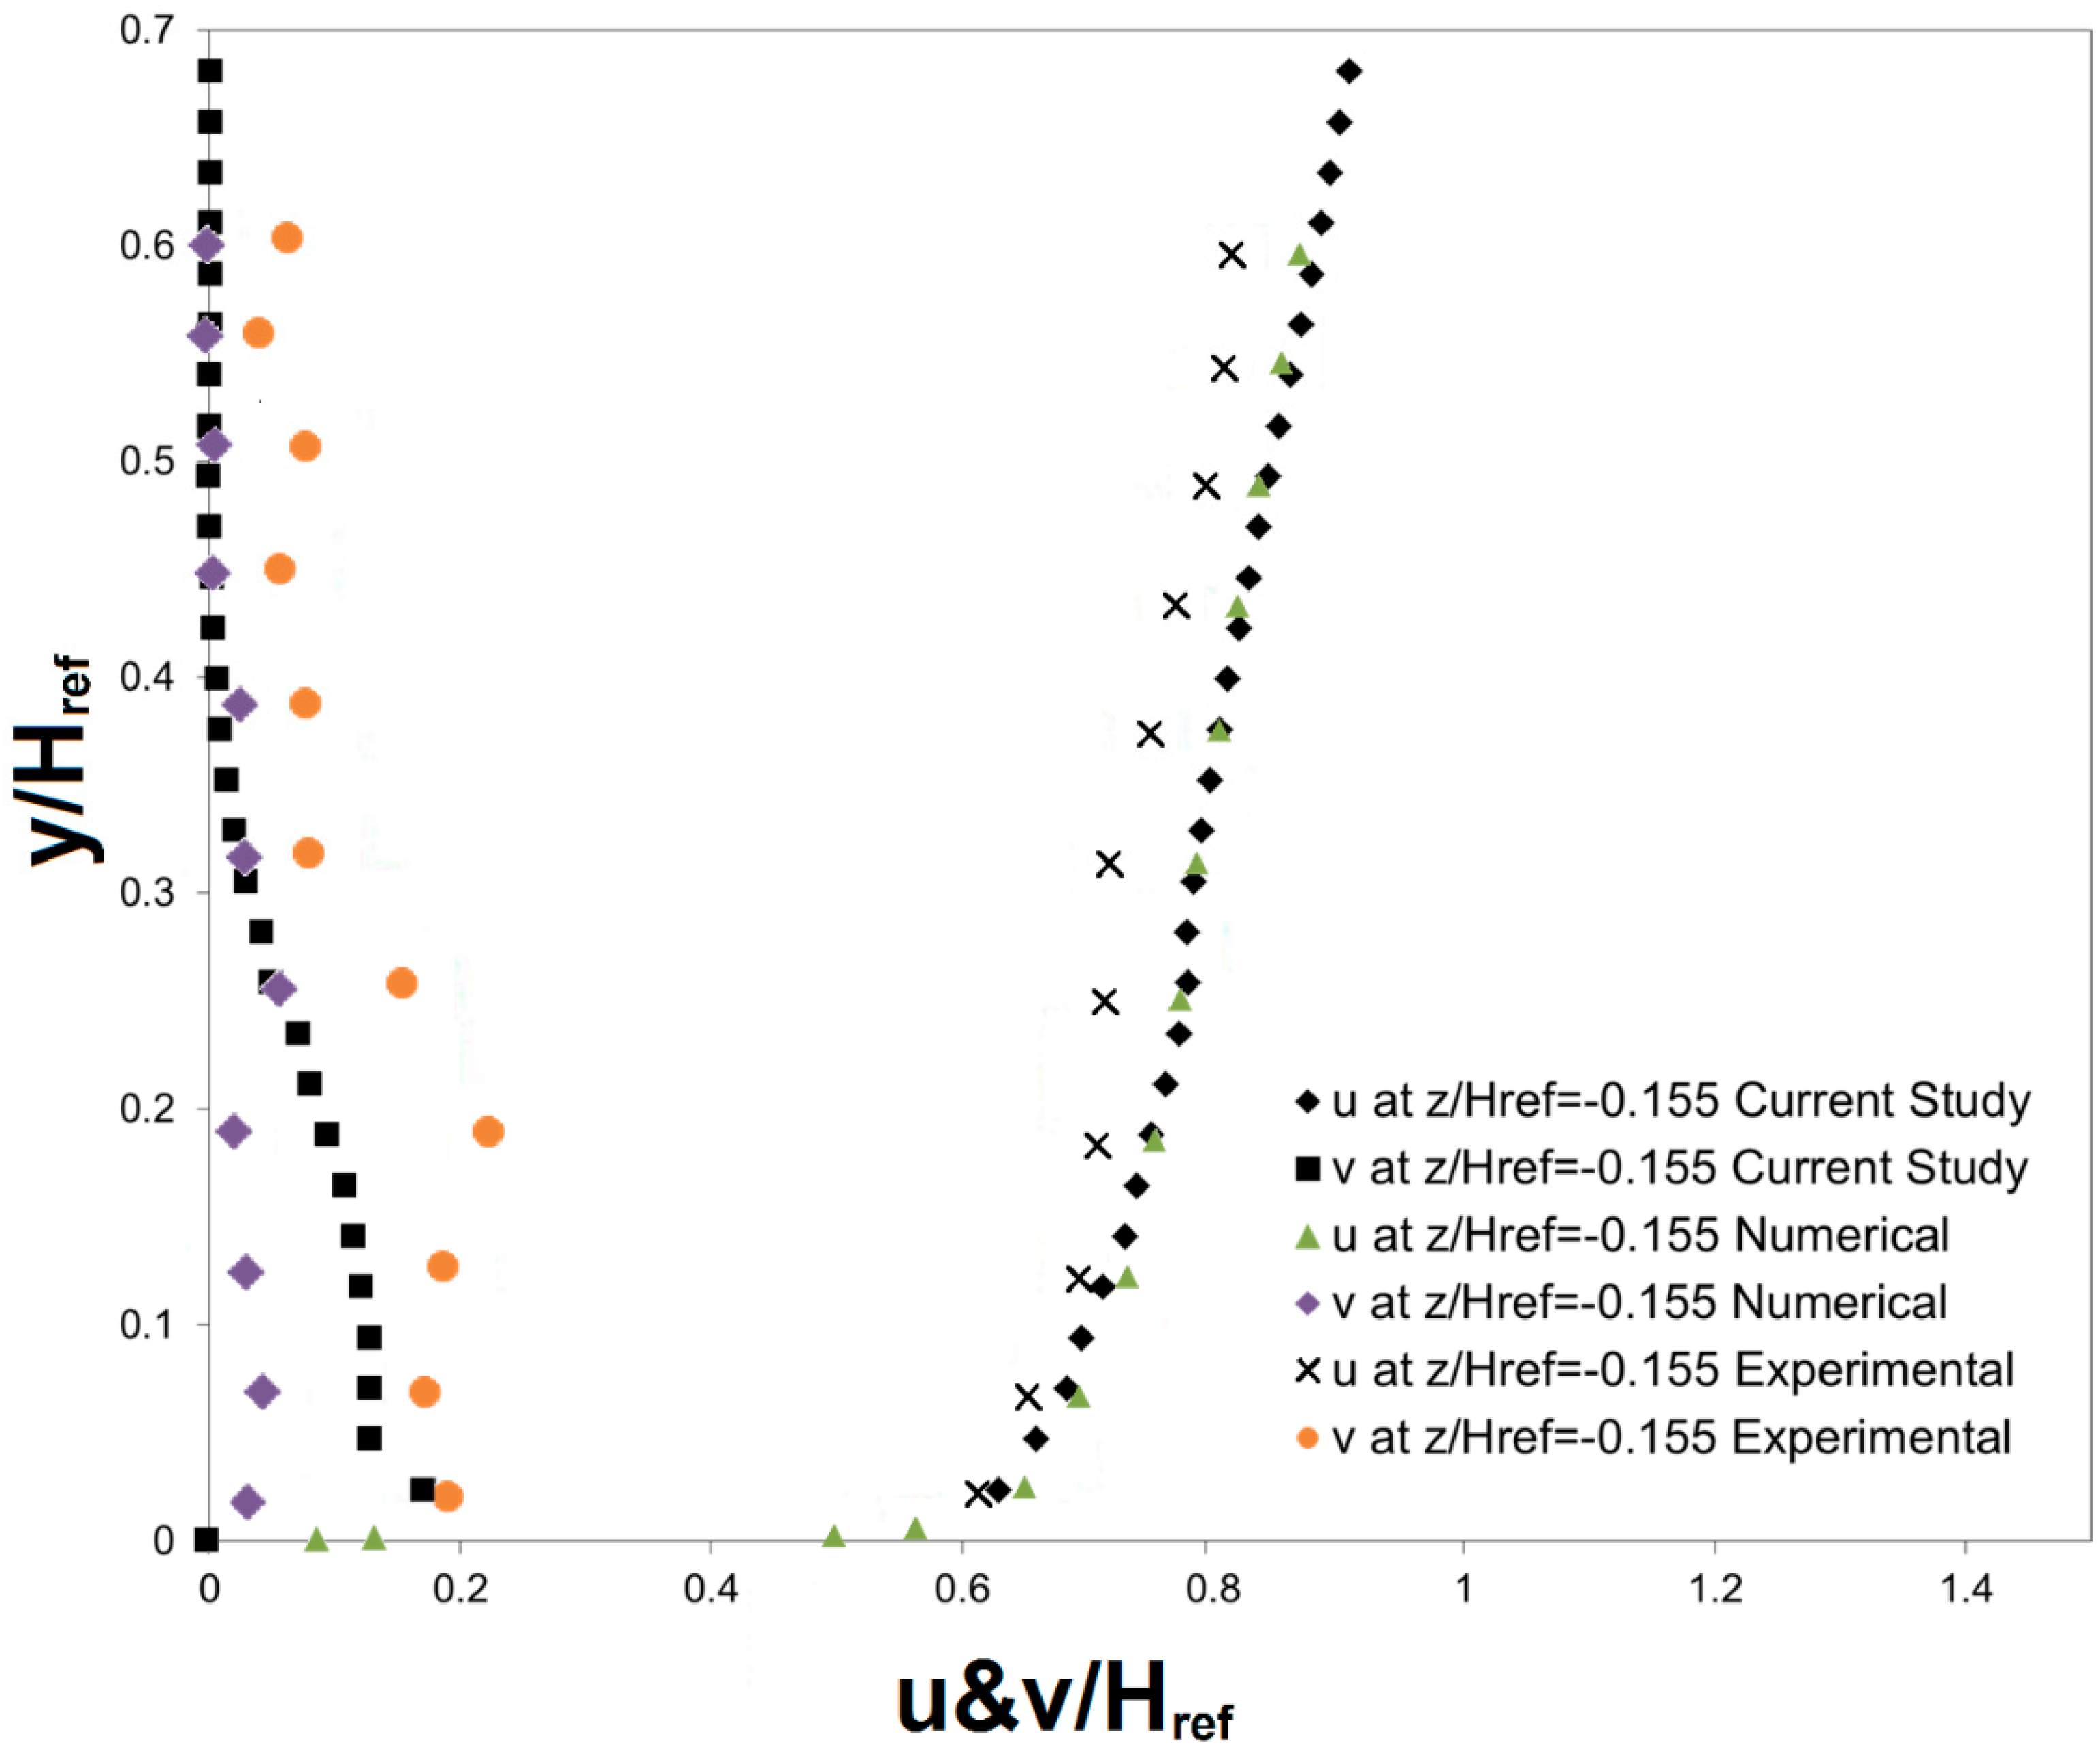
3.5. Method Validation
3.6. Boundary Conditions
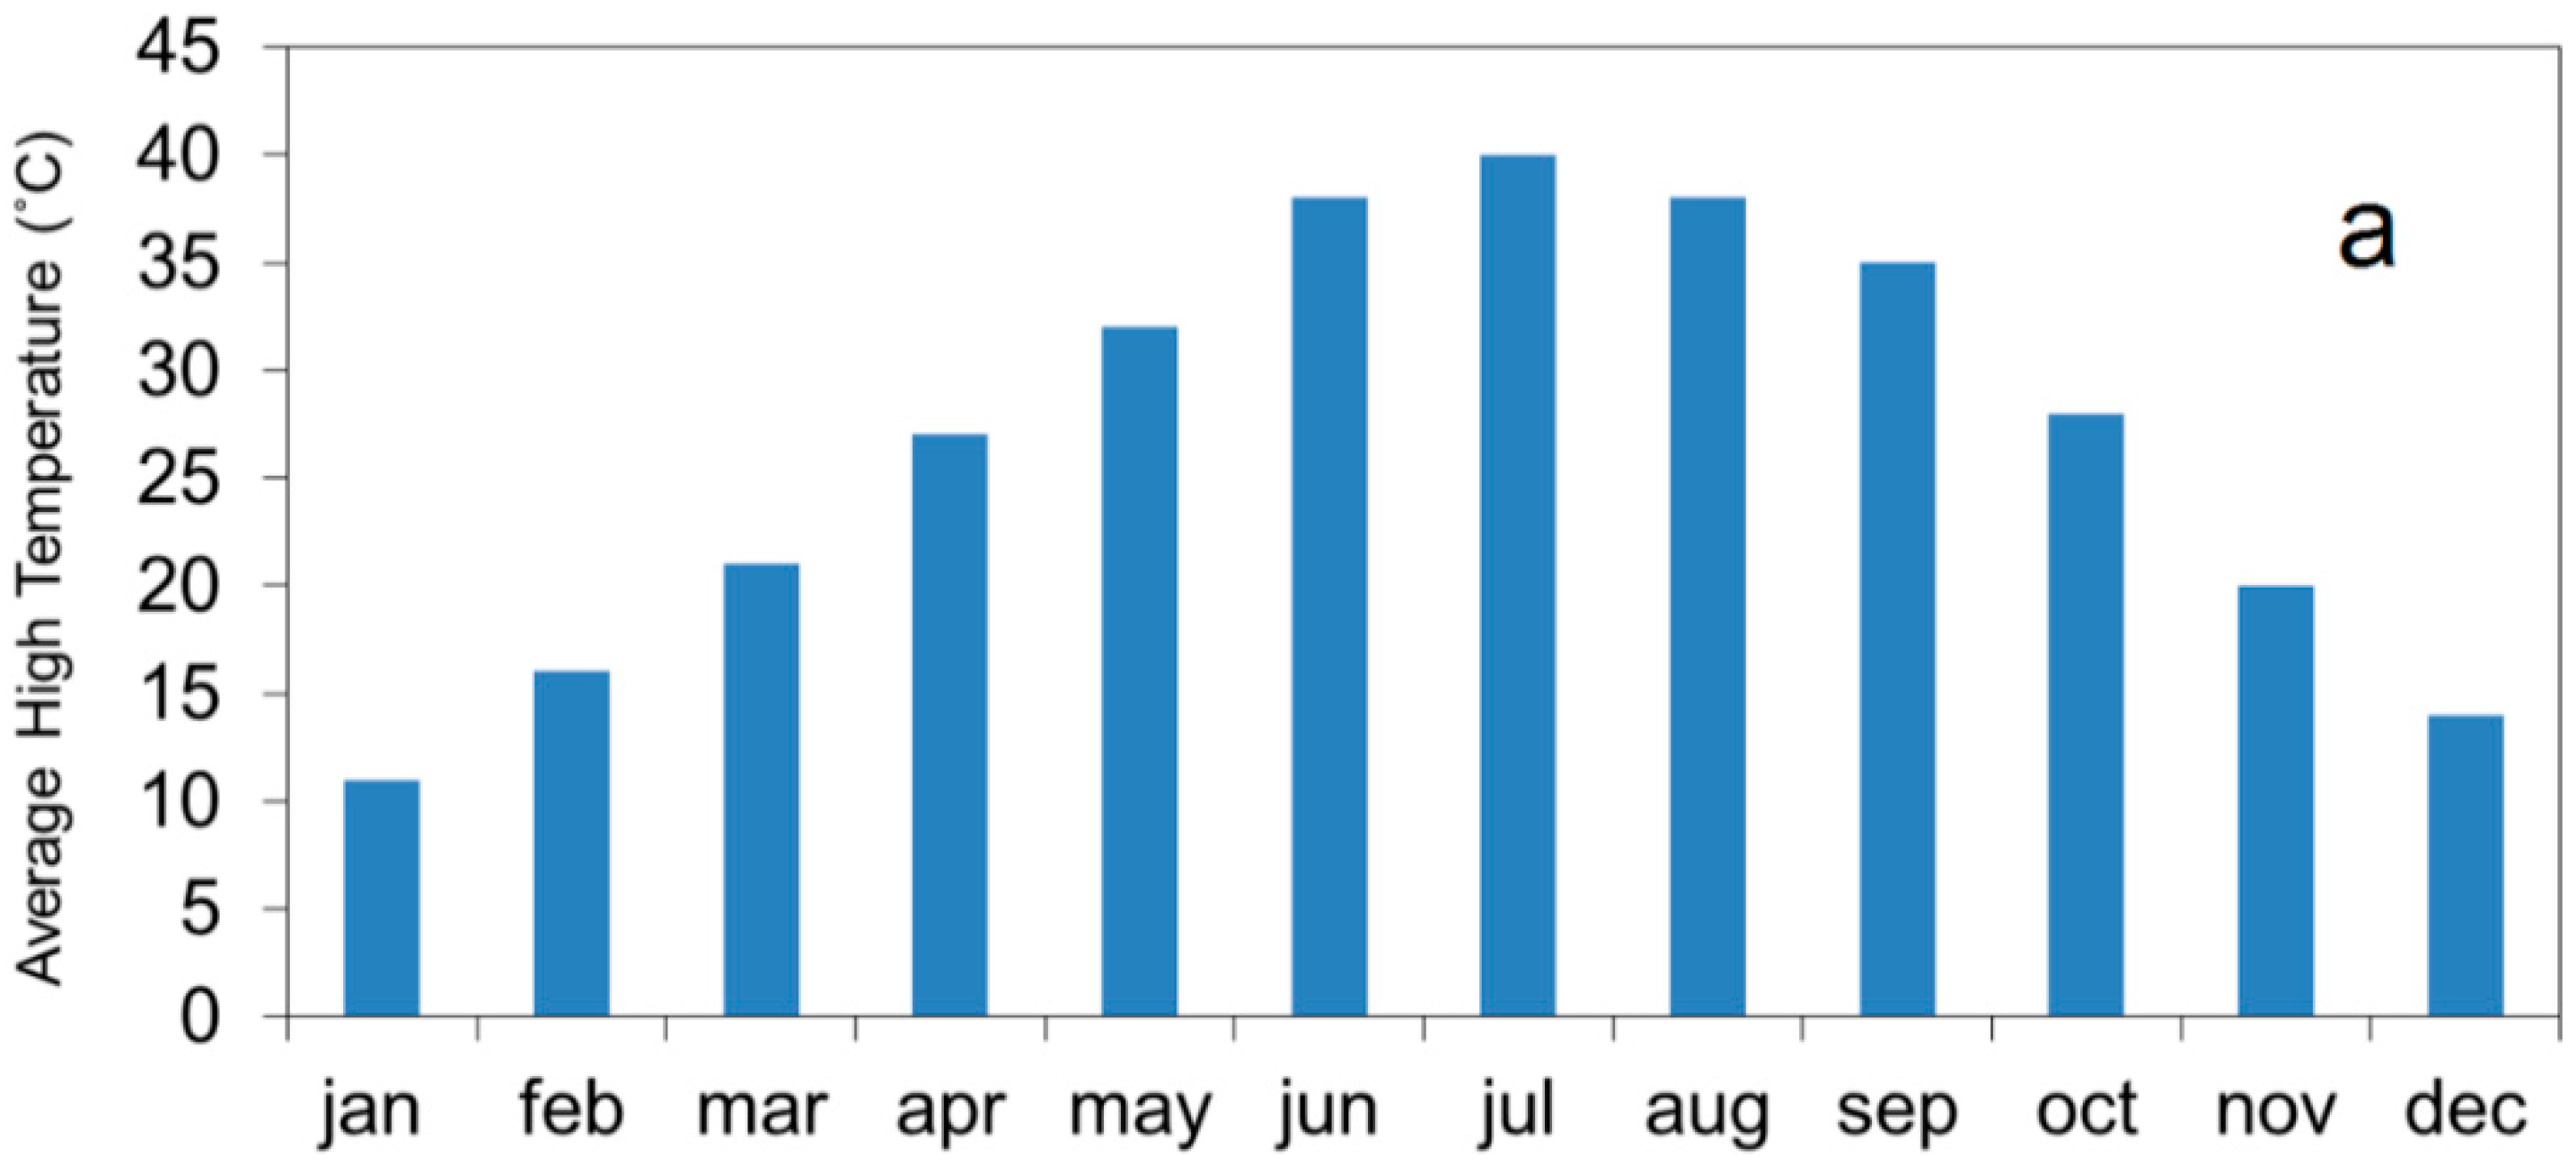
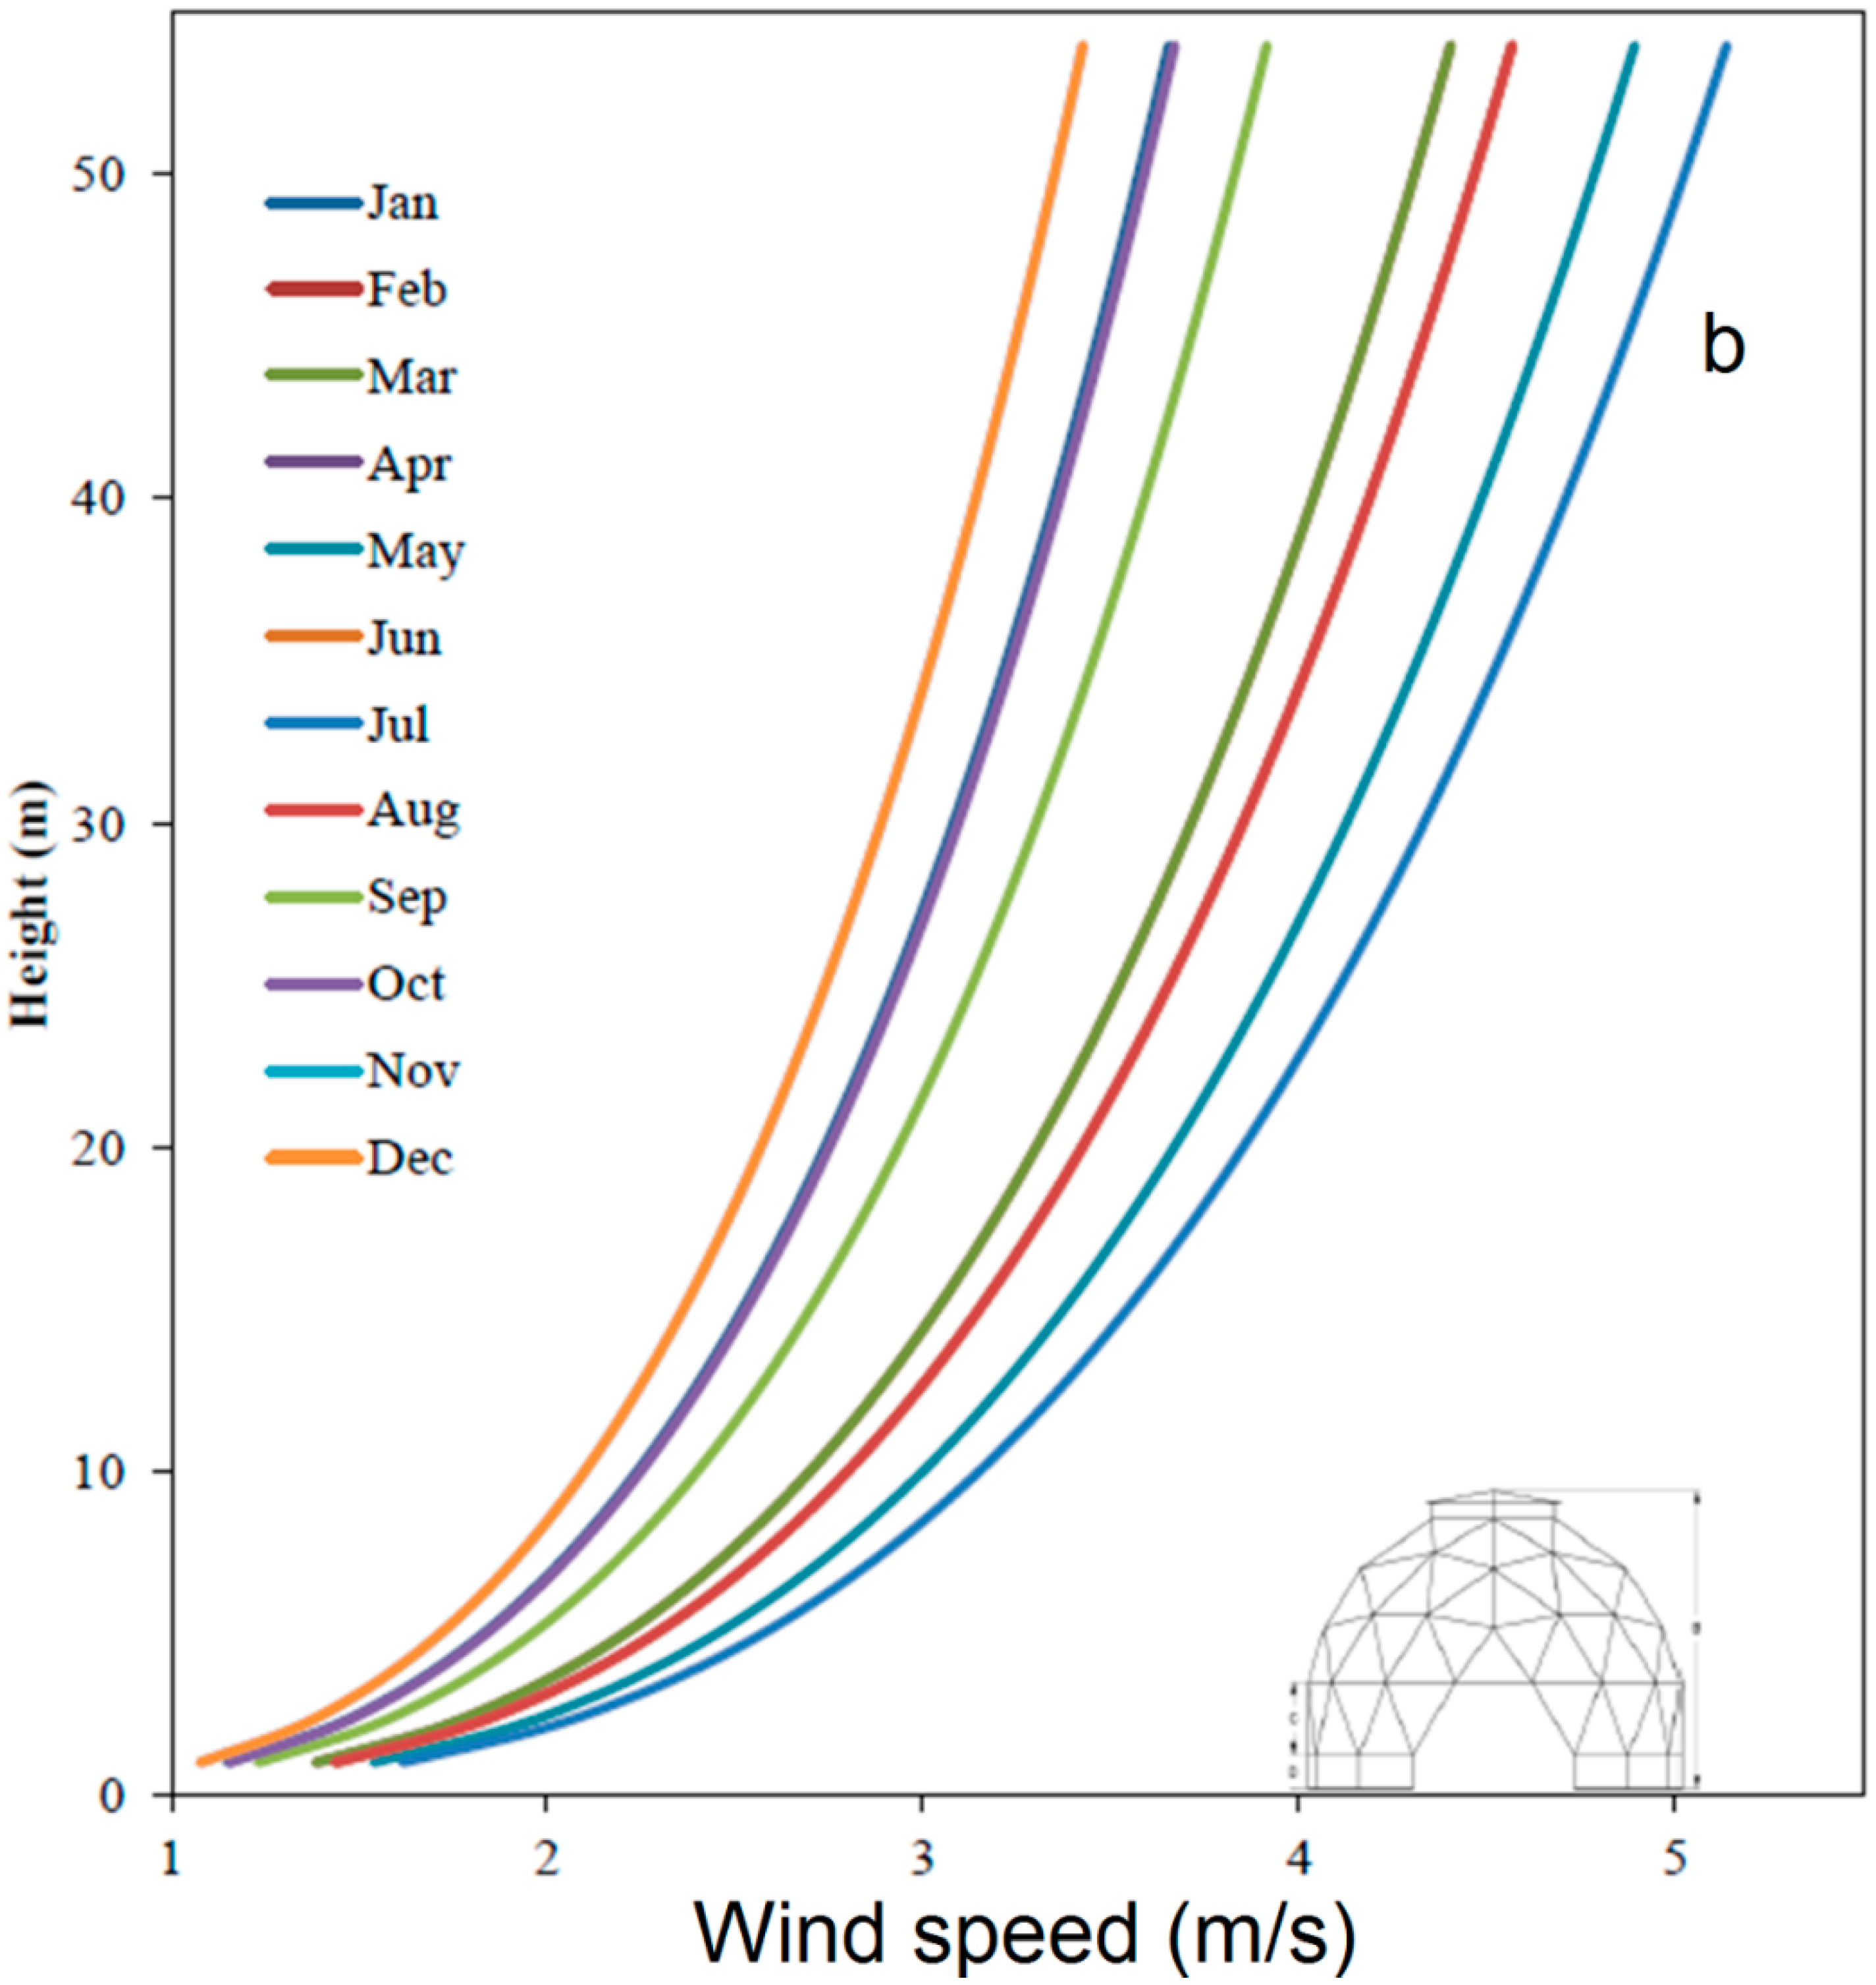
3.7. Case Study Location
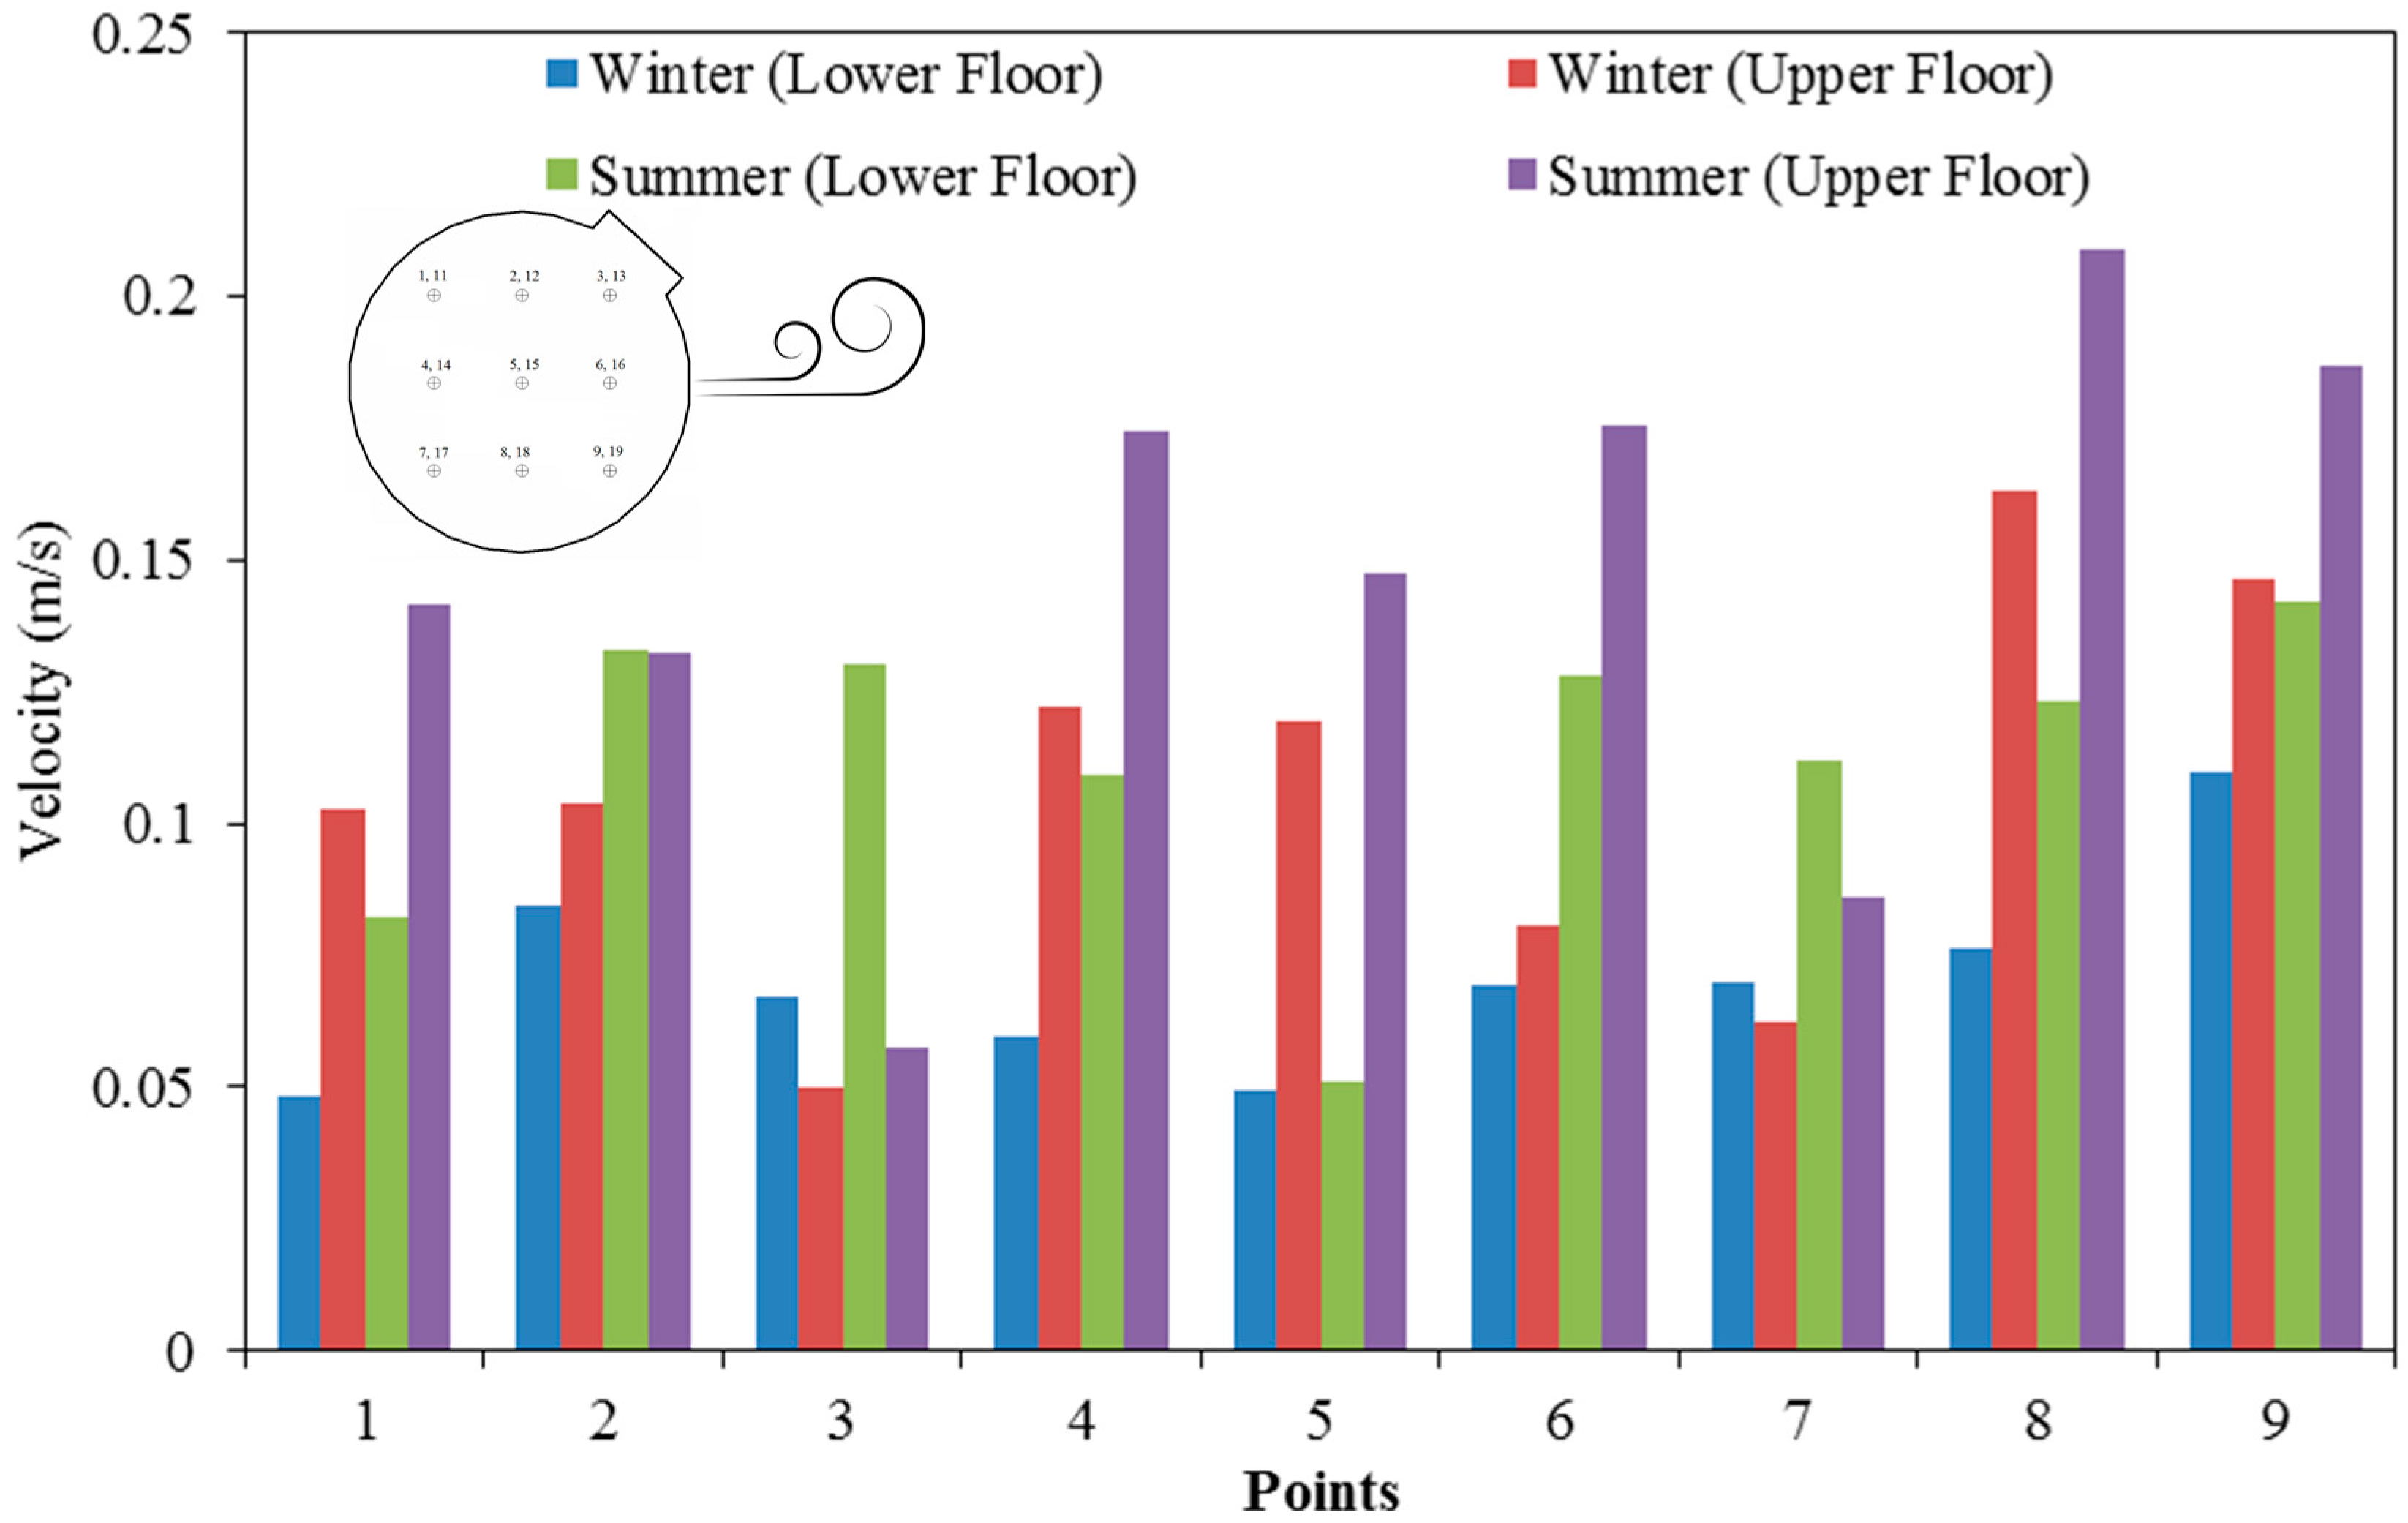
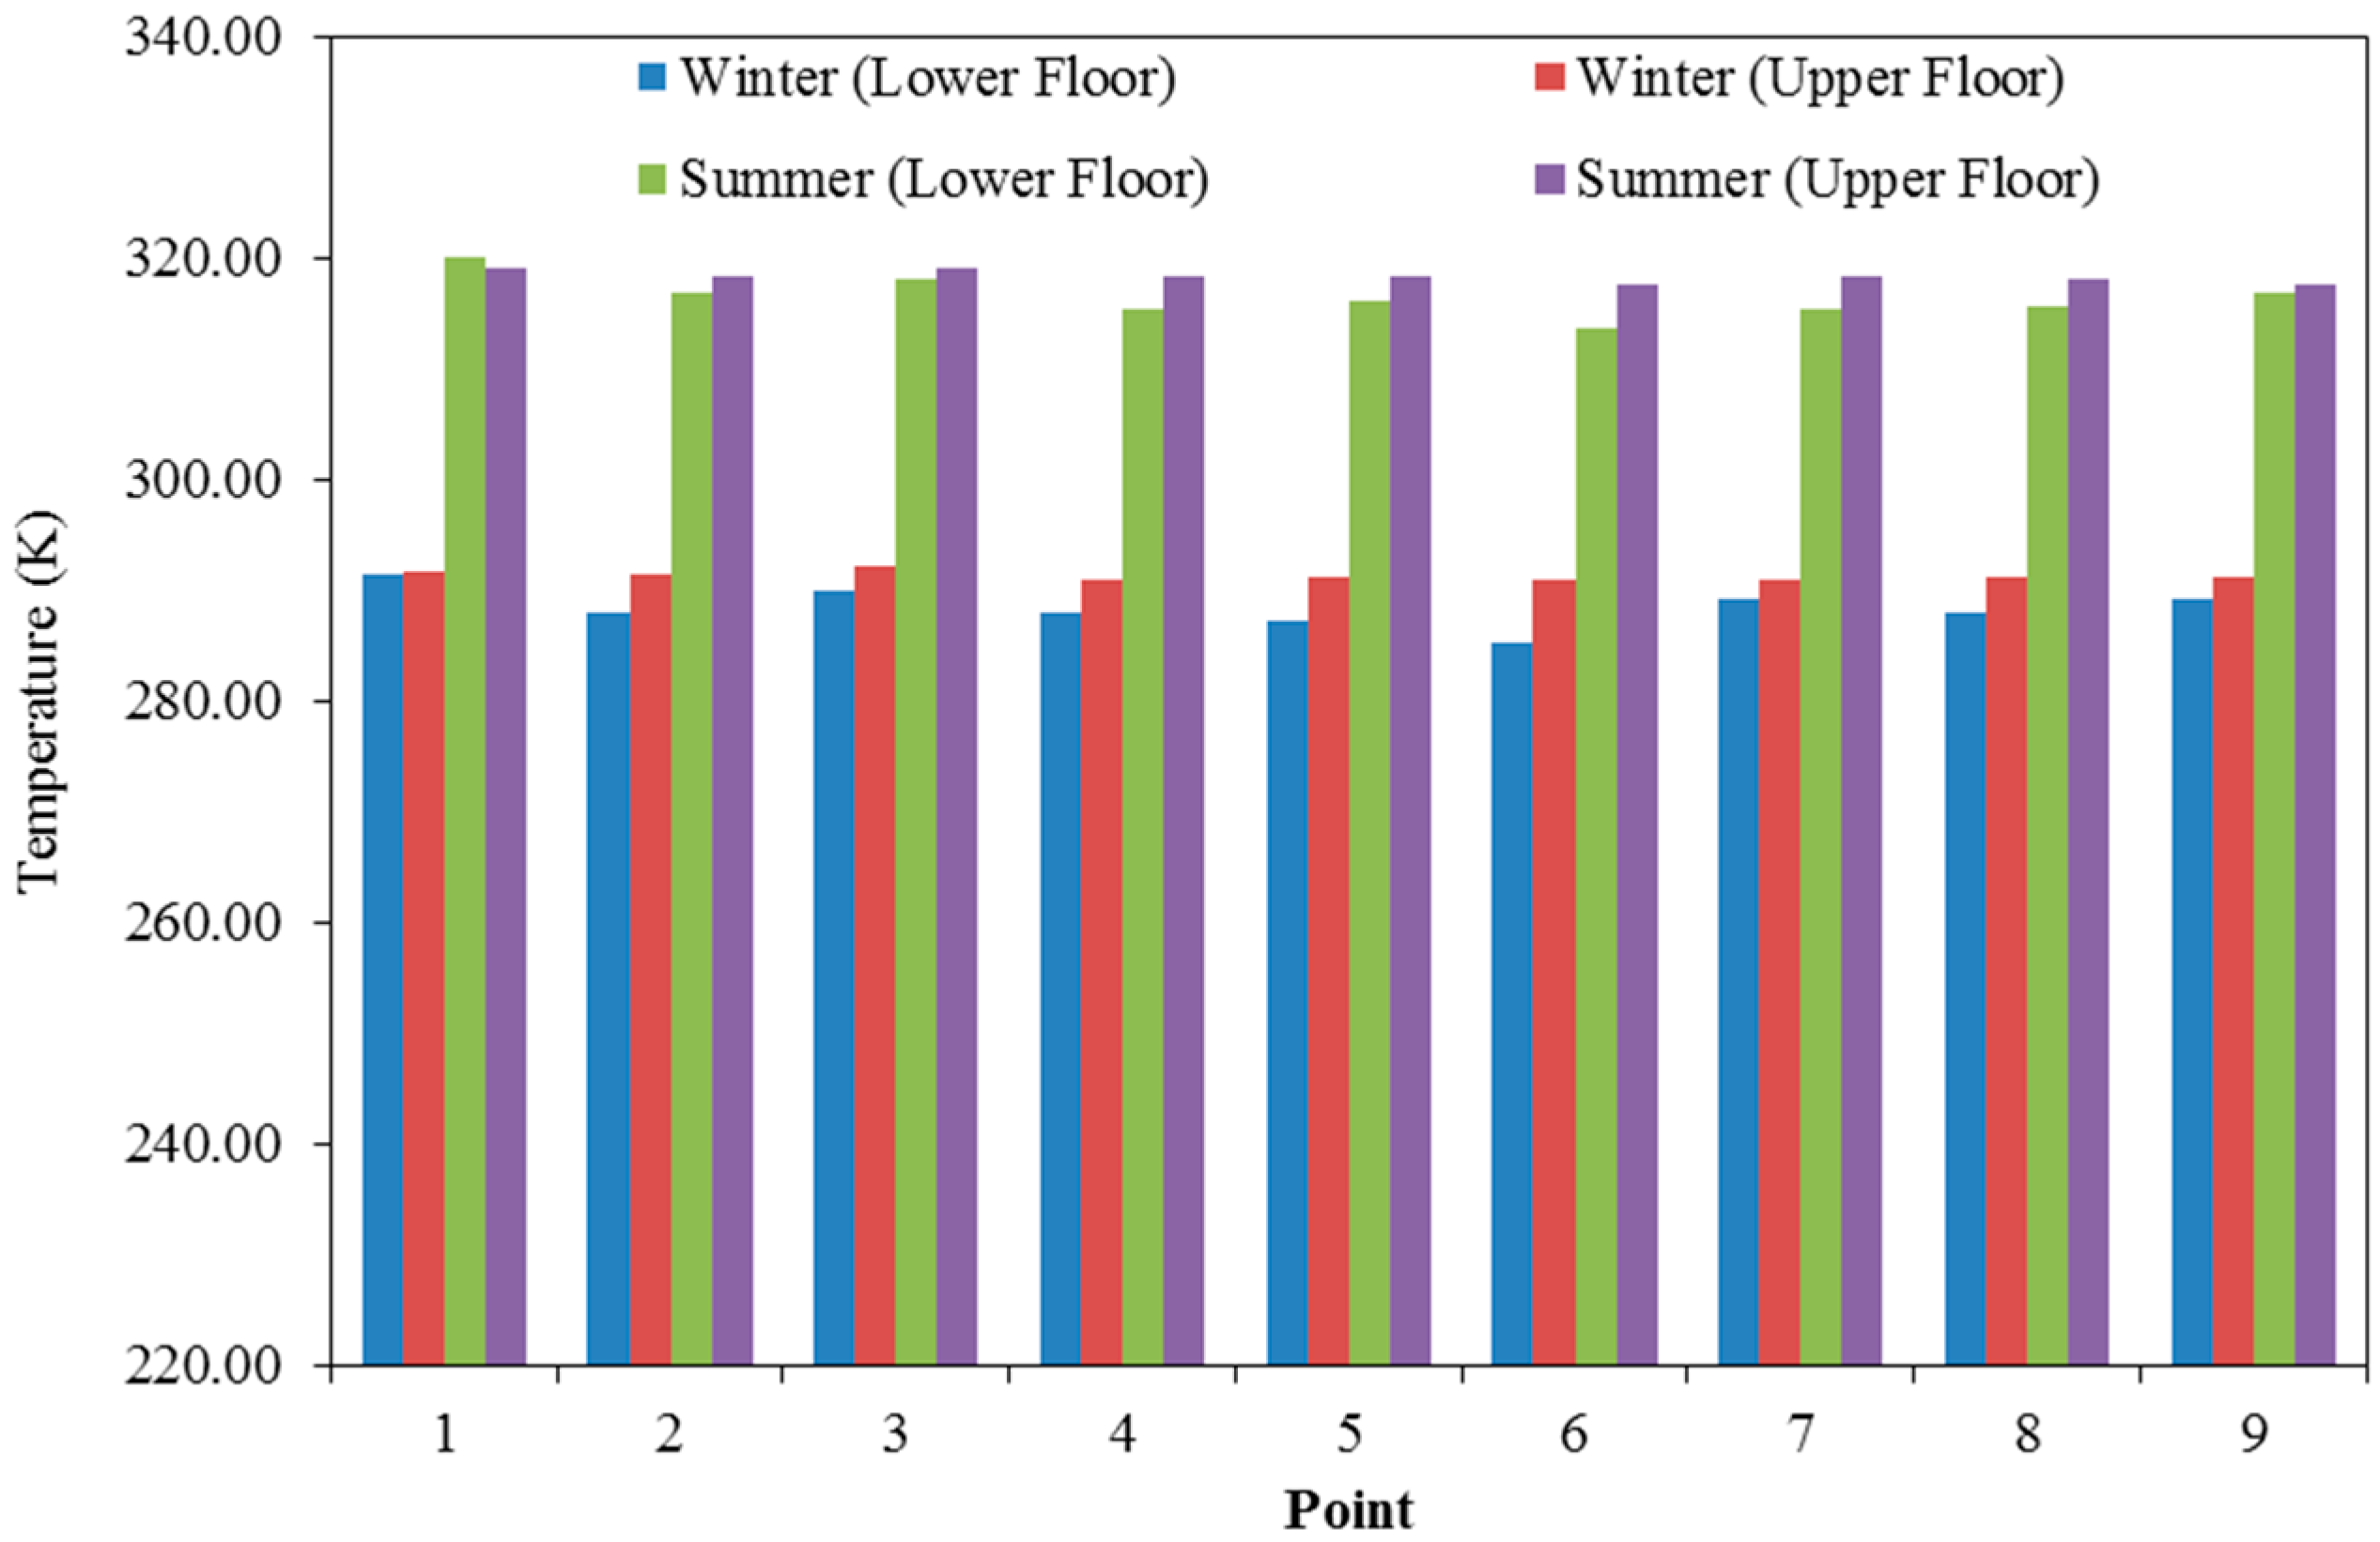
3.8. Measurement of Indoor Velocity and Temperature
4. Results and Discussion
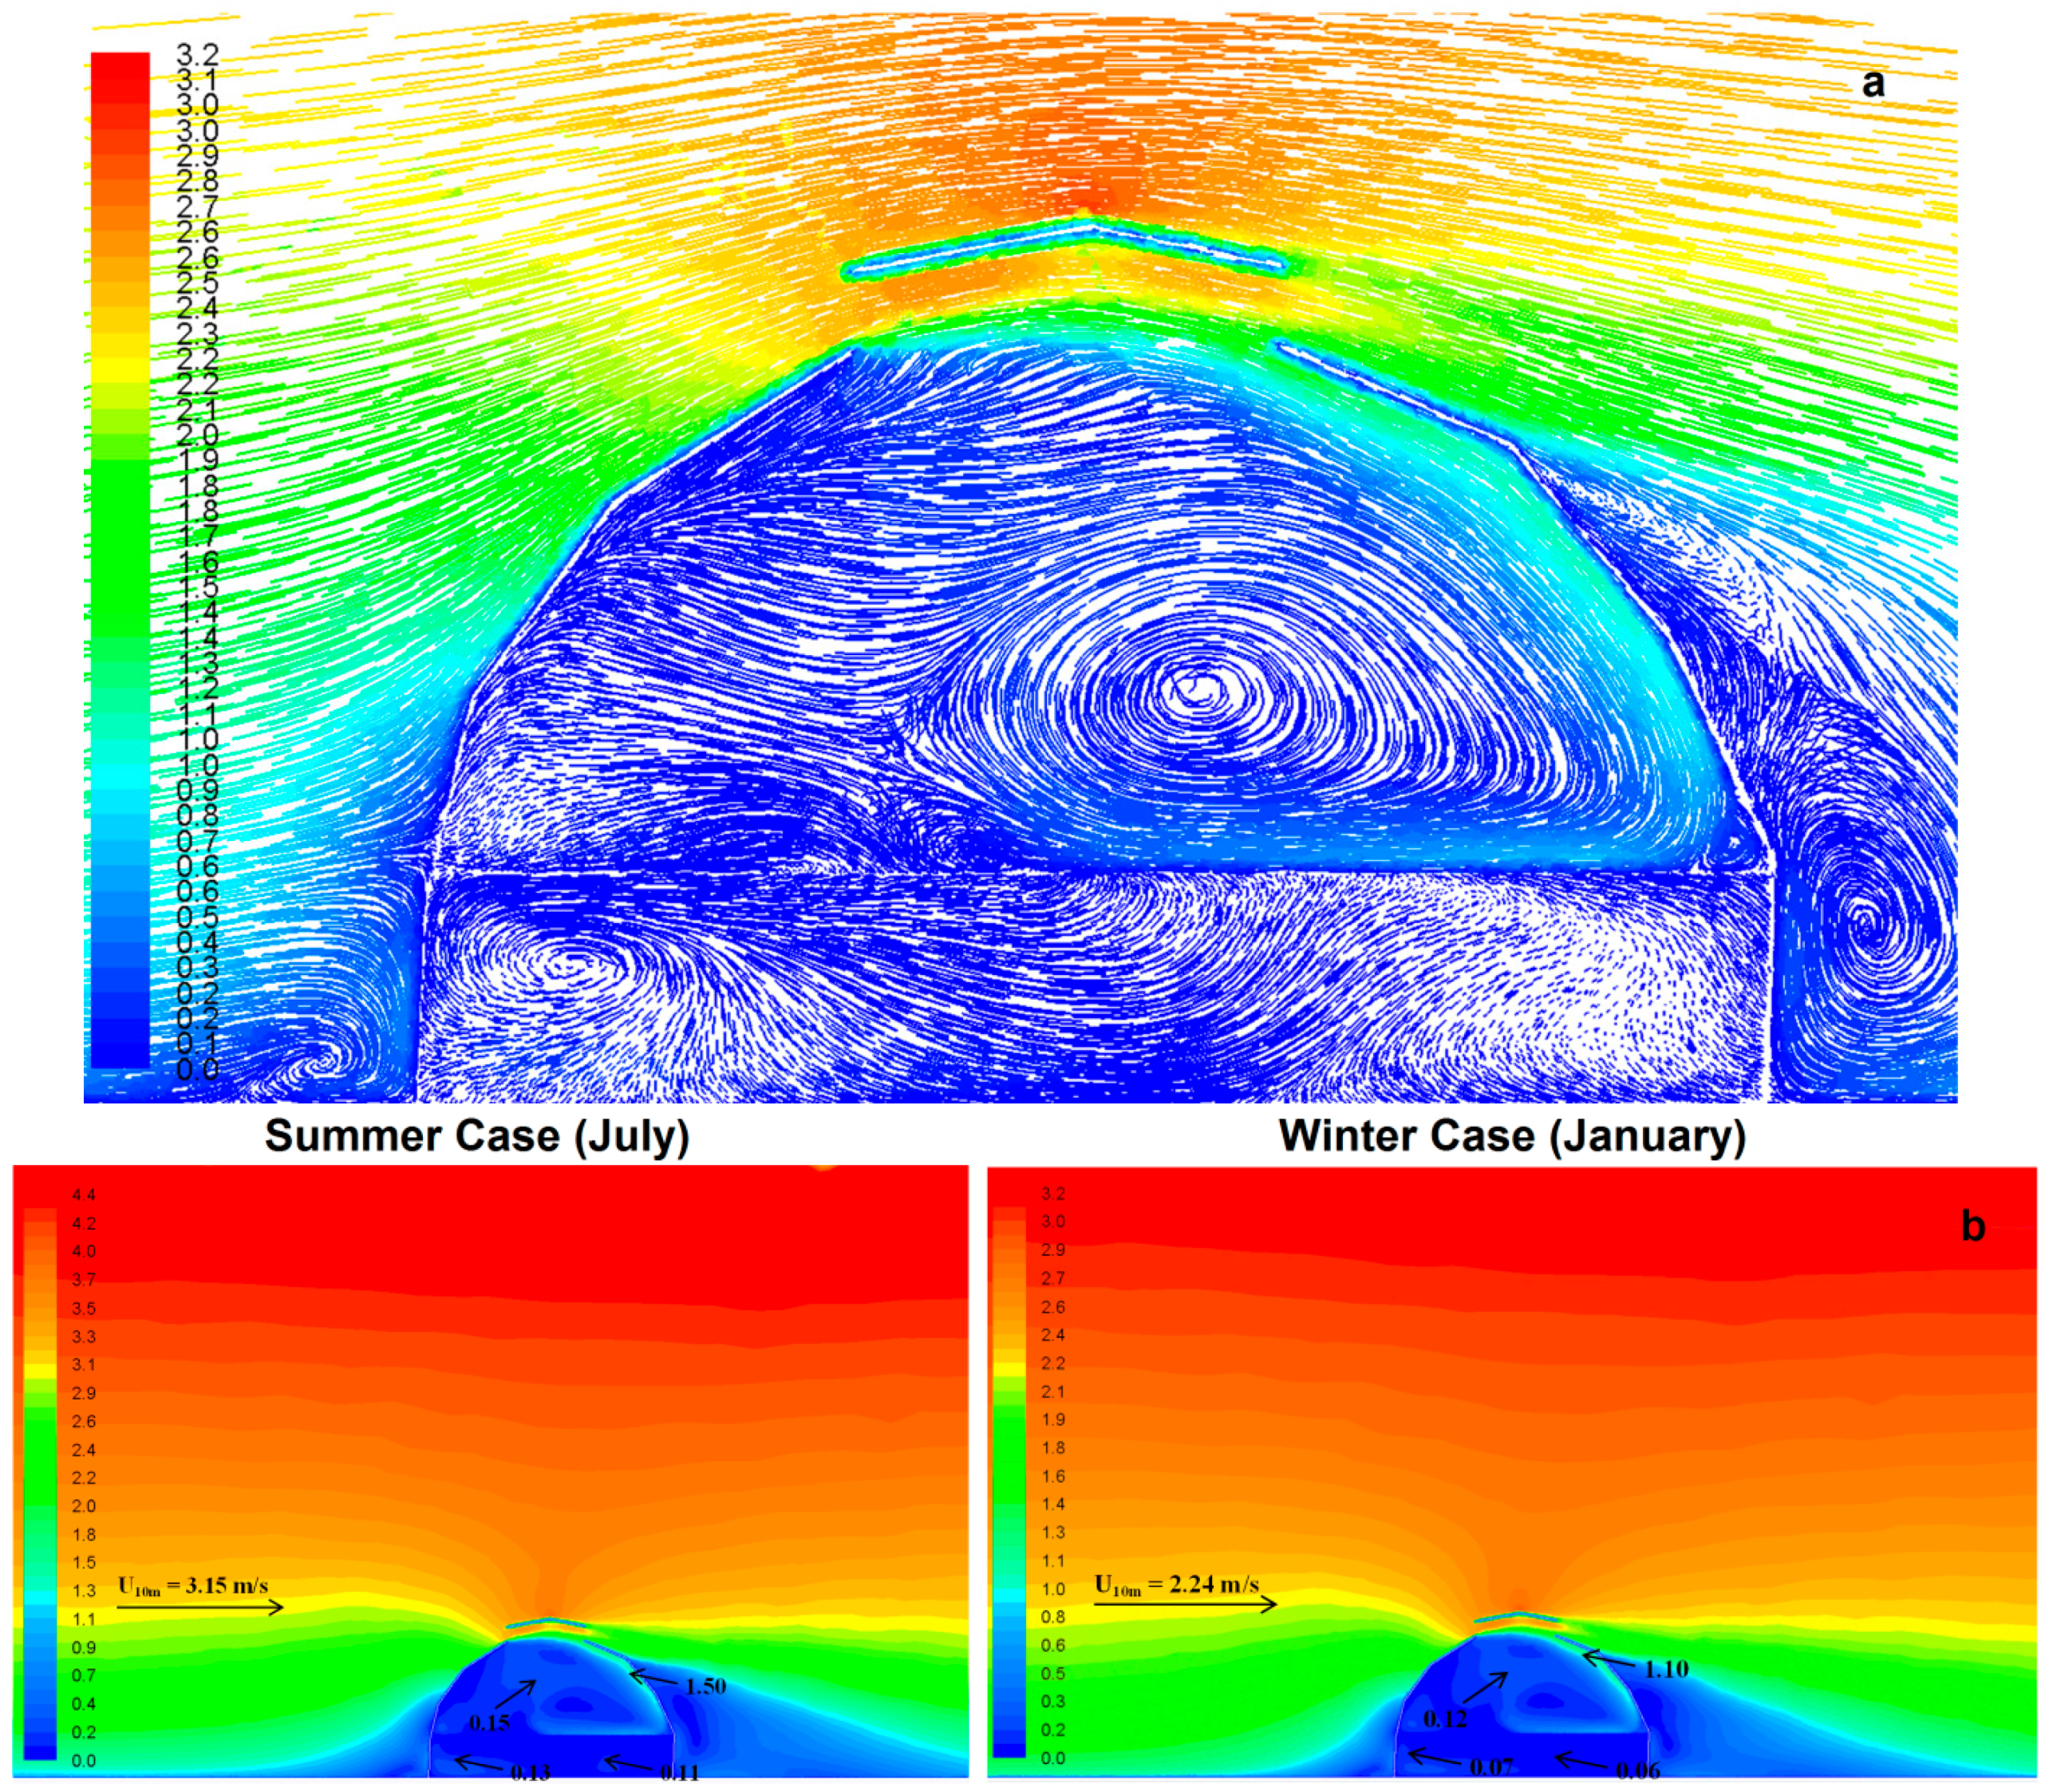
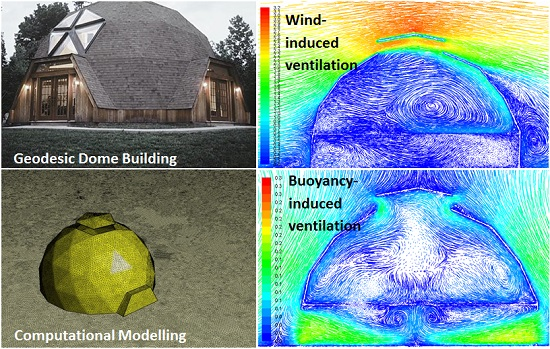
4.1. Wind-Induced Flows
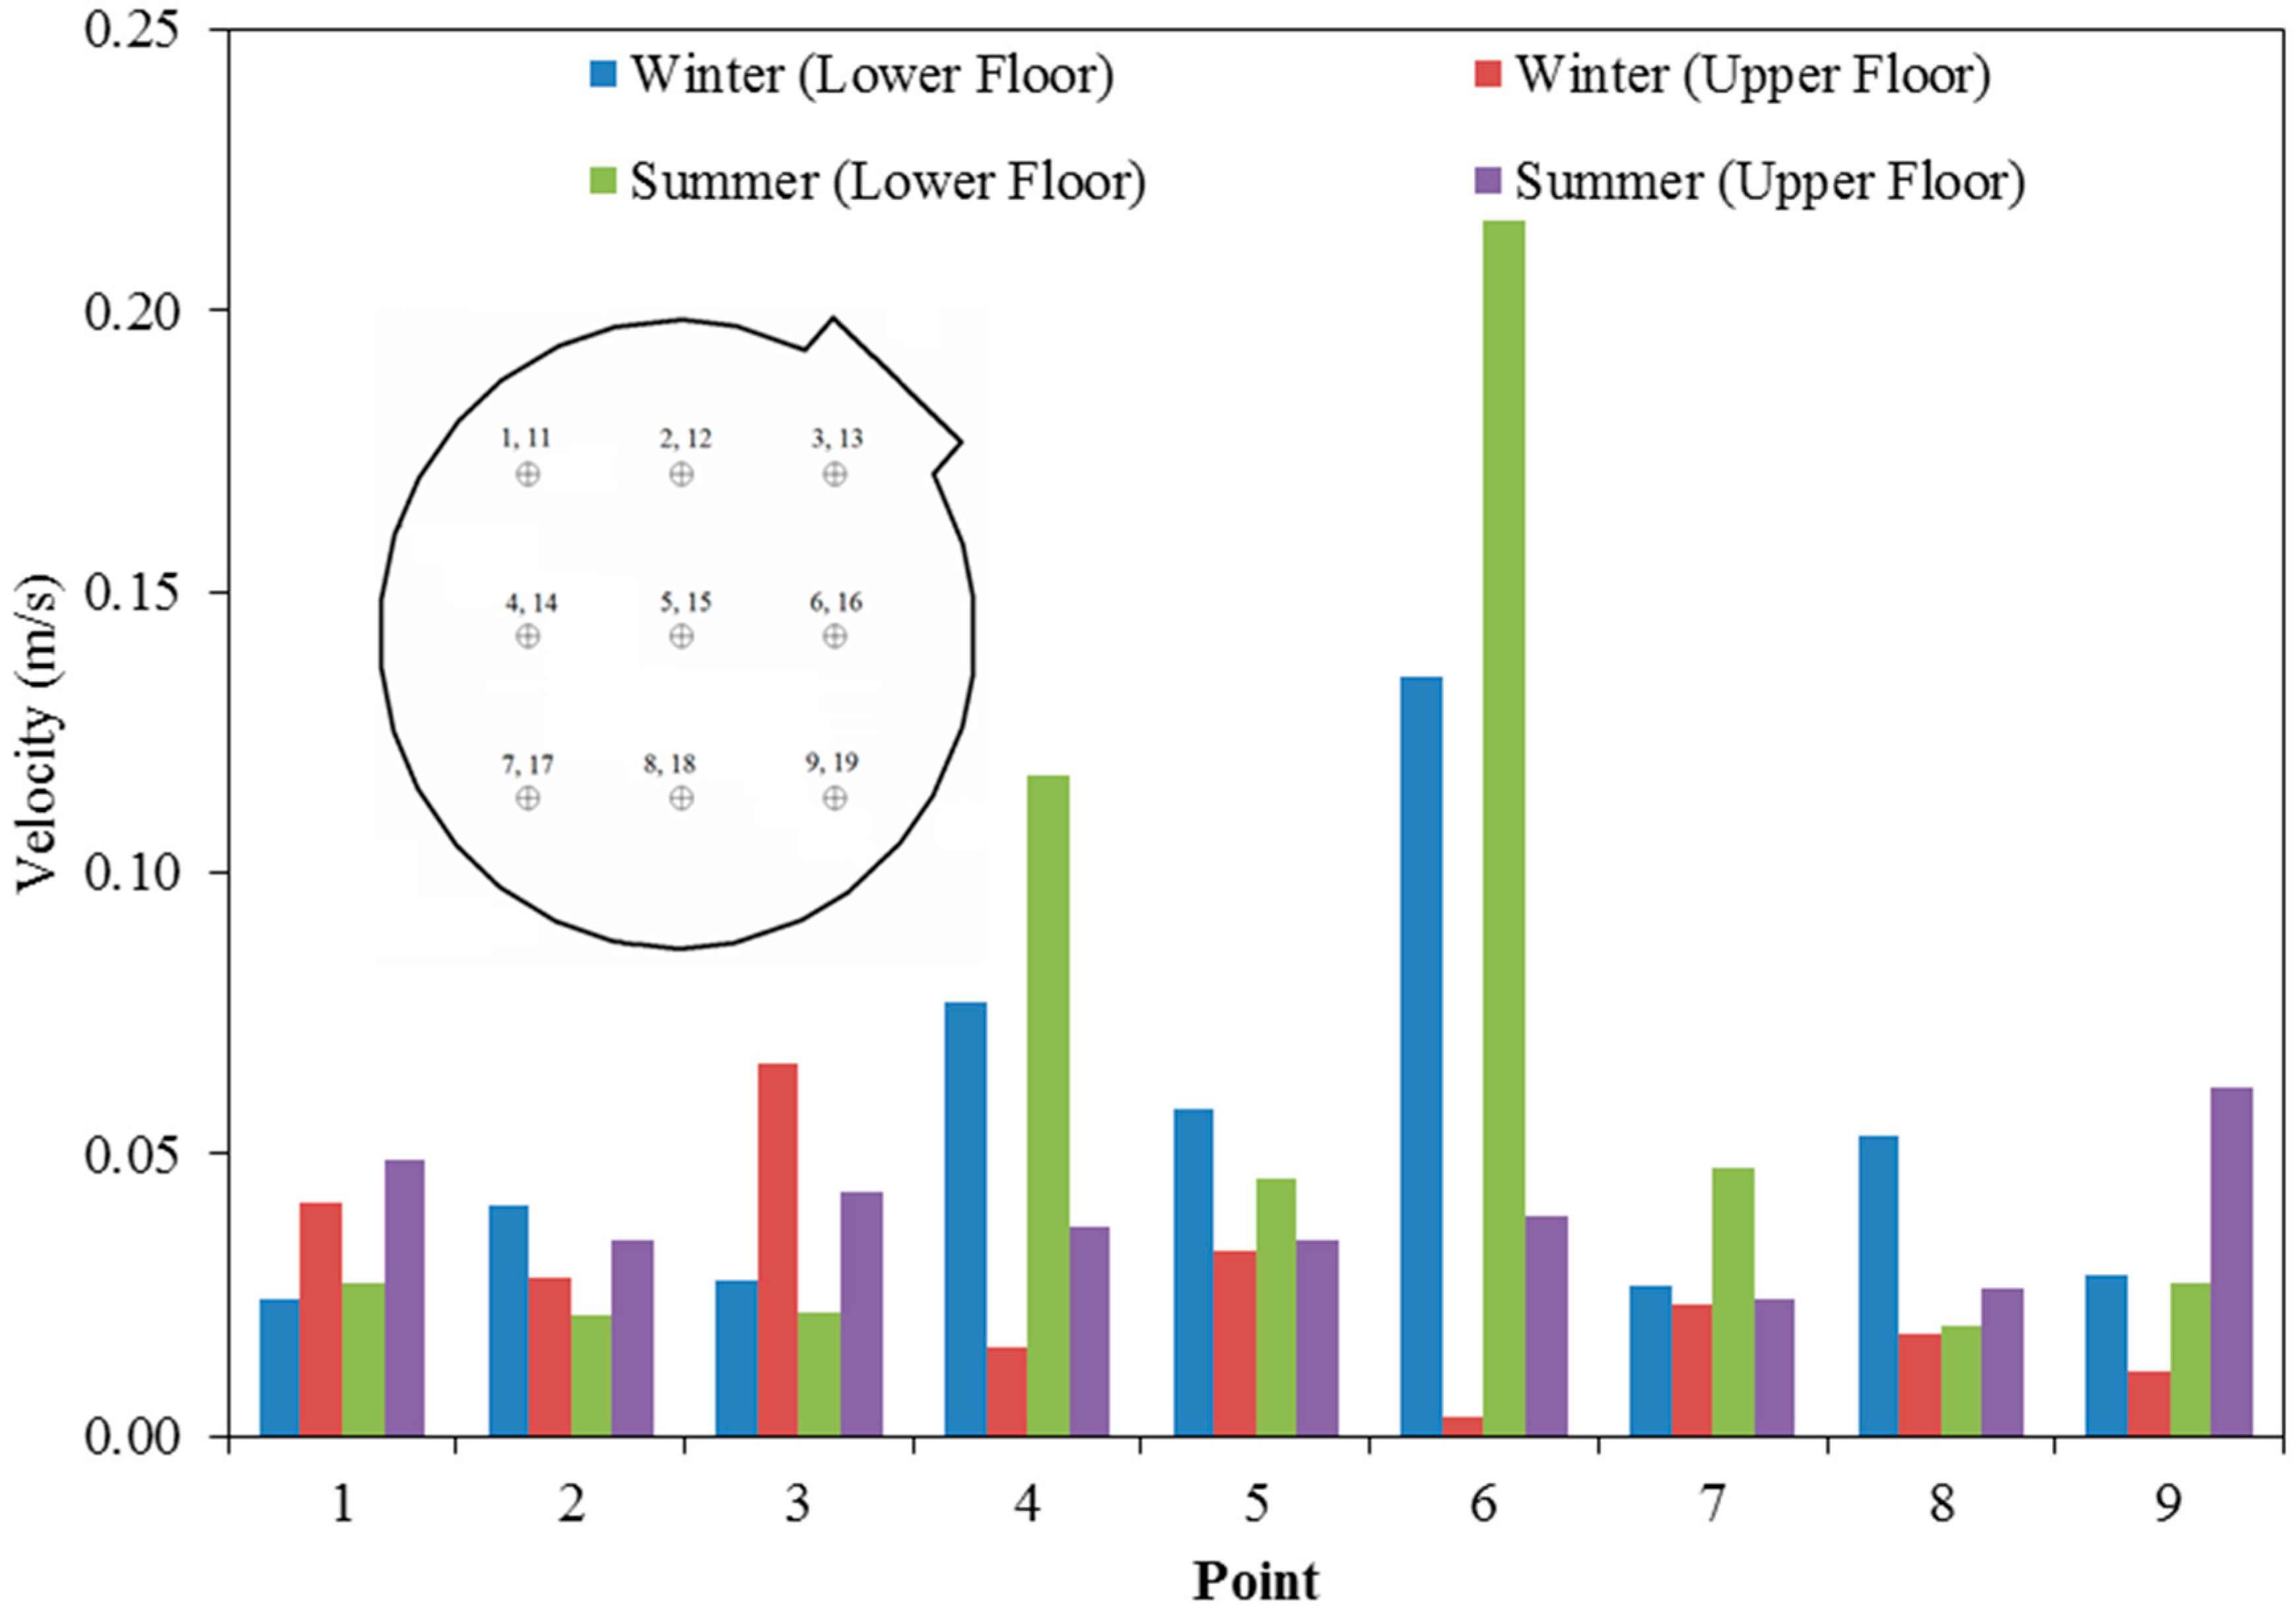
4.1.1. Velocity Distribution (Wind-Induced Flows)
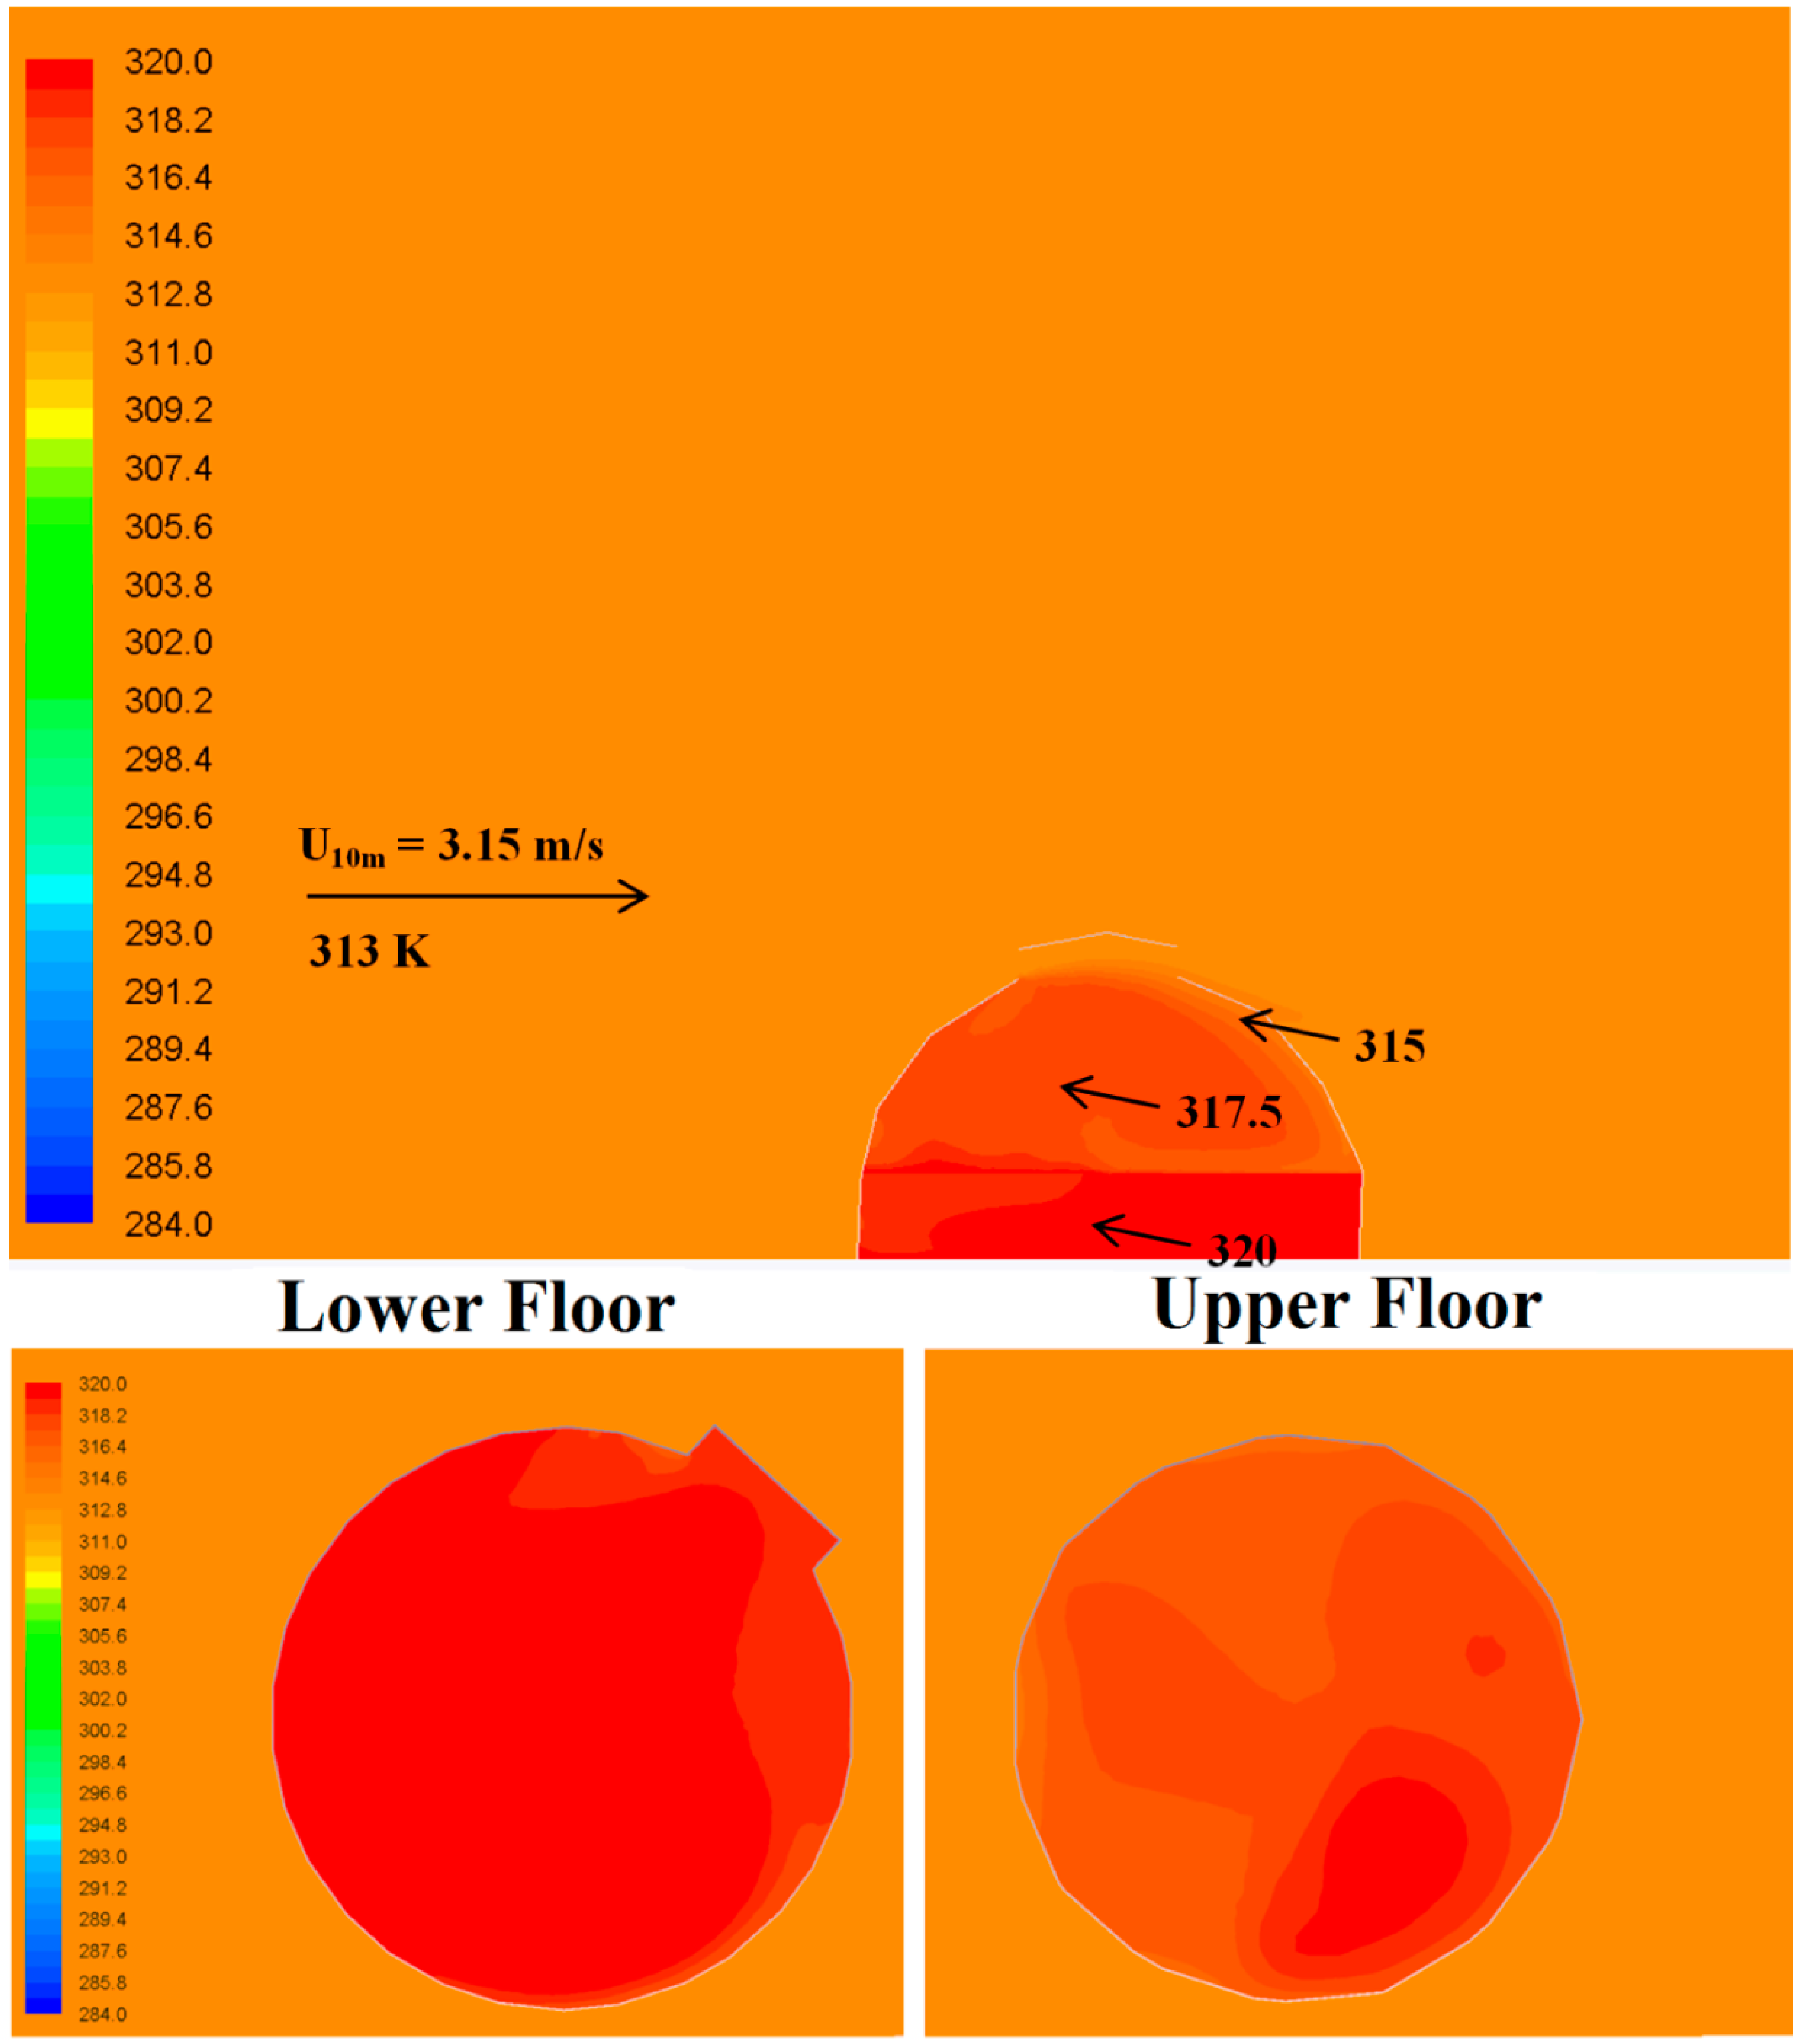
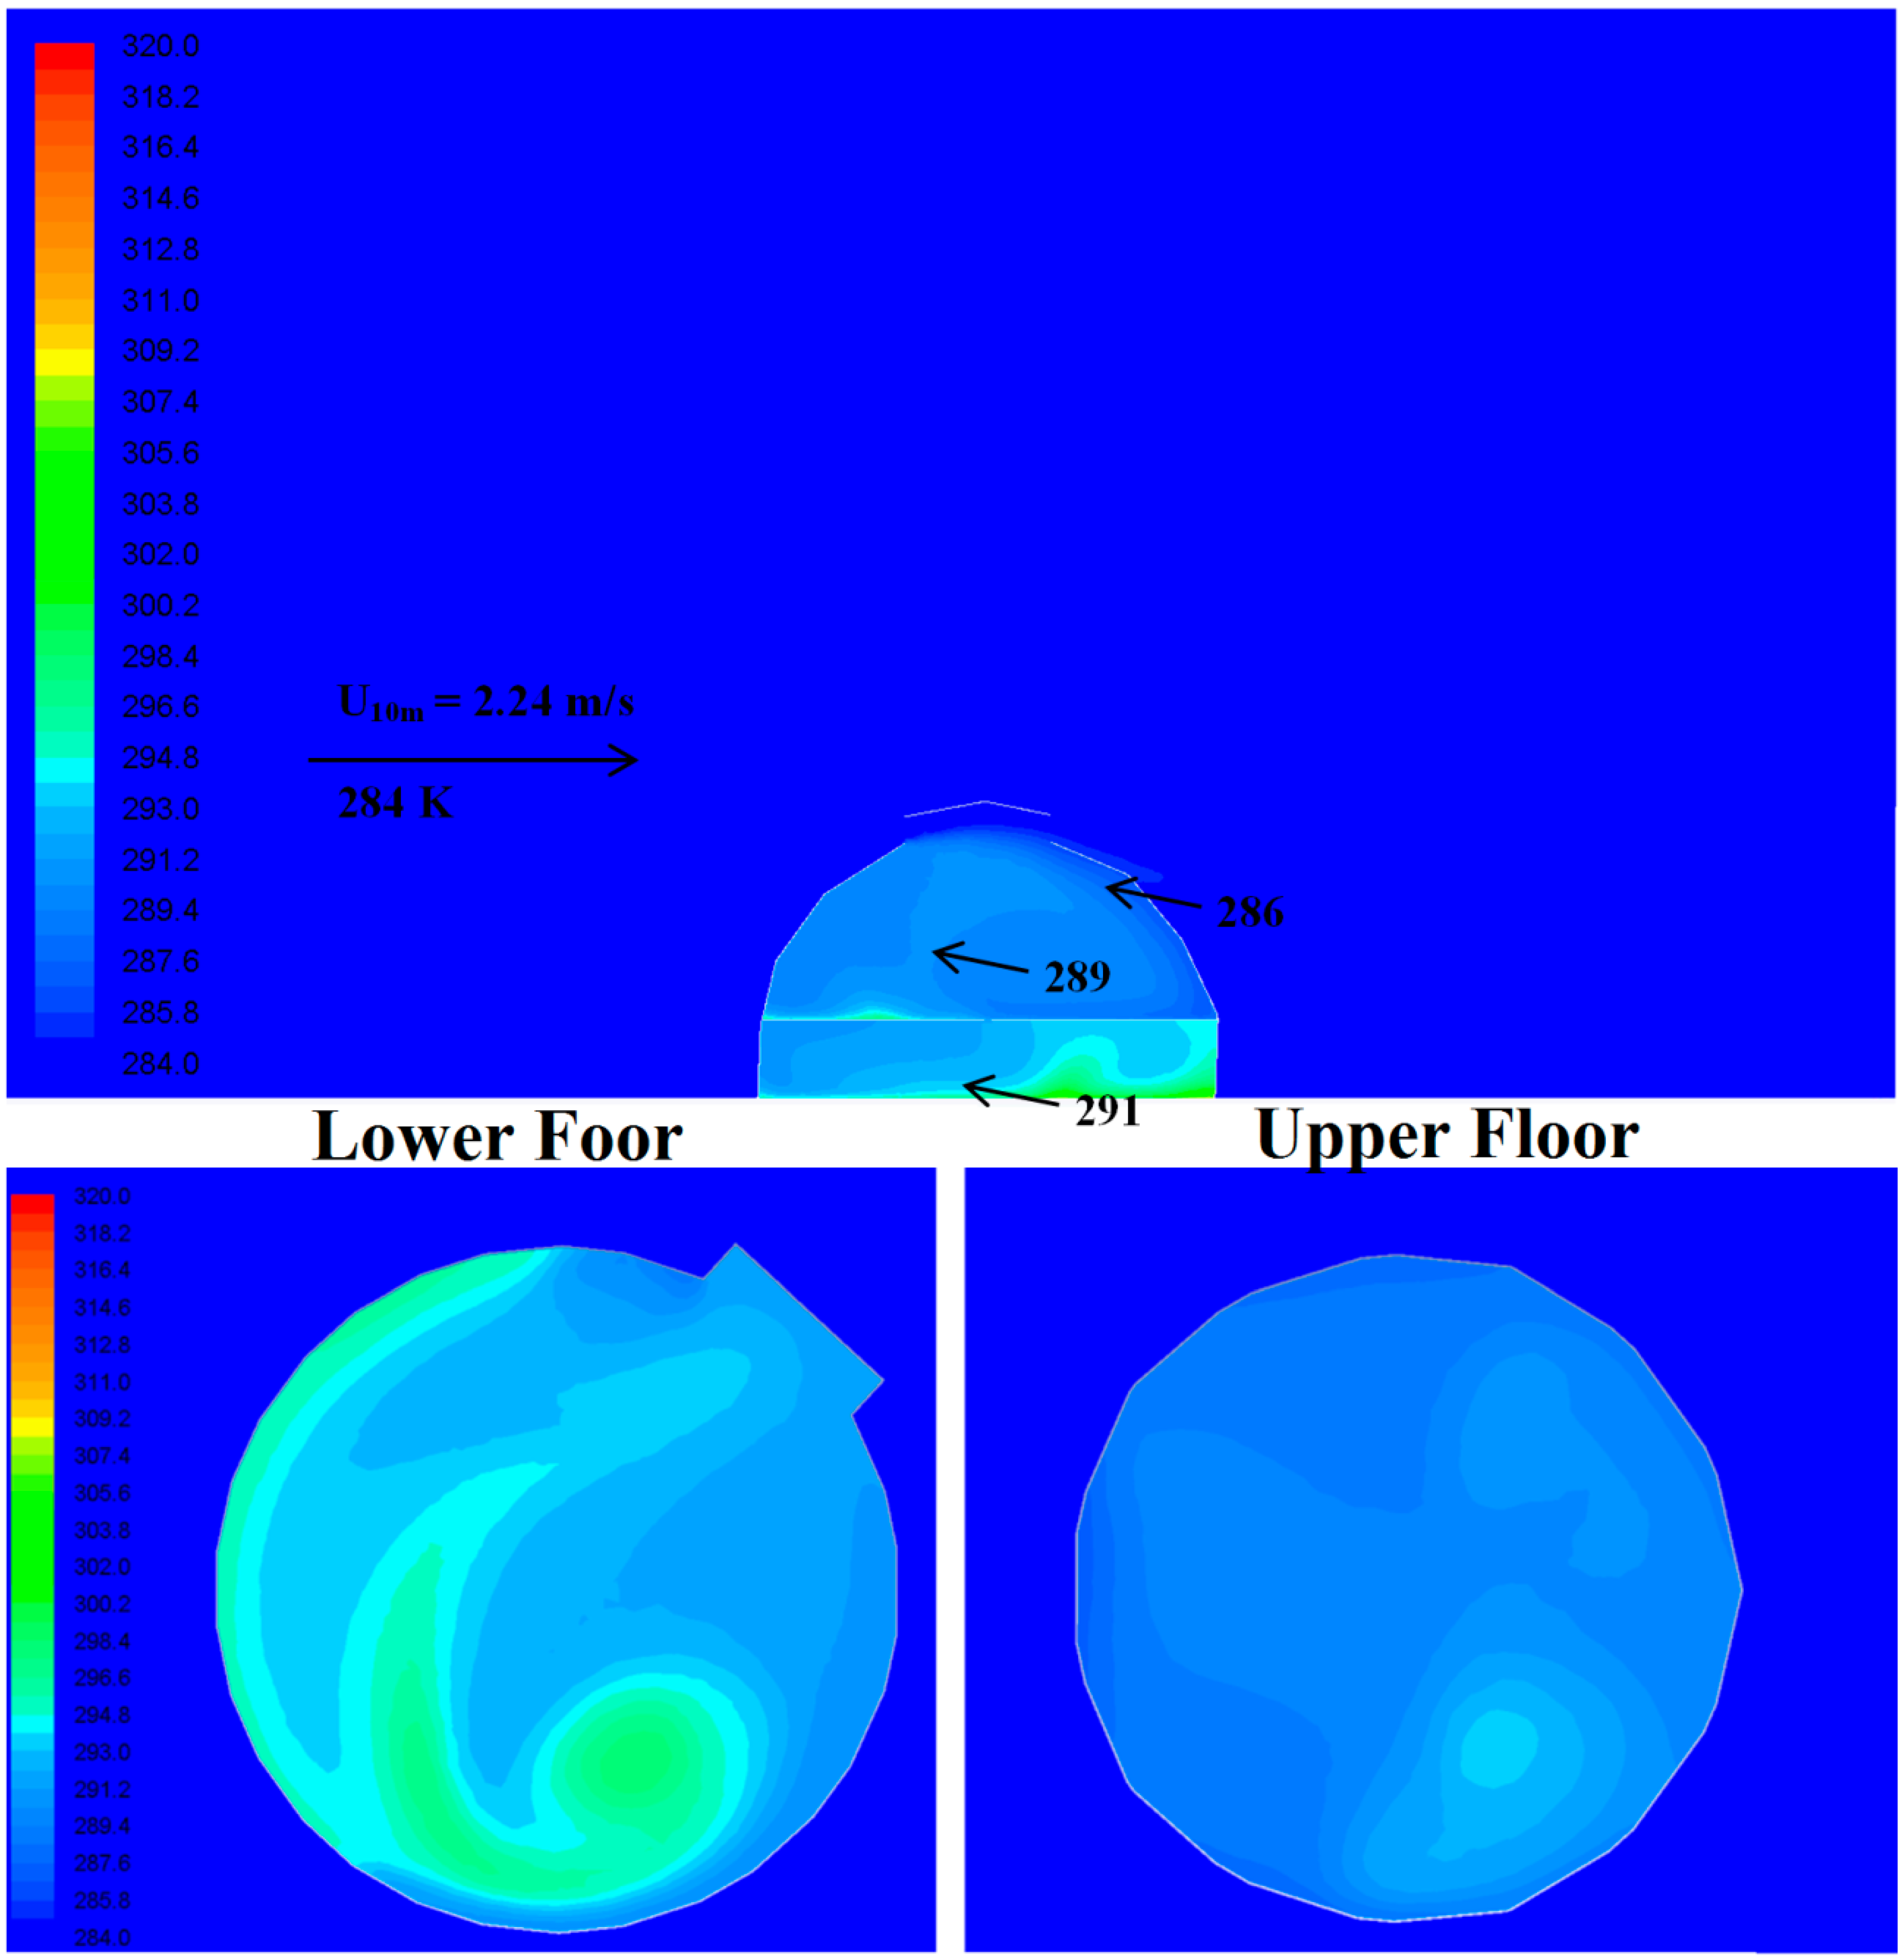
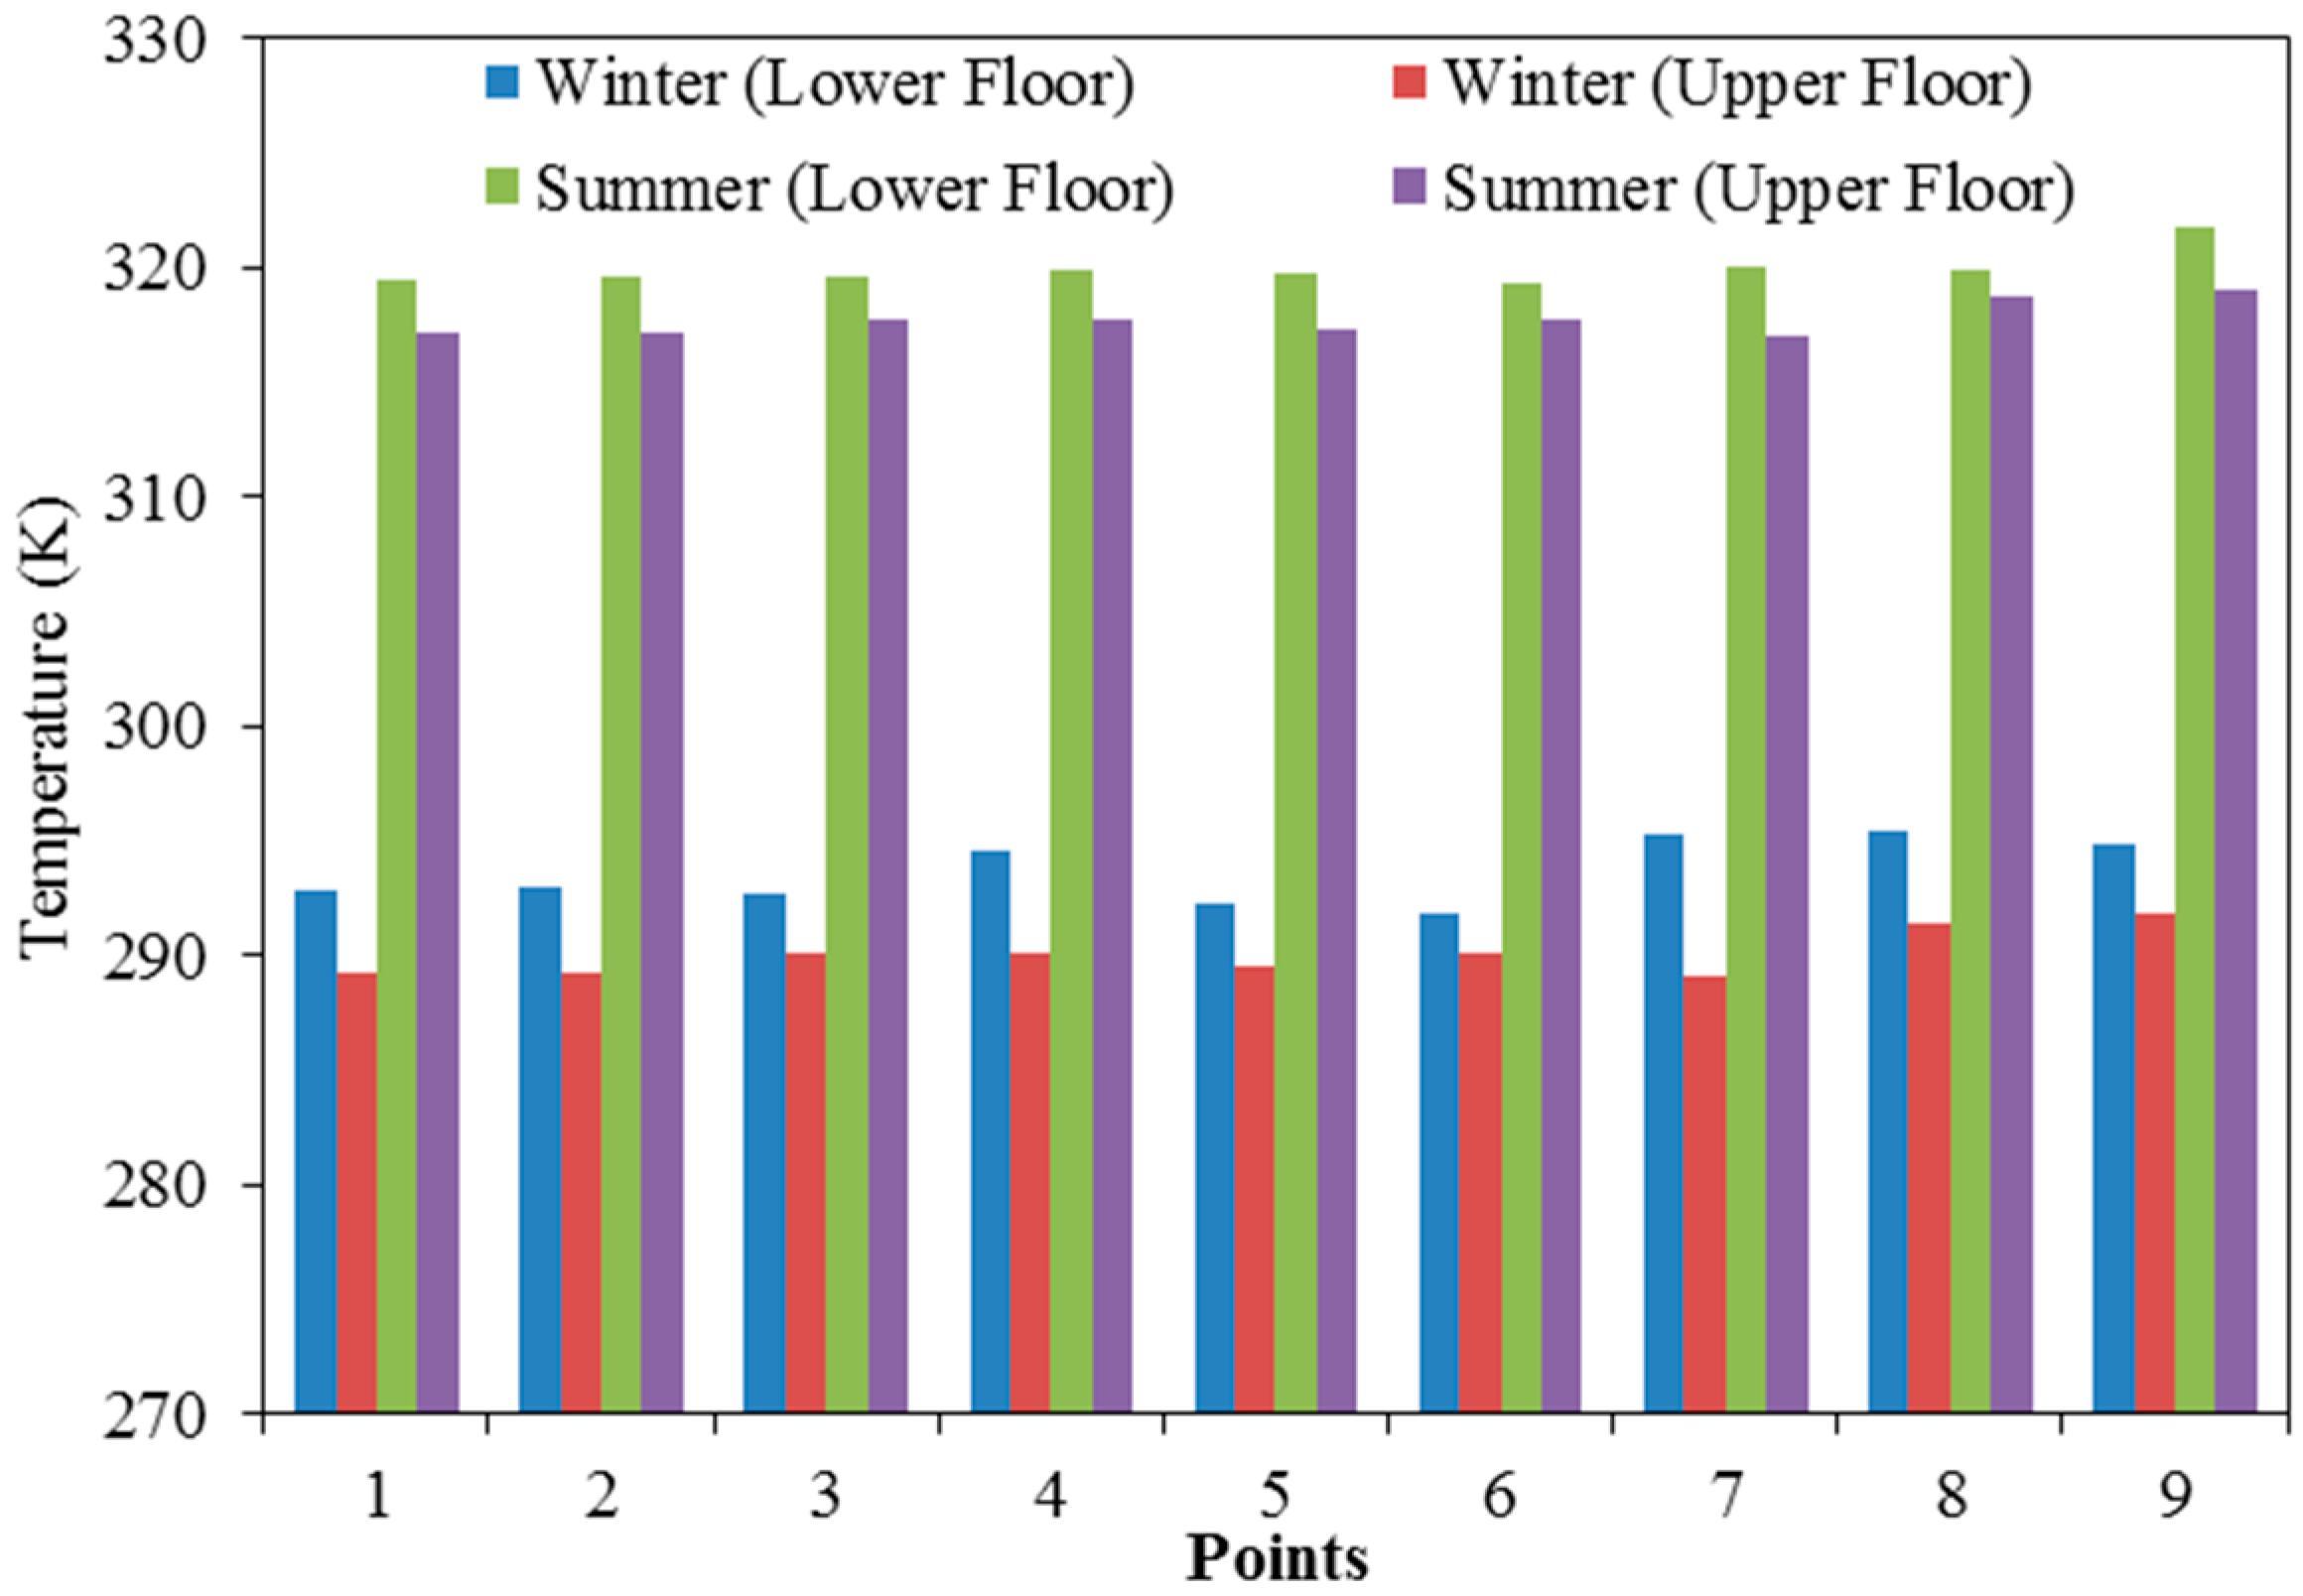
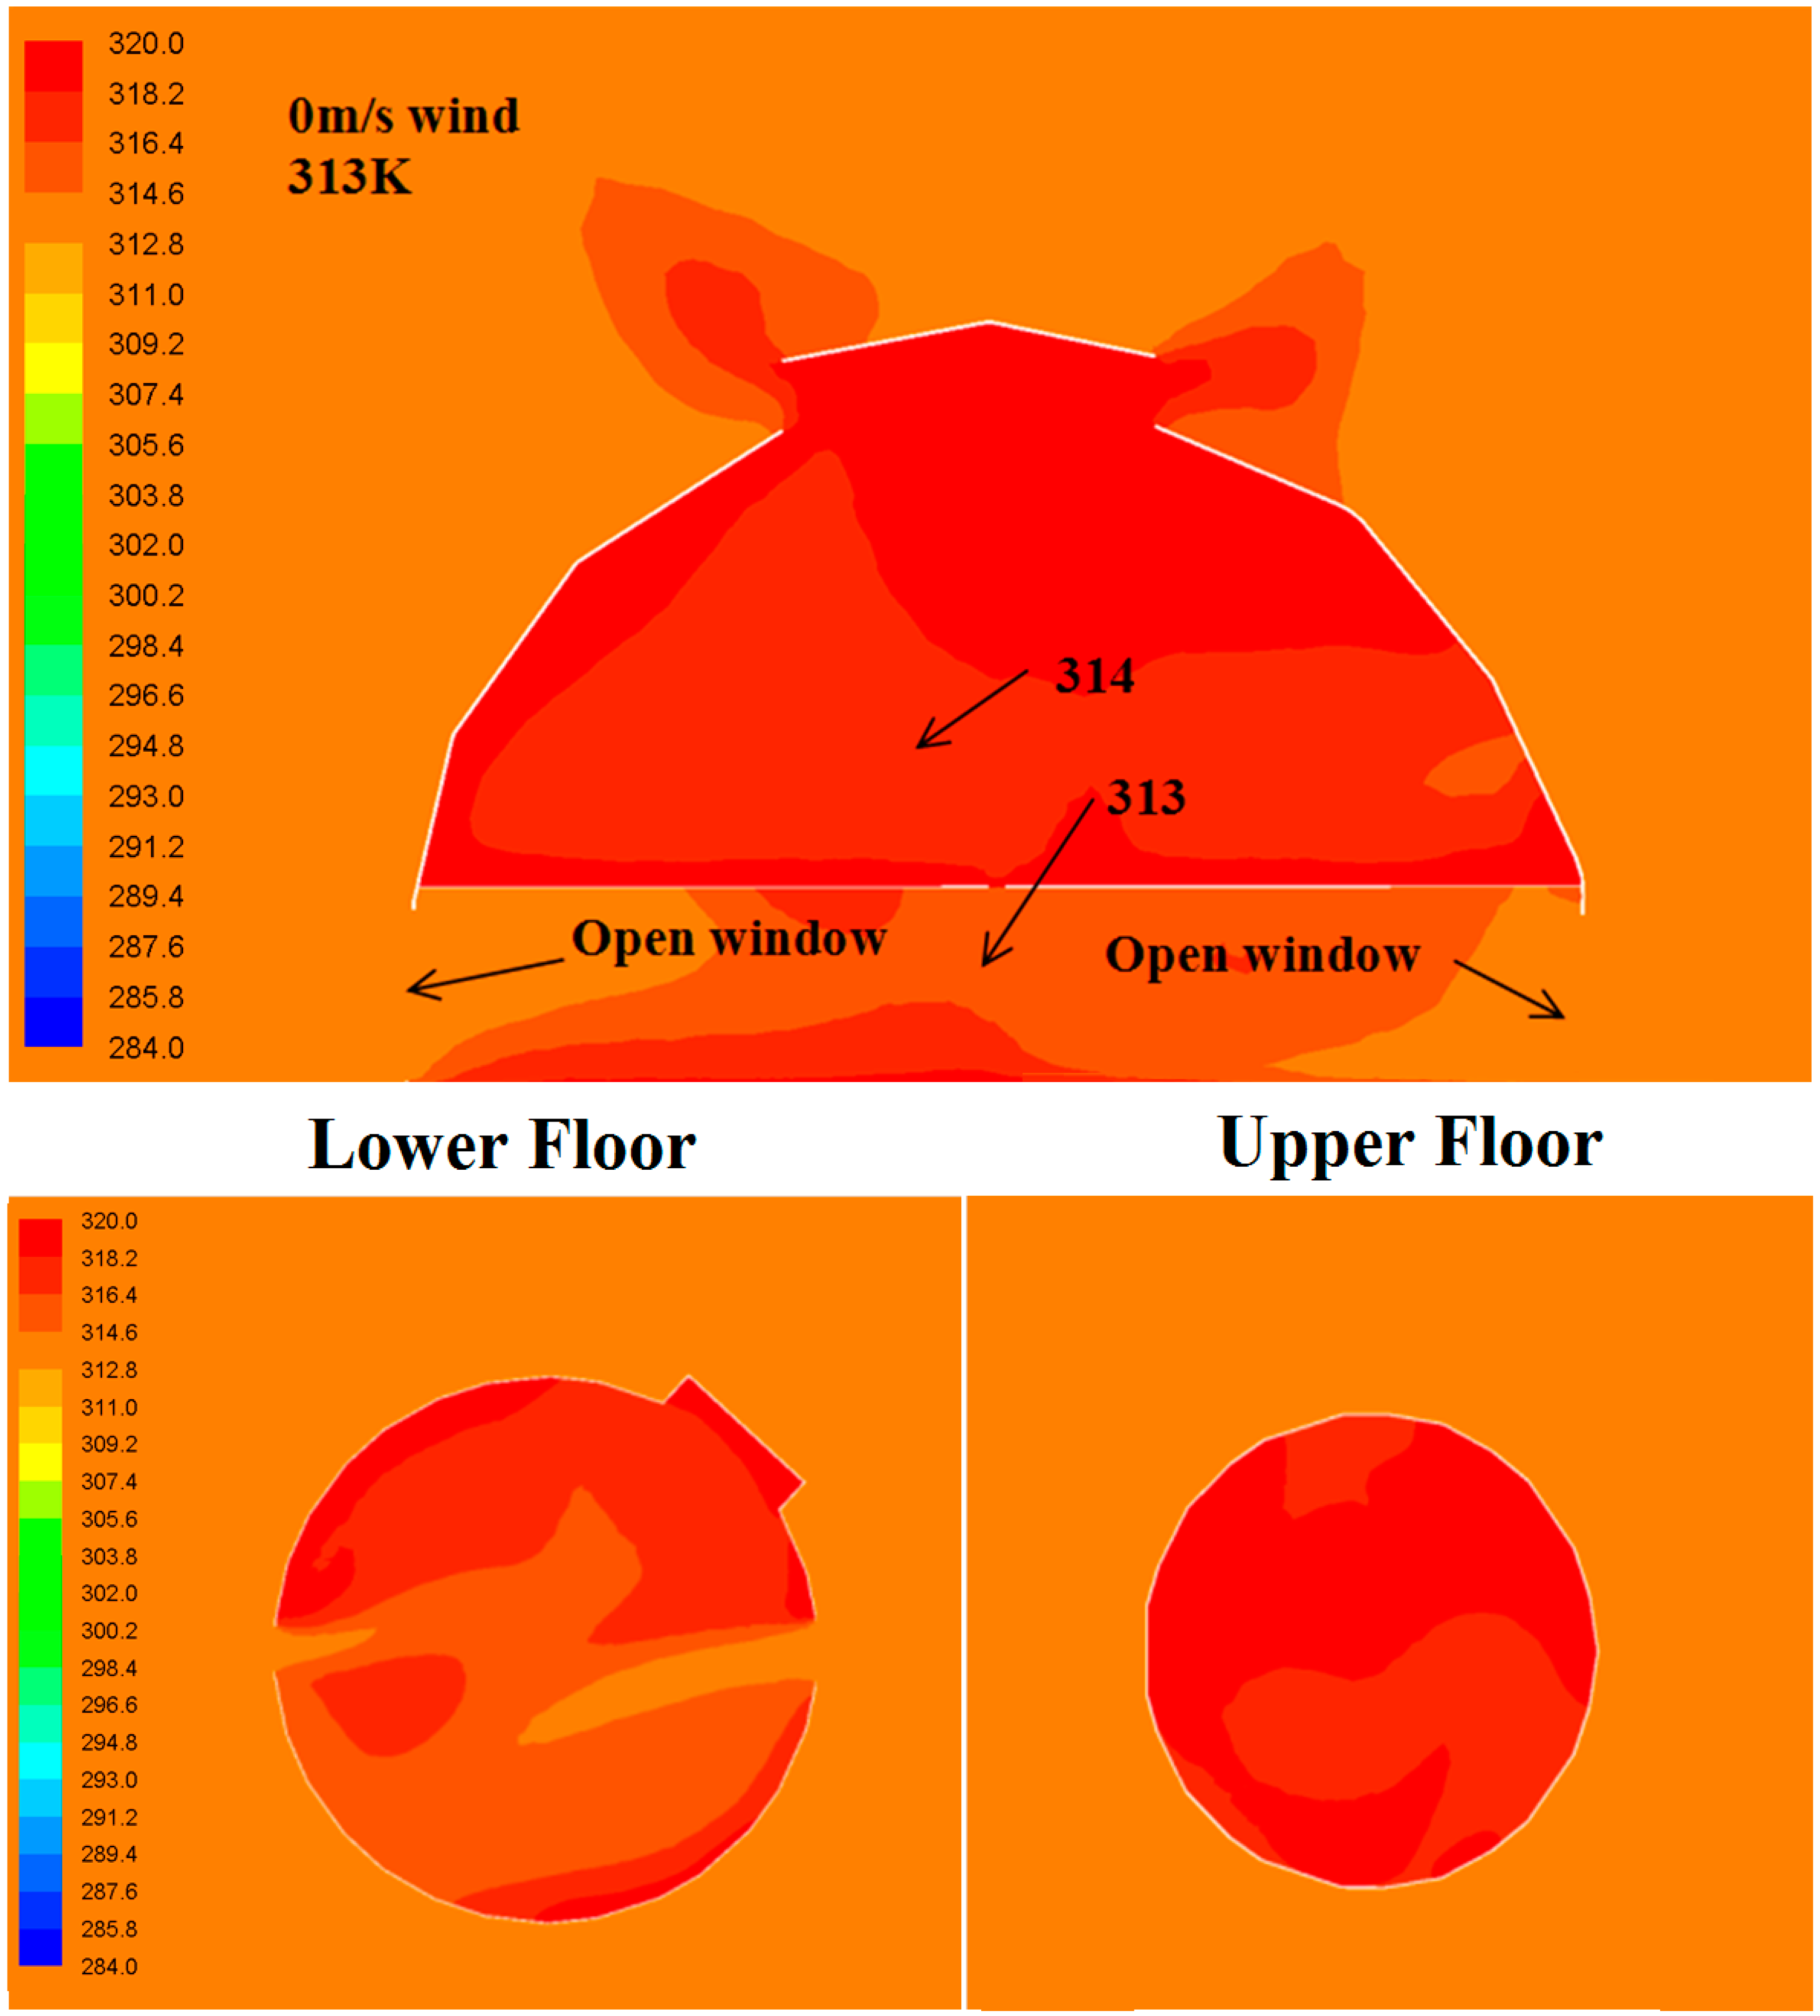
4.1.2. Temperature Distribution (Wind-Induced Flows)
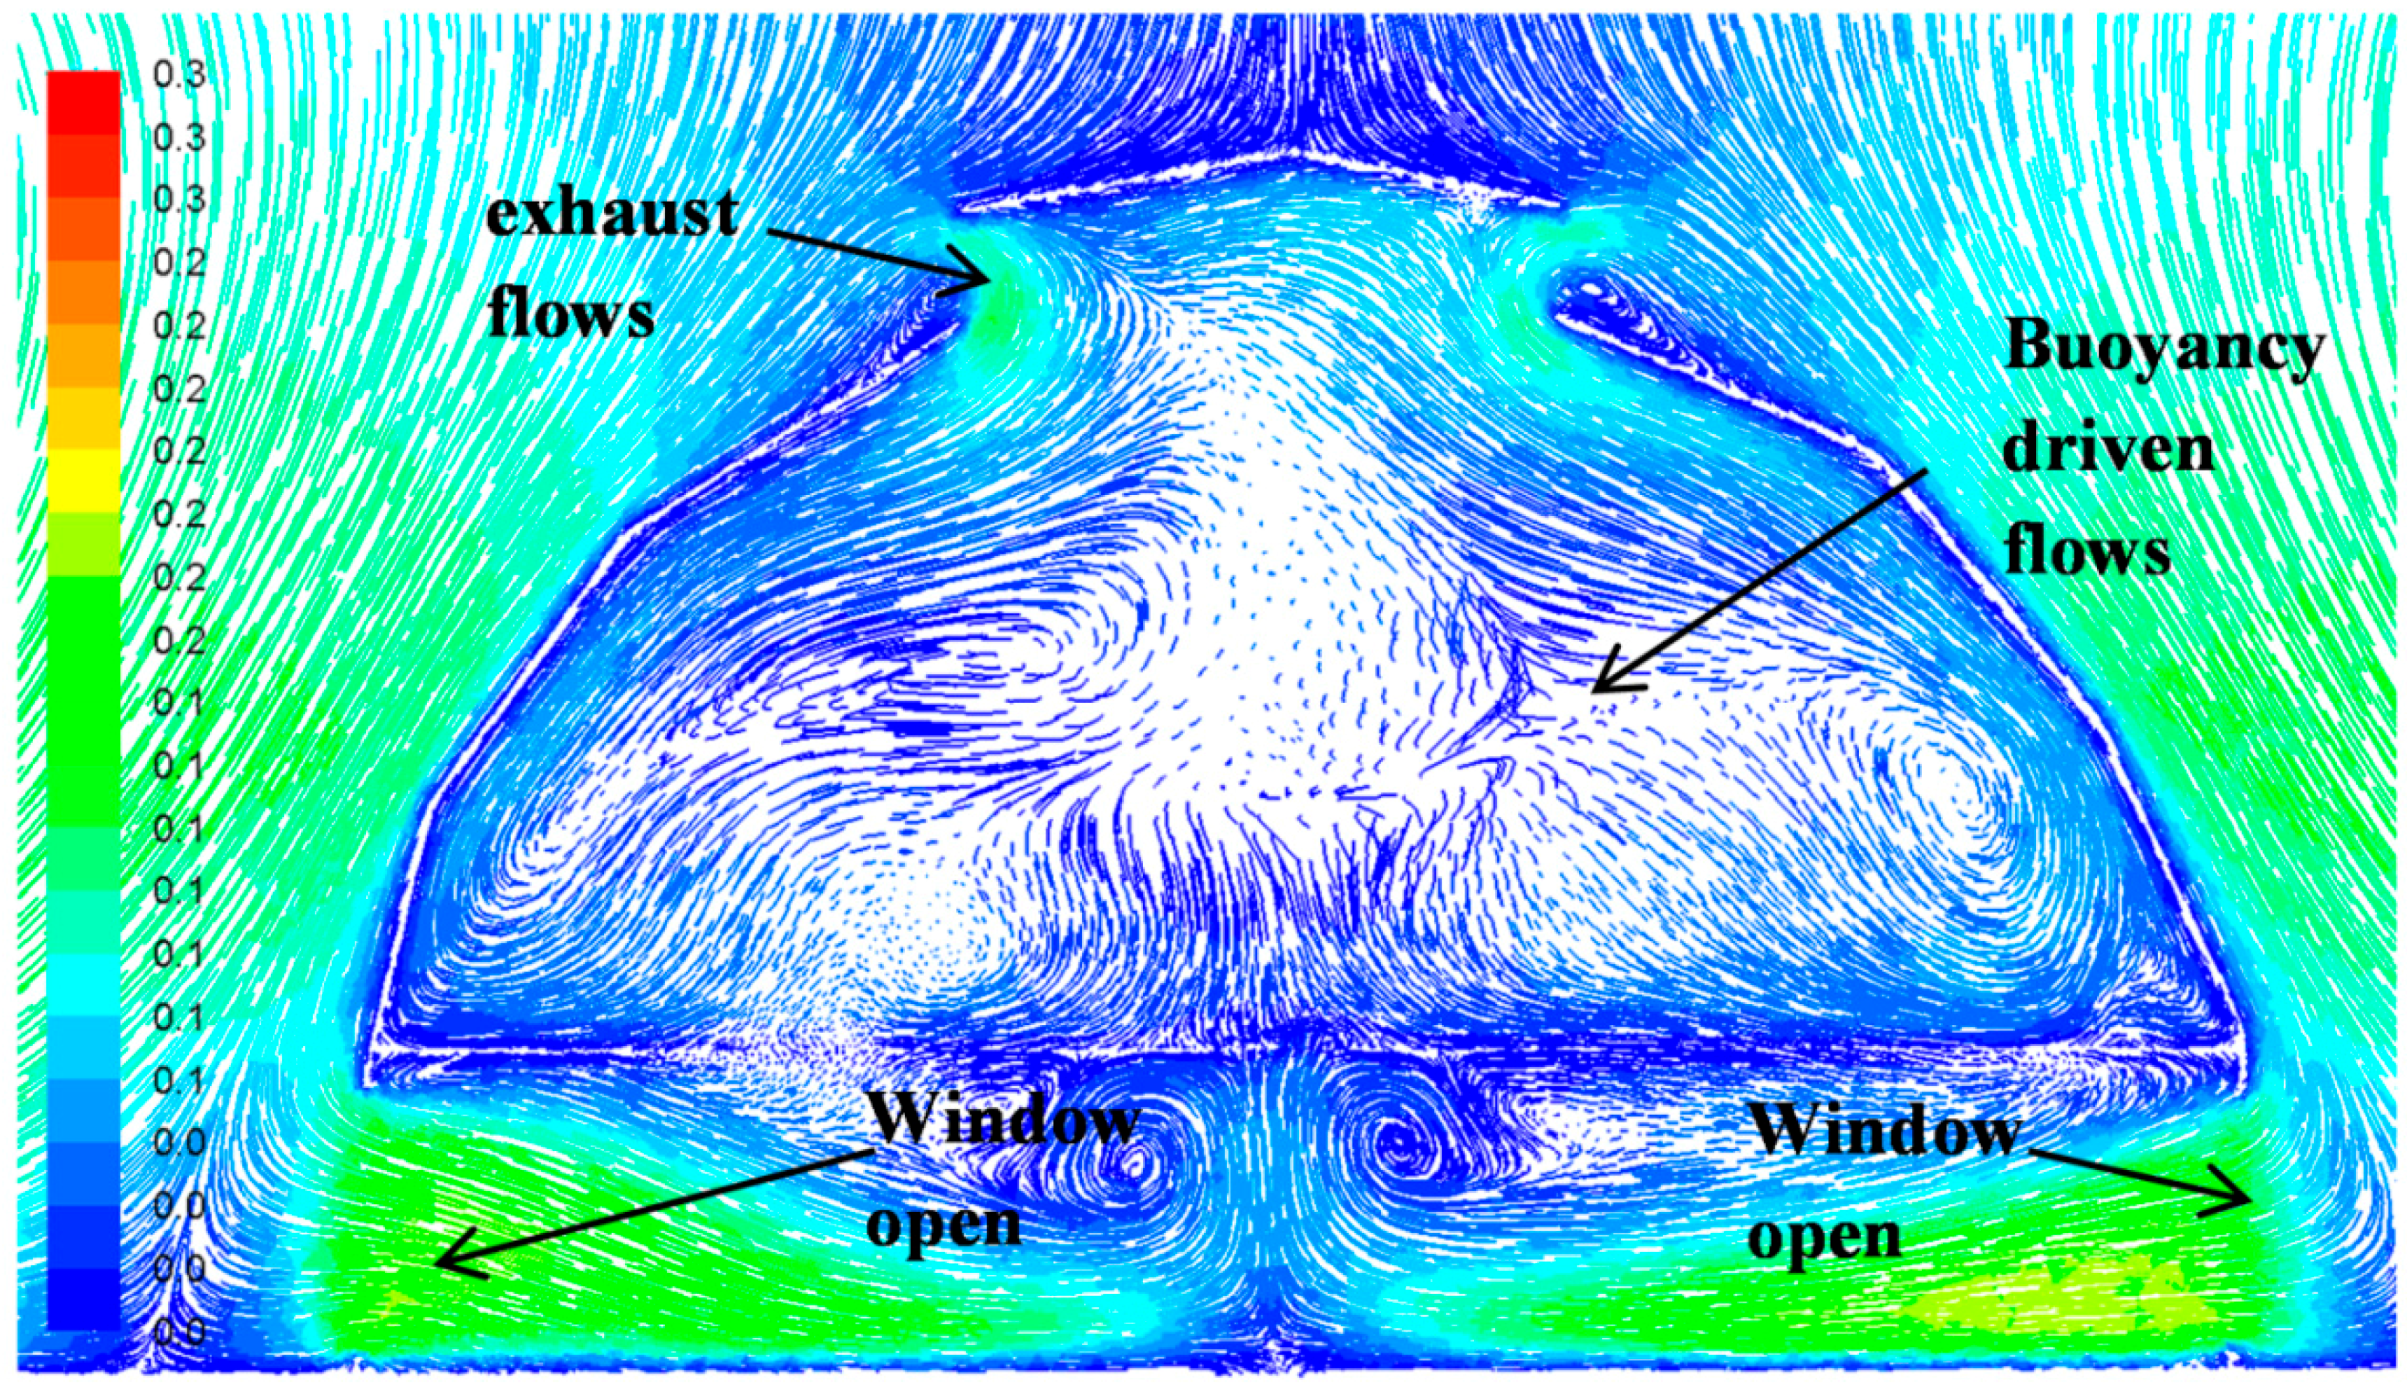
4.2. Buoyancy-Induced Flows
4.2.1. Velocity Distribution (Buoyancy-Induced Flows)
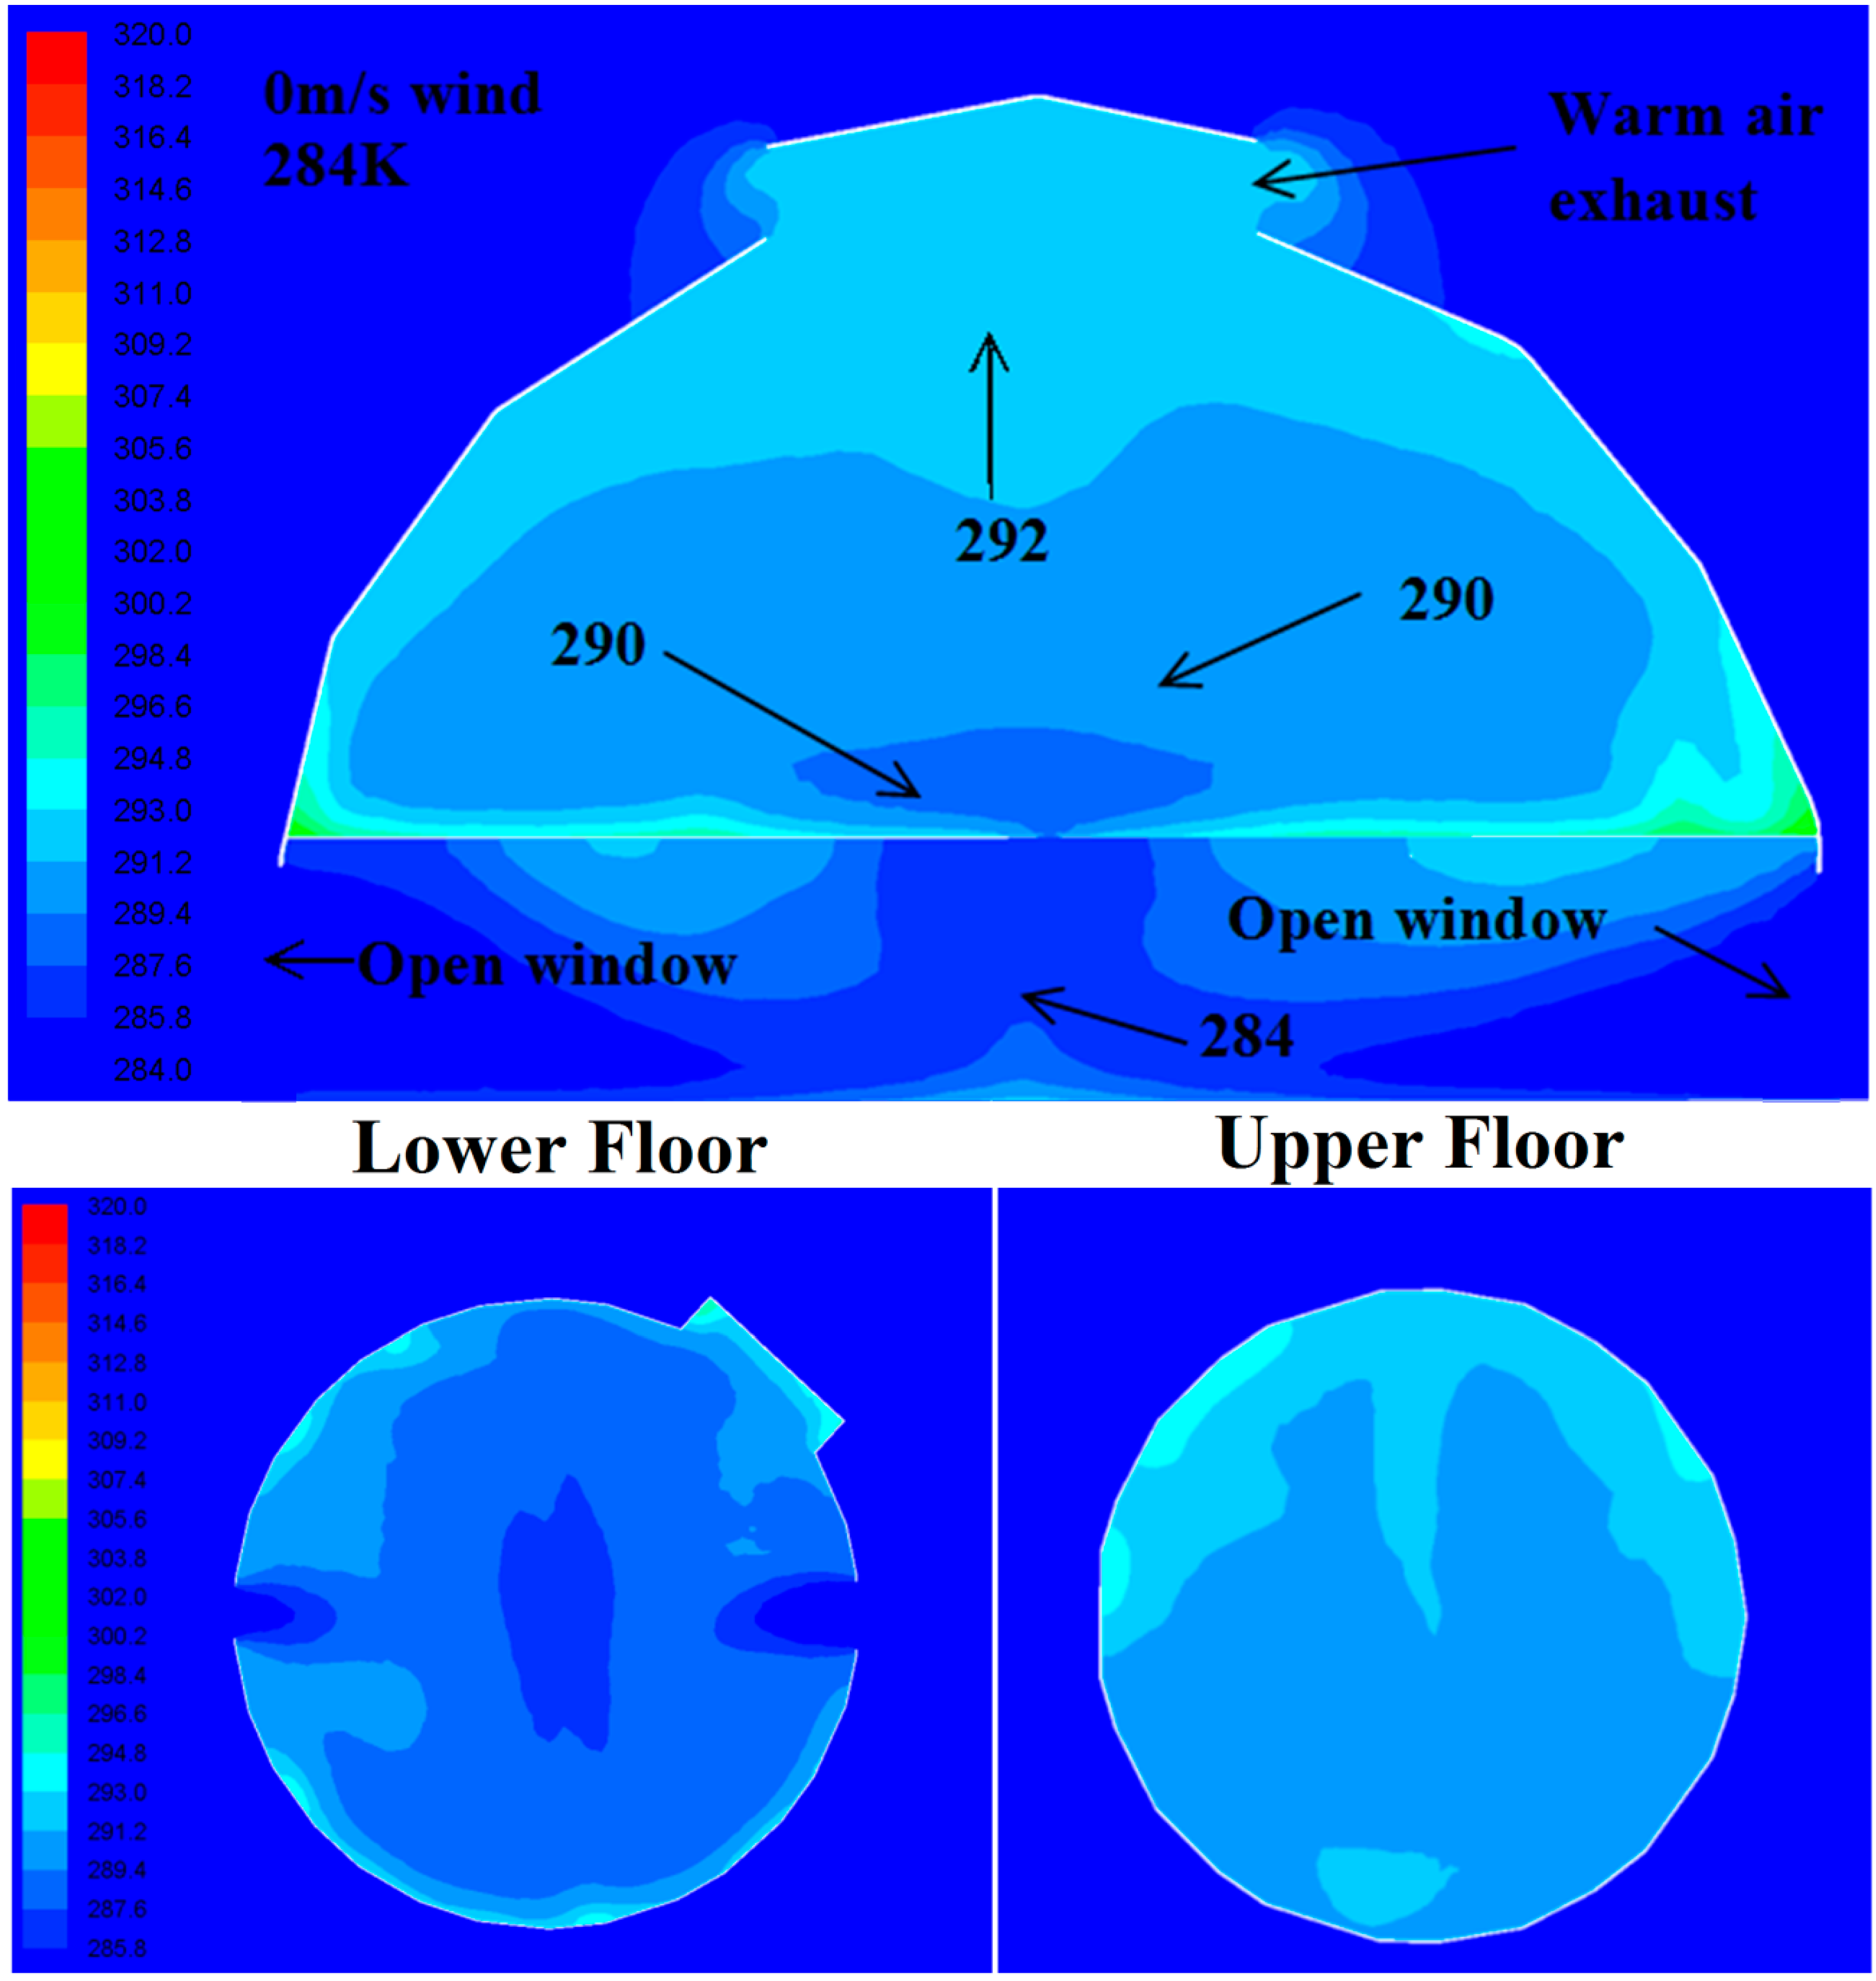
4.2.2. Temperature Distribution (Buoyancy-Induced Flows)
5. Conclusions
Acknowledgments
Author Contributions
Conflicts of Interest
Abbreviations
| ABL | Atmospheric Boundary Layer |
| CFD | Computational Fluid Dynamics |
| FVM | Finite Volume Method |
| HVAC | Heating, Ventilation and Air-Conditioning |
| RANS | Reynolds-Averaged Navier-Stokes |
| SIMPLE | Semi-Implicit Method for Pressure-Linked Equations |
| TKE | Turbulence Kinetic Energy |
References
- United Nations Environment Programme (UNEP) Sustainable Buildings and Climate Initiative. Available online: http://www.unep.org/sbci/AboutSBCI/Background.asp (accessed on 1 September 2015).
- Calautit, J.K.; O’Connor, D.; Sofotasiou, P.; Hughes, B.R. CFD Simulation and Optimisation of a Low Energy Ventilation and Cooling System. Computation 2015, 3, 128–149. [Google Scholar] [CrossRef]
- Calautit, J.K.S.; Hughes, B.R. Integration and Application of Passive Cooling within a Wind Tower for Hot Climates. HVAC&R Res. 2014, 20, 722–730. [Google Scholar]
- Calautit, J.K.; Chaudhry, H.N.; Hughes, B.R.; Ghani, S.A. Comparison between evaporative cooling and a heat pipe assisted thermal loop for a commercial wind tower in hot and dry climatic conditions. Appl. Energy 2013, 101, 740–755. [Google Scholar] [CrossRef]
- Hughes, B.R.; Mak, C.M. A study of wind and buoyancy driven flows through commercial wind towers. Energy Build. 2011, 43, 1784–1791. [Google Scholar] [CrossRef]
- Cory, S.; Donn, M.; Pollard, A. Comparison of NZ’s energy efficiency regulation and verification assumptions to real building loads and operation. Buildings 2015, 5, 116–129. [Google Scholar] [CrossRef]
- Wang, S.; Shen, Z. Impacts of ventilation ratio and vent balance on cooling load and air flow of naturally ventilated attics. Energies 2012, 5, 3218–3232. [Google Scholar] [CrossRef]
- Wang, S.; Shen, Z.; Gu, L. The impact of roof pitch and ceiling insulation on cooling load of naturally-ventilated attics. Energies 2012, 5, 2178–2196. [Google Scholar] [CrossRef]
- Hughes, B.R.; Calautit, J.K.S.; Ghani, S.A. The development of commercial wind towers for natural ventilation: A review. Appl. Energy 2012, 92, 606–627. [Google Scholar] [CrossRef]
- Pixabay. Dome Roof. Available online: https://pixabay.com/en/turkey-istanbul-bosphorus-1405276/ (accessed on 12 August 2016).
- Passe, U.; Battaglia, F. Designing Spaces for Natural Ventilation: An Architect’s Guide; Routledge: Abingdon, UK, 2015. [Google Scholar]
- Andrew, J.M. Domes and Solar Radiation. Available online: http://naturalfrequency.com/articles/solardomes (accessed on 12 December 2015).
- Wang, S.; Shen, Z. Effects of roof pitch on air flow and heating load of sealed and vented attics for gable-roof residential buildings. Sustainability 2012, 4, 1999–2021. [Google Scholar] [CrossRef]
- Calautit, J.K.S.; Hughes, B.R.; Ghani, S.A. A Numerical investigation into the feasibility of integrating green building technologies into row houses in the Middle East. Archit. Sci. Rev. 2013, 56, 279–296. [Google Scholar] [CrossRef]
- Hassan, F. Natural Energy and Vernacular Architecture: Principles and Examples with Reference to Hot Arid Climates; The University of Chicago Press: Chicago, IL, USA, 1986. [Google Scholar]
- Rika, K.; Asri, D. Improvement proposal for dome houses in Indonesia. In Proceedings of the PLEA 2008–25th Conference on Passive and Low Energy Architecture, Dublin, Ireland, 22–24 October 2008.
- Pixabay. Dome Building. Available online: https://pixabay.com/en/berlin-reichstag-the-german-volke-971799/ (accessed on 16 August 2016).
- Pixabay. Switzerland Cern. Available online: https://pixabay.com/en/switzerland-sky-clouds-cern-93275/ (accessed on 1 August 2016).
- Faghih, A.K.; Bahadori, M.N. Experimental investigation of air flow over domed roofs. Iran. J. Sci. Technol. Trans. B Eng. 2009, 33, 207–216. [Google Scholar]
- Faghih, A.K.; Bahadori, M.N. Thermal performance evaluation of domed roofs. Energy Build. 2011, 43, 1254–1263. [Google Scholar] [CrossRef]
- Atif, A.; Laouadi, A.; Atif, M.R. Predicting optical and thermal characteristics of transparent single-glazed domed skylights. ASHRAE Trans. 1999, 105, 325–333. [Google Scholar]
- Khademinejad, T.; Rahimzadeh, S.; Talebizadeh, P.; Rahimzadeh, H.; Sarkardeh, H. CFD modeling of floor heating system in dome shape rooms according to the thermal comfort condition. In Computational Fluid Dynamics Applications in Green Design; CreateSpace: North Charleston, SC, USA, 2014; pp. 277–294. [Google Scholar]
- Romero-Gómez, P.; Choi, C.; Lopez-Cruz, I. Enhancement of the greenhouse air ventilation rate under climate conditions of central Mexico. Agrociencia 2010, 44, 1–15. [Google Scholar]
- Tlili, O.; Mhiri, H.; Bournot, P. Airflow induced by a room fire: Effect of roof shape and source location. Int. J. Therm. Sci. 2015, 90, 135–149. [Google Scholar] [CrossRef]
- Mahdavinejad, M.J.; Javanroodi, K. Efficient roof shapes through wind flow and indoor temperature, case studies: Flat roofs and domed roofs. Armanshahr Archit. Urban Dev. 2014, 12, 55. [Google Scholar]
- Lu, X.; Liu, X.; Lu, S.; Su, Y.; Zhao, Z.; Li, L. Study on air distribution of displacement ventilation in dome cinema in summer. In Proceedings of the 5th International Conference on Advanced Design and Manufacturing Engineering (ICADME 2015), Shenzhen, China, 19–20 September 2015; pp. 1840–1843.
- Lin, Y.; Zmeureanu, R. Three-dimensional thermal and airflow (3D-TAF) model of a dome covered house in Canada. Renew. Energy 2008, 33, 22–34. [Google Scholar] [CrossRef]
- Abohela, I.; Hamza, N.; Dudek, S. Effect of roof shape on energy yield and positioning of roof mounting wind turbines. Renew. Energy 2013, 50, 1106–1118. [Google Scholar] [CrossRef]
- Chung, T.J. Computational Fluid Dynamics, 2nd ed.; Cambridge University Press: Cambridge, UK, 2002. [Google Scholar]
- Vollaro, A.L.; Galli, G.; Vallati, A. CFD Analysis of convective heat transfer coefficient on external surfaces of buildings. Sustainability 2015, 7, 9088–9099. [Google Scholar] [CrossRef]
- Chaudhry, H.N.; Calautit, J.K.; Hughes, B.R.; Sim, L.F. CFD and experimental study on the effect of progressive heating on fluid flow inside a thermal wind tunnel. Computation 2015, 3, 509–527. [Google Scholar] [CrossRef]
- Calautit, J.K.S.; Hughes, B.R.; Ghani, S.A. Numerical investigation of the integration of heat transfer devices into wind towers. Chem. Eng. Trans. 2013, 34, 43–48. [Google Scholar]
- O’Connor, D.; Calautit, J.K.; Hughes, B.R. A Study of Passive Ventilation Integrated with Heat Recovery. Energy Build. 2014, 82, 799–811. [Google Scholar] [CrossRef]
- Valentín, D.; Guardo, A.; Egusquiza, E.; Valero, C.; Alavedra, P. Assessment of the economic and environmental impact of double glazed façade ventilation systems in Mediterranean Climates. Energies 2013, 6, 5069–5087. [Google Scholar] [CrossRef] [Green Version]
- ANSYS Inc. PDF Documentation for Release 15.0. Available online: http://148.204.81.206/Ansys/readme.html (accessed on 16 August 2016).
- Mueller, R.K. Geodesic Dome Notes & Calculator. Available online: https://simplydifferently.org/Geodesic_Dome_Notes?page=2 (accessed on 12 December 2015).
- Rahmatmand, A.; Yaghoubi, M.; Rad, E.G.; Tavakol, M.M. 3D experimental and numerical analysis of wind flow around domed-roof buildings with open and closed apertures. Build. Simul. 2014, 7, 305–319. [Google Scholar] [CrossRef]
- Richards, P.J.; Hoxey, R.P. Appropriate boundary conditions for computational wind engineering models using the k–ε turbulence model. J. Wind Eng. Ind. Aerodyn. 1993, 145–153. [Google Scholar] [CrossRef]
- Grondzik, W.T.; Kwok, A.G. Mechanical and Electrical Equipment for Buildings, 12th ed.; John Wiley and Sons: Hoboken, NJ, USA, 2014. [Google Scholar]
- Autodesk Sustainability Workshop. Equipment and Lighting Loads. Available online: http://sustainabilityworkshop.autodesk.com/buildings/equipment-and-lighting-loads (accessed on 16 August 2016).
- World Weather Online Average High/Low Temperature for Yazd, Iran. Available online: http://www.worldweatheronline.com/yazd-weather-averages/yazd/ir.aspx (accessed on 12 December 2015).
- Ali, M. Feasibility study of harnessing wind energy for turbine installation in province of Yazd in Iran. Renew. Sustain. Energy Rev. 2010, 14, 93–111. [Google Scholar]


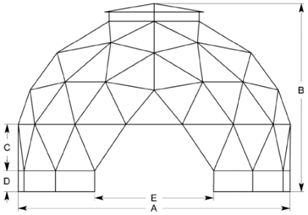
| Specification | Dimensions |
|---|---|
| Base Diameter at A | 13.70 m |
| Height at C | 2.41 m |
| Height at B | 9.06 m |
| Height of Riser D | 0.33 m |
| Entrance Opening E | 5.46 m |
| Floor area at base | 143 m2 |
| Roof area | 329 m2 |
| Volume | 864 m3 |
 |  |
| Parameter | Dimensions |
|---|---|
| Geometry | Solid zone |
| Enclosure | Fluid zone |
| Turbulence Model | Standard k-epsilon |
| Near-Wall Treatment | Standard Wall Functions |
| Velocity Formulation | Absolute |
| Velocity Inlet | ABL Profile (see Section 3.6) |
| Pressure Outlet | Atmospheric |
| Temperature Inlet | see Temperature in Section 3.6 |
| Solver Type | Pressure-Based |
| Time | Steady |
| Gravity | −9.81 m/s2 |
| Points | X [m] | Y [m] | Z [m] | 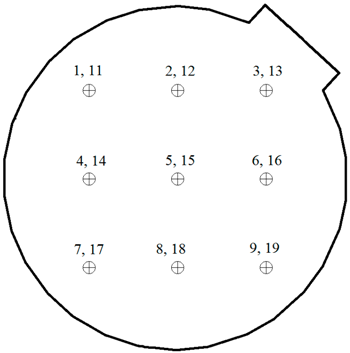 | |
| Lower Floor | 1 | −3.6 | 3.6 | 1.2 | |
| 2 | 0 | 3.6 | 1.2 | ||
| 3 | 3.6 | 3.6 | 1.2 | ||
| 4 | −3.6 | 0 | 1.2 | ||
| 5 | 0 | 0 | 1.2 | ||
| 6 | 3.6 | 0 | 1.2 | ||
| 7 | −3.6 | −3.6 | 1.2 | ||
| 8 | 0 | −3.6 | 1.2 | ||
| 9 | 3.6 | −3.6 | 1.2 | ||
| Upper Floor | 11 | −3.6 | 3.6 | 4.2 | |
| 12 | 0 | 3.6 | 4.2 | ||
| 13 | 3.6 | 3.6 | 4.2 | ||
| 14 | −3.6 | 0 | 4.2 | ||
| 15 | 0 | 0 | 4.2 | ||
| 16 | 3.6 | 0 | 4.2 | ||
| 17 | −3.6 | −3.6 | 4.2 | ||
| 18 | 0 | −3.6 | 4.2 | ||
| 19 | 3.6 | −3.6 | 4.2 |
© 2016 by the authors; licensee MDPI, Basel, Switzerland. This article is an open access article distributed under the terms and conditions of the Creative Commons Attribution (CC-BY) license (http://creativecommons.org/licenses/by/4.0/).
Share and Cite
Soleimani, Z.; Calautit, J.K.; Hughes, B.R. Computational Analysis of Natural Ventilation Flows in Geodesic Dome Building in Hot Climates. Computation 2016, 4, 31. https://doi.org/10.3390/computation4030031
Soleimani Z, Calautit JK, Hughes BR. Computational Analysis of Natural Ventilation Flows in Geodesic Dome Building in Hot Climates. Computation. 2016; 4(3):31. https://doi.org/10.3390/computation4030031
Chicago/Turabian StyleSoleimani, Zohreh, John Kaiser Calautit, and Ben Richard Hughes. 2016. "Computational Analysis of Natural Ventilation Flows in Geodesic Dome Building in Hot Climates" Computation 4, no. 3: 31. https://doi.org/10.3390/computation4030031