Article

Extracting Conformational Ensembles of Small Molecules from Molecular Dynamics Simulations: Ampicillin as a Test Case

Dipartimento di Fisica, Università di Cagliari, Cittadella Universitaria, I-09042 Monserrato (CA), Italy
*
Authors to whom correspondence should be addressed.
Computation 2016, 4(1), 5; https://doi.org/10.3390/computation4010005
Submission received: 30 November 2015 / Revised: 8 January 2016 / Accepted: 21 January 2016 / Published: 26 January 2016
(This article belongs to the Section Computational Chemistry)

Abstract

:
The accurate and exhaustive description of the conformational ensemble sampled by small molecules in solution, possibly at different physiological conditions, is of primary interest in many fields of medicinal chemistry and computational biology. Recently, we have built an on-line database of compounds with antimicrobial properties, where we provide all-atom force-field parameters and a set of molecular properties, including representative structures extracted from cluster analysis over μs-long molecular dynamics (MD) trajectories. In the present work, we used a medium-sized antibiotic from our sample, namely ampicillin, to assess the quality of the conformational ensemble. To this aim, we compared the conformational landscape extracted from previous unbiased MD simulations to those obtained by means of Replica Exchange MD (REMD) and those originating from three freely-available conformer generation tools widely adopted in computer-aided drug-design. In addition, for different charge/protonation states of ampicillin, we made available force-field parameters and static/dynamic properties derived from both Density Functional Theory and MD calculations. For the specific system investigated here, we found that: (i) the conformational statistics extracted from plain MD simulations is consistent with that obtained from REMD simulations; (ii) overall, our MD-based approach performs slightly better than any of the conformer generator tools if one takes into account both the diversity of the generated conformational set and the ability to reproduce experimentally-determined structures.

Graphical Abstract

1. Introduction

The accurate and exhaustive description of the conformational ensemble sampled by small molecules in solution, possibly at different physiological conditions, is of primary interest in many fields of medicinal chemistry and computational biology (e.g., [1,2,3]). Among other tools, numerical calculations, including molecular dynamics (MD) simulations, have gained an ever increasing role in addressing key structural, dynamical, thermodynamic and kinetic features at the molecular level of detail [4,5,6,7,8,9,10,11,12,13,14,15]. In particular, MD simulations based on all-atom empirical force-fields (FF) are nowadays routinely carried out in the μs timescale and over, reaching a very good level of description of the structural and dynamical properties of biological systems, such as membranes [16], proteins [17] and nucleic acids [18]. However, the parametrization of generic molecules (drugs, dyes, etc.) remains often a non-trivial task [19], despite the efforts in developing (semi-)automatic parametrization tools (see, e.g., [20,21,22,23,24,25]).
Recently, in the framework of the translocation consortium [26], we have started building a large database of antimicrobial compounds containing all-atom FF parameters, as well as physico-chemical descriptors derived from both quantum-mechanics and μs-long MD simulations [27]. Our database, freely accessible online, is to our knowledge the first extensive one including dynamical properties for a large set of compounds. Besides the specific application to the translocation of antibiotics through bacterial porins [28,29] and to their extrusion by efflux pumps [30,31], this piece of information can be useful for protein-ligand molecular docking [32], whose success rate is known to be strongly dependent on the generation of accurate input geometries and on the description of the flexibility of both partners involved in the binding process [33]. While receptor flexibility is nowadays routinely considered using different techniques [34,35,36], in the vast majority of docking campaigns, ligand flexibility is generally taken into account by considering the rotatable bonds of one given input structure, sometimes generating the 3D structure from 2D drawings or directly from smiles strings [33]. In addition, stable protomers of ligands are usually generated only at physiological pH 7.4. However, catalytic sites might feature micro-conditions that differ from those found at physiological pH, thus affecting the most likely charge/protonation state of the ligand [33]. An alternative and less exploited way of generating ligand conformations is by means of MD simulations in explicit solvent. Though this methodology is computationally demanding, it has theoretically the advantage of propagating all of the conformational degrees of freedom (not only dihedrals) included in the FF function in the presence of explicit solvent and ions. Furthermore, a plethora of methods exist to accelerate the conformational sampling (e.g., metadynamics [37], accelerated MD [38] and Replica Exchange MD [39]). Therefore, MD-based methods can be useful to improve the reliability and predictive power of molecular docking.
Following the considerations above, the aim of the present work is two-fold: (i) to assess the conformational ensemble extracted from our μs-long MD simulations in terms of both the diversity of the generated conformational set and the ability to reproduce experimentally-determined structures; (ii) to provide parameters of ligands at different pHs, thus making available static and dynamic properties of a given compound as a function of different charge/protonation states. To these aims, we selected a medium-sized molecule in our sample, namely ampicillin (43 atoms, molecular formula C 16 H 19 N 3 O 4 S, molecular weight 349.40476 Da; see Figure 1), a broad-spectrum β-lactam penicillin antibiotic used extensively to treat bacterial infections for more than 50 years [40]. In the following, we will simply refer to the molecule using the corresponding Protein Data Bank chemical component identifier AMP. Thus, considering the AMP neutral zwitterionic form, the most populated one at physiological pH 7.4, we first compared our conformational landscape extracted from plain MD simulations [27] with those obtained by means of: (i) Replica Exchange MD (REMD) [39]; and (ii) some freely-available conformer generation tools widely used in computer-aided drug-design [41]. We additionally generated the General amber Force Field (GAFF) parameters [42] for each major tautomer in the pH range 2–14 and performed μs-long MD simulations for the species bearing net charges −2, −1 and +1. The parameters and the molecular descriptors extracted from both quantum-mechanics and MD simulations are available online [27]. Our results indicate that the conformational statistics extracted from plain MD simulations is: (i) consistent with that obtained from REMD simulations; and (ii) performs slightly better than some widely-used conformer generation tools when considering both the abilities to generate high-diversity conformational ensembles and to reproduce experimentally the available structures.
Figure 1. 2D and 3D structures of zwitterionic ampicillin (oxygen, nitrogen, carbon, sulfur and hydrogens atoms are marked in red, blue, gray, yellow and white, respectively).
Computation 04 00005 g001

2. Computational Methods

2.1. Molecular Characterization and Quantum-Chemistry Calculations

Starting from the structure data file (CID_6249.sdf) downloaded from PubChem [43], we used the package marvin [44] to compute the net charge dependence on pH, the isoelectric point pI and the microspecies distribution in the pH range 2–14. In particular, the microspecies distribution curves as a function of pH have been obtained using the pKa plugin [45] implemented in marvin [44]. This plugin calculates the pKa values of all proton gaining/loosing atoms on the basis of the partial charge distribution computed empirically using the marvin charge plugin [44,45]. We thus focused on the species bearing net charges −2, −1, 0 and +1, which are the major tautomers in the pH range 2–14. The same program has been used to obtain molecular formula, molecular weight, number of H-bond donors/acceptors, number of rotatable bonds and van der Waals volume. The 3D structure of each microspecies has been subsequently used to perform density functional theory (DFT) calculations [46] with the gaussian09 package [47]. As already done in our systematic investigation [27], we employed the hybrid B3LYP functional [48,49] and the 6-31G * * basis-set [50]. The combination B3LYP/6-31G * * is a good compromise between accuracy and computational cost [51,52]. All gaussian09 calculations were performed using the same settings adopted in our previous study [27]. For each major tautomer in the pH range 2–14, we used the DFT optimized geometry to compute logP values with xlogp3 [53] and polar/non-polar molecular surfaces through the platinum web interface [54]. We then generated three sets of atomic partial charges using the RESP method [55] implemented in the antechamber package [56]: the standard Hartree-FockF/6-31G * , and the B3LYP/6-31G * * charges fitting the molecular electrostatic potential using both CHELPG [57] and Merz–Kollman (MK) [58] schemes. We report in Appendix A a comparison between some of the molecular descriptors extracted from MD trajectories obtained with CHELPG-B3LYP/6-31G * * and MK-Hartree–Fock/6-31G*.

2.2. MD Simulations and Post-Processing of the MD Trajectories

For each major microspecies of AMP with total charge −2, −1 and +1, we performed all-atom MD simulations in the presence of explicit water solution (0.1M KCl) using the amber14 package [59]. Model systems were prepared with the program tleap of ambertools14 [59] adopting GAFF parameters [42] for the molecule and the TIP3P model of water [60]. For all microspecies, we used the same protocol adopted in our previous systematic investigation [27]. After production runs, we obtained structural and dynamical properties of the molecules by using the cpptraj program [61]. During the MD runs, we monitored minimum and maximum projection areas using the marvin geometry plugin [44,45] and three morphologic descriptors related to the gyration tensor, i.e., asphericity, acylindricity and kappa2, as implemented in the PLUMED plugin [62]. Asphericity and acylindricity give a measure of the deviation of the mass distribution from spherical and cylindrical symmetry, respectively; the relative shape anisotropy kappa2 is limited between zero and one and reflects both symmetry and dimensionality [63]. Again, the full list of molecular descriptors extracted from MD simulations and the numerical settings adopted can be found in [27].

2.3. REMD Calculations and Conformer Generation Methods Adopted

REMD simulations were performed for the zwitterionic form of AMP using the amber14 package [59]. We adopt a set of 72 replicas in the temperature range from 275–600 K. Each replica was simulated for 50 ns, for a total simulation time of 3.6 μs. The number of exchange attempts between replica pairs was 50,000, and temperature exchanges between replicas were attempted with a frequency of 1 ps 1 . We achieved a very uniform rate of exchanges among replicas of 0.33%.
Following the recent extensive comparison between different conformer generation tools [41], we selected three methods having the option of generating a fixed user-specified number of conformers: frog2 [64], openbabel [65] and rdkit [66]. More precisely,
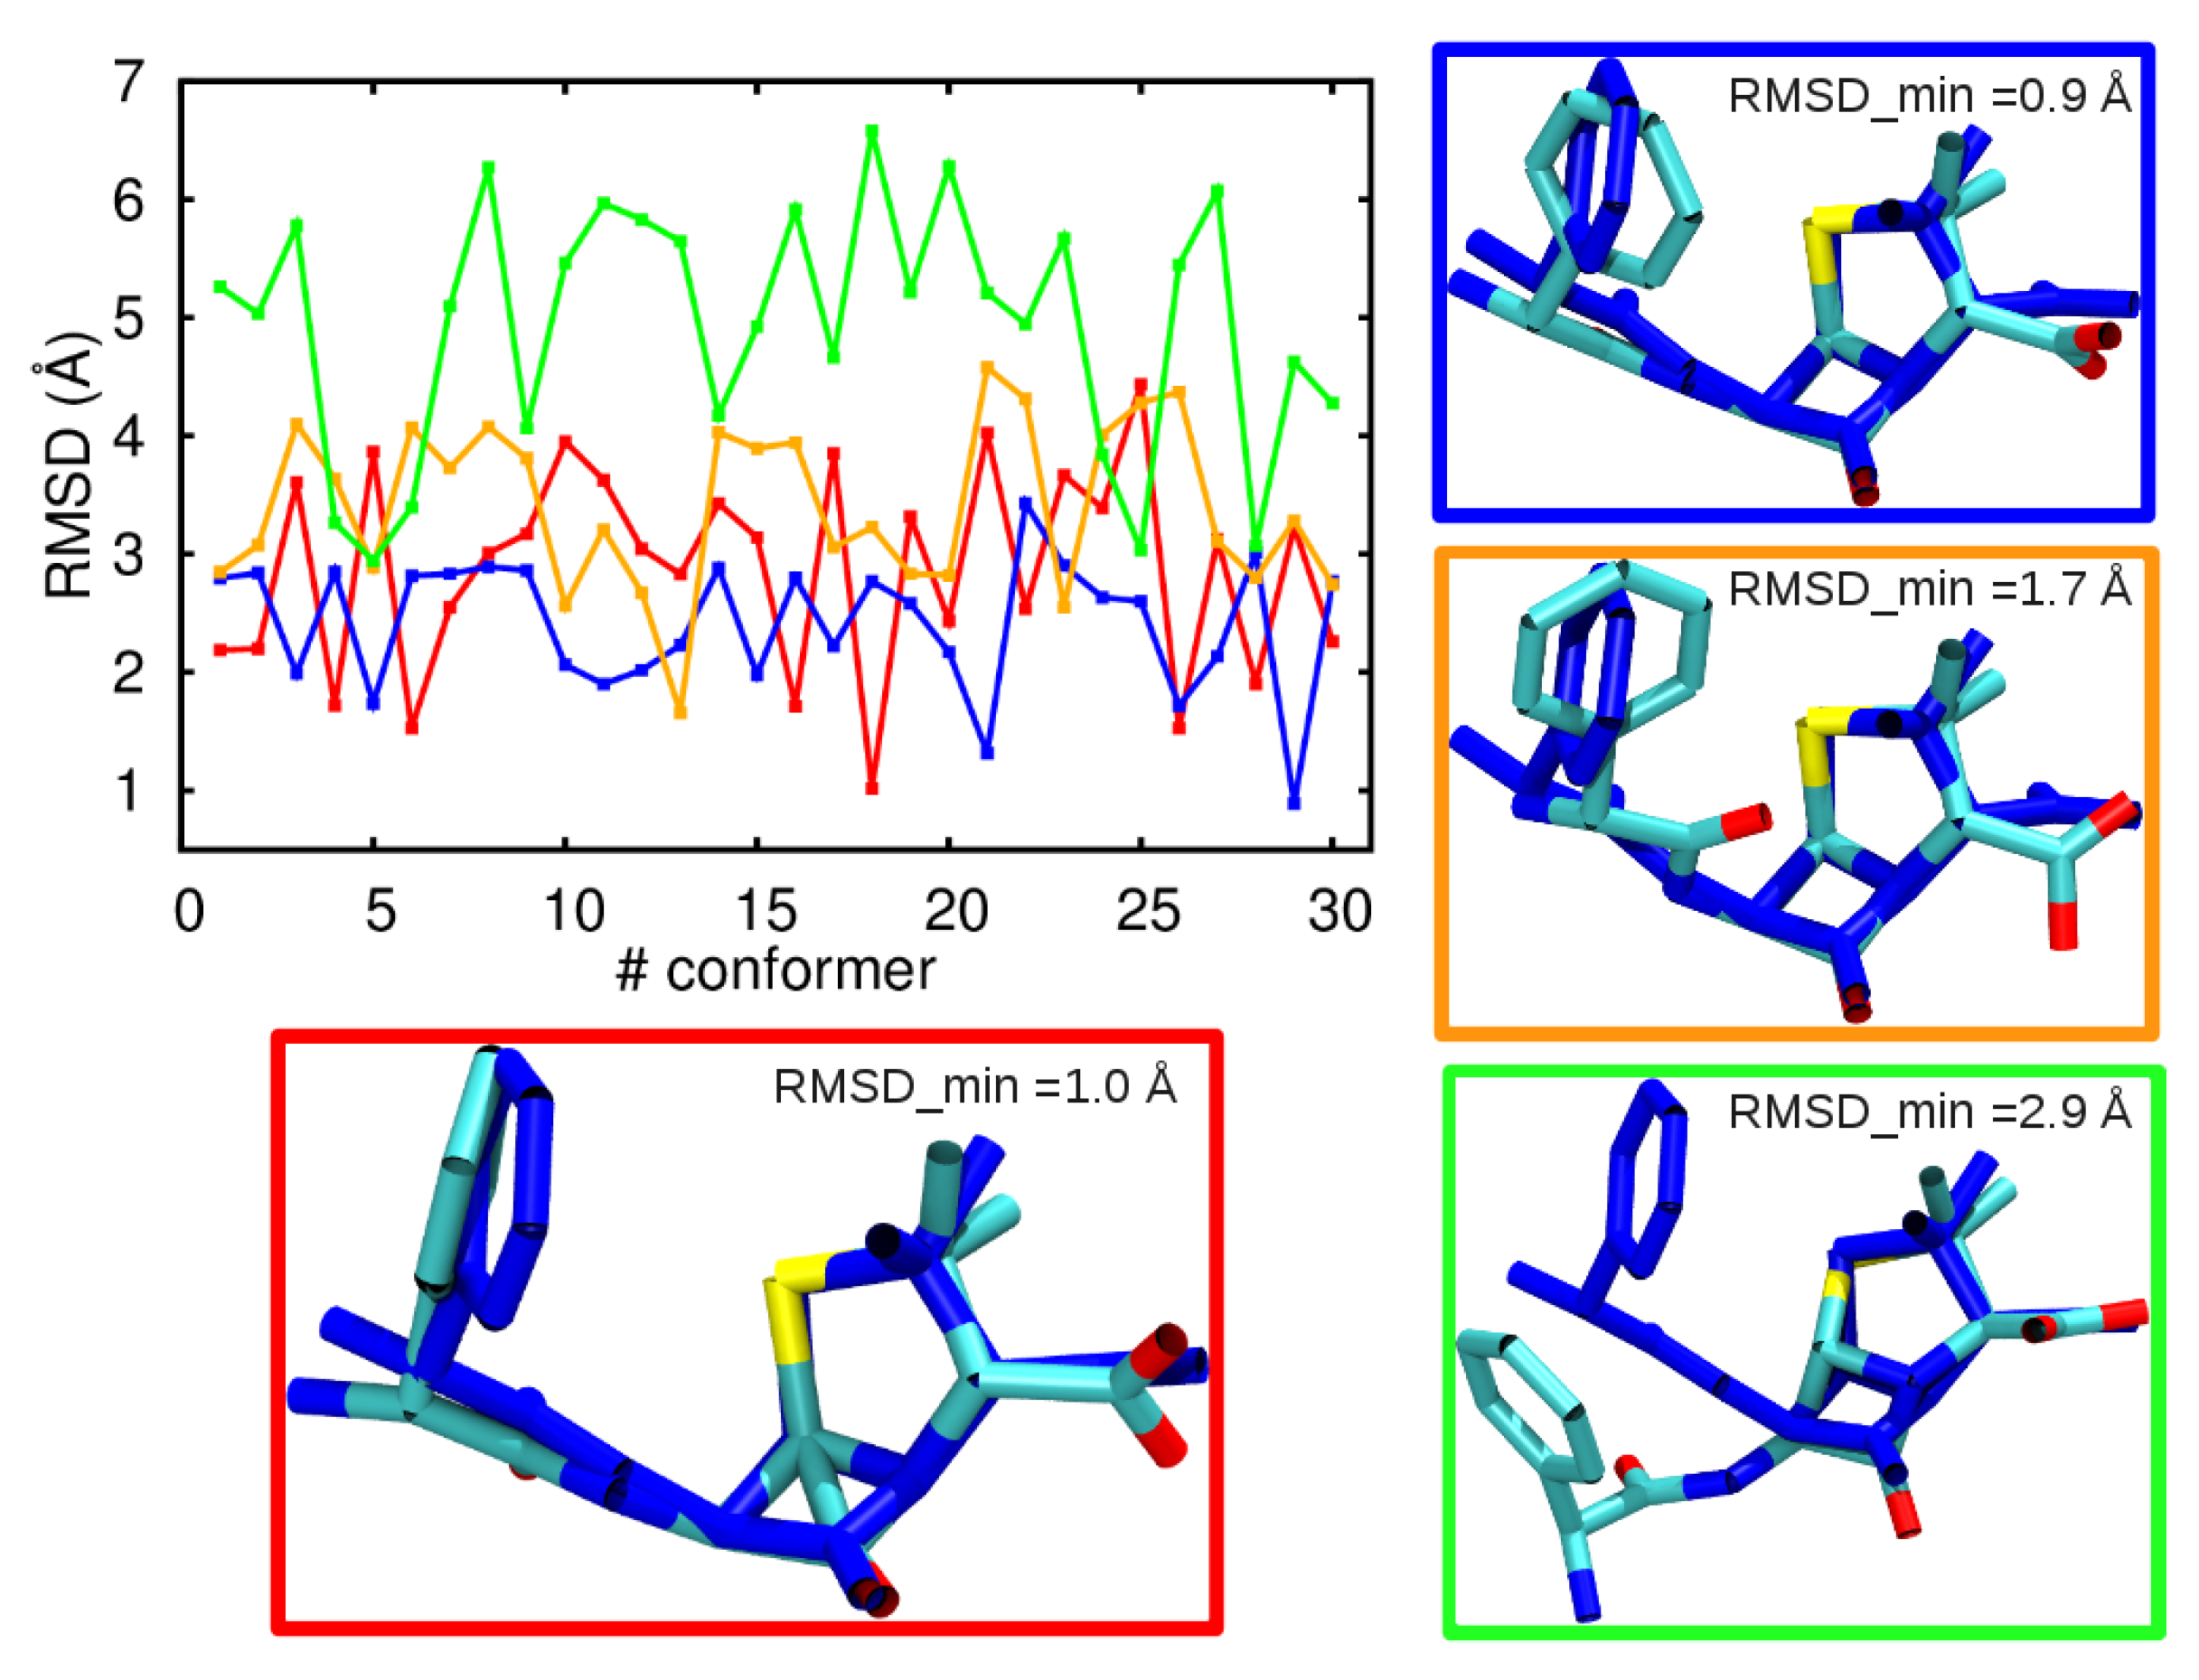
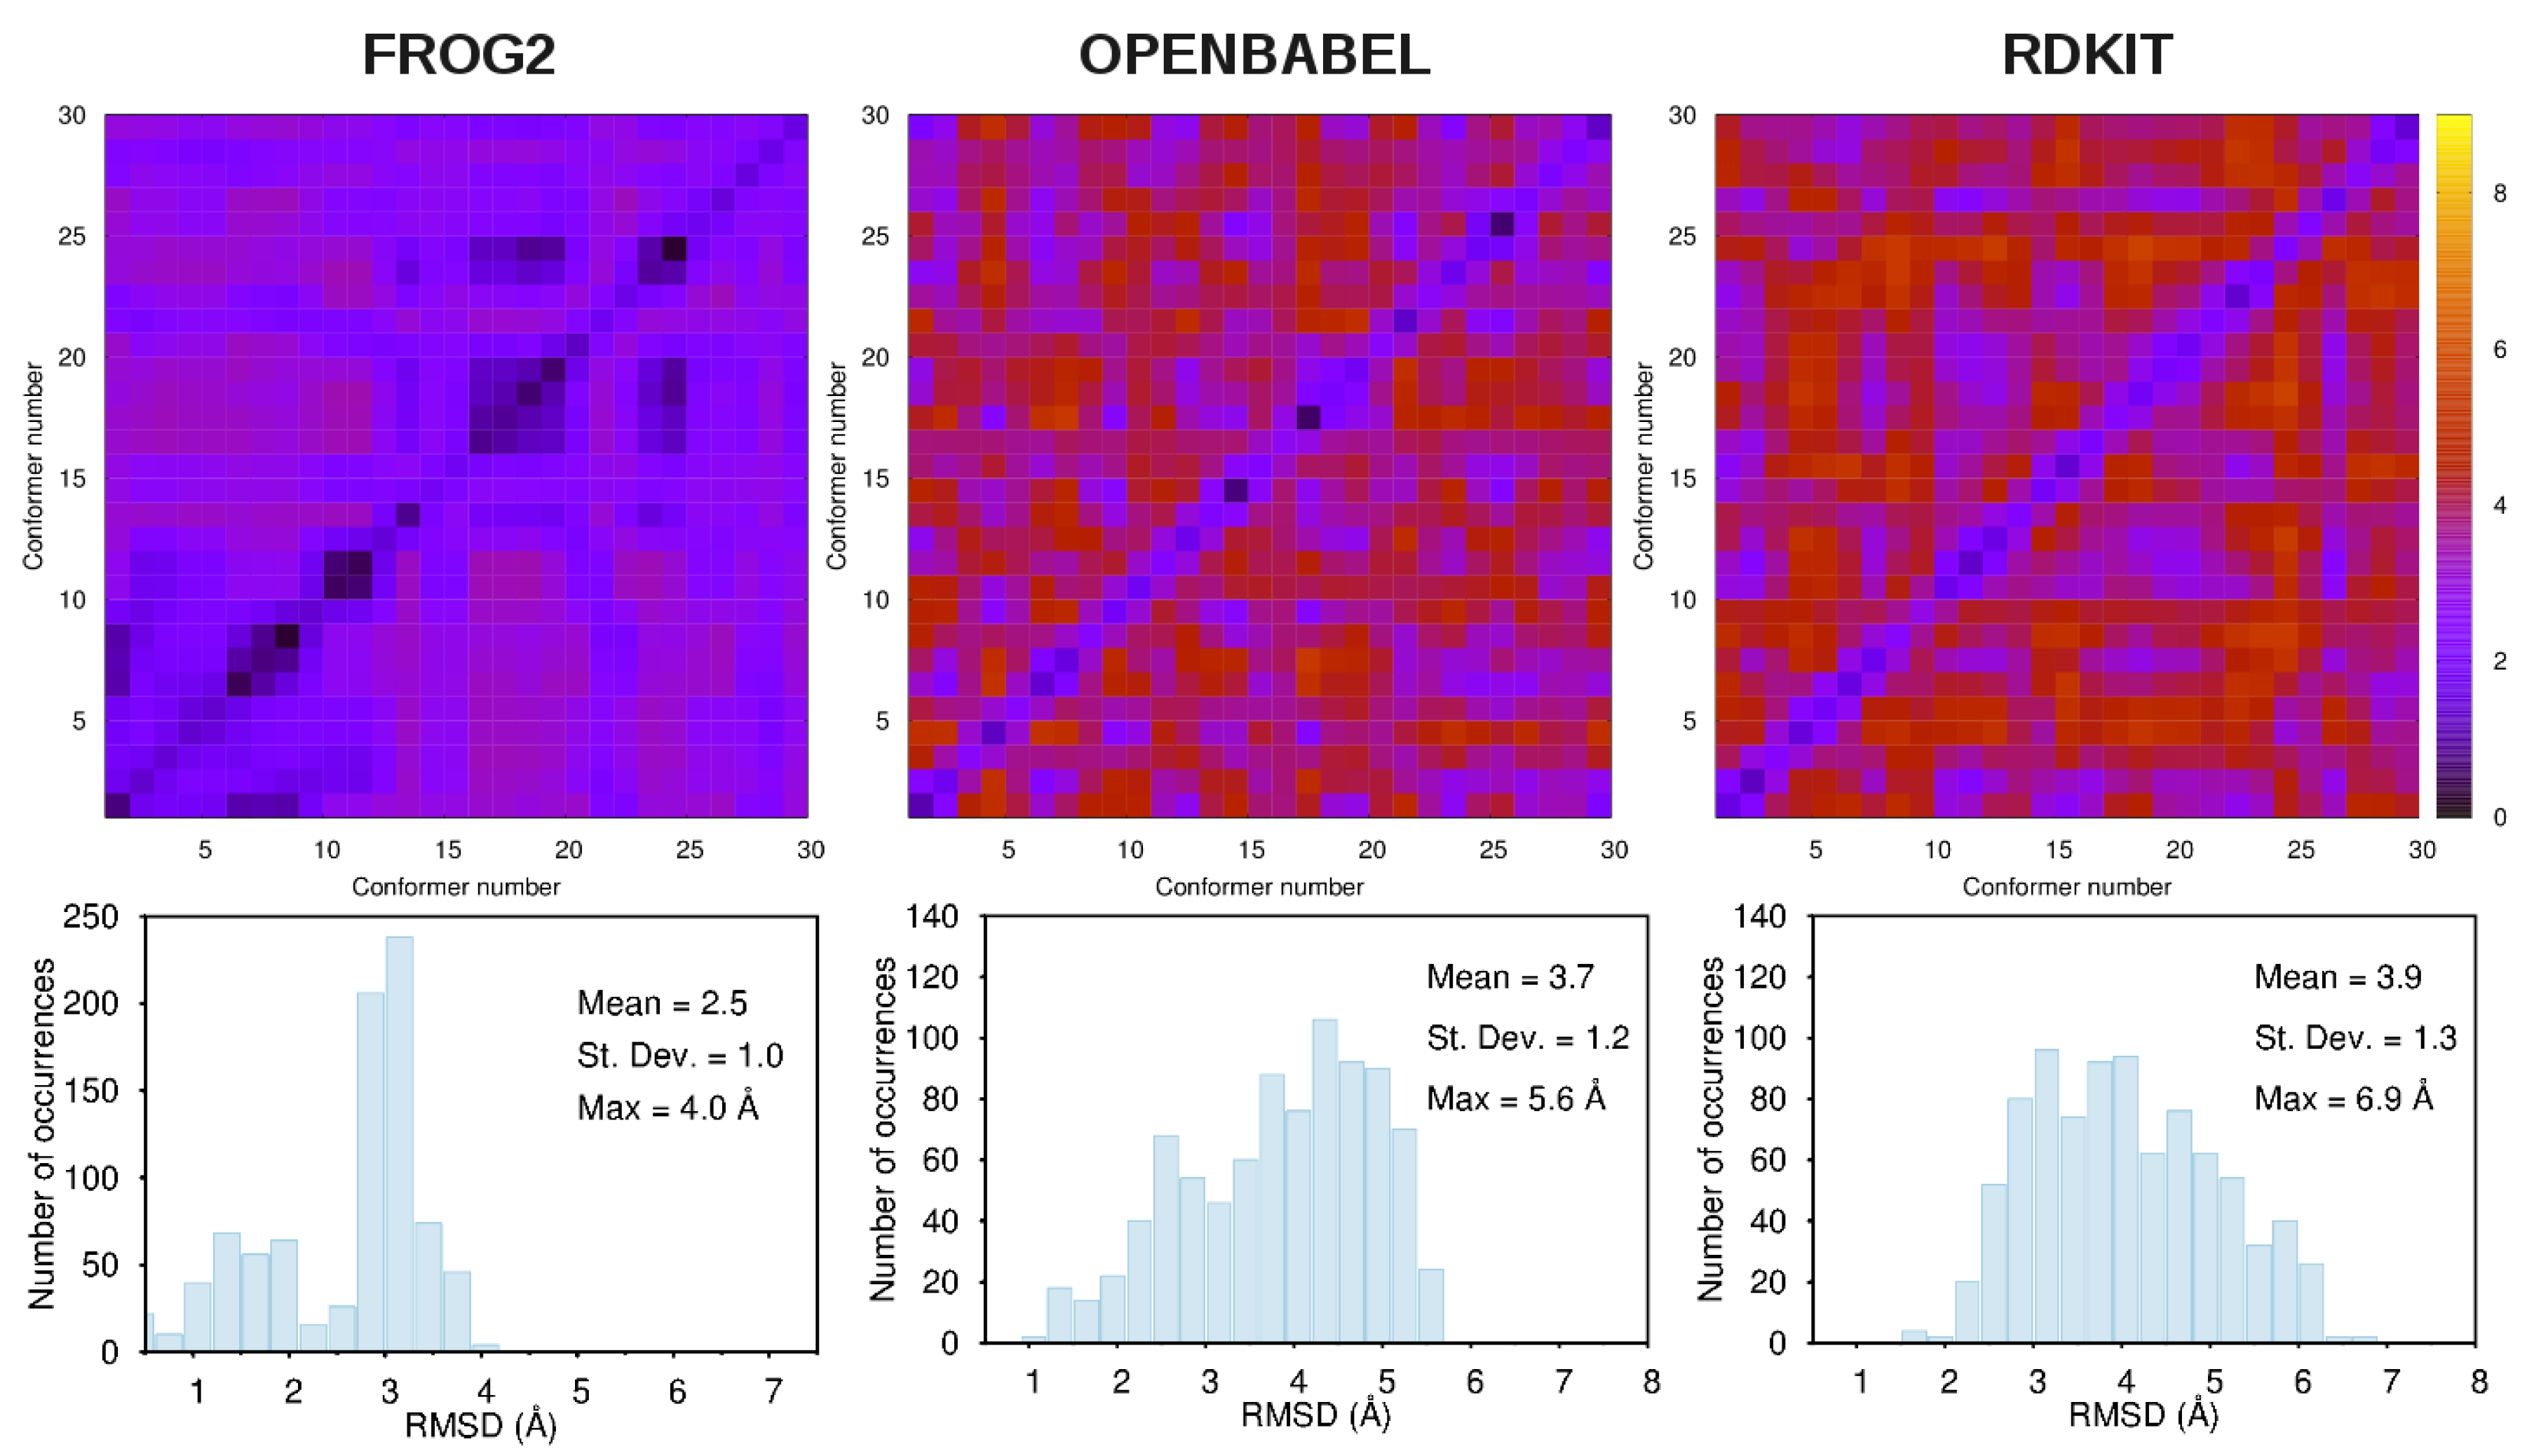
  • frog2: We loaded the 3D structure data file CID_6249.sdf taken from PubChem [43] in the web portal and adopted default settings. The server returned an ensemble of diverse conformers generated using a two-stage Monte-Carlo approach in the dihedral space.
  • openbabel: We used the same structure CID_6249.sdf as an input to the genetic algorithm code implemented in the program. This is a stochastic conformer generator producing a population of conformers that arrive iteratively at an optimal solution in terms of root-mean-squared diversity (we used a cutoff of 2.0 Å), after a series of generations.
  • rdkit: We used the python script provided in the user manual by loading the CID_6249 structure in .mol2format. The script generates the desired number of conformers and, for each of them, performs energy minimizations with the Universal Force Field [67].
For the purpose of comparing the features of the conformational ensemble extracted from our MD simulations (plain and replica-exchange) to the structures generated by conformer generators (vide infra), we performed a symmetric root mean square displacement-based cluster analysis using the hierarchical agglomerative algorithm [68] with a fixed number (30) of representatives. All figures have been produced by using PyMOL [69], VMD [70] and gnuplot [71] graphics programs.

3. Results and Discussion

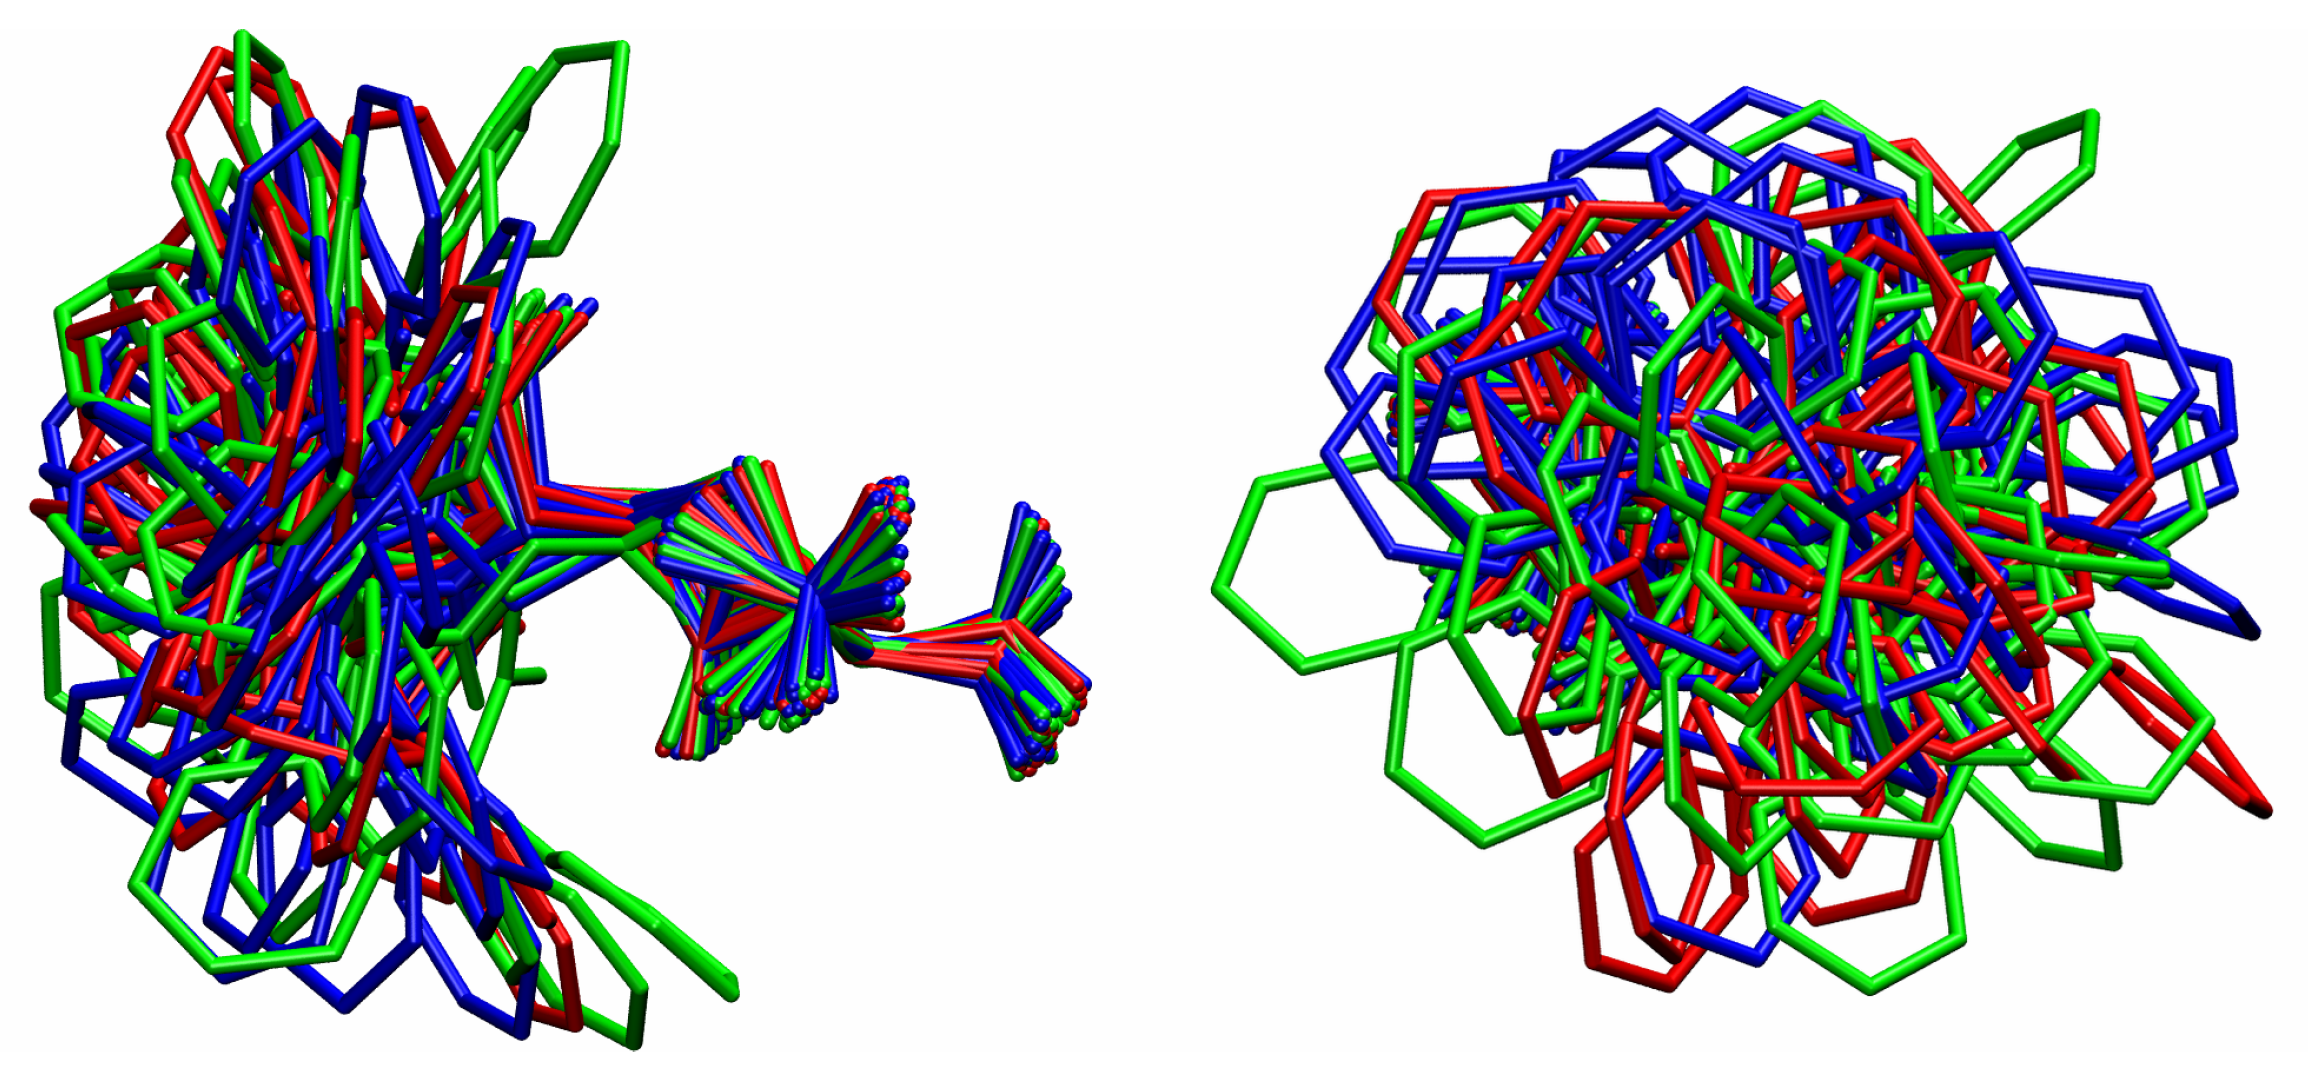
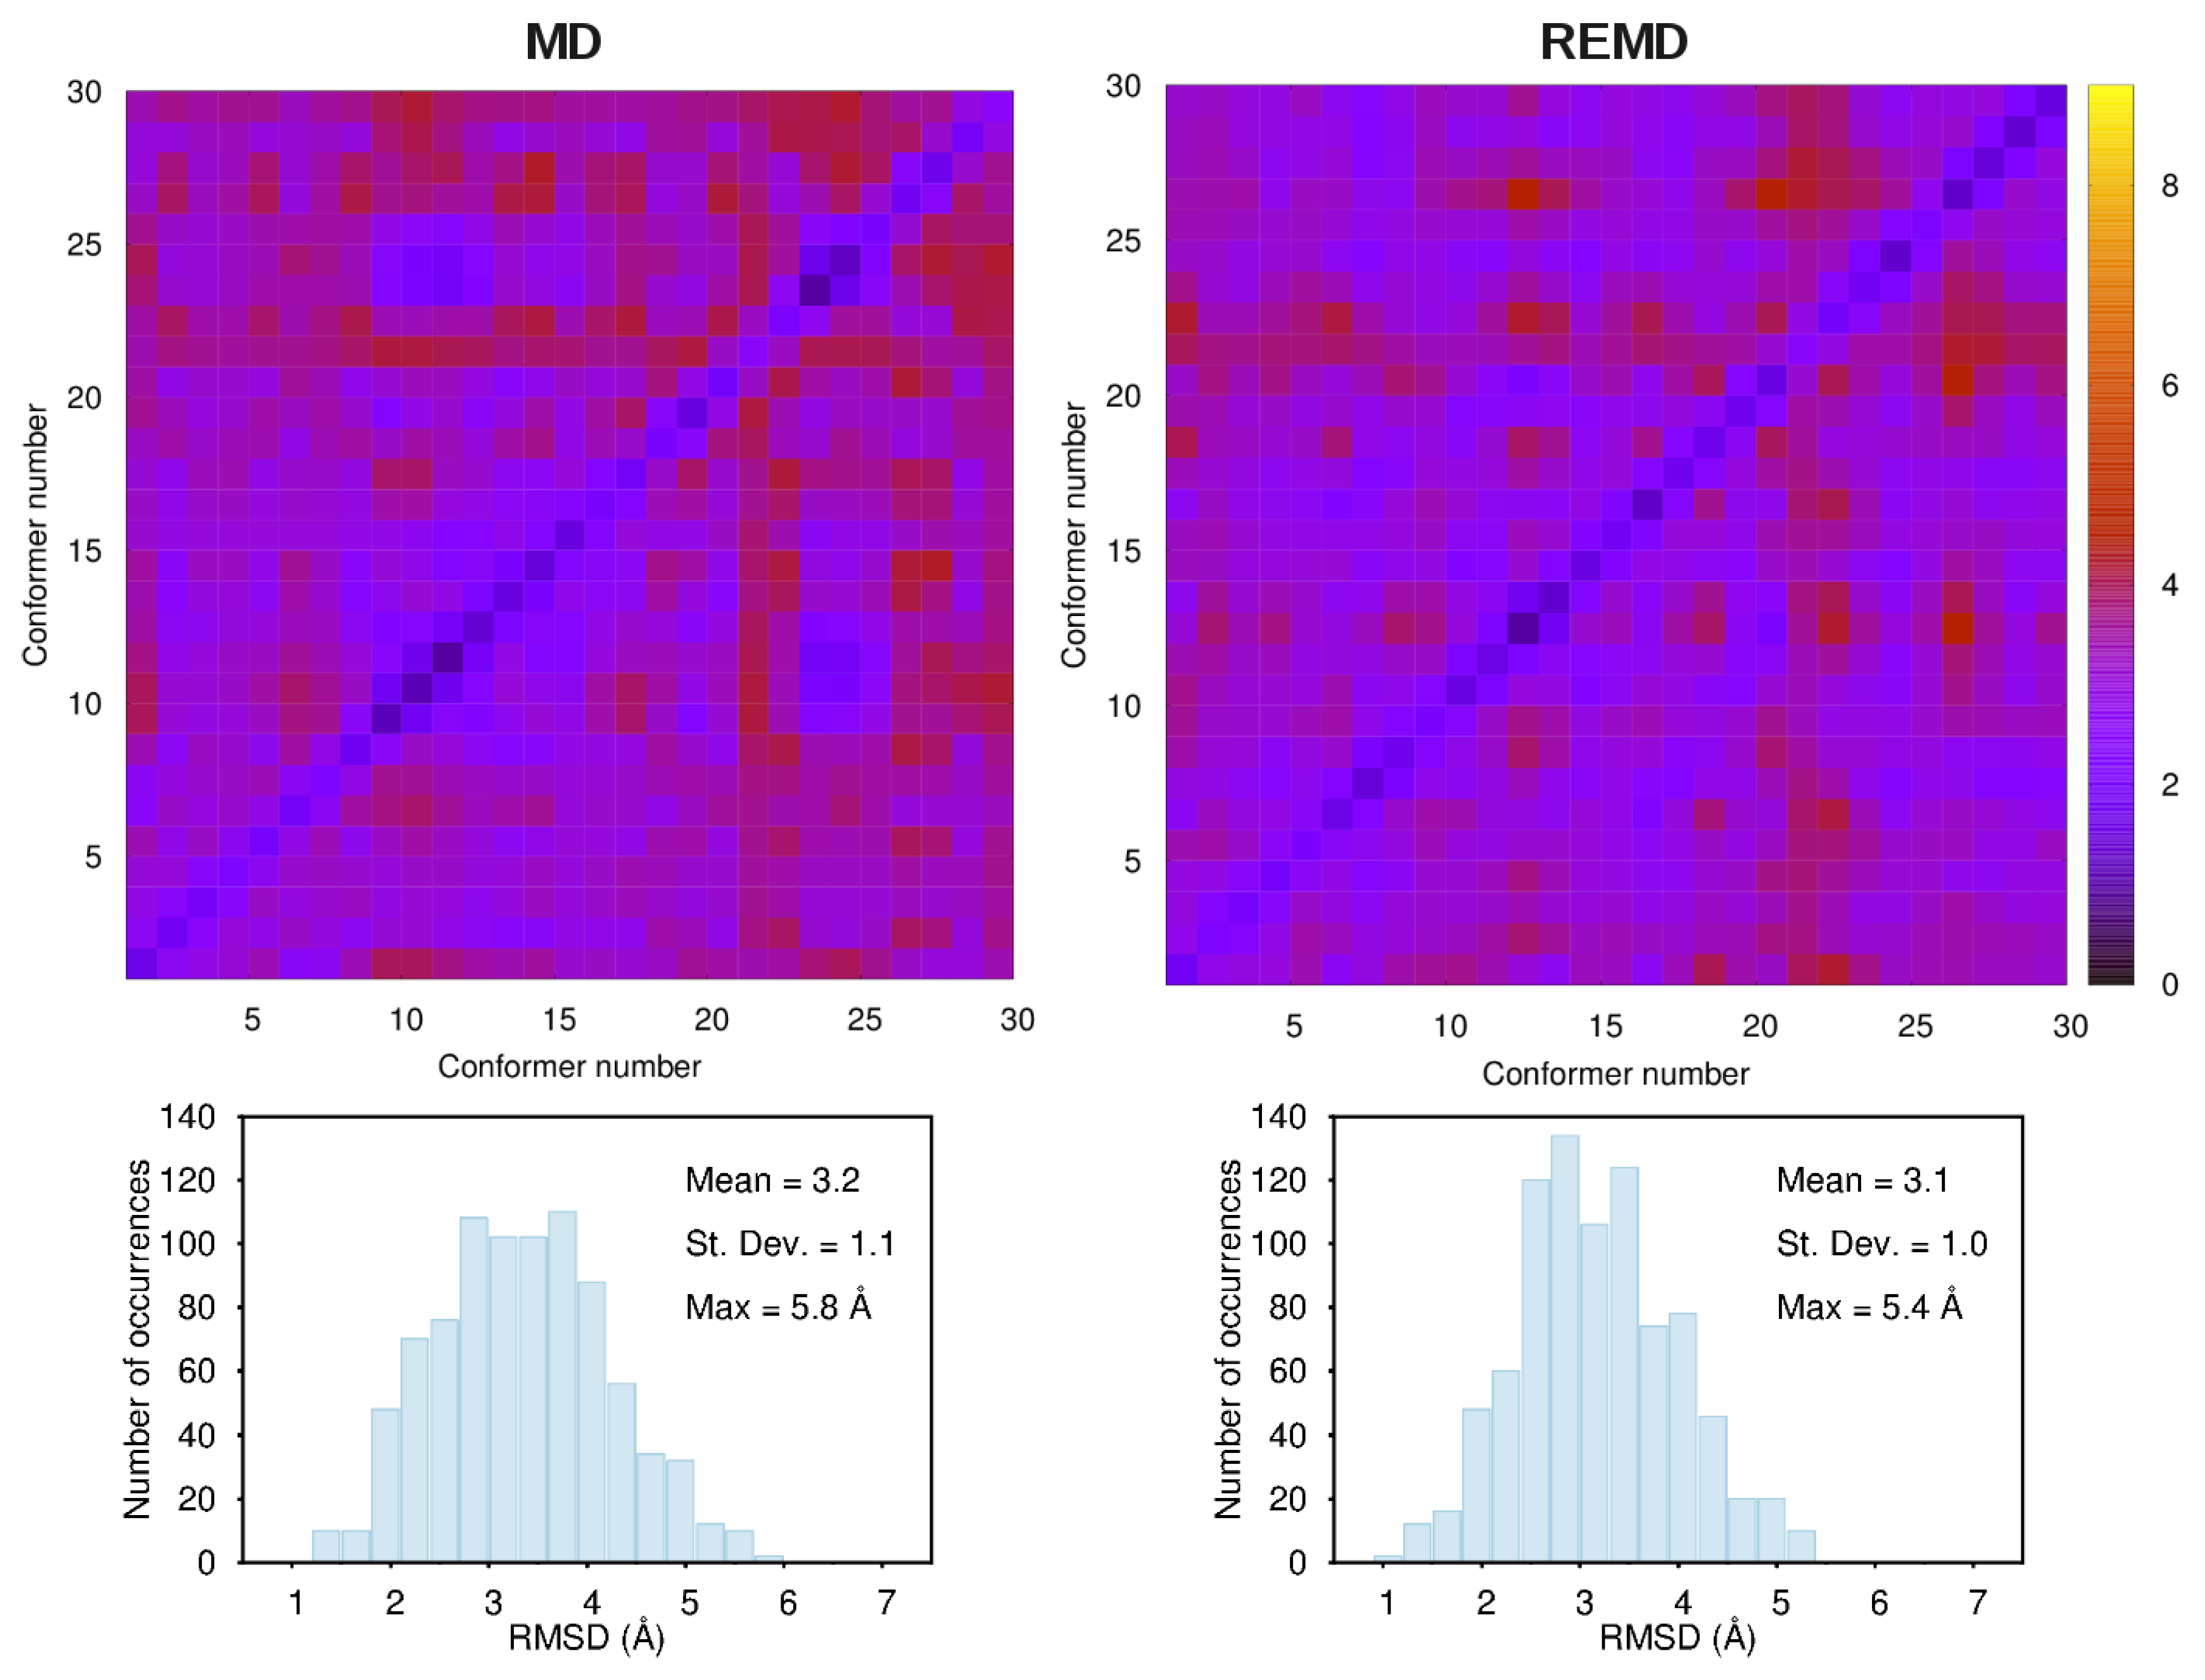
3.1. Comparison among Different Conformational Ensembles

We first assessed the ability of MD simulations: (i) to generate high-diversity conformational ensembles; and (ii) to reproduce the experimentally-available structure of zwitterionic AMP, the one in the co-crystal with OmpF, one of the main general diffusion porins of Escherichia coli [72]. First, we compared the structural clusters representatives of the whole μs-long trajectory with those obtained from a 50 ns-long REMD simulation with 72 replicas in the temperature range 275–600 K. Figure 2 compares the pair-wise root mean square displacement (RMSD) matrix for 30 configurations (all generated vs. all generated) extracted with the two simulations; the picture reports also the corresponding histogram distributions, whose maximum values (mean ± SD) are found to be 5.8 Å (3.2 ± 1.1) and 5.4 Å (3.1 ± 1.0), respectively. As demonstrated by these numbers and clearly seen from a visual inspection of Figure 2, the conformational statistics extracted from the plain μs-long MD simulation at T = 310 K is consistent with the 50 ns-long REMD simulations spanning 72 temperatures in the range 275–600 K. Note that we arrive at the same conclusion by comparing the pair-wise RMSD matrix for 50 and 100 conformers generated with both plain MD and REMD simulations.
As an additional test, we compared the variability of the conformational ensemble extracted from the plain μs-long MD simulation with that obtained using some freely-available conformer generation tools widely used in protein-ligand docking and, more in general, in computer-aided drug-design studies. Following the recent extensive comparison between different conformer generation tools [41], we selected frog2 [64], openbabel [65] and rdkit [66]. Similar to Figure 2, Figure 3 displays the pair-wise RMSD matrices and the corresponding histogram distributions for 30 AMP configurations generated with the three methods. While the RMSDs between the frog2 conformations appear to follow a bi-modal distribution peaking at ∼1.5 and ∼3.0 Å, openbabel and rdkit values follow unimodal distributions centered at 3.7 ± 1.2 and 3.9 ± 1.3 Å, respectively. By comparing Figure 2 and Figure 3, it is clear that our data for AMP, in terms of the diversity of the generated conformers: (i) appear to perform better than frog2; (ii) are of similar quality as those of openbabel; and (iii) cover a smaller conformational space with respect to rdkit. Again, please note that similar conclusions can be draw by repeating the same comparison for 50 and 100 conformers generated with the three methods.
In order to quantify the ability to generate conformers that are structurally similar to the experimentally-determined structure of AMP [72], we compared the RMSD between the experimental configuration and each of the 30 conformers extracted from our plain MD simulation or generated with the different conformer generator tools considered. The resulting comparison is reported in Figure 4. We found that rdkit yields structures differing, on average, by about 4–5 Å in terms of RMSD from the experimental structure. By looking in detail at the generated structures, we found that 17 over 30 conformers generated with rdkit present a flipped conformation with respect to the experimental structure. In particular, the dihedral angle between the planes of the four-membered β-lactam ring and the five-membered ring is found to be ∼240°, while the experimental value is about ∼120°. This can be seen in the green box of Figure 4 and partly explains the larger scatter observed on average in the case of rdkit. On the contrary, frog2, openbabel and our own MD results appear to oscillate around a lower mean value of about 3.0 Å, and interestingly, one of the clusters in these three ensembles is found to be very close to the experimental structure with a minimum RMSD of 0.9 Å, 1.7 Å, and 1.0 Å, respectively. For the four cases considered, the visual comparison between the lowest RMSD structure and the experimental one is reported in the same Figure 4.
Figure 2. Pair-wise RMSD matrix for 30 conformers extracted from a plain μs-long MD simulation (left) and a 50 ns-long REMD simulation with 72 replicas in the range 275–600 K (right; see Section 2). The color scale reflects the RMSD values expressed in Å, as shown in the right box. For each case, the bottom panel shows the corresponding histogram distribution.
Computation 04 00005 g002
Figure 3. Same as Figure 2 for 30 AMP conformers generated using three different conformer generation tools: frog2 (left), openbabel (center) and rdkit (right).
Computation 04 00005 g003
Figure 4. RMSD between the experimental configuration of AMP [72] and each of the 30 conformers extracted from a μs-long MD simulation (red) or generated with frog2 (blue), openbabel (orange), and rdkit (green). The boxes, with the same color-codes, show the comparison between the lowest-RMSD structure and the experimental one (blue).
Computation 04 00005 g004
In summary, the results presented in Figure 2, Figure 3 and Figure 4 for the specific system investigated here show that: (i) the conformational statistics extracted from plain MD simulations is consistent with that obtained from REMD simulations and comparable to those generated by the conformer generator tools considered; (ii) our MD-based approach performs slightly better than any of the conformer generator tools if one takes into account both the diversity of the generated conformational set and the ability to reproduce experimentally-determined structures. Clearly, we are aware that the μs-long MD simulations are not computationally inexpensive, even for small compounds. However, the main reason why we performed here 1 μs-long MD simulations is the consistency with our previous work concerning the creation of an online database of antimicrobial compounds differing in size and flexibility [27]. Thus, such long simulations could not be needed in all cases, at least for compounds with a limited number of rotatable bonds. To show that this is the case for AMP, we addressed the convergence of the conformational diversity and of a few molecular properties as a function of the total simulation time. As shown in Appendix B, for the specific case of AMP, we could have reduced the computational cost grossly by one order of magnitude.

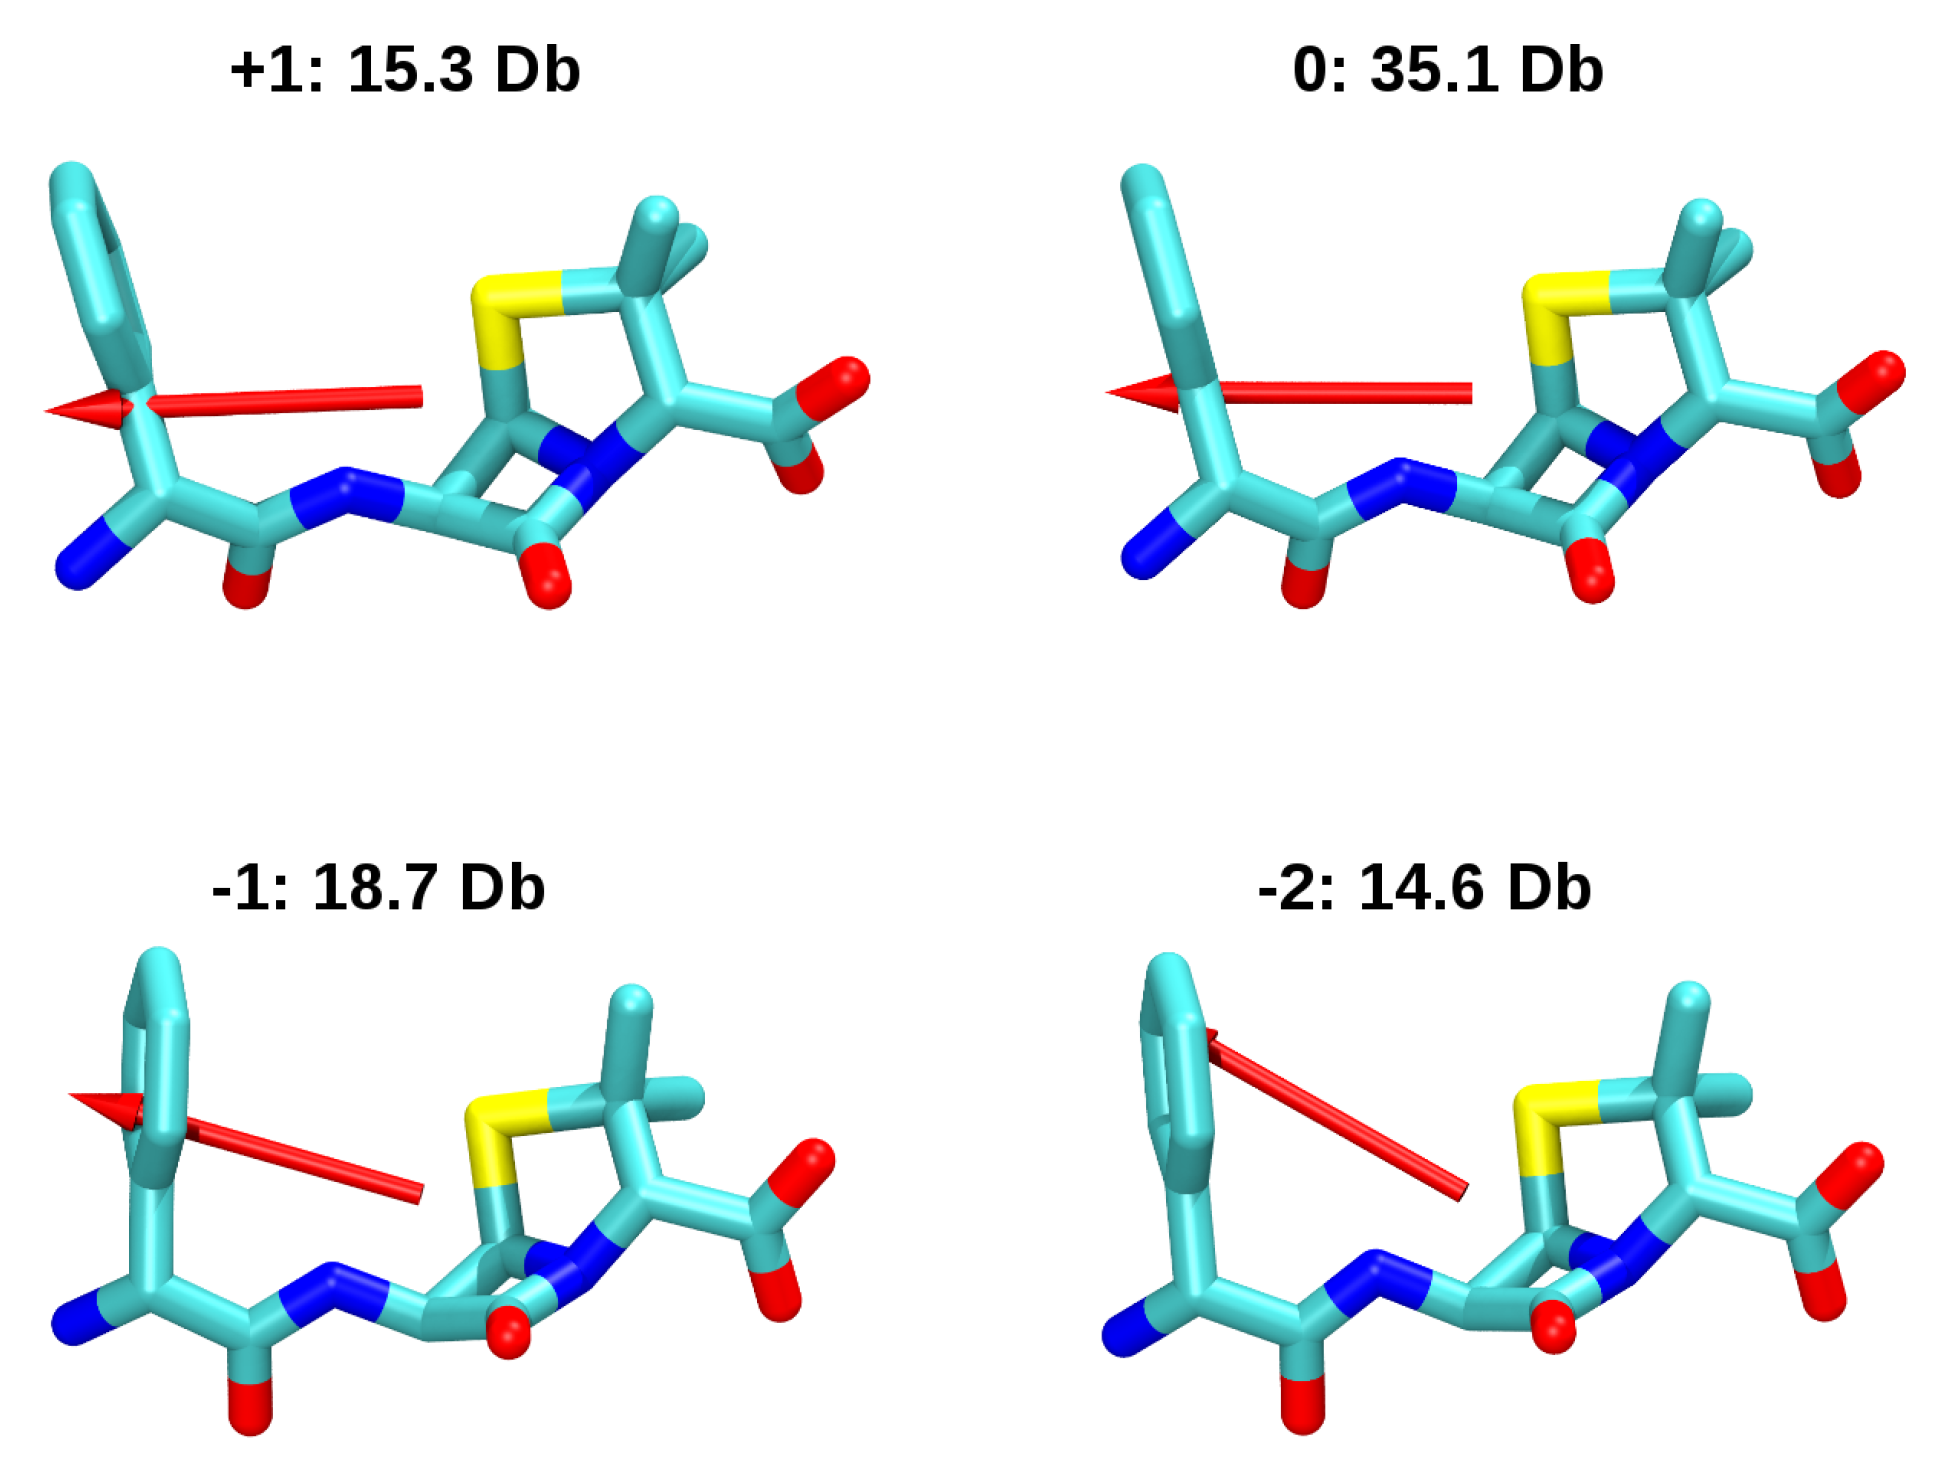
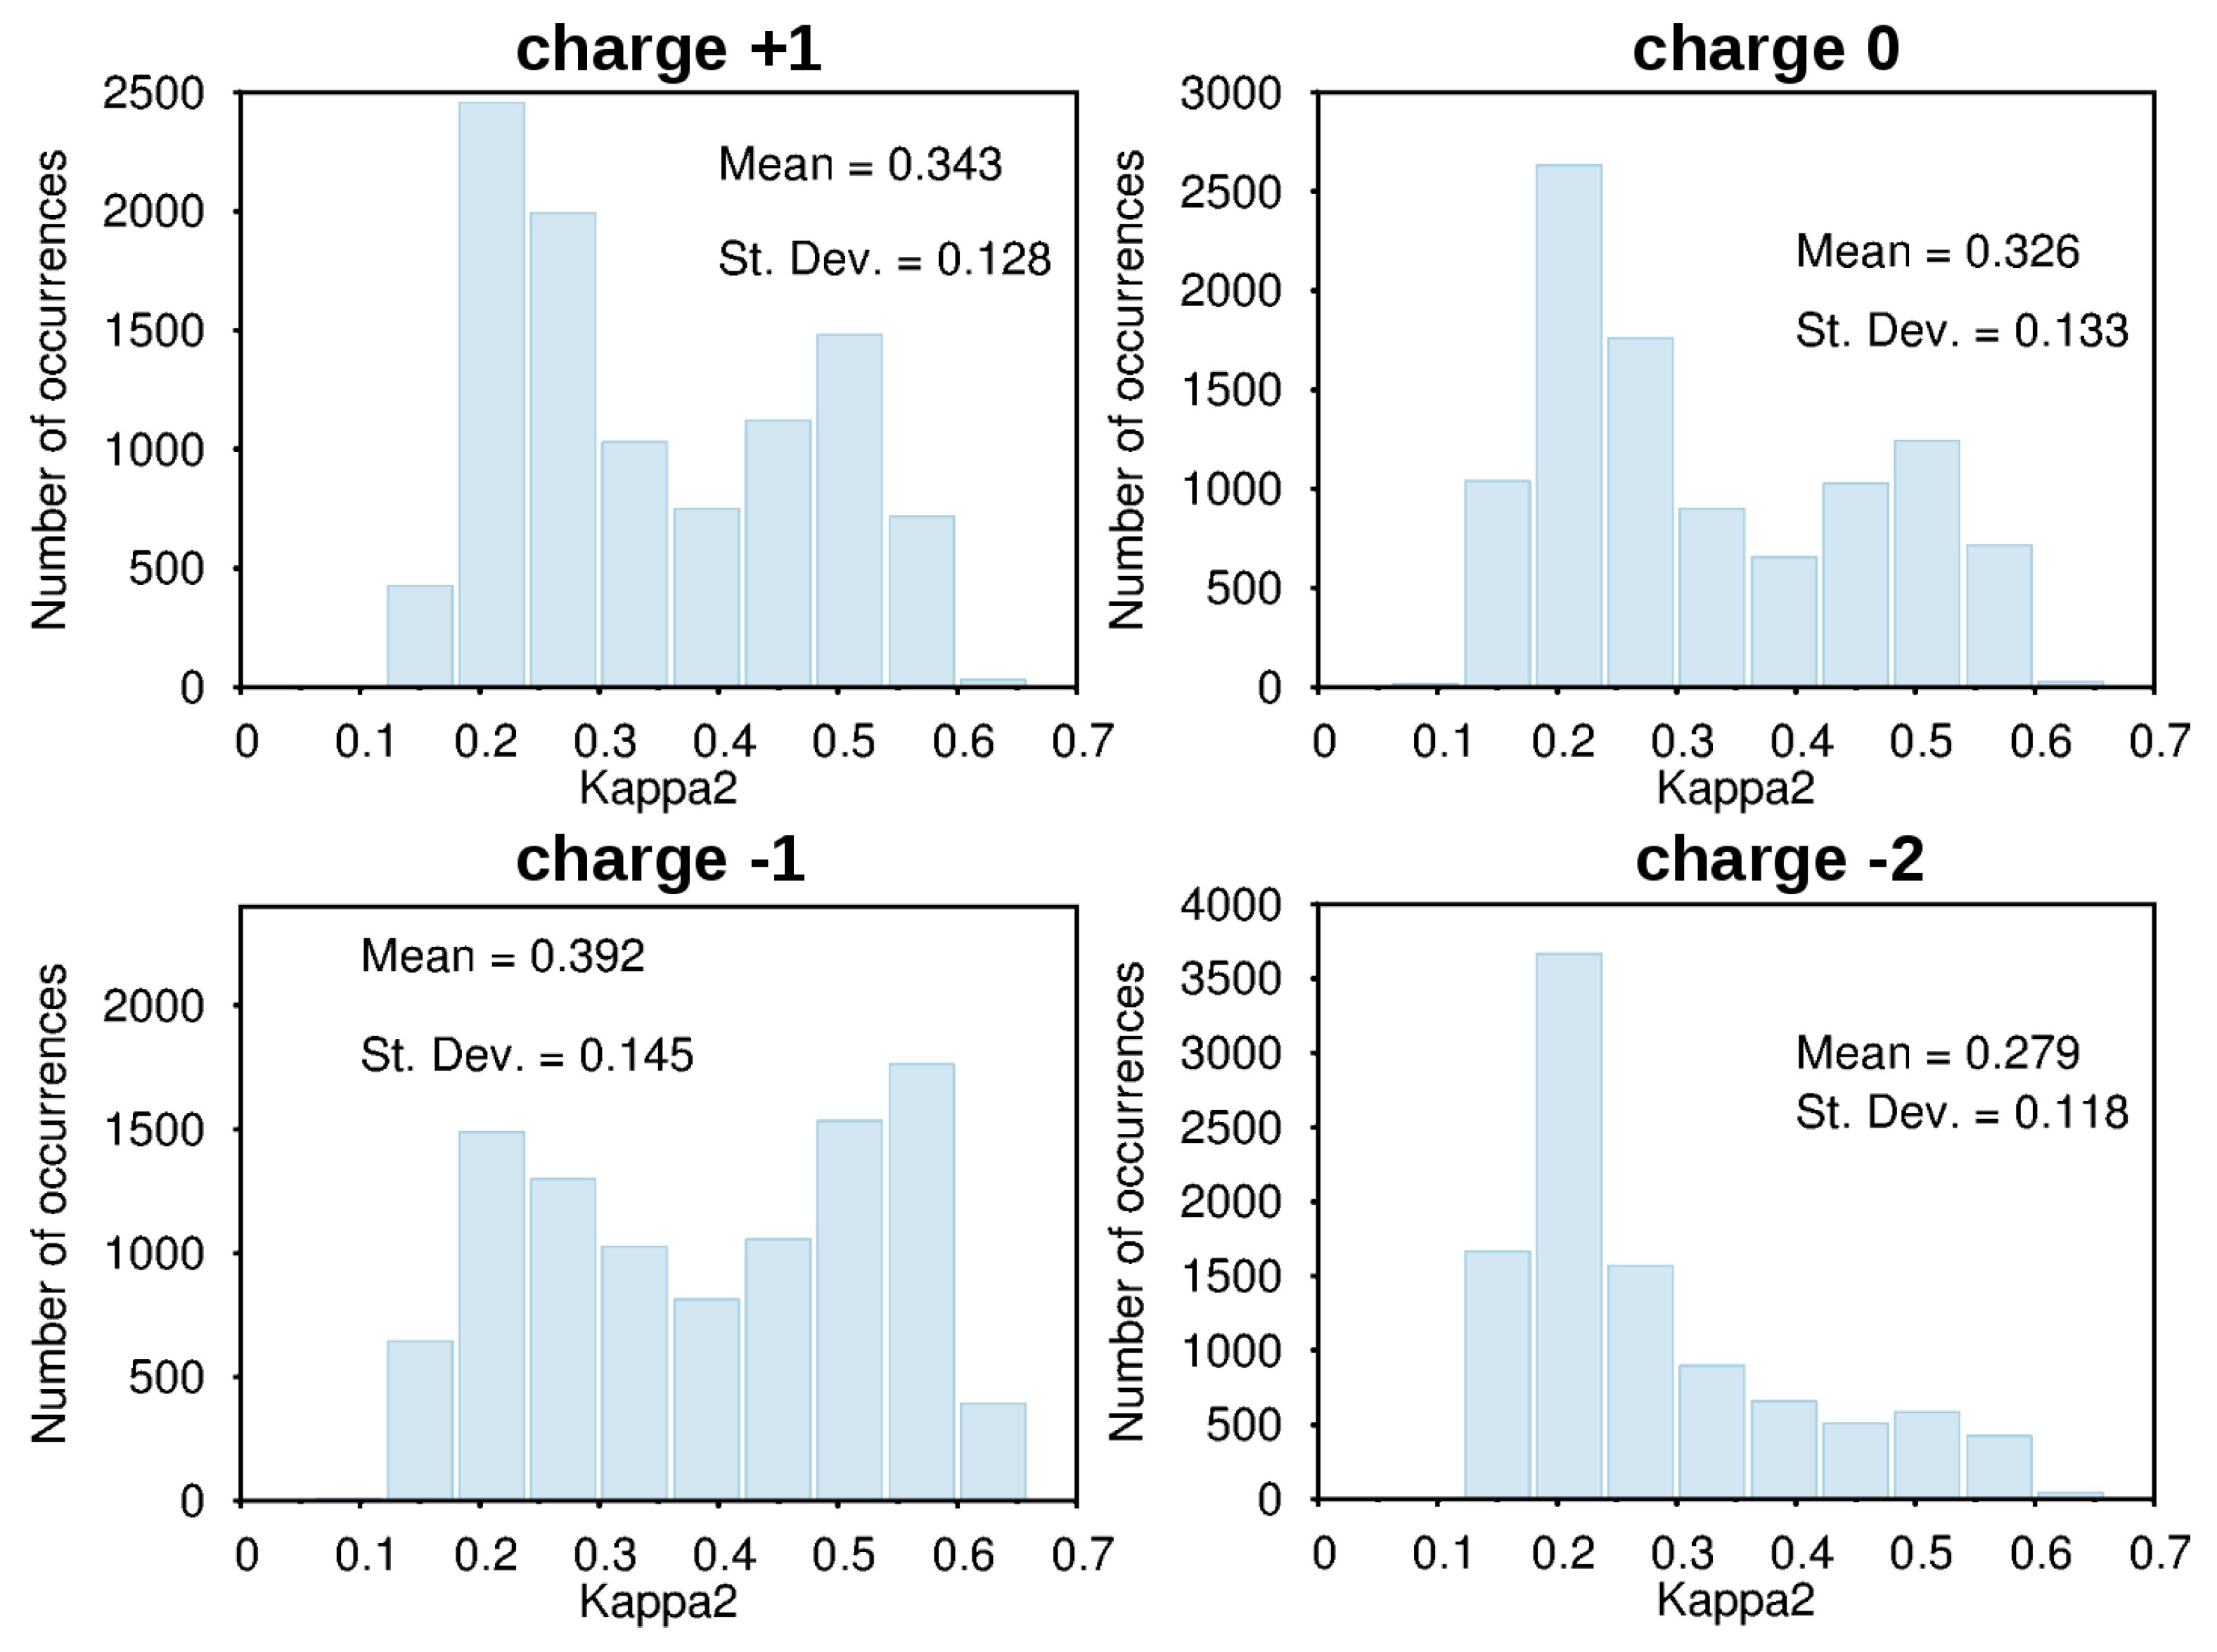
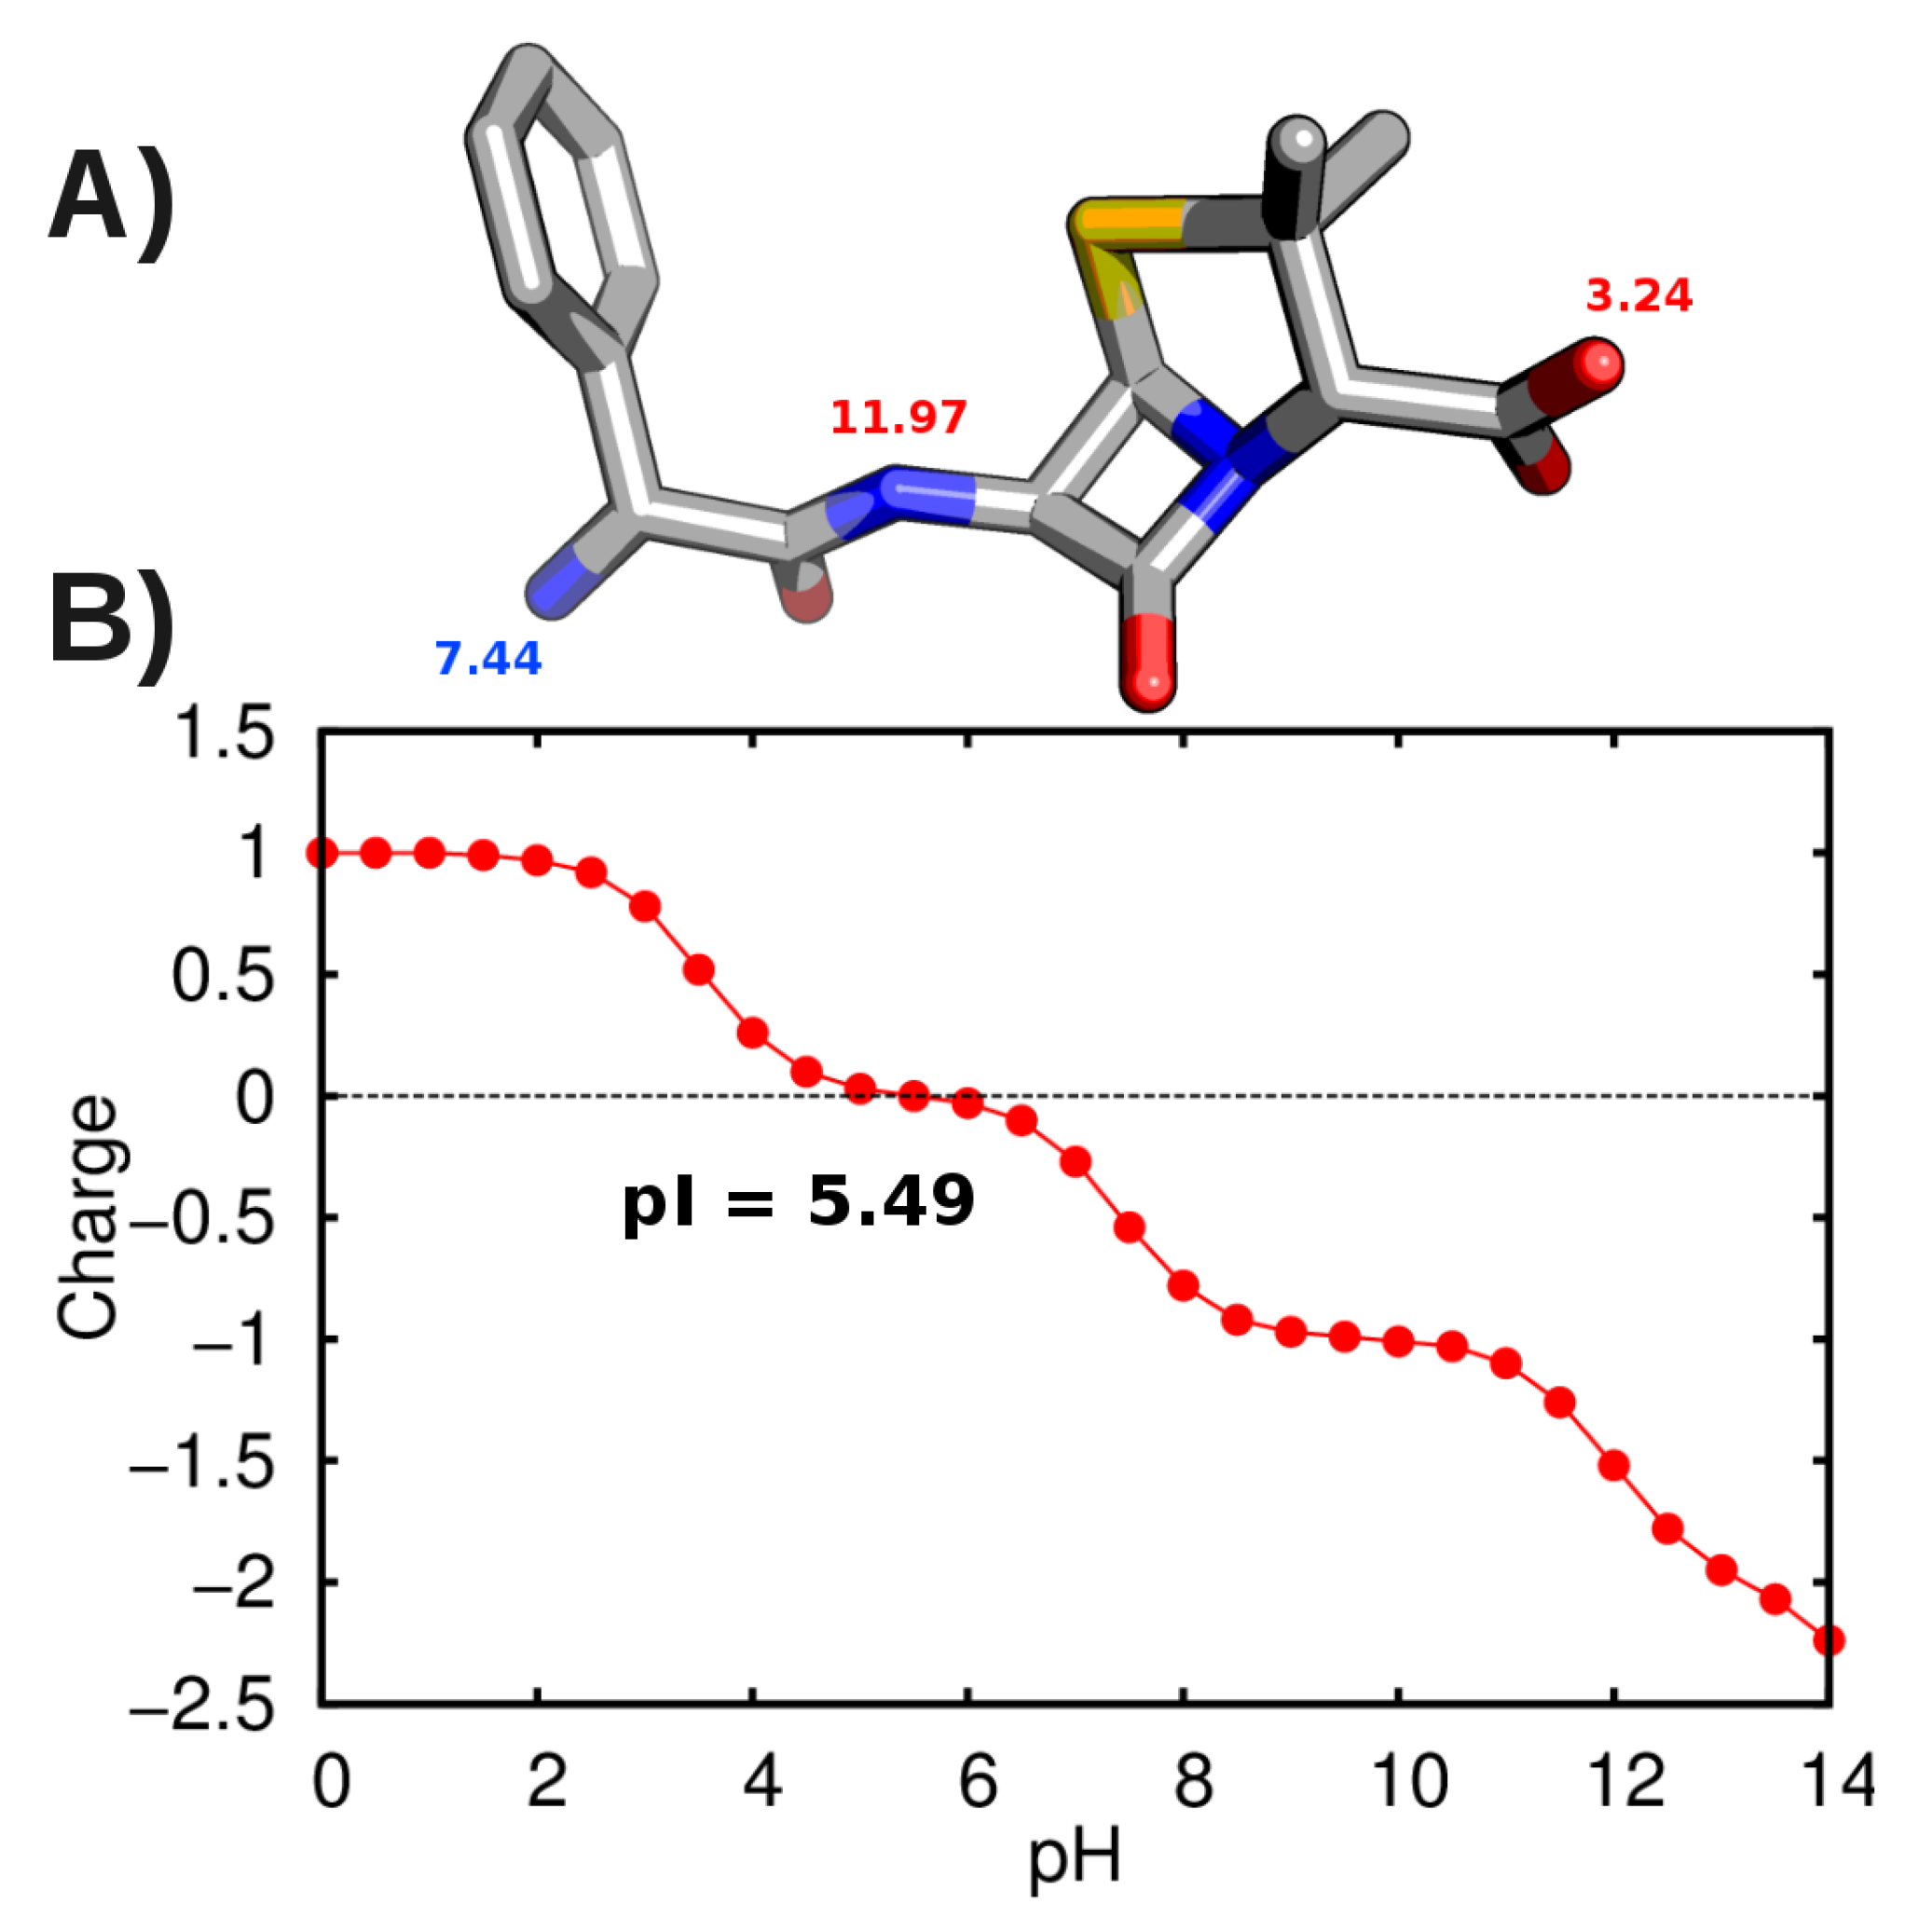
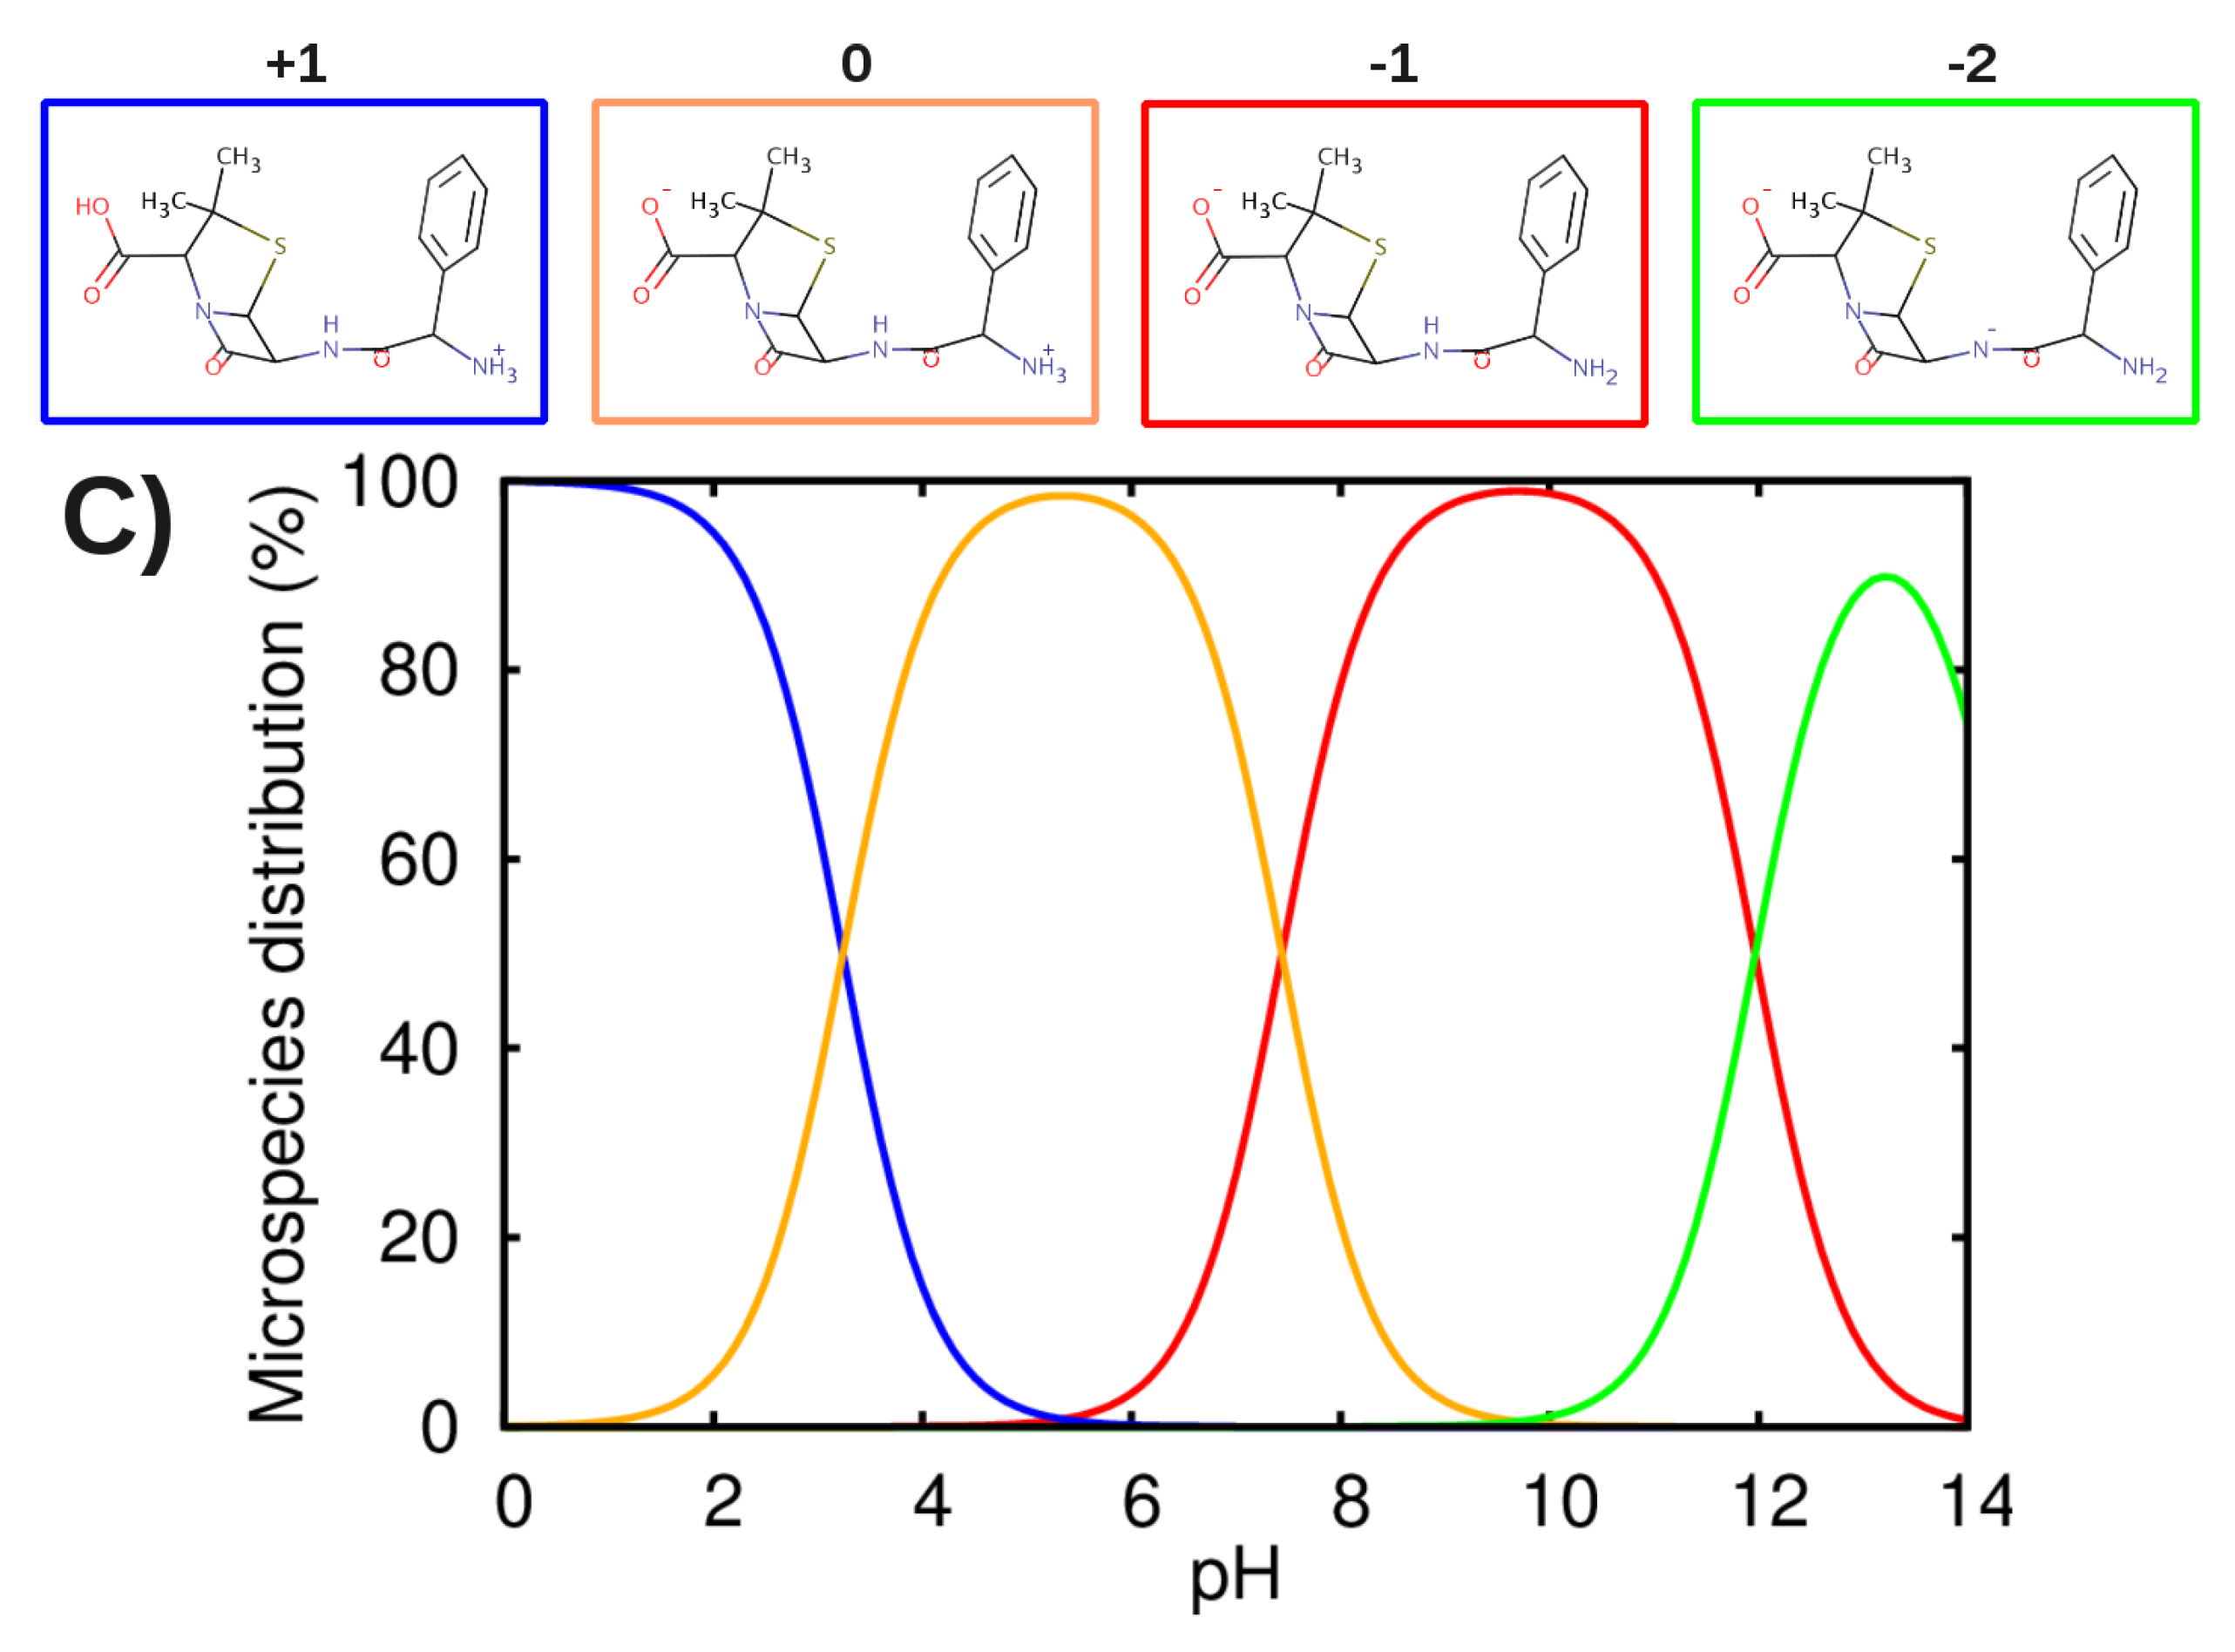
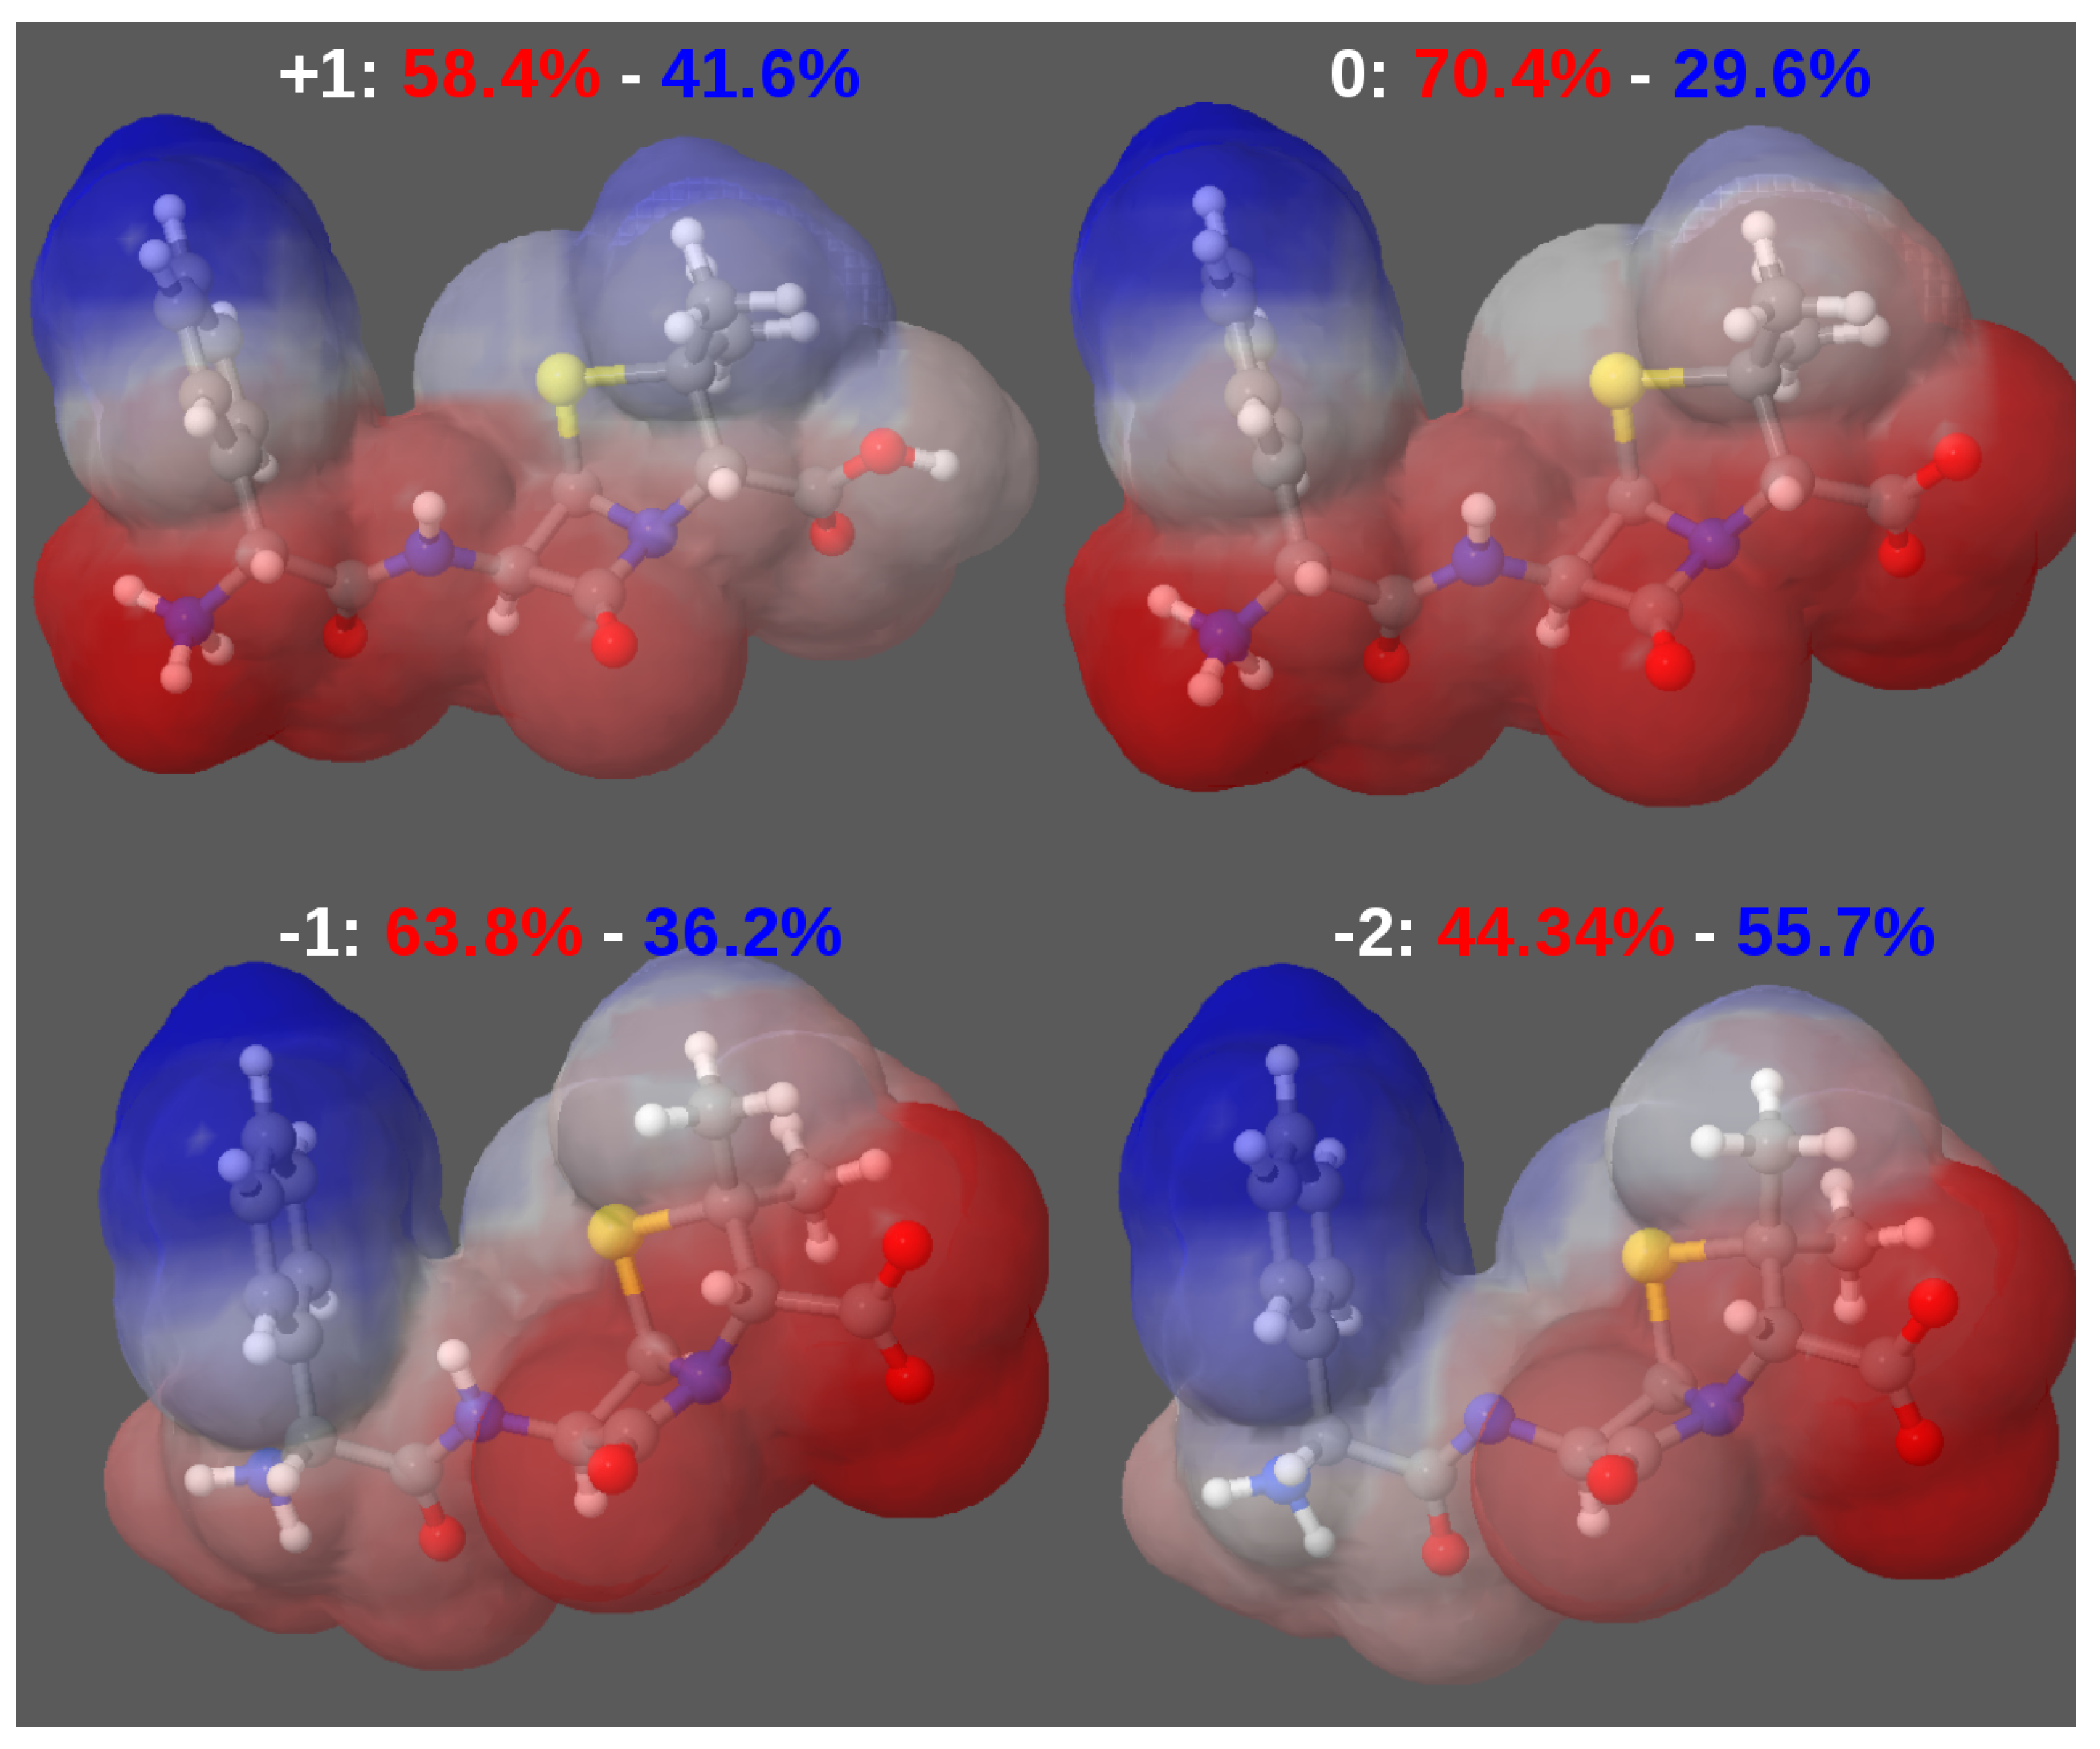
3.2. Force-Field Parameters and Molecular Properties of Different Microspecies

As shown in Figure 5A, in the pH range 2–14 considered in this work, AMP has two proton-donating atoms, one oxygen of the external carboxylic group (pKa = 3.24) and one internal nitrogen (pKa = 11.97), and one proton accepting atom, namely the nitrogen atom (pKa = 7.44) opposite the β-lactam group. As a result, the molecule can exist in four different charge/protonation states, as shown in the pH-dependent net charge distribution (Figure 5B) and the fractional microspecies distribution (Figure 2C): cationic at pH ≤ 3.0, zwitterionic between ≃3.0 and ≃7.5, anionic between ≃7.5 and ≃12.0 and dianionic for pH ≥12.0. For each of the above microspecies, we followed the same general protocol adopted to build the on-line database [27], not taking into account possible chemical changes induced by pH, such as opening of the β-lactam ring [73]. In this work, we added the individual pages of each AMP microspecies displayed in Figure 5 in our online database [27].
In particular, the DFT optimized geometry (in both .xyz and .sdf formats) and the GAFF parameters files (.prep and .frcmod formats [42]) can be freely downloaded for each charge/protonation state. As previously done for the full set of compounds, we provide three sets of atomic partial charges as detailed in Section 2. The availability of the FF parameters for the major microspecies of the same compound makes it possible to perform straightforwardly MD simulations with ready-to-use input files. In the above web page, for each microspecies, separate tables report general-purpose properties and molecular descriptors derived from both DFT and MD simulations. The comparison for some of the different properties listed for the different microspecies is reported in Figure 6, Figure 7 and Figure 8, displaying polar/non-polar molecular surfaces [54], the magnitude and spatial orientation of electric dipoles and the dynamical behavior of the spherical shape anisotropy kappa2 [62], respectively.
Figure 5. AMP protonation-related properties in the pH range 2–14: (A) pKa values of the proton receiving (7.44) and proton-donating (3.24 and 11.97) atoms; (B) pH-dependent net charge distribution (isoelectric point pI = 5.49); (C) fractional distribution of each microspecies: cationic (blue), neutral (orange), anionic (red) and dianionic (green).
Computation 04 00005 g005aComputation 04 00005 g005b
Figure 6. Comparison between the polar/non-polar molecular surfaces (red-white-blue color scale) as evaluated with the PLATINUM web server [54] for the AMP microspecies considered (see Figure 5). The polar (non-polar) fractions are reported in red (blue).
Computation 04 00005 g006
Figure 7. Comparison between the electric dipoles of the AMP microspecies considered. For each charge/protonation state, we report the absolute values (expressed in debyes); to ease visual comparison, the dipole’s moduli have been arbitrarily normalized to the same quantity. Hydrogen atoms have been omitted for clarity.
Computation 04 00005 g007
Figure 8. Comparison between the relative shape anisotropy kappa2 of the four AMP microspecies considered. This quantity, related to the gyration tensor, has been monitored during the MD runs using PLUMED [62].
Computation 04 00005 g008

4. Conclusions

In this work, we presented a follow-up of our long-term project of building a multi-purpose database of force-field parameters, dynamics and molecular descriptors of compounds with antimicrobial activity. We selected a medium-sized antibiotic, ampicillin, and assessed the quality of the conformational ensemble extracted from μs-long MD simulations. For the different charge/protonation states of ampicillin in the pH range 2–14, we additionally made available the GAFF parameters, as well as some general properties and molecular descriptors derived from both DFT and MD simulations. For the specific case considered in this work, we found that the finite ensemble best reproducing the whole MD trajectory is fully consistent with REMD simulations performed with 72 replicas distributed in the range 275–600 K and comparable to those generated by some widely-used conformer generation methods. In addition, by taking into account both the diversity of the generated conformational set and ability to reproduce available experimental structures, our MD-based approach is found to perform slightly better than any of the conformer generator tools considered.

Acknowledgments

The research leading to these results was conducted as part of the translocation consortium (www.translocation.eu) and has received support from the Innovative Medicines Initiatives Joint Undertaking under Grant Agreement n115525, resources that are composed of a financial contribution from the European Union Seventh Framework Programme (FP7/2007–2013) and the European Federation of Pharmaceutical Industries and Associations companies in kind contribution. The authors thank Matteo Ceccarelli and Paolo Ruggerone for useful discussions.

Author Contributions

Giuliano Malloci and Attilio Vittorio Vargiu designed the research. Giuliano Malloci and Attilio Vittorio Vargiu performed the research. Giovanni Serra and Andrea Bosin provided technical support. All authors wrote, read and approved the final manuscript.

Conflicts of Interest

The authors declare no conflict of interest.

Abbreviations

AMP: chemical component identifier of ampicillin
CHELPG: charges from electrostatic potentials using a grid-based method
DFT: density functional theory
GAFF: General Amber Force Field
MD: molecular dynamics
MK: Merz-Kollman
PDB: Protein Data Bank
REMD: Replica Exchange Molecular Dynamics
RMSD: root mean square displacement
RESP: restrained electrostatic potential

Appendix

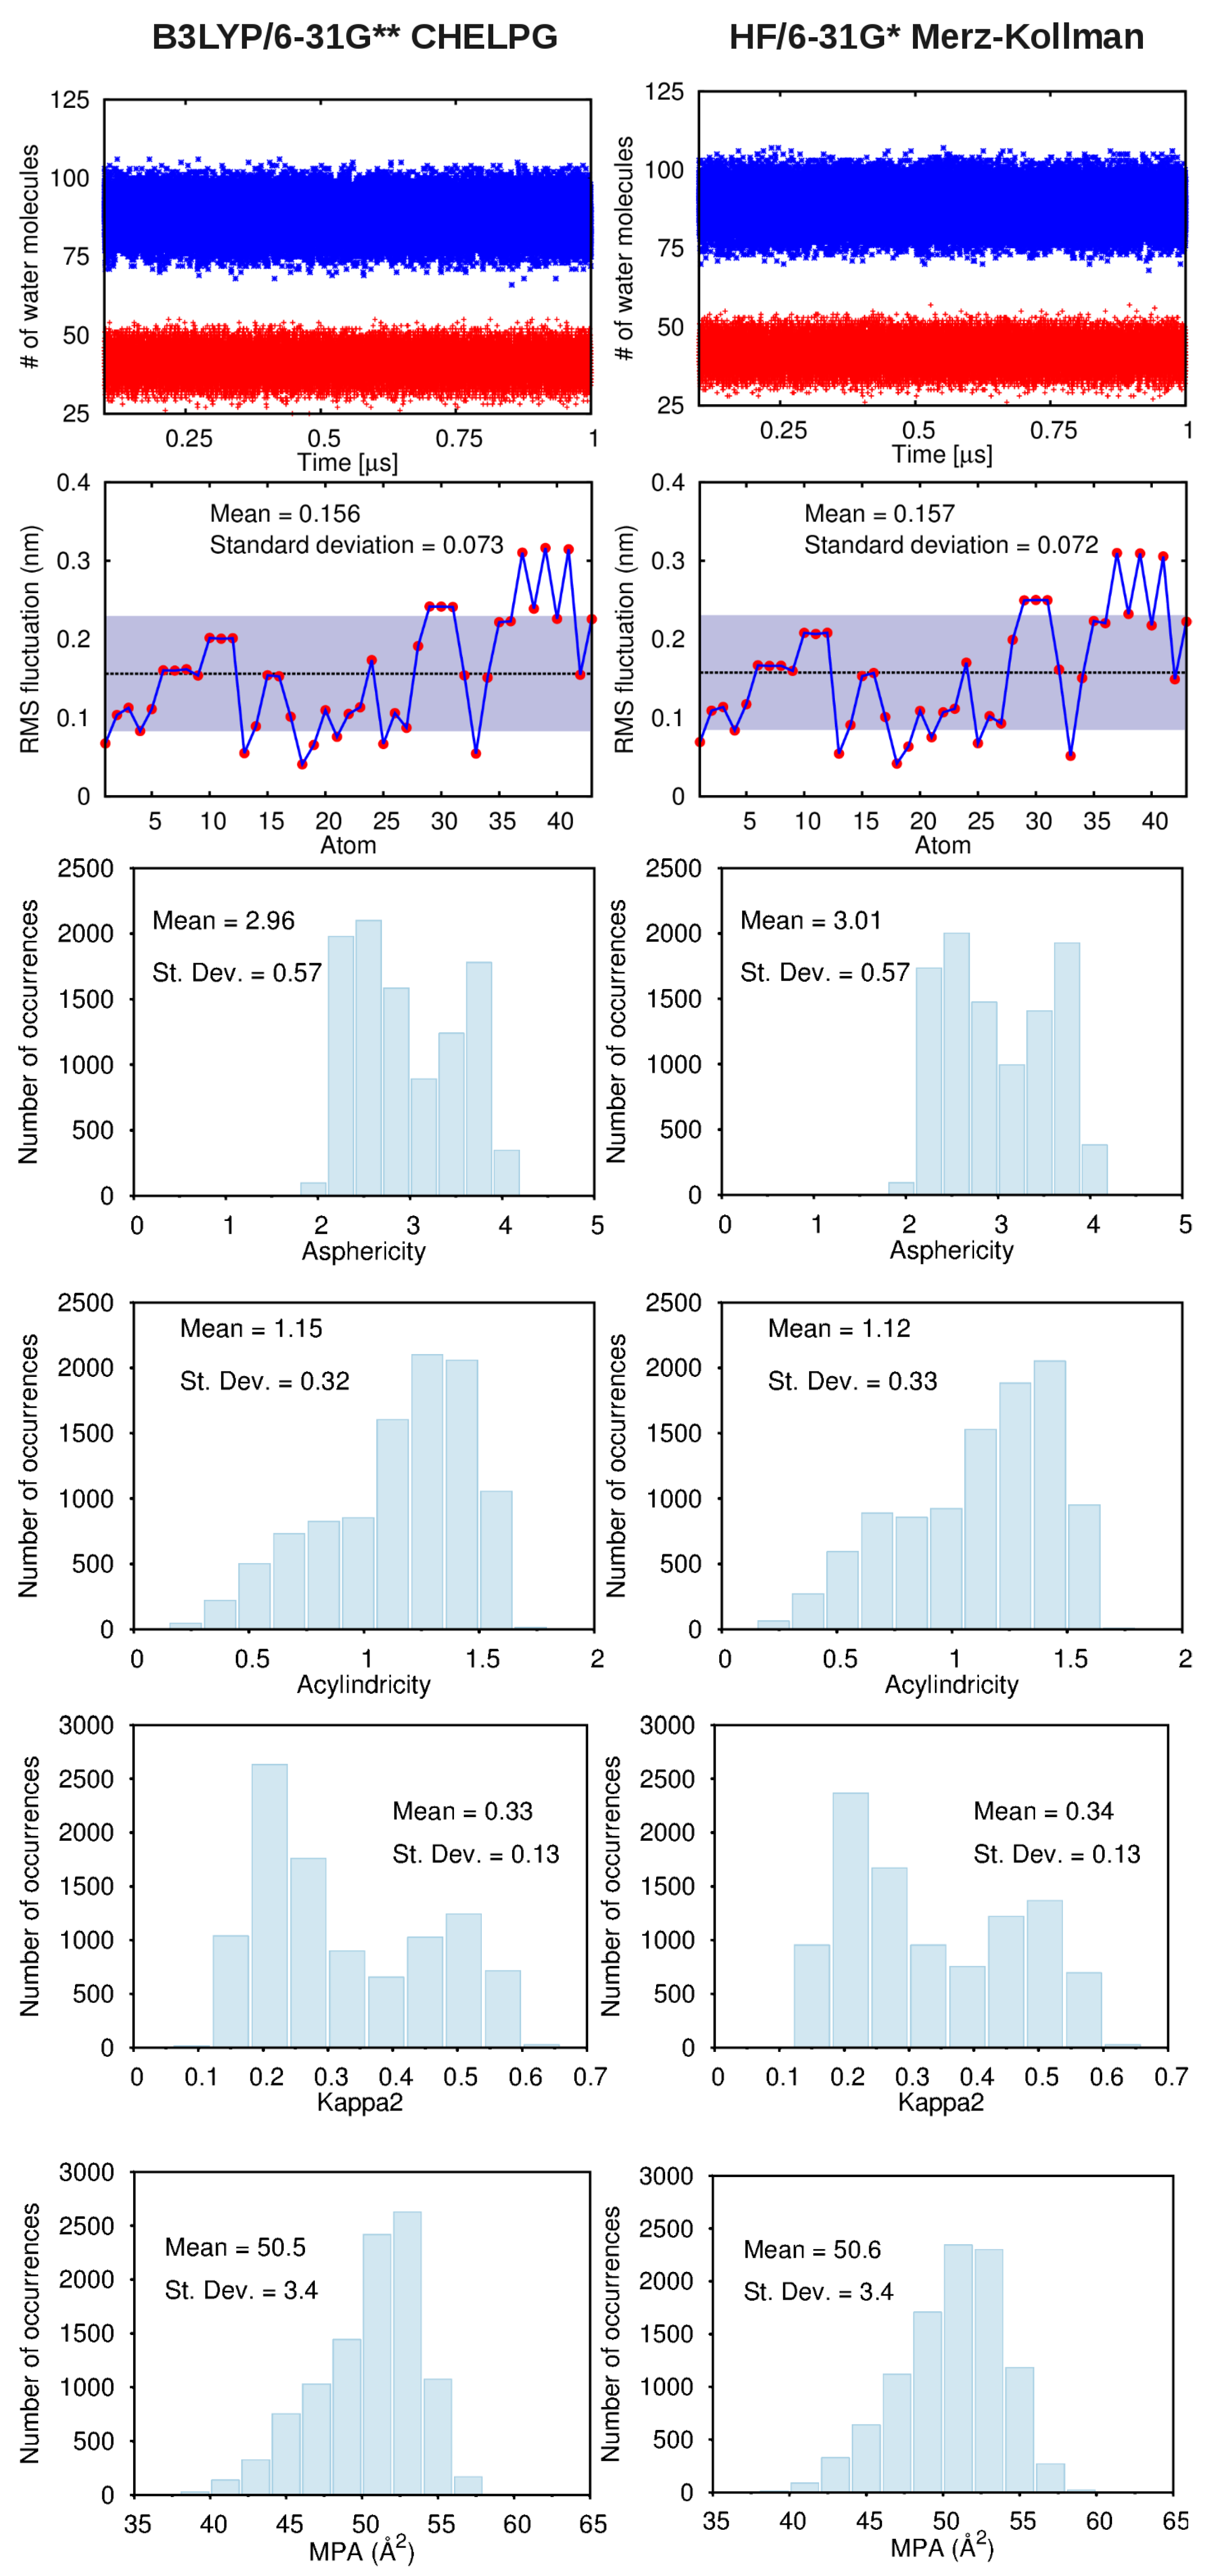
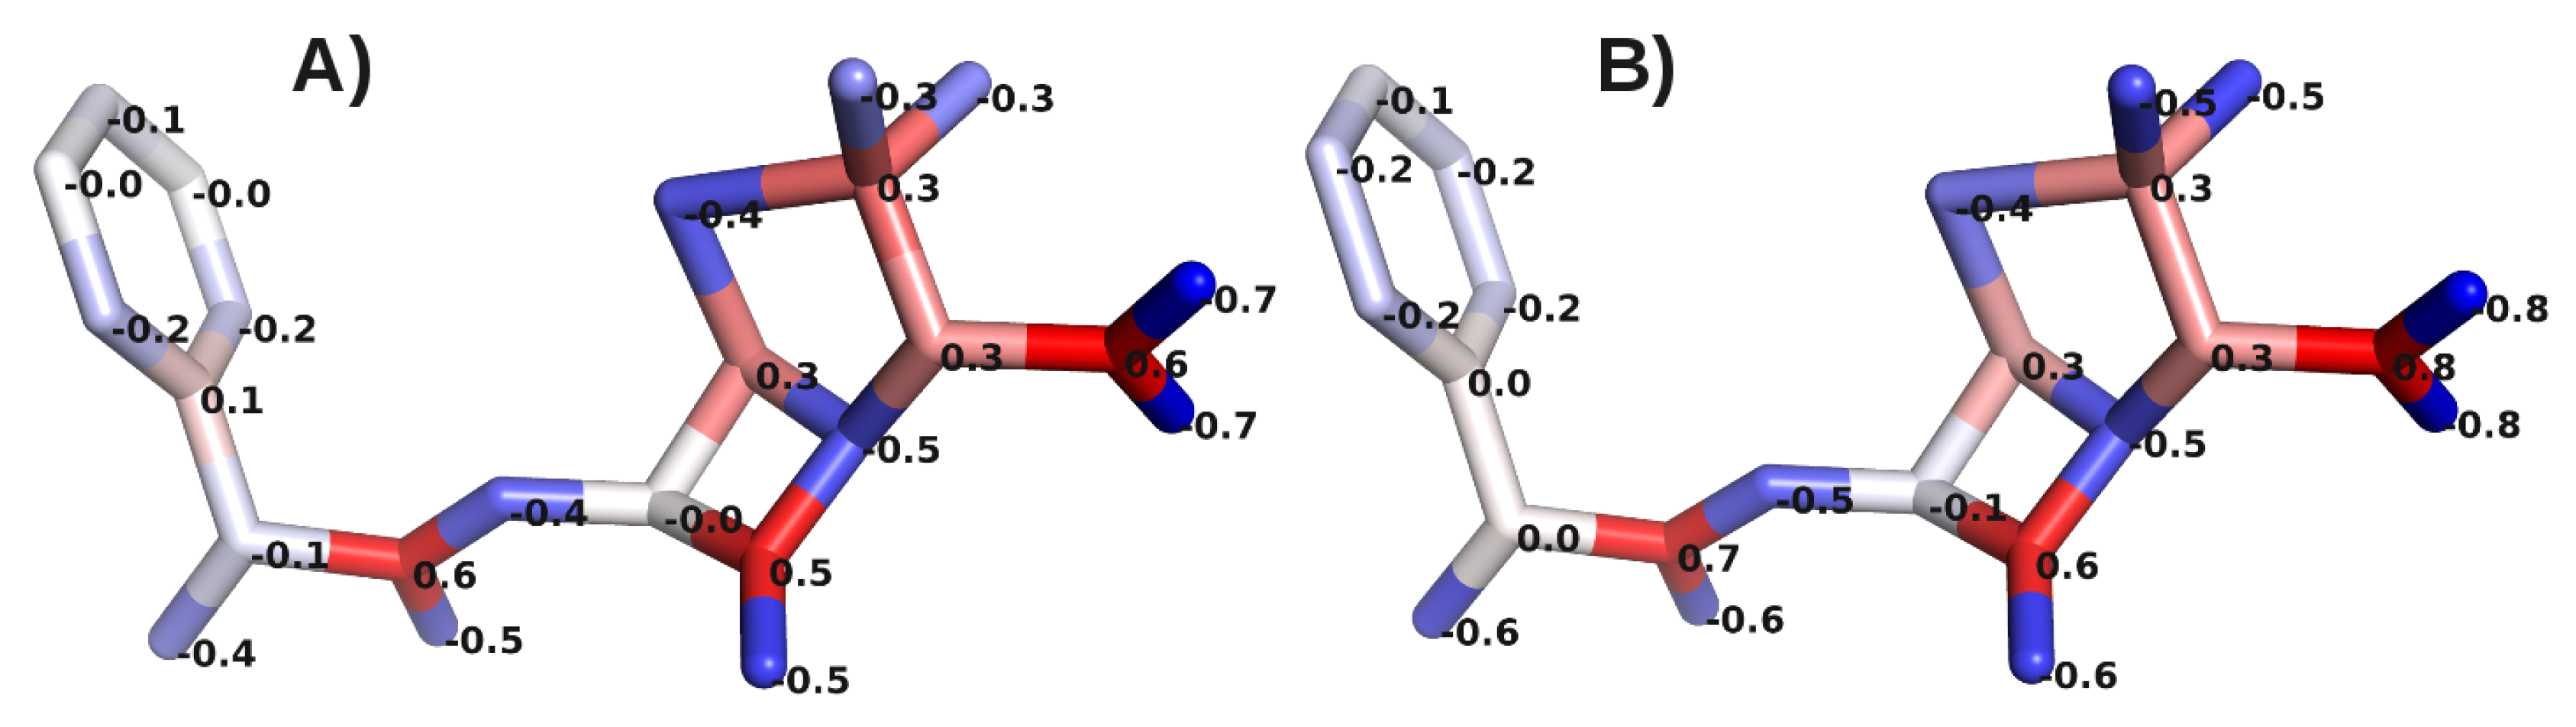
A. Impact of Atomic Partial Charges

Figure A1. Atomic partial charges (in units of the elementary charge e) of zwitterionic AMP as computed at: (A) the B3LYP/6-31G * * level using the CHELPG scheme (chgs-1); (B) the HF/6-31G* level using the Merz–Kollman scheme (chgs-2). Heavy atoms are colored in a blue-white-red scale according to their charge; hydrogens are omitted for clarity.
Computation 04 00005 g009
Figure A2. Comparison between dynamical properties of zwitterionic AMP extracted from MD trajectories obtained using chgs-1 (left) and chgs-2 (right) partial charges. From top to bottom: number of water molecules in the first (red) and second (blue) shell, root mean square fluctuations, asphericity, acylindricity, kappa2 and minimal projection area.
Computation 04 00005 g010
Atomic partial charges are among the primary FF parameters determining the dynamical behavior of a small organic molecule. All-atom MD simulations performed for the compounds included in our online database used GAFF parameters [42] for the major tautomer at physiological pH = 7.4, with CHELPG atomic charges computed at the B3LYP/6-31G * * level (see Section 2). To assess this specific choice, here, we compared some of the dynamical properties extracted from MD trajectories obtained to the above charges (in the following denoted as chgs-1), with the same descriptors extracted from MD simulations using the standard MK partial charges derived from Hartree–Fock/6-31G * calculations (labeled as chgs-2). Figure 6 compares the RESP point charges computed with the two schemes for zwitterionic ampicillin, the most populated microspecies at physiological pH = 7.4 (see Figure 2).
We found some quantitative differences among the values of the two sets of charges. Overall, the MK-Hartree-Fock/6-31G* point charges turn out to be larger than the corresponding CHELPG-B3LYP/6-31G * * , something that is well known from previous investigations [55]. Nonetheless, the charges are qualitatively similar, as seen by comparing the corresponding color patterns (see Figure A1). Moreover, there is a negligible impact of these differences on zwitterionic AMP dynamics as sampled along μs-long MD simulations using both sets of charges. In particular, as shown in Figure A2, we found coincident within statistical deviations all of the molecular descriptors extracted from the MD trajectories, namely the number of solvent molecules within the first and second shells, the molecular flexibility expressed in terms of root mean square fluctuations and some morphological descriptors as a function of time: asphericity, acylindricity, kappa2 and minimal projection area.

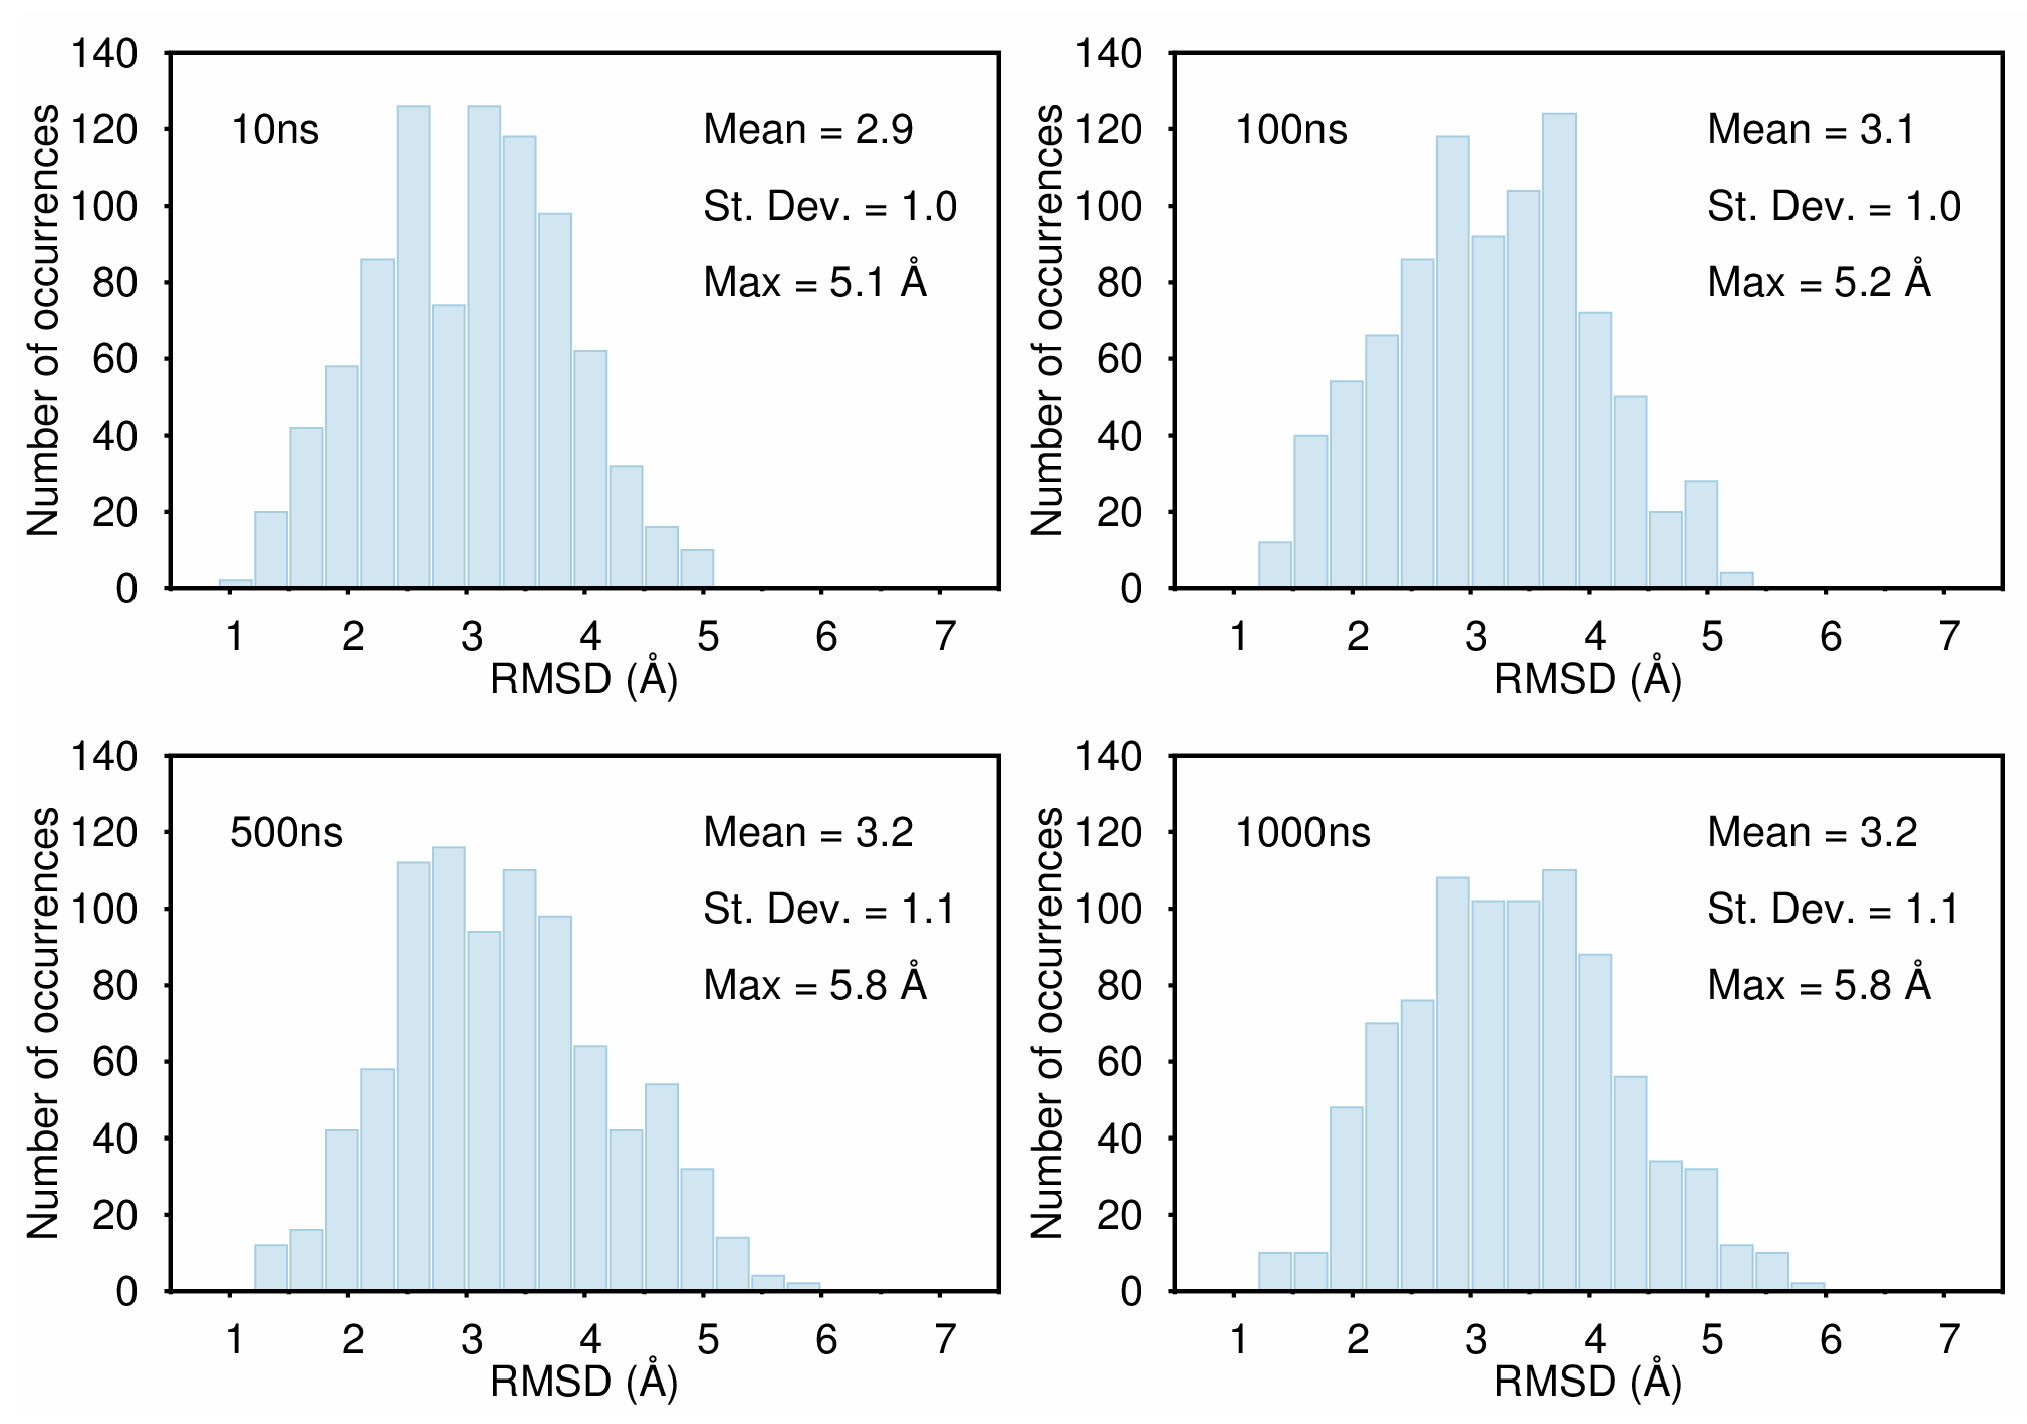
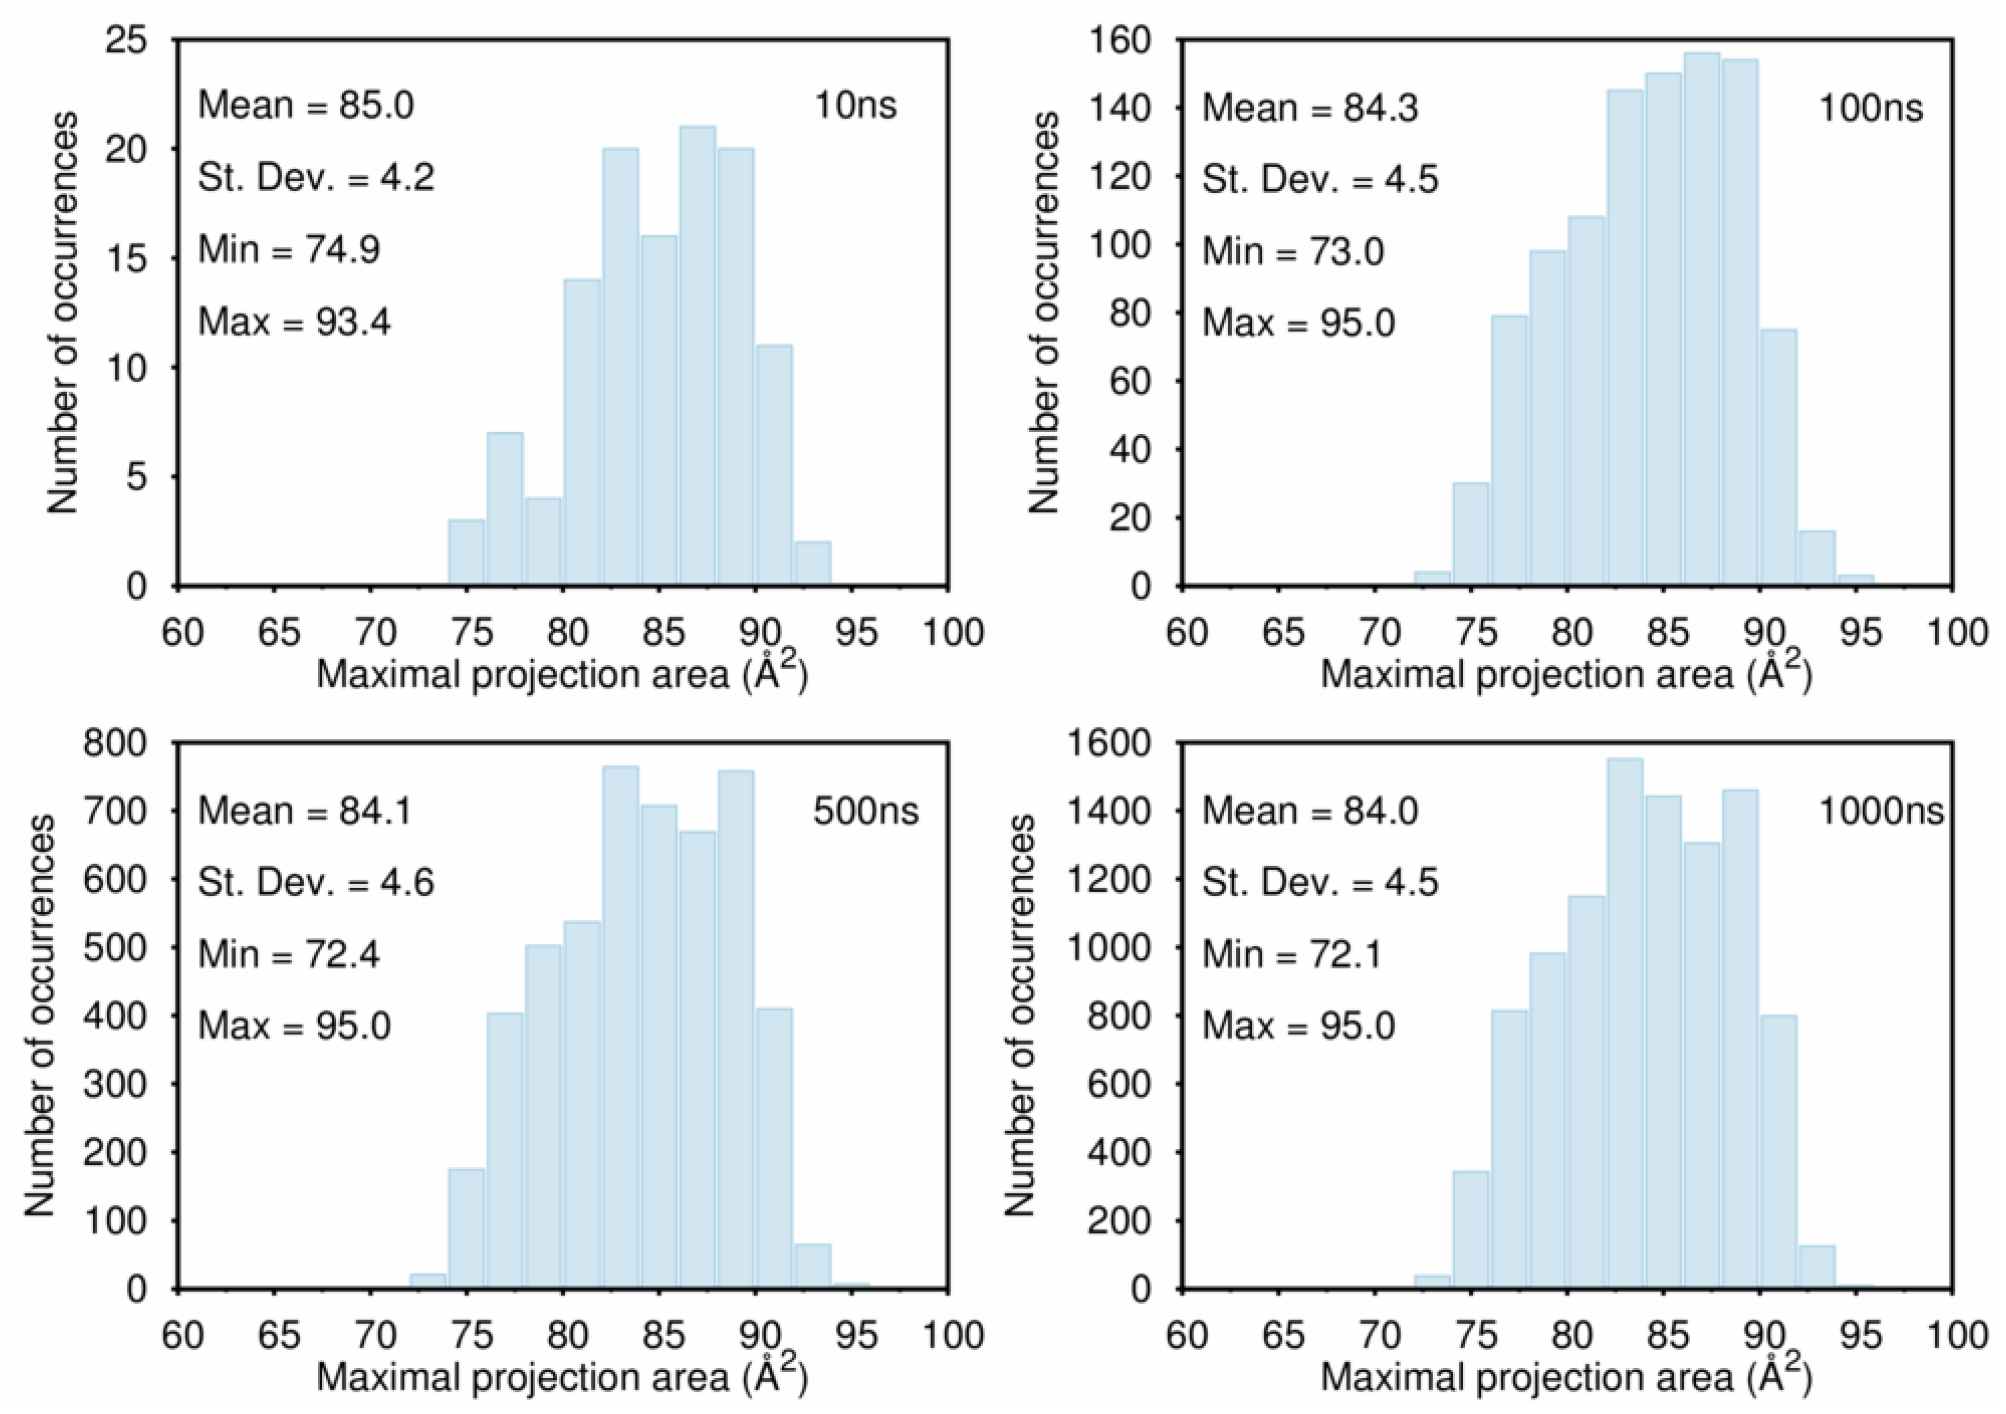
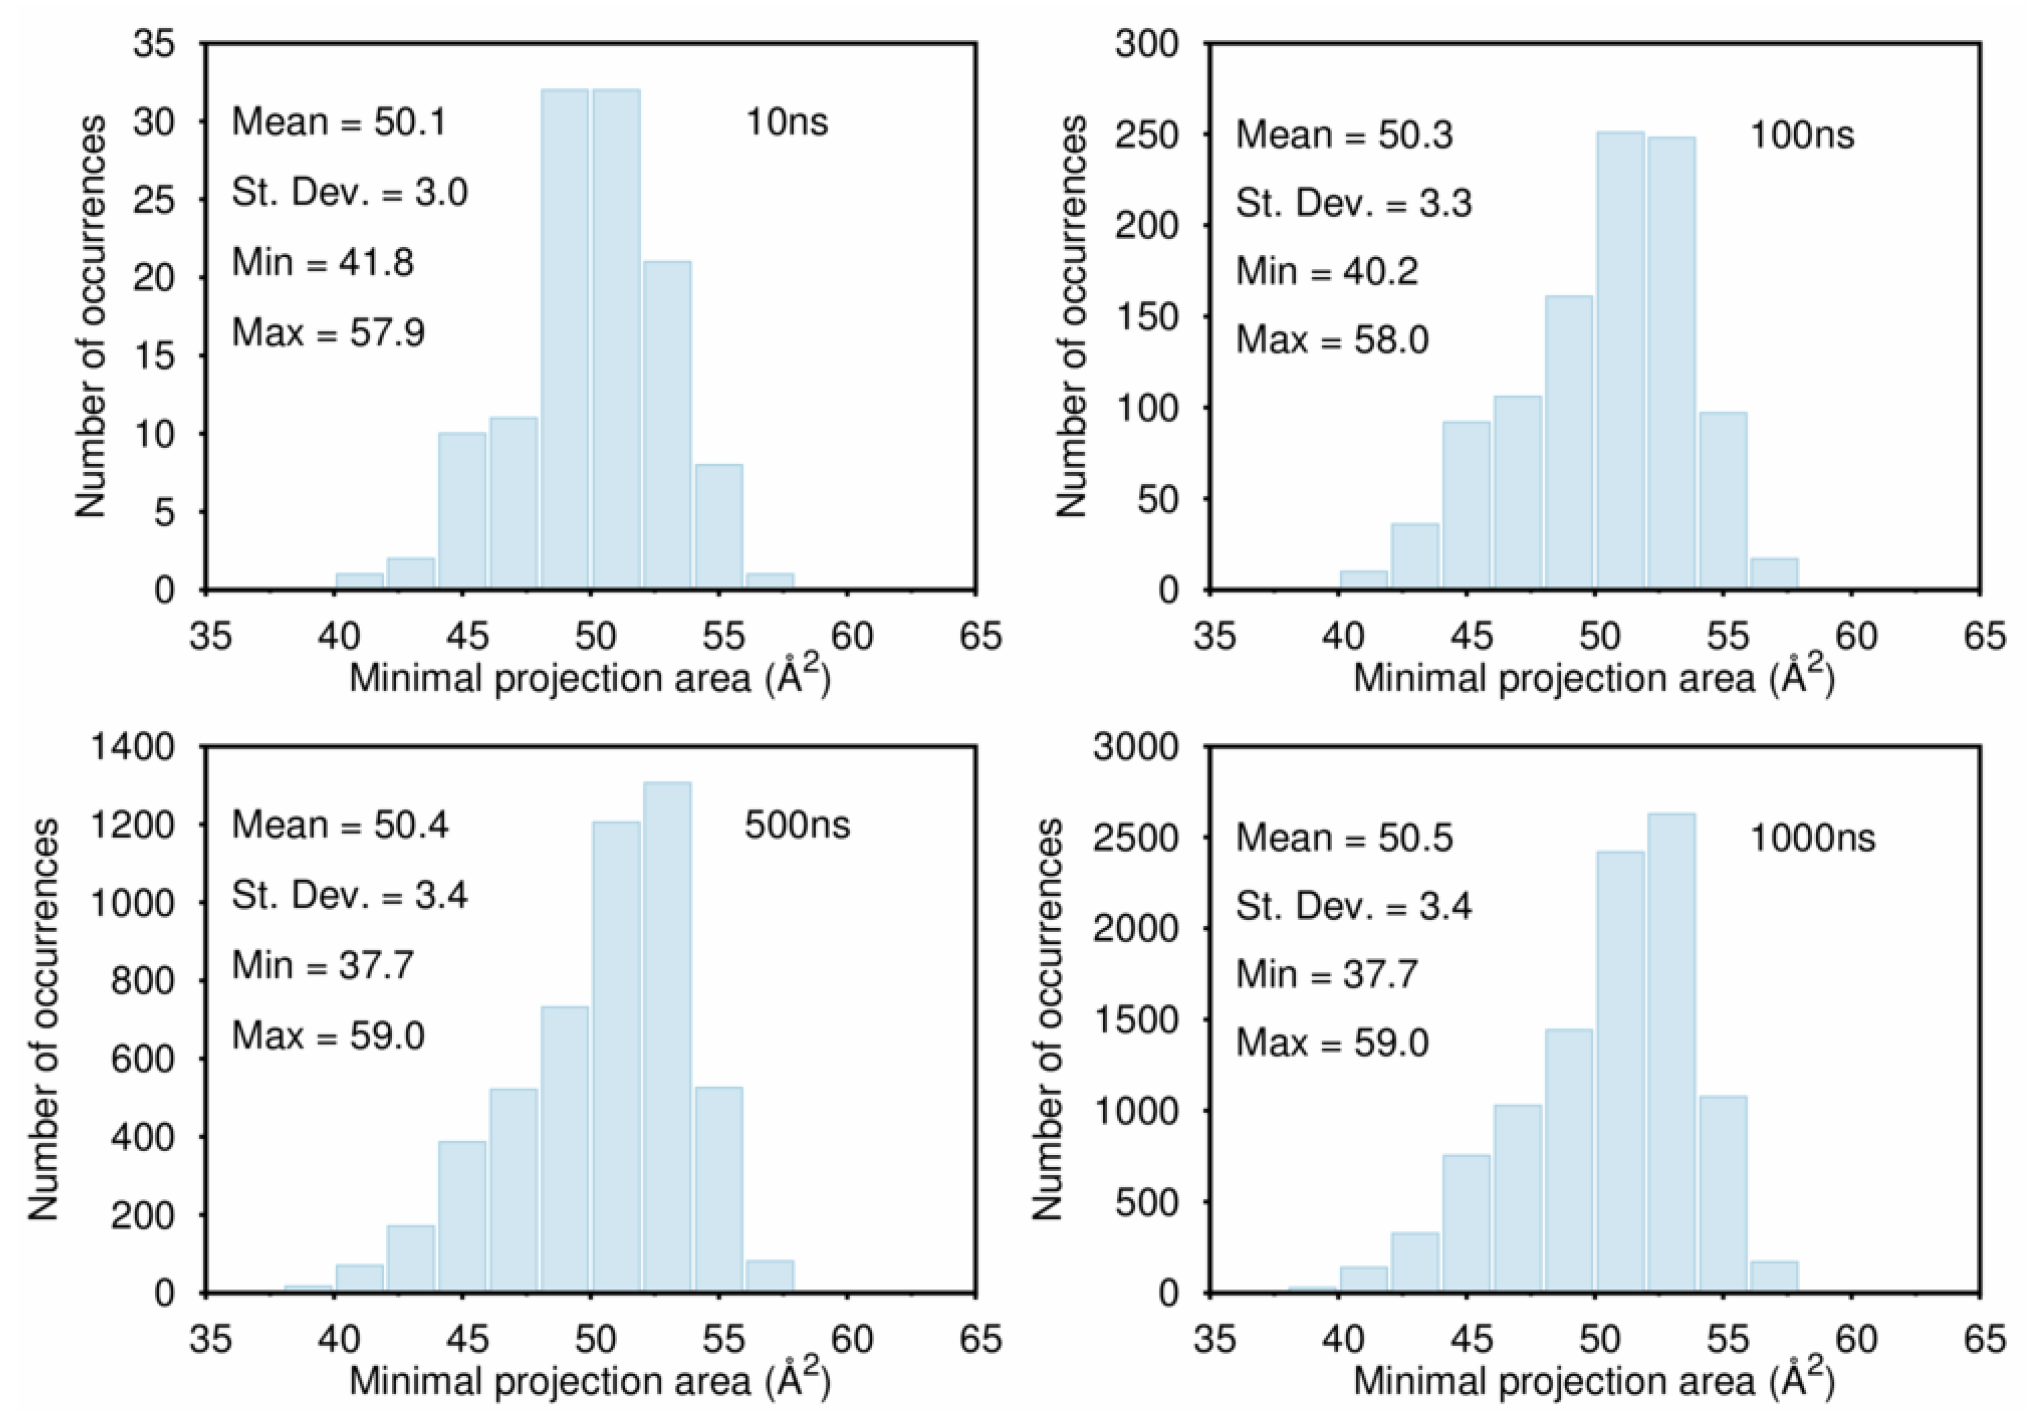
B. Assessment of the Convergence of Structural Properties vs. Simulation Time

To validate the importance of an extensive sampling, we addressed the convergence of the conformational diversity as a function of the total simulation time. Figure B1 displays the comparison between the histogram distribution of the pair-wise RMSD for the 30 conformers extracted from plain MD simulations at 10, 100, 500 and 1000 ns. We found convergent trends, as shown by a visual inspection of the histograms and by comparing the corresponding statistical parameters. This is further confirmed by Figure B2, which compares the spatial distribution of the 30 conformers corresponding to 10, 100 and 1000 ns-long MD runs. As shown by the figure, clusters corresponding to longer simulations are able to cover a larger portion of the configurational space.
We performed a similar convergence check by looking at the evolution of some molecular properties extracted from MD runs at increasing simulation times. Similar to Figure B1, Figure B3 and Figure B4 compare the distributions of minimal and maximal projection areas, respectively, showing again a convergent trend in both cases.
Figure B1. Comparison between the histogram distribution of the pair-wise RMSD for the 30 conformers extracted from plain MD simulations at 10, 100, 500 and 1000 ns.
Computation 04 00005 g011
Figure B2. Side (left) and front (right) views of the spatial distribution of the 30 conformers corresponding to 10, 100 and 1000 ns-long MD runs (blue, red, green, respectively). All of the structures have been aligned with respect to the penam group (formed by the four-membered β-lactam ring fused to the five-membered ring).
Computation 04 00005 g012
Figure B3. Same as Figure B1 for the minimal projection area.
Computation 04 00005 g013
Figure B4. Same as Figure B1 for the maximal projection area.
Computation 04 00005 g014

References

  1. Csermely, P.; Palotai, R.; Nussinov, R. Induced fit, conformational selection and independent dynamic segments: an extended view of binding events. Trends Biochem. Sci. 2010, 35, 539–546. [Google Scholar] [CrossRef] [PubMed]
  2. Baron, R.; McCammon, J.A. Molecular Recognition and Ligand Association. Ann. Rev. Phys. Chem. 2013, 64, 151–175. [Google Scholar] [CrossRef] [PubMed]
  3. Pisani, P.; Piro, P.; Decherchi, S.; Bottegoni, G.; Sona, D.; Murino, V.; Rocchia, W.; Cavalli, A. Describing the Conformational Landscape of Small Organic Molecules through Gaussian Mixtures in Dihedral Space. J. Chem. Theory Comput. 2014, 10, 2557–2568. [Google Scholar] [CrossRef] [PubMed]
  4. Jorgensen, W.L. The many roles of computation in drug discovery. Science 2004, 303, 1813–1818. [Google Scholar] [CrossRef] [PubMed]
  5. Van Gunsteren, W.F.; Bakowies, D.; Baron, R.; Chandrasekhar, I.; Christen, M.; Daura, X.; Gee, P.; Geerke, D.P.; Glaettli, A.; Huenenberger, P.H.; et al. Biomolecular modeling: Goals, problems, perspectives. Angew. Chem. Int. Ed. 2006, 45, 4064–4092. [Google Scholar] [CrossRef] [PubMed]
  6. Gilson, M.K.; Zhou, H.X. Calculation of Protein-Ligand Binding Affinities. Ann. Rev. Biophys. Biomol. Struct. 2007, 36, 21–42. [Google Scholar] [CrossRef] [PubMed]
  7. Sherwood, P.; Brooks, B.R.; Sansom, M.S.P. Multiscale methods for macromolecular simulations. Curr. Opin. Struc. Biol. 2008, 18, 630–640. [Google Scholar] [CrossRef] [PubMed]
  8. Dodson, G.G.; Lane, D.P.; Verma, C.S. Molecular simulations of protein dynamics: New windows on mechanisms in biology. EMBO Rep. 2008, 9, 144–150. [Google Scholar] [CrossRef] [PubMed]
  9. Lee, E.H.; Hsin, J.; Sotomayor, M.; Comellas, G.; Schulten, K. Discovery Through the Computational Microscope. Structure 2009, 17, 1295–1306. [Google Scholar] [CrossRef] [PubMed]
  10. Boehr, D.D.; Nussinov, R.; Wright, P.E. The role of dynamic conformational ensembles in biomolecular recognition. Nat. Chem. Biol. 2009, 5, 789–796. [Google Scholar] [CrossRef] [PubMed]
  11. Dror, R.O.; Dirks, R.M.; Grossman, J.P.; Xu, H.; Shaw, D.E. Biomolecular Simulation: A Computational Microscope for Molecular Biology. Ann. Rev. Biophys. 2012, 41, 429–452. [Google Scholar] [CrossRef] [PubMed]
  12. Baron, R.; McCammon, J.A. Molecular Recognition and Ligand Association. Ann. Rev. Phys. Chem. 2013, 64, 151–175. [Google Scholar] [CrossRef] [PubMed]
  13. Cheatham, T.E.; Case, D.A. Twenty-Five Years of Nucleic Acid Simulations. Biopolymers 2013, 99, 969–977. [Google Scholar] [CrossRef] [PubMed]
  14. Karplus, M.; Lavery, R. Significance of Molecular Dynamics Simulations for Life Sciences. Isr. J. Chem. 2014, 54, 1042–1051. [Google Scholar] [CrossRef]
  15. Mortier, J.; Rakers, C.; Bermudez, M.; Murgueitio, M.S.; Riniker, S.; Wolber, G. The impact of molecular dynamics on drug design: Applications for the characterization of ligand-macromolecule complexes. Drug Discov. Today 2015, 20, 686–702. [Google Scholar] [CrossRef] [PubMed]
  16. Schmidt, T.H.; Kandt, C. LAMBADA and InflateGRO2: Efficient Membrane Alignment and Insertion of Membrane Proteins for Molecular Dynamics Simulations. J. Chem. Inf. Mod. 2012, 52, 2657–2669. [Google Scholar] [CrossRef] [PubMed]
  17. Piana, S.; Klepeis, J.L.; Shaw, D.E. Assessing the accuracy of physical models used in protein-folding simulations: quantitative evidence from long molecular dynamics simulations. Curr. Opin. Struc. Biol. 2014, 24, 98–105. [Google Scholar] [CrossRef] [PubMed]
  18. Šponer, J.; Banáš, P.; Jurečka, P.; Zgarbová, M.; Kührová, P.; Havrila, M.; Krepl, M.; Stadlbauer, P.; Otyepka, M. Molecular Dynamics Simulations of Nucleic Acids. From Tetranucleotides to the Ribosome. J. Phys. Chem. Lett. 2014, 5, 1771–1782. [Google Scholar] [CrossRef] [PubMed]
  19. Graen, T.; Hoefling, M.; Grubmueller, H. AMBER-DYES: Characterization of Charge Fluctuations and Force Field Parameterization of Fluorescent Dyes for Molecular Dynamics Simulations. J. Chem. Theory Comput. 2014, 10, 5505–5512. [Google Scholar] [CrossRef] [PubMed]
  20. Dupradeau, F.Y.; Cézard, C.; Lelong, R.; Stanislawiak, É.; Pêcher, J.; Delepine, J.C.; Cieplak, P. R.E. DD. B.: A database for RESP and ESP atomic charges, and force field libraries. Nucleic Acids Res. 2008, 36, D360–D367. [Google Scholar] [CrossRef] [PubMed]
  21. Dupradeau, F.Y.; Pigache, A.; Zaffran, T.; Savineau, C.; Lelong, R.; Grivel, N.; Lelong, D.; Rosanski, W.; Cieplak, P. The R.E.D. tools: Advances in RESP and ESP charge derivation and force field library building. Phys. Chem. Chem. Phys. 2010, 12, 7821–7839. [Google Scholar] [CrossRef] [PubMed]
  22. AMBER Parameter Database. Available online: http://www.pharmacy.manchester.ac.uk/bryce/amber/ (accessed on 22 January 2016).
  23. Vanommeslaeghe, K.; MacKerell, A.D., Jr. Automation of the CHARMM General Force Field (CGenFF) I: Bond Perception and Atom Typing. J. Chem. Inf. Mod. 2012, 52, 3144–3154. [Google Scholar] [CrossRef] [PubMed]
  24. Vanommeslaeghe, K.; Raman, E.P.; MacKerell, A.D., Jr. Automation of the CHARMM General Force Field (CGenFF) II: Assignment of Bonded Parameters and Partial Atomic Charges. J. Chem. Inf. Mod. 2012, 52, 3155–3168. [Google Scholar] [CrossRef] [PubMed]
  25. Malde, A.K.; Zuo, L.; Breeze, M.; Stroet, M.; Poger, D.; Nair, P.C.; Oostenbrink, C.; Mark, A.E. An Automated Force Field Topology Builder (ATB) and Repository: Version 1.0. J. Chem. Theory Comput. 2011, 7, 4026–4037. [Google Scholar] [CrossRef] [PubMed]
  26. Stavenger, R.A.; Winterhalter, M. TRANSLOCATION Project: How to Get Good Drugs into Bad Bugs. Sci. Transl. Med. 2014, 6, 228ed7. [Google Scholar] [CrossRef] [PubMed]
  27. Malloci, G.; Vargiu, A.V.; Serra, G.; Bosin, A.; Ruggerone, P.; Ceccarelli, M. A Database of Force-Field Parameters, Dynamics, and Properties of Antimicrobial Compounds. Molecules 2015, 20, 13997–14021. [Google Scholar] [CrossRef] [PubMed] [Green Version]
  28. Kumar, A.; Hajjar, E.; Ruggerone, P.; Ceccarelli, M. Molecular simulations reveal the mechanism and the determinants for ampicillin translocation through OmpF. J. Phys. Chem. B 2010, 114, 9608–9616. [Google Scholar] [CrossRef] [PubMed]
  29. Hajjar, E.; Bessonov, A.; Molitor, A.; Kumar, A.; Mahendran, K.R.; Winterhalter, M.; Pagès, J.M.; Ruggerone, P.; Ceccarelli, M. Toward screening for antibiotics with enhanced permeation properties through bacterial porins. Biochemistry 2010, 49, 6928–6935. [Google Scholar] [CrossRef] [PubMed]
  30. Collu, F.; Vargiu, A.V.; Dreier, J.; Cascella, M.; Ruggerone, P. Recognition of Imipenem and Meropenem by the RND-Transporter MexB Studied by Computer Simulations. J. Am. Chem. Soc. 2012, 134, 19146–19158. [Google Scholar] [CrossRef] [PubMed]
  31. Vargiu, A.V.; Nikaido, H. Multidrug binding properties of the AcrB efflux pump characterized by molecular dynamics simulations. Proc. Natl. Acad. Sci. USA 2012, 109, 20637–20642. [Google Scholar] [CrossRef] [PubMed]
  32. Ferreira, L.G.; dos Santos, R.N.; Oliva, G.; Andricopulo, A.D. Molecular Docking and Structure-Based Drug Design Strategies. Molecules 2015, 20, 13384–13421. [Google Scholar] [CrossRef] [PubMed]
  33. Forli, S. Charting a Path to Success in Virtual Screening. Molecules 2015, 20, 18732–18758. [Google Scholar] [CrossRef] [PubMed]
  34. Sinko, W.; Lindert, S.; McCammon, J.A. Accounting for Receptor Flexibility and Enhanced Sampling Methods in Computer-Aided Drug Design. Chem. Biol. Drug Des. 2013, 81, 41–49. [Google Scholar] [CrossRef] [PubMed]
  35. Amaro, R.E.; Baron, R.; McCammon, J.A. An improved relaxed complex scheme for receptor flexibility in computer-aided drug design. J. Comput.-Aided Mol. Des. 2008, 22, 693–705. [Google Scholar] [CrossRef] [PubMed]
  36. Zacharias, M. Protein-protein docking with a reduced protein model accounting for side-chain flexibility. Protein Sci. 2003, 12, 1271–1282. [Google Scholar] [CrossRef] [PubMed]
  37. Laio, A.; Parrinello, M. Escaping free-energy minima. Proc. Natl. Acad. Sci. USA 2002, 99, 12562–12566. [Google Scholar] [CrossRef] [PubMed]
  38. Hamelberg, D.; Mongan, J.; McCammon, J.A. Accelerated molecular dynamics: A promising and efficient simulation method for biomolecules. J. Chem. Phys. 2004, 120, 11919–11929. [Google Scholar] [CrossRef] [PubMed]
  39. Sugita, Y.; Okamoto, Y. Replica-exchange molecular dynamics method for protein folding. Chem. Phys. Lett. 1999, 314, 141–151. [Google Scholar] [CrossRef]
  40. Acred, P.; Brown, D.M.; Turner, D.H.; Wilson, M.J. Pharmacology and Chemotherapy of Ampicillin. A New Broad-Spectrum Penicillin. Brit. J. Pharm. Chemother. 1962, 18, 356–369. [Google Scholar] [CrossRef]
  41. Ebejer, J.P.; Morris, G.M.; Deane, C.M. Freely Available Conformer Generation Methods: How Good Are They? J. Chem. Inf. Mod. 2012, 52, 1146–1158. [Google Scholar] [CrossRef] [PubMed]
  42. Wang, J.; Wolf, R.M.; Caldwell, J.W.; Kollman, P.A.; Case, D.A. Development and testing of a general amber force field. J. Comput. Chem. 2004, 25, 1157–1174. [Google Scholar] [CrossRef] [PubMed]
  43. Bolton, E.E.; Wangand, Y.; Thiessenand, P.A.; Bryant, S.H. PubChem: Integrated Platform of Small Molecules and Biological Activities. Annu. Rep. Comput. Chem. 2008, 4, 217–241. [Google Scholar]
  44. Marvin 14.8.25.0. ChemAxon 2014. Available online: http://www.chemaxon.com (accessed on 22 January 2016).
  45. Calculator Plugins. ChemAxon 2014. Available online: https://www.chemaxon.com/products/calculator-plugins/ (accessed on 22 January 2016).
  46. Kohn, W. Nobel Lecture: Electronic structure of matter-wave functions and density functionals. Rev. Mod. Phys. 1999, 71, 1253–1266. [Google Scholar] [CrossRef]
  47. Frisch, M.J.; Trucks, G.W.; Schlegel, H.B.; Scuseria, G.E.; Robb, M.A.; Cheeseman, J.R.; Scalmani, G.; Barone, V.; Mennucci, B.; Petersson, G.A.; et al. Gaussian09 Revision A.02; Gaussian Inc.: Wallingford, CT, USA, 2009. [Google Scholar]
  48. Becke, A.D. Density-functional thermochemistry. III. The role of exact exchange. J. Chem. Phys. 1993, 98, 5648–5652. [Google Scholar] [CrossRef]
  49. Kim, K.; Jordan, K.D. Comparison of Density Functional and MP2 Calculations on the Water Monomer and Dimer. J. Phys. Chem. 1994, 98, 10089–10094. [Google Scholar] [CrossRef]
  50. Pople, J.A. Quantum Chemical Models (Nobel Lecture). Angew. Chem. Int. Ed. 1999, 38, 1894–1902. [Google Scholar] [CrossRef]
  51. Malloci, G.; Joblin, C.; Mulas, G. On-line database of the spectral properties of polycyclic aromatic hydrocarbons. Chem. Phys. 2007, 332, 353–359. [Google Scholar] [CrossRef]
  52. Malloci, G.; Cappellini, G.; Mulas, G.; Mattoni, A. Electronic and optical properties of families of polycyclic aromatic hydrocarbons: A systematic (time-dependent) density functional theory study. Chem. Phys. 2011, 384, 19–27. [Google Scholar] [CrossRef]
  53. Cheng, T.; Zhao, Y.; Li, X.; Lin, F.; Xu, Y.; Zhang, X.; Li, Y.; Wang, R.; Lai, L. Computation of Octanol-Water Partition Coefficients by Guiding an Additive Model with Knowledge. J. Chem. Inf. Model. 2007, 47, 2140–2148. [Google Scholar] [CrossRef] [PubMed]
  54. Pyrkov, T.V.; Chugunov, A.O.; Krylov, N.A.; Nolde, D.E.; Efremov, R.G. PLATINUM: a web tool for analysis of hydrophobic/hydrophilic organization of biomolecular complexes. Bioinformatics 2009, 25, 1201–1202. [Google Scholar] [CrossRef] [PubMed]
  55. Bayly, C.I.; Cieplak, P.; Cornell, W.; Kollman, P.A. A well-behaved electrostatic potential based method using charge restraints for deriving atomic charges: the RESP model. J. Phys. Chem. 1993, 97, 10269–10280. [Google Scholar] [CrossRef]
  56. Wang, J.; Wang, W.; Kollman, P.A.; Case, D.A. Automatic atom type and bond type perception in molecular mechanical calculations. J. Mol. Graphics Modell. 2006, 25, 247–260. [Google Scholar] [CrossRef] [PubMed]
  57. Breneman, C.M.; Wiberg, K.B. Determining atom-centered monopoles from molecular electrostatic potentials. The need for high sampling density in formamide conformational analysis. J. Comput. Chem. 1990, 11, 361–373. [Google Scholar] [CrossRef]
  58. Singh, U.C.; Kollman, P.A. An approach to computing electrostatic charges for molecules. J. Comput. Chem. 1984, 5, 129–145. [Google Scholar] [CrossRef]
  59. Case, D.; Babin, V.; Berryman, J.; Betz, R.; Cai, Q.; Cerutti, D.; Cheatham, T.; Darden, T.; Duke, R.; Gohlke, H.; et al. Amber 14; University of California: San Francisco, CA, USA, 2014. [Google Scholar]
  60. Jorgensen, W.L.; Chandrasekhar, J.; Madura, J.D.; Impey, R.W.; Klein, M.L. Comparison of simple potential functions for simulating liquid water. J. Chem. Phys. 1983, 79, 926–935. [Google Scholar] [CrossRef]
  61. Roe, D.R.; Cheatham, T.E. PTRAJ and CPPTRAJ: Software for Processing and Analysis of Molecular Dynamics Trajectory Data. J. Chem. Theory Comput. 2013, 9, 3084–3095. [Google Scholar] [CrossRef] [PubMed]
  62. Bonomi, M.; Branduardi, D.; Bussi, G.; Camilloni, C.; Provasi, D.; Raiteri, P.; Donadio, D.; Marinelli, F.; Pietrucci, F.; Broglia, R.A.; et al. PLUMED: A portable plugin for free-energy calculations with molecular dynamics. Comput. Phys. Commun. 2009, 180, 1961–1972. [Google Scholar] [CrossRef]
  63. Theodorou, D.N.; Suter, U.W. Shape of unperturbed linear polymers: polypropylene. Macromolecules 1985, 18, 1206–1214. [Google Scholar] [CrossRef]
  64. Miteva, M.A.; Guyon, F.; Tufféry, P. Frog2: Efficient 3D conformation ensemble generator for small compounds. Nucleic Acids Res. 2010, 38, W622–W627. [Google Scholar] [CrossRef] [PubMed]
  65. O’Boyle, N.; Banck, M.; James, C.; Morley, C.; Vandermeersch, T.; Hutchison, G. Open Babel: An open chemical toolbox. J. Cheminf. 2011, 3, 33. [Google Scholar] [CrossRef] [PubMed]
  66. RDKit: Open-Source Cheminformatics Software. Available online: http://www.rdkit.org (accessed on 22 January 2015).
  67. Rappe, A.K.; Casewit, C.J.; Colwell, K.S.; Goddard, W.A.G.; Skiff, W.M. UFF, a full periodic table force field for molecular mechanics and molecular dynamics simulations. J. Am. Chem. Soc. 1992, 114, 10024–10035. [Google Scholar] [CrossRef]
  68. Shao, J.; Tanner, S.W.; Thompson, N.; Cheatham, T.E. Clustering Molecular Dynamics Trajectories: 1. Characterizing the Performance of Different Clustering Algorithms. J. Chem. Theory Comput. 2007, 3, 2312–2334. [Google Scholar] [CrossRef] [PubMed]
  69. DeLano, W.L. Schrodinger LLC (2010) The PyMOL Molecular Graphics System, version 1.3r1. Available online: http://www.pymol.org (accessed on 25 January 2016).
  70. Humphrey, W.; Dalke, A.; Schulten, K. VMD—Visual Molecular Dynamics. J. Mol. Graph. 1996, 14, 33–38. [Google Scholar] [CrossRef]
  71. Gnuplot. Available online: http://www.gnuplot.info (accessed on 22 January 2016).
  72. Ziervogel, B.; Roux, B. The Binding of Antibiotics in OmpF Porin. Structure 2013, 21, 76–87. [Google Scholar] [CrossRef] [PubMed]
  73. Mitchell, S.M.; Ullman, J.L.; Teel, A.L.; Watts, R.J. pH and temperature effects on the hydrolysis of three β-lactam antibiotics: Ampicillin, cefalotin and cefoxitin. Sci. Total Environ. 2014, 466–467, 547–555. [Google Scholar] [CrossRef] [PubMed]

