2. Methods
We modelled the four composite cell walls by adapting a previously published 3-D model of a perennial ryegrass cell wall (RGCW) and its enzymatic degradation [
16]. All four cell walls had several elements in common with RGCW, namely nine CMFs arranged in parallel (with the cellulose molecules 60 glucosyl residues long) with 35 (1,3;1,4)-β-glucans attached, all in their original configurations.
The first model cell wall (Low XG) was created as a control, and contained 93 XGs, which were in the RGCW model [
16]. The second model cell wall (Low GAX) had no XGs, but contained 93 GAXs from the RGCW in their original configurations. These two model cell walls allowed a comparison to be made of the abilities of XG and GAX to protect cellulose from degradation. The third and fourth model cell walls were designed to investigate the effect of XG density on cellulose degradation. These walls contained no GAXs and were formed by inserting 76 additional XGs into the Low XG model to obtain a cell wall with 169 XGs (Medium XG) and then a further 76 XGs to obtain a cell wall with 245 XGs (High XG). The number 245 was chosen to match the number of GAXs in the RGCW, with the Medium XG cell wall being intermediate between the two.
The GAXs in Low GAX had an average degree of polymerisation (DP) of 27, with standard deviation (SD) of 9, and no glycosidic linkages that could be degraded by a cellulase/β-glucanase. The DP of the XG backbones averaged 29 for both Low and Medium XG and 30 for High XG (with an SD of 7 for all three). Low, Medium and High XG contained respectively 2742, 5104 and 7206 XG-sourced glucoses and respectively 2649, 4936 and 6961 glycosidic bonds degradable by a cellulase/β-glucanase. The CMFs in each cell wall contained 15,120 glucoses and 14,868 glycosidic bonds (1680 glucoses and 1652 glycosidic bonds per CMF). The (1,3;1,4)-β-glucans in each wall contained 1028 glucoses and 993 glycosidic bonds, with average DPs and numbers of glycosidic linkages of 29 and 28 respectively, both with SDs of 3.
Dimensions were specified in terms of the radius of a glucose molecule, r
g. As a reference, the Stoke’s radius of glucose is 0.365 nm [
17]. Each wall had an approximate dimension of 120 r
g deep (in the orientation of the CMF direction), 80 r
g wide and 80 r
g high. The volume not occupied by CMFs was approximately 690,000 r
g3. The total number of residues contained in all hemicelluloses of different types was 5311 for the Low GAX wall, and 5048, 8516 and 11,592 for the Low, Medium and High XG walls. Assuming each residue to be similar in size to a glucose molecule, the non-CMF residues occupied about 3.2% of the volume of the non-CMF space in the Low GAX wall, and about 3.1%, 5.2% and 7.0% of the volume of the non-CMF space in the Low, Medium and High XG walls. Thus these cell walls were sparsely occupied. It is not possible to estimate pore size from these values because of the heterogeneous nature of the cell walls.
We populated the four cell walls with Cel51A (an endo-1,4-β-glucanase) and Cel9D (an exo-1, 4-β-glucanase that cleaves glucosyl residues from the nonreducing end of cellulose) which have been characterised from the rumen bacterium
Fibrobacter succinogenes S85 and shown to act synergistically [
18,
19], and which we have previously modelled [
16].
Cel51A acts on cellulose, (1,3;1,4)-β-glucans and XGs, mainly producing oligosaccharides with a degree of polymerization (DP) of 2–5 [
19]. Cel9D processively removes unsubstituted glucosyl residues from the non-reducing end of oligosaccharides with DP > 2, including cello-oligosaccharides, XG oligosaccharides and (1,3;1,4)-β-glucan oligosaccharides [
18]. Simulations were carried out to investigate the activities of Cel51A and Cel9D (10 each) on the four different hypothetical model cell-wall compositions, to investigate the effect of XG and GAX on their enzymatic degradation.
The model assumes (but does not represent) a microbial biofilm in a region below the section of cell wall, and at the start of each simulation the enzymes are placed in the biofilm area. Enzymes moved randomly using a collision detection method to detect the presence of other molecules which they bounced away from. If an enzyme encountered a target bond, and was not impeded by the presence of other molecules, it could bind and cleave the bond. An enzyme which reached the bounding box of the simulation environment was not reflected back but rather deemed to have irreversibly exited the simulation environment, and was repositioned back in the biofilm area (as a “replacement”).
Five simulations, each of 50 million iterations, were run for each of the model cell walls. Information on each simulation run was recorded in a text file, and included data on cleavage events (bond type and substrate), the formation of breakdown products (including DP, the types of branches and bonds in each product and the originating substrate) and the iteration number when an event occurred. The standard unix/linux utilities, grep and awk were used to extract information on breakdown products and enzyme activity events were analysed using Excel 2010 (Microsoft Corporation, Redmond, WA, USA), Matlab (The Mathworks, Natick, MA, USA) and Flexi [
20]. Statistical comparisons and estimates of confidence intervals and Least Significance Intervals were performed at a 5% level of significance.
The data produced by the model consisted of the times (in terms of iterations) when particular events, such as bond cleavage or formation of breakdown product, occurred. We compared the different model cell walls on the basis of how frequently these events occurred, and in particular by the recurrence time, the time taken for the next event to occur after an event has occurred. These will be distributed as independent Poisson distributions with rate parameter equal to the inverse of the current activity level. Dividing the recurrence time by the number of events gives independent nearest neighbour estimates for the activity level which is ascribed to the iteration at the centre of the interval. The activity levels were logged for analysis and entered into a mixed model, multi-dimensional smoothing programme. The time for 40 events to occur was used instead of the next event to occur to reduce the data set from over 82,000 values to fewer than 2000 values which was more manageable for the multidimensional smoothing programme. The multi-dimensional smoothing programme used the statistical model:
to consider enzyme behaviour, and
to consider breakdown products.
F and
G are arbitrary functions belonging to the space of continuous, first-differentiable functions. The multi-dimensional smoothing programme estimates the posterior probability distributions of
F and
G from the data, using the methods described by Upsdell [
20]. It then computes the mean and standard error of the value of the log (Activity) at any particular set of values for Wall, Enzyme, Target, Iteration derived from the posterior probability distribution of functions on this space-see [
20].
3. Results and Discussion
The structures of each of the four hypothetical model cell walls at the beginning of each simulation are shown in
Figure 1,
Figure 2,
Figure 3 and
Figure 4, along with the degraded structure for each after a simulation of Cel51A and Cel9D acting together on the cell wall. The duration of each simulation was 50 million model iterations, with each enzyme performing an action like moving, binding to an appropriate glycolytic bond, or being attached to a bond while degrading it. An animation of the degradation of a Low XG wall is available in the
Supplementary Material (Figure S1).
Figure 1.
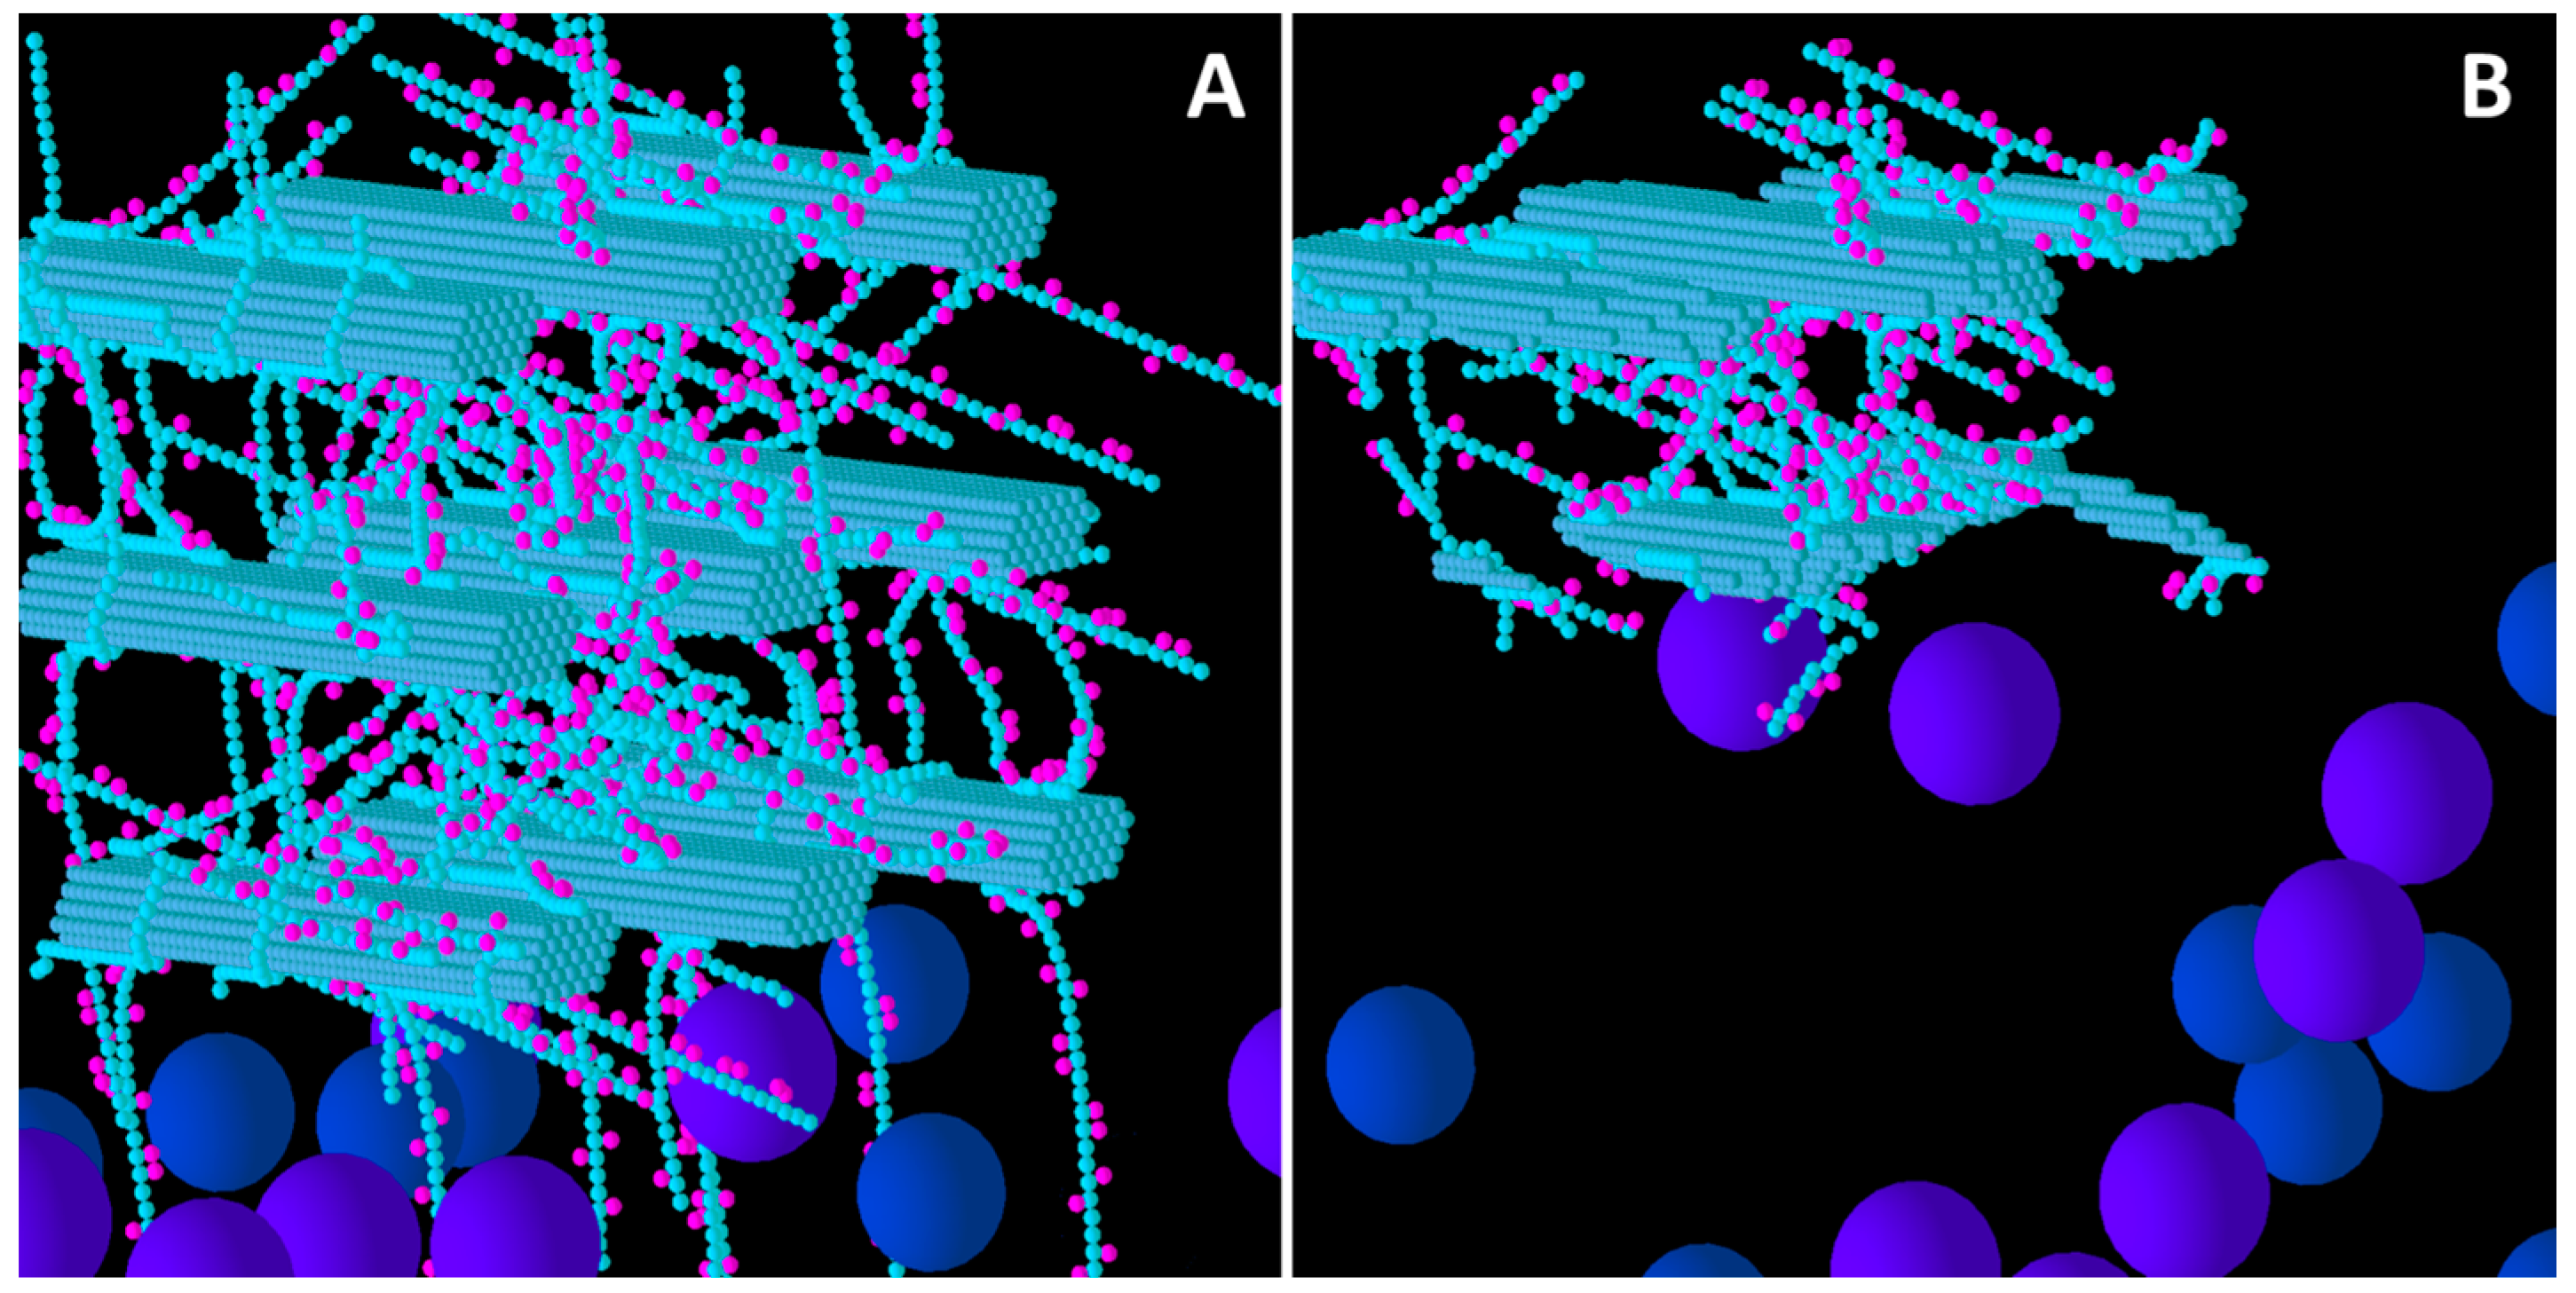
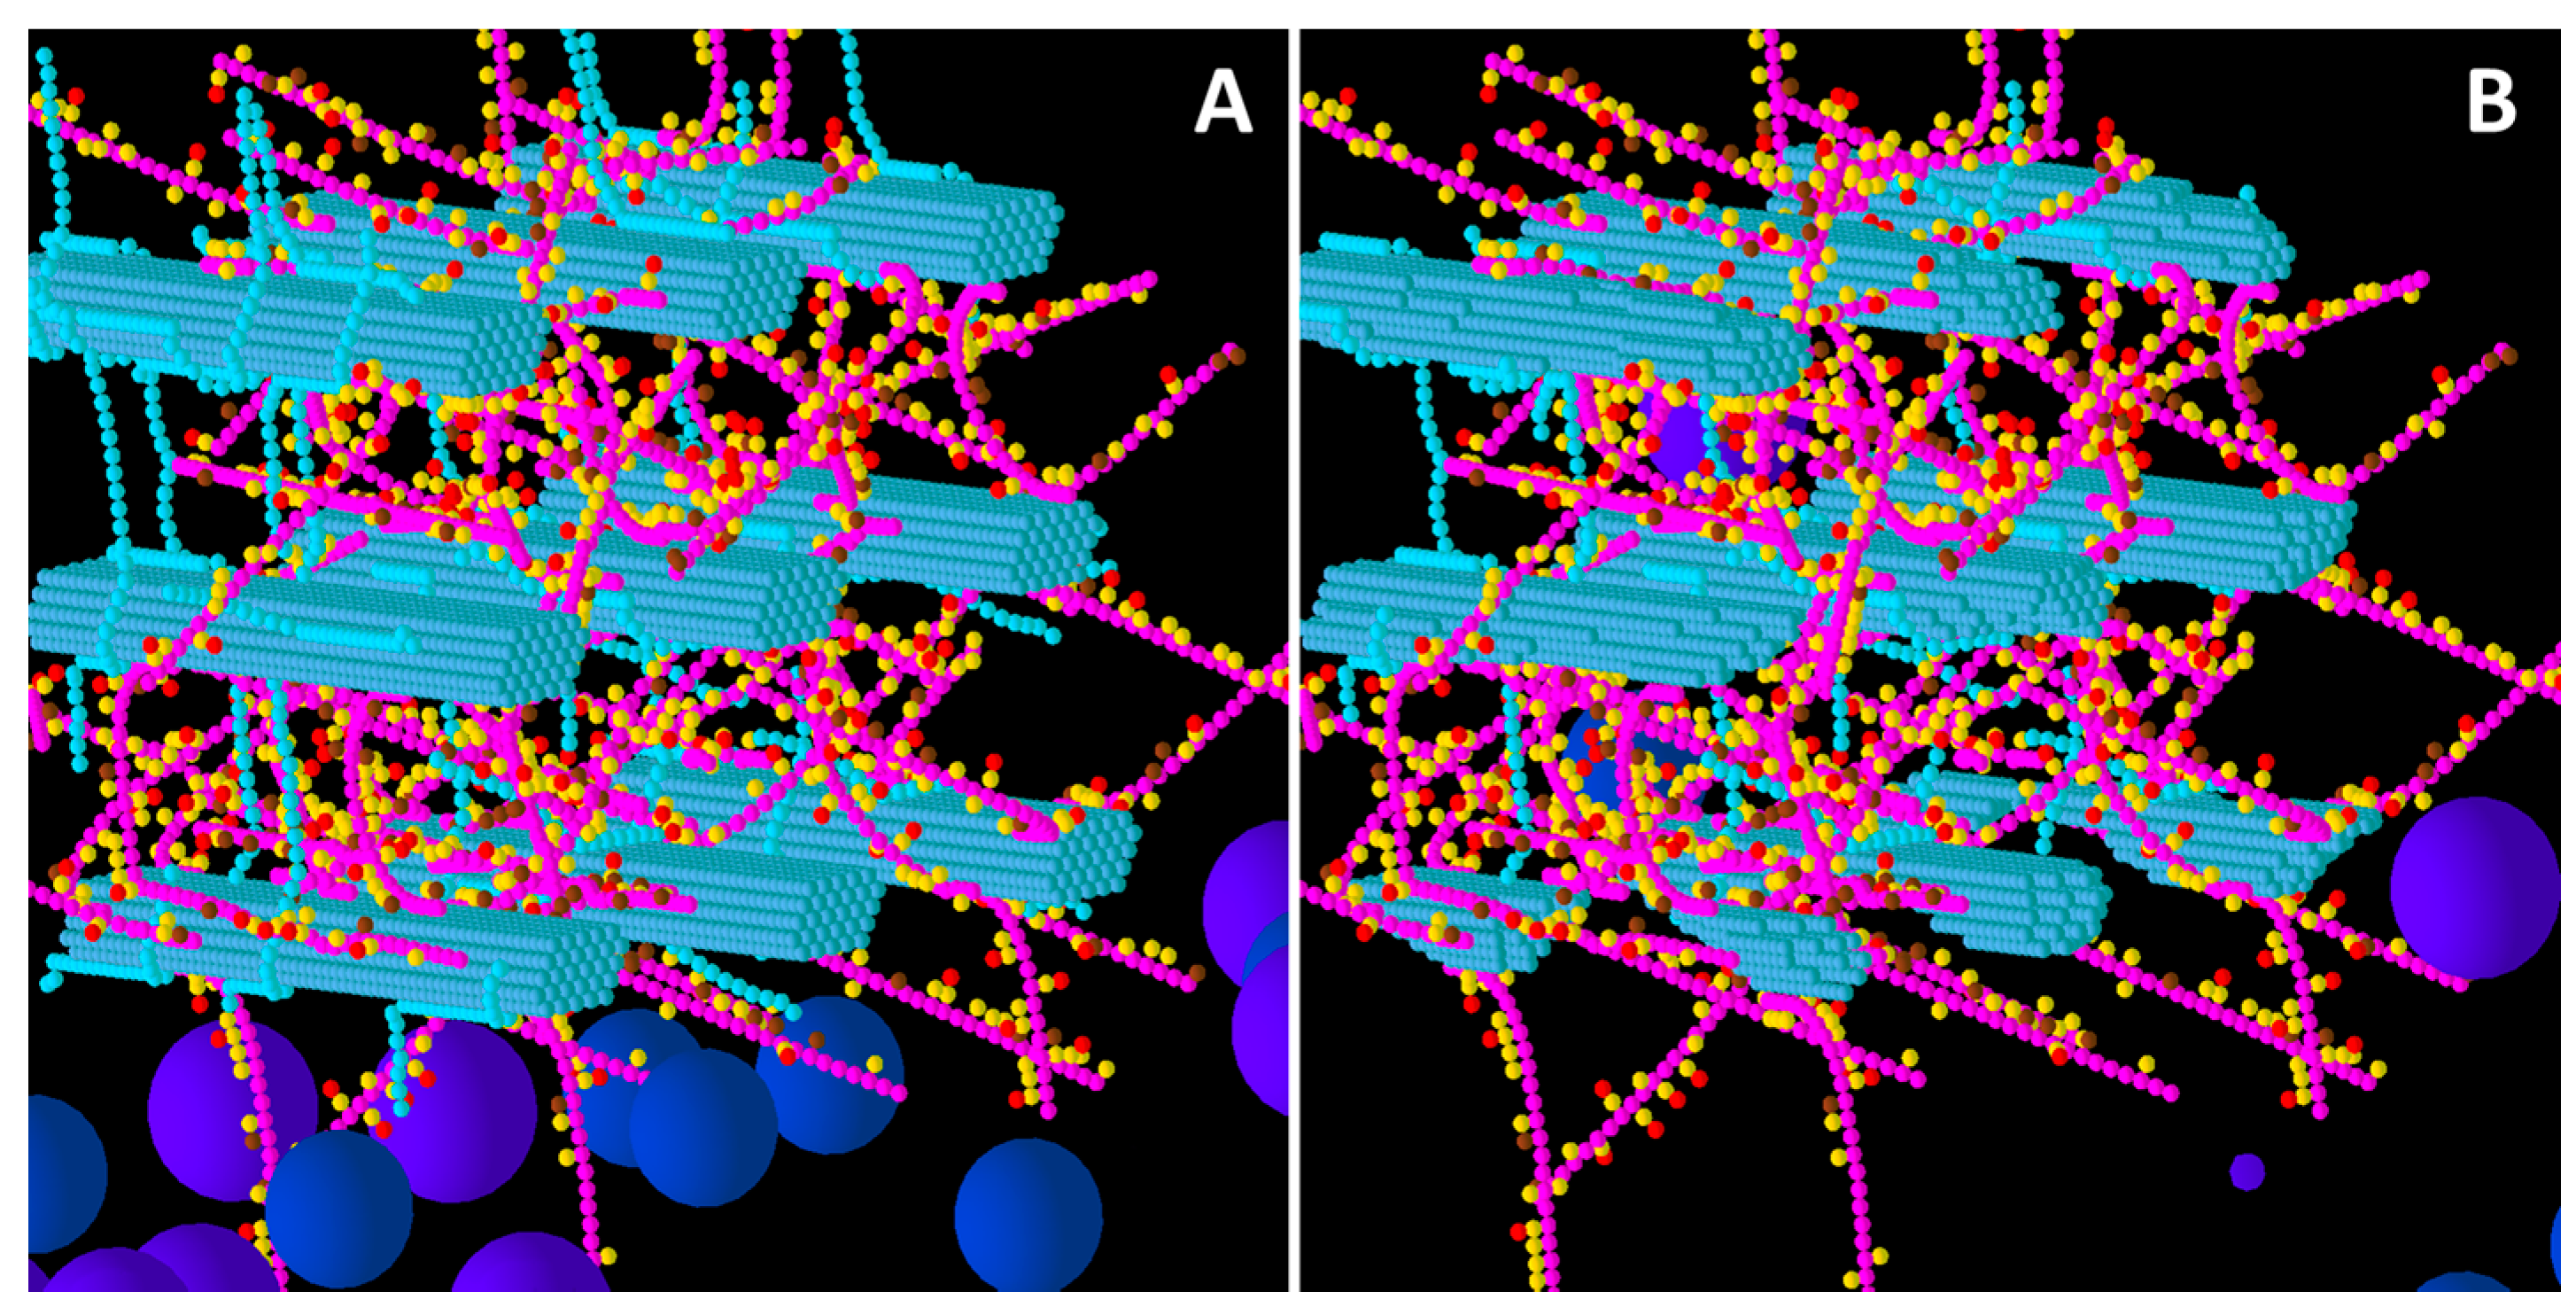
Initial structure of the Low glucuronoarabinoxylan (GAX) model cell wall (A) and the end result of its degradation after a simulation run (B). Glucose, xylose, arabinose, glucuronic acid and ferulic acid are represented by the smaller spheres coloured blue, magenta, yellow, brown and red respectively. Larger spheres represent Cel51A (purple) and Cel9D (blue). Enzymes shown in pane A are in their original positions, located in the hypothetical biofilm area. Some enzymes do not appear solid, because of incomplete graphics rendering due to resource limitation. The graphs are 3-D, and therefore enzymes at the far end of the simulation environment appear small due to the perspective of the graphs (e.g., pane B).
Figure 1.
Initial structure of the Low glucuronoarabinoxylan (GAX) model cell wall (A) and the end result of its degradation after a simulation run (B). Glucose, xylose, arabinose, glucuronic acid and ferulic acid are represented by the smaller spheres coloured blue, magenta, yellow, brown and red respectively. Larger spheres represent Cel51A (purple) and Cel9D (blue). Enzymes shown in pane A are in their original positions, located in the hypothetical biofilm area. Some enzymes do not appear solid, because of incomplete graphics rendering due to resource limitation. The graphs are 3-D, and therefore enzymes at the far end of the simulation environment appear small due to the perspective of the graphs (e.g., pane B).
From a visual assessment, most degradation of the Low GAX wall occurred in the region closest to the “biofilm area”, with the bottom CMFs being considerably degraded although reasonable sized remnants of these CMFs remained at the end of the simulation (
Figure 1). Outside surfaces of CMFs on the periphery of the wall were attacked more than the internal surfaces, especially in regions where there were no GAXs (which of course were impervious to cellulose attack), suggesting the presence of the GAX was presenting a physical barrier to enzyme degradation. Some of the degradation pattern on CMFs was consistent with progressive degradation along individual cellulose molecules until the attacking enzyme encountered a GAX which would prevent further attack (
Figure 1).
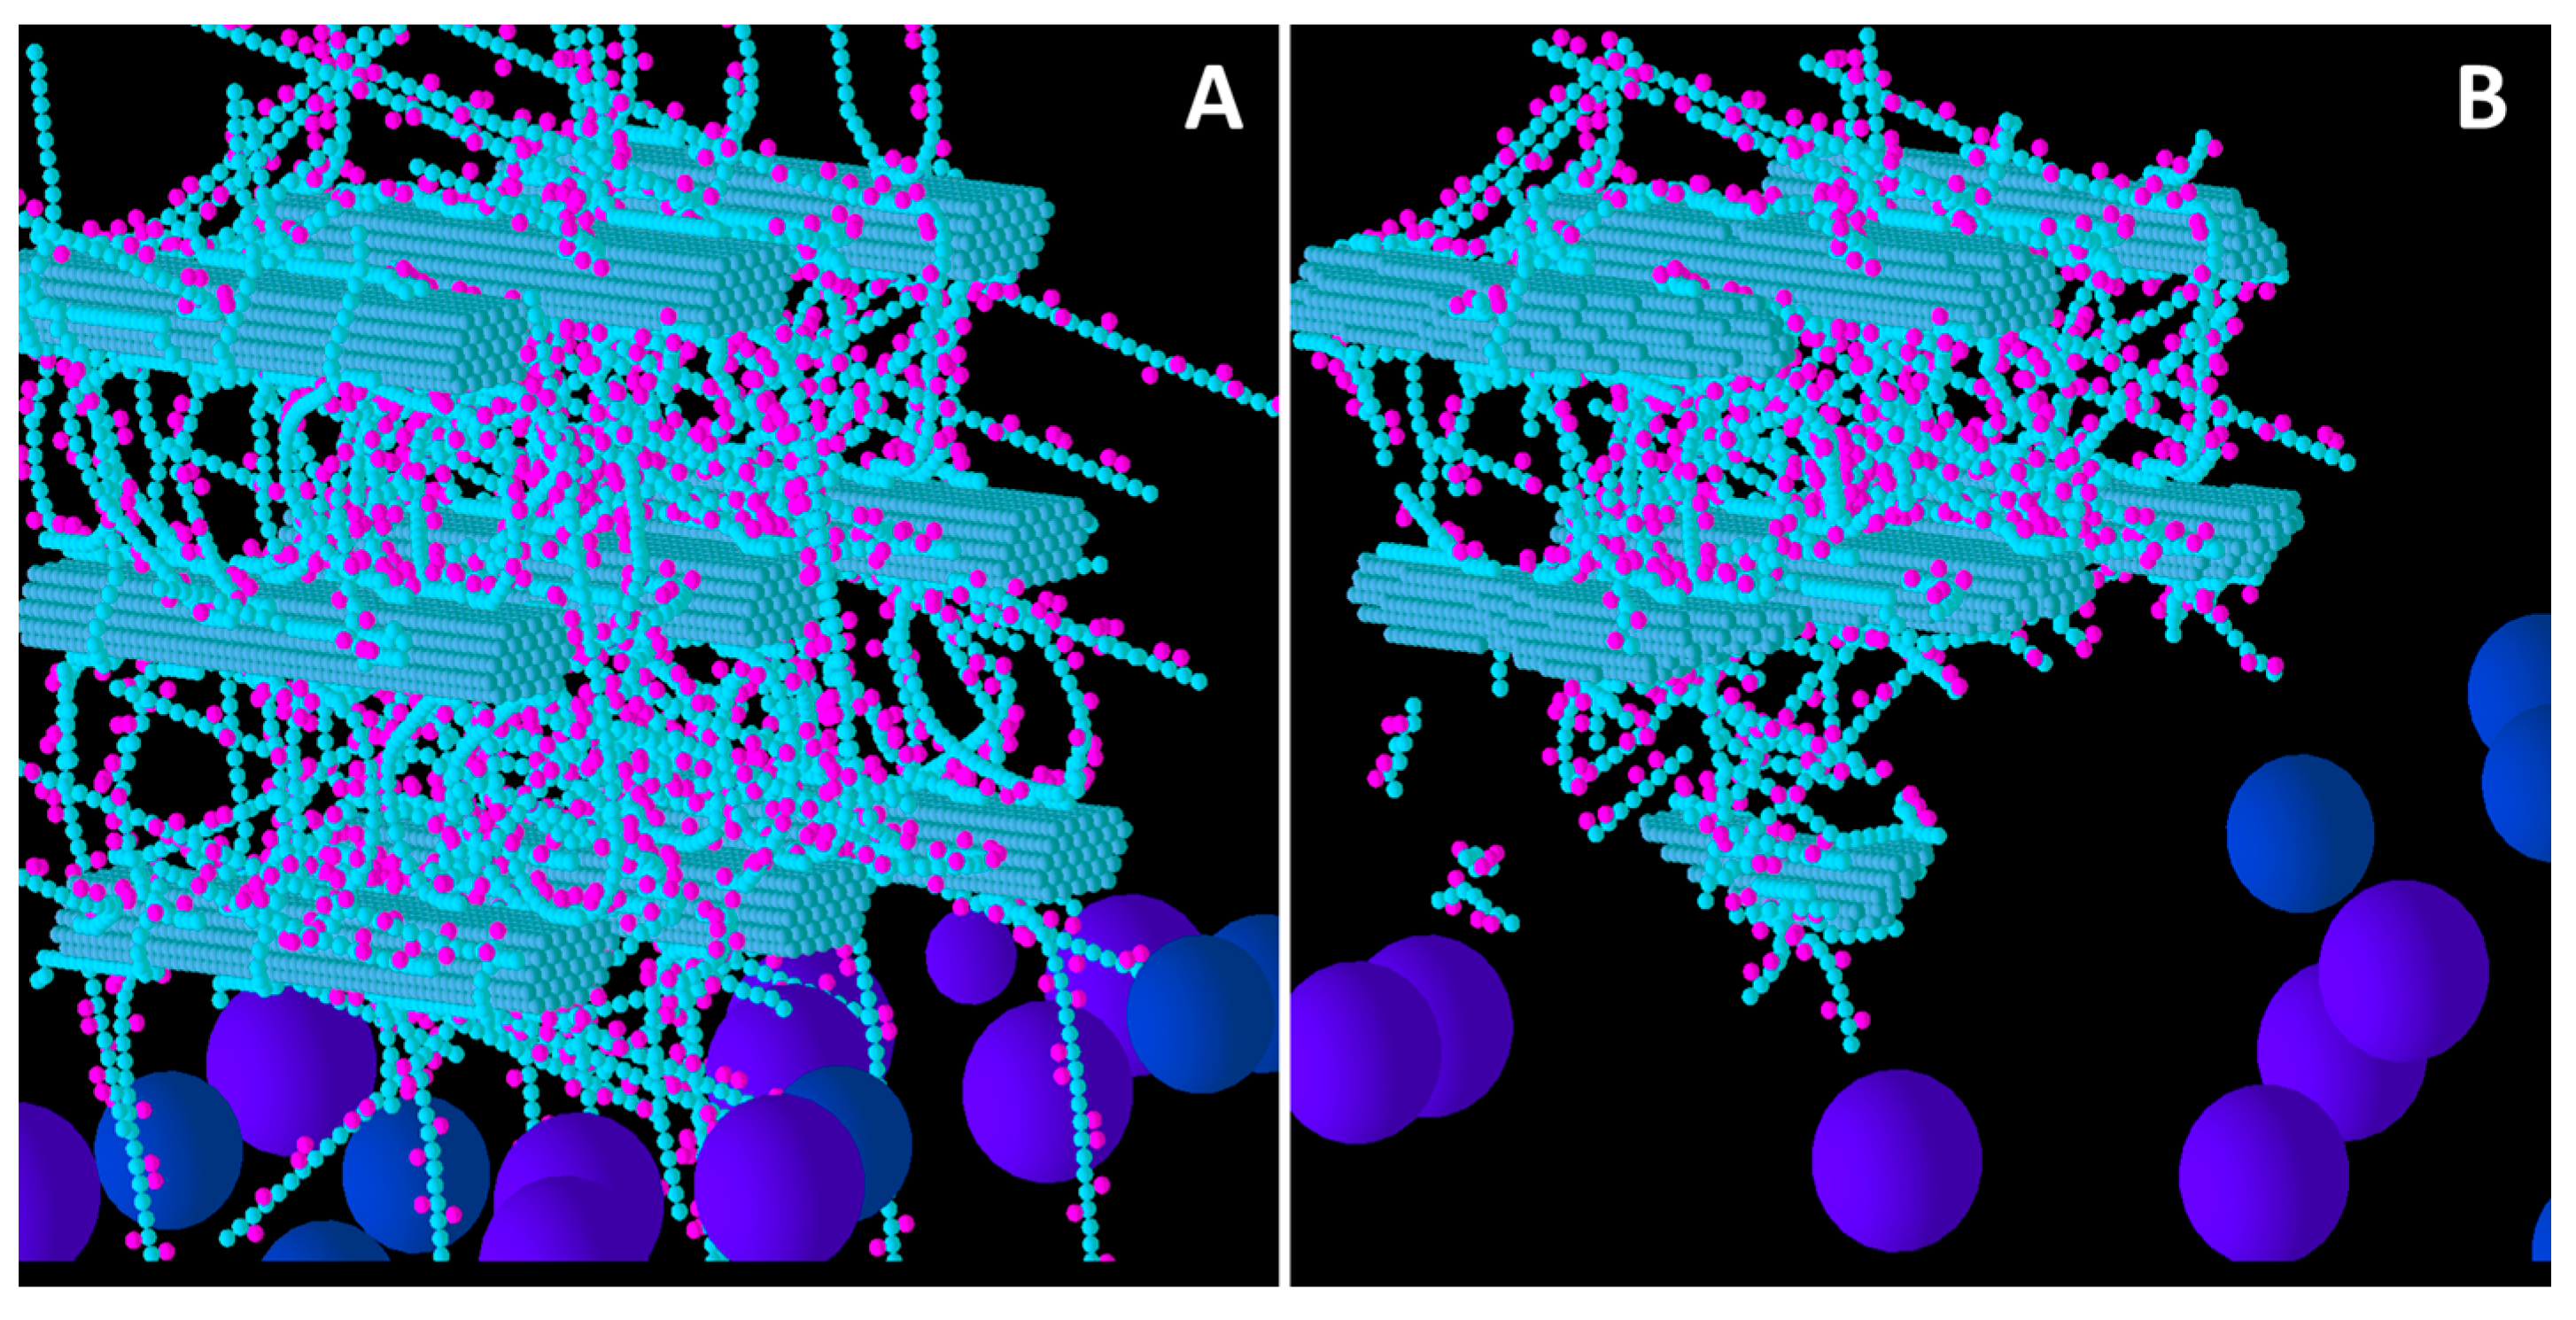
Figure 2 shows the before and after structures for the Low XG wall. Comparing this with
Figure 1, it is evident that the Low XG wall was considerably more degraded than the Low GAX wall, and experienced complete disintegration of the lowest row of CMFs (nearest the biofilm area) and their associated GAX and (1,3;1,4)-β-glucans. The second row of CMFs was extensively eroded, with the loss of XG due to catalytic action allowing enzymes easier access to the CMFs than in Low GAX, and in this row, the central CMF were left more intact that the outside CMFs which provided temporary shielding. This pattern of degradation was repeated in the top row of CMFs, but to a lesser extent. The video of the degradation of a Low XG wall (
Figure S1) shows the progression and pattern of attack.
Figure 2.
Initial structure of the Low xyloglucan (XG) model cell wall (A) and the end result of its degradation after a simulation run (B). Glucose and xylose are represented by the smaller spheres coloured blue and magenta, respectively. Larger spheres represent Cel51A (purple) and Cel9D (blue). Enzymes shown in pane A are in their original positions, located in the hypothetical biofilm area.
Comparing
Figure 1 and
Figure 2 also shows that distribution of degradation activity was more uniformly spread in the Low GAX wall than the Low XG wall, and this is most likely because the barrier presented to cellulases by GAX in the Low GAX wall caused more diffusion of the enzymes than in the Low XG wall.
We do not know the susceptibilities of the two cellulases we used in our simulations to competitive inhibition by GAXs or xylooligosaccharides that have been suggested [
11,
12,
13,
14,
15], but neither of them is a cellobiohydrolase, the type most susceptible to such inhibition. We therefore did not attempt to model such inhibition. However, we still observed a decrease in activity of the cellulases on cellulose with time, in the presence of hemicelluloses, indicating that competitive inhibition is not required to explain this decrease. In our simulations, a small number of XGs reduced the activity of cellulases purely by presenting a barrier around much larger quantities of CMF, with the degradation rate decreasing as easily accessible parts of the CMFs were broken down.
Figure 3.
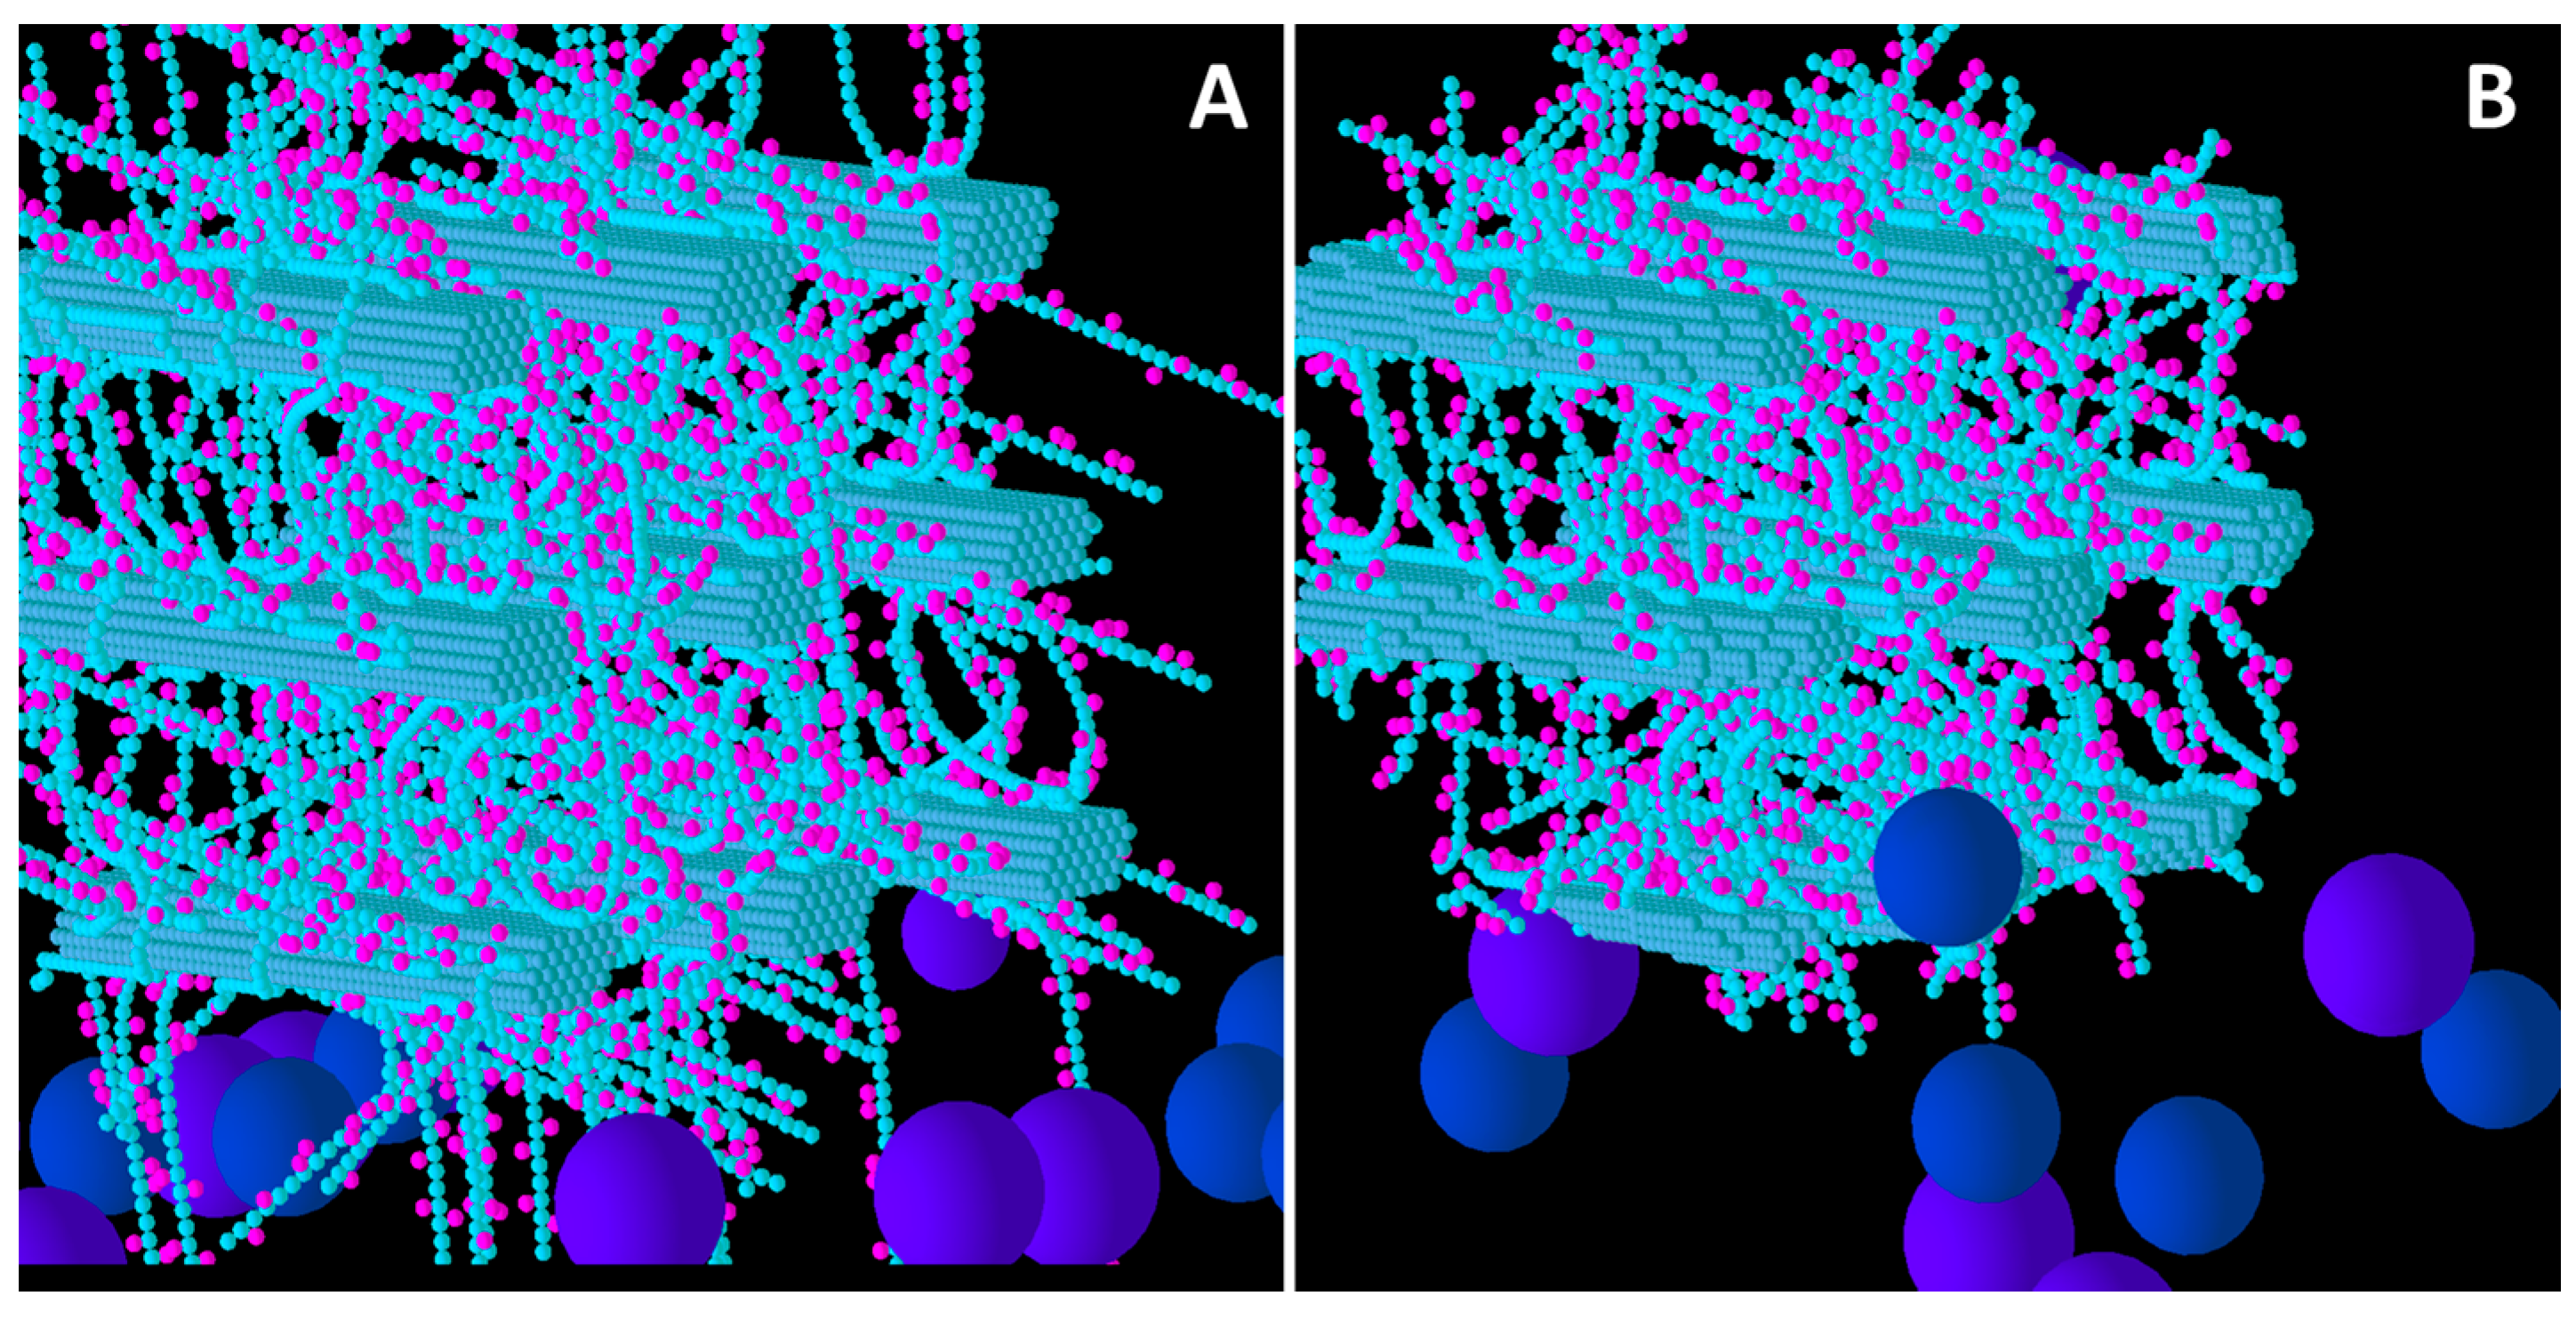
Initial structure of the Medium XG model cell wall (A) and the end result of its degradation after a simulation run (B). Glucose and xylose are represented by the smaller spheres coloured blue and magenta, respectively. Larger spheres coloured purple and blue represent Cel51A, and Cel9D, respectively. Enzymes shown in pane A are in their original positions, located in the hypothetical biofilm area.
Figure 3.
Initial structure of the Medium XG model cell wall (A) and the end result of its degradation after a simulation run (B). Glucose and xylose are represented by the smaller spheres coloured blue and magenta, respectively. Larger spheres coloured purple and blue represent Cel51A, and Cel9D, respectively. Enzymes shown in pane A are in their original positions, located in the hypothetical biofilm area.
Figure 4.
Initial structure of the High XG model cell wall (A) and the end result of its degradation after a simulation run (B). Glucose and xylose are represented by the smaller spheres coloured blue and magenta, respectively. Larger spheres coloured purple and blue represent Cel51A, and Cel9D, respectively. Enzymes shown in pane A are in their original positions, located in the hypothetical biofilm area.
Comparison of Low, Medium and High XG (
Figure 2,
Figure 3 and
Figure 4) shows that as the initial XG density increased, the level of degradation of CMFs decreased. Additionally, the spatial pattern of degradation changed, with degradation becoming more concentrated on the outer parts of the wall (where the spatial distribution of XG was sparse) relative to the centre of the wall, as XG concentration increased. Thus, the penetration of enzymes between the CMFs decreased, as did the extent to which catalytic activity occurred in these regions, suggesting that XG was presenting an accessibility barrier to the enzymes, despite it being a target of cellulase attack. Indeed, as XG concentration increased, the pattern of CMF degradation became closer to that in the Low GAX wall.
The density of hemicelluloses was greatest in the middle section of the walls, for all four model walls. Enzymes did not readily penetrate the denser areas, as is apparent from the degradation patterns of the Low GAX, and Medium and High XG walls. Although not evident in
Figure 2, this was also the case for the Low XG wall, as can be seen by viewing the
Supplementary S1. Cel51A has a diameter of 20.4 r
g (7.5 nm) and Cel9D a diameter of 17.7 r
g (6.5 nm) [
16]. This puts an upper limit of 6.5 nm for pore size in the centres of the walls, but no lower limit. Mean pore size for cell walls from a range of forage crops varied from about 2.4 to 3.0 nm [
21]; these natural cell walls would have been denser than our composite walls. An analysis of the extent to which different polysaccharides were degraded over time (iteration) was performed for each wall and is presented graphically in
Figure 5.
Figure 5.
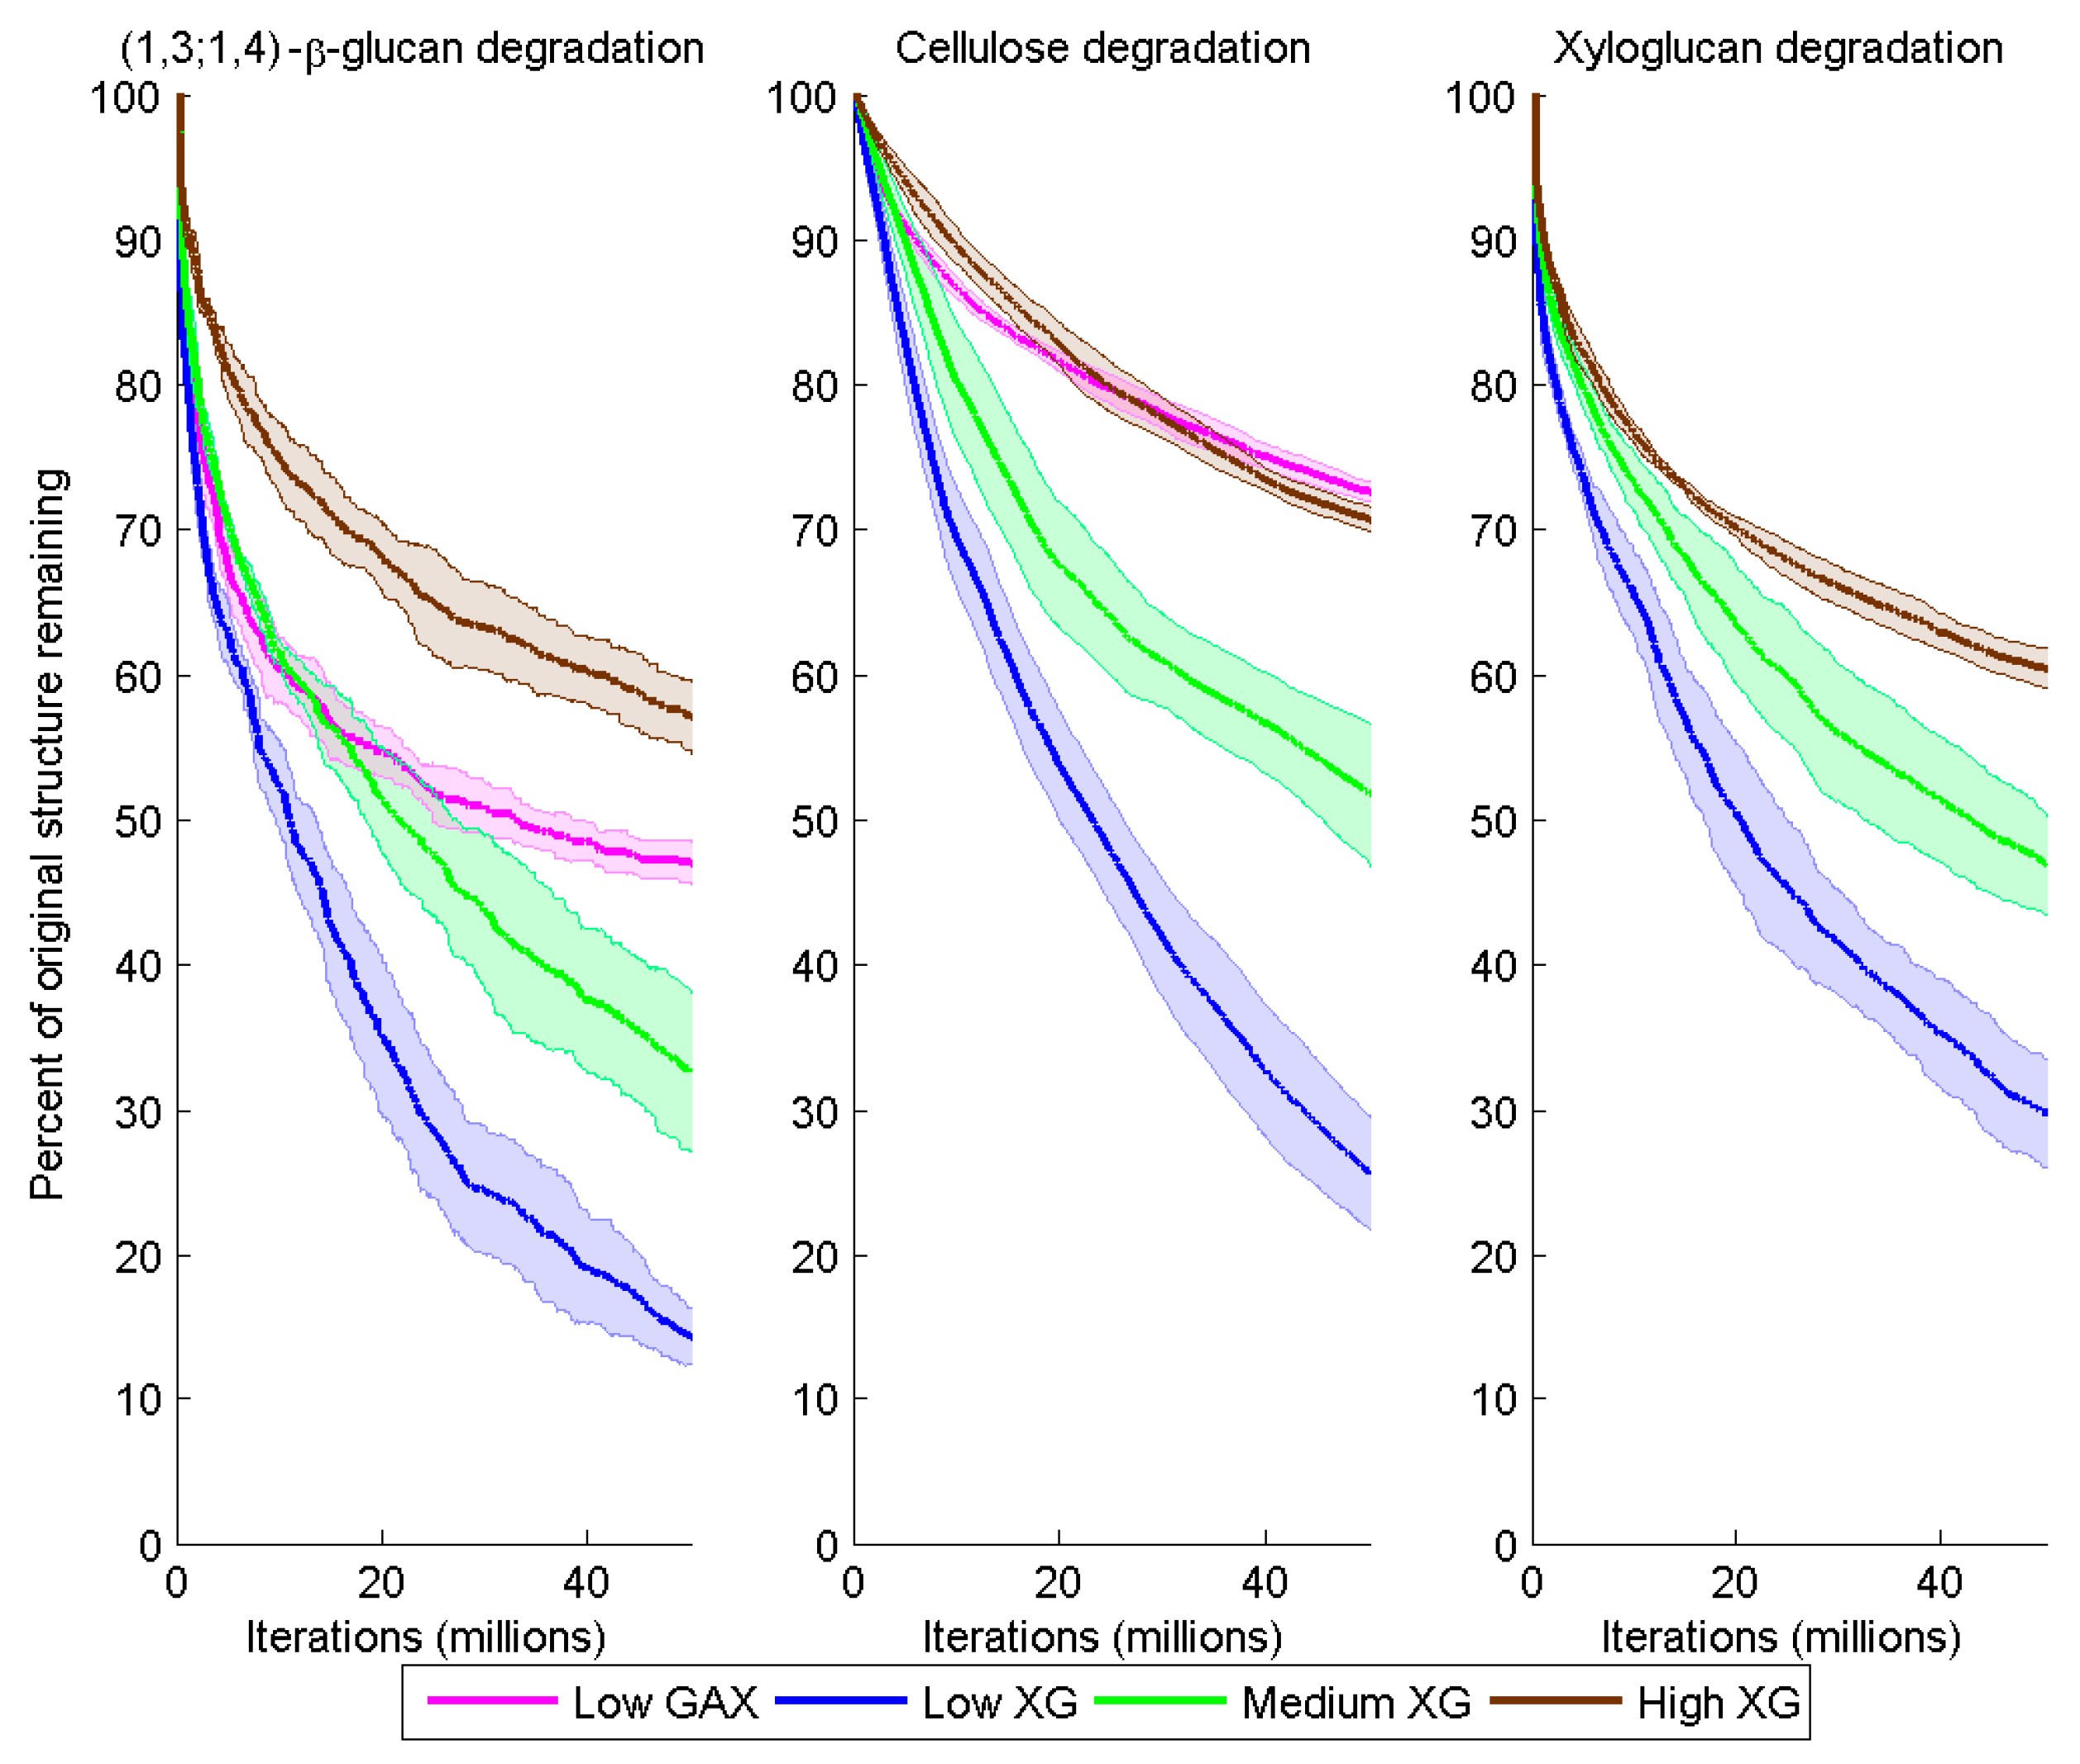
Degradation of (1,3;1,4)-β-glucan, cellulose and XG over time (iteration) for the different model cell walls as a consequence of combined Cel51A and Cel9D activity. Degradation is shown as the number of backbone glycosyl residues remaining expressed as a percent of the initial number, calculated as a mean (solid line) and 95% confidence band (shaded region) from five replicate simulations per wall.
Figure 5.
Degradation of (1,3;1,4)-β-glucan, cellulose and XG over time (iteration) for the different model cell walls as a consequence of combined Cel51A and Cel9D activity. Degradation is shown as the number of backbone glycosyl residues remaining expressed as a percent of the initial number, calculated as a mean (solid line) and 95% confidence band (shaded region) from five replicate simulations per wall.
Degradation of the CMFs and (1,3;1,4)-β-glucan was significantly higher in Low XG (about 75% and 84% loss by the end of the simulation, respectively) than in Low GAX (18% and 53% loss) (
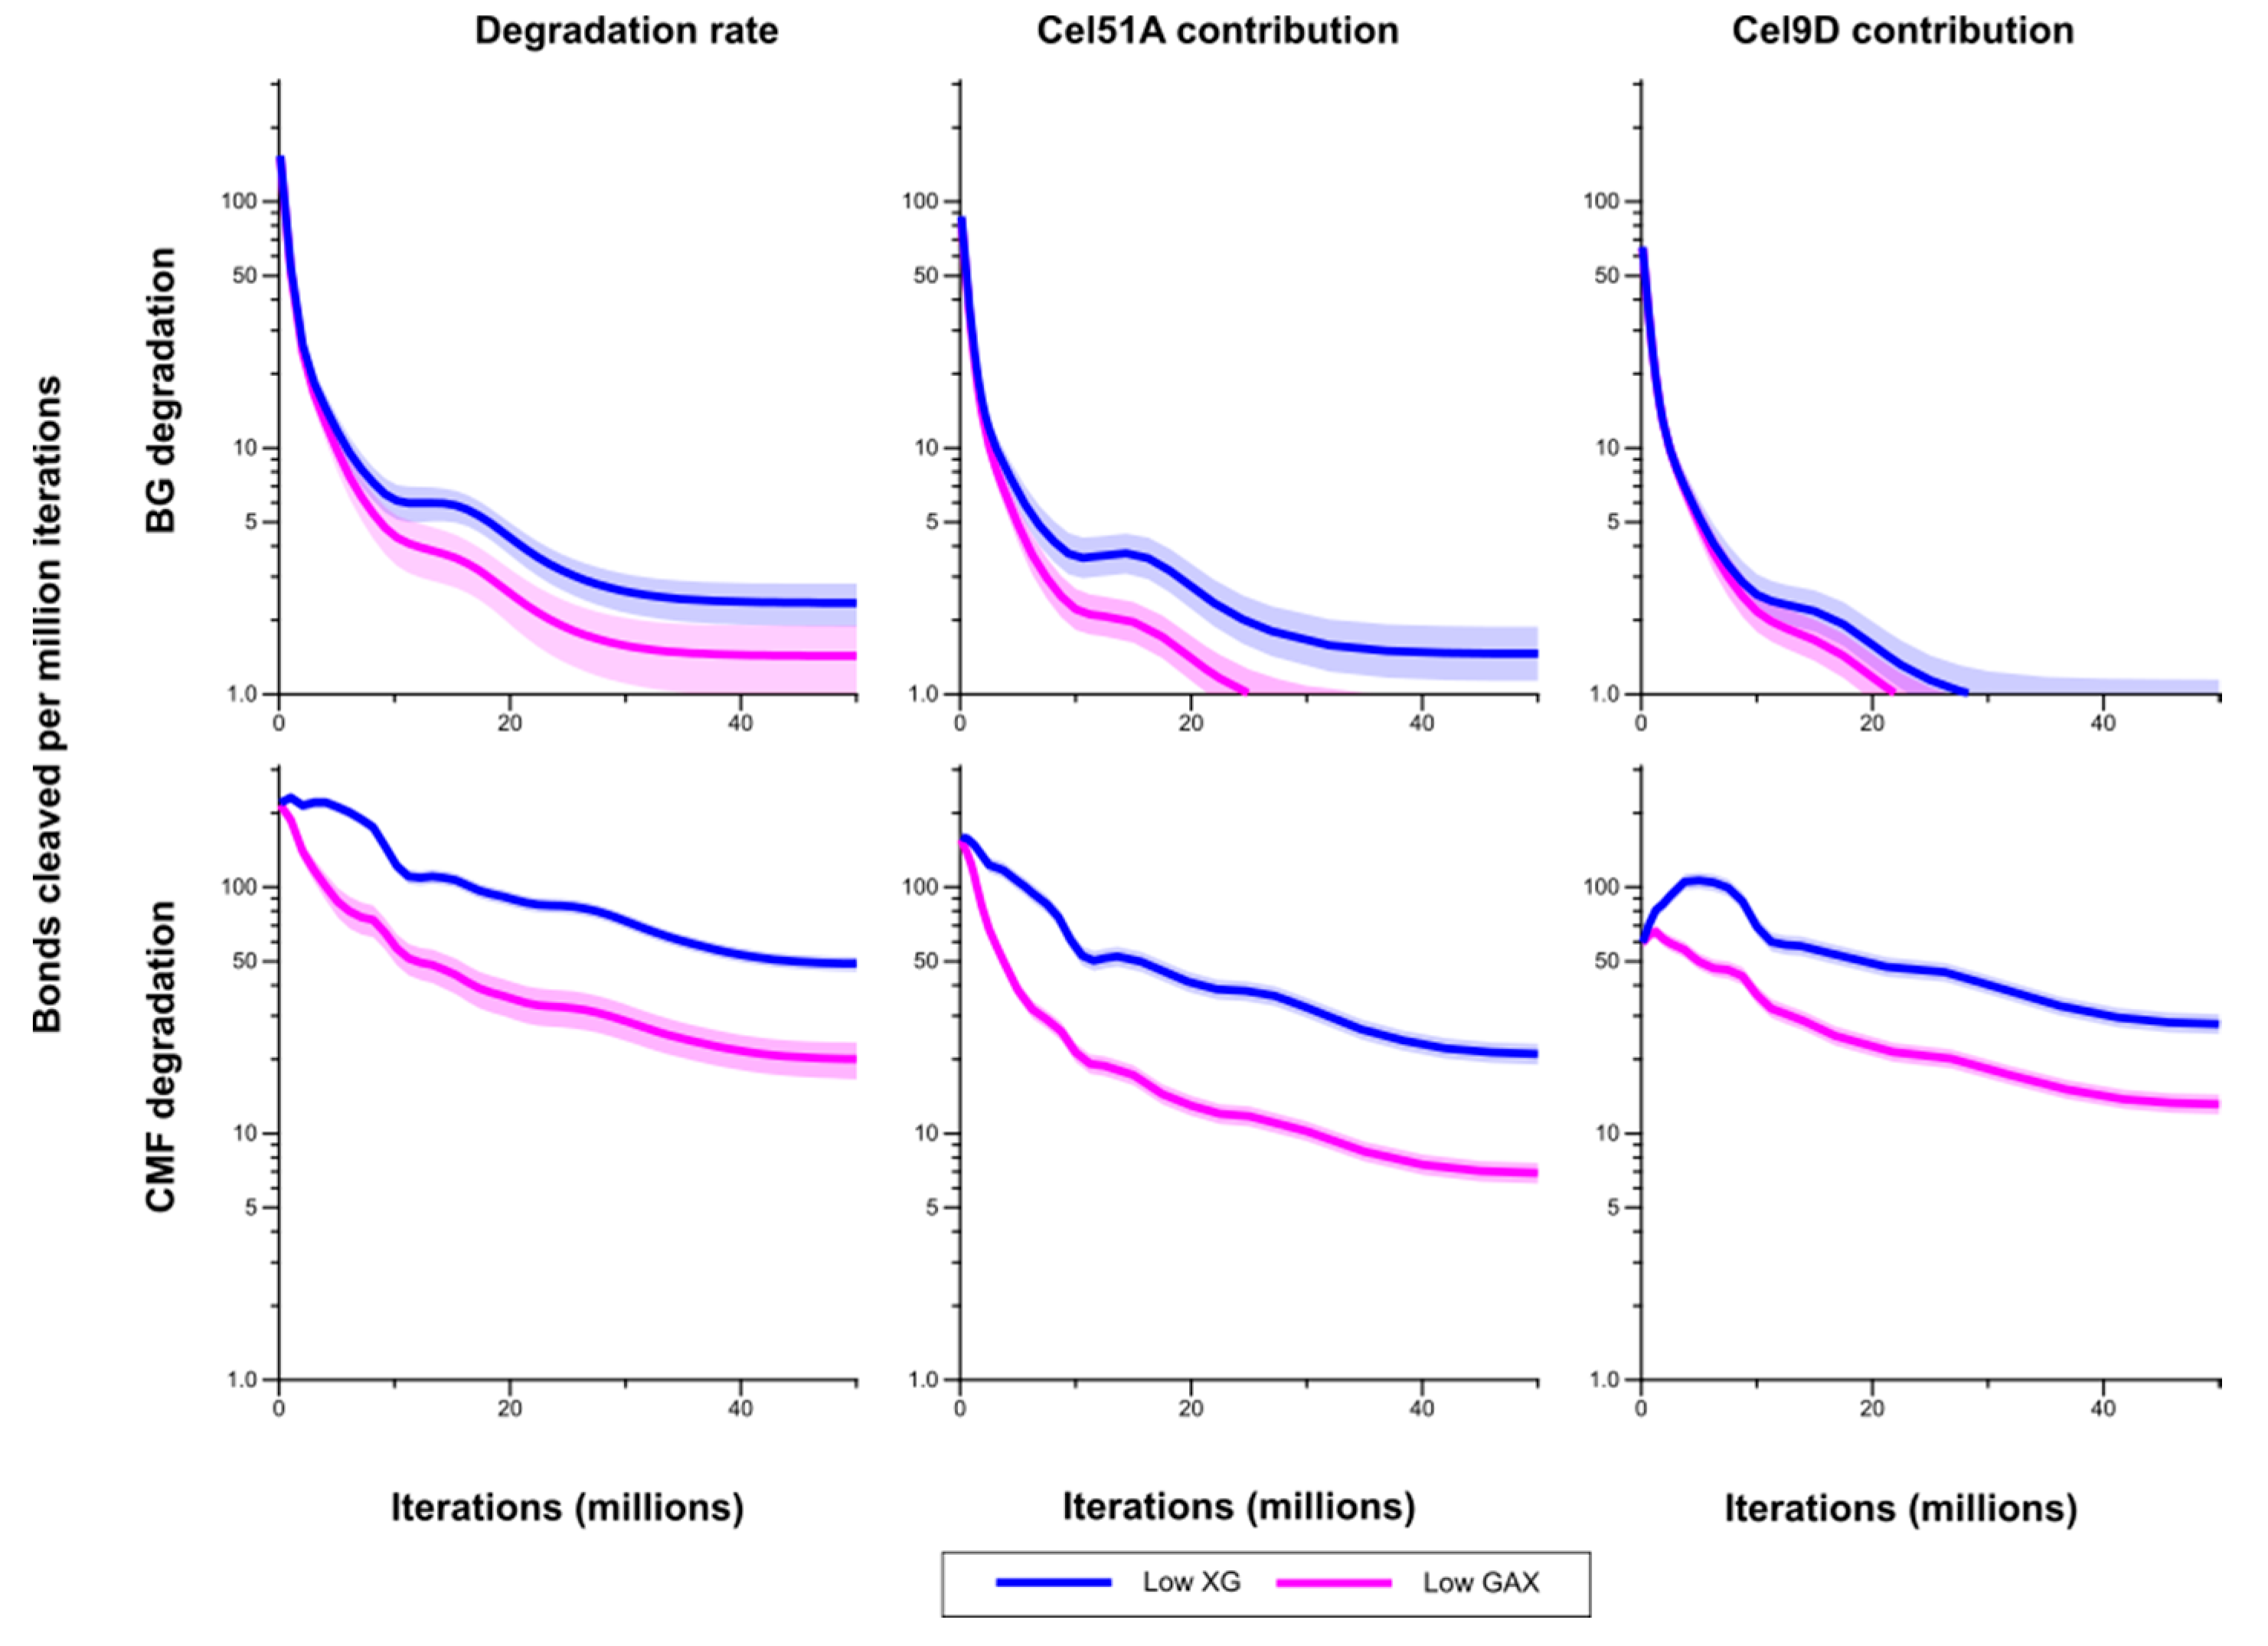
Figure 5). Correspondingly bond cleavage rate in CMF was significantly higher in Low XG compared with Low GAX (
Figure 6). This pattern held when looking at the individual contributions of Cel51A and Cel9D to this degradation. As expected, the bond cleavage rate in (1,3;1,4)-β-glucan was higher in Low XG compared with Low GAX, but was significantly so only during the middle of the simulation period (
Figure 6). Bond cleavage rate in (1,3;1,4)-β-glucan by Cel51A was significantly higher in Low XG cell than in Low GAX. Although the bond cleavage rate in (1,3;1,4)-β-glucan by Cel9D was higher in Low XG than in Low GAX, this difference was not significant. It appears that in Low GAX, the GAX provided significant protection to CMFs and (1,3;1,4)-β-glucan; thus degradation mainly affected accessible bonds and declined as these were depleted.
Figure 6.
Bond cleavage rate in (1,3;1,4)-β-glucan (BG) and cellulose microfibrils (CMF) for Low XG and Low GAX cell walls, and the contributions of Cel51A and Cel9D to degradation of these polysaccharides. The shaded region represents a 95% Least Significance Interval so that the two curves are significantly different from each other at the 5% level where they do not overlap. The solid line in the middle indicates the mean.
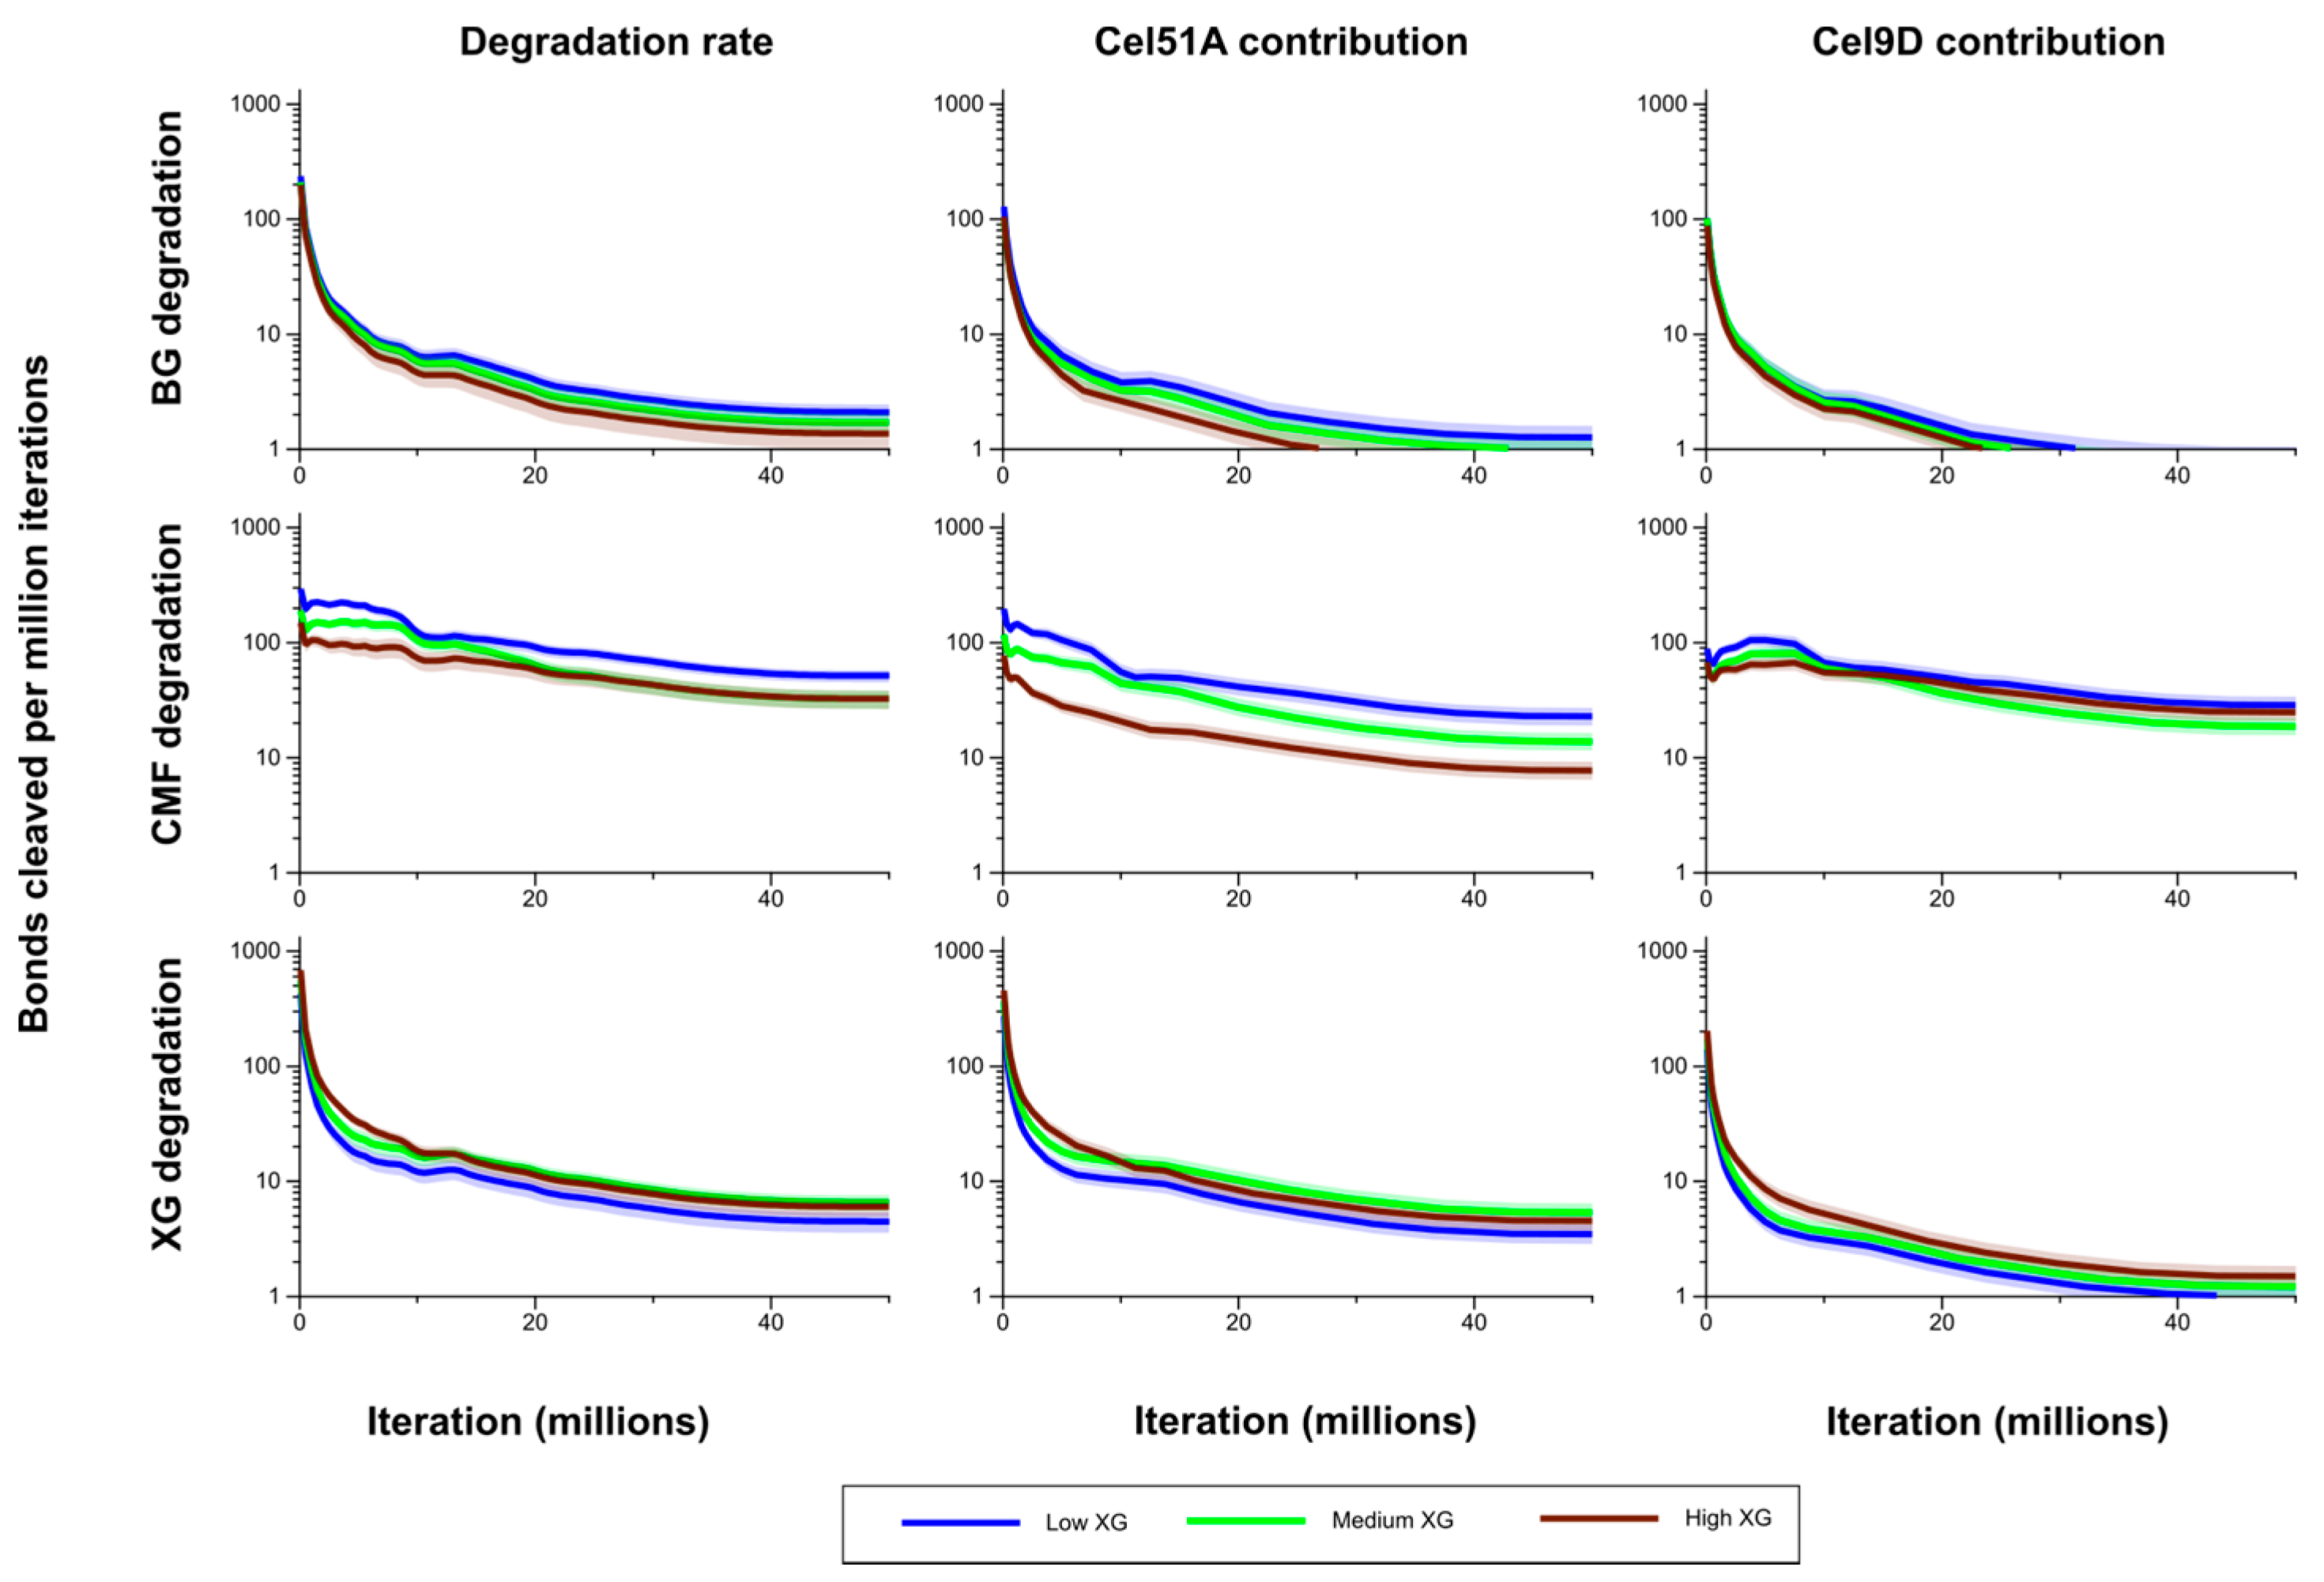
Degradation of the CMFs and (1,3;1,4)-β-glucans decreased with increased XG content of the model cell walls. By the end of the simulations, in the Medium XG wall, the remaining CMF and (1,3;1,4)-β-glucan content was 2.0 and 2.3 times greater, respectively, than in the Low XG wall; and in the High XG wall, 2.8 and 4.0 times greater, respectively (
Figure 5). Bond cleavage rate in CMF in the Medium XG wall was initially intermediate to (and significantly different from) that in the Low and High XG walls, but during the period from 10 to 20 million iterations was not significantly different from that of the Low XG wall. After 20 million iterations, the bond cleavage rate in CMF in the Medium XG wall was indistinguishable from that of the High XG wall (
Figure 7). The contribution of Cel51A to bond cleavage in CMF was higher (mostly significantly) in the Low XG wall than in the Medium XG wall, and was significantly (
p > 0.05) higher in both of these walls than in the High XG wall (
Figure 7).
The bond cleavage rate in the (1,3;1,4)-β-glucans was consistently higher in the Low XG wall than the Medium XG wall, and in the Medium XG wall then the High XG wall, but not significantly so. There was a significant difference in this rate between the Low and High XG walls after about 15 million iterations. Similar patterns were seen for Cel51A contribution to bond cleavage rate in the (1,3;1,4)-β-glucans, but those differences were significant only when comparing the Low-XG and High-XG walls. Interestingly, the contribution of Cel9D to bond cleavage rate in the (1,3;1,4)-β-glucans showed little difference between the Low-, Medium- and High XG walls, and generally was not significantly different in the CMFs in the Low and High XG walls (although its contribution in the Low XG wall was consistently higher and significantly so in the early stages of the simulation). The contribution of Cel9D to bond cleavage rate in the CMFs was higher in the Medium XG wall than the High XG wall early in the simulation and then became lower (although these differences were not significant) (
Figure 7).
Figure 7.
Bond cleavage rate in the (1,3;1,4)-β-glucans (BG), CMFs and XG for the model Low, Medium and High XG walls, and the contributions of Cel51A and Cel9D to this degradation. The shaded region represents a 95% Least Significant Interval so that any two of the three curves are significantly different at the 5% level where their bands do not overlap. The solid line in the middle indicates the mean value.
At the end of the simulation, 70%, 53% and 40% of the initial XG contents of the Low, Medium and High XG walls, respectively, had been degraded (
Figure 5). Although bond cleavage rate is influenced by the availability of substrate, it did not have a straightforward linear relationship with XG content. The cleavage rate of bonds in XG was higher in the High XG than the Low XG wall, with these differences being significant only in the early part of the simulation period. The bond cleavage rate in XG in the Medium XG wall was initially significantly lower than in the High XG wall, but became higher for most of the simulation (though not significantly so), and was higher than in the Low XG wall (but only significantly so for the latter half of the simulation period) (see
Figure 7). The contribution of Cel51A to bond cleavage rate in XG was lowest in the Low XG walls, and significantly lower than in the Medium XG walls. The contribution of Cel51A to bond cleavage rate in XG in High XG walls was generally intermediate to (and not significantly different from) the Low- and Medium XG walls, except early on in the simulations when it was significantly higher than both. As one might expect, the contribution of Cel9D to bond cleavage rate in XG increased with XG content, but was significantly higher in the High XG wall compared with Low and Medium XG walls only in the initial stages of the simulations (with significance of these differences disappearing during the course of the simulations), and was not significantly different between the Low and Medium XG walls.
Figure 8.
Breakdown products (monosaccharides and oligosaccharides) over time (iterations) for Low GAX and Low XG walls, showing rate of formation of products by degree of polymerisation (DP) from (1,3;1,4)-β-glucan (BG) and CMF. The shaded region represents a 95% Least Significant Interval so that the two curves are significantly different at the 5% level where the bands do not overlap. The solid line in the middle indicates the mean value.
The breakdown products of the enzymatic degradation, classified by DP from 1 to 6 are shown in
Figure 8. Levels of CMF breakdown products from the Low XG wall were significantly higher than from the Low GAX wall, except for early in the simulation which may be a result of competitive inhibition by XG. Rates of formation of breakdown products from the (1,3;1,4)-β-glucans were not significantly different between the Low XG and Low GAX walls.
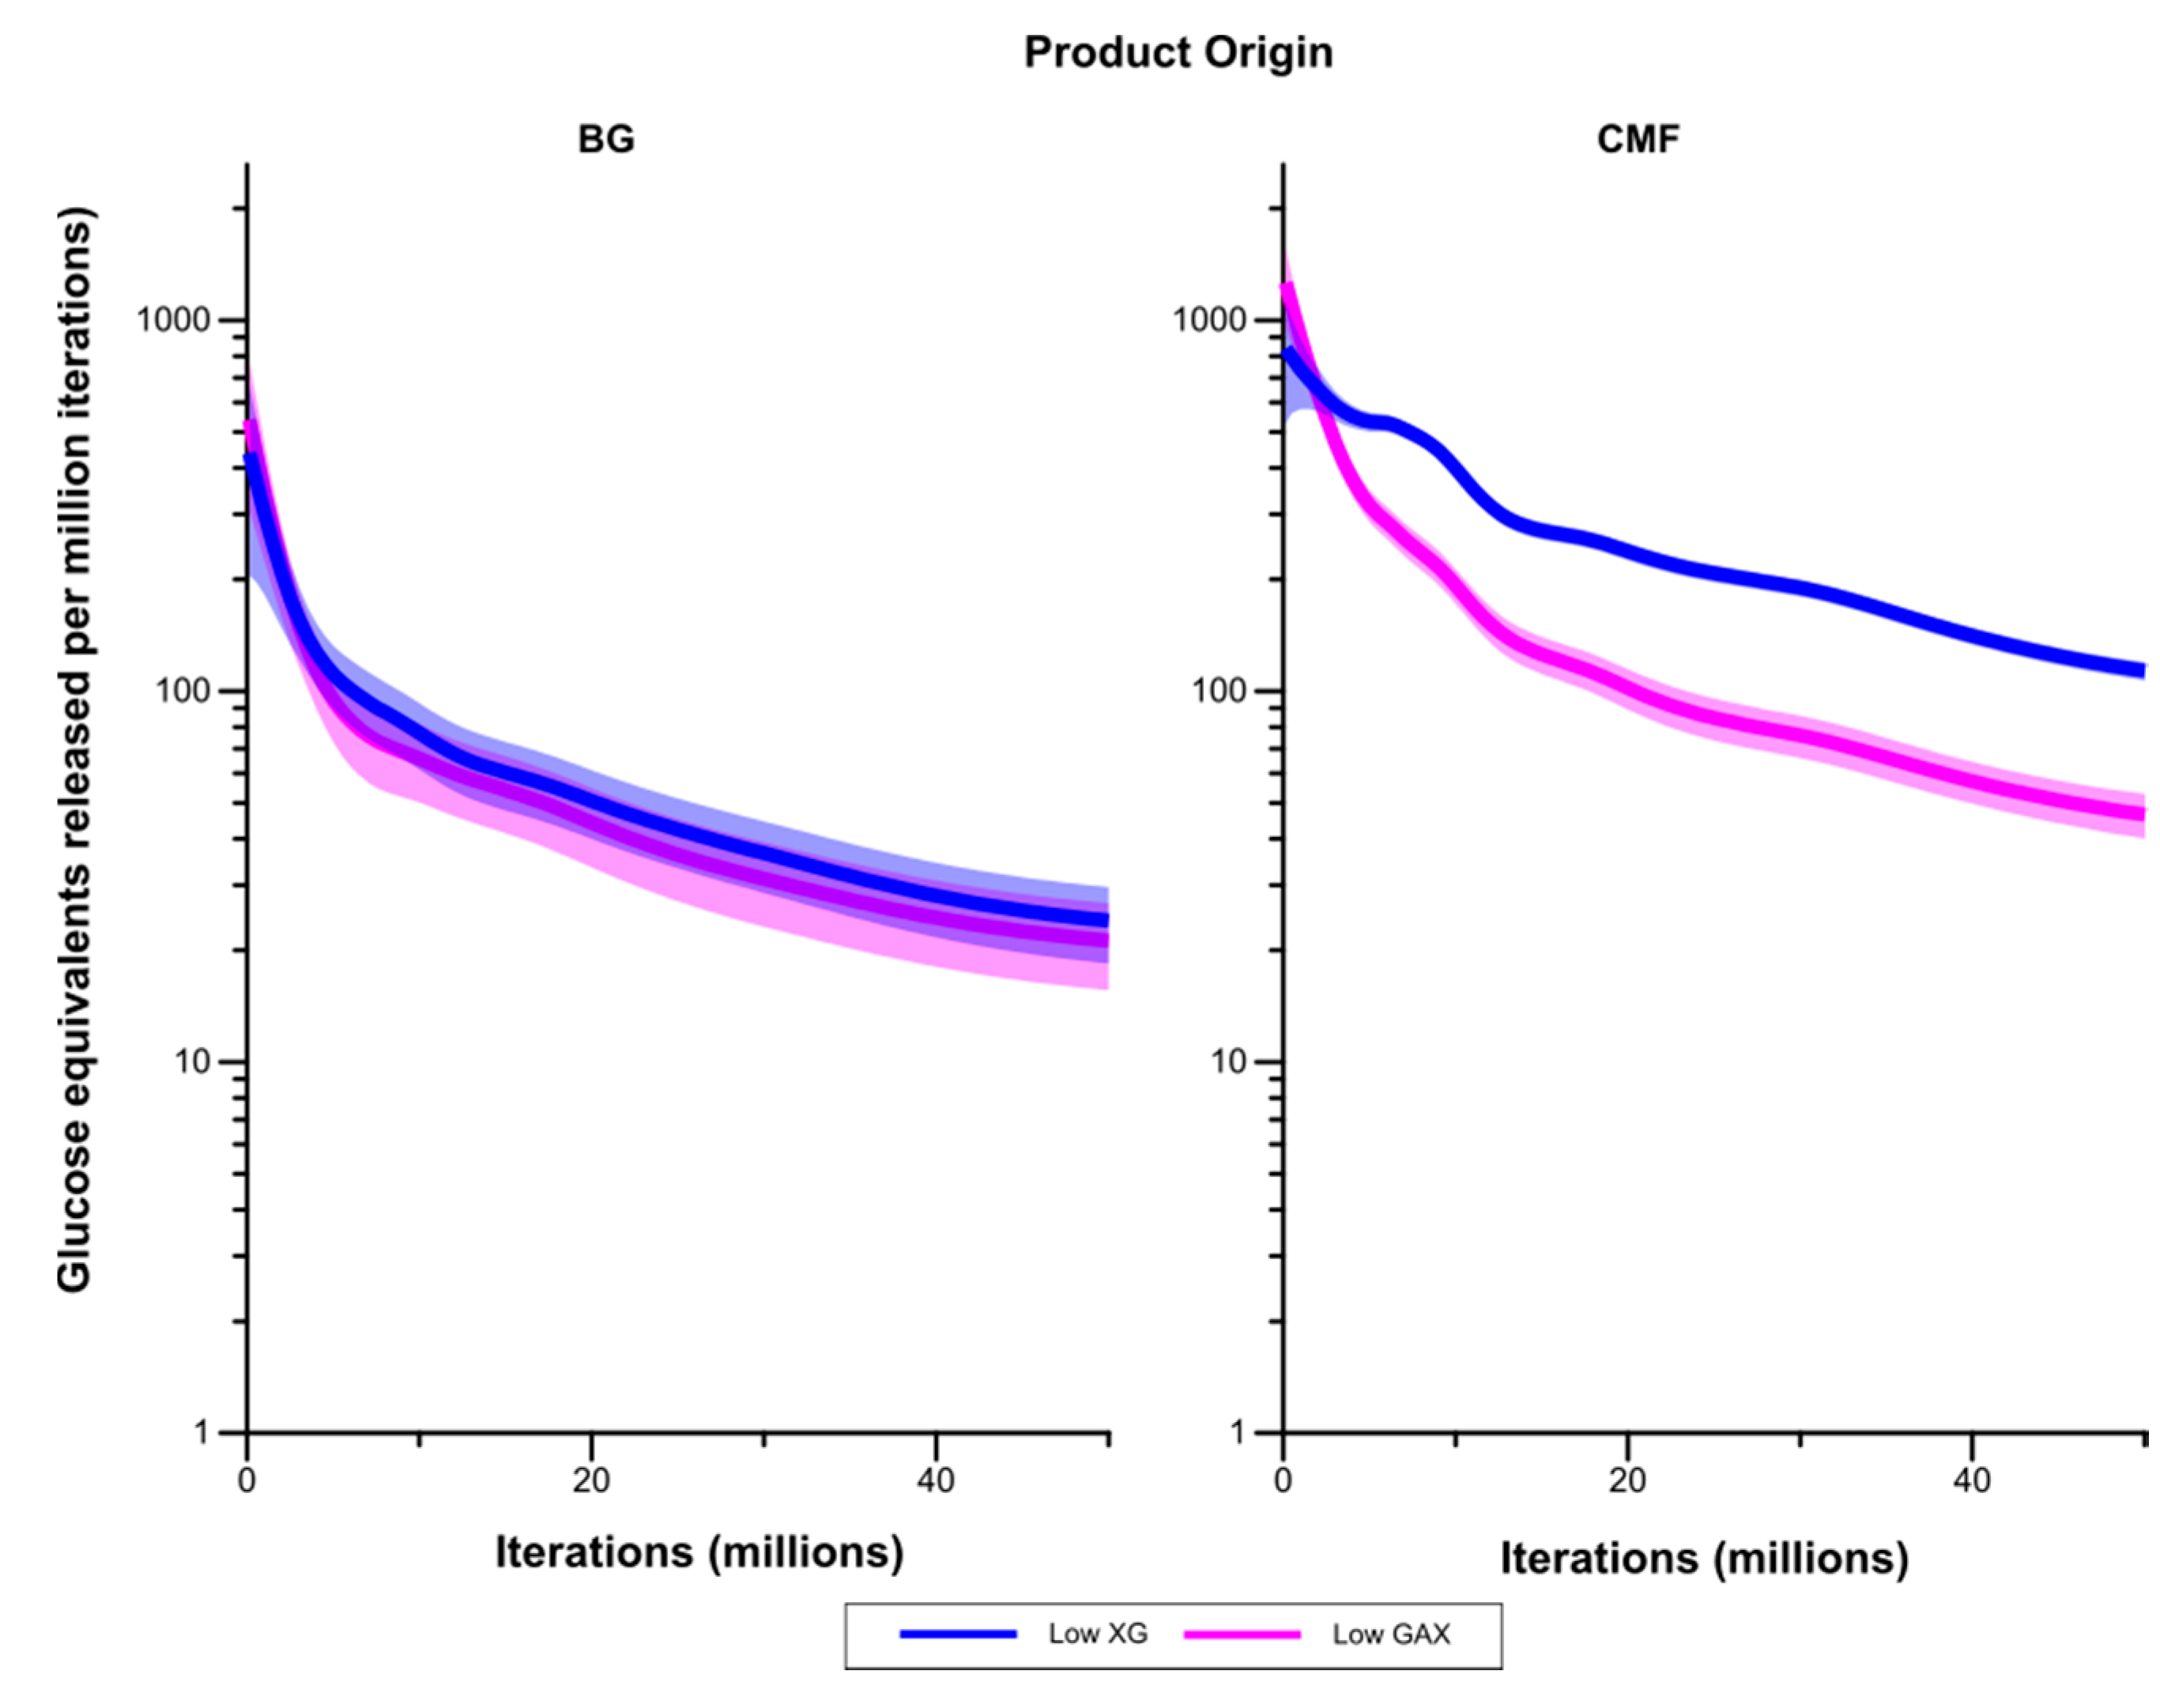
Figure 9 compares rates of liberation of glucose equivalents (in the form of both monomers and oligosaccharides) between the Low GAX and Low XG walls. While liberation of glucose from (1,3;1,4)-β-glucans occurred at a higher rate in the Low XG wall than the Low GAX wall, this was not significantly different at the 5% level. However, liberation of glucose from CMF was significantly higher in the Low XG wall than the Low GAX wall after the early stages of the simulation.
Figure 9.
Rates of liberation of glucose equivalents from the degradation of (1,3;1,4)-β-glucans (BG) and CMF in the Low GAX and Low XG walls. The shaded region represents a 95% Least Significant Interval so that the two curves are significantly different at the 5% level where the bands do not overlap. The solid line in the middle indicates the mean value.
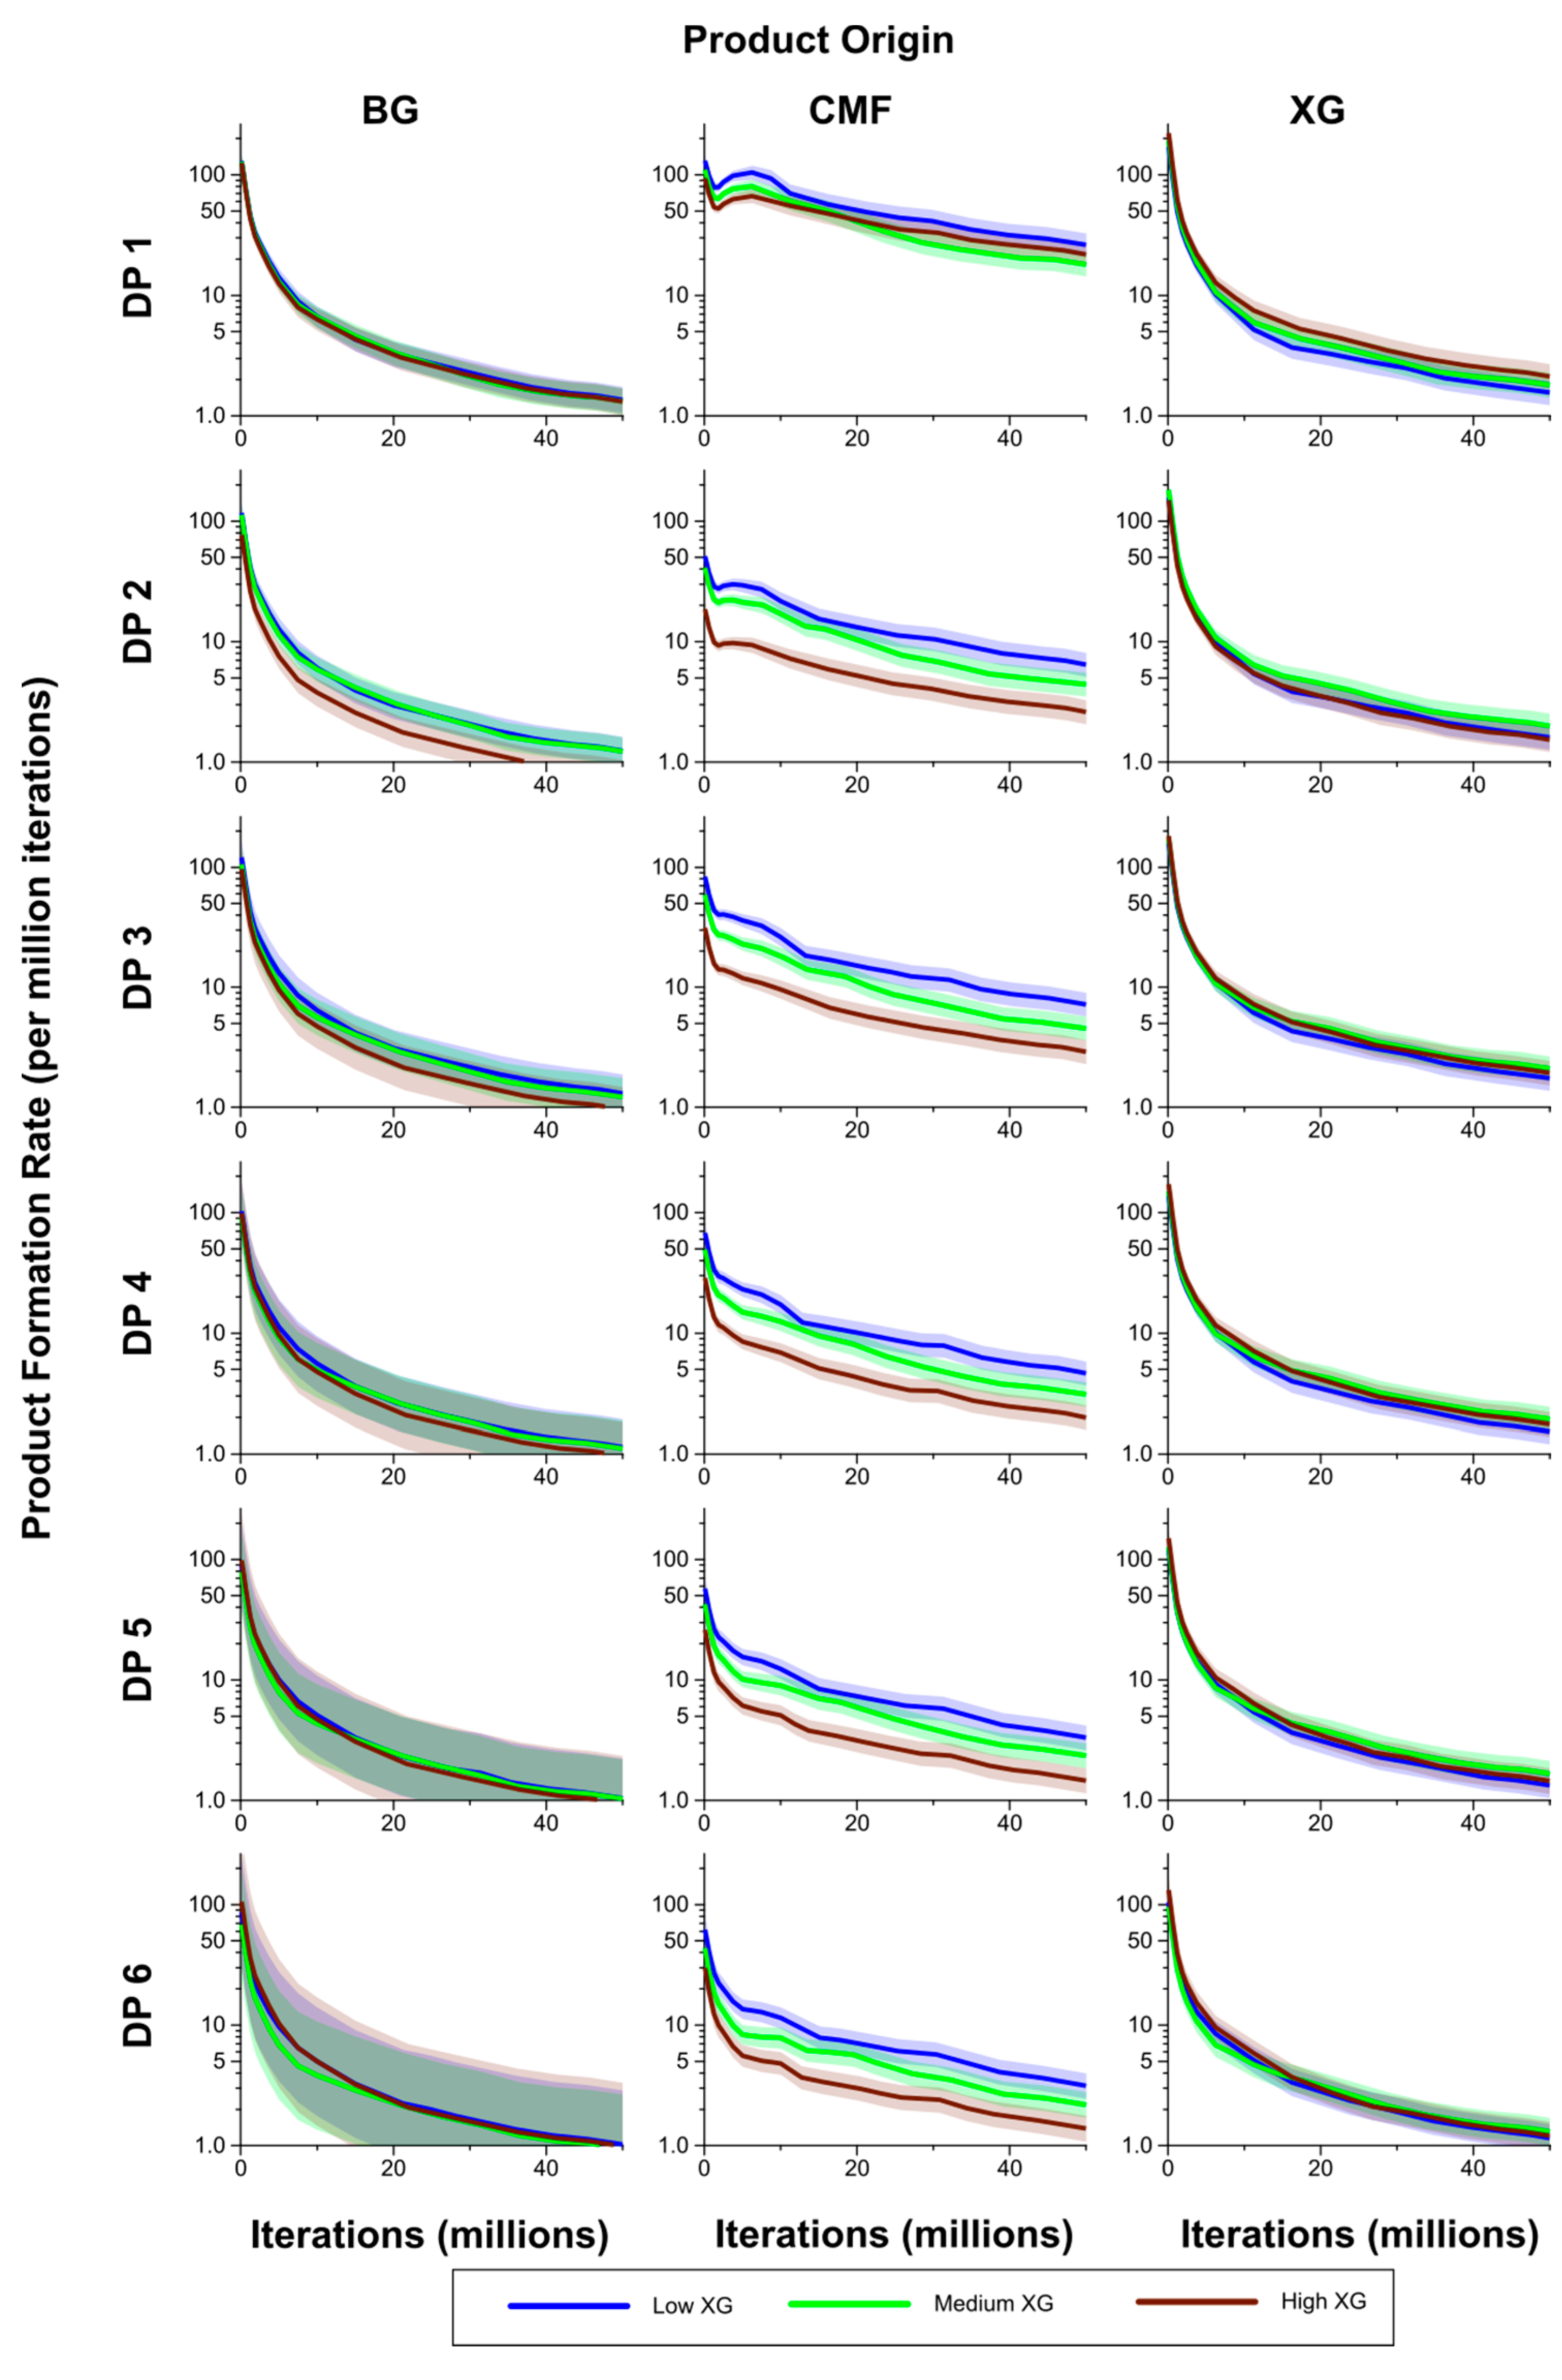
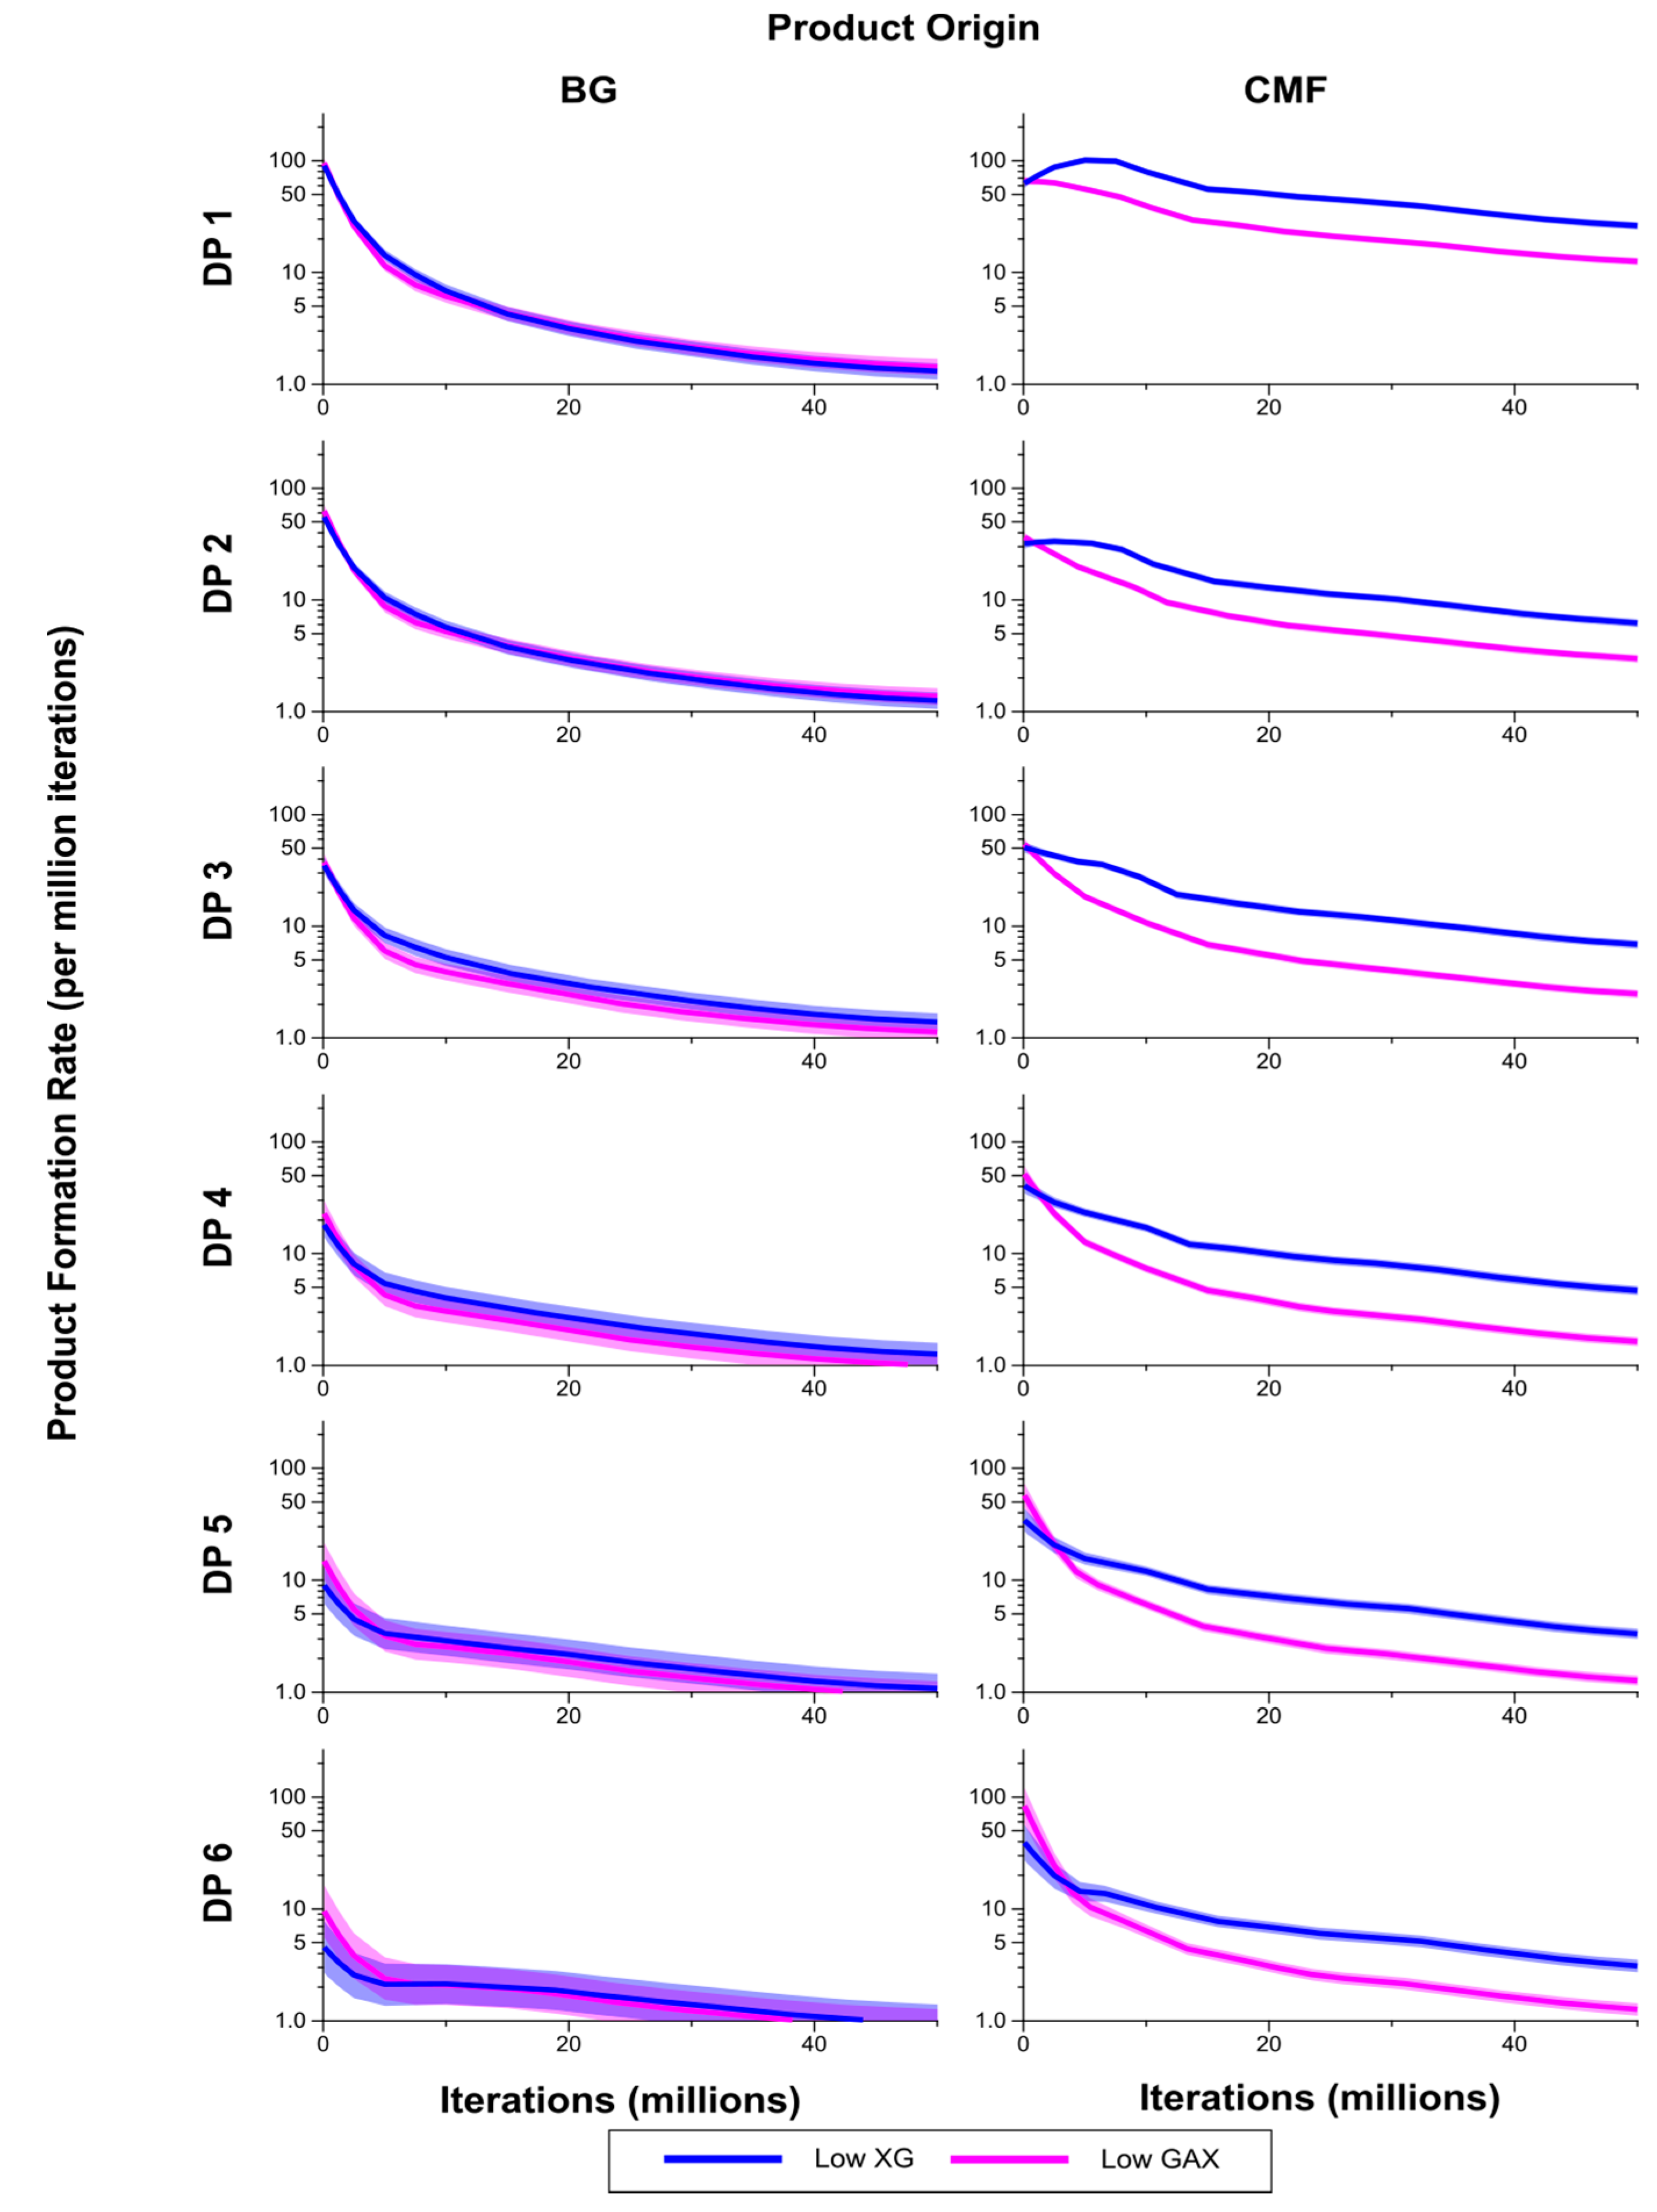
The rates of formation of breakdown products from the CMFs were generally significantly higher in the Low XG wall than in the High XG wall, with the rates for the Medium XG wall intermediate, and at times significantly different from one or both (
Figure 10). The exception to this was for DP 1 where, after the initial stages of the simulation period, the rate of formation was higher in the High XG wall than in the Medium XG wall, but not significantly so. Rates of formation of products from the (1,3;1,4)-β-glucans in the form of DP 3–6 oligosaccharides were generally higher in the Low than Medium XG walls and in the Medium than High XG walls, but these differences were not significant.
However, these rankings did not hold for DP 1 (glucose) and DP 2 products, but differences were never significant. There were no significant differences in the rates of formation of glucose (DP 1) and oligosaccharides of DP 2–6 between the Low, Medium and High XG walls, despite the huge range in abundance of XG between the three wall types. Rates were on average lower for the Low XG wall, but with no clear ranking of the Medium and High XG walls.
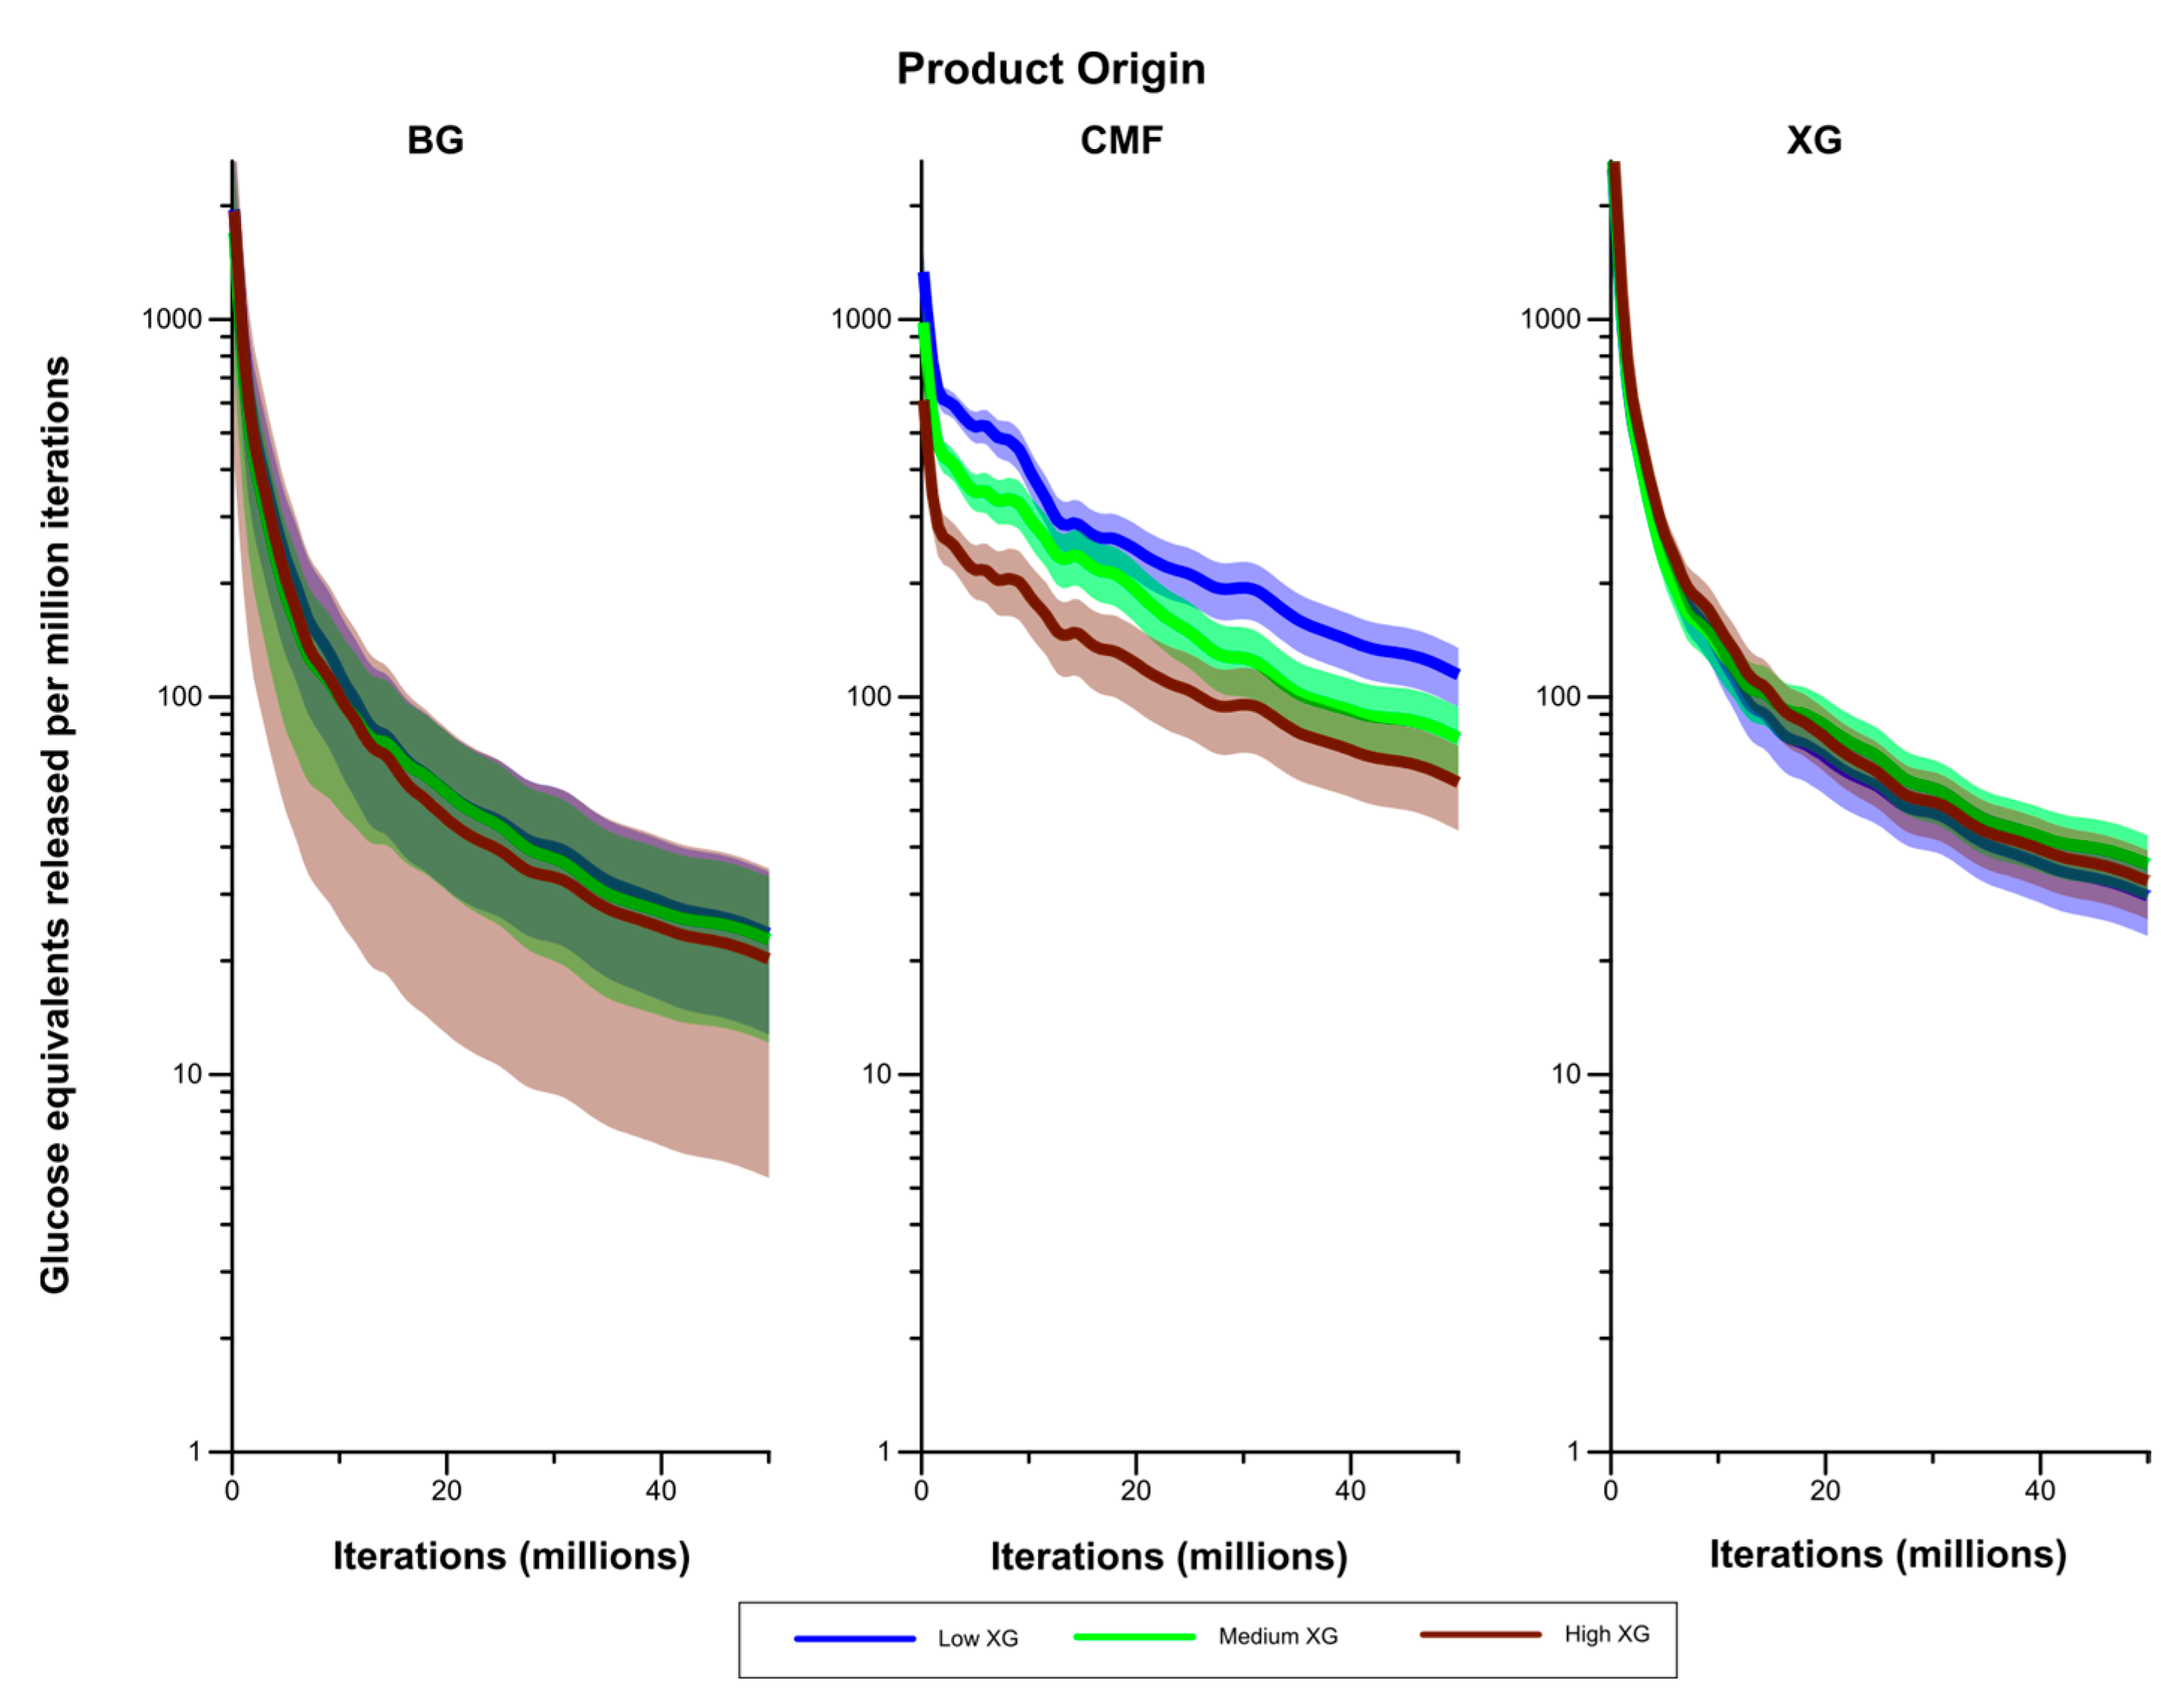
Figure 11 compares rates of liberation of glucose equivalents (in the form of both monomers and oligosaccharides) between the Low, Medium and High XG walls. There was no significant difference in liberation of glucose from either (1,3;1,4)-β-glucans or XG between these three walls. However, the rate of glucose liberation from CMF was significantly higher in the Low XG than the Medium and High XG walls. The rate of glucose liberation from CMF was higher in the Medium XG wall compared to the High XG wall, but this was significant only for the first half of the simulation period.
Figure 10.
Breakdown products (monosaccharides and oligosaccharides) over time (iterations) for Low, Medium and High XG walls, showing rate of formation of products by DP from (1,3;1,4)-β-glucan (BG), CMF and XG. The shaded region represents a 95% Least Significant Interval so that any two of the three curves are significantly different at the 5% level where their bands do not overlap. The solid line in the middle indicates the mean value.
Figure 11.
Rates of liberation of glucose equivalents from the degradation of (1,3;1,4)-β-glucans (BG) and CMF and XG in the Low, Medium and High XG walls. The shaded region represents a 95% Least Significant Interval so that any two of the three curves are significantly different at the 5% level where their bands do not overlap. The solid line in the middle indicates the mean value.
Although some of the rates of product formation were not significantly different among the wall types, during the course of the simulation period, cumulative effects could result in significant differences by the end of the simulation. The profile of breakdown products is shown in
Table 1.
Notably, breakdown products from the CMFs were more numerous from the Low XG than the Low GAX wall, and from the Medium XG than the Low XG wall, and oligosaccharides of DP ≥ 2 were in higher amounts from the High-XG than Medium XG walls. Increasing the XG content in walls resulted in the size distribution of CMF breakdown products shifting towards smaller molecules. In particular, in High XG walls, CMF breakdown products of DP = 1 contained 44% of the glucose degraded from CMF, whereas in the Medium- and Low XG walls it was 25 and 22% respectively. However, XG content had little effect on the DP frequency profile of XG breakdown products (i.e., the percent of products of DP = 1 vs. DP = 2 etc.). For Low-, Medium- and High XG walls, XG breakdown products of DP = 3, 4 or 5 contained similar amounts of glucose and accounted for 78% to 79% of the glucose in products from XG.
The differences in breakdown profile of cell walls would have important implications for cellulolytic bacteria, which vary in their ability to utilise breakdown products of differing DP. For example,
F. succinogenes appears to utilise glucose and cellobiose more readily than larger oligosaccharides [
22], whereas the converse holds for some other microorganisms [
23].
We can gauge the duration of our simulations in terms of physical time by comparing our assumptions with those of Warden,
et al. [
24] who, in their simulation model, specified enzymes to move 5 Å in a 1.0 ms time step. In our model, the average step size of an enzyme is about 0.5 r
g in an iteration [
16]. Taking a value for r
g of 3.65 Å [
17], an iteration of our model corresponds to about 0.365 ms of elapsed time, and each simulation corresponds to a duration of about 5 h. We have no data available on the enzymatic degradation of composite walls of the type we have modelled. However, after 12 h, the primary (non-lignified) mesophyll walls of ryegrass can be fully degraded in the rumen [
25]. The rumen contains a multitude of different enzymatic activities and thus we make no attempt to use that result to calibrate our model. Nonetheless, we feel this gives an indication that the progress of degradation in our simulations is credible. Experimental studies of enzymatic degradation of simple composite walls corresponding to the simulations would be invaluable for parameterising and calibrating the model.
Table 1.
Break down products (monosaccharides and oligosaccharides) and their polysaccharide origin over the entire simulation for each of the model wall types, showing mean values followed by standard deviation in parentheses. A dagger (†) in a row between two columns indicates a significant difference (based on t-tests) at the 5% level between the corresponding entries in that row. Comparisons were made only between adjacent columns: Low GAX vs. Low XG; Low vs. Medium XG; Medium vs. High XG.
| Product (Monosaccharides and Oligosaccharides) Source & DP | Low GAX Wall | Low XG Wall | Medium XG Wall | High XG Wall |
|---|
| (1,3;1,4)-β-glucan |
| 1 | 92 | (12) | † | 126 | (4) | | 122 | (15) | † | 84 | (10) |
| 2 | 30 | (3) | † | 56 | (6) | † | 42 | (10) | | 31 | (5) |
| 3 | 38 | (2) | † | 63 | (2) | † | 54 | (7) | † | 27 | (7) |
| 4 | 22 | (2) | † | 39 | (4) | † | 21 | (4) | † | 14 | (4) |
| 5 | 17 | (3) | † | 28 | (6) | | 21 | (4) | † | 13 | (3) |
| 6 | 18 | (2) | † | 26 | (5) | | 22 | (4) | † | 15 | (3) |
| Cellulose |
| 1 | 1263 | (88) | † | 2491 | (368) | † | 1851 | (134) | | 1938 | (163) |
| 2 | 314 | (27) | † | 611 | (127) | † | 438 | (83) | † | 166 | (15) |
| 3 | 255 | (23) | † | 753 | (114) | † | 463 | (78) | † | 239 | (14) |
| 4 | 141 | (13) | † | 480 | (44) | † | 294 | (40) | † | 133 | (15) |
| 5 | 87 | (9) | † | 317 | (20) | † | 195 | (41) | † | 89 | (9) |
| 6 | 83 | (10) | † | 296 | (14) | † | 173 | (19) | † | 80 | (7) |
| Xyloglucan |
| 1 | | | | 138 | (13) | † | 185 | (11) | † | 250 | (15) |
| 2 | | | | 48 | (11) | † | 75 | (12) | | 62 | (10) |
| 3 | | | | 149 | (12) | † | 198 | (13) | † | 224 | (7) |
| 4 | | | | 119 | (16) | † | 167 | (9) | † | 192 | (12) |
| 5 | | | | 82 | (7) | † | 115 | (12) | | 116 | (7) |
| 6 | | | | 22 | (10) | | 33 | (19) | | 28 | (16) |


