Linking Open Descriptions of Social Events (LODSE): A New Ontology for Social Event Classification


1
Coimbra Polytechnic—ISEC, 3030-190 Coimbra, Portugal
2
FATEC Mogi das Cruzes, São Paulo Technological College, 08773-600 Mogi das Cruzes, Brazil
3
CISUC—Centre of Informatics and Systems of University of Coimbra, 3030-290 Coimbra, Portugal
*
Author to whom correspondence should be addressed.
Information 2018, 9(7), 164; https://doi.org/10.3390/info9070164
Submission received: 4 June 2018
/
Revised: 23 June 2018
/
Accepted: 27 June 2018
/
Published: 4 July 2018
Abstract
:The digital era has brought a number of significant changes in the world of communications. Although technological evolution has allowed the creation of new social event platforms to disclose events, it is still difficult to know what is happening around a location. Currently, a large number of social events are created and promoted on social networks. With the massive quantity of information created in these systems, finding an event is challenging because sometimes the data is ambiguous or incomplete. One of the main challenges in social event classification is related to the incompleteness and ambiguity of metadata created by users. This paper presents a new ontology, named LODSE (Linking Open Descriptions of Social Events) based on the LODE (Linking Open Descriptions of Events) ontology to describe the domain model of social events. The aim of this ontology is to create a data model that allows definition of the most important properties to describe a social event and to improve the classification of events. The proposed data model is used in an experimental evaluation to compare both ontologies in social event classification. The experimental evaluation, using a dataset based on real data from a popular social network, demonstrated that the data model based on the LODSE ontology brings several benefits in the classification of events. Using the LODSE ontology, the results show an increment of correctly classified events as well as a gain in execution time, when comparing with the data model based on the LODE ontology.
1. Introduction
Events are a natural way to show an observable occurrence, such as grouping people, places, times and activities [1]. Also, they might be considered as observable experiences that are often documented through photos and videos [2]. A social event has a distinct characteristic: a relation with the arts, which in this case may include concerts, festivals, theatre, conferences, among other types of events that involve a public performance or entertainment.
Currently, a large number of social events are created and promoted on social networks. Social networks are extensively used because they have a preponderant role that goes beyond the conventional means in the dissemination and promotion of content. Social events are no exception and with the popularity of social networks, there is an increase of events in these systems. Facebook is the largest social network with 1.79 billion monthly active users [3]. Facebook Event is a powerful tool and it is used to create and promote events but they are usually agglomerated with other types of information and users rarely notice them [4].
An application focusing only on the dissemination and recommendation of events could solve this problem effectively [4]. In fact, it is hard to search events of interest [5] and when we move to a new city or country, this necessity is particularly important because it is hard to know what is happening around us. Furthermore, it is difficult to get reliable information about a particular event or to get recommendations of events based on our interests. Finding digital content related to events is challenging, requiring searching at different sources and sites [5] and most of the data is ambiguous and incomplete.
In order to improve the user experience to search and obtain recommended events, social event classification could be integrated with the architecture of platforms of events dissemination. The task of social event classification in this work refers to the classification of event types (e.g., sports events, music events, festivals, conferences, etc.) but with a different approach. Instead of classifying events for default categories like music, conferences, theatre, among others, the events are classified with tags. The tags of an event are like keywords that represent the characteristics of the event and allow the categorization of them.
In order to understand the application of tags to classify a social event, next is presented an example of a U2 music concert and some tags to classify the event:
- Concert: U2 at O2 London Arena;
- Tags: music, rock, alternative rock, post-punk.
However, one of the major challenges in social event classification is the incompleteness and ambiguity of metadata created by users [6]. If we have ambiguity in the data, the classification process can lead to an erroneous categorization of events where the percentage of correctly classified events may be small. Also, classifying events for a large number of tags, the classifier can have performance issues, specifically a slow execution time or higher memory consumption.
In this paper, we propose a different approach for social event classification by creating a new ontology to define the data model to be used in the classification process. This ontology is designated as LODSE (Linking Open Descriptions of Social Events) and it is based on LODE ontology. The LODE ontology creates a model that allows the encapsulation of the most important properties to describe the events [7]. Therefore, one of the main purposes of LODSE ontology is create a data model that allows the definition of the most important properties to describe a social event. Also, the LODSE ontology was created to help the process of classifying events because using a greater knowledge of social events domain may bring advantages in structuring a better data model to obtain enhanced results in social event classification.
An experimental evaluation was made, aiming to compare both ontologies in social event classification. Due to recent General Data Protection Regulation (GDPR), we have generated a synthetic dataset based on real records of events from a popular social network. It was analysed the percentage of correctly classified events, memory consumption and execution time in order to verify if the data model based on the LODSE ontology brings improvements in the classifications of events and performance, namely a better percentage of correctly classified events, low consumption of memory and faster execution time when compared to the data model based on LODE ontology. An analysis of the results is presented and they show an increment of 12.4% in the percentage of correctly classified events as well as a gain of 5.9% in execution time for the LODSE ontology.
Summarizing, the main contributions of this work are the following:
- A new ontology named LODSE, which deals effectively with social events;
- A new improved approach for social event classification;
- The proposed LODSE ontology increments the percentage of correctly classified events as well as the execution time.
The rest of this paper is organized as follows. Section 2 presents some related works, focused on social event classification. Section 3 describes the LODSE ontology, its classes, properties and presents a comparison with LODE ontology. Section 4 describes the experimental setup used in the experimental evaluation. Section 5 presents the experimental evaluation and discussion of the results. Finally, Section 6 concludes the paper and presents the future work.
2. Related Work
Social networks have opened up a new space for information exchange and expression of public opinion. Not only did they bring significant changes in the paradigm of public opinion but they also became a driving force to promote social change [8].
Social networks and search engines are currently the most used services. Data generated from these systems have great value because they reflect several aspects of today’s society [9]. Additionally, data is easily accessed through public Application Programming Interfaces (APIs), allowing the creation of more customized systems targeted to a specific area.
Social event classification is one of the areas that has attracted more attention in recent years [6] due to the amount of data on social networks and the availability of public datasets. Some methods have been proposed for social event classification based on textual metadata.
In Reference [10], the authors participated in a semi-supervised clustering task as well as the classification of social events. For the classification task, they used popular classifiers such as k-Nearest Neighbour (kNN), Decision Trees and Random Forest with Latent Dirichlet Allocation for feature selection. To perform the classification tests, they used the 10-fold cross validation test mode, choosing randomly 15% of the training data as validation. Taking into account that this work focuses more on the clustering task, the results obtained for the classification task only indicate that attention is needed on the imbalanced distribution of categories.
Still related to social event classification based on textual metadata, in Reference [11], the authors studied the detection of events in social networks—particularly on Twitter—considering textual data to identify events. Twitter is characterized by short phrases with strongly colloquial discourse and, to further complicate the classification process, individual messages may not express the full relationship of the authors’ purpose, as is often assumed in a process of extracting tasks. They formulate their approach as a structured graphical model which simultaneously analyses individual messages and induces a canonical value for each event property. They have applied their technique to create a city calendar with entertainment events and their method shows up to 63% recall and up to 85% precision evaluated manually.
With the popularity of social networks like Instagram, the task of social event classification also tries to classify events based on visual information. In Reference [12], the authors propose a method for classifying social event images based on a framework that they developed. The framework consists of three stages, which includes pre-processing, filtering and clustering and classification. The classification task was performed with the help of WordNet, which was combined with textual information from a given dataset. They achieved an F1 main score—a measure of a test’s accuracy—of 0.4409. The presented method was constrained only towards the analysis of media objects rather than textual information.
Event classification can also be used for recommendation purposes. In Reference [4], the authors believe that the problem of recommending events is a different problem than that of recommending books, films or other types of multimedia. Instead of placing as many events as possible in the top of a News Feed, it is best to remove those that do not match the user’s interests and reorder the remaining events to improve the user experience. From this concept, the authors propose a new method for recommendation divided into two stages: classification and reordering. For the first phase, they used several probabilistic classifier models to predict the positive and negative probabilities for each user-event relationship, eliminating all negative cases before moving on to the next phase. For the second phase, the authors worked on the positive probabilities, compared the events based on some reordering techniques and have chosen the best events according to the user’s interests to feed the event recommendation lists. They applied their technique to public events on Facebook, demonstrating effectiveness of the proposed method and the classification phase showed that most of the bad cases were eliminated by assessing the negative probabilities directly by an optimized threshold.
In Reference [13], the authors propose an evaluation measure for the performance assessment of multiannotation classification systems incorporating ontology knowledge. A distance-based misclassification cost was extended from the unilabel to the multilabel case and further enriched with ontology information like its hierarchy, an annotation agreement factor and penalties for ignoring relationships. Despite the differences between this work and our proposal, this paper allows the perception that an ontology knowledge can bring advantages in the process of classification.
All these papers are focused on the classification of events but with different purposes. It is also noted that the data normally used in the classification process is textual data of nominal type (e.g., string). Our work presents a different approach for social events classification, where an ontology is created to generate the data model and the classification of events is based only on numerical data.
3. The LODSE Ontology for Social Events
This section presents the LODSE ontology to represent the domain model of social events. It describes the classes of the ontology, their relationships and the properties of the classes.
An ontology is a data model that represents a set of concepts within a domain and it is used to perform inference on the objects of that domain [14]. The ontologies are used in several areas such as artificial intelligence, or software engineering as a way of representing knowledge about the world or part of it. An ontology usually describes:
- Individuals—the basic objects;
- Classes—sets, collections or types of objects;
- Attributes—properties, characteristics, or parameters that objects may have to share;
- Relationships—between objects.
There are many methods to create an ontology with different results. In the next subsections are introduced the main features of LODSE ontology based on the guide in [15], which presents ontology-design concepts.
3.1. The LODE Ontology
According to [7], the purpose of the LODE ontology is to create a model that allows encapsulating the most important properties to describe events. Their goal is to answer questions such as:
- What is happening?
- Where is it happening?
- When is it happening?
- Who is involved?
These questions provide a data model organization into the following properties: Event, atPlace, atTime and Involved and they were reused in LODSE ontology.
The reason for choosing the LODE ontology is due to its structure which includes the most important properties of an event [7]. Since it does not have any class that takes into account the categorization of an event, there was a need to create a new ontology that provides a better representation of a social event.
3.2. The Domain and Scope of LODSE Ontology
The LODSE ontology aims to cover the domain of social events, more precisely, music, sports, performing arts, conferences, among other types of events. The purpose of this ontology is to create a model that allows defining the most important properties to describe a social event to achieve better results in the task of social event classification.
This ontology will be used to improve the classification of events and also its recommendation by defining the most important classes and properties of a social event. It will also allow the creation of a generic data model that can be used by several applications/platforms for an easier integration of data, obtained from different services.
According to [16], one method to define the scope of the ontology is to create a list of questions that it should be able to answer. These questions serve as a validation test to see if the ontology contains enough information to represent the domain of social events. The following questions were defined to understand if the ontology represents the scope of social events:
- What event is it?
- What is the name of the event?
- Who is the artist?
- Who is the organizer?
- Where will the event occur?
- What time is the event?
- What kind of event is it?
3.3. The Classes and the Class Hierarchy
There are three methods to develop the hierarchical classes of an ontology [17] which are: top-down, bottom-up and combination. We used the top-down method that aims to develop the ontology, starting from the most general concepts of the domain and subsequent specialization of the concepts.
In the previous subsection, a list of terms was defined, that can help create the classes of the ontology and answer the questions presented in Section 3.2. The classes that represent the ontology are the following:
- Event—a class that describes an event and answers the questions “What event is it?” and “What is the name of the event?”;
- Involved—a class that describes who is involved in the event and answers the questions “Who is the artist?” and “Who is the organizer?”;
- ○
- Artist—a subclass describing the artist of the event;
- ○
- Organization—a subclass describing the organizer of the event;
- Date—a class that represents the date of the event and answers the question “What time is the event?”;
- ○
- startDate—a subclass representing the start date of the event;
- ○
- endDate—a subclass representing the end date of the event;
- Venue—a class that describes the place where the event will take place and answers the question “Where will the event occur?”;
- ○
- City—a subclass describing the city where the event will take place;
- ○
- Country—a subclass describing the country where the event will take place;
- Taxonomy—a class that represents the categorization of an event and answers the question “What kind of event is it?”
- ○
- Tag—a subclass representing the event tag;
- ○
- Category—a subclass representing the category of the event.
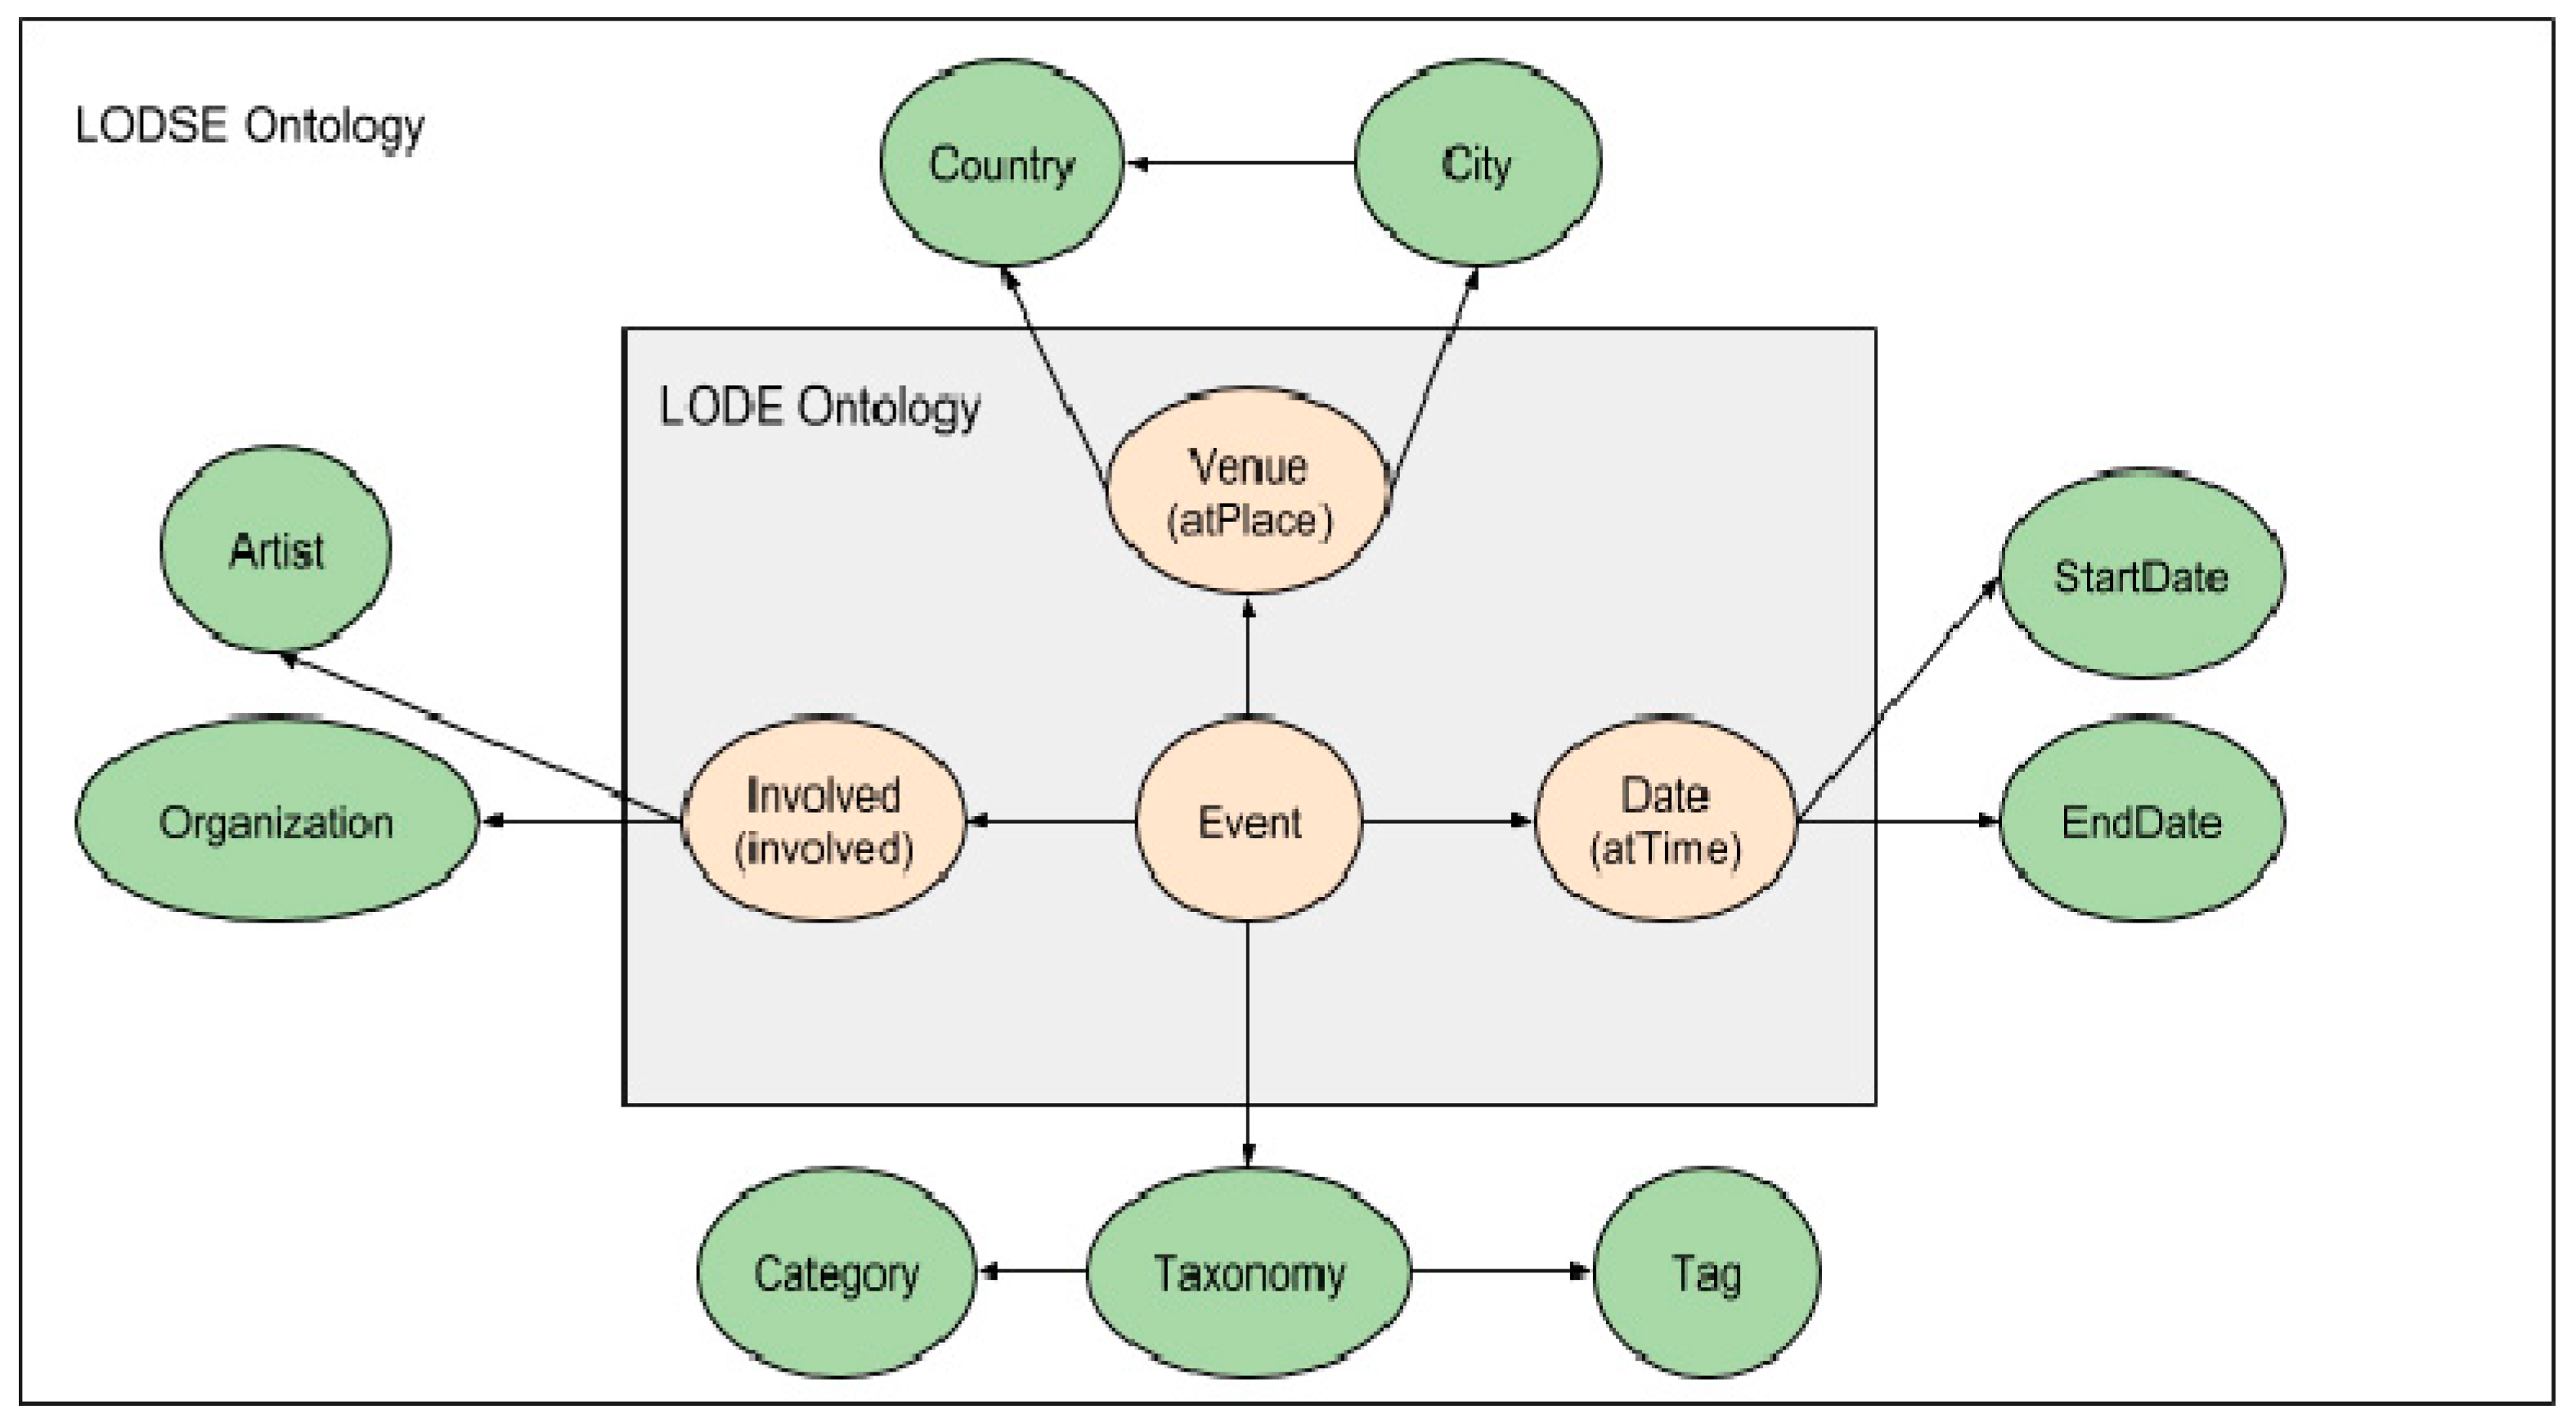
Figure 1 shows how LODSE ontology was created based on LODE ontology, the classes that compose the LODSE ontology, subclasses and the relationships between them. The properties Event, Venue, Date and Involved are the properties imported from the LODE ontology and turned into classes and the other classes are new and were created for the LODSE ontology.
Figure 1 also shows the relations between the classes. It is possible to observe that the Event class is the main class of the LODSE ontology, from which all existing relations start. The relationships of the classes are explained as follows:
- Event—Date: All events occur on a certain date. The event can have a start and also an end date;
- Event—Venue: All events take place at a particular venue. This venue is located in a city/country and the city belongs to a country;
- Event—Involved: Every event has someone involved. Depending on the type of the event the entities that may be involved are the artists or the event organizers;
- Event—Taxonomy: The event belongs to a certain taxonomy; this is, the event is classified or with a pre-defined category or with a tag.
3.4. The Properties of Classes and Their Facets
Classes are the focus of most ontologies and they describe concepts in the domain. In LODSE ontology, the class Event represents all social events. A class can have subclasses that represent concepts that are more specific than the superclass. For example, we can divide the class of all social events into music events because of the Taxonomy subclass.
Classes by themselves do not provide enough information to answer the questions presented in Section 3.2. Since classes are already defined, we must describe the internal structure of concepts and the properties.
The properties of the classes of the LODSE ontology were chosen based on the classes previously defined, on the questions that the ontology intends to answer listed in Section 3.2 and also from an analysis of several event APIs such as Facebook, Eventful, Eventbrite and Meetup to perceive the common properties between these services.
Properties can have different facets describing the value type, allowed values and the number of the values (cardinality). Technically, a facet is a property that can be applied to all or some of the entities in the taxonomy. The value type turns out to be the most important facet in the development of an ontology because it defines the type of each property that will define the properties used in the classification process. The values that the properties can take are number, string, boolean, enumerated and instance.
Table 1 shows all classes, properties and facets of the LODSE ontology.
After defining the classes, the properties of the classes and their facets of the LODSE ontology, we have chosen all properties where the facet is number or boolean to construct our model to be used in the experimental evaluation, presented in the next section. This data model was used to create the datasets needed to perform the classification tests.
4. Experimental Setup
This section presents the setup used in the experimental evaluation that aims to compare aiming to compare both ontologies in social event classification. We intend to increment the percentage of correctly classified events and also improve the performance in the classification process, in order to have low memory consumption and faster execution time with the LODSE ontology comparing to LODE ontology.
We start to present the hardware and software used to run the classification tests. Next, we present the algorithm Random Forest and we describe the structure of our datasets.
4.1. The Hardware
To perform the experimental evaluation, two machines with the following characteristics were used:
- Machine_1—Processor 1.4GHz Intel Core i5, 8GB RAM DD3;
- Machine_2—Intel Xeon Processor 2.39GHz, 40GB RAM.
Since the first machine used did not have enough memory to perform all the tests during the experimental evaluation, a second machine was added to perform the tests when the number of events are greater than 10,200.
4.2. The Data Mining Software
In the experiments, we used the Waikito Environment for Knowledge Analysis (Weka) [18], which is a data mining software in Java, currently in version 8 that consists of a collection of machine learning algorithms for data mining tasks.
We integrated the Weka library in a Java application, developed by us, to get the percentage of correctly classified events and also to measure the memory consumption and execution time. We have chosen this software because it is open source and has interesting features like a graphical interface that allow to test our ideas easily and an API that is well documented and promotes integration in our own applications. Moreover, Weka is one of the most used software in data mining and has made an outstanding contribution to the data mining field [19].
4.3. The Random Forest Algorithm
Weka allows the choice of several data mining algorithms to perform classification tests on our data. We choose the Random Forest algorithm to classify a dataset of events for a certain tag.
We have chosen the Random Forest because it is a method of ensemble learning widely used in the literature and applied field [20]. Also, this algorithm was chosen based on [21] where the Random Forest obtained the best result to classify events compared to the algorithm k-Nearest Neighbour (kNN) and Support Vector Machines.
The Random Forest [22] algorithm consists of a set of n decision trees constructed, considering k attributes randomly. By default, n = 100 and k = [log2 (number of attributes) + 1]. Each tree is dependent on the values of an independently generated random vector and with the same distribution for all trees in the forest after a large set of trees is generated, the result is obtained by a vote of all the trees that constitute the forest, winning the most voted class.
4.4. The Datasets
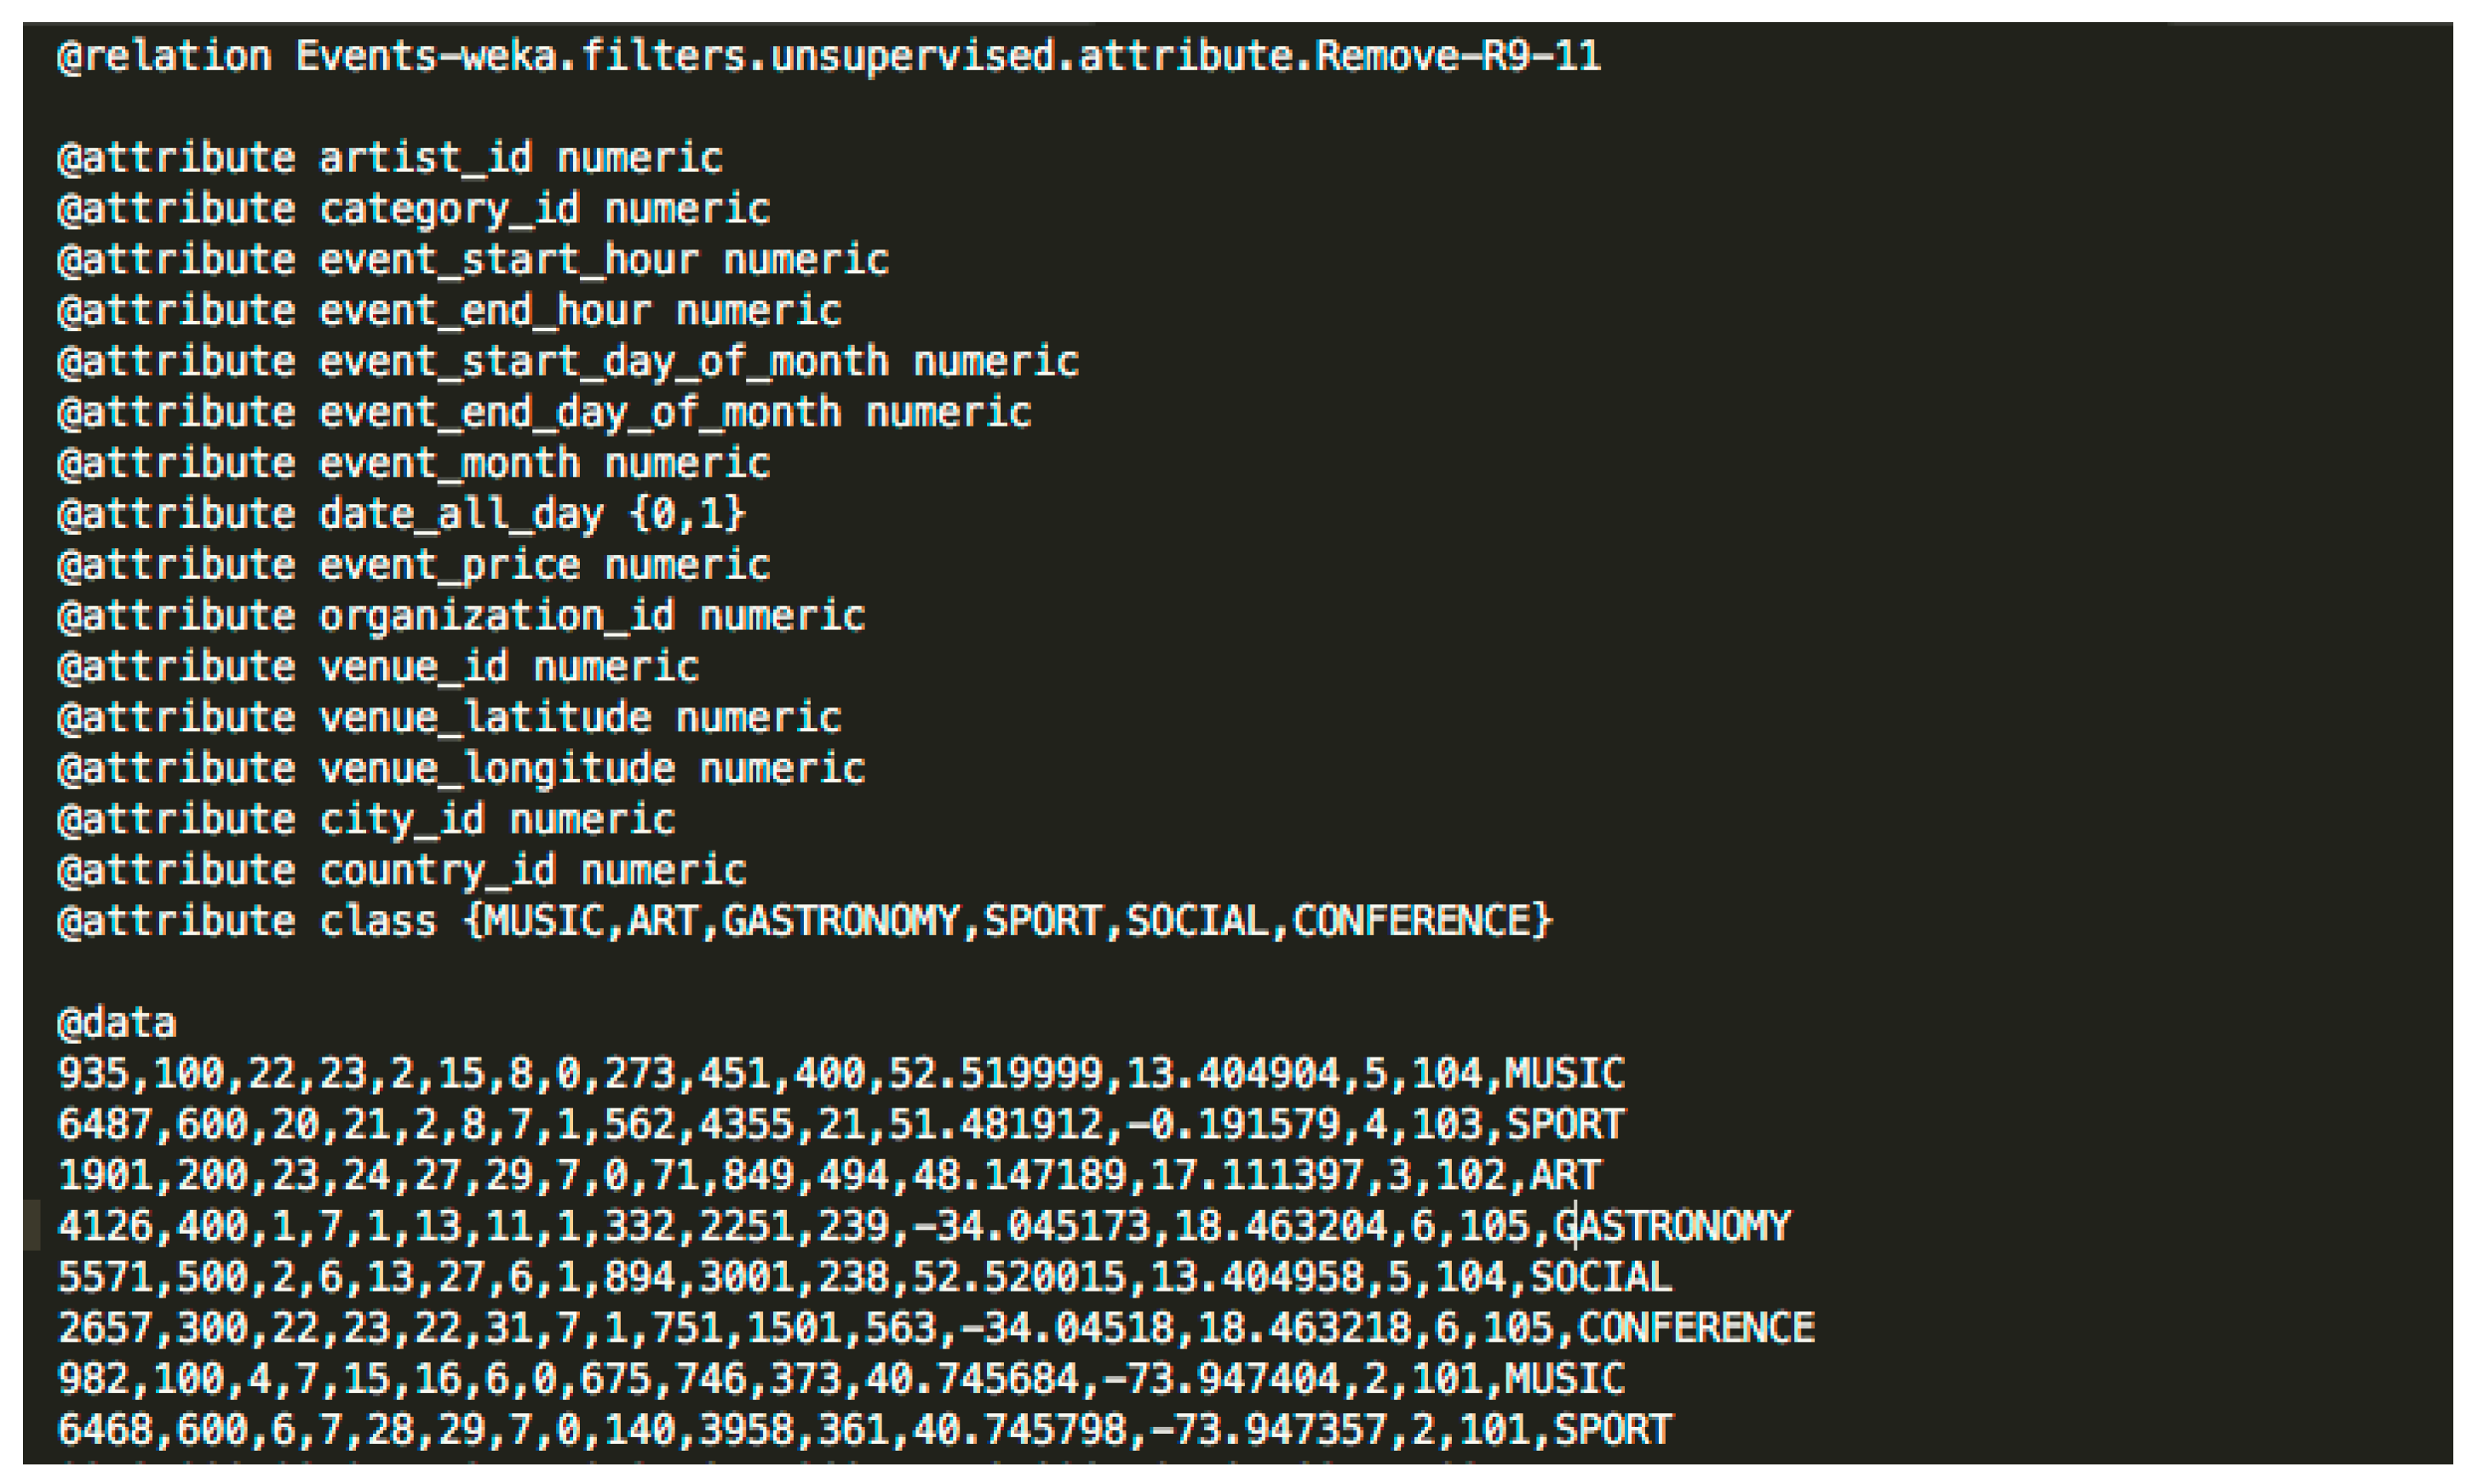
The dataset files created for the experimental evaluation are ARFF (Attribute-Relation File Format) files which contain the event data and the tags to be used in the classification tests. ARFF files have two different sections. The first section is the header information which is followed by the data in the second section. The header of an ARFF file contains the name of the relation, the list of attributes (the columns in the data) and their types. This section defines the structure of our data and it will represent the properties of a social event. The second section represents the data and has the event data for the properties defined in the header information. The Figure 2 shows an example of an ARFF file with the data model of LODSE ontology with the two sections presented above.
Two types of datasets were created and they differ in the list of attributes defined in the header of an ARFF file. The first type of datasets is relative to the data model based on the LODE ontology and the second type of datasets is relative to the data model based on the LODSE ontology.
Table 2 presents the attributes of the data model based on the LODE ontology. These attributes are the most relevant and they obtained 83.33% of correctly classified events in [20].
Table 3 presents the attributes of the data model based on the LODSE ontology. Considering that the algorithm chosen to perform the tests is the Random Forest, the attributes of the data model are all the properties of the ontology with value type numeric, boolean or enumeration because Random Forest does not support nominal values like strings.
The data of the events were generated from an algorithm developed by us. Since no public datasets were found to meet the type of data that our experimental evaluation needs, this algorithm was developed to generate all event data based on the attributes of Table 2 and Table 3 and the event tags. It is important to note that in data generation 30% of the events in all datasets contain missing values. This choice is intended to simulate a real-world environment of data that multiple services can return, including events with missing data. However, it should be stressed that we manually obtained event records from a popular social network. In order to evaluate the performance of our proposal, we have used the records of events manually obtained for generating a group of synthetic data. It is worth mentioning that the group of manually generated records is also part of the experimental dataset.
The number of events generated ranges from 2040 events to 51,000 events. For each specific number of events several ARFF files were created and they differ in the number of tags. The minimum number of tags is 6 and the maximum is 96. In the context of an ARFF file, the tags represent the @class value and are the values at which an event can be classified.
We generated 9 datasets of events with 2040, 4080, 6120, 8160, 10,200, 20,400, 30,600, 40,800 and 51,000 instances. Each specific dataset has a file corresponding to 6, 12, 18, 24, 30 and 96 tags. Multiplied by two ontologies we get the total number of datasets, 108 (= 9 × 6 × 2), which is used in the experimental evaluation.
The number of tags was created based on multiples of 6. From 6 to 30, the number of tags is linear but then the number of tags was increased to 96. The reason for this difference is to prove if there is a linear behaviour, increasing the number of tags and to know the variation in performance between the two types of datasets when we have a large number of tags.
For each specific dataset, five tests were performed. With 108 datasets created, the experimental evaluation counted on 540 tests (108 datasets × 5 tests for each). The reason for conducting 5 tests for the same dataset is to obtain a more accurate average of the percentage of correctly classified events, memory consumption and execution time. The final result for the measured properties is the average of the 5 tests. The results are presented in the next section.
5. Experimental Evaluation Results
As previously mentioned, with this experimental evaluation we intend to prove a better percentage of correctly classified events and also improve the performance, in order to have low memory consumption and faster execution time with the LODSE ontology comparing with the LODE ontology. The test mode used to perform the classification tests, was the 10-fold cross validation, the default test mode of WEKA, which means that 90% of the data of a dataset was used for training and 10% for testing in each fold test.
The percentage of correctly classified events refers to how many instances were correctly classified in an ARFF file. In a dataset with 100 events, if 70 instances were correctly classified, the percentage of correctly classified events is 70%. The memory consumption, measured in megabytes during the classification process, refers to the memory consumption to build the data model and the classification of the instances of a dataset. The execution time, measured in seconds during the classification process, refers to the time to build the data model and the classification time of the instances of a dataset.
This section shows the results obtained on the classification tests after performing the 540 tests in approximately twenty-two days and twelve hours (CPU time) for the percentage of correctly classified instances, memory consumption and execution time where the number of tags was 6, 30 and 96.
5.1. Percentage of Correctly Classified Instances
The percentage of correctly classified instances is the percentage of the instances that were correctly classified in an ARFF file.
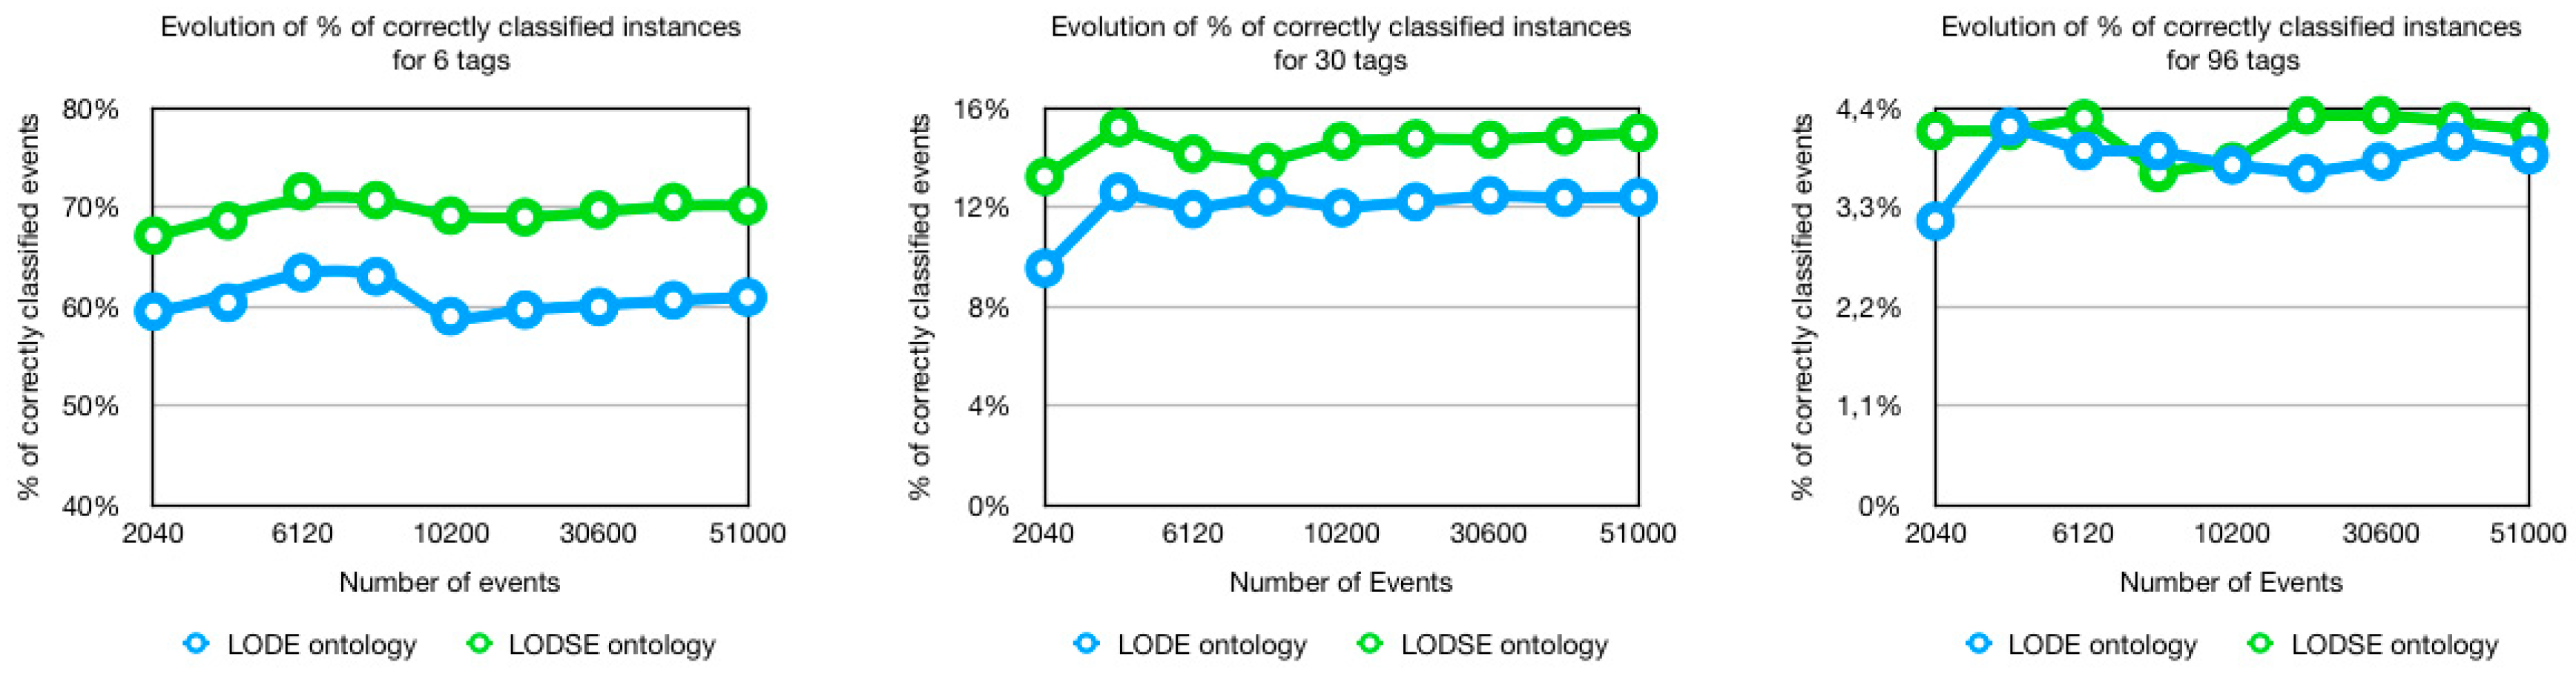
Figure 3 shows the evolution of the results for the percentage of correctly classified instances where the number of tags is equal to 6, 30 and 96. Overall, the LODSE ontology has a better percentage of correctly classified events comparing to the LODE ontology. On average, the LODSE ontology has:
- 12.78% more correctly classified events when the number of tags was 6;
- 17.31% more correctly classified events when the number of tags was 30;
- 7.12% more correctly classified events when the number of tags was 96.
In Figure 3, we can also see that the percentage of correctly classified events reduces as the number of tags increases. This reduction is justified with the increase of tags for the same number of events because we incremented the number of tags but the number of events was always the same. If we take 51,000 events as an example, the distribution of events per 6, 30 and 96 tags are 8500 events, 1700 and 531 events respectively. The percentage of events per tag decreased which worsened the percentage of correctly classified events for a high number of tags, for example 96 tags.
5.2. Memory Consumption
Memory consumption is measured in megabytes and analyses the memory used in the classification process, which means, the memory used to build the data model and the classification of the instances of an ARFF file.
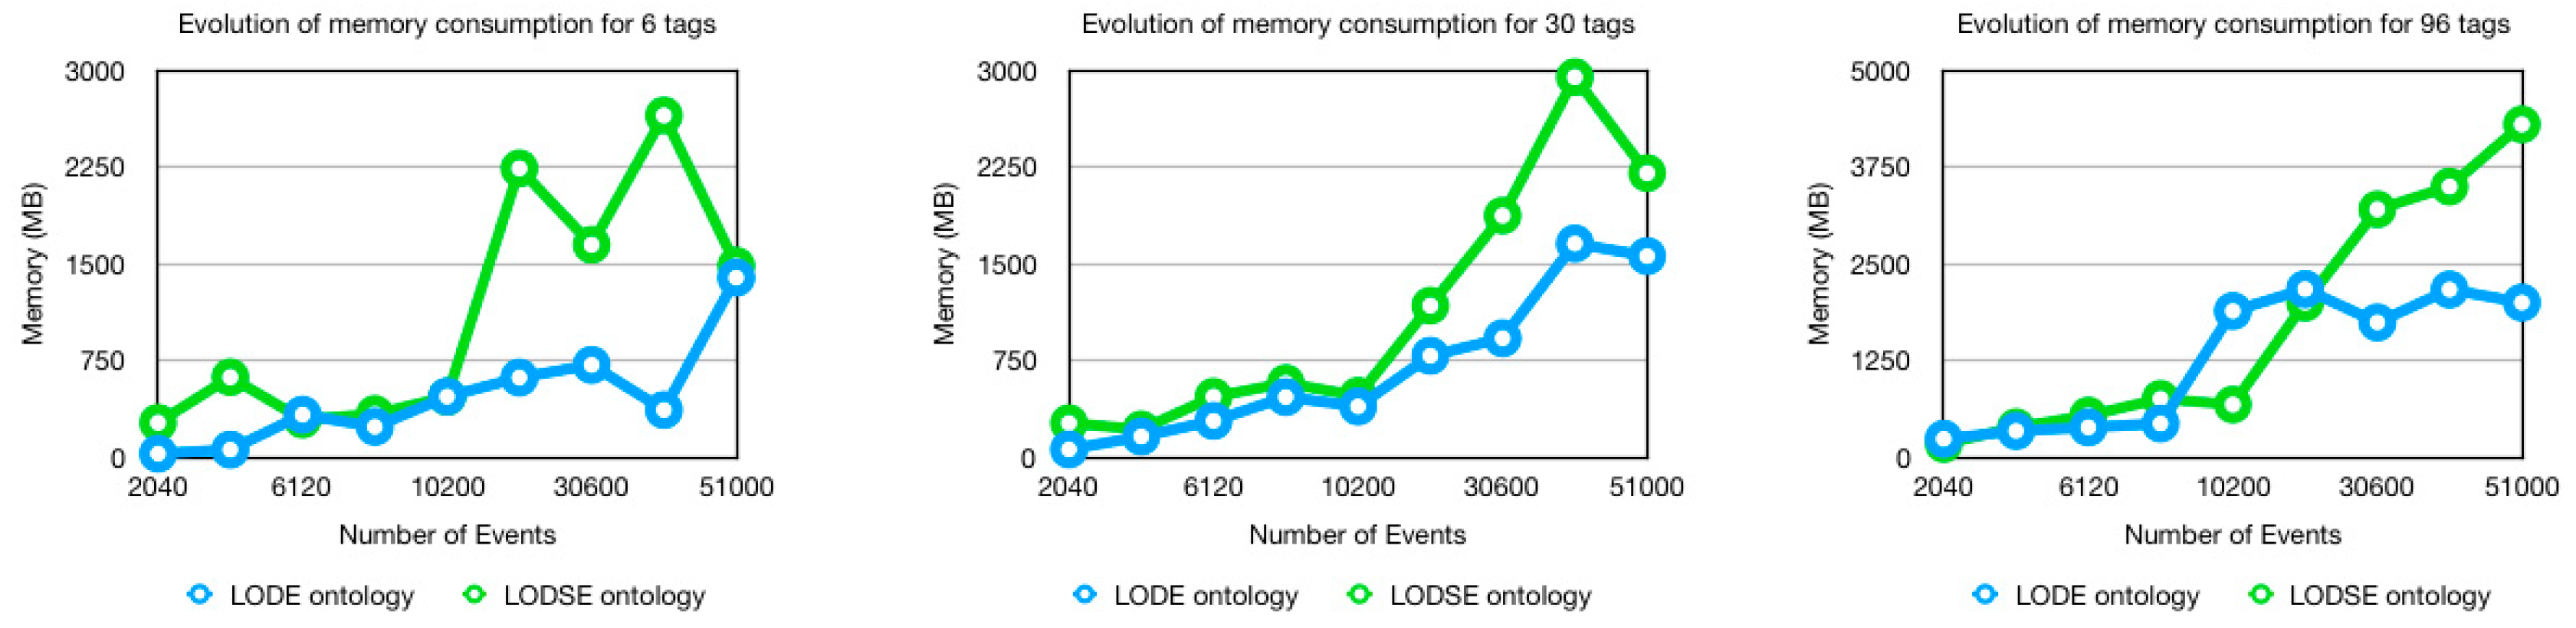
Figure 4 shows the evolution of memory consumption where the number of tags is equal to 6, 30 and 96. Overall, the LODSE ontology has a higher consumption than the LODE ontology. On average, the LODSE ontology consumes:
- 46.34% more memory than the LODE ontology when the number of tags was 6;
- 37.20% more memory than the LODE ontology when the number of tags was 30;
- 0.44% less memory than the LODE ontology when the number of tags was 96.
The LODSE ontology consumes more memory than the LODE ontology because of the number of trees needed to construct the model to be used in the classification process. However, when the number of tags increases, the memory consumption average is reduced.
The Random Forest algorithm constructs its trees based on the defined attributes, classes and instances. According to Reference [22], as the number of trees grows, it does not always mean better performance compared to fewer trees. Therefore, the memory consumption is lower for the LODE ontology because the algorithm has built fewer trees to be able to classify the instances while the LODSE ontology, with more attributes, had a higher memory consumption due to the need to build more trees.
It is also worth mentioning that memory consumption increase is not linear as the number of events increases as we can see in Figure 4. Taking into account that the software used was Weka, the memory management is done by the garbage collector of Java. The garbage collector is a dynamic approach to do automatic memory management and heap allocation that processes and identifies dead memory blocks and reallocates storage for reuse.
5.3. Execution Time
The execution time is measured in seconds and corresponds to the time of a classification test, which means the time to build the data model plus the classification time of the instances of an ARFF file.
Figure 5 shows the evolution of execution time where the number of tags is 6, 30 and 96. On average, the LODSE ontology take:
- 1.64% more time when the number of tags is 6;
- 7.05% less time when the number of tags is 30;
- 12.28% less time when the number of tags is 96.
Overall, the LODSE ontology takes less time to classify a given dataset than the LODE ontology. We can affirm that as the number of events increases, the execution time also increases because we have more data to be classified. The LODSE ontology had a better execution time when the number of tags was equal to 30 and 96. Otherwise, for a number of tags equal to 6, the LODE ontology had a better execution time but for a smaller difference.
5.4. Discussion of The Results
Overall, the data model created based on the LODSE ontology brings improvements in social event classification obtaining a better percentage of correctly classified instances and taking less time to classify the events, particularly for a higher number of tags and events. For the percentage of correctly classified instances, the best result achieved by LODSE was when the number of tags was equal to 30 obtaining 17.31% more correctly classified instances. For execution time, the best result achieved by LODSE was when the number of tags was equal to 96 taking 12.8% less time to classify events which corresponds to less 99 s (1 min and 39 s) comparing to the LODE ontology.
However, LODE ontology had lower memory consumption than the LODSE ontology but, as the number of tags increases, the consumption gap is reduced and for 96 tags, the new ontology used 0.44% less memory than the LODE ontology.
These results validate positively the LODSE ontology and its data model in social event classification. Although the data were randomly generated, the use of more attributes to determine the tag of the event demonstrated improvements in the percentage of correctly classified events. It is also worth mentioning the choice of attributes of the data model. Since we chose only the numerical properties of the LODSE ontology classes, it becomes easier for the algorithm perceive the tag of an event because one property can be the unique identifier of that class. A practical example can be the association of “rock-music” tag to a specific venue which only has concerts of rock music. For the algorithm, this association can be accomplished because we have an attribute venueID that identifies the venue in question.
In terms of performance, the LODSE ontology consumed more memory than the LODE ontology. As explained previously, this is related to the memory required to create the predictive model of the Random Forest algorithm. More attributes in the data model can lead to the creation of more trees on the predictive model. Since the LODSE ontology has almost double the attributes of the LODE ontology, the results prove this higher consumption of memory.
When looking at the execution time, the improvements obtained may be related only to the use of numeric attributes, which are the type of attributes in which the Random Forest algorithm performs better.
This experimental evaluation demonstrates that the LODSE ontology brought advantages in social event classification, achieving a better percentage of correctly classified events and a faster time in the classification process compared to the LODE ontology. In particular, for a large number of tags, the LODSE ontology also demonstrated better results compared to the LODE ontology. However, the memory consumption was slightly worse because of the higher number of attributes in the LODSE ontology.
6. Conclusions and Future Work
One of the major challenges in social event classification is related to the incompleteness and ambiguity of metadata generated by users which leads to poor results. Therefore, the classifier can have performance issues for a large number of tags, specifically a slow execution time or higher memory consumption. To solve the mentioned problems, a new ontology was proposed in this paper, named LODSE (Linking Open Descriptions of Social Events) to create a data model that allows defining the most important to describe a social event, based on LODE ontology. The experimental evaluation was performed with 540 tests varying the number of events between 2040 to 51,000 and the number of tags between 6 and 96. The aim was to compare the performance between the two data models, based on the presented ontologies, in the classification process. We analysed the percentage of correctly classified events, the memory consumption, as well as the execution time.
From the analysis of results, it is possible to observe that the LODSE ontology caused improvements in social event classification. The tests performed have shown good results, especially in datasets where there is a large number of events and tags. In general, they demonstrated an average gain of 12.40% in the percentage of correctly classified events as well as a mean of gain of 5.89% in execution time which corresponds to less 276 s (4 min and 36 s) comparing to the LODE ontology. However, memory consumption remained greater than that of the LODE ontology due to the memory required to create the predictive model of the Random Forest algorithm. According to the results obtained, we conclude that our approach can be used in social event classification using only numerical data to describe a social event instead of textual metadata. The creation of the LODSE ontology helped the understanding of what the most important properties of an event are and that choosing only the numerical properties to use in the data model resulted in a better percentage of correctly classified events.
Despite the good results, there is a need to validate the same experimental evaluation but with real data. In future work, we intend to perform a new experimental evaluation with data from Facebook. The data should be in agreement with the data model of LODSE ontology and the same tests should be performed in order to understand if the results are better or not. We also intend to analyse the relevance of the attributes and applying feature selection techniques and performing the classification tests with different algorithms.
Author Contributions
The contributions to the paper are as follows. Conceptualization, M.R., R.R.S. and J.B.; Methodology, M.R. and R.R.S.; Software, M.R.; Validation and Formal Analysis, M.R., R.R.S. and J.B.; Investigation, M.R., R.R.S. and J.B.; Resources, M.R.; Writing—Original Draft Preparation, M.R.; Writing—Review & Editing, M.R., R.R.S. and J.B.; Supervision, J.B. and R.R.S.; Project Administration, J.B.; Funding, J.B.
Conflicts of Interest
The authors declare no conflict of interest.
References
- Shaw, R.; Troncy, R.; Hardman, L. LODE: Linking open descriptions of events. In Asian Semantic Web Conference; Springer: Berlin/Heidelberg, Germany, 2009; pp. 153–167. [Google Scholar]
- Troncy, R.; Fialho, A.; Hardman, L.; Saathoff, C. Experiencing Events through User-Generated Media. Available online: https://www.researchgate.net/profile/Raphael_Troncy/publication/228346078_Experiencing_Events_through_User-Generated_Media/links/09e41506c69fe5ad92000000/Experiencing-Events-through-User-Generated-Media.pdf (accessed on 8 May 2018).
- Barrigas, H.; Barrigas, D.; Barata, M.; Bernardino, J.; Furtado, P. Scalability of Facebook Architecture. In New Contributions in Information Systems and Technologies; Springer: Cham, Switzerland, 2015. [Google Scholar]
- Nguyen, D.; Le, T. Recommendation system for Facebook public events based on probabilistic classification and re-ranking. In Proceedings of the Eighth International Conference on Knowledge and Systems Engineering, Hanoi, Vietnam, 6–8 October 2016; pp. 133–138. [Google Scholar]
- Girolami, M.; Chessa, S.; Caruso, A. On Service Discovery in Mobile Social Networks: Survey and Perspectives. Available online: https://www.sciencedirect.com/science/article/pii/S1389128615001991 (accessed on 8 May 2018).
- Zeppelzauer, M.; Schopfhauser, D. Multimodal classification of events in social media. Image Vis. Comput. 2016, 53, 45–56. [Google Scholar] [CrossRef] [Green Version]
- Shaw, R.; Troncy, R. LODE: An Ontology for Linking Open Descriptions of Events. Available online: http://linkedevents.org/ontology/ (accessed on 8 May 2018).
- Dong, T.; Liang, C.; Xu, H. Social media and internet public events. Telemat. Inf. 2017, 34, 726–739. [Google Scholar] [CrossRef]
- Panagiotou, N.; Katakis, I.; Gunopulos, D. Detecting events in online social networks: Definitions trends and challenges. In Solving Large Scale Learning Tasks. Challenges and Algorithms; Springer International Publishing: Cham, Switzerland, 2016; pp. 42–44. [Google Scholar]
- Sutanto, T.; Nayak, R. ADMRG @ MediaEval 2013 Social Event Detection. Available online: https://eprints.qut.edu.au/63821/1/ADMRG-QUT_MediaEval_SED_2013.pdf (accessed on 28 June 2018).
- Benson, E.; Haghighi, A.; Barzilay, R. Event discovery in social media feeds. In Proceedings of the 49th Annual Meeting of the Association for Computational Linguistics: Human Language Technologies, Portland, OR, USA, 19–24 June 2011; pp. 389–398. [Google Scholar]
- Gupta, I.; Gautam, K.; Chandramouli, K. Vit @ MediaEval 2013 social event detection task: Semantic structuring of complementary information for clustering events. In Proceedings of the MediaEval Workshop, Barcelona, Spain, 18–19 October 2013. [Google Scholar]
- Nowak, S.; Lukashevich, H. Multilabel classification evaluation using ontology information. In Proceedings of the ESWC Workshop on Inductive Reasoning and Machine Learning on the Semantic Web, Heraklion, Crete, Greece, 1 June 2009. [Google Scholar]
- Guarino, N. Formal ontology and information systems. In Formal Ontology in Information Systems: Proceedings of the First International Conference (FOIS’98), June 6–8, Trento, Italy; IOS press: Amsterdam, The Netherlands, 1998; pp. 3–15. [Google Scholar]
- Noy, N.F.; Mcguinness, D. Ontology Development 101: A Guide to Creating Your First Ontology. Available online: http://www.corais.org/sites/default/files/ontology_development_101_aguide_to_creating_your_first_ontology.pdf (accessed on 28 June 2018).
- Grüninger, M.; Fox, M.S. Methodology for the Design and Evaluation of Ontologies. Available online: http://citeseerx.ist.psu.edu/viewdoc/summary?doi=10.1.1.44.8723 (accessed on 28 June 2018).
- Uschold, M.; Gruninger, M. Ontologies principles methods and applications. Knowl. Eng. Rev. 1996, 11, 93–136. [Google Scholar] [CrossRef]
- Weka 3: Data Mining Software in Java. Available online: https://www.cs.waikato.ac.nz/ml/weka/ (accessed on 28 June 2018).
- Russell, I.; Markov, Z. An introduction to the Weka data mining system. In Proceedings of the 11th Annual SIGCSE Conference on Innovation and technology in Computer Science Education, Bologna, Italy, 26–28 June 2006. [Google Scholar]
- Oshiro, T.M.; Perez, P.S.; Baranauskas, J.A. How many trees in a random forest? Lect. Notes Comput. Sci. 2012, 7376, 154–168. [Google Scholar]
- Rodrigues, M.A.; Silva, R.R.; Bernardino, J. An event search platform using machine learning. In Proceedings of the International Conference on Software Engineering and Knowledge Engineering (SEKE 2017), Pittsburgh, PA, USA, 5–7 July 2017; Available online: https://ksiresearchorg.ipage.com/seke/seke17paper/seke17paper_159.pdf (accessed on 28 June 2018).
- Breiman, L. Random forests. Mach. Learn. 2011, 45, 5–32. [Google Scholar] [CrossRef]
Figure 1.
A comparison between linking open descriptions of events (LODE) ontology and linking open descriptions of social events (LODSE) ontology.
Figure 1.
A comparison between linking open descriptions of events (LODE) ontology and linking open descriptions of social events (LODSE) ontology.

Figure 2.
Example of an ARFF File.

Figure 3.
Evolution of the percentage of correctly classified instances for 6, 30 and 96 tags.

Figure 4.
Evolution of memory consumption for 6, 30 and 96 tags.

Figure 5.
Evolution of execution time for 6, 30 and 96 tags.


Table 1.
Classes, properties and facets of LODSE ontology.
| Class | Properties | Facets |
|---|---|---|
| Event | eventID | number |
| eventName | string | |
| eventDescription | string | |
| eventPrice | number | |
| eventURL | string | |
| eventDateCreated | date | |
| eventDateModified | date | |
| Involved | involvedName | string |
| involvedDescription | string | |
| involvedOfficialWebsite | string | |
| Artist | artistID | number |
| organizationID | number | |
| Date StartDate EndDate | date | date |
| time | date | |
| allDay | boolean | |
| Venue | venueID | number |
| venueName | string | |
| venueDescription | string | |
| venueLatitude | number | |
| venueLongitude | number | |
| venueCapacity | number | |
| venuePostalCode | string | |
| City | cityID | number |
| Country | countryID | number |
| Taxonomy | name | string |
| Category | categoryID | number |
| Tag | tagID | number |
Table 2.
Classes, properties and facets of LODSE ontology.
| Attributes | Type |
|---|---|
| artist_id | numeric |
| event_start_hour | numeric |
| event_end_day_of_month | numeric |
| event_maybe_count | numeric |
| event_interested_count | numeric |
| event_attendind_count | numeric |
| venue_id | numeric |
| venue_longitude | numeric |
Table 3.
Classes, properties and facets of LODSE ontology.
| Attributes | Type |
|---|---|
| artist_id | numeric |
| category_id | numeric |
| event_start_hour | numeric |
| event_end_hour | Numeric |
| event_start_day_of_month | numeric |
| event_end_day_of_month | numeric |
| event_month | numeric |
| date_all_day | boolean |
| event_price | numeric |
| organization_id | numeric |
| venue_id | numeric |
| venue_latitude | numeric |
| venue_longitude | numeric |
| city_id | numeric |
| country_id | numeric |
© 2018 by the authors. Licensee MDPI, Basel, Switzerland. This article is an open access article distributed under the terms and conditions of the Creative Commons Attribution (CC BY) license (http://creativecommons.org/licenses/by/4.0/).
Share and Cite
MDPI and ACS Style
Rodrigues, M.; Rocha Silva, R.; Bernardino, J. Linking Open Descriptions of Social Events (LODSE): A New Ontology for Social Event Classification. Information 2018, 9, 164. https://doi.org/10.3390/info9070164
AMA Style
Rodrigues M, Rocha Silva R, Bernardino J. Linking Open Descriptions of Social Events (LODSE): A New Ontology for Social Event Classification. Information. 2018; 9(7):164. https://doi.org/10.3390/info9070164
Chicago/Turabian StyleRodrigues, Marcelo, Rodrigo Rocha Silva, and Jorge Bernardino. 2018. "Linking Open Descriptions of Social Events (LODSE): A New Ontology for Social Event Classification" Information 9, no. 7: 164. https://doi.org/10.3390/info9070164
Note that from the first issue of 2016, this journal uses article numbers instead of page numbers. See further details here.