Mean-Variance Analysis of Retailers Deploying RFID-Enabled Smart Shelves

1
Academy of Chinese Energy Strategy, China University of Petroleum-Beijing, 18 Fuxue Road, Changping, Beijing 102200, China
2
School of Economics and Management, Tianjin Chengjian University, 26 Jinjing Road, Xiqing, Tianjin 300384, China
*
Author to whom correspondence should be addressed.
Information 2018, 9(2), 40; https://doi.org/10.3390/info9020040
Submission received: 31 December 2017
/
Revised: 4 February 2018
/
Accepted: 10 February 2018
/
Published: 12 February 2018
(This article belongs to the Section Information Systems)
Abstract
:Radio frequency identification (RFID)-enabled smart shelves have recently attracted enormous attention from both industry and academia. Retailers have an explosion of interest in deploying smart shelves for the automatic ordering and the reduction of inventory inaccuracy. This study explores the retailers’ optimal policy for investing in a smart shelf inventory control system. Since the decision maker’s risk attitude plays an important role in its investment in technology, we therefore specifically consider the retailers’ risk attitude. The risk attitude is measured by the mean-variance analysis. We derive analytical expressions for the benefit of the smart shelf and specify the conditions under which retailers should invest in it. We also show the explicit relationship between the retailer’s risk attitude and his optimal policy. Finally, we conduct a numerical analysis to provide managerial insights for retailers to invest in smart shelves.

1. Introduction
Radio frequency identification (RFID) associates an object to a unique identification number, and enables detection and recognition of the tagged item. RFID provides item-level virtually full inventory transparency, i.e., identifies location and quantity for each item. Due to this advantage, the applications of RFID have been rapidly extended to diverse industries including retailing, food, logistics, health care, and manufacturing. Various RFID-based systems have been proposed for product tracing and tracking, real-time locating, as well as inventory control [1,2]. Taking the apparel retail industry for example, great attentions have been paid to RFID-based systems in avoiding stockouts [3], improving sales turnover [4], and enhancing customer shopping experiences [5].
This paper focuses on the application of RFID technology in terms of improving inventory accuracy. Recently, the RFID-enabled smart shelf inventory control system has received considerable attention. RFID-enabled smart shelves ensure product placement in desired locations and enable data collection and delivery along the supply chain without human intervention. Wal-Mart tested Gillette products on RFID-enabled smart shelves as early as 2003 [6]. Mondelez International, the company that makes snacks such as Oreo, Ritz crackers, and Wheat Thins, has applied smart shelves in stores since 2015. There exists a literature on the RFID-enabled smart shelf, which mainly focused on the configuration and technical solutions of smart shelves [7,8,9]. However, few theoretical research has analyzed the benefits of smart shelves. In particular, retailers will benefit more from RFID-based systems when they suffer from inventory inaccuracy, a prevalent problem in retail stores.
Inventory inaccuracy occurs when the inventory record shown in the information system is not in agreement with the actual available inventory. Several factors lead to inventory inaccuracy: permanent shrinkage in physical stock due to theft; random yield of the supplier; transaction errors at the checkout counter; and misplacement errors [10,11]. Inventory inaccuracy appears to be a major operation problem in supply chain management as reported in a number of empirical studies. Kang and Gershwin [12] reported the inventory inaccuracy problem of a global retailer with 500 stores. They found that the best performing store in their sample study had only 75–80% of its inventory records match the actual inventory, and the inventory accuracy was only 51% on average. In an in-depth study of 35 leading retailers, DeHoratius and Raman [13] discovered that 65% of all stock-keeping units have inaccurate inventory records upon inventory audits. They estimated that these errors reduced the retailers’ overall profits by 10% due to extra inventory carrying cost and lost sales. The stockout caused by misplacement errors has attracted considerable attentions from industries. Based on the survey from American Apparel, as many as 10% of items on the sales floor could be generally missing at selling periods. While the deployment of RFID system could make 99% of sales-floor inventory available to customers, leading to increases of sales by 15% to 25% [1]. IDtechEx also showed that the US apparel company GAP, increased sales by 2% with RFID implementation to reduce stockouts [14].
This study investigates the benefits of the retailer investing in a RFID-enabled smart shelf inventory control system, with special emphasis on the benefits stemming from the reduction of inventory inaccuracy. Several researchers are interested in the impact of RFID on reducing inventory errors. Zipkin [15] showed that RFID is particularly successful in reducing transaction errors. Zhu and Lee [16] illustrated the value of RFID technology for reducing misplacement errors. Lee [17] reported that RFID systems can lead to an increase in a retailer’s revenue by 2–7%. However, previous studies have only analyzed the impact of RFID implementation; none of them discussed the incentive of retailers from the perspective of investing in a RFID-enabled smart shelf inventory control system. Smart shelves can automatically alert store employees when inventory levels are running low or when items are misplaced. Moreover, when item quantity reaches the reorder level, the inventory control system can even send ordering information to suppliers without human intervention. We specifically model and analyze the retailer’s decisions with consideration of these properties.
There exists an extensive literature on the inventory inaccuracy problem. Rekik et al. [18] presented an analytical model of a newsvendor subject to misplacement errors. They compared three approaches to model this issue: the retailer remaining unaware of errors, taking errors into account, and deploying RFID technology to eliminate errors. Heese [19] considered the inventory record inaccuracy in a two-echelon supply chain model. He analyzed both the manufacturer’s and the retailer’s benefits from RFID adoption. However, previous studies have always postulated risk-neutral decision-makers: these studies aimed to maximize the retailer’s expected profit, which provided the best decisions on average while ignoring the variance of the profit. In reality, decision makers tend to show a risk-averse attitude when they face more uncertainty, which means that they are willing to give up some profits for avoidance of uncertainty [20,21,22]. Moreover, the retailer’s risk preference also plays an important role in making decisions about investment [22]. Therefore, it is crucial to consider the risk attitude of retailers.
Motivated by these observations, a few studies have analyzed the newsvendor problem with consideration of risk attitude. Expected utility (EU) maximization and mean-variance (MV) analysis are considered as two tenets for decision making under risk [23]. MV analysis is based on the consideration that decision makers usually make a trade-off between expected profit (mean) and expected uncertainty (variance) [22]. MV analysis has been utilized by numerous researchers because it is more analytically tractable and more robust compared with approaches based on EU [24,25]. However, most previous works utilizing MV analysis assumed accurate inventory records in the information system. If inventory inaccuracy is considered, the mean–variance tradeoff may be very different and some findings obtained in previous works may no longer be valid. Taking inventory inaccuracy into consideration, this paper aims to explore the retailer’s optimal policy for investing in the smart shelf inventory control system.
The contribution of this paper is threefold: (i) propose a RFID-enabled smart shelf inventory control system and conduct a cost-benefit analysis of the system; (ii) consider the retailer’s risk attitude under MV criterion, being the first MV analysis for retailers that are subject to inventory inaccuracy, and (iii) provide implications on RFID-enabled smart shelves investments from the perspective of reducing inventory inaccuracy.
The remainder of this paper is organized as follows. Section 2 presents two approaches of reducing inventory inaccuracy: conducting Cycle Counting or deploying the RFID-enabled inventory control system. In Section 3, we formulate the inventory models with and without smart shelves respectively. In Section 4, we derive the critical price of RFID tags for retailers to invest in smart shelves. In Section 5, a numerical analysis is conducted to explore the impact of RFID tag cost on the retailer’s decisions. Finally, Section 6 concludes this paper.
2. Problem Description
We consider a newsvendor framework in which the retailer purchases a seasonal product from the upstream supplier at unit cost w and sells the product to end customers at price r. Customer demand x is a random variable, and the decision variable of the retailer is the order quantity Q per period.
In a retail store, a discrepancy exists between the inventory record and the amount of product available for sale to customers. We assume that misplacement errors lead to this inaccurate inventory: employees sometimes put products on the wrong shelves, or customers may take items from one shelf and put them on another. Without smart shelves, the misplaced items are not available for current demand; they can only be found after physical counting.
We define as the ratio between the quantity of items that are available for sale and the total physical quantity in the store. For order quantity Q, only is available for customers, the remaining items are misplaced but can be found at the end of each period and sold at salvage price s. Normally, misplacement occurs gradually over time in real-life situations. However, the assumption of instantaneous misplacement is widely used in the literature for analytical tractability [18,26,27].
We will present two approaches for dealing with the inventory inaccuracy problem. Approach 1 can be described as a nontechnical solution, whereas Approach 2 can be seen as a technical solution.
Approach 1:
The retailer estimates misplacement errors by Cycle Counting.
The mostly used approach to deal with inventory inaccuracy is Cycle Counting. It is the process that employees check the retailer’s physical inventory at certain frequency. By Cycle Counting, the retailer uncovers factors that cause inventory inaccuracy and can estimate the value of . Then his ordering decisions are made by taking misplacement errors into account, which is much more profitable than that of ignoring the errors.
With the development of RFID technology, many retailers deploy hand-held RFID readers to facilitate Cycle Counting. It was estimated that RFID implementation could increase the speed of Cycle Counting five to eight times [1]. However, the application of hand-held RFID readers can only shorten Cycle Counting times by easing misplacement identification. The periodical Cycle Counting can’t eliminate misplacement errors nor correct inventory records instantly.
Approach 2:
The retailer deploys the RFID-enabled smart shelf inventory control system.
In this paper, we propose another solution: the RFID-enabled smart shelf inventory control system. This system is based on RFID technology; it can track the retailer’s inventory level instantaneously and automate the ordering process.
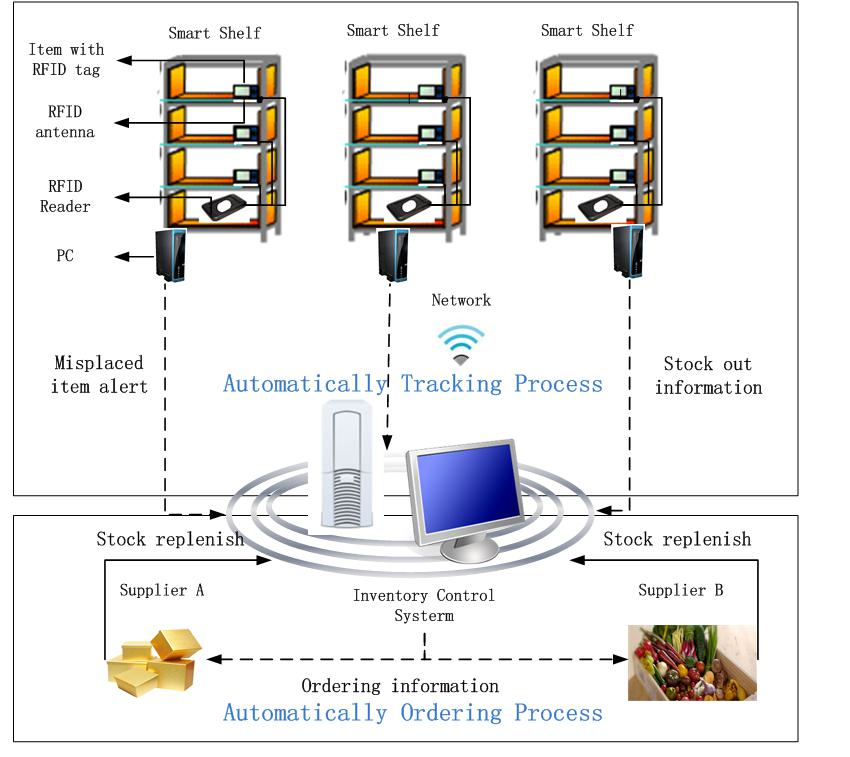
As shown in Figure 1, items placed on the shelf have RFID tags attached to them, a RFID reader is embedded underneath the shelf, and a RFID sheet antenna is placed on the surface of each layer in order to track RFID tags. Different with the hand-held RFID readers to facilitate Cycle Counting, the RFID-enabled smart shelf system with the attached readers and antennas can continuously monitor the inventory. Thus misplaced items can be detected immediately, and misplacement errors can be eliminated.
The main challenge in this system is that how far one antenna should be placed from another to avoid interference among them. Note that the antenna for the smart shelf is an evanescent radio wave pattern-based antenna, which can provide an almost rectangular read zone on top of it. This way, items in other layers are out of the read-zone of the antenna and will not be identified by it. Nowadays, more and more algorithms have been proposed to overcome the collision problem, enhance positioning accuracy, and improve the efficiency of RFID systems [28,29,30].
The top half of Figure 1 shows the automatically tracking process: with RFID sheet antennas connected to the reader, the RFID reader can detect signals from the tags of displayed items and deliver information to the mini PC server. Then information in terms of item’s unique identification number and location are collected in the system. In other words, by detecting the presence or absence of each item on the shelf, the smart shelf can automatically notify the inventory control system when inventory levels are running low or items are misplaced. The bottom half of Figure 1 shows the automatically ordering process: to make an order, firstly the system needs to compute the optimal order quantity for each type of item; when it is notified that the inventory level for certain item reaches its reorder point, the system can send ordering information to the corresponding supplier automatically; in this way, the stock got replenished without human intervention.
Despite the great advantages, the traceability system also imposes a considerable cost on the retailers. The cost of RFID tags and the initial investment to build up the infrastructures are major obstacles in the diffusion of RFID-enabled smart shelves in supply chain management [31]. Recently, many researchers have pointed out that the gradual reduction of RFID costs made it possible for extensive RFID applications [32]. However, cost remains one of the major barriers for RFID implementation. Therefore, the trade-off between the investment costs and the benefits derived from smart shelves becomes a crucial issue for the retailer. So in the next section, in order to estimate the value of a smart shelf system in a retail store, we develop mathematical models to compute the retailer’s optimal order quantity and the corresponding profit.
3. Inventory Models for the Retailer
To analyze when it is profitable to adopt smart shelves, we formulate inventory models for retailers with and without smart shelves. We analyze the investment decisions for two types of retailers. The risk-neutral retailer makes decisions that maximize his expected profit; while the risk-averse retailer is trying to maximize his utility with MV criterion.
The MV analysis was first proposed by Markowitz [33] to measure the risk associated with assets returns and was widely applied in both theoretical and practical studies. Under MV criterion, the utility is an increasing function of the expected profit (mean) but a decreasing function of uncertainty and risk sensitivity (variance). The following mean-variance analysis is utilized to formulate the risk-averse retailer’s decision model:
where k is the tradeoff between profit and uncertainty. Note that k = 0 denotes the risk-neutral case, where the retailer is indifferent to profit uncertainty, and his satisfaction depends only on the expected profit.
3.1. Inventory Model without the Smart Shelf System
First, we model the case of a retailer without the smart shelf system. In this situation, when retailer orders Q items, only are available, the remaining items are found later and sold at salvage price s.
The retailer’s profit is given by
where x denotes random demand. The first term in Equation (2) is the revenue from sales, and the second one represents the revenue from salvage of misplaced inventory, while the last one corresponds to the cost of purchase. Note that this paper focuses on the impact of inventory inaccuracy on retailers’ decisions and the approaches to deal with inventory inaccuracy. Hence the estimation of costs related to Cycle Counting, such as labor cost and infrastructure cost of RFID readers, are beyond the scope of this study.
Equation (2) can also be written as
where u is the underage cost with, and h is the holding cost with .
The expected profit function is expressed as follows:
Theorem 1.
The risk-neutral retailer has a unique optimal order quantity, which is
Proof of Theorem 1.
The risk-neutral retailer’s objective is to maximize the expected profit. It is straightforward to show that the retailer’s profit function (Equation (4)) is concave with respect to Q. From the first-order condition, we obtain the optimal solution. ☐
For a risk-averse retailer, the risk is measured by the variance of the profit, where the variance function is given by
Theorem 2.
The variance function is a monotone increasing function of Q, with lower bound and upper bound , where is the variance of the demand.
Proof.
Taking the first-order derivative of with respect to Q, we obtain
It is easy to confirm that , thus, is a monotone increasing function of Q. We then prove the boundness of . From Equation (6), it is intuitive that . Furthermore, Equation (6) can be revised as
Under the mild assumption that x has a finite second moment which is , we have . Since for all x, when , we have . We then revise Equation (8) as
This completes the proof. ☐
The corollary below follows directly from Theorems 1 and 2.
Corollary 1.
With misplacement errors, the risk-averse retailer orders no more than the risk-neutral retailer.
Proof.
The second-order derivative of the variance function with respect to Q is given by
From Equation (10), it is straightforward to know that when Q = 0, ; and when . Note that is a concave increasing function and . So there exists at least one positive utility for the retailer in interval .
Moreover, for any , we have and , thus, all are dominated by , and thereby the optimal order quantity of the risk-averse retailer, , is in the range of . ☐
Since the range for is given, a simple search algorithm can be applied to search for the optimal order quantity of the risk-averse retailer, and can be used as the initial solution for the search algorithm.
3.2. Inventory Model with the Smart Shelf System
As mentioned in Section 2, the RFID-enabled smart shelf system can detect misplaced items and help employees to replace them on the correct shelf, thus eliminating misplacement errors in retail stores.
Besides the fixed costs related to the implementation and operation of smart shelf system, such as infrastructure cost, software cost, hardware cost, and training cost, the substantial cost of RFID tags seems to prohibit widespread application of item-level RFID [19]. This paper aims to explore the relationship between the economics of RFID-enabled system and the inventory inaccuracy, rather than obtain the exact profit. Therefore, we assume no fixed cost in the model, which was also assumed in many works related to RFID technology, such as Rekik et al. [18], Heese [19], Xu et al. [11], and Wang et al. [26]. Nonetheless, the net profit stemming from the system can be generated by subtracting the fixed cost calculated by a net present value type analysis from the profit obtained from the current model.
With the smart shelf system, there is no misplacement error, i.e., and with the additional tag cost t, we have (we set to avoid trivial cases). Thus, the retailer’s profit is given by
The expected profit function is
where u′ is the underage cost with , and h′ is the holding cost with .
Theorem 3.
is concave in order quantity Q, and the optimal order quantity of the risk-neutral retailer is
The proof of Theorem 3 is similar to that of Theorem 1 and there by omitted.
The variance function of the retailer’s profit is given by
Theorem 4.
The variance function is a monotone increasing function of Q, and under the mild assumption that the second moments of x are finite, is bounded in .
The proof of Theorem 4 is similar to that of Theorem 2. From the results of Theorems 3 and 4, we can draw the following conclusion:
Corollary 2.
With smart shelves, the risk-averse retailer orders no more than the risk-neutral retailer.
4. The Condition for Investing in Smart Shelves
The retailer’s adoption decision should be made by balancing the value of the smart shelf against its cost. Although we can get the closed-form expression of the optimal order quantity for the risk-neutral retailer, the calculation of the maximized profit is complex with general demand distribution. To obtain closed-form analytical expressions, we assume that customer demand is uniformly distributed, which is commonly adopted in inventory management literature [11,19,34,35].
When the demand follows uniform distribution U[0, 1], from Equations (4) and (5), we obtain the profit function for the non-smart shelf retailer, as follows
with an optimal order quantity of
For the retailer adopting smart shelves, the expected profit with uniform distributed demand is derived from Equation (12), as follows
and the optimal order quantity is
In practice, the decision makers want to know when it is more profitable to invest in smart shelves compared with the traditional Cycle Counting approach. Therefore, we specify the critical price indicating when the smart shelf system is more profitable.
Proposition 1.
The critical price that makes is given by
Only when the actual RFID tag cost , it is profitable for the retailer to adopt smart shelves. Note that ignoring the fixed cost can lead to underestimation of the RFID critical tag cost and overestimation of the benefits of RFID-enabled system. Therefore, one can think of our model as an approximation to a real-life setting where the critical tag cost provided can be perceived as an upper bound. The negative relationship between and indicates that the more significant of misplaced errors (i.e., smaller ), the higher tag cost the retailer can tolerate, meaning that the retailer will have a higher tendency to deploy smart shelves. Note that when misplacement errors are serious (i.e., when ), it is always cost-effective to deploy smart shelves. Otherwise, when inventory error is relatively small, the critical tag price increases with the holding cost and is independent of the selling price.
For risk-averse retailers (i.e., when k > 0), the objective function is complex due to the variance term. Since the theoretical analysis of the model is intractable, we conduct a numerical analysis to show the benefits of risk-averse retailers investing in smart shelves.
5. Numerical Analysis
The main objective of the numerical analysis is threefold. First, we explore the impact of inventory inaccuracy on the retailer’s ordering policy. Second, we investigate the impact of risk attitude on the benefit of smart shelves. Last but not least, we analyze sensitivity of the cost parameters to the investment decisions.
Without loss of generality, we assume the demand follows uniform distribution U[0, 1], and the parameters are valued as r = 100, w = 70, s = 50, k = 0.1, and t = 5.
5.1. Impact of Inventory Inaccuracy on the Retailer’s Ordering Policy
Figure 2 shows the impact of inventory inaccuracy on both the risk-neutral and risk-averse retailers. The x-axis represents misplacement errors and the y-axis represents the optimal order quantity. We set vary from 0.3 to 1, with denoting the case of no misplacement error when the smart shelf is deployed. Figure 2 indicates the non-monotonicity of the optimal order quantity in misplacement errors.
With decreasing from 1, the retailer orders more to make up for the quantity of misplaced. When decreases to a certain level, the retailer orders the maximum quantity. Afterwards, the retailer orders less and eventually stops ordering when . The reason behind this is that the evolution of with is the tradeoff between the underage cost and the holding cost. When is low, the quantity of available items is small even with a large Q. Meanwhile, the misplaced items will be held until the end of the period, which lead to the holding cost. By balancing out the underage cost for shortage and holding cost for misplaced items, the retailer makes the ordering policy which is non-monotonicity in misplaced errors.
On the other hand, we observe a monotonous relationship between misplacement errors and the retailer’s profit (utility).
Table 1 shows that the non-smart shelf retailer’s expected profit and expected utility monotonically increase with . It is intuitive that when the misplacement errors get serious, the retailer without smart shelves suffers more from inaccurate inventory and obtains less profit and utility. Table 1 also shows that the critical price of RFID tag increases as misplacement errors increase, indicating that the monotonous relationship also holds for retailers deploying smart shelves.
Our observations explain the phenomenon that retailers such as Wal-Mart, TESCO, and Metro AG have been scurried to test the best implement of RFID and smart shelves; whereas few suppliers have made effort for this, even though the upstream suppliers can also benefit from inventory visibility with RFID implementation. The reason is twofold. First, along a supply chain, inventory inaccuracy is found especially prevalent in retail stores. So the retailers have stronger incentives to deploy the RFID technology for reduction of inventory inaccuracy. Second, the retailers with certain level of inventory inaccuracy order more from the suppliers than retailers with accurate inventory record. This seems one of the reasons prohibiting RFID adoption by the upstream suppliers.
5.2. Impact of Risk Attitude on the Benefit of Smart Shelves
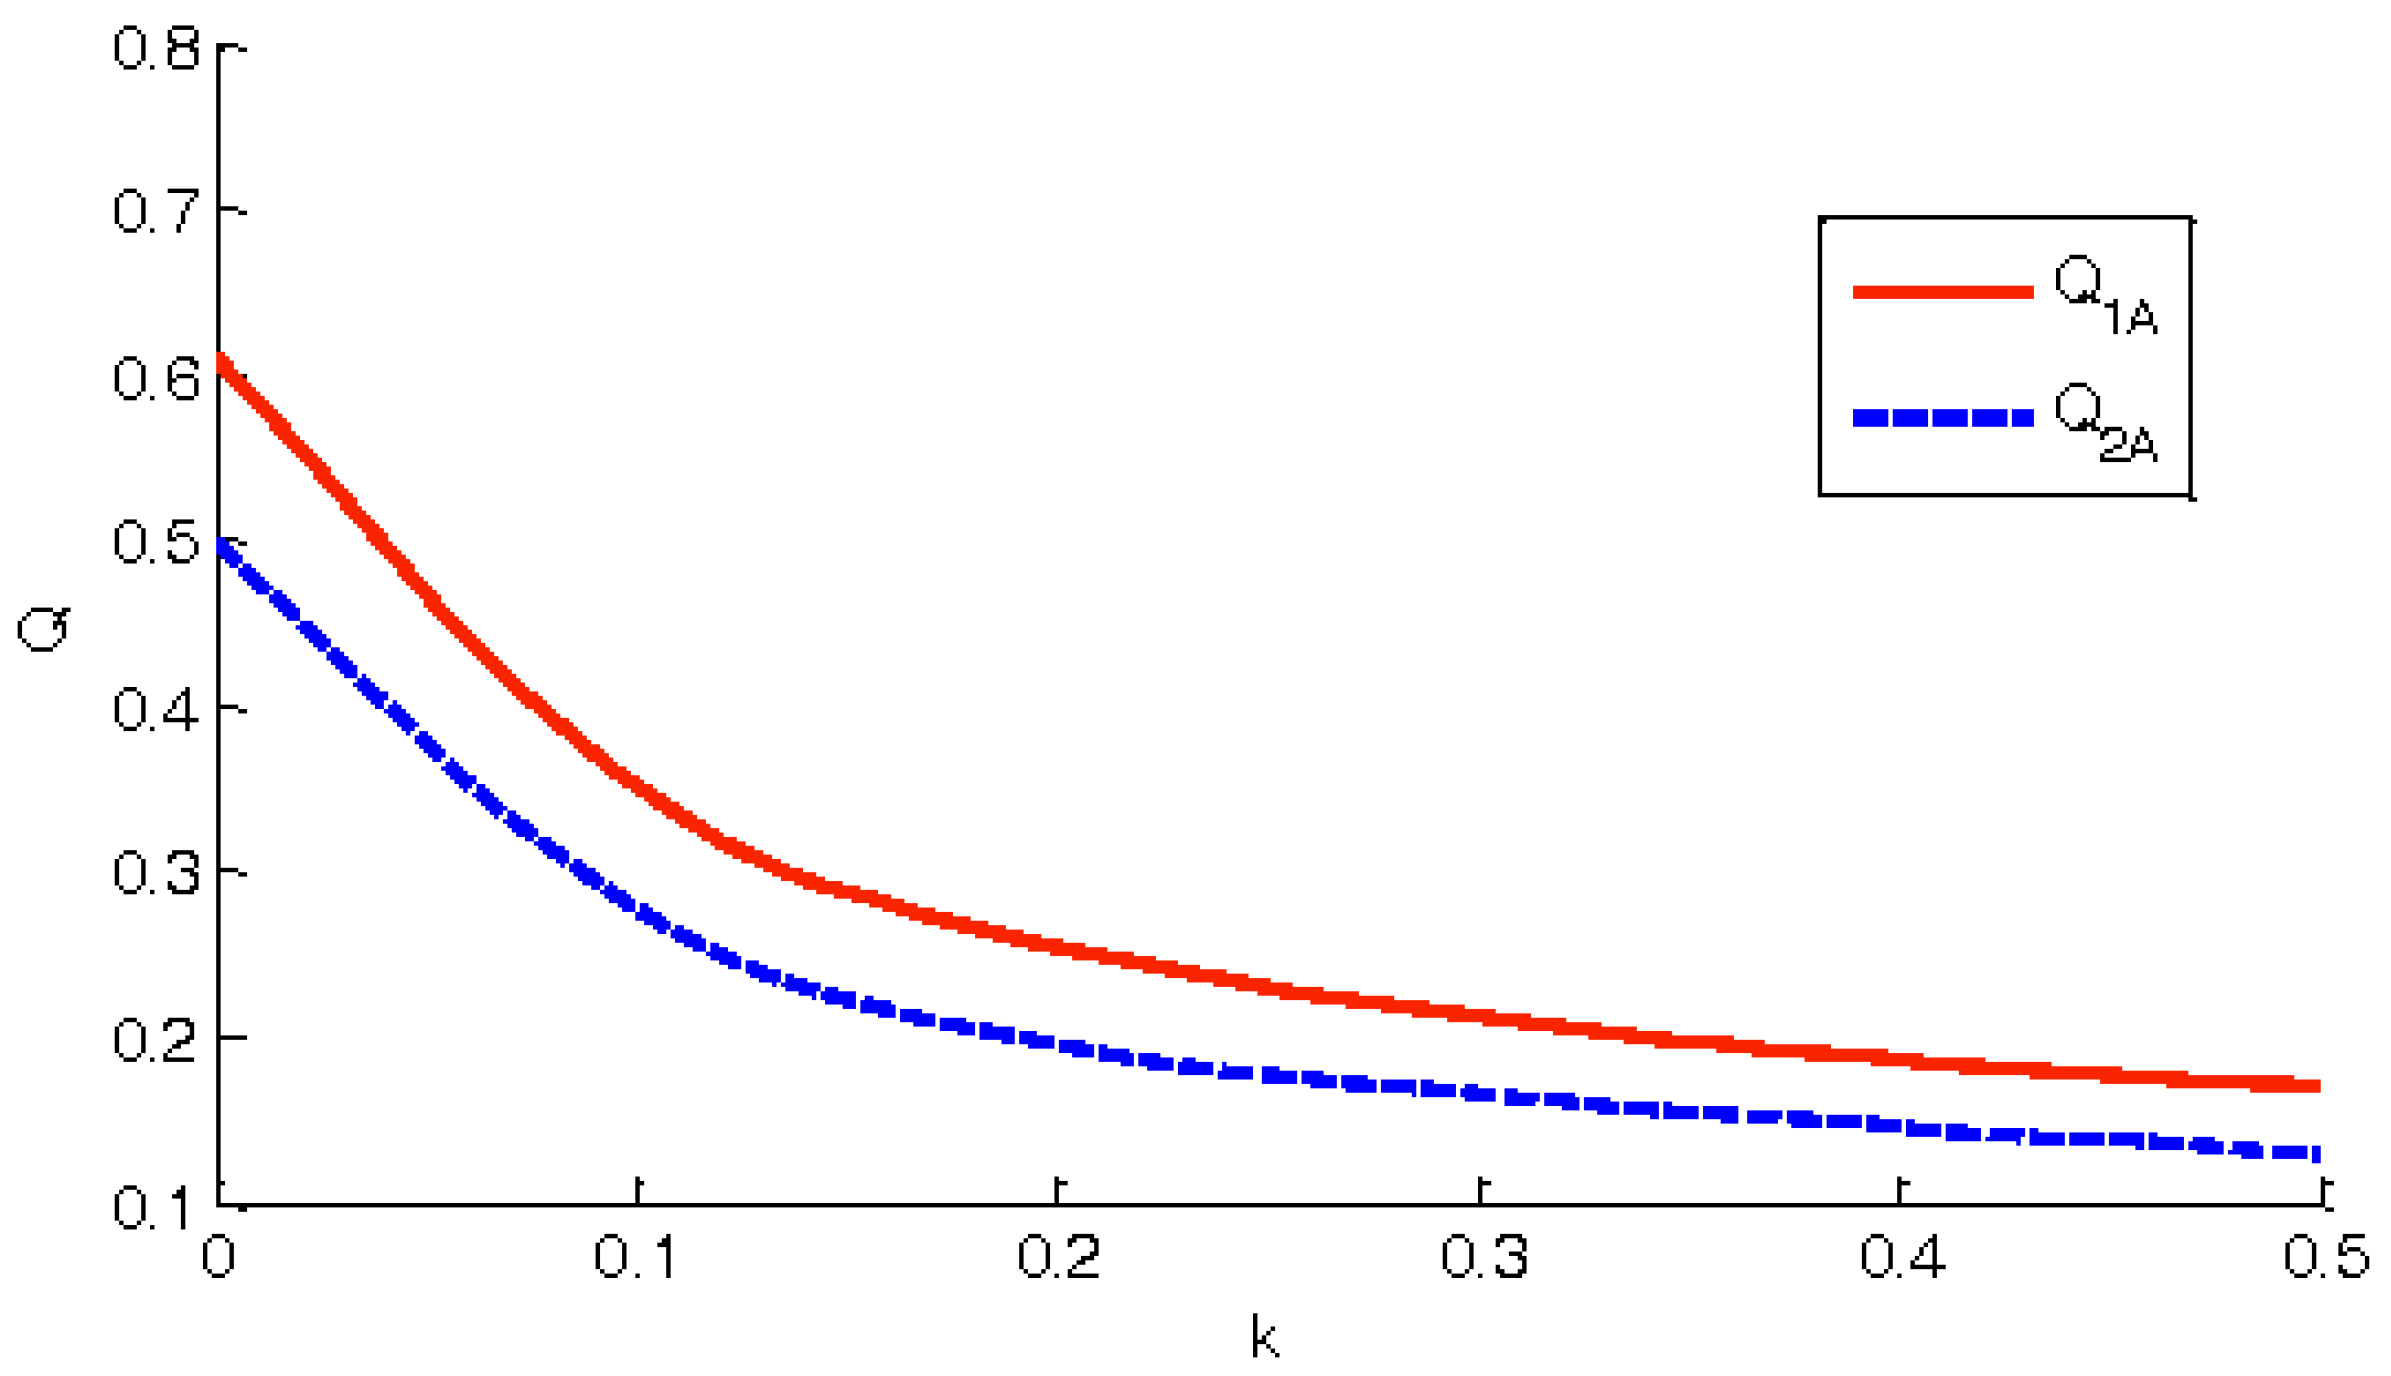
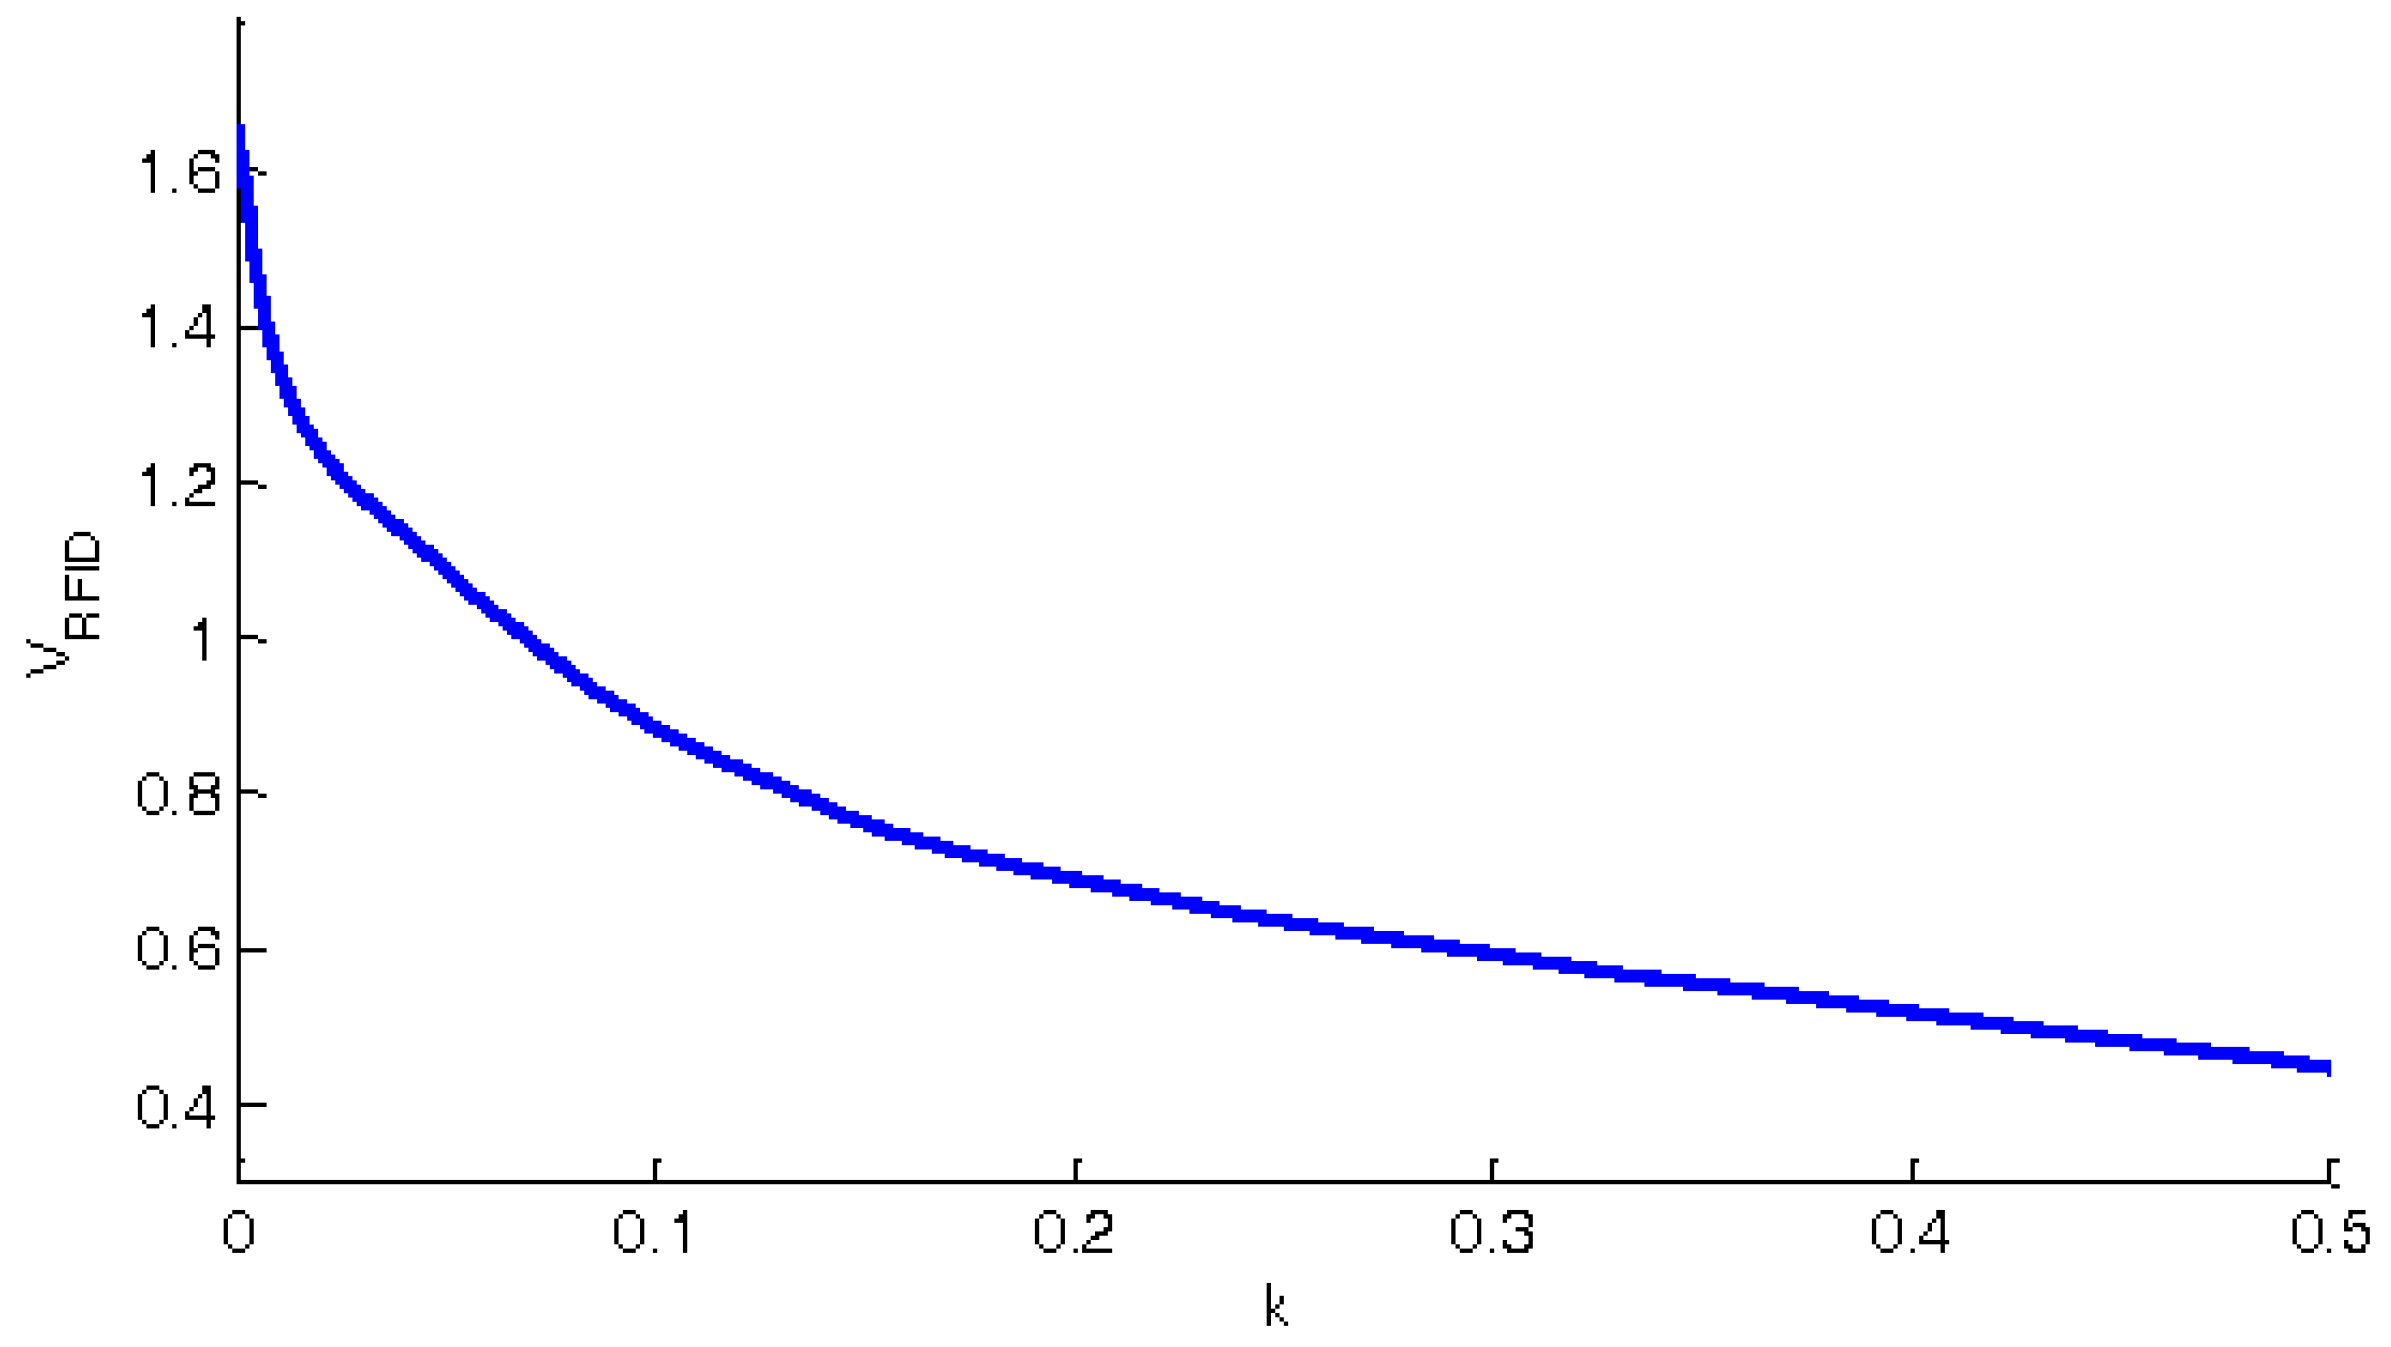
Figure 3 illustrates the impact of risk attitude on the ordering policy. The x-axis represents the retailer’s risk attitude. With k increasing from 0 to 0.5, the retailer’s risk averseness gets stronger. Note that k = 0 is a special case that denotes the risk-neutral retailer. Figure 3 shows that the retailer’s risk attitude has a negative relationship with the optimal order quantity, i.e., the more risk averse the retailer is, the less he orders. This result is consistent with previous studies.
Averseness to risk makes the retailer give up some profits to reduce the uncertainty. Consequently, profit and utility decrease with the degree of risk aversion for both non-smart shelf retailers and retailers deploy smart shelves. So how does the risk attitude of retailers affect their expected profit or utility? We define as the benefits of adopting a RFID-enabled smart shelf system, where . Figure 4 shows that the benefit of smart shelves decreases with the retailer’s degree of risk aversion. In other words, the more risk-averse the retailer becomes, the less likely for him to invest in smart shelves.
5.3. Sensitivity of the Cost Parameters to the Investment Decisions
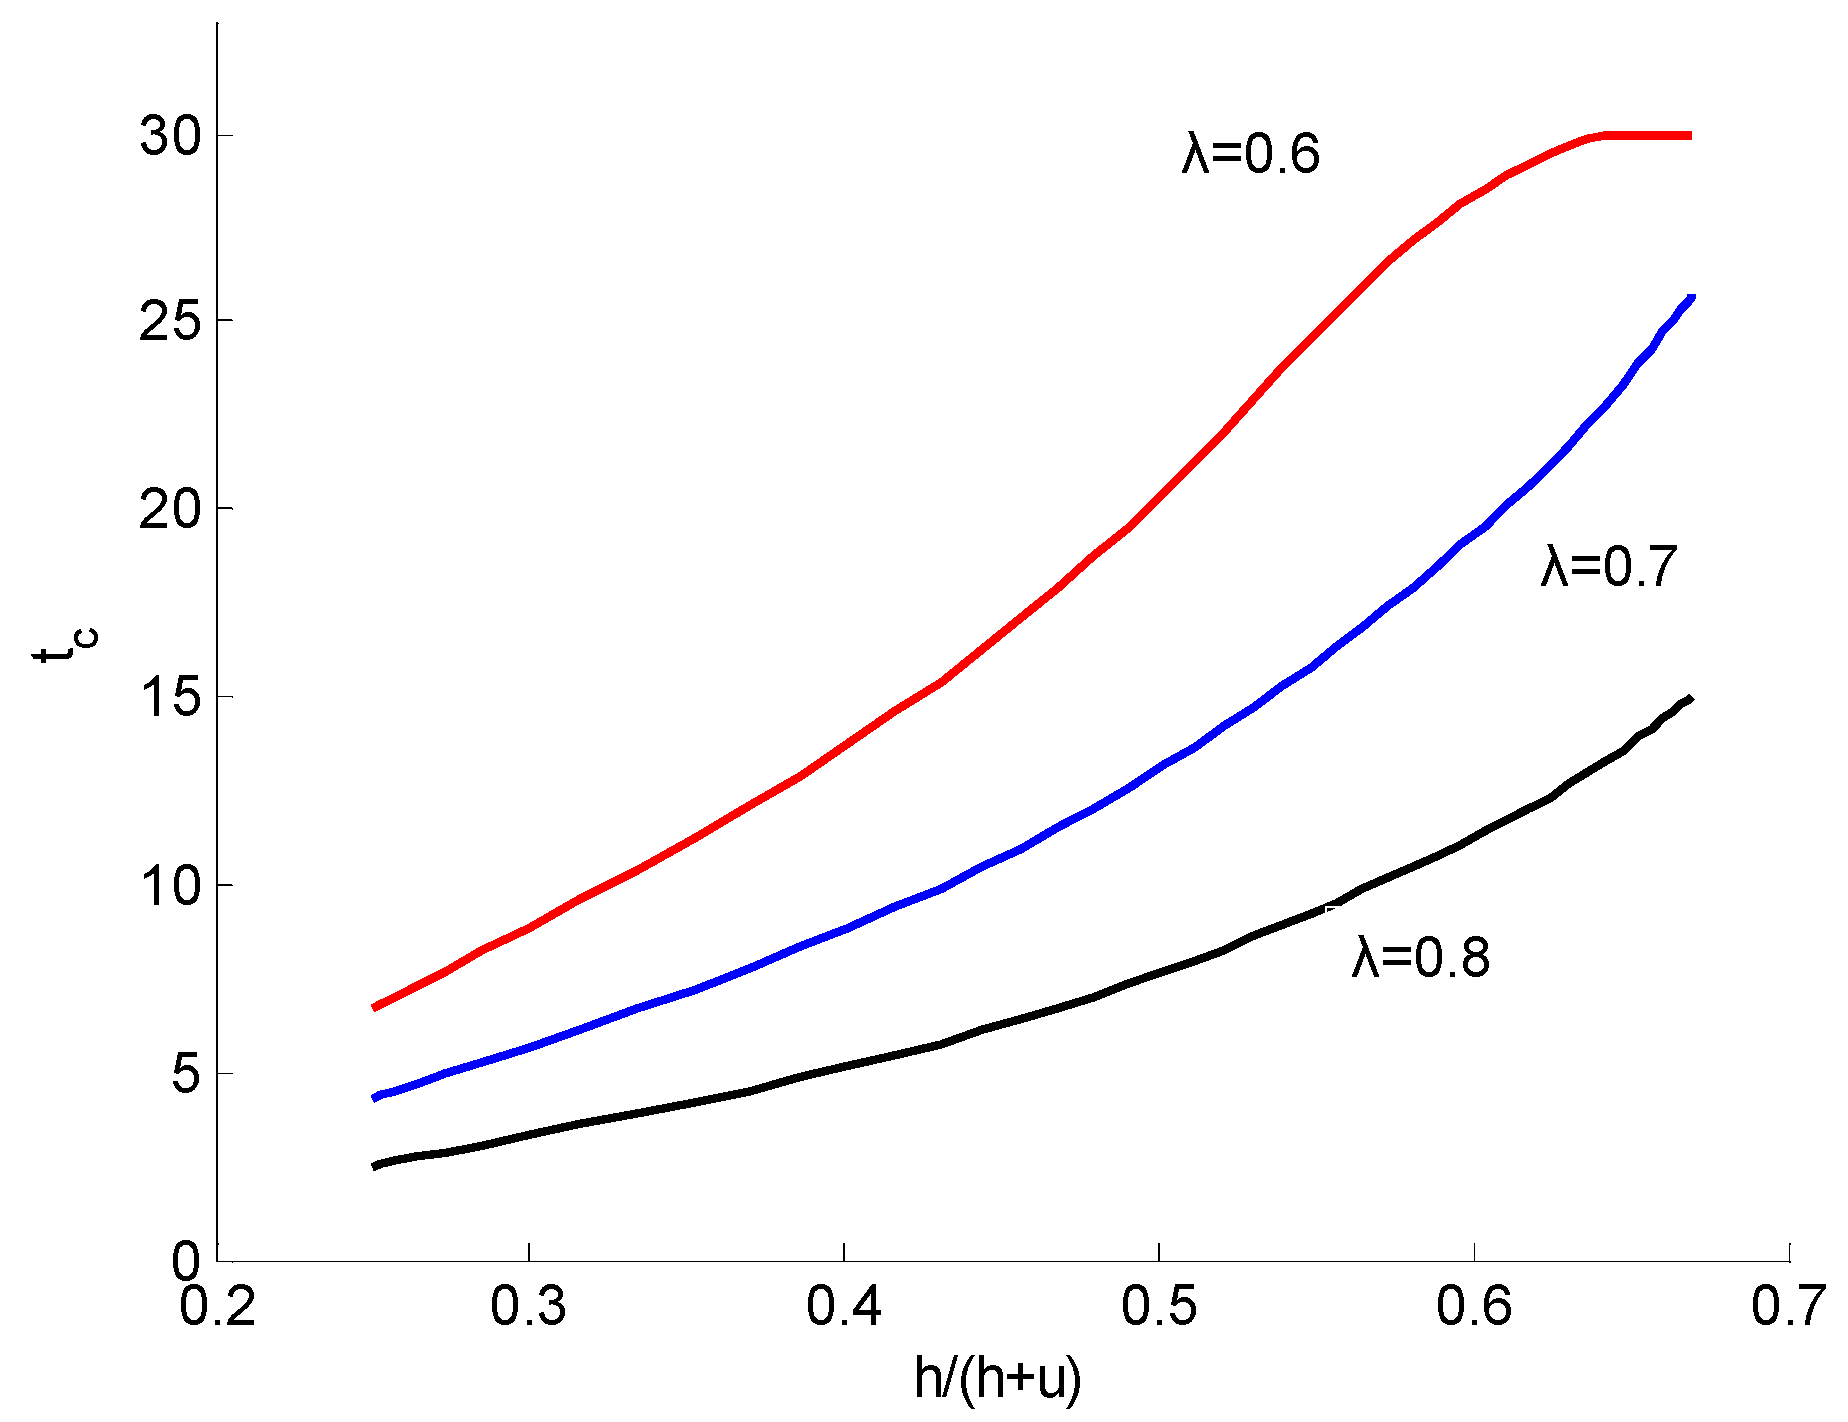
We analyze the sensitivity of the cost parameters to the investment decisions. In particular, we explore the impact of holding cost on the retailer’s optimal decision.
The x-axis of Figure 5 represents the share of holding cost in the summation of holding cost and underage cost. The share of the holding cost varies from 0.2 to 0.7 when we fix k = 0.1, r = 100, w = 70, t = 5 and change the value of s from 10 to 60.
Figure 5 illustrates that when , the critical price of RFID tag increases with proportion of the holding cost. This is because with fixed misplacement errors, the larger the ratio of the holding cost, the more costly the misplaced items, and thus, the more profitable the smart shelf system.
Therefore, we infer that the smart shelf system is particularly practicable for products with a low salvage price. In other words, our findings provide theoretical support for perishable products industry to deploy smart shelves, such as the fashion industry, the perishable media industry, and the food industry.
In the fashion industry, trends may change for a short period so that the misplaced items may become out of season and have tiny value at the end of the selling season. Therefore, fashion retailers intend to deploy smart shelves to ensure that the right item is available for customers at the right time [36]. Another example is the perishable media such as CDs and DVDs, for which most sales occur in the few weeks it is published. With smart shelves, the retailer can immediately replace the misplaced CDs or DVDs [37]. Perishable food such as milk and meat usually has limited useful life. If not handled properly during retailing, it may get spoilt or its life value will reduce. When the perishable food is misplaced outside the refrigerated section for a period of time, than the misplaced food would have less life value and should be sold at a discount price. The food industry is making effort to extend smart shelves to calculate freshness status of perishable food, which will lead to less waste and higher profit [38]. These positive performances of smart shelves offer a strong business case for retailers in various industries.
6. Conclusions
This study analyzed the optimal policy of retailers that are subject to inventory inaccuracy. We compared two approaches of tackling the inventory inaccuracy problem, conducting Cycle Counting and implementing a RFID-enabled smart shelf inventory control system. We contributed to the literature by analyzing the impact of risk attitude on the retailer’s decisions. The retailer’s optimal order quantity was derived under the mean-variance analysis. We proved that the risk-averse retailer orders no more than the risk-neutral retailer no matter the smart shelf is deployed or not. We also found that the deployment of smart shelves may not be more profitable compared with the nontechnical approach. It is only cost-effective when RFID tag costs no more than the critical price, which is affected by the level of inventory inaccuracy, cost parameters such as holding cost and underage cost.
Our analytical and numerical results provided some managerial insights for retailers investing in smart shelves. First, compared with the upstream suppliers, the downstream retailers benefit more from the RFID technology and hence have stronger incentives to deploy smart shelves. Second, the benefit of smart shelves decreases with the retailer’s degree of risk aversion, so risk-neutral retailers have a higher tendency to invest in smart shelves compared with risk-averse retailers. Last but not least, we showed that the smart shelf system is especially practicable for perishable products, such as apparel, DVDs and food.
Acknowledgments
This work was also supported by the Ministry of Education in China (MOE) Project of Humanities and Social Sciences (Project No. 15YJC630195).
Author Contributions
Lijing Zhu contributed to the preparation of the whole paper and the model development. Peize Wang participated in methodology discussions. Sha Xi proposed the idea and contributed to the numerical analysis.
Conflicts of Interest
The authors declare no conflict of interest.
Abbreviations
The following abbreviations are used in this manuscript:
| R | Selling price per item |
| s | Salvage price per item |
| w | Purchasing cost per item |
| t | RFID tag cost per item |
| k | Parameter that reflects the retailer’s degree of risk aversion |
| x | Random demand |
| Probability density function (pdf) of x | |
| Cumulative distribution function (CDF) of x | |
| Ratio between the available quantity for sale and the total physical quantity in the store | |
| Profit of the retailer with random demand | |
| Mean of the profit | |
| Variance of the profit | |
| Utility of the profit | |
| Optimal order quantity (decision variable) ( denotes approach 1 and approach 2 respectively denotes risk-neutral and risk-averse respectively) |
References
- Zhu, X.; Mukhopadhyay, S.K.; Kurata, H. A review of RFID technology and its managerial applications in different industries. J. Eng. Technol. Manag. 2012, 29, 152–167. [Google Scholar] [CrossRef]
- Uckelmann, D.; Romagnoli, G. Rf-based locating of mobile objects. In Proceedings of the International Conference on the Internet of Things, Linz, Austria, 22–25 October 2017; pp. 147–154. [Google Scholar]
- Wen, T.C.; Chang, Y.C.; Chang, K.H. Cost-benefit analysis of RFID application in apparel retailing for SME: A case from taiwan. Transp. J. 2010, 49, 57–66. [Google Scholar]
- Bottani, E.; Montanari, R.; Romagnoli, G. Improving sales turnover in fashion retailing by means of an RFID-based replenishment policy. Int. J. RF Technol. Res. Appl. 2016, 7, 65–86. [Google Scholar] [CrossRef]
- Choi, S.H.; Yang, Y.X.; Yang, B.; Cheung, H.H. Item-level RFID for enhancement of customer shopping experience in apparel retail. Comput. Ind. 2015, 71, 10–23. [Google Scholar] [CrossRef] [Green Version]
- Gragg, J. The Emergence of RFID Technology in Modern Society; Oregon State University: Corvallis, OR, USA, 2003. [Google Scholar]
- Medeiros, C.R.; Costa, J.R.; Fernandes, C.A. RFID smart shelf with confined detection volume at UHF. IEEE Antennas Wirel. Propag. Lett. 2008, 7, 773–776. [Google Scholar] [CrossRef]
- Qing, X.; Chen, Z.N. Characteristics of a metal-backed loop antenna and its application to a high-frequency RFID smart shelf. IEEE Antennas Propag. Mag. 2009, 51, 26–38. [Google Scholar] [CrossRef]
- Wang, F.; Liu, S.; Liu, P.; Bai, Y. Bridging physical and virtual worlds: Complex event processing for RFID data streams. In Proceedings of the International Conference on Advances in Database Technology, Munich, Germany, 26–31 March 2006; pp. 588–607. [Google Scholar]
- Atali, A.; Lee, H.L.; Özer, Ö. If the Inventory Manager Knew: Value of Visibility and RFID under Imperfect Inventory Information. 2009. Available online: http://ssrn.com/abstract=1351606 (accessed on 11 February 2018).
- Xu, J.; Wei, J.; Tian, J. Comparing improvement strategies for inventory inaccuracy in a two-echelon supply chain. Eur. J. Oper. Res. 2012, 221, 213–221. [Google Scholar] [CrossRef]
- Kang, Y.; Gershwin, S.B. Information inaccuracy in inventory systems: Stock loss and stockout. IIE Trans. 2005, 37, 843–859. [Google Scholar] [CrossRef]
- Dehoratius, N.; Raman, A. Inventory record inaccuracy: An empirical analysis. Manag. Sci. 2008, 54, 627–641. [Google Scholar] [CrossRef]
- Cost Reduction in Retailing & Products Using Rfid. Available online: http://www.idtechex.com/research/articles/cost_reduction_in_retailing_and_products_using_rfid_00000205.asp (accessed on 16 April 2008).
- Zipkin, P. Om forumthe best things in life were free: On the technology of transactions. Manuf. Serv. Oper. Manag. 2006, 8, 321–329. [Google Scholar] [CrossRef]
- Zhu, L.; Lee, C. Risk analysis of a two-level supply chain subject to misplaced inventory. Appl. Sci. 2017, 7, 676. [Google Scholar] [CrossRef]
- Lee, H.; Özer, Ö. Unlocking the value of RFID. Prod. Oper. Manag. 2007, 16, 40–64. [Google Scholar] [CrossRef]
- Rekik, Y.; Sahin, E.; Dallery, Y. Analysis of the impact of the rfid technology on reducing product misplacement errors at retail stores. Int. J. Prod. Econ. 2008, 112, 264–278. [Google Scholar] [CrossRef]
- Heese, H.S. Inventory record inaccuracy, double marginalization, and RFID adoption. Prod. Oper. Manag. 2007, 16, 542–553. [Google Scholar] [CrossRef]
- Choi, T.M.; Li, D.; Yan, H.; Chiu, C.H. Channel coordination in supply chains with agents having mean-variance objectives. Omega 2008, 36, 565–576. [Google Scholar] [CrossRef]
- Gan, X.; Sethi, S.P.; Yan, H. Channel coordination with a risk-neutral supplier and a downside-risk-averse retailer. Prod. Oper. Manag. 2010, 14, 80–89. [Google Scholar] [CrossRef]
- Xiao, T.; Yang, D. Price and service competition of supply chains with risk-averse retailers under demand uncertainty. Int. J. Prod. Econ. 2008, 114, 187–200. [Google Scholar] [CrossRef]
- Nakamura, Y. Mean-variance utility. J. Econ. Theory 2015, 160, 536–556. [Google Scholar] [CrossRef]
- Wu, J.; Li, J.; Wang, S.; Cheng, T.C.E. Mean–variance analysis of the newsvendor model with stockout cost. Omega 2009, 37, 724–730. [Google Scholar] [CrossRef]
- Tsay, A.A. Risk sensitivity in distribution channel partnerships: Implications for manufacturer return policies. J. Retail. 2002, 78, 147–160. [Google Scholar] [CrossRef]
- Wang, F.; Fang, X.; Chen, X.; Li, X. Impact of inventory inaccuracies on products with inventory-dependent demand. Int. J. Prod. Econ. 2016, 177, 118–130. [Google Scholar] [CrossRef]
- Camdereli, A.Z.; Swaminathan, J.M. Misplaced inventory and radio-frequency identification (rfid) technology: Information and coordination. Prod. Oper. Manag. 2010, 19, 1–18. [Google Scholar] [CrossRef]
- Fu, Z.; Deng, F.; Wu, X. Design of a quaternary query tree aloha protocol based on optimal tag estimation method. Information 2016, 7, 5. [Google Scholar] [CrossRef]
- Wang, C.; Shi, Z.; Wu, F. An improved particle swarm optimization-based feed-forward neural network combined with RFID sensors to indoor localization. Information 2017, 8, 9. [Google Scholar] [CrossRef]
- Hua, F.; Wu, Q.; Lin, Y.; Zhang, J. A split-path schema-based RFID data storage model in supply chain management. Sensors 2013, 13, 5757–5776. [Google Scholar]
- Zhu, L. Economic analysis of a traceability system for a two-level perishable food supply chain. Sustainability 2017, 9, 682. [Google Scholar] [CrossRef]
- Shi, Z.; Zhang, X.; Wang, Y. A lightweight rfid grouping-proof protocol based on parallel mode and DHCP mechanism. Information 2017, 8, 85. [Google Scholar]
- Markowitz, H.M. Portfolio Selection: Efficient Diversification of Investments, 2nd ed.; Yale University Press: City of New Haven, CT, USA, 1991; Volume 35, pp. 243–265. [Google Scholar]
- Inderfurth, K. Analytical solution for a single-period production-inventory problem with uniformly distributed yield and demand. Cent. Eur. J. Oper. Res. 2004, 12, 117–127. [Google Scholar]
- Sahina, E.; Dallery, Y. Analysis of a newsvendor which has errors in inventory data records. Eur. J. Oper. Res. 2008, 188, 370–389. [Google Scholar] [CrossRef]
- Moon, K.L.; Ngai, E.W.T. The adoption of rfid in fashion retailing: A business value-added framework. Ind. Manag. Data Syst. 2008, 108, 596–612. [Google Scholar] [CrossRef]
- Gaukler, G.M.; Seifert, R.W.; Hausman, W.H. Item-level rfid in the retail supply chain. Prod. Oper. Manag. 2007, 16, 65–76. [Google Scholar] [CrossRef]
- Kaye, S. Inference Electronic Shelf Life Dating System for Perishables. U.S. Patent US9710754 B2, 18 July 2017. [Google Scholar]
Figure 1.
A smart shelf inventory control system architecture.

Figure 2.
The variation of Q with .
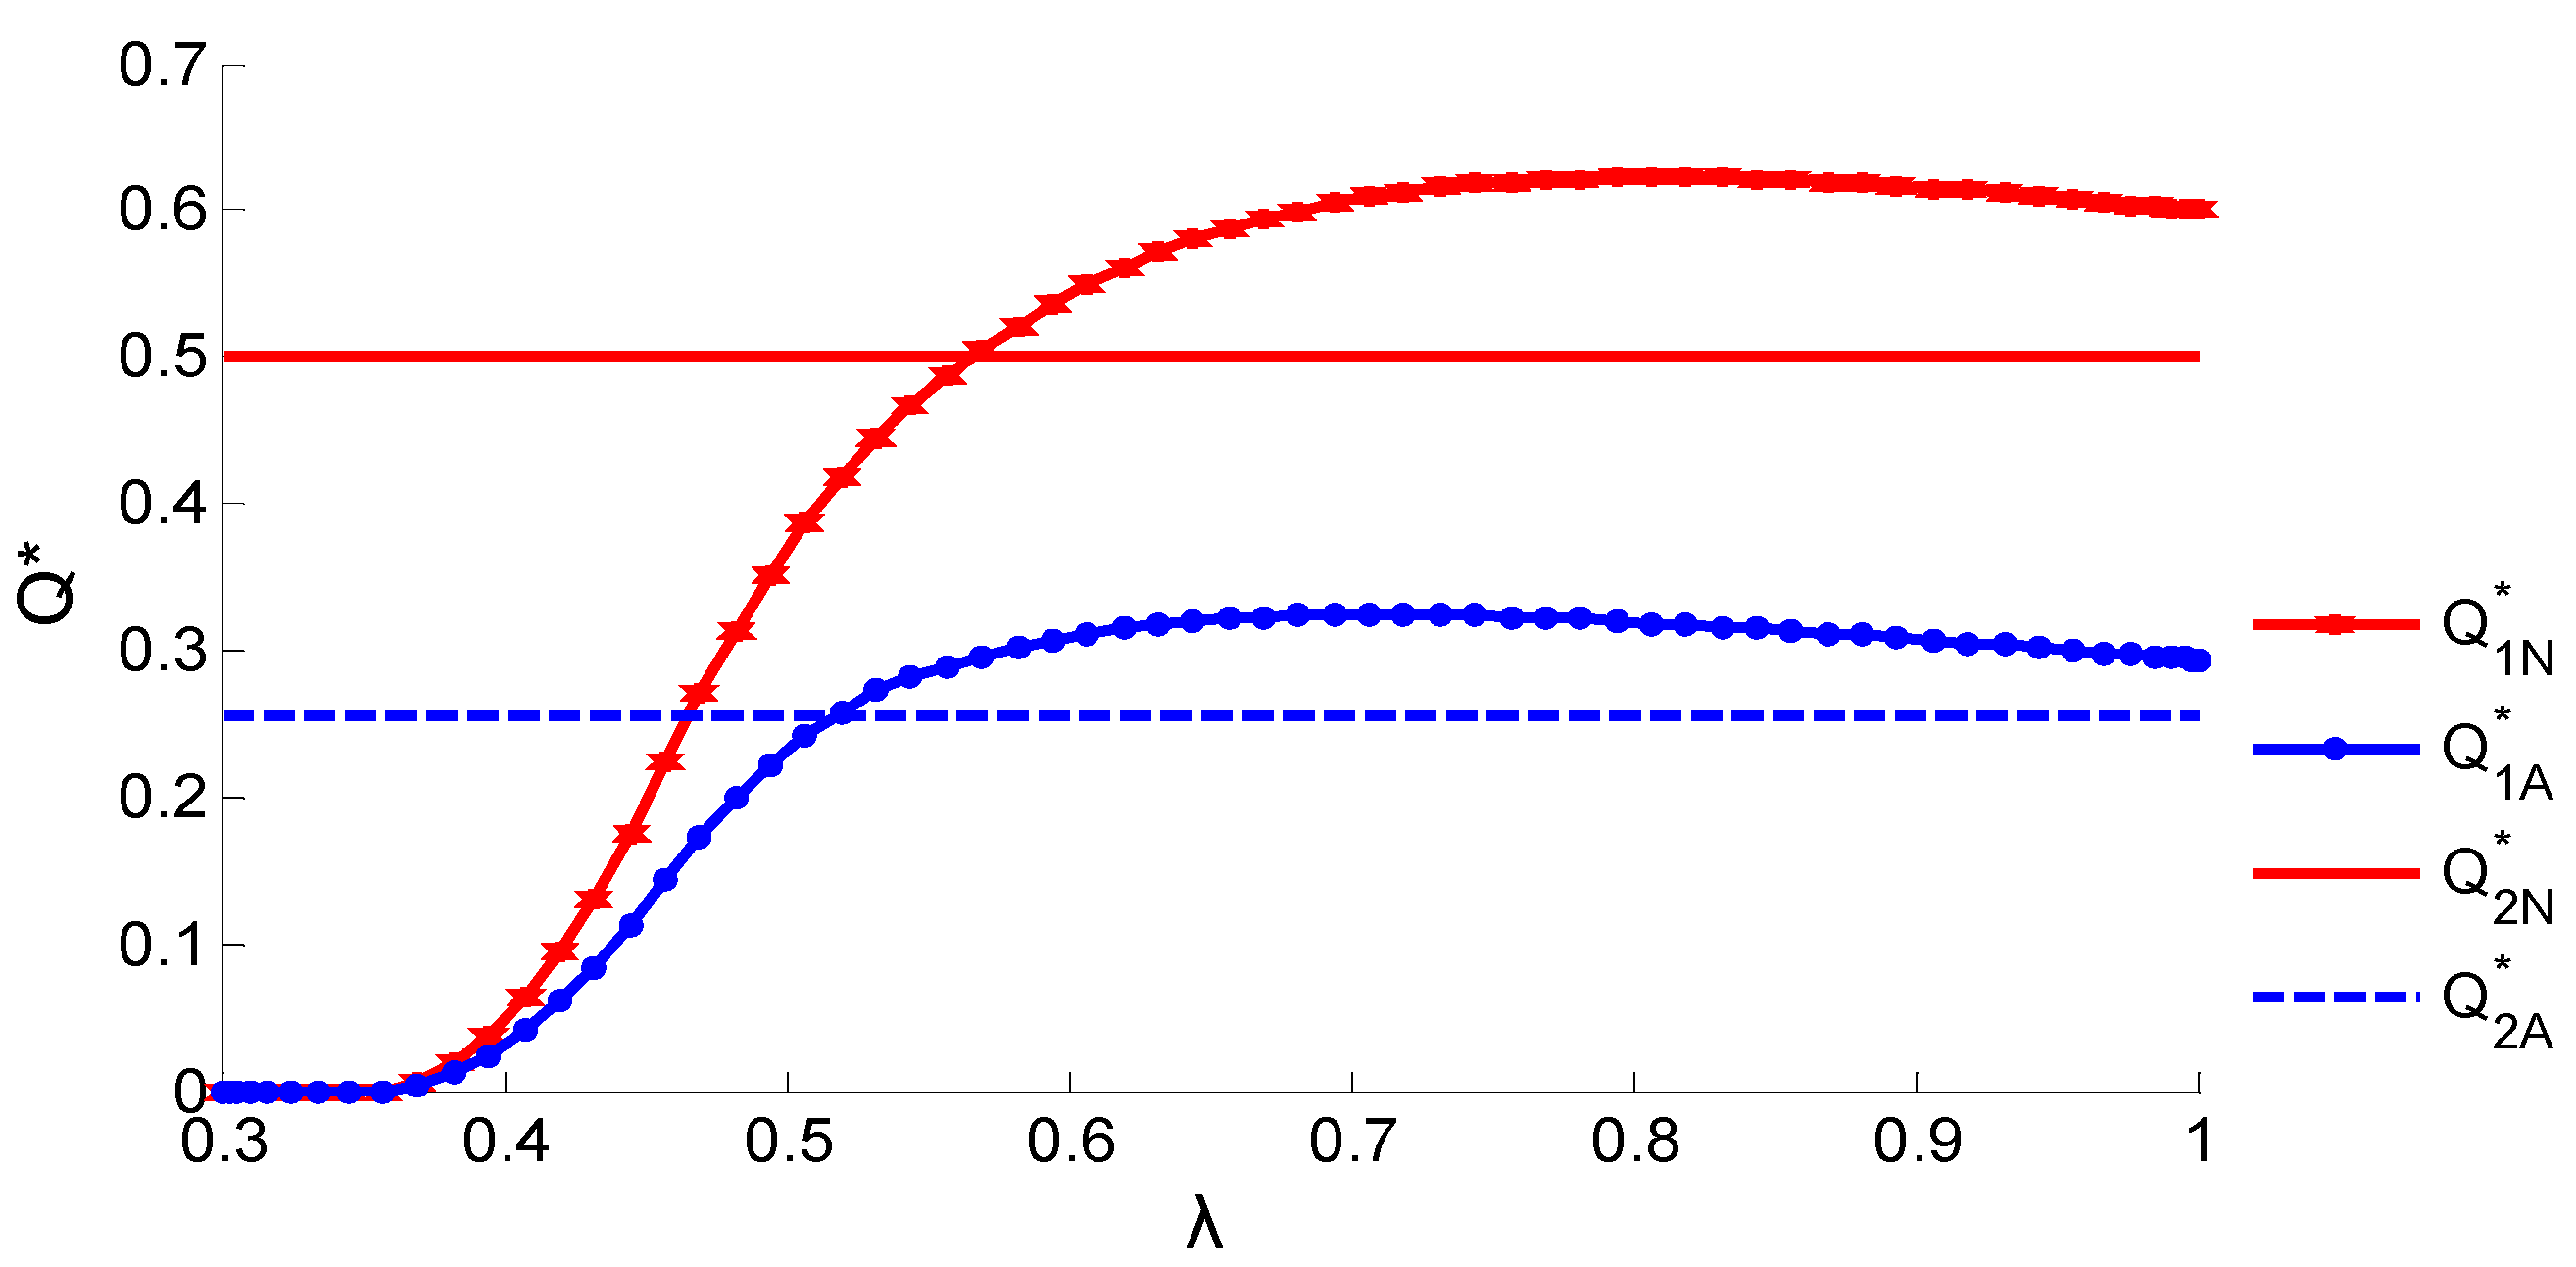
Figure 3.
The impact of risk attitude on the order quantity.

Figure 4.
The impact of risk attitude on benefit of smart shelves.

Figure 5.
The sensitivity of the cost parameters to optimal decisions.


Table 1.
The impact of inventory inaccuracy on the retailer’s benefit and utility.
| 1 | 9 | 5.008 | 0 |
| 0.9 | 7.716 | 4.373 | 2.222 |
| 0.8 | 6.25 | 3.632 | 5 |
| 0.7 | 4.591 | 2.767 | 8.571 |
| 0.6 | 2.778 | 1.774 | 13.333 |
| 0.5 | 1 | 0.712 | 20 |
| 0.4 | 0 | 0 | 30 |
| 0.3 | 0 | 0 | 30 |
© 2018 by the authors. Licensee MDPI, Basel, Switzerland. This article is an open access article distributed under the terms and conditions of the Creative Commons Attribution (CC BY) license (http://creativecommons.org/licenses/by/4.0/).
Share and Cite
MDPI and ACS Style
Zhu, L.; Wang, P.; Xi, S. Mean-Variance Analysis of Retailers Deploying RFID-Enabled Smart Shelves. Information 2018, 9, 40. https://doi.org/10.3390/info9020040
AMA Style
Zhu L, Wang P, Xi S. Mean-Variance Analysis of Retailers Deploying RFID-Enabled Smart Shelves. Information. 2018; 9(2):40. https://doi.org/10.3390/info9020040
Chicago/Turabian StyleZhu, Lijing, Peize Wang, and Sha Xi. 2018. "Mean-Variance Analysis of Retailers Deploying RFID-Enabled Smart Shelves" Information 9, no. 2: 40. https://doi.org/10.3390/info9020040
Note that from the first issue of 2016, this journal uses article numbers instead of page numbers. See further details here.