Predicting Cyber-Events by Leveraging Hacker Sentiment


Information Sciences Institute, University of Southern California, Marina del Rey, CA 90292, USA
*
Author to whom correspondence should be addressed.
Information 2018, 9(11), 280; https://doi.org/10.3390/info9110280
Submission received: 22 August 2018
/
Revised: 12 November 2018
/
Accepted: 13 November 2018
/
Published: 15 November 2018
(This article belongs to the Special Issue Darkweb Cyber Threat Intelligence Mining)
Abstract
:Recent high-profile cyber-attacks exemplify why organizations need better cyber-defenses. Cyber-threats are hard to accurately predict because attackers usually try to mask their traces. However, they often discuss exploits and techniques on hacking forums. The community behavior of the hackers may provide insights into the groups’ collective malicious activity. We propose a novel approach to predict cyber-events using sentiment analysis. We test our approach using cyber-attack data from two major business organizations. We consider three types of events: malicious software installation, malicious-destination visits, and malicious emails that surmounted the target organizations’ defenses. We construct predictive signals by applying sentiment analysis to hacker forum posts to better understand hacker behavior. We analyze over 400 K posts written between January 2016 and January 2018 on over 100 hacking forums both on the surface and dark web. We find that some forums have significantly more predictive power than others. Sentiment-based models that leverage specific forums can complement state-of-the-art time-series models on forecasting cyber-attacks weeks ahead of the events.
1. Introduction
Recent high-profile cyber-attacks such as the massive denial of service attack using Mirai botnet, infections of computers word-wide with WannaCry & Petya ransomware, and the Equifax data breach highlight the need for organizations to develop cyber-crime defenses. Cyber-threats are hard to identify and predict because the hackers that conduct these attacks often obfuscate their activity and intentions. However, they may still use publicly accessible forums to discuss vulnerabilities and to share tradecraft about how to exploit them. The behavior of the hacker community, as expressed in such venues, may provide insights into the group’s malicious intent. It has been shown that computational models based on various behavior learning theories can help in cyber-security situational awareness [1]. While cyber-situation awareness [2,3] is critical for defending networks, it is focused on detecting cyber-events. In this paper, we describe a computational method that analyzes discussions on hacker forums to predict cyber-attacks. The overall architecture of our model consists of four main tasks. The first is hacker post collection, the second is text preprocessing and sentiment analysis, the third is time-series model development and the fourth task is cyber-event prediction. We explore this approach against two major companies in the Defense Industrial Base (DIB) who provide major contracted services to the US government. For security purposes we henceforth refer to these companies as Organization A and Organization B. Organization A is not a Fortune 500 company but has over 10,000 employees and revenue in excess of $1 billion. Organization B is a Fortune 500 company with over 10,000 employees and revenue in excess of $1 billion. Both companies offer a very wide range of products and services to multiple aspects of the US government to include the Department of Defense. Both companies have also been in operation over 25 years. Due to non-disclosure agreements, this is the most that can be said concerning these organizations.
Opinion mining or sentiment analysis can be linked all the way back to Freud’s 1901 paper on how slips of the tongue can reveal a person’s hidden intentions [4]. While sentiment analysis was originally developed in the field of linguistics and psychology, it has recently been applied to several other fields with the first seminal work in the computational sciences being Pang et al. [5]. Historically, it has been applied in the context of social networks, comments (such as on news sites) and reviews (either for products or movies). In this work, we apply sentiment analysis to posts on dark web forums with the purpose of forecasting cyber-attacks. The dark web consists of websites that are not indexed nor searchable by standard search engine and can only be accessed using a special browser service.
We further explore the link between community behavior and malicious activity. The connection between security and human behavior has been studied in designing new technology [6]; however, here we look to reverse engineer malicious events by mapping to hacker behavior. Social media has been shown to be a source of useful data on human behavior and used to predict real-world events [7,8,9]. Here, we inspect the ability of hacker forums to predict cyber-events. We consider each forum individually and then apply sentiment analysis to each post within those forums. After computing a daily average per day and a seven-day running average sentiment signal per forum, we test these signals against ground truth data. We determine some forums have significantly more predictive power and these isolated forums can beat the evaluation models in 36% of the months under study using precision and recall of predictions within a specified 39-h window of the event.
2. Related Work
Given the serious nature of cyber-attacks, naturally there are several other research efforts to predict them. As it relates to our efforts, the three main areas of research are sentiment analysis in cyber-security, predictive methods for cyber-attacks and leveraging dark web data in cyber-security.
2.1. Sentiment Analysis in Cyber-Security
The closest work which has applied sentiment analysis to hacker forums to cyber-security is [10]. While much research has investigated the specifics of cyber-attacks, Macdonald et al. [10] investigates the actual cyber-actors via their communication activities. The focus of the research was the cyber-physical systems related to critical infrastructure and they developed an automated analysis tool to identify potential threats against such infrastructure. Despite recognizing that there are over 140 hacker forums on the public web, the authors chose only one forum to analyze and they scraped the complete forum once. They leveraged the Open Discussion Forum Crawler to do the scrapping and then used OpenNLP to tag parts of speech, filtering on nouns. Those nouns were cross referenced with three lists of malicious keywords to identify posts whose sentiment would be determined with SentiStrength. Contextual analysis of keyword pairings with sentiment scores allowed them to confirm current statistics about critical infrastructure cyber-attacks. The main differences illustrated in our work is that we looked at over 100 forums, not just from the public web but also the dark web. In collecting posts for over a two-year period, we found the sentiment of all posts by applying Valence Aware Dictionary for sEntiment Reasoning (VADER) and Linguistic Inquiry and Word Count (LIWC) for sentiment in addition to just SentiStrength. Furthermore, we were able to model our data against ground truth events from companies making our approach predictive in nature. BiSAL [11] did sentiment analysis on English and Arabic on dark web forums with slight modification to cyber-security terms. Other work such as [12] used sentiment in measuring radicalization. Remaining research in sentiment analysis, not specific to cyber-security was presented earlier.
2.2. Predicting Cyber-Attack
The goal of predicting cyber-attacks is not new and there has been a considerable research effort in this field. The efforts split along two categories, using network traffic or non-network traffic. Forecasting methods such as [13,14,15] analyze network traffic which is not what we do. Where [13] is specific to predicting attacks using IPV4 packet traffic and Pontes et al. [14] look at various network sensors at different layers to prevent unwanted Internet traffic. Whereas, Leslie et al. [15] combines DNS traffic with security metadata such as number of policy violations and the number of clients in the network. Many researchers such as [16] based cyber-prediction on open source information. In this case, they use the National Vulnerability Database to highlight the difficulty in using public sources for building effective models. Other work has focused on detecting cyber-bullying using graph detection models [17] with success but is limited to identifying malicious activity and not a predictive model.
The closest to our research is Gandotra et al. [18] who outlined a number of cyber-prediction efforts using statistical modeling and algorithmic modeling. They highlight several significant challenges that we tried to address. The first challenge is that open source ground truth is incomplete and should be compiled from multiple sources because analysis does not scale to real-world scenarios. We were able to get ground truth data from two companies that operate in the DIB, this ground truth is across three different attack vectors and is over a two-year time period. The additional challenges in [18] focus on the volume, speed, and heterogeneity of network data which we avoid since we are attempting to prevent cyber-events specifically with non-network data. They also present two modeling approaches of statistical modeling and algorithmic modeling. We used statistical models not unlike what they presented as classical time-series models with autoregressive, integrated moving average with historical data and external signals.
2.3. Dark Web Research
There has been a lot of research recently concerning the dark web or websites not indexed by major search engines. Typically, the dark web refers to the through The Onion Router (TOR) [19] network which is only accessible via specialized browsers. It has been shown by [20] that from an overall cyber-security threat perspective, the dark web provides a valuable source of information for malicious activity. They developed a system that scrapes hacker forum and marketplace sites on the dark web to develop threat warnings for cyber-defenders. We leverage the same ultimate data source but perform sentiment analysis to not only predict future threats, but to predict actual attacks. They also leverage the deep web by standard search engines.
While not using sentiment analysis, Lacey and Salmon [21] offers insight to the trust establishment between participants in dark web forums. There may be behavioral patterns of malicious actors that provide insight to future activity. Dark web conversations were shown to provide earlier insights than surface web conversations by [22] indicating potential predictive power for cyber-events. Ref. [22] highlights two cases with a major DDoS attack and the Mirai attack. There may also be early insights on the surface web in many of the social media sites as illustrated in [23]. Our work focused only on forums where it was likely that computer security topics would be discussed but does contain a mix of dark web and surface web. There has been work using natural language processing on dark web text for predictive method such as [24]. Other predictive approaches such as Cyber-Attacker Model Profile (CAMP) [25], focus on the macro level of a country and financial cyber-crimes, where we look at a wider range of malicious activity against specific target organizations.
3. Data
3.1. Hacker Forum Texts
This research is reliant on online discussion of participants posted on platforms that might cater to those who are interested in not publicly visible cyber-security topics. We look at hacking forums from both the surface web and the dark web from 1 January 2016 to 31 January 2018. The dark web refers to sites accessible TOR private network platform [19]. The surface web refers to the World Wide Web accessible through standard browsers. In this paper, we focus only on English posts from 113 forums which were identified based on cyber-security keywords consisting of 432,060 posts. The text from these forums were accessed using the methods proposed in [20,26]. The original text data from the hacking forums was provided through a partnership with CYR3CON (https://www.cyr3con.ai/). In general, a mix of forums on the dark web and surface web were accessed and the text data within those forums was scrapped. There were over 300 forums accessed with text in a variety of languages with English being the most prevalent.
3.2. Cyber-Event Data
We use ground truth data from cyber-attacks directed at two large organizations in the DIB, Organization A and Organization B. The ground truth comprises three event types and the counts by month are in Table 1.
- endpoint malware (EP-Mal): a malicious software installation, such as ransomware, spyware, and adware, is discovered on a company endpoint device.
- malicious destination (Mal-Dest): a visit by a user to a URL or IP address that is malicious in nature or a compromised website.
- malicious email (Mal-Email): receipt of an email that contains a malicious email attachment and/or a link to a known malicious destination.
4. Sentiment Analysis
In this paper, we use the sentiment of members of hacker forums to serve as a predictive signal for future cyber-security related activity. The first effective use of sentiment analysis in a predictive sense was by Pang et al. [5] in assessing movie reviews. Since then, sentiment analysis has expanded to other fields. Sentiment analysis can be done with or without supervision (label training data). Supervised methods can be adapted to create trained models for specific purposes and contexts. The drawback is that labeled data may be highly costly and often researchers end up using AMT—Amazon Mechanical Turk. The alternative is to use lexical-based methods that do not rely on labeled data; however, it is hard to create a unique lexical-based dictionary to be used for all different contexts. Deep learning methods allow for additional functions such as taking into account order of words in a sentence such as the Stanford Recursive Deep Model. Methods can either be 2-way (positive or negative) or 3-way (positive, neutral, negative). Furthermore, dictionary-based sentiment algorithms are either polarity-based where sentiment is based only on the frequency of positive or negative words whereas valence-based methods factor the intensity of the words into polarity. There are several issues with sentiment analysis which include: word pairs, word tuples, emoticons, slang, sarcasm, irony, questions, URLs, code, domain specific use of words (shoot an email, dead link), and inversions (small is good for portable electronics) which are difficult for computerized text analysis to handle.
Studies have found that a method’s prediction performance varies considerably from one dataset to another. VADER works well for some tweets, but not for others, depending on the context. SentiStrength has good Macro F1 values but has low coverage because it tends to classify a high number of instances as neutral.
The choice of a sentiment analysis is highly dependent on the data and application; therefore, you need to take into account prediction performance and coverage. There is no single method that always achieves a consistent rank position for different datasets. Therefore, in this paper we test multiple methods for sentiment analysis. Most languages themselves are biased positive and if a lexicon is built on data, the positive bias that data can lead to a bias in the lexicon. Therefore, most methods are better at classifying positive than neutral or negative methods meaning that they are biased, neutral are the hardest to detect [27].
4.1. VADER
VADER: Valence Aware Dictionary for sEntiment Reasoning [28] is a rule-based sentiment model that has both a dictionary and associated intensity measures. Its dictionary has been tuned for microblog-like contexts and they incorporate five generalizable rules that goes beyond pure dictionary lookups:
- Increase intensity due to exclamation point
- Increase intensity due to all caps in the presence of other non-all cap words
- Increase intensity with degree modifiers i.e., extremely
- Negate sentiment with contrastive conjunction i.e., but
- Examine the preceding tri-gram to identify cases where negation flips the polarity of the text.
Therefore, VADER not only captures positive or negative, but also how positive and how negative beyond simple words counts. It is made further robust by the additional rules. Its “gold standard” lexicon was developed manually and with Amazon Mechanical Turk. VADER scores range from −1.0 (most negative) to 1.0 (most positive).
4.2. LIWC
LIWC [29] was a pioneer in the computerized text analysis field with the first major iteration in 2007, we used the updated version LIWC 2015. It has two components: the processing component and the dictionaries. The heart of LIWC are the dictionaries that contain the lookup words in psychometric categories which can resolve content words from style words. LIWC counts the inputted words in psychologically meaningful categories which produces close to 100 dimensions for any given text being analyzed. For the purposes of this research, we are only focused on Tone which bests maps to sentiment as we have defined it. The Tone scores range from 0 (most negative) to 100 (most positive). LIWC also ignores context, irony, sarcasm, and idioms.
4.3. SentiStrength
SentiStrength [30] is another lexicon-based sentiment classifier which leverages dictionaries and non-lexical linguistics information to detect sentiment. SentiStrength focuses on the strength of the sentiment and uses weights for the words in its dictionaries. Additionally, positive sentiment strength and negative sentiment strength is scored separately. Each is scored from 1 to 5, with 5 being the greatest strength. For our purposes, we seek overall sentiment, so we subtract the negative sentiment from the positive sentiment so that strongly positive (5, 1) becomes 4, neutral (1, 1) becomes 0 and strongly negative (1, 5) becomes −4. Therefore, SentiStrength scores range from −4 (most negative) to 4 (most positive). SentiStrength is designed to do better with social media; however, it cannot exploit indirect indicators of sentiment. It is also weaker for positive sentiment in news-related discussions.
5. Time-Series Prediction
5.1. ARIMA
The goal of this research is to determine the predictive power of hacker forum sentiment toward future cyber-events. Because of the expected autocorrelation in previous cyber-events, we apply the widely used ARIMA model for forecasting events. ARIMA stands for autoregressive integrated moving average. The key idea is that the number of current events () depends on the past counts and forecast errors. Formally, ARIMA(p, d, q) defines an autoregressive model with p autoregressive lags, d difference operations, and q moving average lags (see [31]). Given the observed series of events , ARIMA(p, d, q) applies d () difference operations to transform to a stationary series . Then the predicted value at time point t can be expressed in terms of past observed values and forecasting errors which is as follows:
Here is a constant, is the autoregressive (AR) coefficient at lag i, is the moving average (MA) coefficient at lag j, is the forecast error at lag j, and is assumed to be the white noise (). The AR model is essentially an ARIMA model without moving average terms.
These models assume that are known and the series is weakly stationary. To select the values for , we employ grid search over the values of and select the one with minimum AIC score. We use maximum likelihood estimation for learning the ARIMA parameters; more specifically, parameters are optimized with L-BFGS method [32] which is linear in memory requirement by estimating the inverse Hessian with a few vectors. We allowed a maximum value of p to be 21, q to be 7, and d to be 2. All three parameters have a minimum potential value of 0.
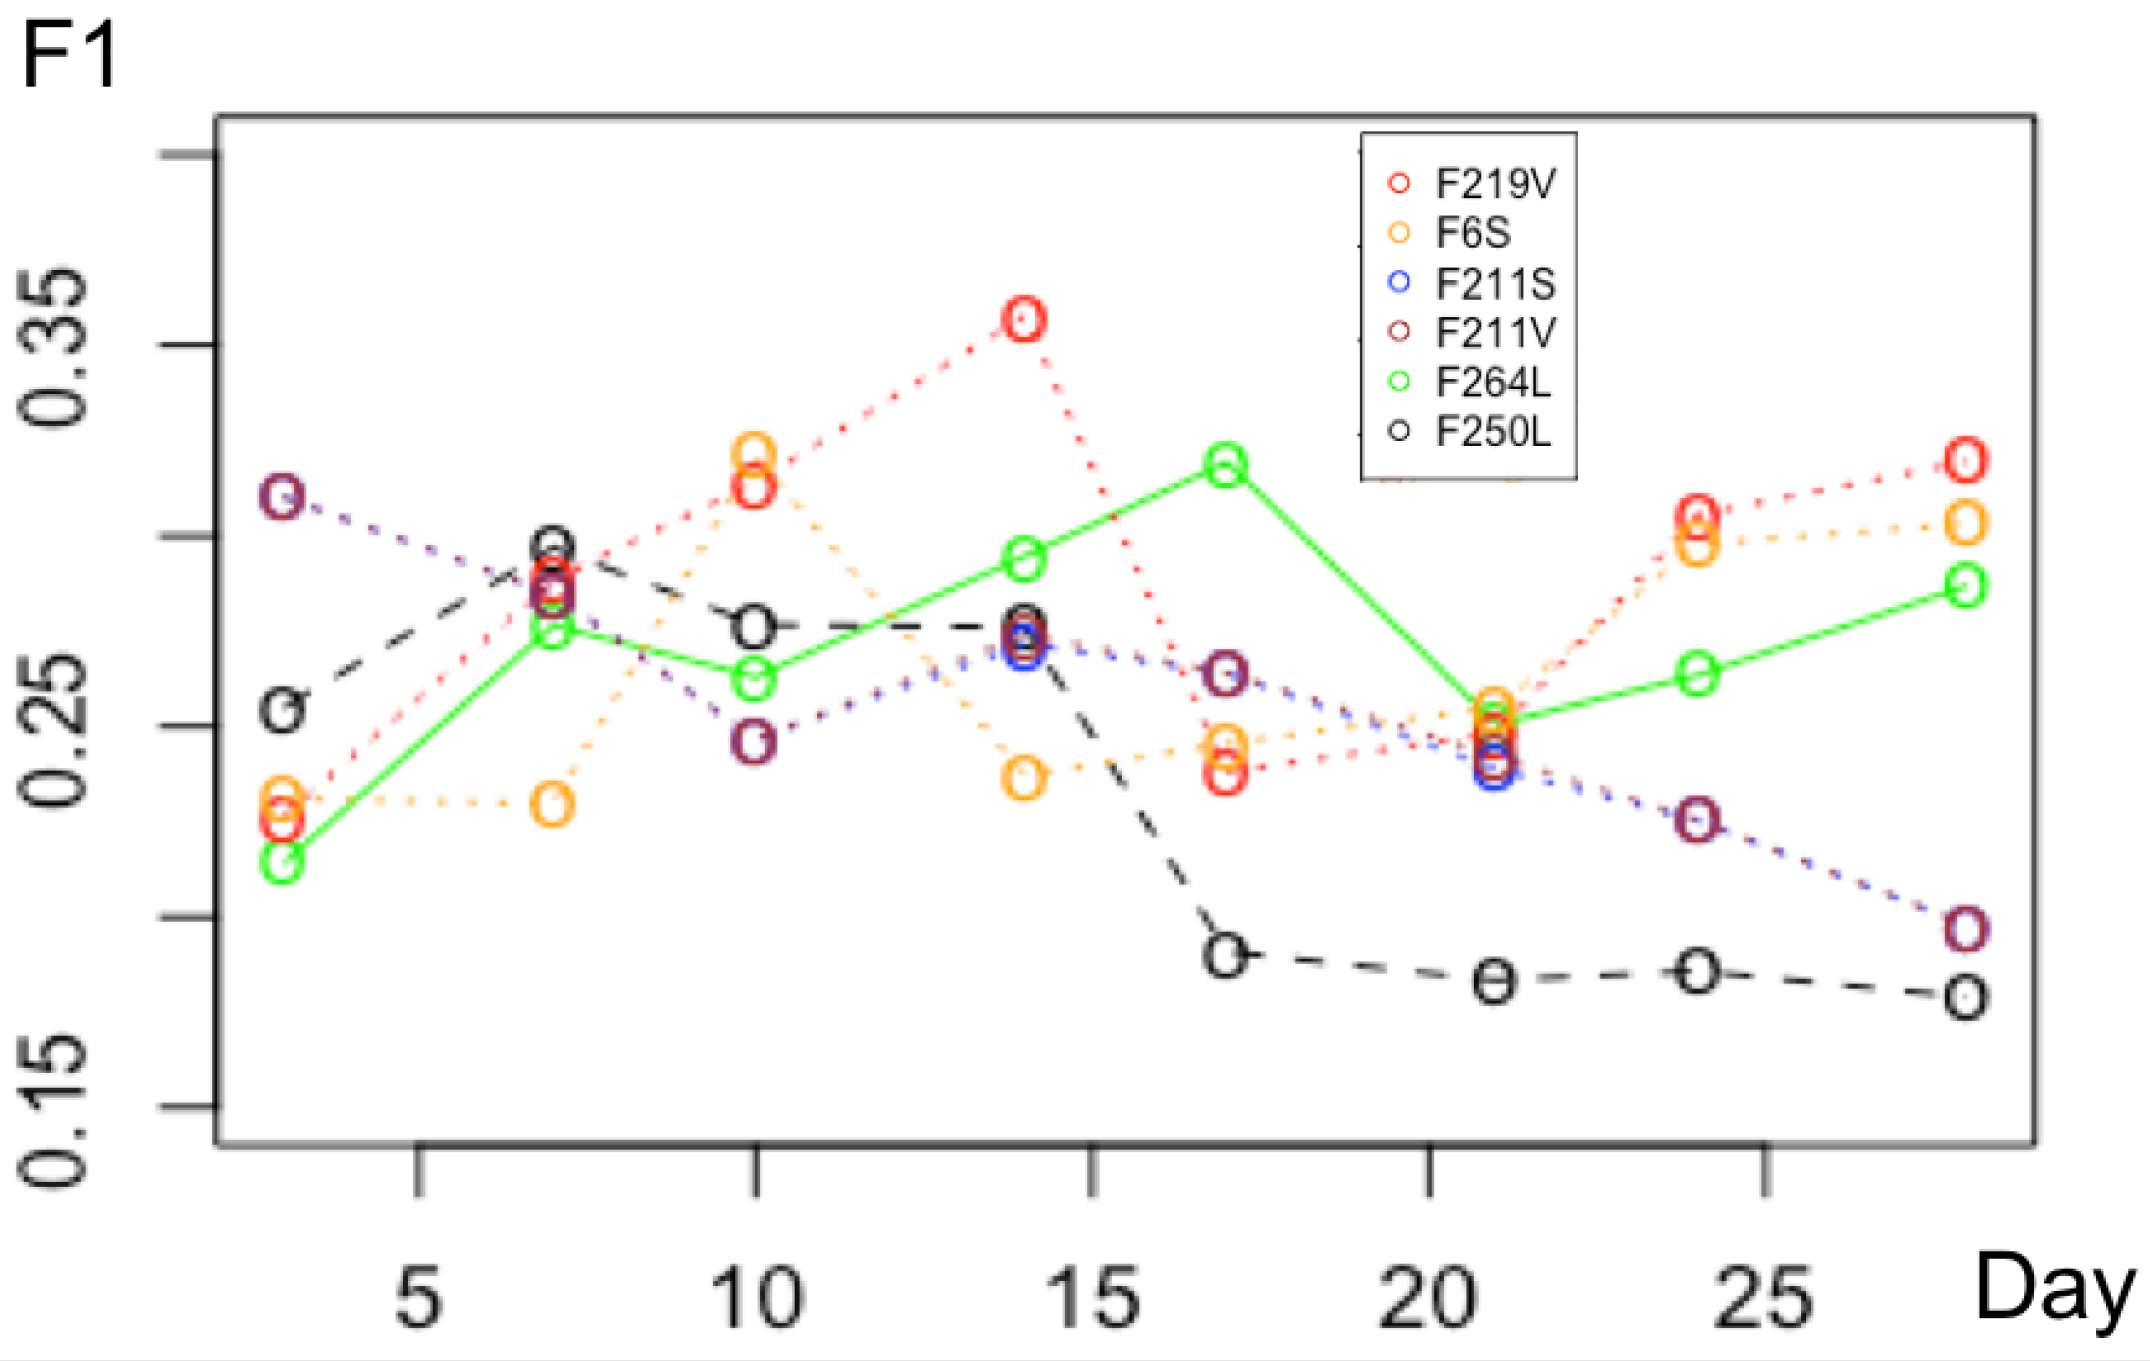
5.2. Parameter Tuning
We looked at adjusting the running average from 1 to 30 days and settled on 7 days primarily because that was our original prediction window. Figure 1 shows the average F1 score various signals computed with running averages of 3, 7, 10 and 14 days.
5.3. Complexity
Reference complexity, the computation of the model is based on the number of forums and the number of posts per forum since this method leverages external signals and not internal network information. For each post, it is the number of words that affects the computational complexity. The text data preprocessing steps of url removal is linear with respect to the number of words and the contraction expansion can be done in constant time since it is a predefined lookup table expansion. All three sentiment methods are done in linear time since they are all dictionary-based methods. The ARIMA method is based on the number of time periods used to fit the model with respect to the parameters. The we start with 17 months of historical data at the day level and increase to 23 months of historical data for the last prediction window. We used a maximum of for model fitting. Since we leverage L-BFGS, only matrix-vector multiplication is needed so the computational complexity is .
6. Cyber-Event Prediction
The fourth task of the model is to actually predict future cyber-events. We make predictions concerning the three cyber-event types defined with a time window dependent on the event type as noted by the data providers. Endpoint malware must be within 0.875 days, malicious destination within 1.625 days and malicious email within 1.375 days. To determine how well the signals under study performed, a Hungarian matching algorithm [33] is used to compare predicted warnings w to ground truth events g. The algorithm identifies the mutually exclusive pairs such that the sum of similarities is maximized. If w comes before g, the time difference between w and g is within the associated time window and the event type/target organization are the same, then equals the score. Otherwise . Using the matching algorithm, we could consistently score which predicted events should be mapped to actual events and which predicted events did not occur as well as which actual events were not predicted.
7. Methodology
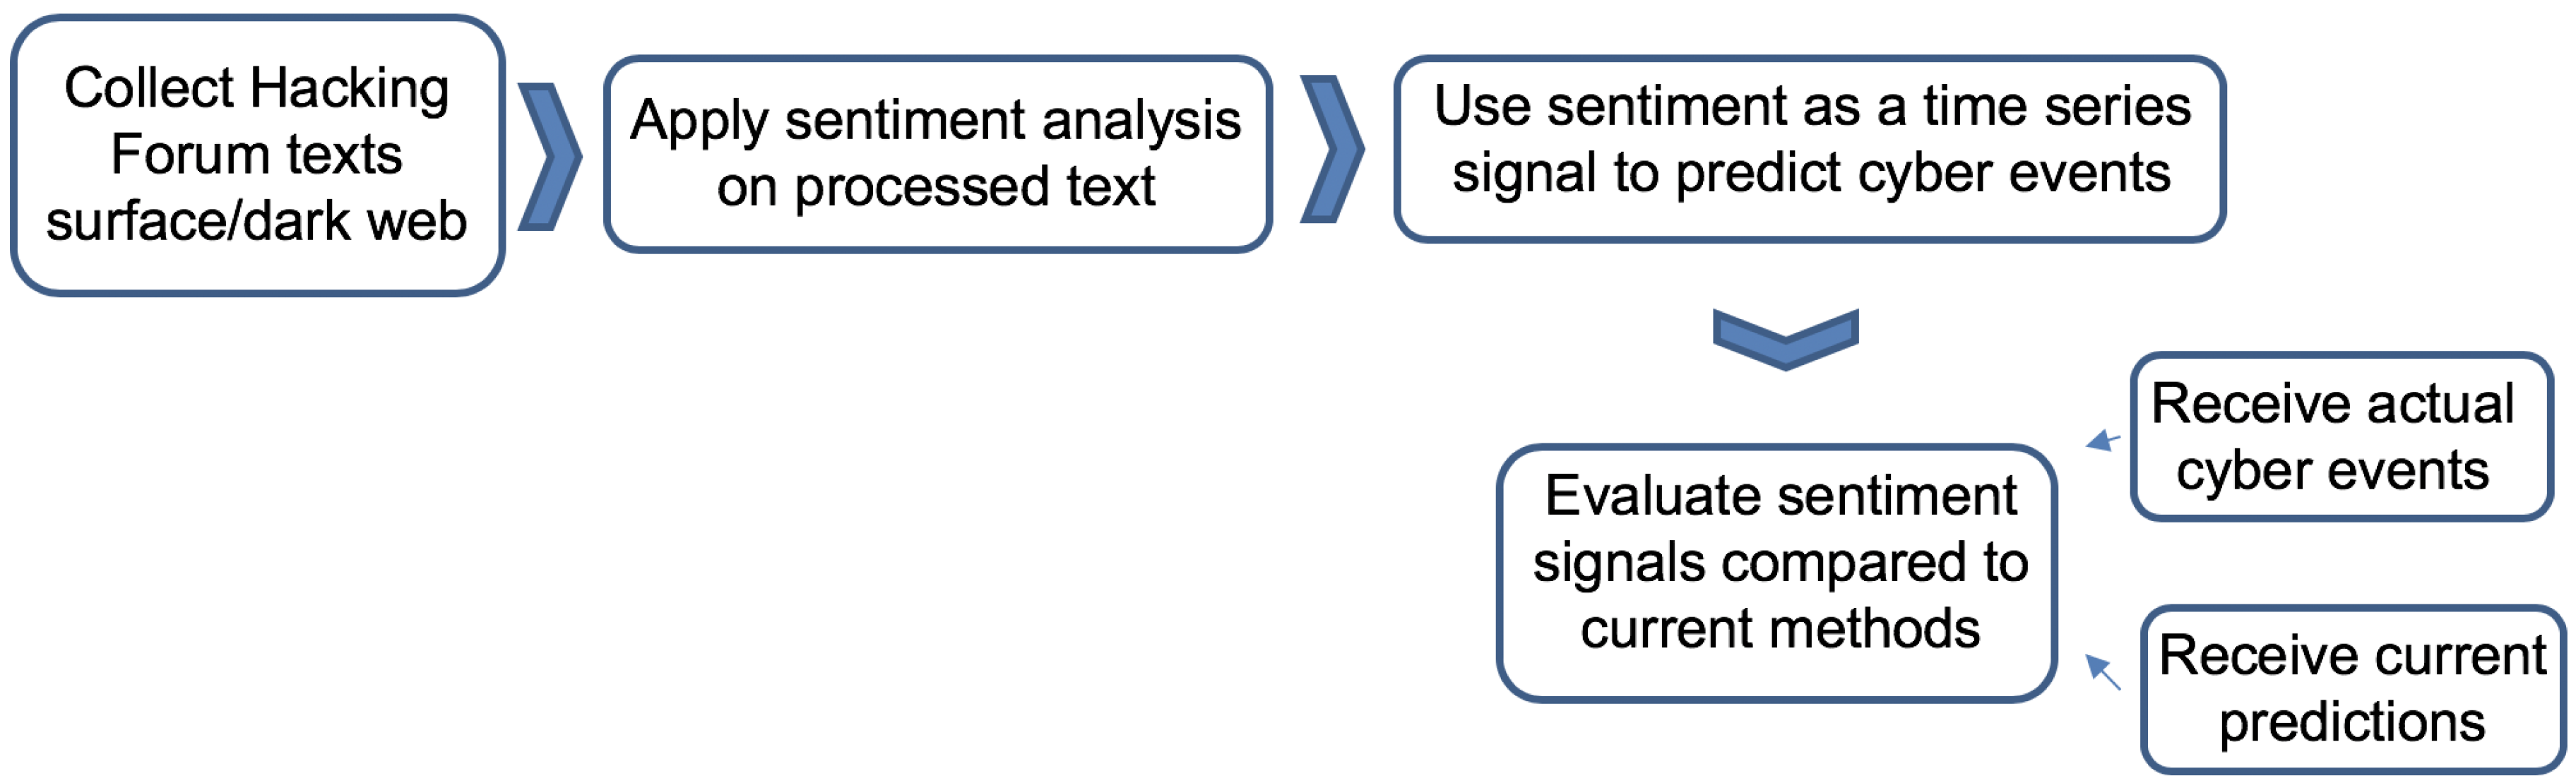
In this section, we document the methodology used and process workflow from the data processing to signal generation through warning generation and signal testing. An overview is provided in Figure 2.
7.1. Processing the Data
Working with researchers at Arizona State University, we were able to develop a database of posts from forums on both the dark web and surface web which discuss computer security and network vulnerability topics. To protect the future utility of these sources, each forum has been coded with a number (forumid) from 1 to 350. The data consist of the forumid, date the post was made, and the text of the post. The data in this study was from 1 January 2016 to 31 January 2018. The data was collected by ASU and we used an API to pull and store the data in a local server and access it via Apache Lucene’s Elastic Search engine.
7.2. Evaluating Sentiment Analysis
After a review of the sentiment analysis methods in SentiBench [27], we decided to use VADER [28], SentiStrenght [30] and LIWC15 [29]. For social networks, VADER and LIWC15 were found to be the best method for 3-class classification and SentiStrength was the winner for 2-class classification [27], for these reasons those three methods were used. As far as implementation, VADER has a Python module, SentiStrenght has a Java implementation and LIWC15 is a stand-alone program.
7.3. Computing Sentiment Signal
A sentiment score for each forum post was computed using the three sentiment methods outlined above. Since there can be multiple posts on a forum for a day, we characterization the overall sentiment of the day with a daily average. There can be a wide range of sentiment scores for any given day, especially if there are a lot of posts from a popular forum. To understand the trend of sentiment over time, we compute running averages. A running daily average was computed to assess the trend of sentiment over time. The more days in the running average, the smoother the curve and the harder to detect a change. Whereas no using a running average or making it only 1 or 2 days would have many jump discontinuities and swings. From testing over various running averages, we determined 7 days to be the best universal value for this parameter.
7.4. Standardizing the Score
To make the 3 sentiment scores more comparable, their scores were standardized. As previously mentioned, VADER generates sentiment scores on a scale of 0 to 1, SentiStrength goes from −4 to 4, and LIWC goes from 0 to 100 for Tone. While standardizing the scores do not affect the correlation any forum would have with the ground truth from our target organizations, it will be necessary when we potentially combine signals from various forums and sentiment methods to find more powerful predictors.
7.5. Compute Correlations to Find Potential Signals
As previously mention, we have ground truth events from 2 DIB organizations of 3 different cyber-event types. The event types are endpoint malware, malicious destination, and malicious email. Correlations were computed between all forum-sentiments against all event types from both organizations. Additionally, since we are looking for predictive signals, we computed correlations with a negative lag from 0 to 30 days with a lag of −30 meaning offset the sentiment signal 30 days before the organization’s event occurrence. Several signals stood out as being more correlated than others against certain event types as seen in Figure 2. This shows the LIWC sentiment on Forum 84 against Organization B’s endpoint-malware events. The fact that multiple, consecutive lags have low p-values gives some indication that this might be a useful signal.
7.6. Testing Signals with ARIMAX
Again, Table 2 shows the signals that are better correlated with Organization B’s ground truth events. The next step is to test these signals to see if they have any predictive power. To do this, the ARIMA model is used with the ground truth events to develop a baseline model from which to compare potential signals for the potential to have predictive power. Additionally, 4 other methods were used for comparison: Dark Mentions, Deep Exploit [22], ARIMAX with abuse.ch and a daywise-hourly base rate model. Using ground truth events from both Organization A and Organization B, sentiment signals from the various forums, computed with the different methodologies were tested. Testing was done across the 3 event types for both Organizations with Precision, Recall and F1 computed to evaluate the signal. The time series of the sentiment for a given forum and sentiment method was used as the input to the time-series forecasting model to predict future events. The model was trained on data from 1 April 2016 to 31 May 2017, to start generating warnings for the month of June 2017. After predictions were made for the month of June, they were scored against the actual ground truth and then the model was run again to predict warnings for August 2017. This was done for all the way through January 2018.
7.7. Scoring
To determine how well the signals under study performed, a Hungarian matching algorithm [33] was used to compare which predicted warnings w should map to ground truth events g. The algorithm identifies the mutually exclusive pairs such that the sum of similarities is maximized. If w comes before g, the time difference between w and g is within the stated time window and the event type/target organization are the same, then equals the quality score. Otherwise . The window around the actual events which varies based on the event type. Endpoint malware must be within 0.875 days, malicious destination within 1.625 days and malicious email within 1.375 days. Using the matching algorithm, we could consistently score which predicted events should be mapped to actual events and which predicted events did not occur as well as which actual events were not predicted. For example, if Organization A had only 1 malicious-email event at noon on the 11th of the month, then only the warnings predicted for before that time could be considered since the predicted warning must be before the ground truth event. For malicious email, the warning must be within 33 h of the event. If there are multiple warnings within that 33-h window, only 1 can be mapped. The Hungarian matching algorithm will map the one that was closed in time with the other unmapped warnings being false-positives. The Hungarian matching algorithm becomes vital when there are multiple warnings and multiple events within a small window to determine which warnings are mapped to an associated event and which warnings will be classified as a false positive.
7.8. External Signals
Currently, there are other external signals that the data provider organizations are currently evaluating for predictive potential. Again, external signals are time-series information derived from open sources that are not based on information system network data. The other external signals under evaluation are:
- ARIMAX: is the same model outlined in Section 5.1; however, time-series counts of malicious activity are acquired from https://abuse.ch and used in conjunction with historical data.
- Baseline: is the exact same model in Section 5.1 with no external signal and using only historical ground truth data to predict the future rate of attack.
- Daywise-Baserate: is the same as the ARIMAX model mentioned above; however, the model takes day of the week into consideration assuming that the event rate for each day of the week is not the same.
- Deep Exploit: is an ARIMA model that is based on the vulnerability analysis determined by [24]. This method, referred to as DarkEmbed, learns the embeddings of dark web posts and then uses a trained exploit classifier to predict which vulnerabilities in dark web posts might be exploited.
- Dark Mentions: Is an extension of [34] which predicts if a disclosed vulnerability will be exploited based on a variety of data sources in addition to the dark web using methods still being developed. These predictions are used to construct a rule-based forecasting method based on keyword mentions in Dark Web forums and marketplaces.
8. Results
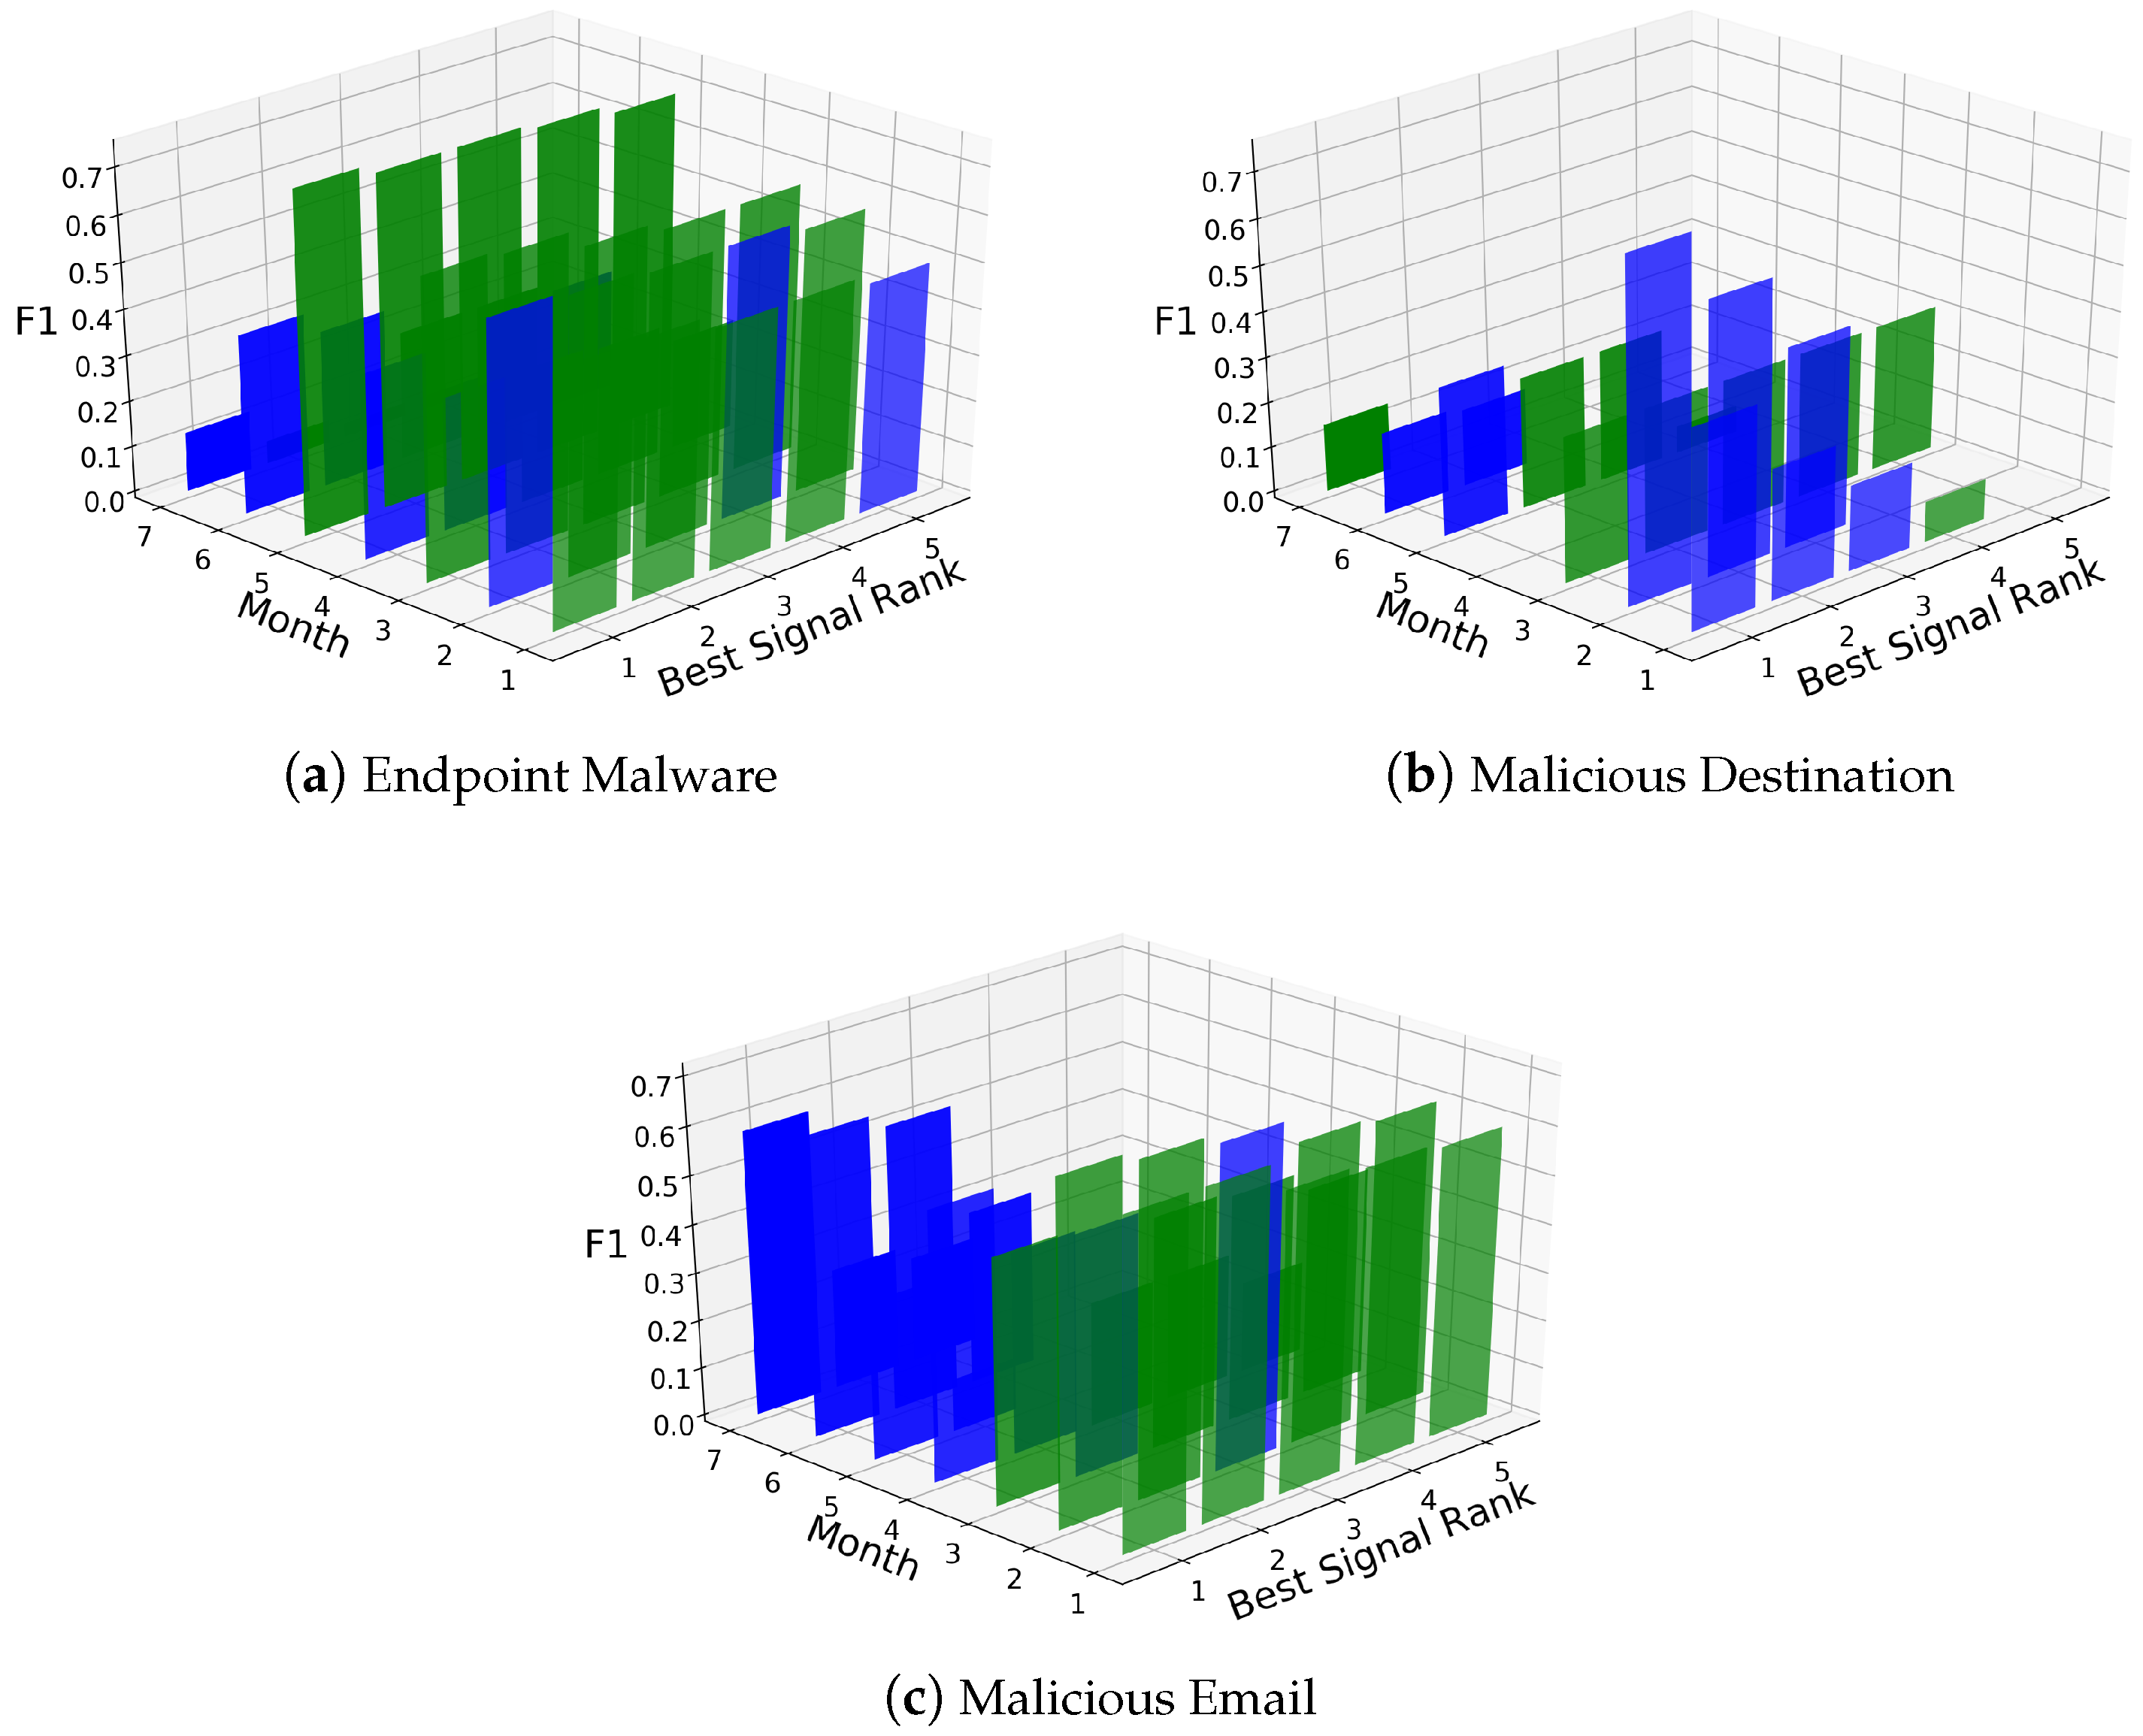
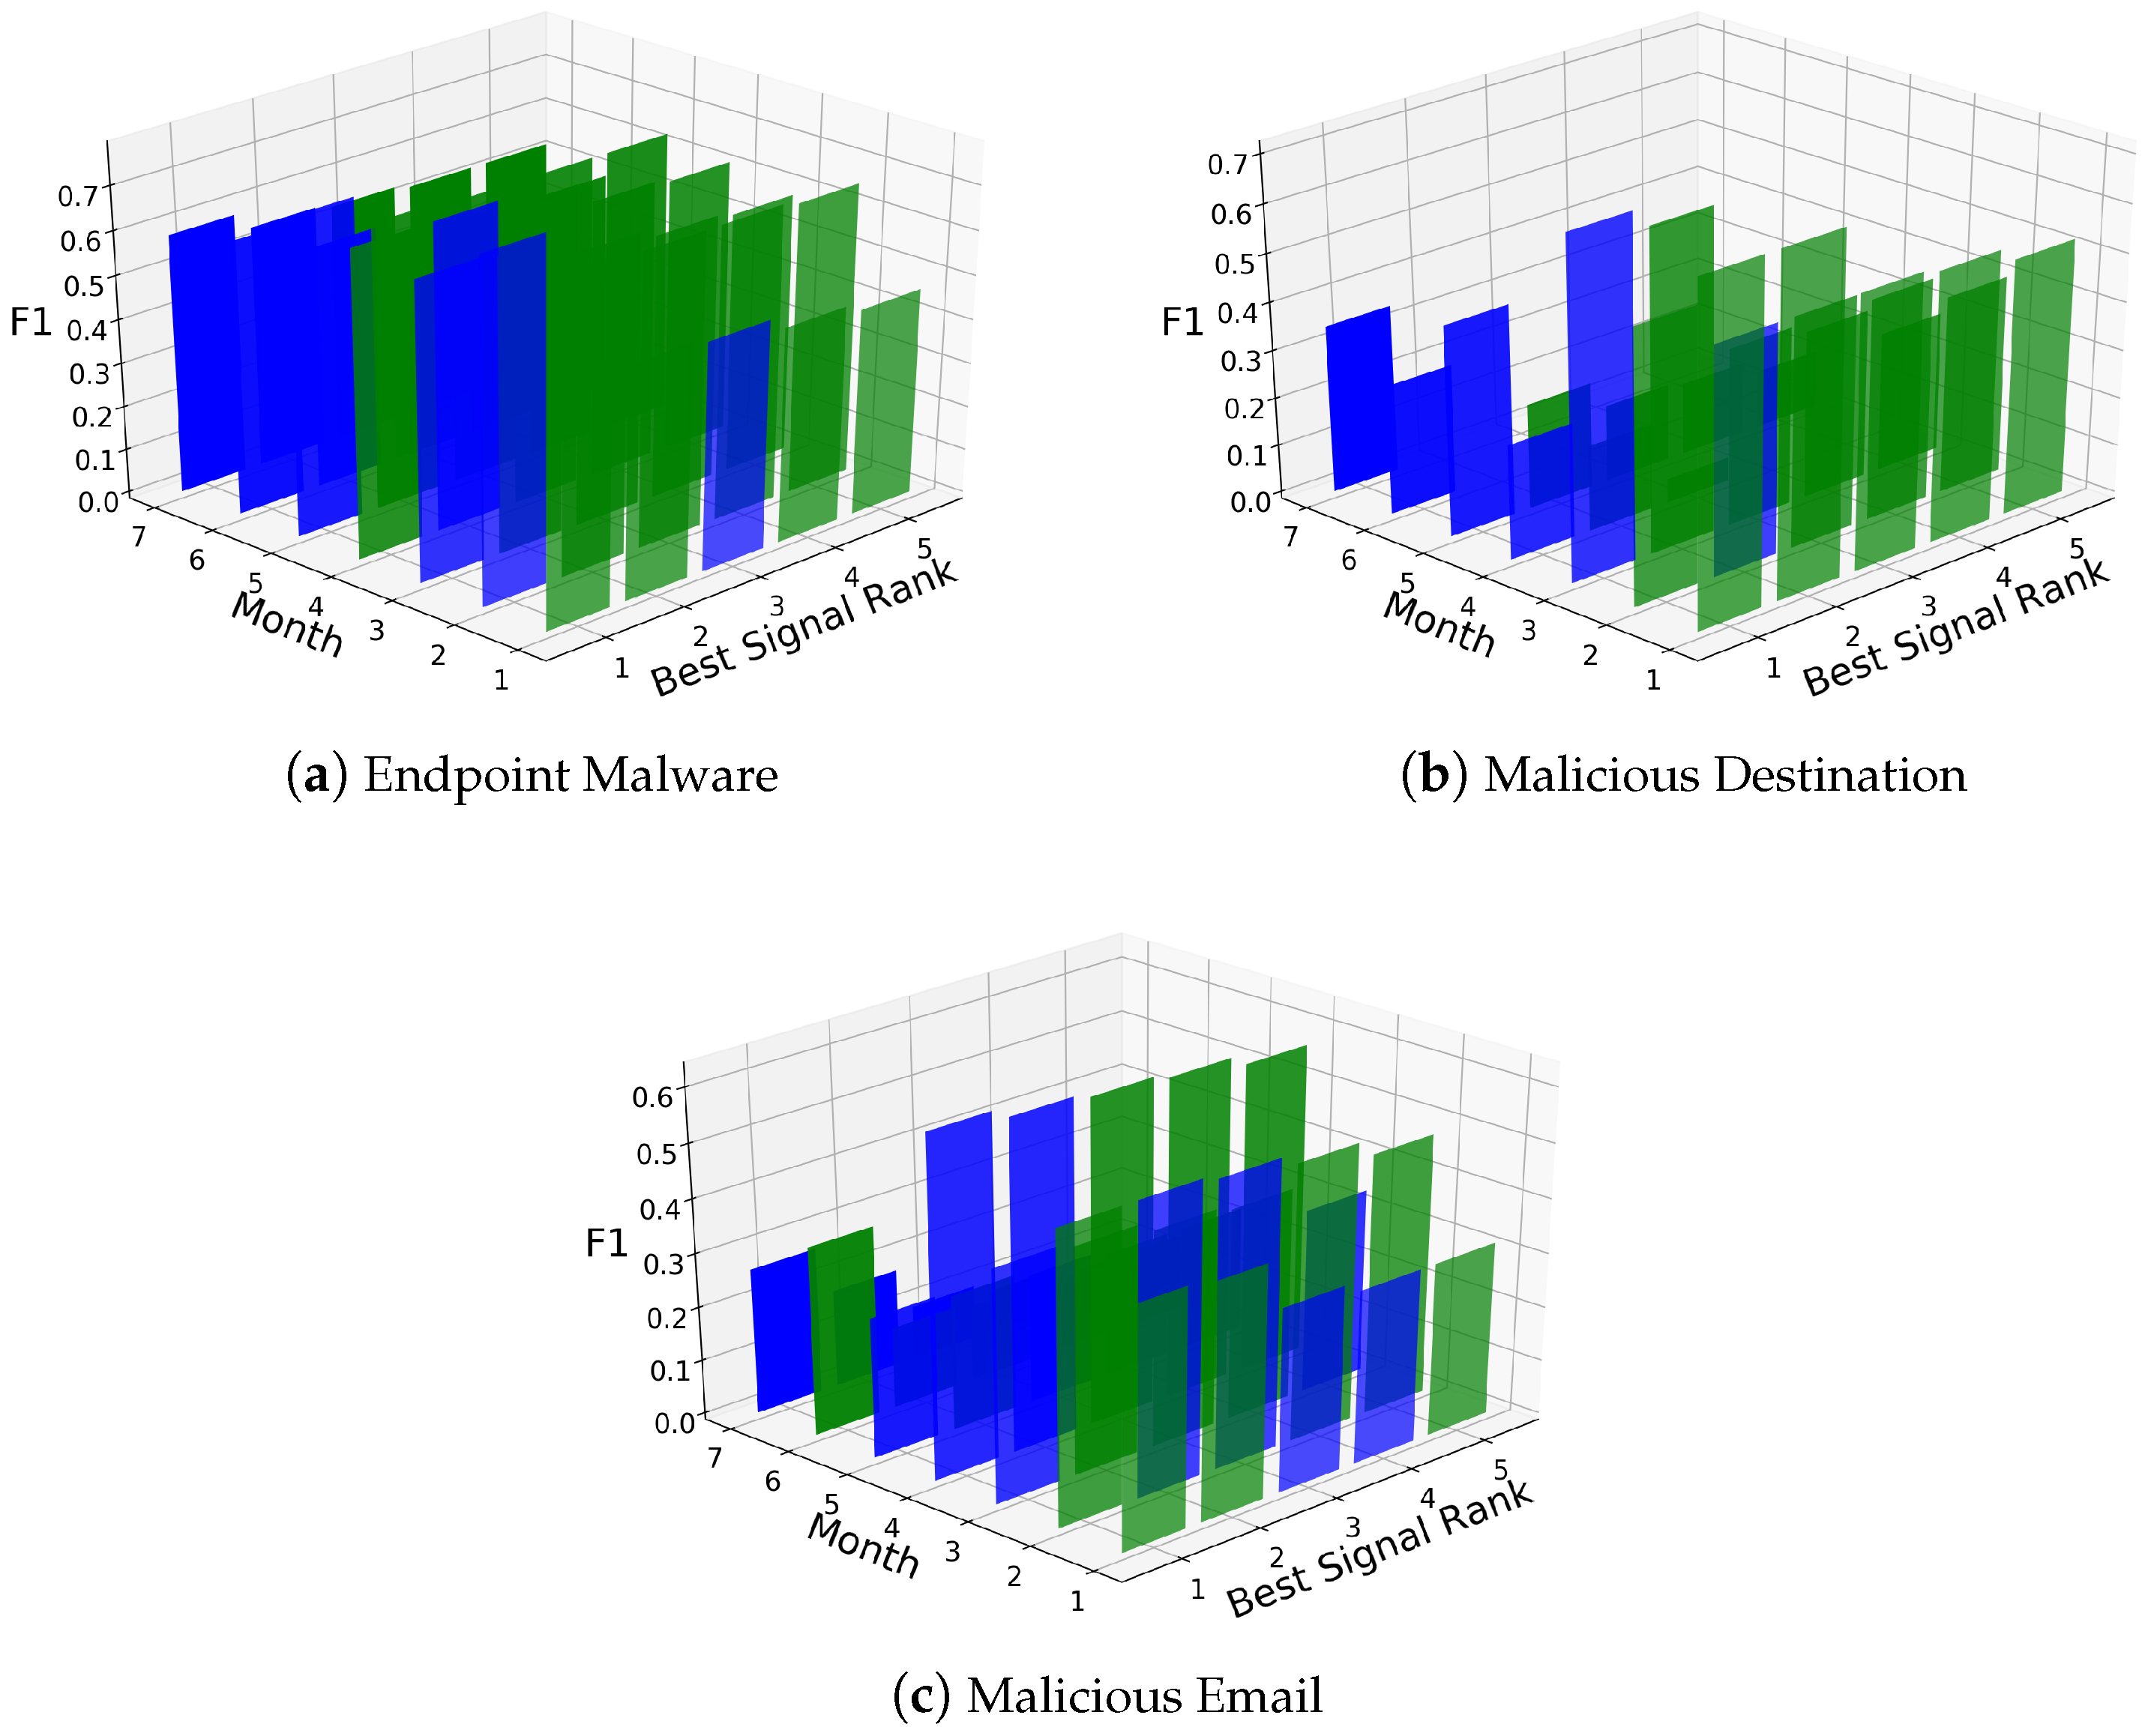
After generating ARIMAX models with each potential signal, they were scored as mentioned above for each month from July 2017 to January 2018. A visual representation of the performance is illustrated below. The top 5 signals for each month are plotted by target organization and event type. Green indicates it was a sentiment signal and blue represents one of the 5 current signals from Section 7.8. The Appendix A has the results for the months under study, by month, with the number of actual ground truth events (Evt), the number of warnings generated by each signal (Warn), and the precision (P), recall (R) and F1 score for each. The table is sorted by largest F1 score for each month with only the top five signals listed. Signals generated by sentiment analysis that were part of the top five for each month are highlighted in light blue.
8.1. Organization A
Figure 3a shows Organization A’s endpoint malware where sentiment signals dominated July, September and November and did reasonably well in the remaining months. Every month a sentiment signal beat at least on evaluation model. Malicious Destination (Figure 3b) had periodic performance July, September, November, and January but the case is not as strong as endpoint malware. Lastly, Figure 3c shows malicious-email results which illustrate that sentiment signals did well in July to September with waning results for the later months. Upon further inspection this is believed to be due to some key forums going offline toward the end of the year. The actual results can be found in the Appendix A in Table A1, Table A2 and Table A3.
8.2. Organization B
Figure 4a shows that sentiment signals do best for July and October for endpoint malware. While baseline and daywise base rate dominate the other months, sentiment signals perform better than the other evaluation models. Similar to Organization A, the Malicious Destination for Organization B (Figure 4b) does the best early in July in August and moderately well in September to November until degrading to below all evaluation models in December and January. This may be due the small number of events and perhaps sentiment signals do not perform the best under low frequency conditions. The performance for malicious email (Figure 4c) is oddly cyclical; however, sentiment signals dominated December and beat at least one evaluation model for every month. Again, the actual results can be found in the Appendix A in Table A4, Table A5 and Table A6.
8.3. Discussion
Given the novelty of application of this approach, it is not directly comparable to prior work. Most cyber-event prediction centers around using data or data sources that is extracted from the network systems. This is often logs, Internet traffic metadata or activity on network devices. We specifically use external signals meaning data not from the network. Additionally, we are making predictions using data from outside of the target organizations. There are several other methods that seek to do the same. The two other methods in literature that can serve as comparison are Dark Mention and Deep Exploit. We used these two methods as best suited state of the art for comparisons.
Dark Mention is a rule-based approach that leverages dark web data, to predict which computer vulnerabilities may be exploited partially based on mentions of the vulnerabilities online. Since there are so many software vulnerabilities identified in any given year, predicting which of those vulnerabilities are most likely to be exploited can be useful. Using a variety of external sources, they build a model that has a true positive rate of 90% with relatively low false-positive rate (13%). However, their prediction task is if a vulnerability is going to be exploited. The output of their model could also serve in itself as an external signal if you consider the time series of the count of vulnerabilities predicted to be exploited. In the tables in the Appendix A you will see that for the two organizations, three event types and across 7 months of evaluation, a sentiment signal was better than Dark Mention every time except for three times when there was a sentiment signal. The is primarily because the Dark Mention produced very few warnings and is probably better as an argumentative system rather than stand-alone.
Dark Exploit is a neural language-based method that also looks to predict the likelihood that a vulnerability will be exploit is Dark Exploit. Dark Exploit is based on the text embedding of the vulnerability mention where Dark Mention is based on a rule-based system not using a latent, embedded space. This method improves on methods such as Dark Mention by taking textual context into consideration for vulnerability exploitation prediction. In theory, the word embedding model will take semantic features such as syntax, similarity, and logical analogy into consideration. In the evaluation of the Dark Exploit paper, they achieved a F1 score of 0.74 which is slightly better than the Dark Mention model. This is evident in our analysis as Dark Exploit had performance on par with Dark Mentions. Again, since it only seeks to predict the chance of a vulnerability being exploited, it often underestimates the number of attacks and may be better suited as an augmented system as well. For the months where a sentiment signal generated warnings, it performed better than Dark Exploit except for 2 out of 42 test months.
9. Conclusions
Malicious activity can be very devastating to national security, economies, businesses, and personal lives. As such, cyber-security professionals working with major organizations and nation states could use all the help they can get in preventing malicious activity. We present a methodology to predict malicious cyber-events by exploiting malicious actor’s behavior via sentiment analysis of posts on hacker forums. These forums on both surface web and dark web have some predictive power to be used as signals external to the network for forecasting attacks using time-series models. Using ground truth data from two major organizations in the DIB across three different cyber-event types, we show that sentiment signals can be more predictive than a baseline time-series model. Additionally, they will often beat other state-of-the-art external signals, in the 7 months under study across the three event types from the two organizations, sentiment signals performed the best 15 out of 42 times or 36%. The signal parameters need to be tuned over significant historical data and the source forum could be shut off or taken down at any time; however, an automated implementation of this system would still be value added.
Author Contributions
K.L. and E.F. conceived and designed the experiments; A.D. performed the experiments, analyzed the data and wrote the paper. K.L. and E.F. contributed guidance, analysis and edits.
Funding
This project was funded by the Office of the Director of National Intelligence (ODNI) and the Intelligence Advanced Research Projects Activity (IARPA) via the Air Force Research Laboratory (AFRL) contract number FA8750-16-C-0112.
Acknowledgments
The views and conclusions contained herein are those of the authors and should not be interpreted as necessarily representing the official policies, either expressed or implied, of IARPA, or the U.S. Government. The U.S. Government had no role in study design, data collection and analysis, decision to publish, or preparation of the manuscript. The U.S. Government is authorized to reproduce and distribute reprints for governmental purposes notwithstanding any copyright annotation therein.
Conflicts of Interest
The authors declare no conflict of interest. The founding sponsors had no role in the design of the study; in the collection, analyses, or interpretation of data; in the writing of the manuscript, and in the decision to publish the results.
Abbreviations
The following abbreviations are used in this manuscript:
| AIC | Akaike information criterion |
| AMT | Amazon Mechanical Turk |
| ARIMA | autoregressive integrated moving average |
| ASU | Arizona State University |
| CAMP | Cyber-Attacker Model Profile |
| DDoS | Distributed Denial of Service |
| DIB | Defense Industrial Base |
| F1 | harmonic average of precision and recall |
| IPV4 | Internet Protocol version 4 |
| L-BFGS | limited-memory Broyden-Fletcher-Goldfarb-Shanno |
| LIWC | Linguistic Inquiry Word Count |
| NLP | natural language programming |
| MA | moving average |
| MDPI | Multidisciplinary Digital Publishing Institute |
| P | precision |
| R | recall |
| TOR | The Onion Router |
| URL | universal resource locater |
| VADER | Valence Aware Dictionary for sEntiment Reasoning |
Appendix A
Below are the data tables of the results.

Table A1.
Results from Organization A’s endpoint malware.
| Month | Evt | Warn | Signal | P | R | F1 |
|---|---|---|---|---|---|---|
| July | 15 | 14 | forum211-Senti | 0.57 | 0.53 | 0.55 |
| July | 15 | 29 | forum196-LIWC | 0.41 | 0.80 | 0.55 |
| July | 15 | 27 | forum89-Senti | 0.41 | 0.73 | 0.52 |
| July | 15 | 12 | forum111-LIWC | 0.58 | 0.47 | 0.52 |
| July | 15 | 9 | baseline | 0.67 | 0.40 | 0.50 |
| August | 19 | 14 | baseline | 0.71 | 0.53 | 0.61 |
| August | 19 | 11 | forum111-LIWC | 0.82 | 0.47 | 0.60 |
| August | 19 | 35 | forum8-Vader | 0.46 | 0.84 | 0.59 |
| August | 19 | 8 | daywise base rate | 1.00 | 0.42 | 0.59 |
| August | 19 | 23 | forum230-Senti | 0.52 | 0.63 | 0.57 |
| September | 18 | 16 | forum111LIWC | 0.69 | 0.61 | 0.65 |
| September | 18 | 32 | forum250LIWC | 0.50 | 0.89 | 0.64 |
| September | 18 | 35 | forum211vader | 0.46 | 0.89 | 0.60 |
| September | 18 | 41 | forum147LIWC | 0.41 | 0.94 | 0.58 |
| September | 18 | 41 | forum194LIWC | 0.41 | 0.94 | 0.58 |
| October | 6 | 14 | daywise base rate | 0.29 | 0.67 | 0.40 |
| October | 6 | 35 | baseline | 0.17 | 1.00 | 0.29 |
| October | 6 | 29 | forum8vader | 0.17 | 0.83 | 0.29 |
| October | 6 | 37 | forum111LIWC | 0.16 | 1.00 | 0.28 |
| October | 6 | 43 | forum211vader | 0.14 | 1.00 | 0.24 |
| November | 27 | 38 | forum6senti | 0.63 | 0.89 | 0.74 |
| November | 27 | 42 | forum147LIWC | 0.60 | 0.93 | 0.72 |
| November | 27 | 40 | forum111LIWC | 0.60 | 0.89 | 0.72 |
| November | 27 | 41 | forum211senti | 0.59 | 0.89 | 0.71 |
| November | 27 | 43 | forum121LIWC | 0.56 | 0.89 | 0.69 |
| December | 13 | 18 | arimax | 0.33 | 0.46 | 0.39 |
| December | 13 | 16 | dark mentions | 0.31 | 0.38 | 0.34 |
| December | 13 | 80 | forum121LIWC | 0.16 | 1.00 | 0.28 |
| December | 13 | 73 | forum194LIWC | 0.16 | 0.92 | 0.28 |
| December | 13 | 10 | deep exploit | 0.30 | 0.23 | 0.26 |
| January | 1 | 15 | dark mentions | 0.07 | 1.00 | 0.13 |
| January | 1 | 37 | forum6senti | 0.03 | 1.00 | 0.05 |
| January | 1 | 61 | forum147LIWC | 0.02 | 1.00 | 0.03 |
| January | 1 | 64 | baseline | 0.02 | 1.00 | 0.03 |
| January | 1 | 19 | arimax | 0.00 | 0.00 | 0.00 |
Table A2.
Results from Org. A’s Malicious Destination.
| Month | Evt | Warn | Signal | P | R | F1 |
|---|---|---|---|---|---|---|
| July | 4 | 5 | baseline | 0.40 | 0.50 | 0.44 |
| July | 4 | 3 | daywise base rate | 0.33 | 0.25 | 0.29 |
| July | 4 | 17 | dark mentions | 0.12 | 0.50 | 0.19 |
| July | 4 | 42 | forum266-LIWC | 0.05 | 0.50 | 0.09 |
| July | 4 | 0 | arimax | 0.00 | 0.00 | 0.00 |
| August | 10 | 6 | baseline | 1.00 | 0.60 | 0.75 |
| August | 10 | 10 | daywise base rate | 0.60 | 0.60 | 0.60 |
| August | 10 | 8 | dark mentions | 0.50 | 0.40 | 0.44 |
| August | 10 | 0 | arimax | 0.00 | 0.00 | 0.00 |
| August | 10 | 0 | deep exploit | 0.00 | 0.00 | 0.00 |
| September | 4 | 15 | forum194LIWC | 0.20 | 0.75 | 0.32 |
| September | 4 | 15 | forum210LIWC | 0.20 | 0.75 | 0.32 |
| September | 4 | 15 | forum264LIWC | 0.20 | 0.75 | 0.32 |
| September | 4 | 15 | forum6senti | 0.20 | 0.75 | 0.32 |
| September | 4 | 15 | forum194LIWC | 0.20 | 0.75 | 0.32 |
| October | 2 | 0 | arimax | 0.00 | 0.00 | 0.00 |
| October | 2 | 0 | dark mentions | 0.00 | 0.00 | 0.00 |
| October | 2 | 5 | daywise base rate | 0.00 | 0.00 | 0.00 |
| October | 2 | 0 | deep exploit | 0.00 | 0.00 | 0.00 |
| November | 1 | 5 | daywise base rate | 0.20 | 1.00 | 0.33 |
| November | 1 | 6 | forum111LIWC | 0.17 | 1.00 | 0.29 |
| November | 1 | 6 | forum147LIWC | 0.17 | 1.00 | 0.29 |
| November | 1 | 30 | forum210senti | 0.03 | 1.00 | 0.06 |
| November | 1 | 0 | arimax | 0.00 | 0.00 | 0.00 |
| December | 1 | 10 | daywise base rate | 0.10 | 1.00 | 0.18 |
| December | 1 | 11 | dark mentions | 0.09 | 1.00 | 0.17 |
| December | 1 | 0 | arimax | 0.00 | 0.00 | 0.00 |
| December | 1 | 0 | deep exploit | 0.00 | 0.00 | 0.00 |
| January | 2 | 24 | forum111LIWC | 0.08 | 1.00 | 0.15 |
| January | 2 | 0 | arimax | 0.00 | 0.00 | 0.00 |
| January | 2 | 10 | dark mentions | 0.00 | 0.00 | 0.00 |
| January | 2 | 9 | daywise base rate | 0.00 | 0.00 | 0.00 |
| January | 2 | 0 | deep exploit | 0.00 | 0.00 | 0.00 |
Table A3.
Results from Organization A’s malicious email.
| Month | Evt | Warn | Signal | P | R | F1 |
|---|---|---|---|---|---|---|
| July | 26 | 21 | forum210-LIWC | 0.76 | 0.62 | 0.68 |
| July | 26 | 27 | forum250-LIWC | 0.67 | 0.69 | 0.68 |
| July | 26 | 19 | forum147-LIWC | 0.74 | 0.54 | 0.62 |
| July | 26 | 36 | forum159-Senti | 0.53 | 0.73 | 0.61 |
| July | 26 | 17 | forum28-LIWC | 0.76 | 0.50 | 0.60 |
| August | 11 | 17 | forum179-VADER | 0.59 | 0.91 | 0.71 |
| August | 11 | 15 | forum250-LIWC | 0.60 | 0.82 | 0.69 |
| August | 11 | 7 | daywise base rate | 0.86 | 0.55 | 0.67 |
| August | 11 | 18 | forum210-Senti | 0.50 | 0.82 | 0.62 |
| August | 11 | 25 | forum159-Senti | 0.44 | 1.00 | 0.61 |
| September | 15 | 36 | forum264LIWC | 0.36 | 0.87 | 0.51 |
| September | 15 | 17 | daywise base rate | 0.47 | 0.53 | 0.50 |
| September | 15 | 18 | forum210senti | 0.44 | 0.53 | 0.48 |
| September | 15 | 45 | forum147LIWC | 0.31 | 0.93 | 0.47 |
| September | 15 | 46 | forum6senti | 0.28 | 0.87 | 0.43 |
| October | 11 | 14 | daywise base rate | 0.50 | 0.64 | 0.56 |
| October | 11 | 8 | deep exploit | 0.50 | 0.36 | 0.42 |
| October | 11 | 42 | forum264LIWC | 0.17 | 0.64 | 0.26 |
| October | 11 | 51 | forum194LIWC | 0.16 | 0.73 | 0.26 |
| October | 11 | 102 | forum8vader | 0.11 | 1.00 | 0.19 |
| November | 50 | 16 | daywise base rate | 0.69 | 0.22 | 0.33 |
| November | 50 | 4 | deep exploit | 0.75 | 0.06 | 0.11 |
| November | 50 | 0 | arimax | 0.00 | 0.00 | 0.00 |
| November | 50 | 0 | dark mentions | 0.00 | 0.00 | 0.00 |
| December | 17 | 22 | daywise base rate | 0.55 | 0.71 | 0.62 |
| December | 17 | 10 | deep exploit | 0.80 | 0.47 | 0.59 |
| December | 17 | 5 | dark mentions | 0.80 | 0.24 | 0.36 |
| December | 17 | 0 | arimax | 0.00 | 0.00 | 0.00 |
| January | 40 | 18 | daywise base rate | 0.94 | 0.43 | 0.59 |
| January | 40 | 8 | deep exploit | 0.75 | 0.15 | 0.25 |
| January | 40 | 6 | dark mentions | 0.83 | 0.13 | 0.22 |
| January | 40 | 0 | arimax | 0.00 | 0.00 | 0.00 |
Table A4.
Results from Organization B’s endpoint malware.
| Month | Evt | Warn | Signal | P | R | F1 |
|---|---|---|---|---|---|---|
| July | 18 | 47 | forum264LIWC | 0.38 | 1.00 | 0.55 |
| July | 18 | 50 | forum250LIWC | 0.36 | 1.00 | 0.53 |
| July | 18 | 43 | baseline | 0.37 | 0.89 | 0.52 |
| July | 18 | 35 | forum8senti | 0.37 | 0.72 | 0.49 |
| July | 18 | 50 | forum111LIWC | 0.32 | 0.89 | 0.47 |
| August | 28 | 39 | baseline | 0.67 | 0.93 | 0.78 |
| August | 28 | 31 | forum264LIWC | 0.65 | 0.71 | 0.68 |
| August | 28 | 32 | forum121LIWC | 0.63 | 0.71 | 0.67 |
| August | 28 | 35 | forum211vader | 0.60 | 0.75 | 0.67 |
| August | 28 | 33 | forum194LIWC | 0.61 | 0.71 | 0.66 |
| September | 31 | 40 | baseline | 0.60 | 0.77 | 0.68 |
| September | 31 | 38 | forum210senti | 0.61 | 0.74 | 0.67 |
| September | 31 | 37 | forum121LIWC | 0.57 | 0.68 | 0.62 |
| September | 31 | 46 | forum219vader | 0.50 | 0.74 | 0.60 |
| September | 31 | 30 | forum194LIWC | 0.60 | 0.58 | 0.59 |
| October | 53 | 44 | forum210LIWC | 0.77 | 0.64 | 0.70 |
| October | 53 | 47 | baseline | 0.74 | 0.66 | 0.70 |
| October | 53 | 41 | forum264LIWC | 0.78 | 0.60 | 0.68 |
| October | 53 | 39 | forum250LIWC | 0.74 | 0.55 | 0.63 |
| October | 53 | 40 | forum8vader | 0.73 | 0.55 | 0.62 |
| November | 37 | 52 | daywise base rate | 0.62 | 0.86 | 0.72 |
| November | 37 | 49 | forum121LIWC | 0.57 | 0.76 | 0.65 |
| November | 37 | 53 | forum147LIWC | 0.55 | 0.78 | 0.64 |
| November | 37 | 50 | forum111LIWC | 0.56 | 0.76 | 0.64 |
| November | 37 | 50 | forum194LIWC | 0.56 | 0.76 | 0.64 |
| December | 35 | 30 | daywise base rate | 0.67 | 0.57 | 0.62 |
| December | 35 | 27 | baseline | 0.63 | 0.49 | 0.55 |
| December | 35 | 23 | forum250LIWC | 0.65 | 0.43 | 0.52 |
| December | 35 | 28 | forum194LIWC | 0.57 | 0.46 | 0.51 |
| December | 35 | 29 | forum147LIWC | 0.55 | 0.46 | 0.50 |
| January | 43 | 42 | baseline | 0.60 | 0.58 | 0.59 |
| January | 43 | 37 | daywise base rate | 0.59 | 0.51 | 0.55 |
| January | 43 | 35 | forum219vader | 0.60 | 0.49 | 0.54 |
| January | 43 | 37 | forum111LIWC | 0.57 | 0.49 | 0.53 |
| January | 43 | 37 | forum147LIWC | 0.57 | 0.49 | 0.53 |
Table A5.
Results from Org. B’s Malicious Destination.
| Month | Evt | Warn | Signal | P | R | F1 |
|---|---|---|---|---|---|---|
| July | 6 | 8 | forum130vader | 0.63 | 0.83 | 0.71 |
| July | 6 | 8 | forum8senti | 0.63 | 0.83 | 0.71 |
| July | 6 | 8 | forum111LIWC | 0.50 | 0.67 | 0.57 |
| July | 6 | 12 | forum194LIWC | 0.42 | 0.83 | 0.56 |
| July | 6 | 9 | forum210senti | 0.44 | 0.67 | 0.53 |
| August | 8 | 6 | forum210senti | 0.67 | 0.50 | 0.57 |
| August | 8 | 17 | daywise base rate | 0.35 | 0.75 | 0.48 |
| August | 8 | 13 | forum211senti | 0.38 | 0.63 | 0.48 |
| August | 8 | 5 | forum210LIWC | 0.60 | 0.38 | 0.46 |
| August | 8 | 21 | forum8vader | 0.29 | 0.75 | 0.41 |
| September | 6 | 11 | daywise base rate | 0.55 | 1.00 | 0.71 |
| September | 6 | 9 | forum210LIWC | 0.56 | 0.83 | 0.67 |
| September | 6 | 10 | forum250LIWC | 0.30 | 0.50 | 0.37 |
| September | 6 | 11 | forum121LIWC | 0.27 | 0.50 | 0.35 |
| September | 6 | 1 | forum147LIWC | 1.00 | 0.17 | 0.29 |
| October | 9 | 8 | daywise base rate | 0.25 | 0.22 | 0.24 |
| October | 9 | 2 | forum121LIWC | 0.50 | 0.11 | 0.18 |
| October | 9 | 114 | forum210senti | 0.03 | 0.33 | 0.05 |
| October | 9 | 0 | arimax | 0.00 | 0.00 | 0.00 |
| October | 9 | 0 | dark mentions | 0.00 | 0.00 | 0.00 |
| November | 4 | 14 | daywise base rate | 0.29 | 1.00 | 0.44 |
| November | 4 | 5 | forum210LIWC | 0.20 | 0.25 | 0.22 |
| November | 4 | 21 | forum219vader | 0.10 | 0.50 | 0.16 |
| November | 4 | 9 | forum211vader | 0.11 | 0.25 | 0.15 |
| November | 4 | 13 | forum210senti | 0.08 | 0.25 | 0.12 |
| December | 3 | 12 | daywise base rate | 0.17 | 0.67 | 0.27 |
| December | 3 | 0 | arimax | 0.00 | 0.00 | 0.00 |
| December | 3 | 0 | dark mentions | 0.00 | 0.00 | 0.00 |
| December | 3 | 0 | deep exploit | 0.00 | 0.00 | 0.00 |
| January | 5 | 18 | daywise base rate | 0.22 | 0.80 | 0.35 |
| January | 5 | 0 | arimax | 0.00 | 0.00 | 0.00 |
| January | 5 | 0 | dark mentions | 0.00 | 0.00 | 0.00 |
| January | 5 | 0 | deep exploit | 0.00 | 0.00 | 0.00 |
Table A6.
Results from Organization B’s malicious email.
| Month | Evt | Warn | Signal | P | R | F1 |
|---|---|---|---|---|---|---|
| July | 24 | 49 | forum210LIWC | 0.33 | 0.67 | 0.44 |
| July | 24 | 56 | forum210senti | 0.30 | 0.71 | 0.43 |
| July | 24 | 75 | baseline | 0.23 | 0.71 | 0.34 |
| July | 24 | 81 | daywise base rate | 0.21 | 0.71 | 0.32 |
| July | 24 | 81 | forum130vader | 0.21 | 0.71 | 0.32 |
| August | 57 | 55 | forum111LIWC | 0.55 | 0.53 | 0.54 |
| August | 57 | 70 | baseline | 0.49 | 0.60 | 0.54 |
| August | 57 | 91 | daywise base rate | 0.43 | 0.68 | 0.53 |
| August | 57 | 107 | forum147LIWC | 0.39 | 0.74 | 0.51 |
| August | 57 | 153 | forum6senti | 0.33 | 0.88 | 0.48 |
| September | 179 | 70 | daywise base rate | 0.76 | 0.30 | 0.43 |
| September | 179 | 102 | forum210senti | 0.58 | 0.33 | 0.42 |
| September | 179 | 180 | forum210LIWC | 0.40 | 0.40 | 0.40 |
| September | 179 | 100 | forum147LIWC | 0.54 | 0.30 | 0.39 |
| September | 179 | 76 | baseline | 0.57 | 0.24 | 0.34 |
| October | 71 | 125 | daywise base rate | 0.50 | 0.87 | 0.63 |
| October | 71 | 118 | baseline | 0.49 | 0.82 | 0.61 |
| October | 71 | 90 | forum211senti | 0.53 | 0.68 | 0.60 |
| October | 71 | 142 | forum194LIWC | 0.44 | 0.89 | 0.59 |
| October | 71 | 150 | forum210senti | 0.42 | 0.89 | 0.57 |
| November | 426 | 104 | daywise base rate | 0.67 | 0.16 | 0.26 |
| November | 426 | 205 | forum264LIWC | 0.39 | 0.19 | 0.25 |
| November | 426 | 118 | baseline | 0.55 | 0.15 | 0.24 |
| November | 426 | 251 | forum210LIWC | 0.31 | 0.18 | 0.23 |
| November | 426 | 579 | forum210senti | 0.20 | 0.27 | 0.23 |
| December | 51 | 69 | forum210LIWC | 0.30 | 0.41 | 0.35 |
| December | 51 | 329 | forum147LIWC | 0.09 | 0.55 | 0.15 |
| December | 51 | 313 | forum111LIWC | 0.08 | 0.51 | 0.14 |
| December | 51 | 249 | forum194LIWC | 0.08 | 0.41 | 0.14 |
| December | 51 | 284 | forum211senti | 0.08 | 0.45 | 0.14 |
| January | 10 | 12 | deep exploit | 0.25 | 0.30 | 0.27 |
| January | 10 | 103 | daywise base rate | 0.10 | 1.00 | 0.18 |
| January | 10 | 186 | baseline | 0.05 | 1.00 | 0.10 |
| January | 10 | 226 | forum111LIWC | 0.04 | 1.00 | 0.08 |
References
- Dutt, V.; Ahn, Y.S.; Gonzalez, C. Cyber situation awareness: Modeling detection of cyber attacks with instance-based learning theory. Hum. Factors 2013, 55, 605–618. [Google Scholar] [CrossRef] [PubMed]
- Jajodia, S.; Liu, P.; Swarup, V.; Wang, C. Cyber Situational Awareness; Springer: Berlin/Heidelberg, Germany, 2009. [Google Scholar]
- Franke, U.; Brynielsson, J. Cyber situational awareness–a systematic review of the literature. Comput. Secur. 2014, 46, 18–31. [Google Scholar] [CrossRef]
- Freud, S.; Strachey, J. The psychopathology of everyday life. The Standard Edition of the complete psychological works of Sigmund Freud. Trans. James Strachey 1901, 24, 1953–1974. [Google Scholar]
- Pang, B.; Lee, L.; Vaithyanathan, S. Thumbs up?: Sentiment classification using machine learning techniques. In Proceedings of the ACL-02 conference on Empirical methods in natural language processing, Philadelphia, PA, USA, 6–7 July 2002; pp. 79–86. [Google Scholar]
- Pfleeger, S.L.; Caputo, D.D. Leveraging behavioral science to mitigate cyber security risk. Comput. Secur. 2012, 31, 597–611. [Google Scholar] [CrossRef]
- Agarwal, S.; Sureka, A. Applying social media intelligence for predicting and identifying on-line radicalization and civil unrest oriented threats. arXiv, 2015; arXiv:1511.06858. [Google Scholar]
- Asur, S.; Huberman, B.A. Predicting the future with social media. In Proceedings of the 2010 IEEE/WIC/ ACM International Conference on Web Intelligence and Intelligent Agent Technology, Toronto, ON, Canada, 31 August–3 September 2010; pp. 492–499. [Google Scholar]
- Kalampokis, E.; Tambouris, E.; Tarabanis, K. Understanding the predictive power of social media. Internet Res. 2013, 23, 544–559. [Google Scholar] [CrossRef]
- Macdonald, M.; Frank, R.; Mei, J.; Monk, B. Identifying digital threats in a hacker web forum. In Proceedings of the 2015 IEEE/ACM International Conference on Advances in Social Networks Analysis and Mining, Paris, France, 25–28 August 2015; pp. 926–933. [Google Scholar]
- Al-Rowaily, K.; Abulaish, M.; Haldar, N.A.H.; Al-Rubaian, M. BiSAL–A bilingual sentiment analysis lexicon to analyze Dark Web forums for cyber security. Digit. Investig. 2015, 14, 53–62. [Google Scholar] [CrossRef]
- Chen, H. Sentiment and affect analysis of dark web forums: Measuring radicalization on the internet. In Proceedings of the 2008 IEEE International Conference on Intelligence and Security Informatics, Taipei, Taiwan, 17–20 June 2008; pp. 104–109. [Google Scholar]
- Park, H.; Jung, S.O.D.; Lee, H.; In, H.P. Cyber weather forecasting: Forecasting unknown internet worms using randomness analysis. In Proceedings of the IFIP International Information Security Conference, Heraklion, Greece, 4–6 June 2012; pp. 376–387. [Google Scholar]
- Pontes, E.; Guelfi, A.E.; Kofuji, S.T.; Silva, A.A. Applying multi-correlation for improving forecasting in cyber security. In Proceedings of the Sixth International Conference on Digital Information Management, Melbourne, Australia, 26–28 September 2011; pp. 179–186. [Google Scholar]
- Leslie, N.O.; Harang, R.E.; Knachel, L.P.; Kott, A. Statistical models for the number of successful cyber intrusions. J. Def. Model. Simul. 2018, 15, 49–63. [Google Scholar] [CrossRef]
- Zhang, S.; Ou, X.; Caragea, D. Predicting cyber risks through national vulnerability database. Inf. Secur. J. 2015, 24, 194–206. [Google Scholar] [CrossRef]
- Nahar, V.; Unankard, S.; Li, X.; Pang, C. Sentiment analysis for effective detection of cyber bullying. In Proceedings of the Web Technologies and Applications—14th Asia-Pacific Web Conference, APWeb 2012, Kunming, China, 11–13 April 2012; pp. 767–774. [Google Scholar]
- Gandotra, E.; Bansal, D.; Sofat, S. Computational techniques for predicting cyber threats. In Intelligent Computing, Communication and Devices, Advance in Intelligent Systems and Computing; Springer: Berlin/Heidelberg, Germany, 2015. [Google Scholar]
- Dingledine, R.; Mathewson, N.; Syverson, P. Tor: The Second-Generation Onion Router; Technical report; Naval Research Lab: Washington, DC, USA, 2004. [Google Scholar]
- Nunes, E.; Diab, A.; Gunn, A.; Marin, E.; Mishra, V.; Paliath, V.; Robertson, J.; Shakarian, J.; Thart, A.; Shakarian, P. Darknet and deepnet mining for proactive cybersecurity threat intelligence. In Proceedings of the 2016 IEEE Conference on Intelligence and Security Informatics (ISI), Tucson, AZ, USA, 28–30 September 2016; pp. 7–12. [Google Scholar]
- Lacey, D.; Salmon, P.M. It’s dark in there: Using systems analysis to investigate trust and engagement in dark web forums. In Proceedings of the International Conference on Engineering Psychology and Cognitive Ergonomics, Los Angeles, CA, USA, 2–7 August 2015; pp. 117–128. [Google Scholar]
- Sapienza, A.; Bessi, A.; Damodaran, S.; Shakarian, P.; Lerman, K.; Ferrara, E. Early warnings of cyber threats in online discussions. In Proceeding of the 2017 IEEE International Conference on Data Mining Workshops (ICDMW), New Orleans, LA, USA, 18–21 November 2017; pp. 667–674. [Google Scholar]
- Sabottke, C.; Suciu, O.; Dumitras, T. Vulnerability disclosure in the age of social media: Exploiting twitter for predicting real-world exploits. In Proceedings of the USENIX Security Symposium, Washington, DC, USA, 12–14 August 2015; pp. 1041–1056. [Google Scholar]
- Tavabi, N.; Goyal, P.; Almukaynizi, M.; Shakarian, P.; Lerman, K. DarkEmbed: Exploit prediction with neural language models. In Proceedings of the Thirtieth Annual Conference on Innovative Applications of Artificial Intelligence, New Orleans, LA, USA, 2–7 Feburary 2018. [Google Scholar]
- Watters, P.A.; McCombie, S.; Layton, R.; Pieprzyk, J. Characterising and predicting cyber attacks using the Cyber Attacker Model Profile (CAMP). J. Money Laund. Control. 2012, 15, 430–441. [Google Scholar] [CrossRef]
- Robertson, J.; Diab, A.; Marin, E.; Nunes, E.; Paliath, V.; Shakarian, J.; Shakarian, P. Darkweb Cyber Threat Intelligence Mining; Cambridge University Press: Cambridge, UK, 2017. [Google Scholar]
- Ribeiro, F.N.; Araújo, M.; Gonçalves, P.; Gonçalves, M.A.; Benevenuto, F. SentiBench—A benchmark comparison of state-of-the-practice sentiment analysis methods. EPJ Data Sci. 2016, 5, 1–29. [Google Scholar] [CrossRef]
- Hutto, C.; Gilbert, E. VADER: A parsimonious rule-based model for sentiment analysis of social media text. In Proceedings of the Eighth International AAAI Conference on Weblogs and Social Media, Ann Arbor, MI, USA, 1–4 June 2014. [Google Scholar]
- Pennebaker, J.W.; Francis, M.E.; Booth, R.J. Linguistic Inquiry and Word Count: LIWC 2001; Lawrence Erlbaum Associates: Mahway, NJ, USA, 2001. [Google Scholar]
- Thelwal, M. Heart and soul: Sentiment strength detection in the social web with SentiStrength. Cyberemotion 2013, 1–14. [Google Scholar]
- Shumway, R.H.; Stoffer, D.S. Time Series Analysis and Its Applications; Springer: Berlin/Heidelberg, Germany, 2011. [Google Scholar]
- Seabold, S.; Perktold, J. Statsmodels: Econometric and statistical modeling with python. In Proceedings of the 9th Python in Science Conference, Austin, TX, USA, 28 June–3 July 2010. [Google Scholar]
- Kuhn, H.W. The Hungarian method for the assignment problem. Nav. Res. Logist. 1955, 2, 83–97. [Google Scholar] [CrossRef] [Green Version]
- Almukaynizi, M.; Nunes, E.; Dharaiya, K.; Senguttuvan, M.; Shakarian, J.; Shakarian, P. Proactive identification of exploits in the wild through vulnerability mentions online. In Proceedings of the 2017 International Conference on Cyber Conflict (CyCon U.S.), Washington, DC, USA, 7–8 November 2017; pp. 82–88. [Google Scholar]
Figure 1.
Average F1 Scores by Signal using Different Running Averages.

Figure 2.
Overview of the methodology.

Figure 3.
Organization A results.

Figure 4.
Organization B results.

Table 1.
Number of Cyber-Events by Organization.
| Organization A | Organization B | |||||
|---|---|---|---|---|---|---|
| Month | EP-Mal | Mal-Dest | Mal-Email | EP-Mal | Mal-Dest | Mal-Email |
| July | 15 | 4 | 26 | 18 | 6 | 24 |
| August | 19 | 10 | 11 | 28 | 8 | 57 |
| September | 18 | 4 | 15 | 31 | 6 | 179 |
| October | 6 | 2 | 11 | 53 | 9 | 71 |
| November | 27 | 1 | 50 | 37 | 4 | 426 |
| December | 13 | 1 | 17 | 35 | 3 | 51 |
| January | 1 | 2 | 40 | 43 | 5 | 10 |
Table 2.
Best Signals for Organization B’s Events.
| Forum# | Sent | Lag | Correlation | p Value | Events |
|---|---|---|---|---|---|
| 84 | LIWC | −11 | 0.2170 | 0.000055 | EP-Mal |
| 84 | LIWC | −12 | 0.2221 | 0.000037 | EP-Mal |
| 84 | LIWC | −14 | 0.2185 | 0.000052 | EP-Mal |
| 219 | VADER | −18 | −0.2329 | 0.000079 | EP-Mal |
| 264 | LIWC | −10 | 0.2472 | 0.000040 | EP-Mal |
| 264 | LIWC | −12 | 0.2362 | 0.000095 | EP-Mal |
| 264 | LIWC | −15 | 0.2380 | 0.000091 | EP-Mal |
| 261 | LIWC | −3 | 0.2173 | 0.000043 | Mal-Dest |
| 266 | Senti | −27 | −0.6243 | 0.000080 | Mal-Dest |
| 159 | Senti | −14 | 0.8498 | 0.000008 | Mal-Email |
| 266 | Senti | −14 | −0.5517 | 0.000058 | Mal-Email |
© 2018 by the authors. Licensee MDPI, Basel, Switzerland. This article is an open access article distributed under the terms and conditions of the Creative Commons Attribution (CC BY) license (http://creativecommons.org/licenses/by/4.0/).
Share and Cite
MDPI and ACS Style
Deb, A.; Lerman, K.; Ferrara, E. Predicting Cyber-Events by Leveraging Hacker Sentiment. Information 2018, 9, 280. https://doi.org/10.3390/info9110280
AMA Style
Deb A, Lerman K, Ferrara E. Predicting Cyber-Events by Leveraging Hacker Sentiment. Information. 2018; 9(11):280. https://doi.org/10.3390/info9110280
Chicago/Turabian StyleDeb, Ashok, Kristina Lerman, and Emilio Ferrara. 2018. "Predicting Cyber-Events by Leveraging Hacker Sentiment" Information 9, no. 11: 280. https://doi.org/10.3390/info9110280
Note that from the first issue of 2016, this journal uses article numbers instead of page numbers. See further details here.