Remotely Monitoring Cancer-Related Fatigue Using the Smart-Phone: Results of an Observational Study


1
Wearable Computing Lab, ETH Zurich, 8092 Zürich, Switzerland
2
University Hospital Zurich, University of Zurich, Switzerland
3
University of Zurich, Switzerland
4
Clinic Zugersee, Center for Psychiatry and Psychotherapy, Oberwil-Zug, Switzerland
*
Author to whom correspondence should be addressed.
Information 2018, 9(11), 271; https://doi.org/10.3390/info9110271
Submission received: 30 September 2018
/
Revised: 24 October 2018
/
Accepted: 25 October 2018
/
Published: 30 October 2018
(This article belongs to the Special Issue e-Health Pervasive Wireless Applications and Services (e-HPWAS'17))
Abstract
:Cancer related fatigue is a chronic disease that may persist up to 10 years after successful cancer treatment and is one of the most prevalent problems in cancer survivors. Cancer related fatigue is a complex symptom that is not yet explained completely and there are only a few remedies with proven evidence. Patients do not necessarily follow a treatment plan with regular follow ups. As a consequence, physicians lack of knowledge how their patients are coping with their fatigue in daily life. To overcome this knowledge gap, we developed a smartphone-based monitoring system. A developed Android app provides activity data from smartphone sensors and applies experience based sampling to collect the patients’ subjective perceptions of their fatigue and interference of fatigue with the patients’ daily life. To evaluate the monitoring system in an observational study, we recruited seven patients suffering from cancer related fatigue and tracked them over two to three weeks. We collected around 2700 h of activity data and over 500 completed questionnaires. We analysed the average completion of answering the digital questionnaires and the wearing time of the smartphone. A within-subject analysis of the perceived fatigue, its interference and measured physical activity yielded in patient specific fatigue and activity patterns depending on the time of day. Physical activity level correlated stronger with the interference of fatigue than with the fatigue itself and the variance of the acceleration correlates stronger than absolute activity values. With this work, we provide a monitoring system used for cancer related fatigue. We show with an observational study that the monitoring system is accepted by our study cohort and that it provides additional details about the perceived fatigue and physical activity to a weekly paper-based questionnaire.
1. Introduction
Some cancer survivors are confronted with additional hurdles even after having defeated their cancer. One of the most prevalent problems is cancer related fatigue (CRF): almost all cancer patients suffer from CRF during treatment [1] and about of cancer survivors suffer from CRF after successful treatment for up to 10 years [2]: the exhausting treatment and stressful situation of the severe disease are finished, yet CRF patients still feel constantly exhausted on a physical, mental and psychological level. Furthermore, usual behaviours like regenerative sleeping do not improve the tiredness of CRF patients.
The etiology of CRF is complex and includes physiological causes related to cancer treatment and medication as well as behavioural factors such as fear, depression or insomnia and reduced physical activity [2].
A moderate to severe CRF reduces physical and mental capabilities. This can lead to inability to work, impairment of social life, daily activities and hobbies, and can also negatively impact relationships. Overall, this negative interference with daily life reduces quality of life [3,4]. During FATIGUE2 study [3], 376 patients were interviewed about the physical, emotional, behavioural and economical impact of fatigue after being treated with chemotherapy. In addition, of the interviewed patients suffered from fatigue () and reported that CRF prevents them from leading a normal life. Curt concludes that CRF reduces the quality of life (QoL) more than other symptoms [3].
Psychological interventions and psycho-stimulant drugs have been used as therapies, although evidence of efficacy is still low for both categories of intervention. Drugs have negative side effects and a risk of addiction, leading to increased research for alternative treatment methods. Studies have discovered evidence for cognitive behavioural therapy, mindfulness-based meditation [5], physical interventions including moderate physical exercise, walking or yoga [6]. However, more research is required to reveal deeper knowledge and understanding of the underlying mechanisms of the disease. More detailed and individualised recommendations are needed on when, how often, how much and what type of exercise is most effective in the context of other diseases as well, such as depression [7].
After a systematic review of studies investigating CRF, Prue et al. concluded that studies should have a longitudinal design including frequent assessments of the fatigue and a healthy control group [8]. Kelley et al. confirm Prue with their conclusion that “additional well-designed randomised controlled trials and meta-analyses appear warranted” [9].
Monitoring systems and mobile health have been explored for patients with other diseases such as patients with cardiovascular diseases [10,11], mental diseases [12,13,14,15,16], Parkinson [17] and for patients in rehabilitation [18]. Activities could be related to pain level [19] and mental health [20]. Furthermore, Huh presents an intestersting approach how to visualize big data on smartphones for personalized health activities in order to investigate obesity in Korea [21].
Timmerman et al. could correlate the severity of CRF with physical daily activity using a device worn on the hip to measure acceleration [22].
Besides monitoring, mobile Health smartphone apps serve as a tool to provide cancer information [23] and have educational purposes such as support cancer prevention (e.g., reminders to use sun screen), early detection of cancer (e.g., skin cancer [24]), diagnosis and treatment [25].
However, the usage of the smart-phone as sole sensor and questionnaire platform for application in fatigue cancer survivors has not yet been investigated according to current literature review [26].
This work examined how activity monitoring and digital questionnaires provided by the smartphone could be applied in longitudinal studies, realising a fatigue assessment with a frequency of several times per day. The study goal was to gain information concerning the course of fatigue, patients’ behaviour and physical activity. Analysis of patients’ self-reports and activity data evaluated the patients’ retention and revealed insights about the course of the perceived fatigue and activity patterns of six patients. With our monitoring system, we contribute to the research of cancer related fatigue by providing a monitoring system that
- is inexpensive and integrated in daily life of patients, since it is based on smartphones,
- is accepted by patients suffering from cancer related fatigue,
- allows to collect subjective data in terms of patients’ self-reports and objective behavioral data,
- is designed for long-term usage.
2. Materials and Methods
This sections describe the designed activity monitoring system, the protocol of the performed observational study and the performed data analysis.
2.1. Monitoring System
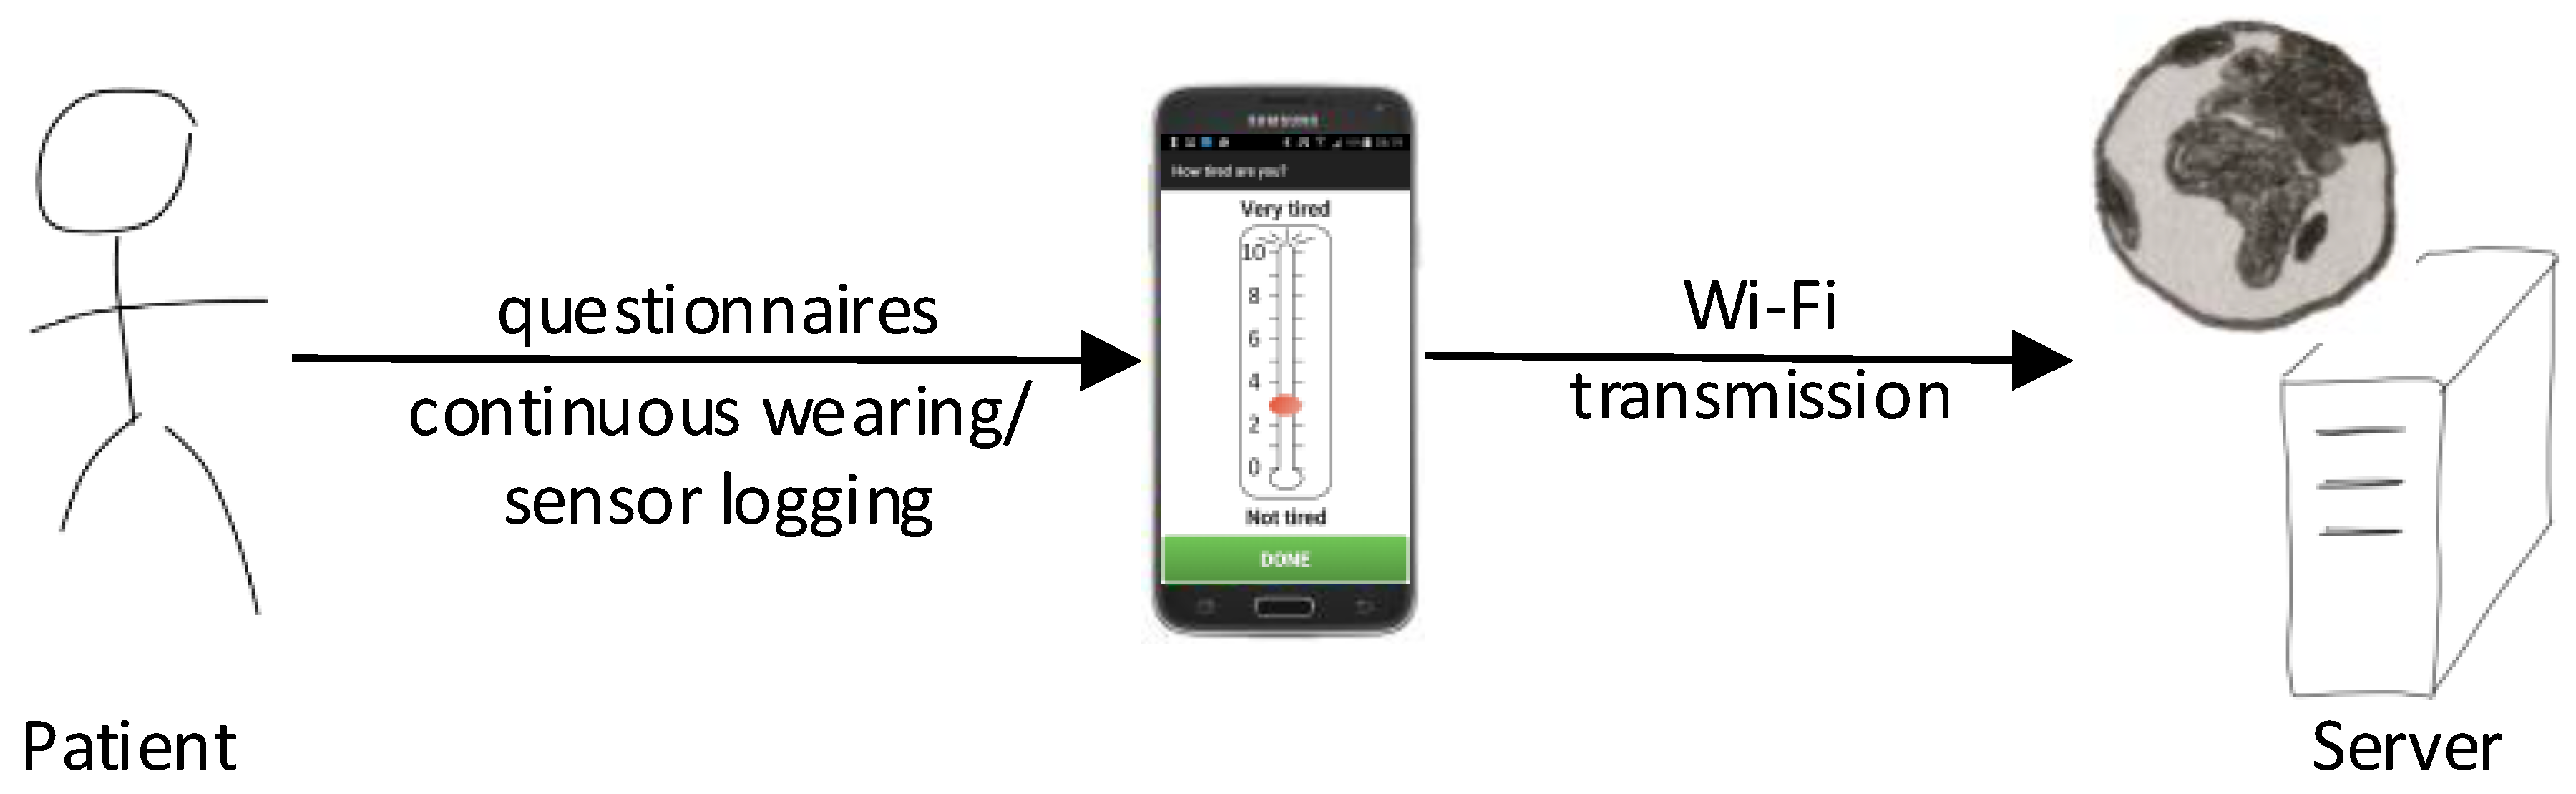
We implemented a monitoring system as depicted in Figure 1. It consists of a smartphone (Samsung Galaxy S5, Samsung, Seoul, South Korea), an Android activity tracking app and a web-server that receives and stores the data. The system design was re-used from [27]. In contrast to the system that is described in [27], we focused here on activity monitoring with the smart-phone only. Hence, we did not include any additional wearables as in [27].
Android App
We re-used the app design that was developed following a patient-centric approach [27]. Transparent to the user, the app is collecting data concerning physical activity as described in Table 1. In addition, the smartphone reminds the patient to fill out digital questionnaires following the experience based sampling method (ESM).
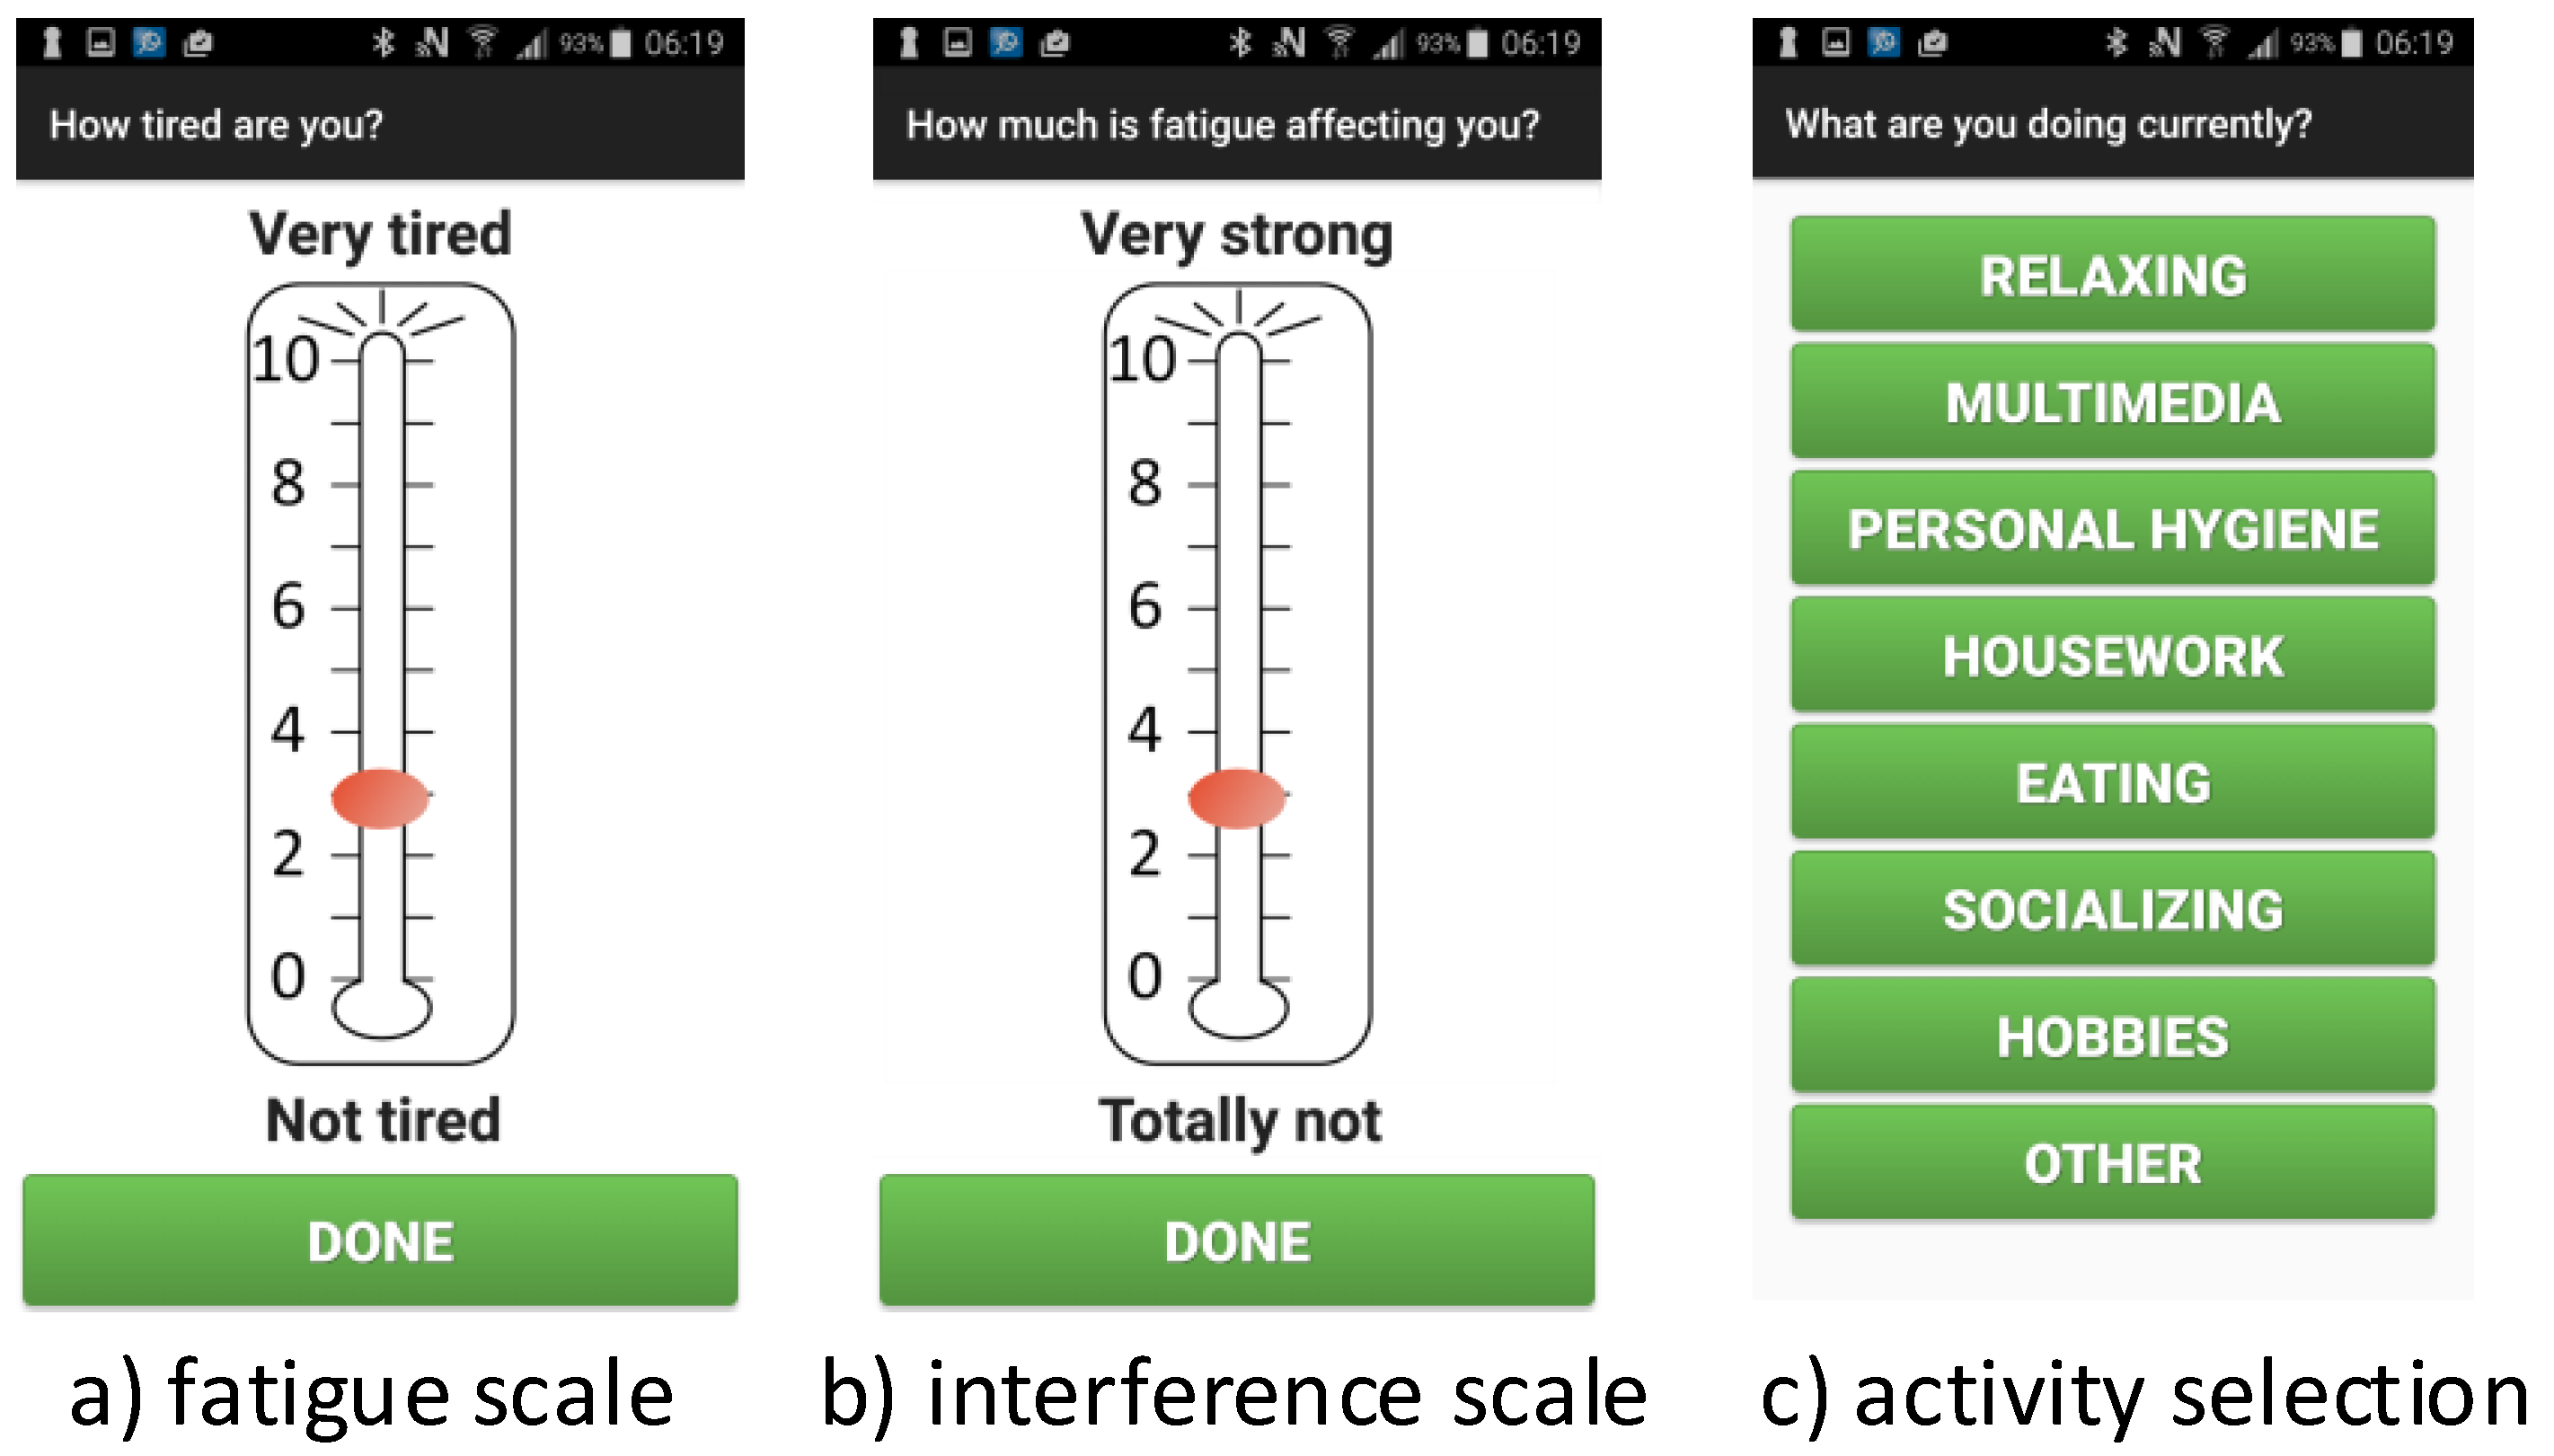
The questionnaires are collected via a patient interface that is integrated in the activity monitoring app. Via vibration alarm, the smartphone app reminds patients to report their perceived fatigue, the interference of fatigue and the currently performed activity. To answer the first two questions, the app shows visual analogue scales (VAS), and the last question is answered by pressing the appropriate button. Following the ESM, the timing of the questionnaires is randomised—ensuring that the whole day is covered. Figure 2 shows the design of the two types of questionnaires. To allow a simple selection of an activity, the app provides seven activities and a blank card “Other”.
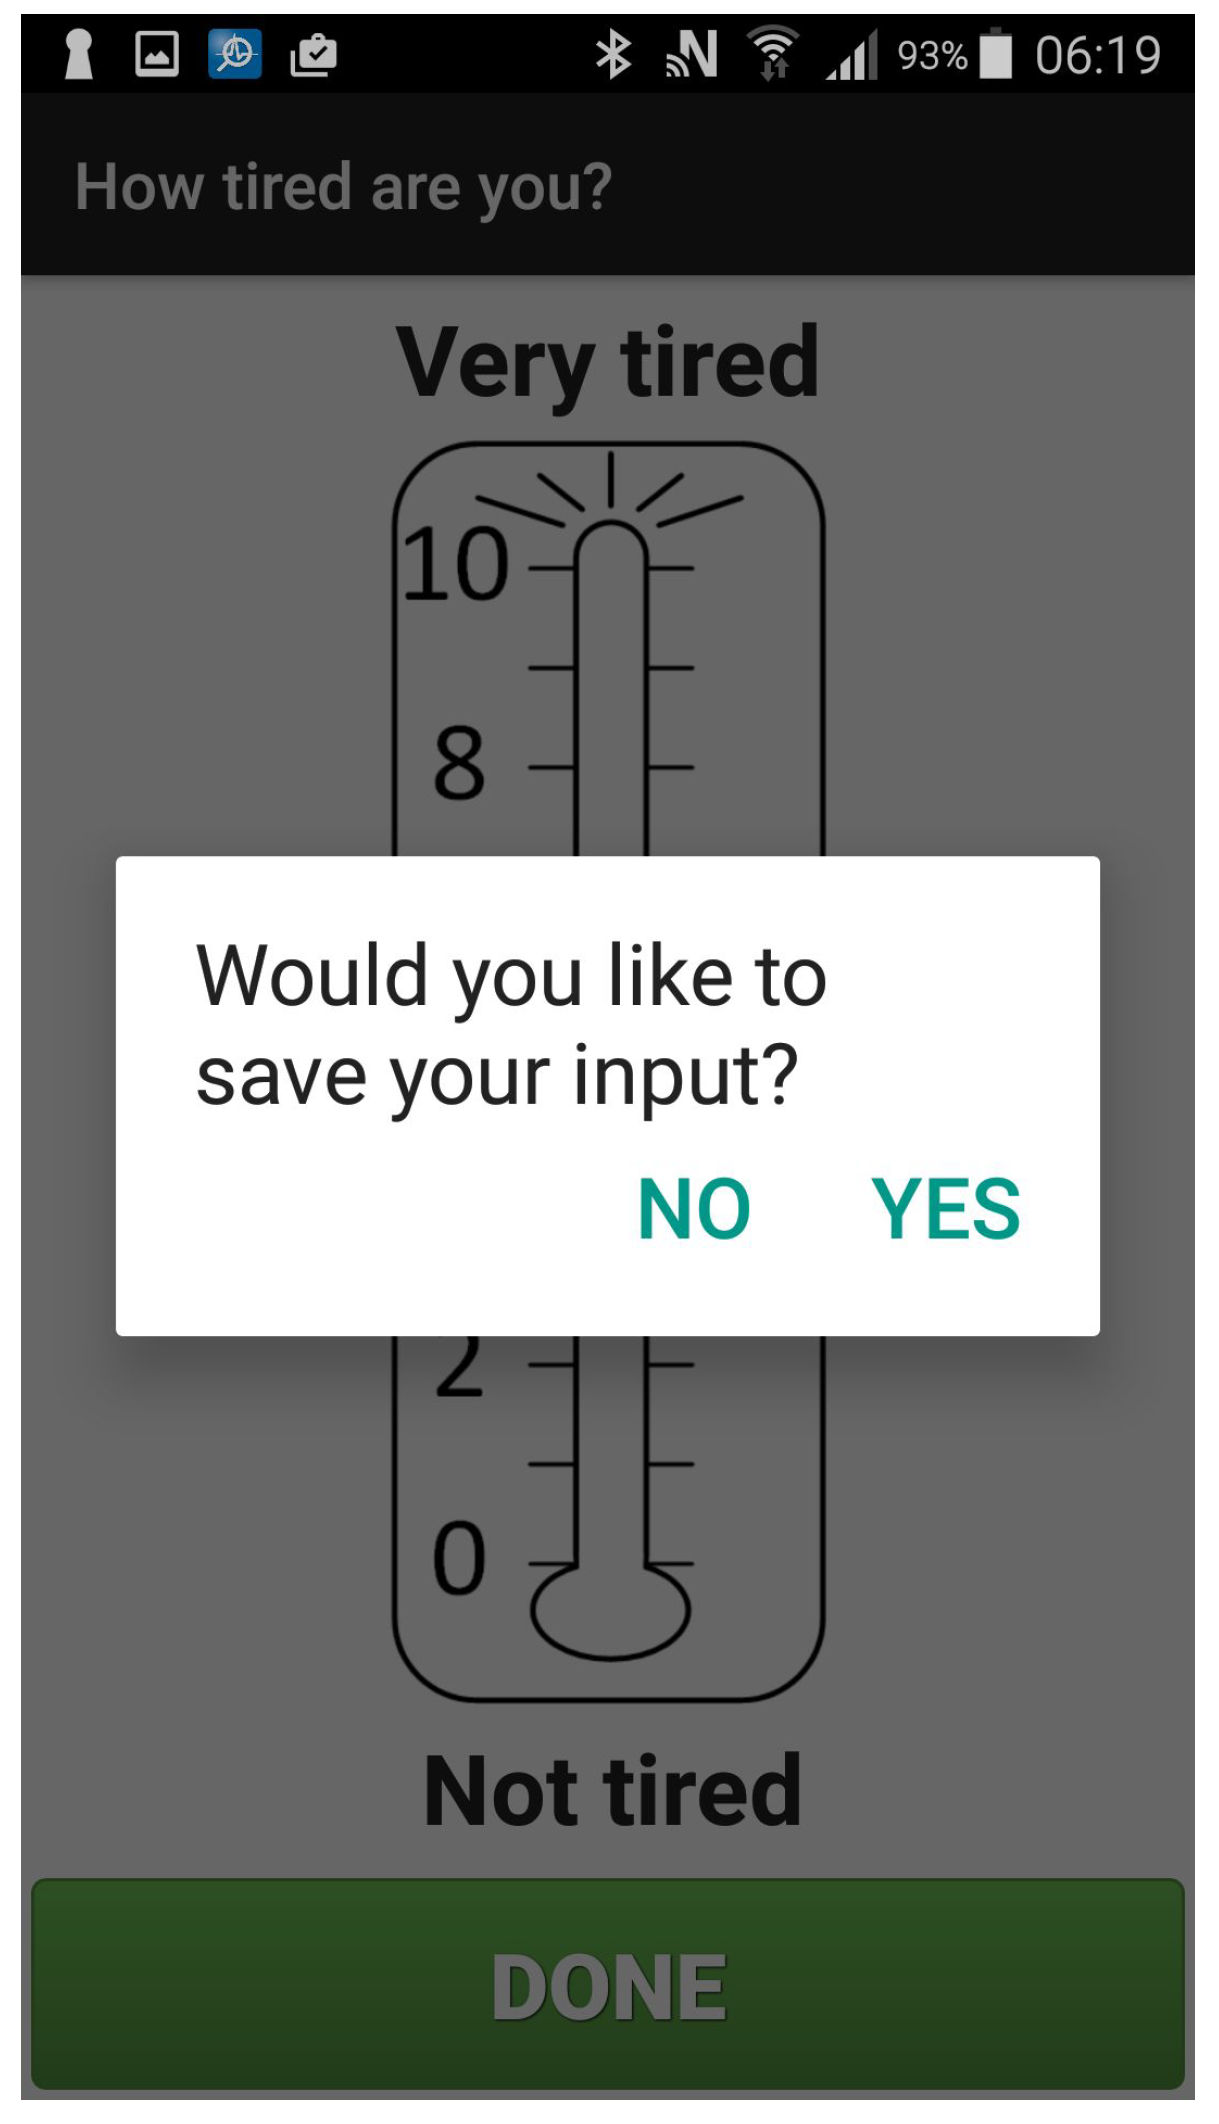
Each input has to be saved explicitly via a confirmation dialogue as shown in Figure 3.
2.2. Data Transmission
Once per day, the activity monitoring app performs a task to upload the data using a wireless connection. To ensure a reliable network connection, only WiFi networks are used and the upload is performed preferably during night. Households without WiFi access are equipped with a mobile hot-spot that is installed and tested during a visit at the patient’s home. In terms of robustness and the Swiss mobile contract landscape, transferring data via WiFi networks is the optimal solution.
As the collected patient data are sensitive in terms of privacy and aimed studies need ethical approval, the transmission of the collected data is secured via Secure Sockets Layer (SSL). In order to avoid traffic peaks at the web-server, the upload time is randomised. Data collection and transmission were tested internally by members of our group.
Web-Server
The web-server is a implemented as a Tornado web server that listens for POST requests from the smartphone app and stores received files in an upload directory.
2.3. Study Protocol
The study protocol with all necessary documents including informed consent, forms and paper questionnaires for the patients, was approved by the local ethics committee (Kantonale Ethikkommissision Zürich) as an amendment to the study with the number KEK-ZH-Nr. 2012-0563.
2.3.1. Patient Recruitment
Participants had to fulfil the following inclusion criteria:
- Aged years,
- mild to severe fatigue, i.e., FACIT-F [28],
- willingness to use the provided smartphone,
- successful briefing how to use the smartphone and activity monitoring app,
- signed informed consent.
Excluded were patients with a relevant cognitive impairment or severe depression assessed by M.I.N.I., a validated measure to assess psychiatric clinical disorders.
Patients were recruited by phone calls during which they were:
- explained the study concept and goal
- asked to participate in the study
- tested for eligibility, i.e., tested for fatigue FACIT-F and depression (M.I.N.I.)
2.3.2. Baseline
Interested patients were either visited at home or met at the university hospital or another convenient place. They had to fill out and sign a general and informed consent. Participants were provided with a smartphone (Samsung Galaxy S5) with the activity monitoring app pre-installed and equipped with a prepaid SIM-card, the smartphone charger and a smartphone belt or pocket depending on their needs. After introducing them to the app and, if necessary, to the smartphone, they had to show that they were able to handle the device. If they had no WiFi at home, they received a WiFi hotspot as well.
2.3.3. The Study Period
Naturally, the participants had the possibility to contact the study team at any time point.
At the third day after start, any upcoming questions concerning the devices or the study were clarified during a home visit or phone call.
At four times per day (random in fixed time windows), the participants were notified via the smartphone vibration alarm to answer the digital questionnaires. The frequency of four times per day was chosen as trade-off between a comprehensive dataset using experience based sampling [29] and a reasonable burden put on the group of fatigued patients that already have a reduced energy level insufficient to perform the activities of daily life (ADL) [30].
The participants were asked to wear the smartphone the whole day long and charge it over night.
Weekly interviews comprised the FACIT-F questionnaire and the usage of the smartphone.
2.3.4. The Study End
At the end of the follow-up interval, patients filled out again the FACIT-F and were interviewed about their experiences during the study and using the smartphone and app in a personal meeting using the technique of a guided conversation [31].
2.4. Data Analysis
The data were analysed in order to investigate the following research questions:
- Is activity monitoring by the use of smartphones feasible in these patients that are often not capable to achieve their daily tasks?
- Can we generate patient-specific activity data with the goal to support research and interventions for CRF?
2.4.1. Feasibility, Retention and Wearability
In addition to patients’ feedback collected during the final interviews, we evaluated the retention of the patients with respect to smartphone and app usage by the following metrics:
- completeness of answering the digital self-reports,
- logging time of the smartphone,
- wearability index WI, denoting the percentage of time per day during which the phone was on-body.
We excluded the first and the last day of study participation from data analysis, since those days were incomplete per definition: at those days, the patients received or returned the smartphones, respectively.
We defined the daily WI as the ratio between on-body samples and total samples
A recorded test data set provided WI values for comparison. The phone was worn always except for charging, sleeping, personal hygiene like taking a shower, etc. This yielded a value of over a day of 24 h. Since the smartphone shall not be switched off over night and assuming 7 to 8 h of sleep during night, a WI of about is close to the maximum possible for an average person.
2.4.2. Smartphone On-/Off-Body Detection
To estimate the wearability index, we annotated the collected acceleration data with the labels on-body and off-body. To distinguish between on-body and off-body based on the acceleration data, we trained a classifier, based on the three-axis acceleration signals of the smartphone acceleration sensor.
A recorded and labelled test data set consisting of four days was used to train and test the classifier yielding in a F1 score of F1 = 0.81 for the class “off-body”.
The smartphone accelerometer delivers a signal with noise and varying sampling rate. Therefore, we pre-processed and re-sampled the raw signals. We applied a sliding window (for parameters ref. Table 2 on the Euclidean norm of the three acceleration signals () to extract features that were used as input for the classifier. Using the Euclidean norm instead of the three individual axes allowed for train a classifier independently from the smartphone position. We trained a support vector machine (SVM) with radial basis function (RBF) kernel. The optimal parameters C and gamma were determined by grid search and are given in Table 2.
We processed the acceleration data per patient and day.
2.4.3. Descriptive Statistics and Exploratory Data Analysis
We report patients demographics and provide descriptive statistics on self-reports, weekly fatigue assessments (FACIT-F) and activity measures. As an example, we visualise sedentary behaviour of a patient using a heat map of the energy of the Euclidean norm (ref. Table 3) of the acceleration signal over one minute windows.
For a patient-specific correlation analysis of VAS values with sensor data, we extracted the data lying in the one hour time window preceding the VAS time stamp. On each time window, we extracted features root mean square and variance on the Euclidean norm of the three-axis and summarised the two features as indicated in Table 3 using the statistical measures variance, sum, mean, 10 quantile and 90 quantile, maximum and minimum value. Since the energy (sum of RMS) of a signal depends on the amount of on-body samples per time window, we considered also the energy normalised by the wear-index.
According to [32], we consider correlations with a Pearson’s correlation coefficient as medium and values as strong.
3. Results
This section presents the results in three subsections. First, we give an overview over the recruited patients. Second, we present the patients’ retention. Third, we present the results of the analysis of the collected data.
3.1. Patients’ Demographics
We included seven patients (6 female (f), 1 male (m), median age = 52 years (32–73)). The patients participated for two, respectively, three weeks. One female patient dropped out early due to health reasons. We excluded the patient from our data analysis. Details on the patients are given in Table 4.
3.2. Feasibility and Retention
In total, we collected data on 124 days that yielded 2772 h of data and 523 answered questionnaires.
The final interviews covered the patients’ experiences with the smartphone app and the smartphone itself. All patients stated that they could use intuitively the smartphone as well as the app. Some patients missed activities to select, e.g., “work”. A possible solution for a future study would be to allow a configuration of the selection of activities specific to the patients needs during the initial meeting with the patient.
Except patient 219, all study participants were already smartphone users (Android smartphones and iPhones). Naturally, some of them found it cumbersome to take care of a second phone. In the future, this could be solved by also providing an activity app for iPhones and then installing the activity monitoring app on the patients’ smartphone (Android or iPhone) instead of providing an additional smartphone.
Table 5 shows that, on average, patients were handling the smartphone as advised: they kept the smartphone switched on for most of the time (>22 h per day) and most of the patients answered the questionnaires on average four times per day as requested. Patient 232 answered the questionnaire also on her own initiative (which we allowed), in average 6.6 times per day.
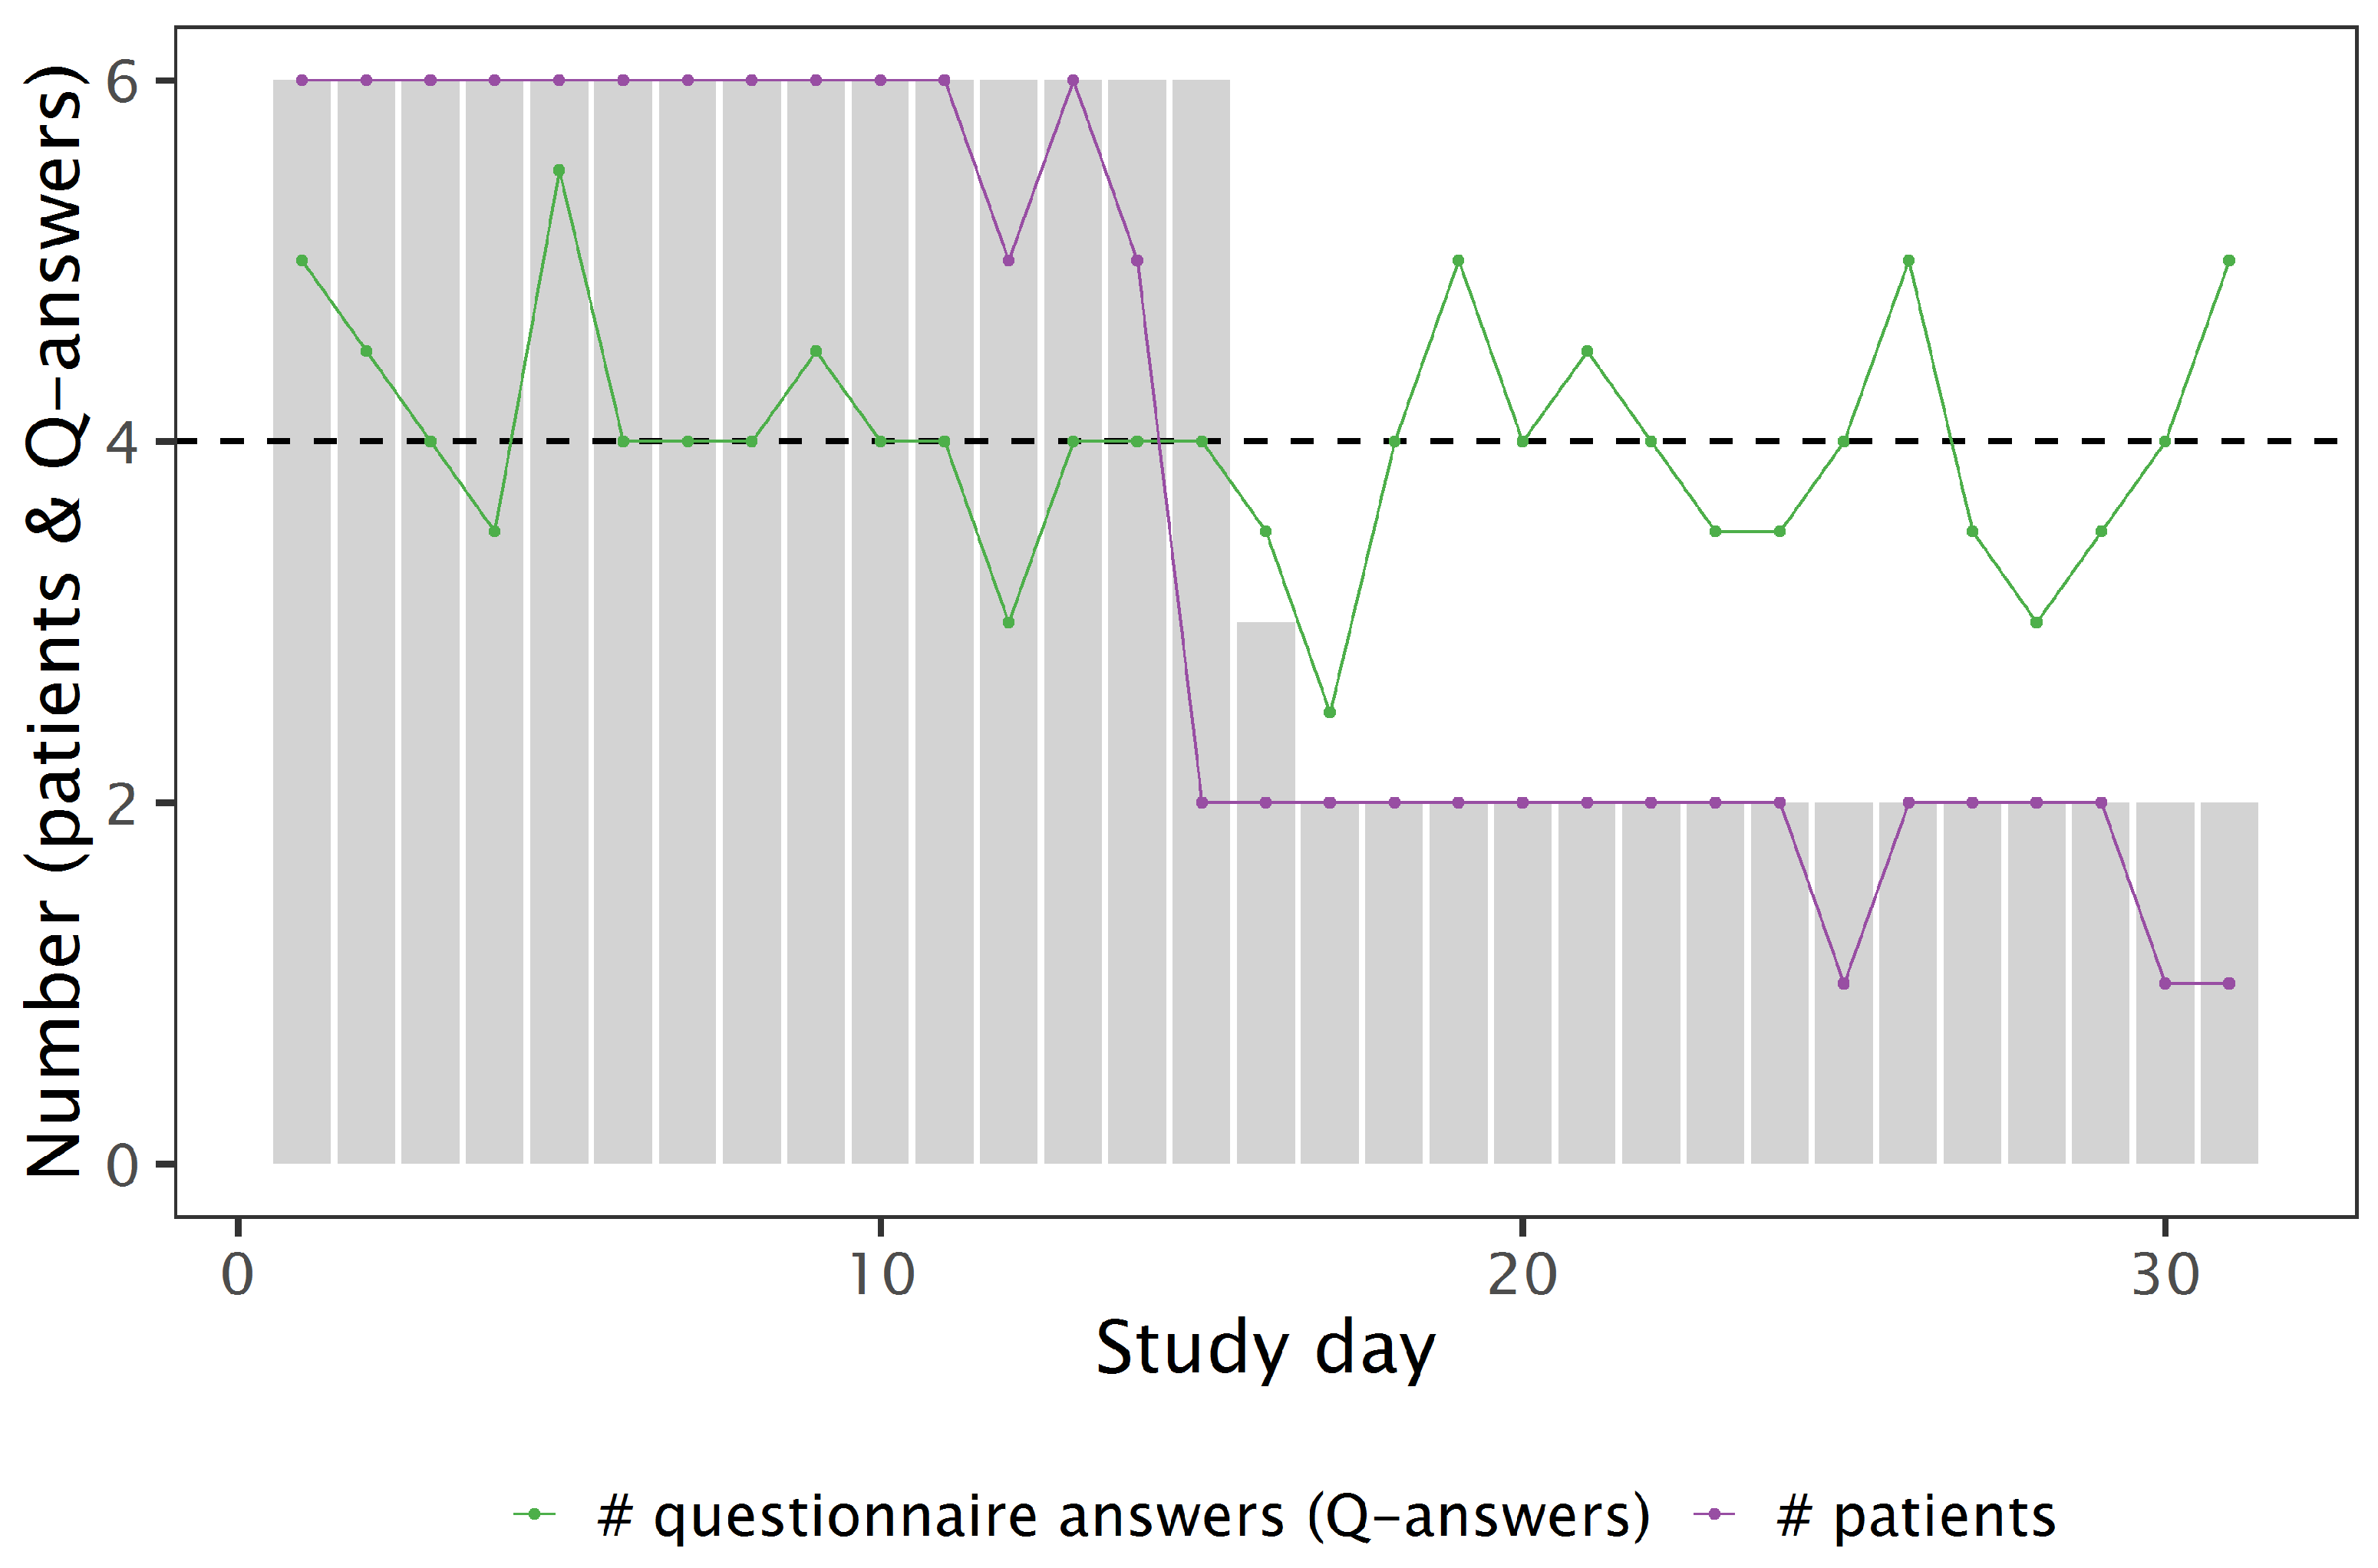
Figure 4 shows that the answering rate remained constantly high during the whole study period: Except for three days, all patients filled out the questionnaires at least once per day. At nine days, the median number of answered questionnaires dropped below four answers; for the 22 other days, the answering rate lies at or above the requested four answers.
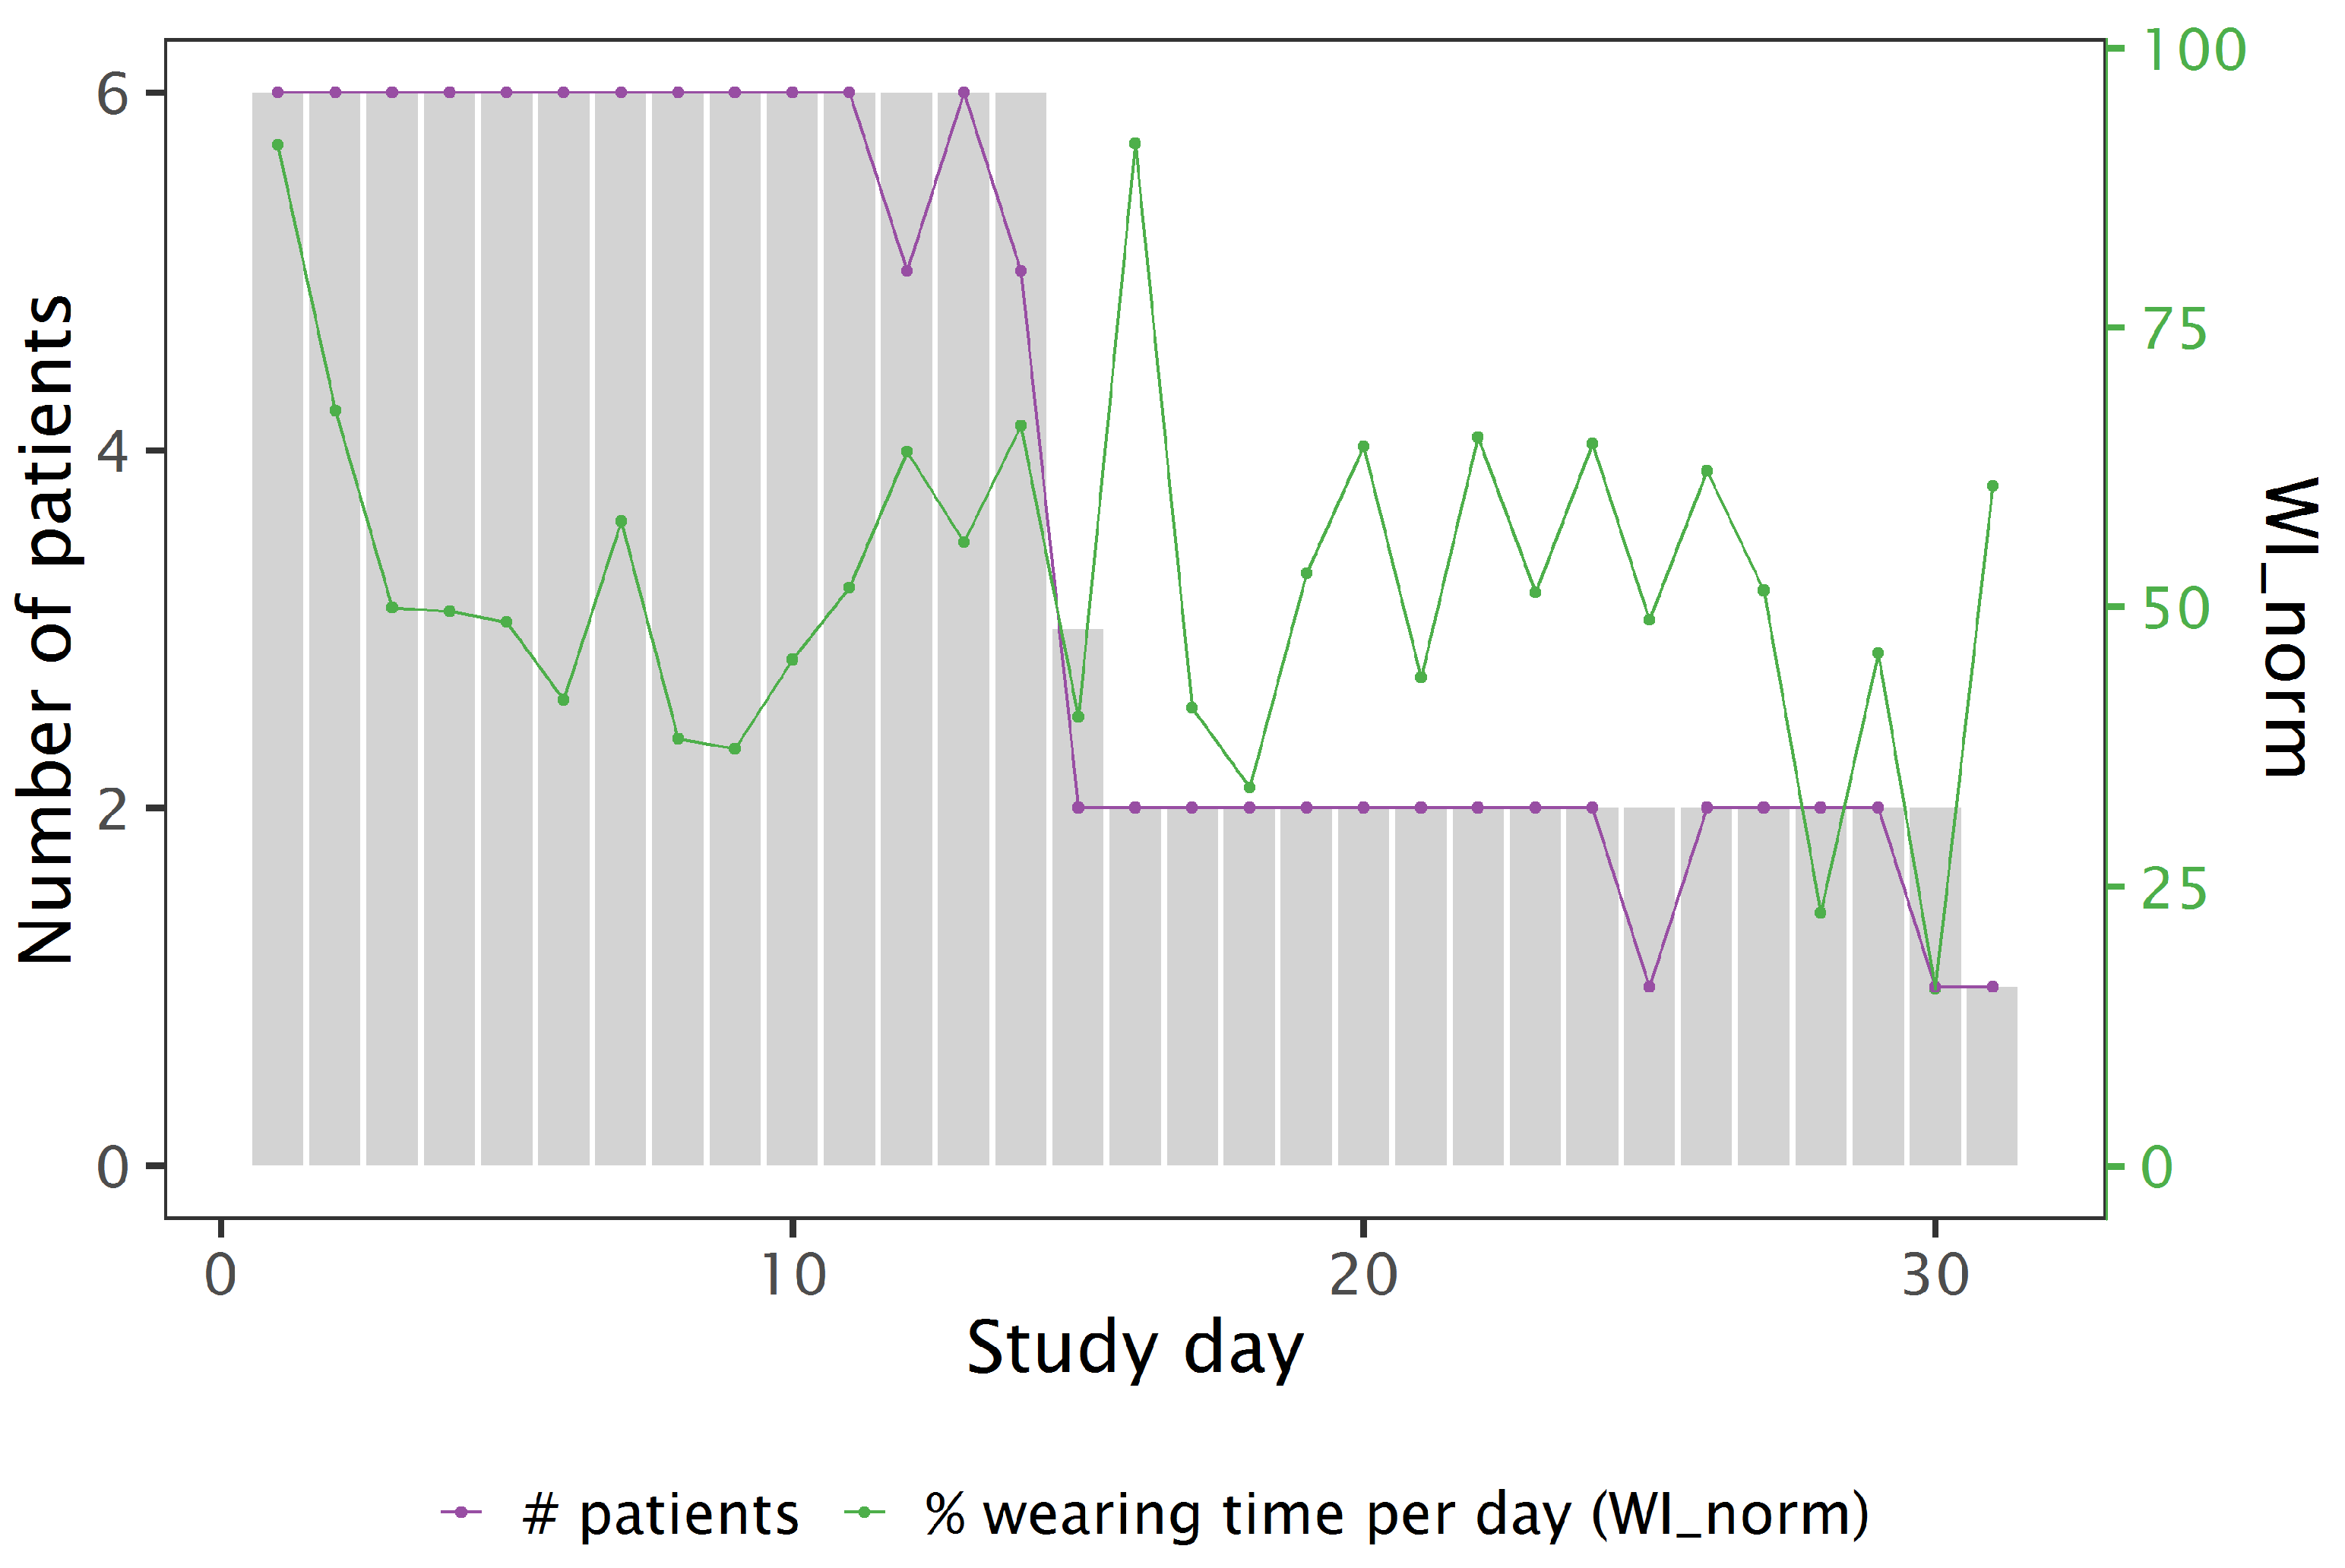
Table 5 shows that, for all patients, it was more difficult to wear the smartphone all day long than to fill out the questionnaires. WI specifies the WI when assuming an awake-time of 16 h instead of calculating the WI w.r.t. a 24 h day. Despite repeating “to wear it at the body also at home” during the briefing, patient 64 did not follow the instructions. The low WI of patients 103 and 111 is explained by their statement that they were lying down large parts of the day. We expect better WI when participants use their own smartphone. However, statements of the patients also indicate that the WI itself is an indicator for physical activity: off-body periods denote home time and, depending on the patient, sedentary time. Figure 5 illustrates that the average WI is stable over the whole study period.
3.3. Analysis of FACIT-F Questionnaire Answers
Figure 6 illustrates that four out of six patients had higher FACIT-F values at the end of the studym i.e., a lower level of fatigue.
3.4. Analysis of Digital Questionnaires: Fatigue and Interference
3.4.1. Distribution of VAS Values
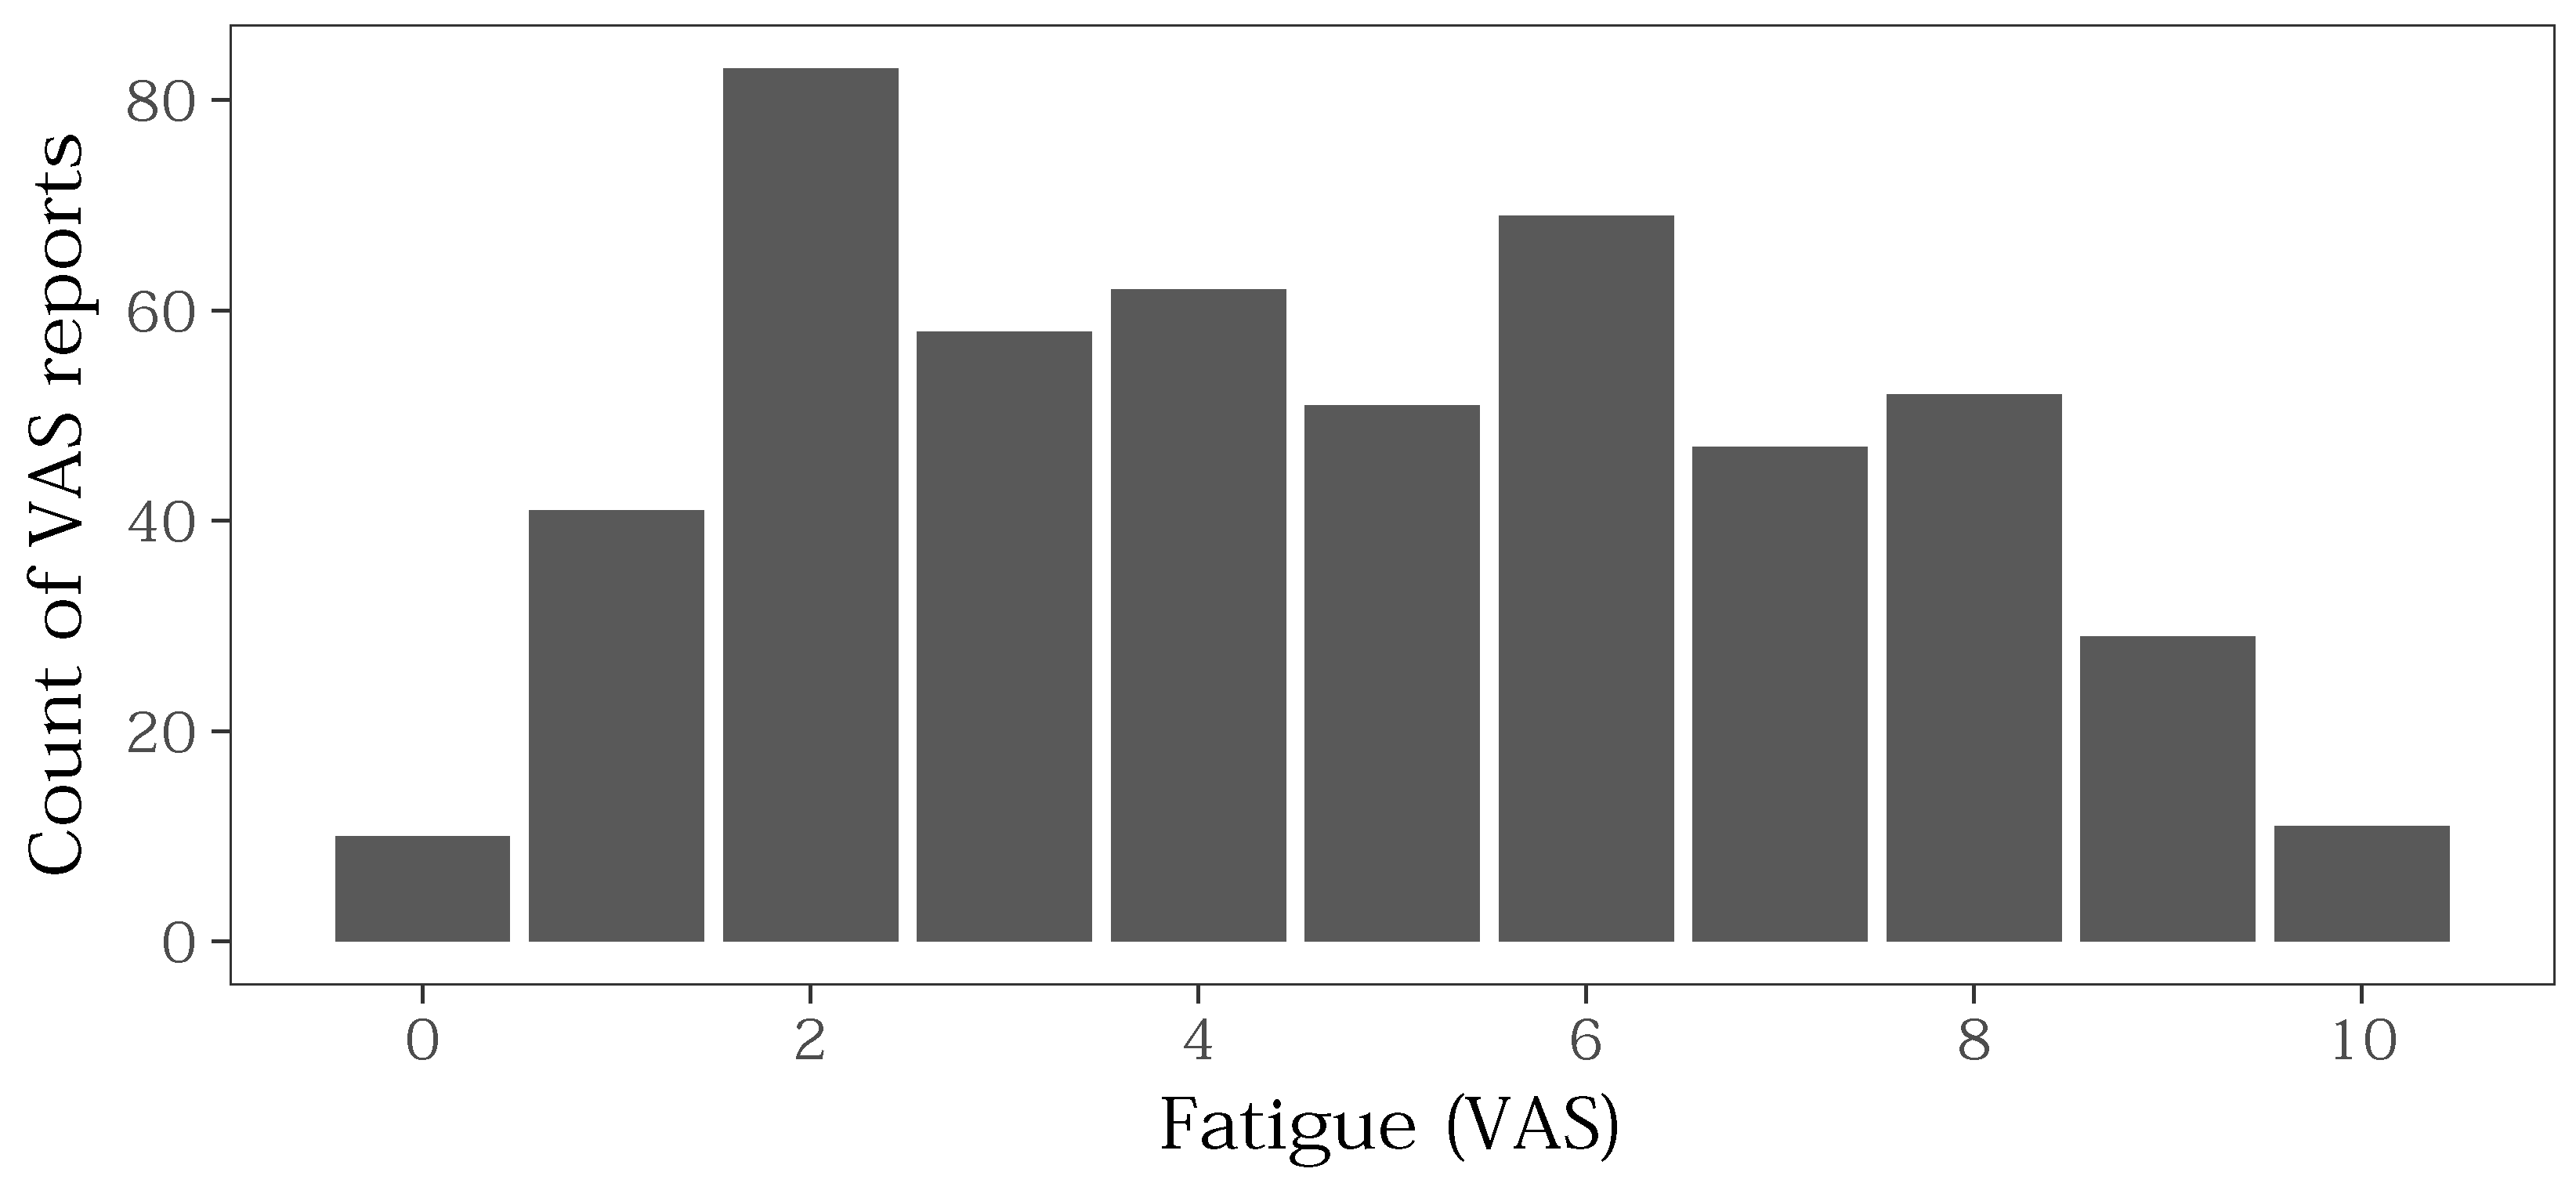
Figure 7 shows the histogram of the reported fatigue VAS. Peaks are visible for the even numbers (2, 4, 6, 8): in each case, the adjacent odd numbers were selected less often compared to the even number. The VAS scales were labelled only with even numbers as shown in Figure 2a). Omitting the odd numbers possibly created a bias towards even numbers.
3.4.2. Relation between Fatigue and Interference of Fatigue
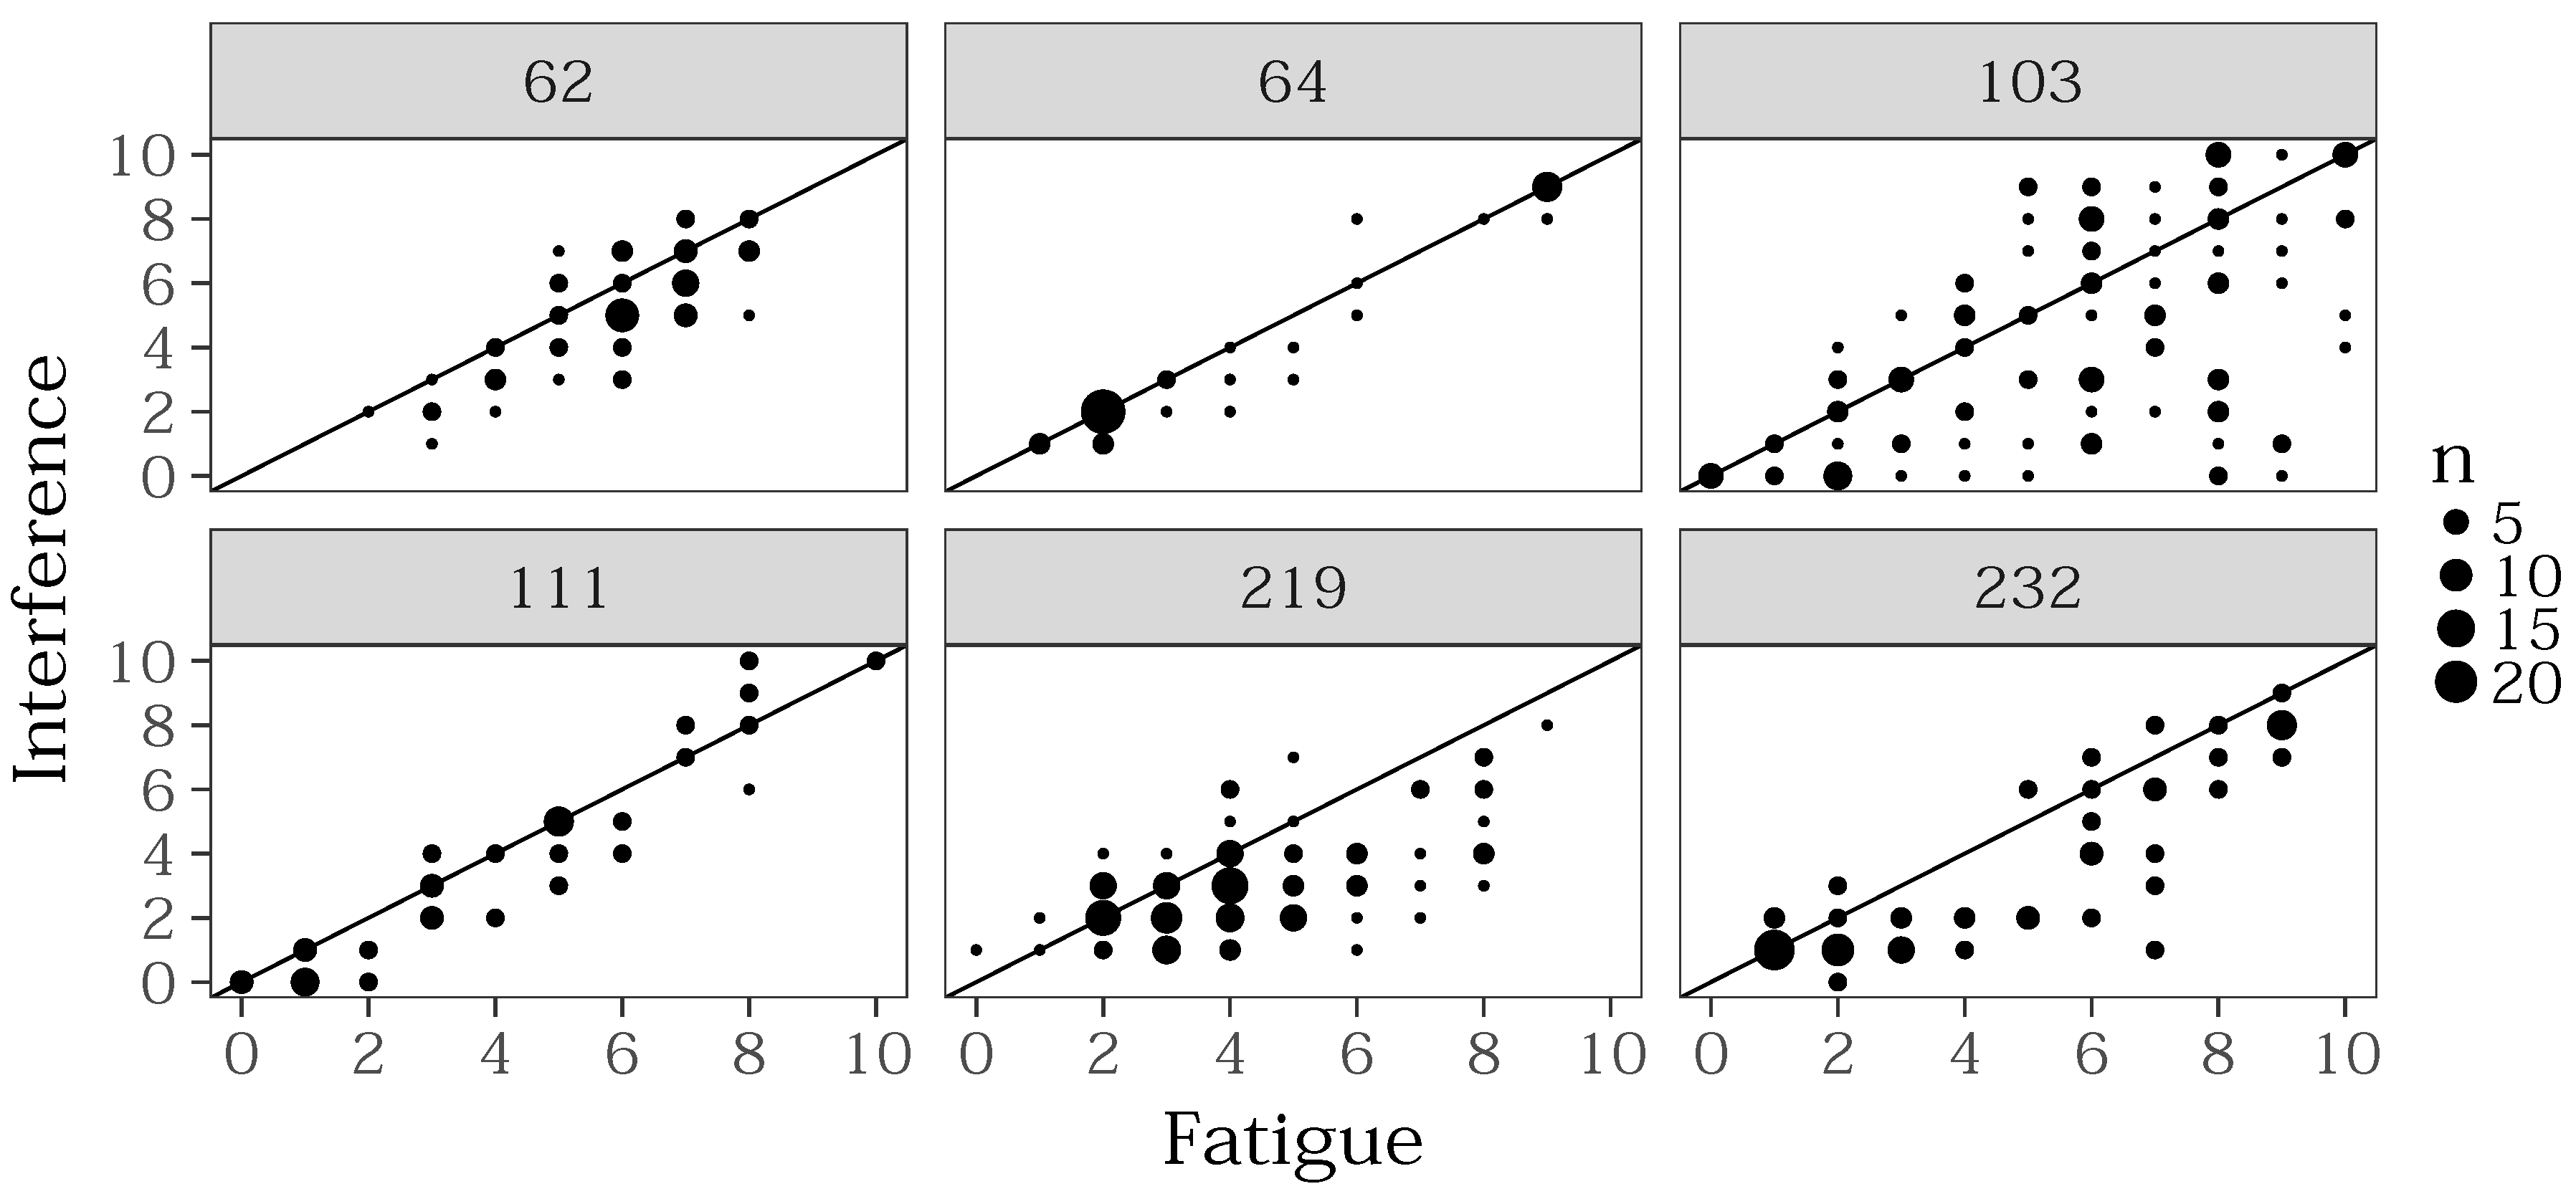
The two VAS scales for fatigue and interference were positively correlated (r = 0.77, n = 523, p < 0.0001). Figure 8 shows the reported fatigue with the corresponding reported interference per patient. For each reported pair, the dot size indicates the number of occurrences of this pair in the dataset. Only for values 1 and 2, there is an accumulation of same answers. For the other values, the diagonal is not overrepresented except for patient 64 who had either low fatigue and interference (2) or high fatigue and interference (9) and only a few values in between. Hence, Figure 8 supports the explanation no. 1, i.e., the more expressed the fatigue was, with the greater impact, it affected the daily activities.
Table 6 rises the question if all patients really distinguished between the two symptoms they were asked for: patients 64 and 111 show nearly a correlation of 1.
From the observed relationship between perceived fatigue and interference, we propose the following hypothesis that can be investigated in a future study:
- The higher the fatigue, the more impact on daily activities. If one is less tired, it is probably easier to ignore the lack of energy during activities of daily life. However, literature gives no clear conclusions to confirm this hypothesis. Franke et al. have observed a similar behaviour in fatigued patients suffering from Hepatitis C [33]. They found out that interference is a significant predictor for depression. On the other hand, depressed patients were more likely to report a severe fatigue.
- The patients could not well distinguish between the two questionnaires. To investigate this hypothesis, a future study can collect data from the digital questionnaires and correlate them with validated instruments such as the Brief Fatigue Inventory that measures intensity and interference of fatigue at the same time. Considering the result of [33], also depression should be controlled.
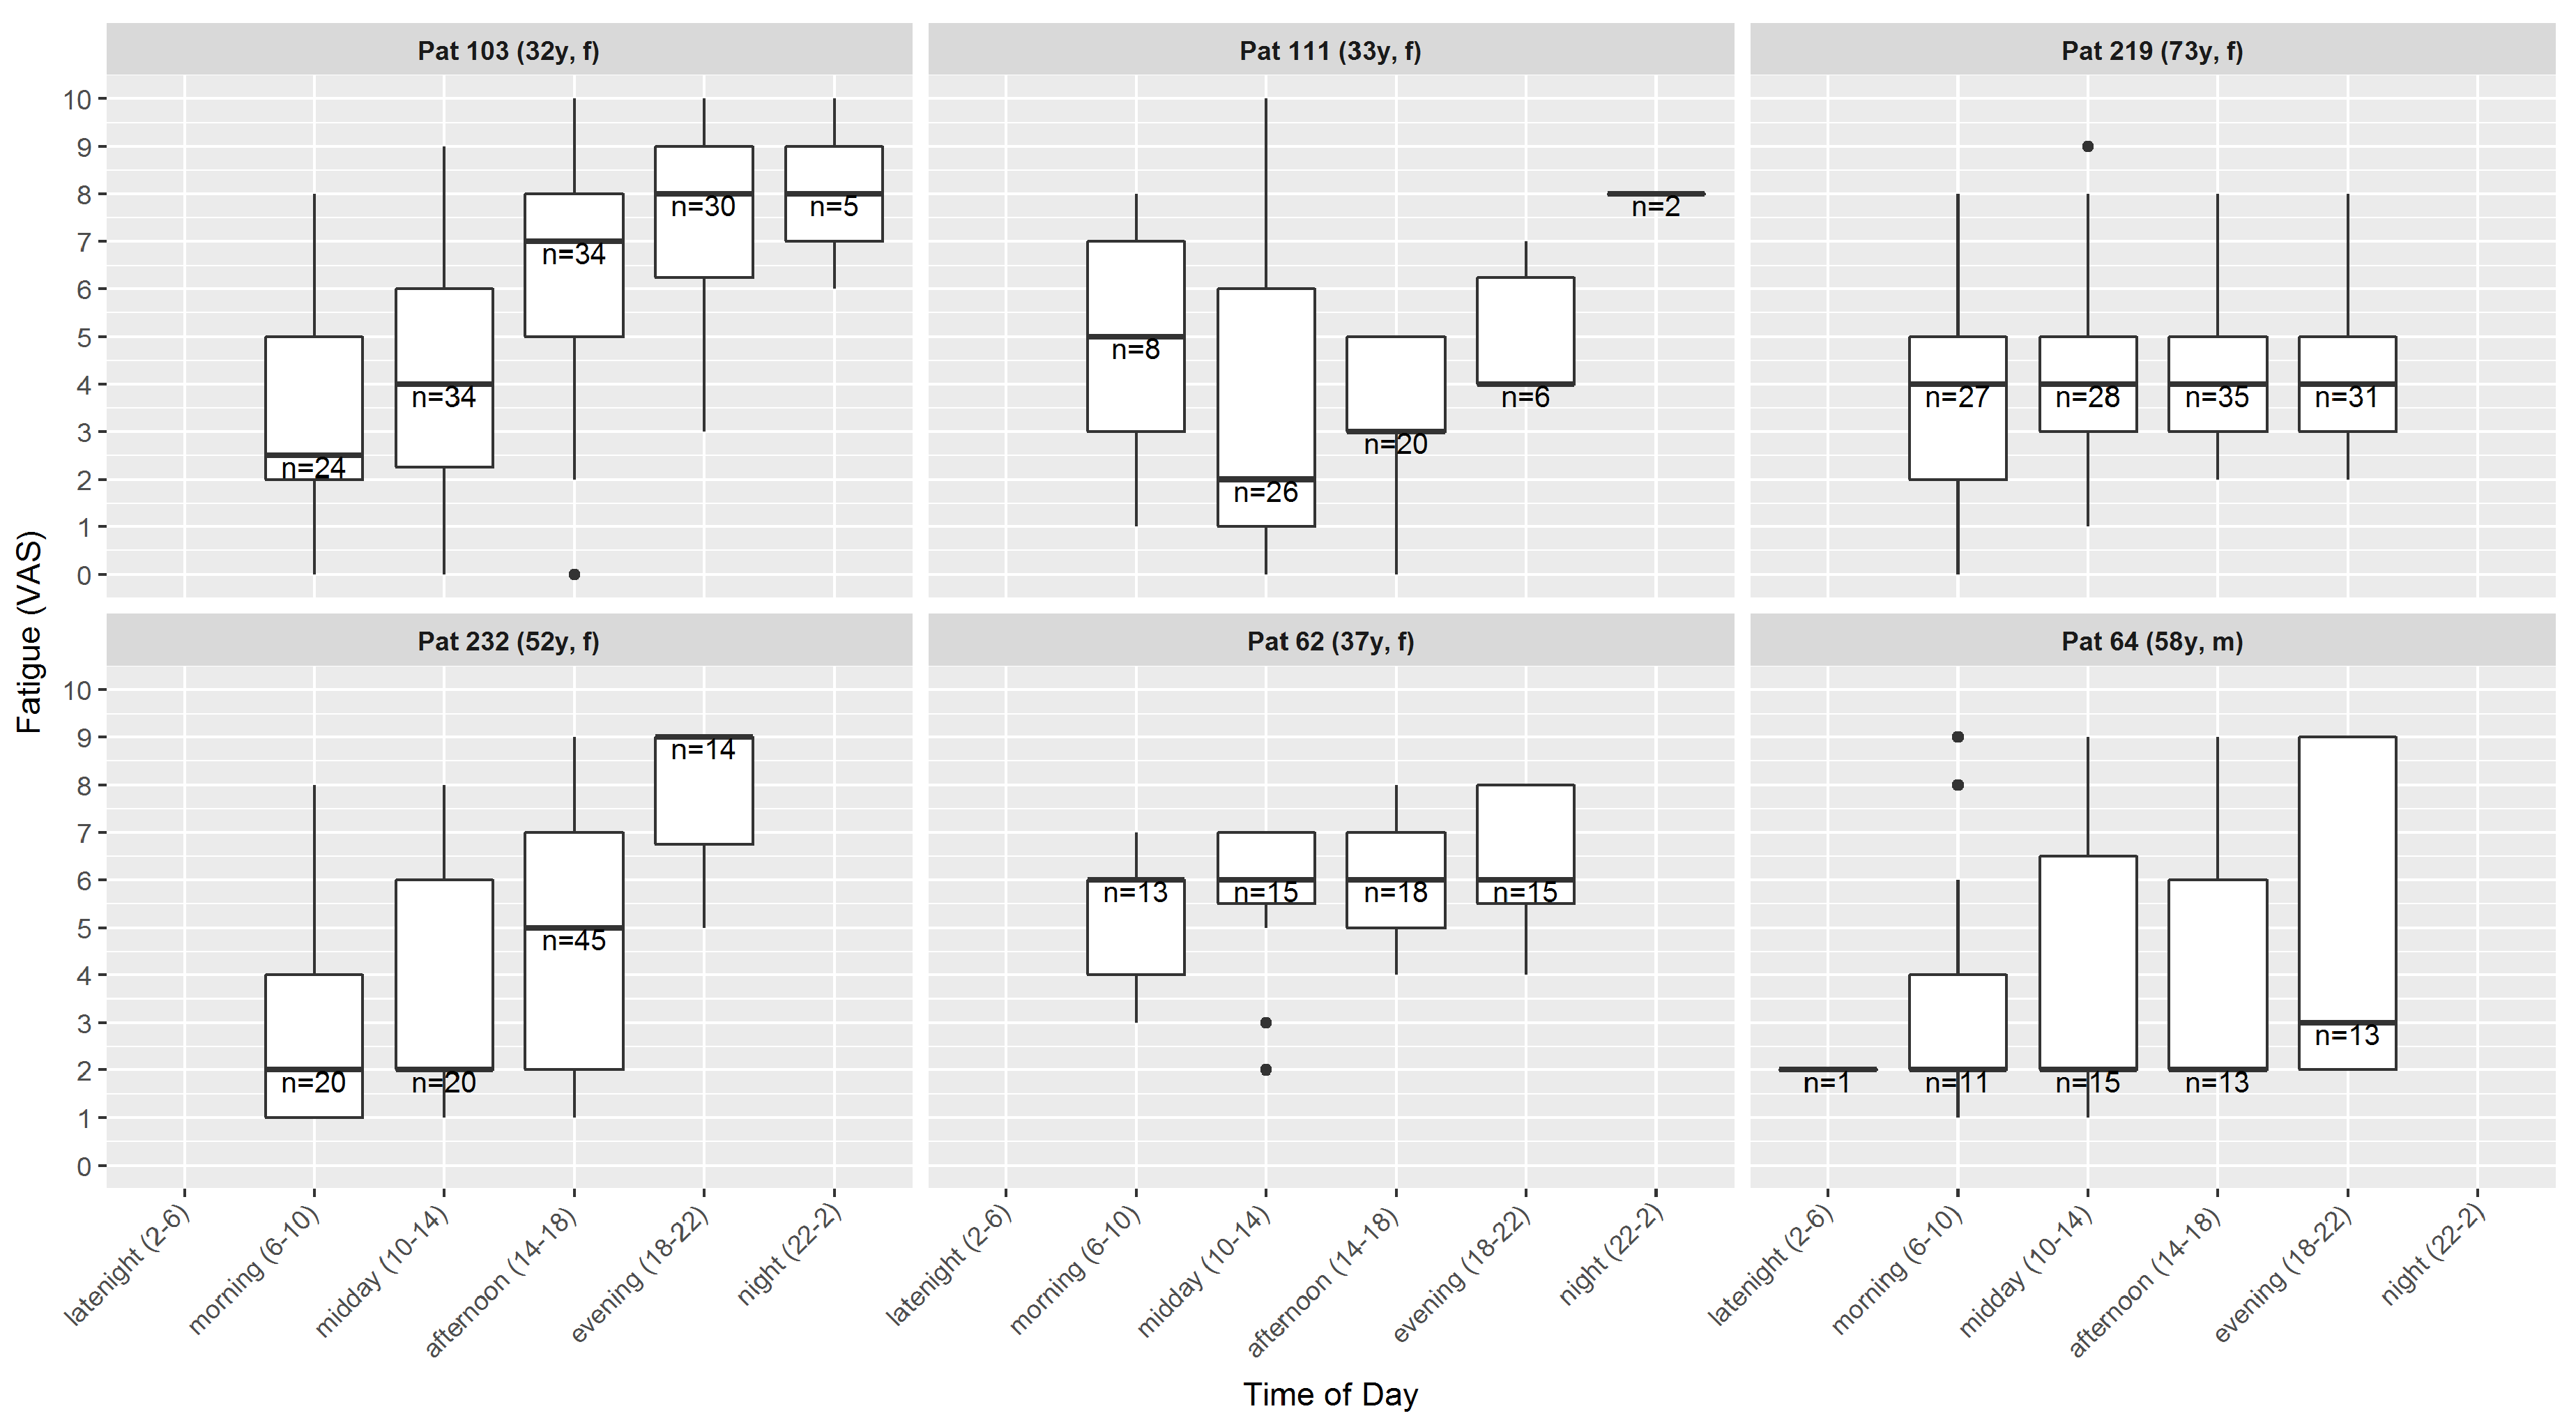
3.4.3. Intra-Day Course of Fatigue
We used ESM for collecting the digital self-reports. The ESM unveiled that the fatigue is not constant over the day. We grouped the self-reports’ values according to their timestamp in order to identify patterns in the daily course. We adapted the habits of the German-speaking cultural area to divide a day into time frames and defined six time windows of equal length:
- late night
- 2–6 o’clock,
- morning
- 6–10 o’clock,
- midday
- 10–14 o’clock,
- afternoon
- 14–18 o’clock,
- evening
- 18–22 o’clock,
- night
- 22–2 o’clock.
Naturally, there are only a few values available for night (seven reports over all patients) and late night (one report). Figure 9 shows that the perceived fatigue varies during the day. In the cohort of this study, there are different patterns present: in two patients, the fatigue increases during the day, one patient has a decrease towards midday and followed by an increase towards the evening that is close to the morning value, and three patients have a constant median all over the day, but with varying inter-quartile range (IQR).
3.5. Analysis of Activity Data
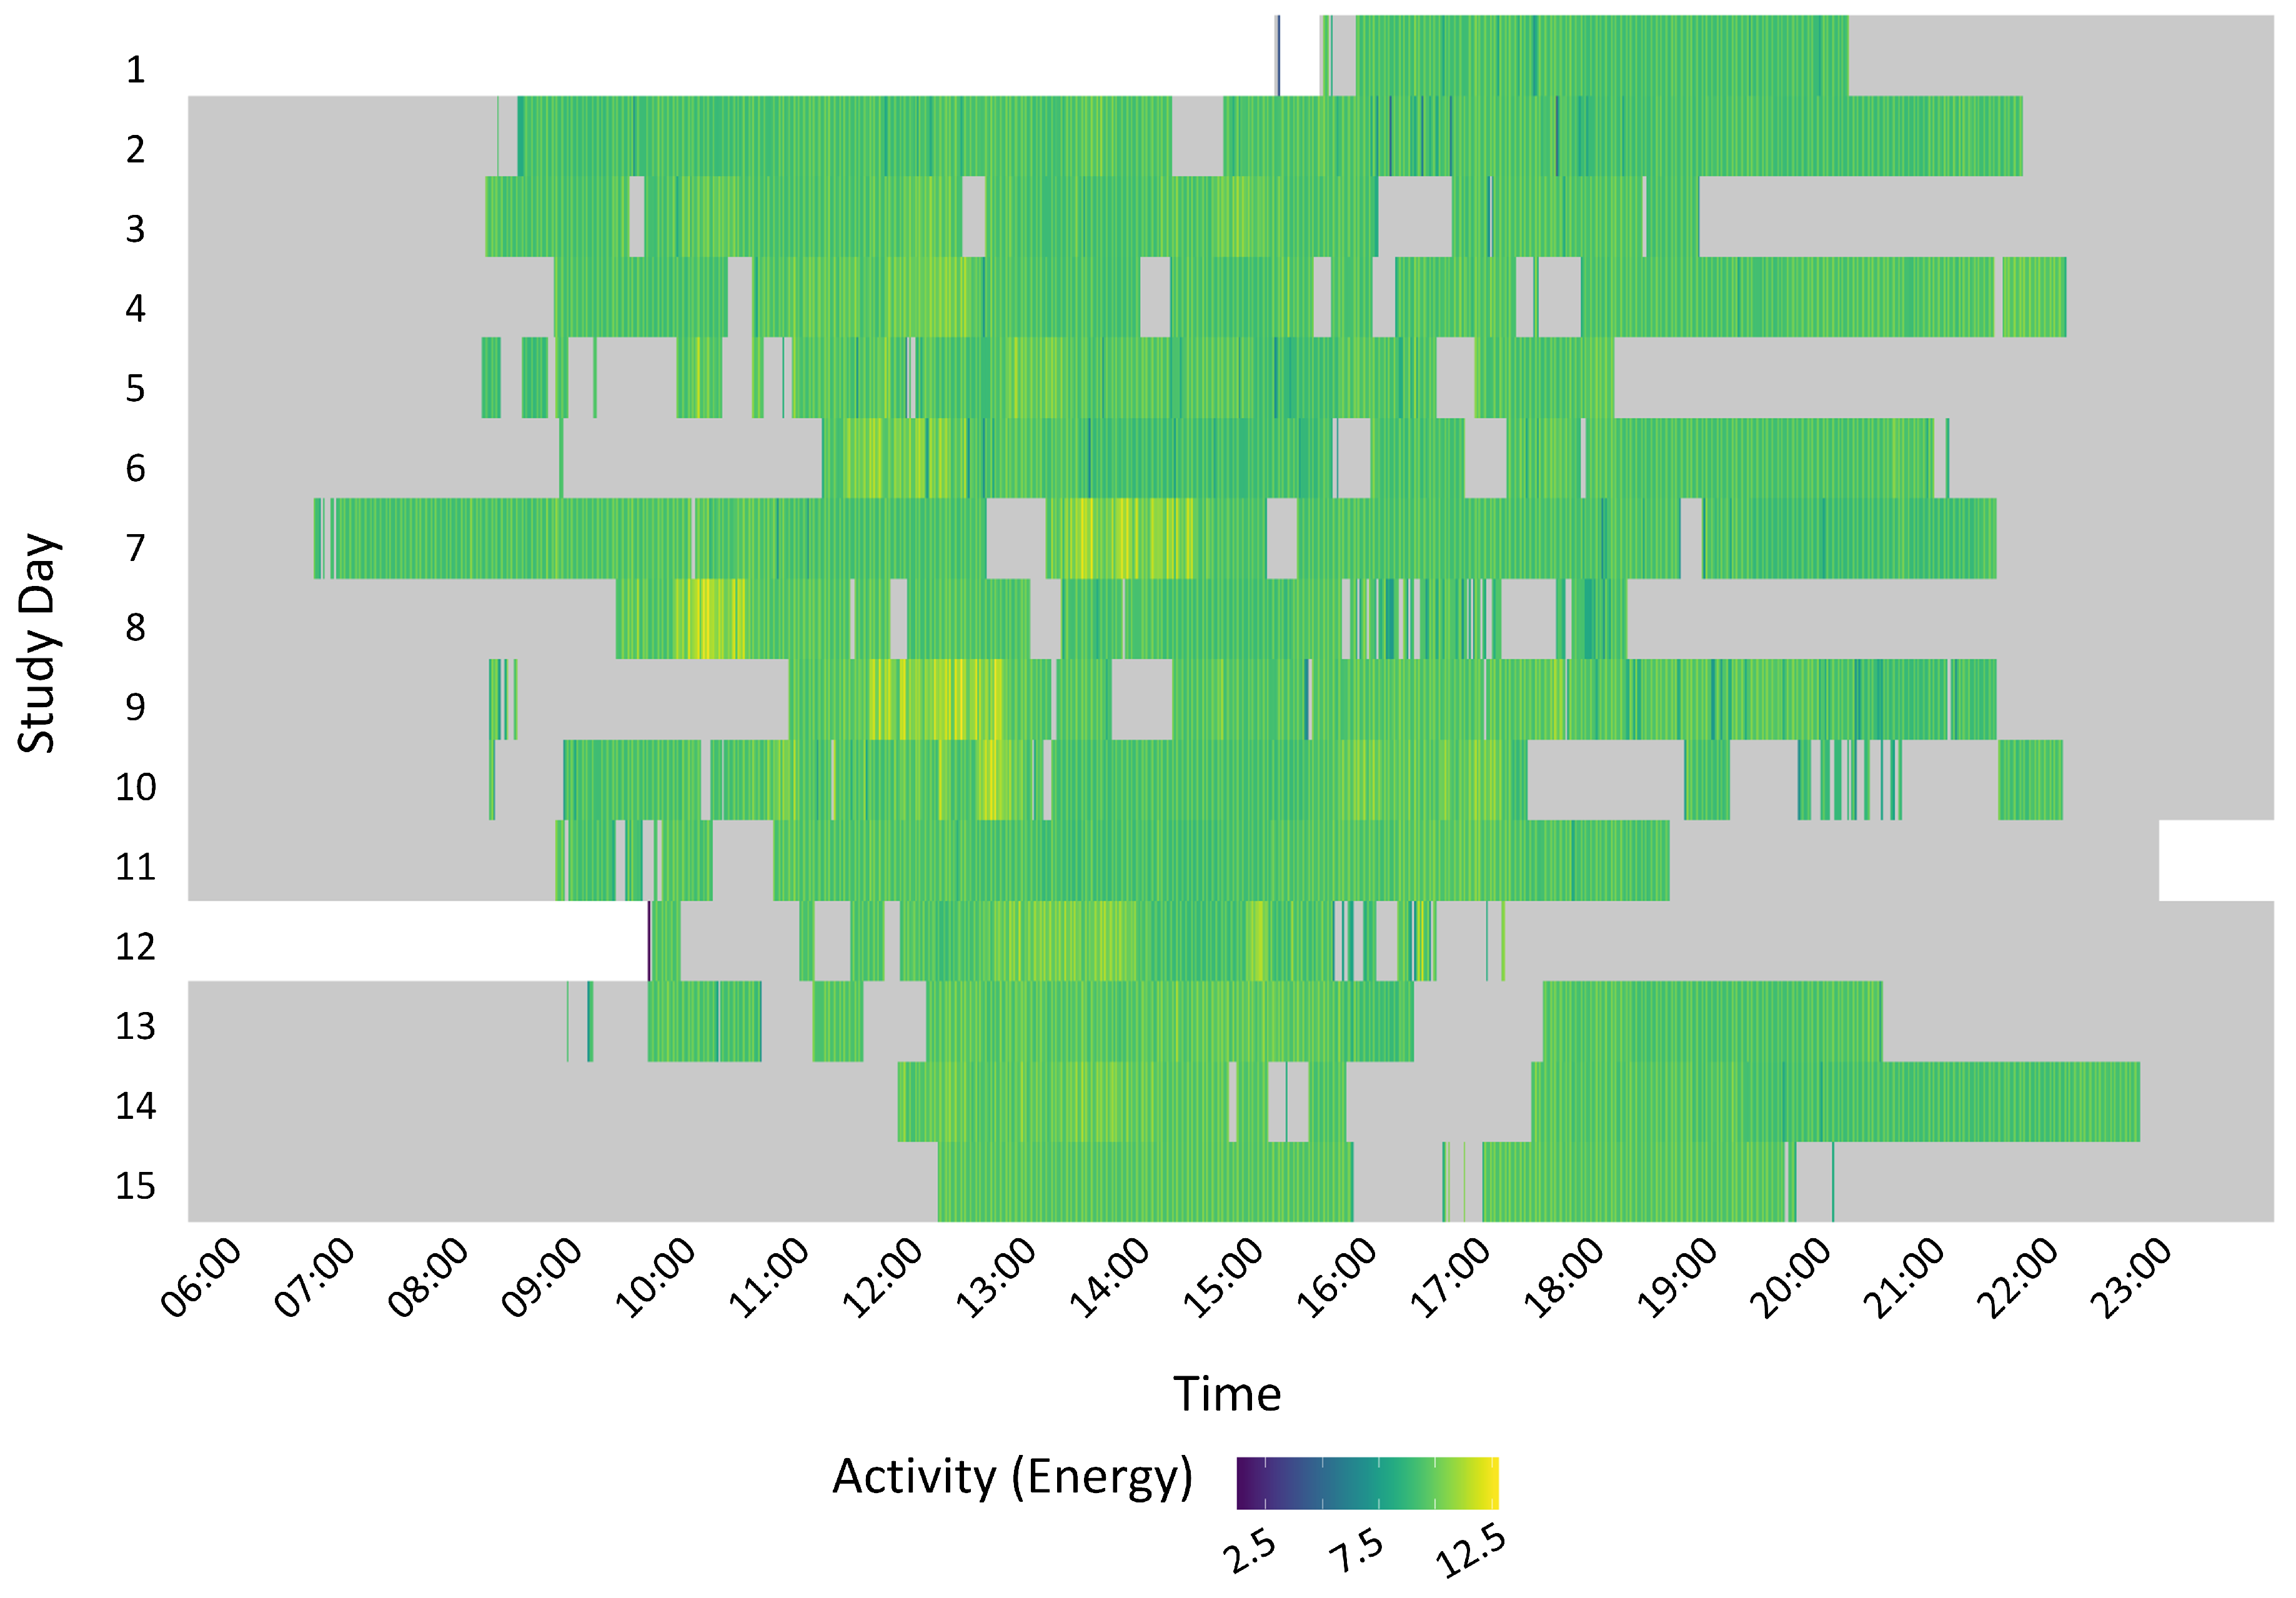
3.5.1. Visualisation of Sedentary Behaviour
Figure 10 shows an example of the activity of one patient over her study period. A row represents the activity of one day. The colour indicates the level of activity intensity: the lighter, the higher. The activity is calculated as the energy of the signal over one-minute window and calculated as the sum of the RMS () of the Euclidean norm of the acceleration signal recorded by the smartphone. Patterns such as beginning and ending a day, periods of higher activity or sedentary behaviour as well as wearing the phone are visualised and changes in the behaviour identified. In the example of Figure 10, almost each day, the patient takes the phone in the (late) morning and puts it aside in the evening at differing times. This patient’s activity has small variance in the first two days. Starting from day 3, there are some periods of higher activity denoted by the lighter colour and only very few periods of high activity denoted by yellow colour. As expected, most of off-body data are located at the beginning and end of the day and also include phases of resting.
3.5.2. Correlation Analysis
We examined the correlations between activity features which are listed in Table 3 and questionnaire values per patient. In total, we discovered 48 significant () correlations: 26 features were correlated to fatigue in six patients and 22 features were correlated to interference in five patients (no correlations in patient 232). Following an exploratory approach, we did not correct the significant values for multiple testing. Table 7 lists the results for medium and strong correlations.
All significant correlations occurred during the afternoon or evening and have a positive sign except for one patient.
Variance-based features ( as defined in Table 3) had medium to strong correlations with both VAS values (fatigue and interference). In two patients (62, 111), these correlations were positive and in one patient (232), this correlation was negative.
RMS-based features( as it was defined in Table 3) had medium to strong positive correlations for both VAS in two patients (62, 64). Since the features were calculated from a time window that lies before the questionnaire answer, the positive correlation possibly indicates that the patients felt more tired after a period of increased activity. The fact that the correlation with the interference ratings was similar could mean that, due to the increased activity, the patients perceived the fatigue as a bigger burden. However, we did not find literature examining these relationships on a level of detail that allows conclusions on our hypotheses.
The feature WEAR (based on the wearability index) has a medium positive correlation in one patient (64). Interestingly, this patient has a low average WI (ref. Table 5) because he stated that he did not wear the smartphone at home. Therefore, we evaluate this correlation as a result by chance.
To summarise, the patient-specific correlation analysis did not discover specific correlations that are consistent over the patient cohort. This is explainable by the fact that the participants differed in the degree of their fatigue as well as that they were living in diverse circumstances concerning, e.g., their family status (single, mother of children, etc.) or work status (e.g., working, retired, incapable of working). Nevertheless, consistently over the patient group, the correlations appeared during the afternoon and evening, leading to the assumption that relationship between activity and fatigue is less strong in the morning, after having rested during night.
The within-subject analysis unveiled a huge diversity in the patient group. This is reflected by the correlation analysis and analysis of the questionnaires as well as by visualising the activity level as illustrated in Figure 10.
4. Discussion
4.1. Summary of Results
This pilot study showed that adult patients suffering from a medium to severe CRF and not having a depression or cognitive impairment are an eligible patient group for activity monitoring with a smartphone. The patients achieved rates of around of completeness for questionnaire answering via the smartphone. However, wearing the phone on-body at home has been shown as being not convenient or meaning too much effort for some patients.
The ESM based assessment of perceived fatigue unveiled information about the course of fatigue: there is a variation of the perceived fatigue during the day. The participants of this study had three different patterns of intra-day fatigue trends. The VAS scales showed the same trends as weekly questionnaires.
We identified features extracted from the smartphone acceleration signal (VAR and RMS) that correlate significantly with the VAS values during the afternoon and evening. Nevertheless, the correlations are individual for each patient. This reflects the fact that self-reported, subjective ratings of symptoms (such as the VAS used in this study) are naturally very specific to the individuals.
Gresham et al. identified 467 clinical trials in cancer populations involving wearable monitors that measure physical activity (e.g., accelerometers, pedometers and multi-sensor systems) and analysed 46 of these studies and eight of these investigated cancer related fatigue. They stated that the median trial size was 75 patients (IQR 36, 150) [34]. We conclude that our investigation concerning the relationship between physical activity and perceived fatigue and interference of fatigue served to demonstrate feasibility and created new hypothesis that are not yet investigated in literature, although they would extend the knowledge in this field.
Gresham et al. conclude that these devices have a “relatively good prognosis” [34]. Our study is in accordance with previous findings and shows that smartphones can compete with other devices with respect to wearability. Furthermore, they provide the additional benefit of the possibility of experience based sampling that allows for tracking the perceived fatigue in a higher frequency than a paper-based questionnaire that is intended to be filled out weekly.
4.2. Advantages and Limits of Mobile Health
As an advantage, mobile health apps are cost effective and can provde access to medical care also in rural areas or in developing countries. Smartphones give the opportunity to reach regions that are not sufficiently covered with medical services [23,25].
In addition, our smartphone app is implemented in a modular way that allows for configuring the amount of sensor logging and the frequency and content of self-reports. Therefore, it can be adapted easily in order to monitor other patient groups, such as depressed patients or patients suffering from multiple sclerosis. Giunti et al. reviewed the availability of smartphone apps for multiple sclerosis patients and conclude that mobile health for this patient group has to be improved [35].
Furthermore, a continous monitoring can improve the treatment of patients, which is already common in heart failure patients [10].
However, the quality of remote monitoring with smartphones relies on the compliance of the participating patients. There is a risk of missing data and noise (e.g., when using GPS data while the phone is indoor). Furthermore, mobile health has to include the care givers [25].
4.3. Limitations
The patient pool to recruit from was limited for this study. Hence, the sample size with six evaluated patients is too small in order to draw general conclusions. The study period of 2–3 weeks does not replace a longer study period in order to evaluate retention over a longer time frame.
4.4. Future Work
In future, other sensor modalities such as visited places and social behaviour could be investigated as well to provide information about different aspects of the behavior CRF patients. The technology can be used in future studies to study the behaviour of CRF patients. Smartphones could also be used in intervention studies to measure activity related outcomes. The usage of smartphones has the potential to simplify the study design, since no other devices need to be involved. Furthermore, the app could be extended by an intervention, e.g., giving hints to improve sedentary habits.
Author Contributions
Software, Data Curation, Formal Analysis, Writing—Original Draft Preparation, V.K.; Supervision, G.T.; Writing—Review, G.T., H.W., and J.J.
Funding
This research received no external funding.
Conflicts of Interest
The authors declare no conflict of interest.
Abbreviations
The following abbreviations are used in this manuscript:
| CRF | cancer related fatigue |
| QoL | quality of life |
| app | smartphone application |
| VAS | visual analogue scale |
| SSL | secure sockets layer |
| FACIT-F | functional assessment of chronic illness therapy-fatigue |
| M.I.N.I. | mini international neuropsychiatric interview |
| ADL | activities of daily life |
| min | minute |
| SVM | support vector machine |
| RBF | radial basis function |
| IQR | inter quartile range |
| ESM | experienced-based sampling method |
References
- Stasi, R.; Abriani, L.; Beccaglia, P.; Terzoli, E.; Amadori, S. Cancer-Related Fatigue: Evolving Concepts in Evaluation and Treatment. Cancer 2003, 98, 1786–1801. [Google Scholar] [CrossRef] [PubMed]
- Bower, J.E. Cancer-related fatigue: Mechanisms, risk factors, and treatments. Nat. Rev. Clin. Oncol. 2014, 11, 597–609. [Google Scholar] [CrossRef] [PubMed]
- Curt, G.A. The Impact of Fatigue on Patients with Cancer: Overview of FATIGUE 1 and 2. Oncologist 2000, 5, 9–12. [Google Scholar] [CrossRef] [PubMed] [Green Version]
- Berger, A.M.; Gerber, L.H.; Mayer, D.K. Cancer-related fatigue: Implications for breast cancer survivors. Cancer 2012, 118, 2261–2269. [Google Scholar] [CrossRef] [PubMed]
- van der Lee, M.L.; Garssen, B. Mindfulness-based cognitive therapy reduces chronic cancer-related fatigue: A treatment study. Psychooncology 2012, 21, 264–272. [Google Scholar] [CrossRef] [PubMed]
- Sadja, J.; Mills, P.J. Effects of Yoga Interventions on Fatigue in Cancer Patients and Survivors: A Systematic Review of Randomized Controlled Trials. Explore 2013, 9, 232–243. [Google Scholar] [CrossRef] [PubMed] [Green Version]
- Minton, O.; Berger, A.; Barsevick, A.; Cramp, F.; Goedendorp, M.; Mitchell, S.A.; Stone, P.C. Cancer-related fatigue and its impact on functioning. Cancer 2013, 119, 2124–2130. [Google Scholar] [CrossRef] [PubMed]
- Prue, G.; Rankin, J.; Allen, J.; Gracey, J.; Cramp, F. Cancer-related fatigue: A critical appraisal. Eur. J. Cancer 2006, 42, 846–863. [Google Scholar] [CrossRef] [PubMed]
- Kelley, G.A.; Kelley, K.S. Exercise and cancer-related fatigue in adults: A systematic review of previous systematic reviews with meta-analyses. BMC Cancer 2017, 17, 1–17. [Google Scholar] [CrossRef] [PubMed]
- Bhimaraj, A. Remote monitoring of heart failure patients. Methodist Debakey Cardiovasc. J. 2013, 9, 26–31. [Google Scholar] [CrossRef] [PubMed]
- Urrea, B.; Misra, S.; Plante, T.B.; Kelli, H.M.; Misra, S.; Blaha, M.J.; Martin, S.S. Mobile Health Initiatives to Improve Outcomes in Primary Prevention of Cardiovascular Disease. Curr. Treat. Options Cardiovasc. Med. 2015, 17, 1–12. [Google Scholar] [CrossRef] [PubMed]
- Grunerbl, A.; Muaremi, A.; Osmani, V.; Bahle, G.; Ohler, S.; Troester, G.; Mayora, O.; Haring, C.; Lukowicz, P. Smart-Phone Based Recognition of States and State Changes in Bipolar Disorder Patients. IEEE J. Biomed. Health Informat. 2014, 19, 140–148. [Google Scholar] [CrossRef] [PubMed]
- Faurholt-Jepsen, M.; Vinberg, M.; Christensen, E.M.; Frost, M.; Bardram, J.; Kessing, L.V. Daily electronic self-monitoring of subjective and objective symptoms in bipolar disorder–the MONARCA trial protocol (MONitoring, treAtment and pRediCtion of bipolAr disorder episodes): A randomised controlled single-blind trial. BMJ Open 2013, 3, 1–10. [Google Scholar] [CrossRef] [PubMed]
- Mayora, O.; Arnrich, B.; Bardram, J.; Drager, C.; Finke, A.; Frost, M.; Giordano, S.; Grunerbl, A.; Raring, C.; Raux, R.; et al. Mobile Health Systems for Bipolar Disorder. Proc. MindCare 2013, 5, 424–429. [Google Scholar]
- Saeb, S.; Zhang, M.; Karr, C.J.; Schueller, S.M.; Corden, M.E.; Kording, K.P.; Mohr, D.C. Mobile Phone Sensor Correlates of Depressive Symptom Severity in Daily-Life Behavior: An Exploratory Study. J. Med. Internet Res. 2015, 17, e175. [Google Scholar] [CrossRef] [PubMed]
- Ben-Zeev, D.; Wang, R.; Abdullah, S.; Brian, R.; Scherer, E.A.; Mistler, L.A.; Hauser, M.; Kane, J.M.; Campbell, A.; Choudhury, T. Mobile Behavioral Sensing for Outpatients and Inpatients With Schizophrenia. Psychiatr. Serv. 2016, 67, 558–561. [Google Scholar] [CrossRef] [PubMed] [Green Version]
- Mazilu, S.; Blanke, U.; Calatroni, A.; Gazit, E.; Hausdorff, J.M.; Tröster, G. The role of wrist-mounted inertial sensors in detecting gait freeze episodes in Parkinson’s disease. Pervasive Mob. Comput. 2016. [Google Scholar] [CrossRef]
- Patel, S.; Park, H.; Bonato, P.; Chan, L.; Rodgers, M. A review of wearable sensors and systems with application in rehabilitation. J. Neuroeng. Rehabil. 2012, 9, 21. [Google Scholar] [CrossRef] [PubMed] [Green Version]
- Seiter, J.; Feese, S.; Arnrich, B.; Tröster, G.; Amft, O.; Macrea, L.; Maurer, K. Activity monitoring in daily life as an outcome measure for surgical pain relief intervention using smartphones. In Proceedings of the 2013 International Symposium on Wearable Computers, Zurich, Switzerland, 8–12 September 2013; p. 127. [Google Scholar]
- Burton, C.; McKinstry, B.; Szentagotai Tatar, A.; Serrano-Blanco, A.; Pagliari, C.; Wolters, M. Activity monitoring in patients with depression: A systematic review. J. Affect. Disord. 2013, 145, 21–28. [Google Scholar] [CrossRef] [PubMed] [Green Version]
- Huh, J.H. Big data analysis for personalized health activities: Machine learning processing for automatic keyword extraction approach. Symmetry 2018, 10, 93. [Google Scholar] [CrossRef]
- Timmerman, J.; Weering, M.D.V.; Tönis, T.; Hermens, H.; Vollenbroek-Hutten, M. Relationship between patterns of daily physical activity and fatigue in cancer survivors. Eur. J. Oncol. Nurs. 2015, 19, 162–168. [Google Scholar] [CrossRef] [PubMed]
- Pandey, A.; Hasan, S.; Dubey, D.; Sarangi, S. Smartphone apps as a source of cancer information: Changing trends in health information-seeking behavior. J. Cancer Educ. 2013, 28, 138–142. [Google Scholar] [CrossRef] [PubMed]
- Karargyris, A.; Karargyris, O.; Pantelopoulos, A. DERMA/Care: An advanced image-processing mobile application for monitoring skin cancer. Proc. Int. Conf. Tools Artif. Intell. 2012, 2, 1–7. [Google Scholar]
- Davis, S.W.; Oakley-Girvan, I. mHealth Education Applications Along the Cancer Continuum. J. Cancer Educ. 2015, 30, 388–394. [Google Scholar] [CrossRef] [PubMed]
- Seiler, A.; Klaas, V.; Tröster, G.; Fagundes, C.P. eHealth and mHealth interventions in the treatment of fatigued cancer survivors: A systematic review and meta-analysis. Psychooncology 2017, 26, 1239–1253. [Google Scholar] [CrossRef] [PubMed]
- Klaas, V.V.C.; Calatroni, A.; Hardegger, M.; Guckenberger, M.; Theile, G.; Tröster, G. Monitoring Patients in Ambulatory Palliative Care: A Design for an Observational Study. In Proceedings of the 6th International Conference on Wireless Mobile Communication and Healthcare, Milan, Italy, 14–16 November 2016. [Google Scholar]
- FACIT. FACIT-Erschöpfung (Fassung 4); FACIT: Elmhurst, IL, USA, 2012. [Google Scholar]
- Csikszentmihalyi, M.; Larson, R. Validity and Reliability of the Experience-Sampling Method. In Flow and the Foundations of Positive Psychology; Collected Works Mihaly Csikszentmihalyi; Springer: Dordrecht, The Netherlands, 2014; pp. 35–54. [Google Scholar]
- Bossola, M.; Di Stasio, E.; Giungi, S.; Rosa, F.; Tazza, L. Fatigue is associated with serum interleukin-6 levels and symptoms of depression in patients on chronic hemodialysis. J. Pain Symptom Manag. 2015, 49, 578–585. [Google Scholar] [CrossRef] [PubMed]
- DiCicco-Bloom, B.; Crabtree, B.F. The qualitative research interview. Med. Educ. 2006, 40, 314–321. [Google Scholar] [CrossRef] [PubMed] [Green Version]
- Mukaka, M.M. Statistics corner: A guide to appropriate use of correlation coefficient in medical research. Malawi Med. J. 2012, 24, 69–71. [Google Scholar] [PubMed]
- Franke, L.; Therstappen, E.; Schlosser, B.; Biermer, M.; Berg, T.; Schäfer, M.; Arck, P.; Uebelhack, R.; Friebe, A. A preliminary study on the relationship between platelet serotonin transporter functionality, depression, and fatigue in patients with untreated chronic hepatitis C. Depress. Res. Treat. 2014, 2014. [Google Scholar] [CrossRef] [PubMed]
- Gresham, G.K.; Piantadosi, S.; Drye, L.; Figlin, R.A.; Shinde, A.M. Applications of wearable activity monitors (WAM) in cancer clinical trials (CT): A review of the literature. J. Clin. Oncol. 2016, 34, e21598. [Google Scholar] [CrossRef]
- Giunti, G.; Fernández, E.G.; Zubiete, E.D.; Romero, O.R. Supply and demand in mHealth apps for persons with multiple sclerosis: Systematic search in app stores and scoping literature review. J. Med. Internet Res. 2018, 20. [Google Scholar] [CrossRef] [PubMed]
Figure 1.
Monitoring system comprising of a smartphone with the activity monitoring app installed and a data receiving web-server.
Figure 1.
Monitoring system comprising of a smartphone with the activity monitoring app installed and a data receiving web-server.

Figure 2.
Design (a) of the visual analogue scale to rate the perceived fatigue and (b) of the VAS to rate the perceived interference of fatigue and (c) of the selection of the currently performed activity (English translations from German original).
Figure 2.
Design (a) of the visual analogue scale to rate the perceived fatigue and (b) of the VAS to rate the perceived interference of fatigue and (c) of the selection of the currently performed activity (English translations from German original).

Figure 3.
Confirmation dialogue.

Figure 4.
Average answering rate of the six included patients. The bars denote the number of participating patients, the violet line represents the number of patients that have answered at least once the questionnaires and the green line denotes the median number of questionnaires that were answered by these patients at a day. The dashed line denotes the requested number of four questionnaires per day.

Figure 5.
Average wearability index (normalised to a 16 h day) of the six included patients. The bars denote the number of participating patients, the violet line represents the number of patients that have worn the smartphone at a day and the green line denotes the average WI of these patients at a day.

Figure 6.
The course of FACIT-F weekly reports over the study period for all patients. Each subfigure represents one patient.
Figure 6.
The course of FACIT-F weekly reports over the study period for all patients. Each subfigure represents one patient.
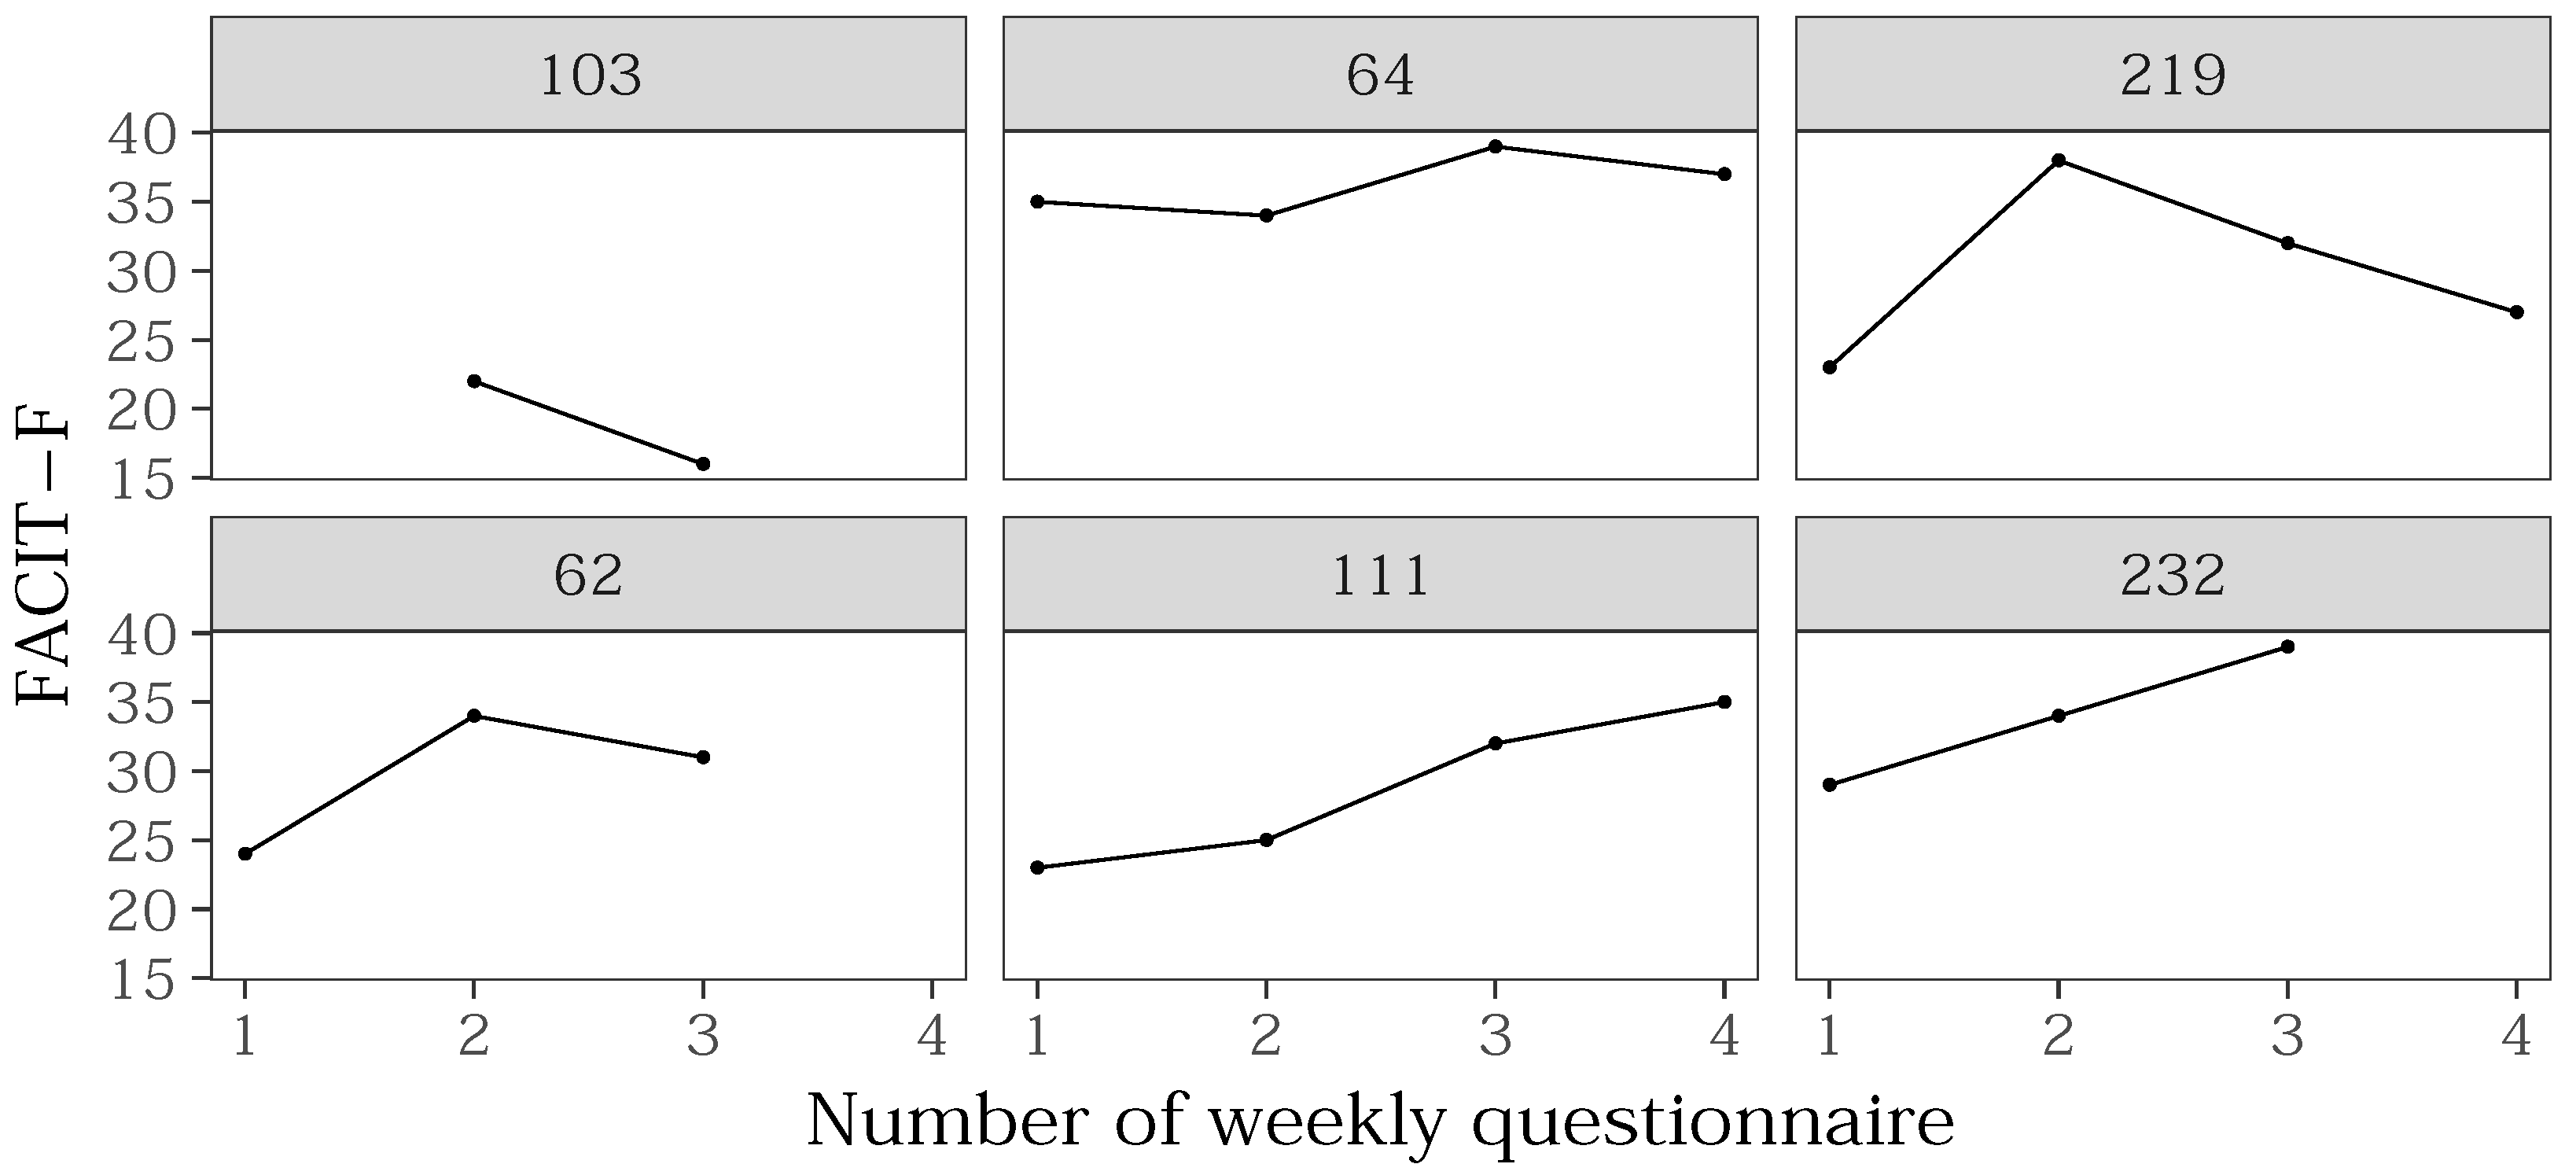
Figure 7.
Histogram of Fatigue (VAS) shows the count of fatigue values reported by all patients through the smartphone VAS. Peaks for the even numbers 2, 4, 6, 8 indicate a bias through the app design (ref. Figure 2).
Figure 7.
Histogram of Fatigue (VAS) shows the count of fatigue values reported by all patients through the smartphone VAS. Peaks for the even numbers 2, 4, 6, 8 indicate a bias through the app design (ref. Figure 2).

Figure 8.
Scatter plots of Fatigue vs. Interference of all digital questionnaires per patient: the dot size represents the count of a VAS value pair. The diagonal denotes where Fatigue equals Interference.
Figure 8.
Scatter plots of Fatigue vs. Interference of all digital questionnaires per patient: the dot size represents the count of a VAS value pair. The diagonal denotes where Fatigue equals Interference.

Figure 9.
The box plot of perceived fatigue values per time at day shows intra-day variance. The sample size is denoted in each box with n. The bold line in each box denotes the median, the box denotes the IQR and the whiskers extend to the smallest value, highest value resp., within . Points denote outliers, i.e., values that lie outside of the whiskers.

Figure 10.
Actigram of patient 232; rows present days; activity is aggregated as variance of the acceleration signal over one-minute windows; grey represents off-body data, white shows gaps of data.
Figure 10.
Actigram of patient 232; rows present days; activity is aggregated as variance of the acceleration signal over one-minute windows; grey represents off-body data, white shows gaps of data.


Table 1.
Data collected by the smartphone.
| Modality | Description | Sampling Rate |
|---|---|---|
| Questionnaires | two simple to use visual analogue scales allow to rate the level of perceived fatigue and interference in a range from 0 (not tired/no interference)–10 (extremely tired/extreme interference). The third question provides a selection of 7 daily activities, e.g., relaxing, housework, multimedia, and a blank card (“Other”). | 4 random times per day (based on ESM) |
| Physical Activity | The sampling rate of sensor measurements is controlled by Android and varies depending on usage. | |
| Accelerometer | 40 Hz | |
| Barometer | 2 Hz | |
| Magnetometer | 10 Hz |
Table 2.
Parameters for applied sliding windows and for the trained SVM.
| Parameter Name | Value |
|---|---|
| windows size | 256 samples |
| step width | 1 |
| C | 31.62 |
| gamma | 0.0025 |
Table 3.
Statistical features extracted from the Euclidean norm of the three-axis acceleration signal: these features are used for a fatigue-activity-correlation-analysis.
Table 3.
Statistical features extracted from the Euclidean norm of the three-axis acceleration signal: these features are used for a fatigue-activity-correlation-analysis.
| Feature | Description |
|---|---|
| with of over 1 h window | |
| with of over 1 h window | |
| WEAR | wearability index calculated over 1 h window |
| ENERGY | |
| ENERGY.WEAR |
Table 4.
Overview on the included study participants. BL: baseline (**: value after week 1); *: drop out.
Table 4.
Overview on the included study participants. BL: baseline (**: value after week 1); *: drop out.
| Pat. Id | Age (Year) | Gender | FACIT-F (BL) |
|---|---|---|---|
| 103 | 32 | f | 22 ** |
| 64 | 58 | m | 35 |
| 219 | 73 | f | 23 |
| 62 | 37 | f | 24 |
| 111 | 33 | f | 23 |
| 232 | 52 | f | 29 |
| 66 * | 56 | f | 24 |
Table 5.
Daily averages of retention features: LT/d—avg logging time per day; h—nb. of days with less than 20 h logging time; q/d—avg nb. of answered questionnaires per day; WI—average wearability index; WI—WI normalised to a 16 h day.
Table 5.
Daily averages of retention features: LT/d—avg logging time per day; h—nb. of days with less than 20 h logging time; q/d—avg nb. of answered questionnaires per day; WI—average wearability index; WI—WI normalised to a 16 h day.
| Pat. Id | Participation (d) | LT/d (h) | h | q/d | WI | WI |
|---|---|---|---|---|---|---|
| 103 | 32 | 23.6 | 1 | 4 | ||
| 64 | 16 | 22.0 | 2 | 3.3 | ||
| 219 | 31 | 23.9 | 0 | 3.9 | ||
| 62 | 15 | 23.1 | 1 | 4.1 | ||
| 111 | 15 | 21.6 | 3 | 4.1 | ||
| 232 | 15 | 23.0 | 1 | 6.6 |
Table 6.
Individual Pearson’s correlations between perceived fatigue and perceived interference for each patient.
Table 6.
Individual Pearson’s correlations between perceived fatigue and perceived interference for each patient.
| Pat. Id | Correlation | Significance |
|---|---|---|
| 103 | r(97) = 0.62 | p < 2.2 |
| 64 | r(60) = 0.98 | p < 2.2 |
| 219 | r(59) = 0.57 | p = 7.505 |
| 62 | r(119) = 0.78 | p = 5.87 |
| 111 | r(51) = 0.95 | p < 2.2 |
| 232 | r(125) = 0.87 | p = 1.211 |
Table 7.
Result of correlation analysis: the discovered correlations per patient are reported according to the sign of the Pearson’s correlation coefficient r together with the number of patients in which these correlations were found.
Table 7.
Result of correlation analysis: the discovered correlations per patient are reported according to the sign of the Pearson’s correlation coefficient r together with the number of patients in which these correlations were found.
| Correlation Sign | |||
|---|---|---|---|
| VAR | pos | 0.78–0.91 (2) | 0.61 (1) |
| neg | −0.8 (1) | −0.76 (1) | |
| RMS | pos | 0.6–0.76 (2) | 0.61–0.63 (2) |
| WEAR | pos | 0.55 (1) | 0.61 (1) |
© 2018 by the authors. Licensee MDPI, Basel, Switzerland. This article is an open access article distributed under the terms and conditions of the Creative Commons Attribution (CC BY) license (http://creativecommons.org/licenses/by/4.0/).
Share and Cite
MDPI and ACS Style
Klaas, V.C.; Troster, G.; Walt, H.; Jenewein, J. Remotely Monitoring Cancer-Related Fatigue Using the Smart-Phone: Results of an Observational Study. Information 2018, 9, 271. https://doi.org/10.3390/info9110271
AMA Style
Klaas VC, Troster G, Walt H, Jenewein J. Remotely Monitoring Cancer-Related Fatigue Using the Smart-Phone: Results of an Observational Study. Information. 2018; 9(11):271. https://doi.org/10.3390/info9110271
Chicago/Turabian StyleKlaas, Vanessa Christina, Gerhard Troster, Heinrich Walt, and Josef Jenewein. 2018. "Remotely Monitoring Cancer-Related Fatigue Using the Smart-Phone: Results of an Observational Study" Information 9, no. 11: 271. https://doi.org/10.3390/info9110271
Note that from the first issue of 2016, this journal uses article numbers instead of page numbers. See further details here.