Article

An Approach to the Classification of Cutting Vibration on Machine Tools

1
Department of Industrial Engineering and Systems Management, Feng Chia University, Taichung 40724, Taiwan
2
Department of Electrical and Electronic Engineering, Faculty of Information Technology, University of Transport Technology, Hanoi 100000, Vietnam
*
Author to whom correspondence should be addressed.
These authors contributed equally to this work.
Information 2016, 7(1), 7; https://doi.org/10.3390/info7010007
Submission received: 15 November 2015 / Revised: 30 January 2016 / Accepted: 3 February 2016 / Published: 15 February 2016

Abstract

:
Predictions of cutting vibrations are necessary for improving the operational efficiency, product quality, and safety in the machining process, since the vibration is the main factor for resulting in machine faults. “Cutting vibration” may be caused by setting incorrect parameters before machining is commenced and may affect the precision of the machined work piece. This raises the need to have an effective model that can be used to predict cutting vibrations. In this study, an artificial neural network (ANN) model to forecast and classify the cutting vibration of the intelligent machine tool is presented. The factors that may cause cutting vibrations is firstly identified and a dataset for the research purpose is constructed. Then, the applicability of the model is illustrated. Based on the results in the comparative analysis, the artificial neural network approach performed better than the others. Because the vibration can be forecasted and classified, the product quality can be managed. This work may help new workers to avoid operating machine tools incorrectly, and hence can decrease manufacturing costs. It is expected that this study can enhance the performance of machine tools in metalworking sectors.

1. Introduction

Machine tools play important roles in the metalworking sectors. Machine tools vibrate more or less when in operation. Excessive vibration may cause operational inefficiency, product-quality problems, and increase the cost of manufacturing. Therefore, predictions of cutting vibrations are important for reducing machine downtime and work piece failure costs. In the past, predictions of cutting vibrations were based on practical considerations, previous experience and common sense. Therefore, successful predictions of vibrations required staff with a considerable degree of knowledge and experience. Although data collection may be carried out by trained personnel, data processing and an assessment of the state of the machine tools are the tasks of engineers who have knowledge in various areas (design of machine tools, mathematics, dynamic processing, and signal processing, etc.) and who are able to apply this knowledge in this context. Since machine tools have become more complex and technologically sophisticated, traditional prediction methods have fallen behind. Research in the field of advanced machine tools control mainly focuses on modeling [1], detection [2,3], and the classification and planning aspect of the disturbance [4]. Not much research or commercial systems tackle the prediction of the cutting vibration before operation is commenced. In this paper, a classification model based on an artificial neural network (ANN) approach is presented to predict the level of a cutting vibration. It focuses on the prediction of the cutting vibrations before work is commenced. As is known, especially in the aerospace industry, the raw material cost is very expensive. This study can help new workers to avoid manufacturing defective work pieces and thus can reduce the cost of manufacturing.
This rest of this paper is organized into seven sections. A review of the literature is presented in Section 2. Previous classification approaches are described in Section 3. The artificial neural network (ANN) architecture is illustrated in Section 4. An application of the presented ANN classifier is shown in Section 5. Section 6 is devoted to experimental results and discussion. Finally, Section 7 presents the conclusions.

2. Literature Review

The literature review includes the skills of monitoring machining processes, vibrations of machine tools, and the past research related to the vibrations of machine tools.

2.1. Skills of Monitoring Machining Processes

In recent years, the monitoring of machining processes has been recognized as being one of the key revolutionary technologies. There are several reasons behind this need. One is the factory automation, especially the ever-increasing popularity of computer-aided technologies such as CAD/CAM and FMS. Other than this, there has been a dramatic demand for more sophisticated and precise parts, which in turn has resulted in the increasing requirement of more intelligent machine tools.
Intelligent machine tools require the use of various sensors and a decision-making process based on the information obtained by the sensors. The research in monitoring machining process include: (1) the use of multiple sensors to sense machining states; (2) the extraction of features sensitive to machining conditions; and (3) the development of a pattern classifier capable of correctly classifying the state of cutting processes [5]. Of all the various applications for machine intelligence, the monitoring of tool wear, breakage, and chatter have been the most important monitoring subjects in the machine tool industry [6,7,8,9,10]. For the research of using neural networks to monitoring machining process, unsupervised neural networks have often been used to monitor tool breakage [11], and supervised neural networks have often been used to monitor tool wear [12,13,14]. Several noticeable studies are as follows: In a work by Leone et al., regression analysis and artificial neural network paradigms were used to predict the tool wear development [10]. The data were collected from turning of Inconel 718 aircraft engine components. The results showed that the accuracy of the artificial neural network prediction is better than the regression analysis, especially when a limited number of data is unknown. Nakai et al. [8] estimated diamond tool wear during the grinding of advanced ceramics using neural networks. Acoustic emission and cutting power signals were acquired during the tests, and data were obtained from these signals. The results showed that the models successfully estimated tool wear. D’Addona et al. [9] employed the neural network model to estimate the optimal tool life utilization in turning of aircraft engine products. The results indicate that the model can provide a step increase in productivity while preserving the surface integrity of the machined parts.

2.2. Vibrations of Machine Tools

The vibrations that occur in the machining processes ordinarily fall into three types [15]: (1) free vibrations; (2) forced vibrations; and (3) self-excited vibrations (chatter). Free vibrations occur when a mechanical system is set off with an initial input and then allowed to vibrate freely.
Forced vibrations may be because of one or more of the following causes:
(1)
Out-of-balance rotating or reciprocating machine components. This is due to the fact that the mechanisms transfer energy in uniformly timed impulses to faulty gears, belts, balls, and roller bearings.
(2)
Vibrations transmitted from other machines through foundations.
(3)
Vibrations caused by chip formation. When a discontinuous type of chip is formed, the recurring fractures of the metal in the shear plane ahead of the tool produce periodic variations. Similarly, in the case of machining operations that produce a continuous chip with a built-up edge, there is a variation in the force on the cutting tool. Yet another source of forced variation may be caused by the formation of chips of varying thickness obtained. The frequency of these periodic variations depends upon the frequency of discontinuity in the chip of the built-up edge, or the number of teeth in the milling cutting.
Of the three types of vibrations, the self-excited type is ordinarily the most severe. Self-excited vibrations are mainly caused by the dynamic instability of the cutting. The theory of chatter is complex, and a large number of parameters are involved in the chatter phenomena. The self-excited vibrations will be discussed in Section 5.2.

2.3. Past Research Related to the Vibrations of Machine Tools

Choudhury et al. [16] developed a system for on-line vibration control on a turning lathe. A correlation was established between cutting parameters (speed, feed…) and the control of vibrations during machining. Ema and Marui [17] presented a theoretical analysis on chatter vibration in drilling and its suppression. The stability of chatter vibration, occurring in drills for deep-hole machining, was investigated theoretically. After conducting the experiment, they found that, if the logarithmic decrement of the drills becomes greater than some value by the application of an impact damper, the chatter vibration can be suppressed completely.
Quintana et al. [18] studied the chatter vibration issue and classified the existing methods developed to ensure the stable cutting of those using out-of-process or in-process, as well as those modifying system behavior passively or actively. Out-of-process strategies focused on predicting, estimating and identifying the SLD through machining process modeling and analytical-experimental methods. In-process strategies focused on identifying or recognizing chatter through the use of several sensor technologies, process monitoring and signal treatment. Passive strategies focused on the use of passive elements, devices, methodologies or techniques that change or modify the system behavior and improve its performance against chatter. Active strategies focused on the use of elements, strategies, devices or actuators that actively modify the system behavior so as to suppress chatter as soon as it occurs. In this study, an ANN classifier is used to classify vibration classes.

3. Previous Classification Approaches

In order to demonstrate the effectiveness of the presented ANN classifier, the performance of the ANN classifier is compared with three commonly used classifiers, namely the decision tree classifier, the support vector machine classifier, and the Naive Bayes classifier. These three classifiers are described as follows.

3.1. Decision Tree

A decision tree (DT) is a hierarchical structure consisting of decision rules that recursively divide independent inputs into homogenous classes. The purpose of constructing a DT is to identify the set of decision rules that can be employed to predict outcomes from a set of input variables. A DT is called a regression tree if the target variables are continuous. If the target variables are discrete, it is called a classification tree [19]. Although the computational complexity of a decision tree may be high, it can be used to identify the most important input variables in a dataset.

3.2. Support Vector Machine (SVM)

A support vector machine (SVM) is a supervised learning method based on the statistical learning theory [20]. SVM has been successfully applied to a number of classification applications. By using the training data, SVM can map the input space into a high-dimensional feature space. In the feature space, the optimal hyper plane can be searched by maximizing the margins or distances of class boundaries. The training points closest to the optimal hyper plane are called support vectors. After the decision surface is obtained, it can be applied to classify the new data.
Consider a training dataset of (xi, yi), with i = 1, , m. The optimal separating hyper plane can be represented as [20]:
g ( x ) = s i g n ( i = 1 m y i α i K ( x i , x j ) + b )
where K (xi, xj) is a kernel function, αi is a Lagrange multiplier, and b is the offset of the hyper plane from the origin. Equation (1) is subject to 0 α i C and Σαiyi = 0, where C is the penalty. Only those training points lying close to the support vectors have nonzero αi. However, in real-world problems, there is noise in the data. Hence, there may be no linear separation in the feature space. Therefore, the optimal hyper plane can be represented as:
yi(w.xi+b)1-ξi, ξi0
where w is the weight vector that measures the orientation of the hyper plane in the feature space and ξi is the ith positive slack variable that measures the amount of violation.

3.3. Naive Bayes Classifier

The naive Bayes classifier is based on Bayes’ theorem and the idea that the probability of a given data point belongs to a particular class [21]. Assume that there are n training samples (xi, yi), where xi = (xi1, xi2, …, xim) and yi are two m-dimensional vectors. For a new sample xtest to predict its class by using Bayes’ theorem, then:
y t e s t = arg max y   P ( y | x t e s t ) = arg max y P ( x t e s t | y ) P ( y ) P ( x t e s t )
The above equation requires the estimation of distribution P ( x | y ) , since the estimation of distribution P ( x | y ) is impossible in some cases. Hence, the Naive Bayes classifier makes a strong independent assumption on this probability distribution by the following equation [21]:
P ( x | y ) = i = 1 m P ( x i | y )
This means that the individual components of x are conditionally independent with respect toy, andthe classification can then proceed by estimating m one-dimensional distributions P ( x j | y ) .

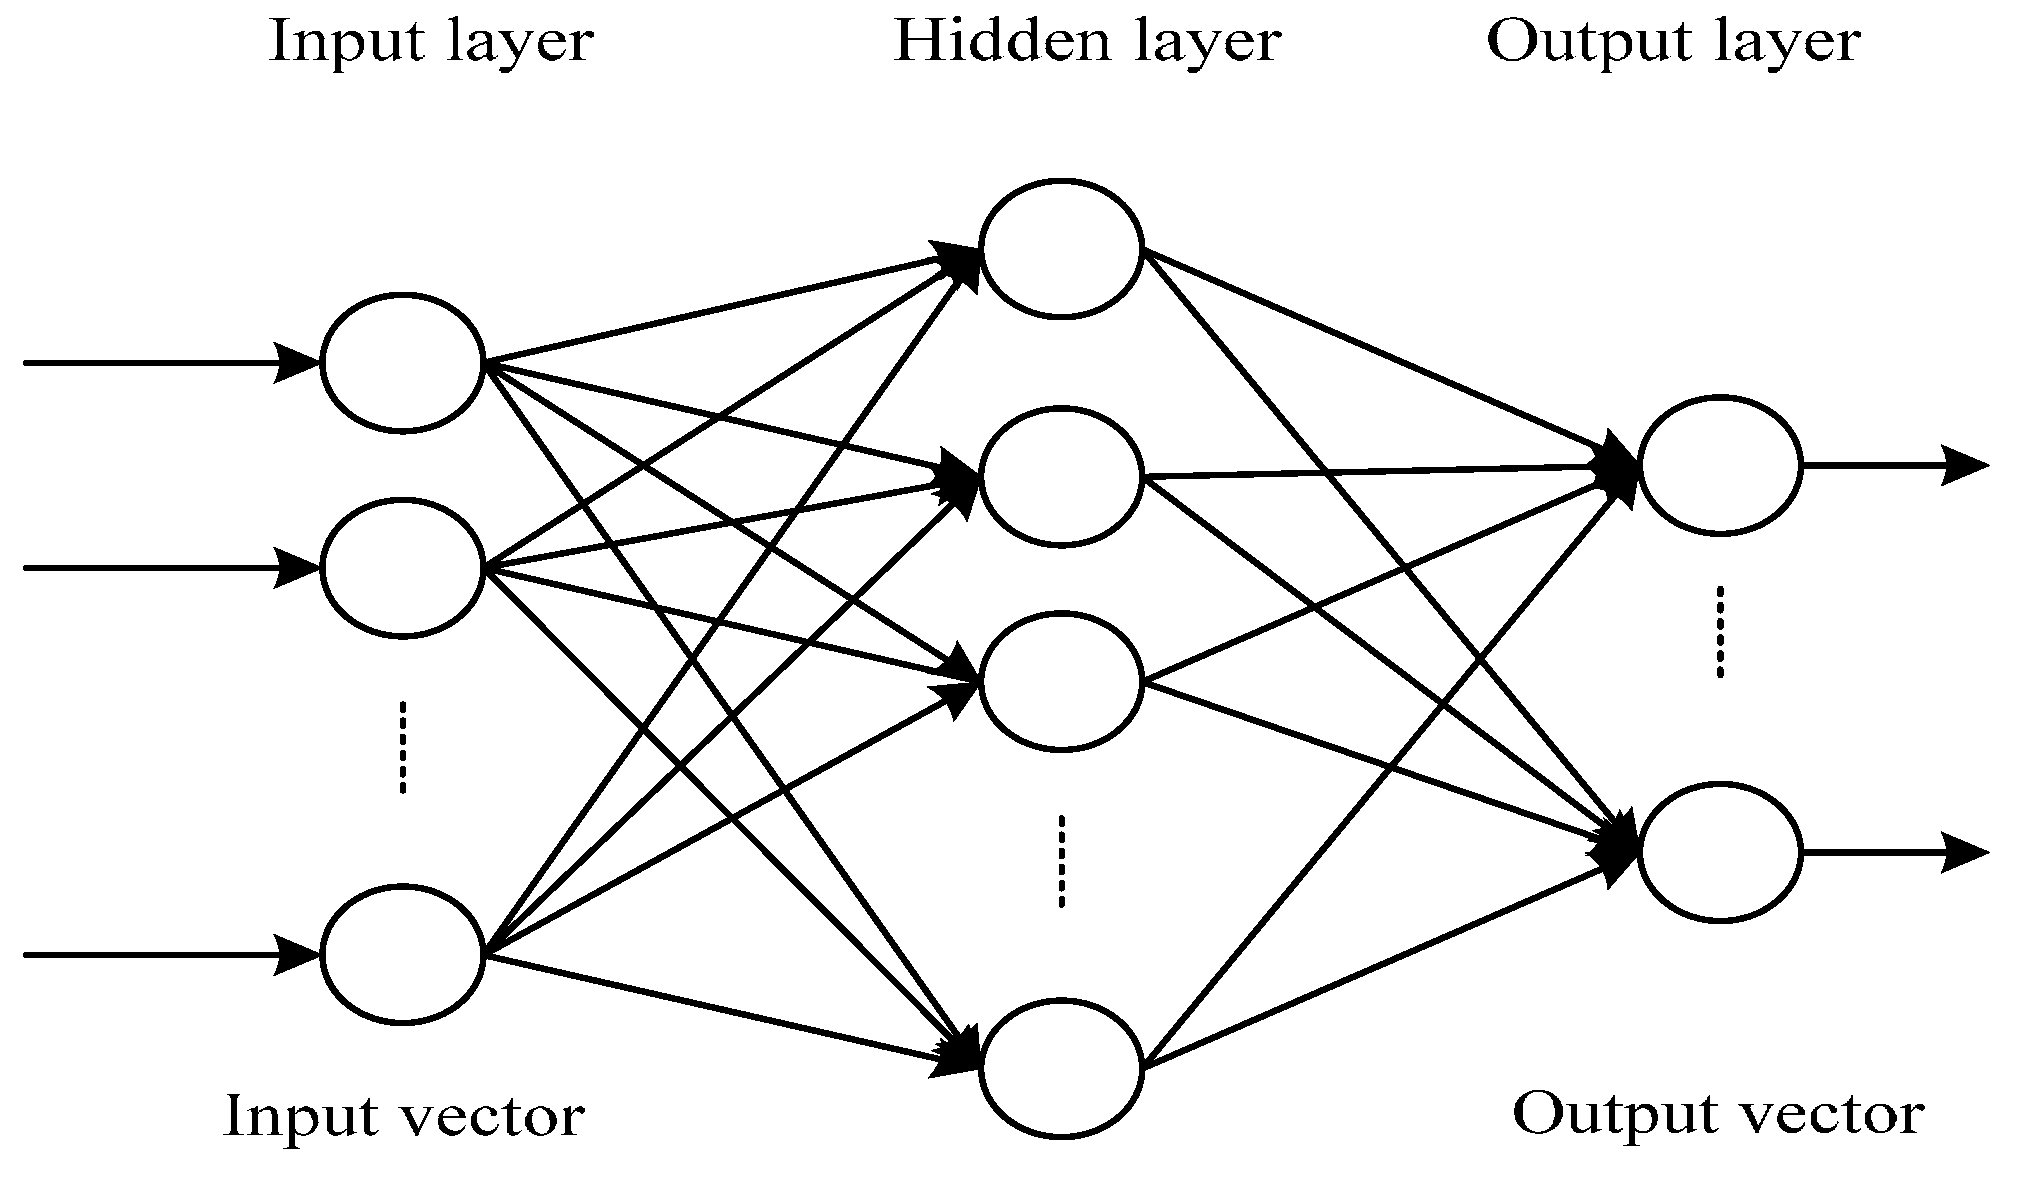
4. Artificial Neural Network (ANN) Architecture

In this study, an artificial neural network is implemented and the back propagation algorithm is applied for classification. Generally, the procedure of classification by using ANN consists of three steps: (1) data pre-processing, training, and testing; (2) the features from the data pre-processing step are fed to the ANN and a classifier is generated through the ANN; and (3) the testing data is used to verify the efficiency of the classifier.

4.1. The Feed-Forward Neural Network

The ANN is inspired by biological neural networks such as the brain. ANNs can represent complex relationships between inputs and outputs and can find patterns in data. ANNs have the notable ability to derive meaning from complicated or imprecise data and can be used to extract patterns and detect trends that are too complicated to be recognized by either humans or traditional computing techniques. This means that neural networks have the ability to identify and respond to patterns that are similar but not identical to the ones with which they have been trained. The ANN has become one of the most important data mining techniques and can be used for both supervised and unsupervised learning. In fact, feed-forward neural networks (FNNs) are the most popular neural networks in practical applications. For a given set of data, a multi-layered FNN can provide a good non-linear relationship. Studies have shown that an FNN, even with only one hidden layer, can approximate any continuous function [22,23]. Therefore, it is the most commonly used technique for classifying nonlinearly separable patterns and approximating functions.
Feed-forward neural networks often have one or more hidden layers (Figure 1). Multiple layers of neurons with non-linear transfer functions allow the network to learn non-linear and linear relationships between input and output vectors. The linear output functions let the network produce values inside the range −1 to 1 (Figure 2). On the other hand, if the outputs of network are restricted to the values between 0 and 1, then the output layer should use a log-sigmoid transfer function.
Figure 1. A feed-forward neural network with one hidden layer.
Information 07 00007 g001
Figure 2. (a) A sigmoid function; (b) A hyperbolic tangent function.
Information 07 00007 g002
Before training a feed-forward network, the weight and biases must be initialized. Once the network weights and biases have been initialized, the network is ready for training. Random numbers around zero are used to initialize weights and biases in the network. The training process requires a set of proper inputs and targets as outputs. During training, the weights and biases of the network are iteratively adjusted to minimize the network performance function. There are several training algorithms for feed-forward networks. All these algorithms use the gradient of the performance function to determine how to adjust the weights to minimize the performance. The gradient is determined using a technique called back propagation, which involves performing computational backwards through the network.

4.2. Back-PropagationAlgorithm

Back propagation was created by generalizing the Widrow-Hoff learning rule [24] to a multiple layer network and a non-linear differentiable transfer function. Input vectors and corresponding target vectors are used to train a network until it can approximate a function, associate input vectors with specific output vectors, or classify input vectors in an appropriate way as defined in this study. A sigmoid layer and a linear output layer are capable of approximating any function with a finite number of discontinuities. The back propagation algorithm consists of two paths: the forward path and backward path. The forward path includes creating a feed-forward network, initializing weight, simulation and training the network. The network weights and biases are updated in the backward path. The training process is as follows:
Step 1:
Design the structure of FNN and set input parameters of the network.
Step 2:
Set learning rate η and momentum rate α .
Step 3:
Initialize the connection weights Wji, Wki and bias weights θ j , θ k to random values.
Step 4:
Set stopping criteria.
Step 5:
Start training by applying input patterns one at a time and propagate through the layers to calculate total error.
Step 6:
Back-propagate error through output and hidden layers and update biases and weights.
Step 7:
Back-propagate error through hidden and input layers and update biases and weights.
Step 8:
Repeat step 5 to step 8 until stopping criteria are reached.

5. An Application of the Presented ANN Classifier

In this section, an application of the proposed ANN model to the prediction of the vibration class of a CNC milling machine is demonstrated. In order to simplify the experiment, only plane-surface machining is considered. Furthermore, it is assumed that both the machine tool and the cutting tool are in good condition, that the cutting tool (an end mill cutter, S45C) is suitable for cutting the work piece (made of cast iron), that the work piece is properly held (only up milling is considered), and that no cutting fluid is used. (Note that without the above assumptions, the dataset would contain an enormous amount of data).During the experiment, a vibration analyzer, VA12, was used to measure the vibration. The vibration analyzer can measure vibrations based on the acceleration, velocity, and displacement. In this study, the vibration was measured according to the velocity. The dataset was collected by an expert working with a machine tool factory in Taiwan. The data collection steps include (1) putting a set of input parameters into the NC panel; (2) using the vibration analysis instrument (VA-12) to measure the data of velocity; and (3) measuring the classification of vibration class according to the velocity.
The vibration classes are divided into three classes (based on the machine tool industry in Taiwan): (1) the velocity below G2.5 (2.5 mm/s) is good (no vibration, class 3); (2) the velocity between G2.5 to G6.3 is acceptable (light vibration, class 2); and (3) the velocity over G6.3 is not good (vibration, class 1). The dataset consists of 360 cases and the 10-fold cross validation method was used for the validation of the developed model. The dataset was divided into two groups: The first group (containing 60% of the data) was used for training the model and the second group (containing 40% of the data) was employed for testing the model. The dataset belongs to the Manford Machine Company in Taiwan and can be requested by contacting the corresponding author by email.

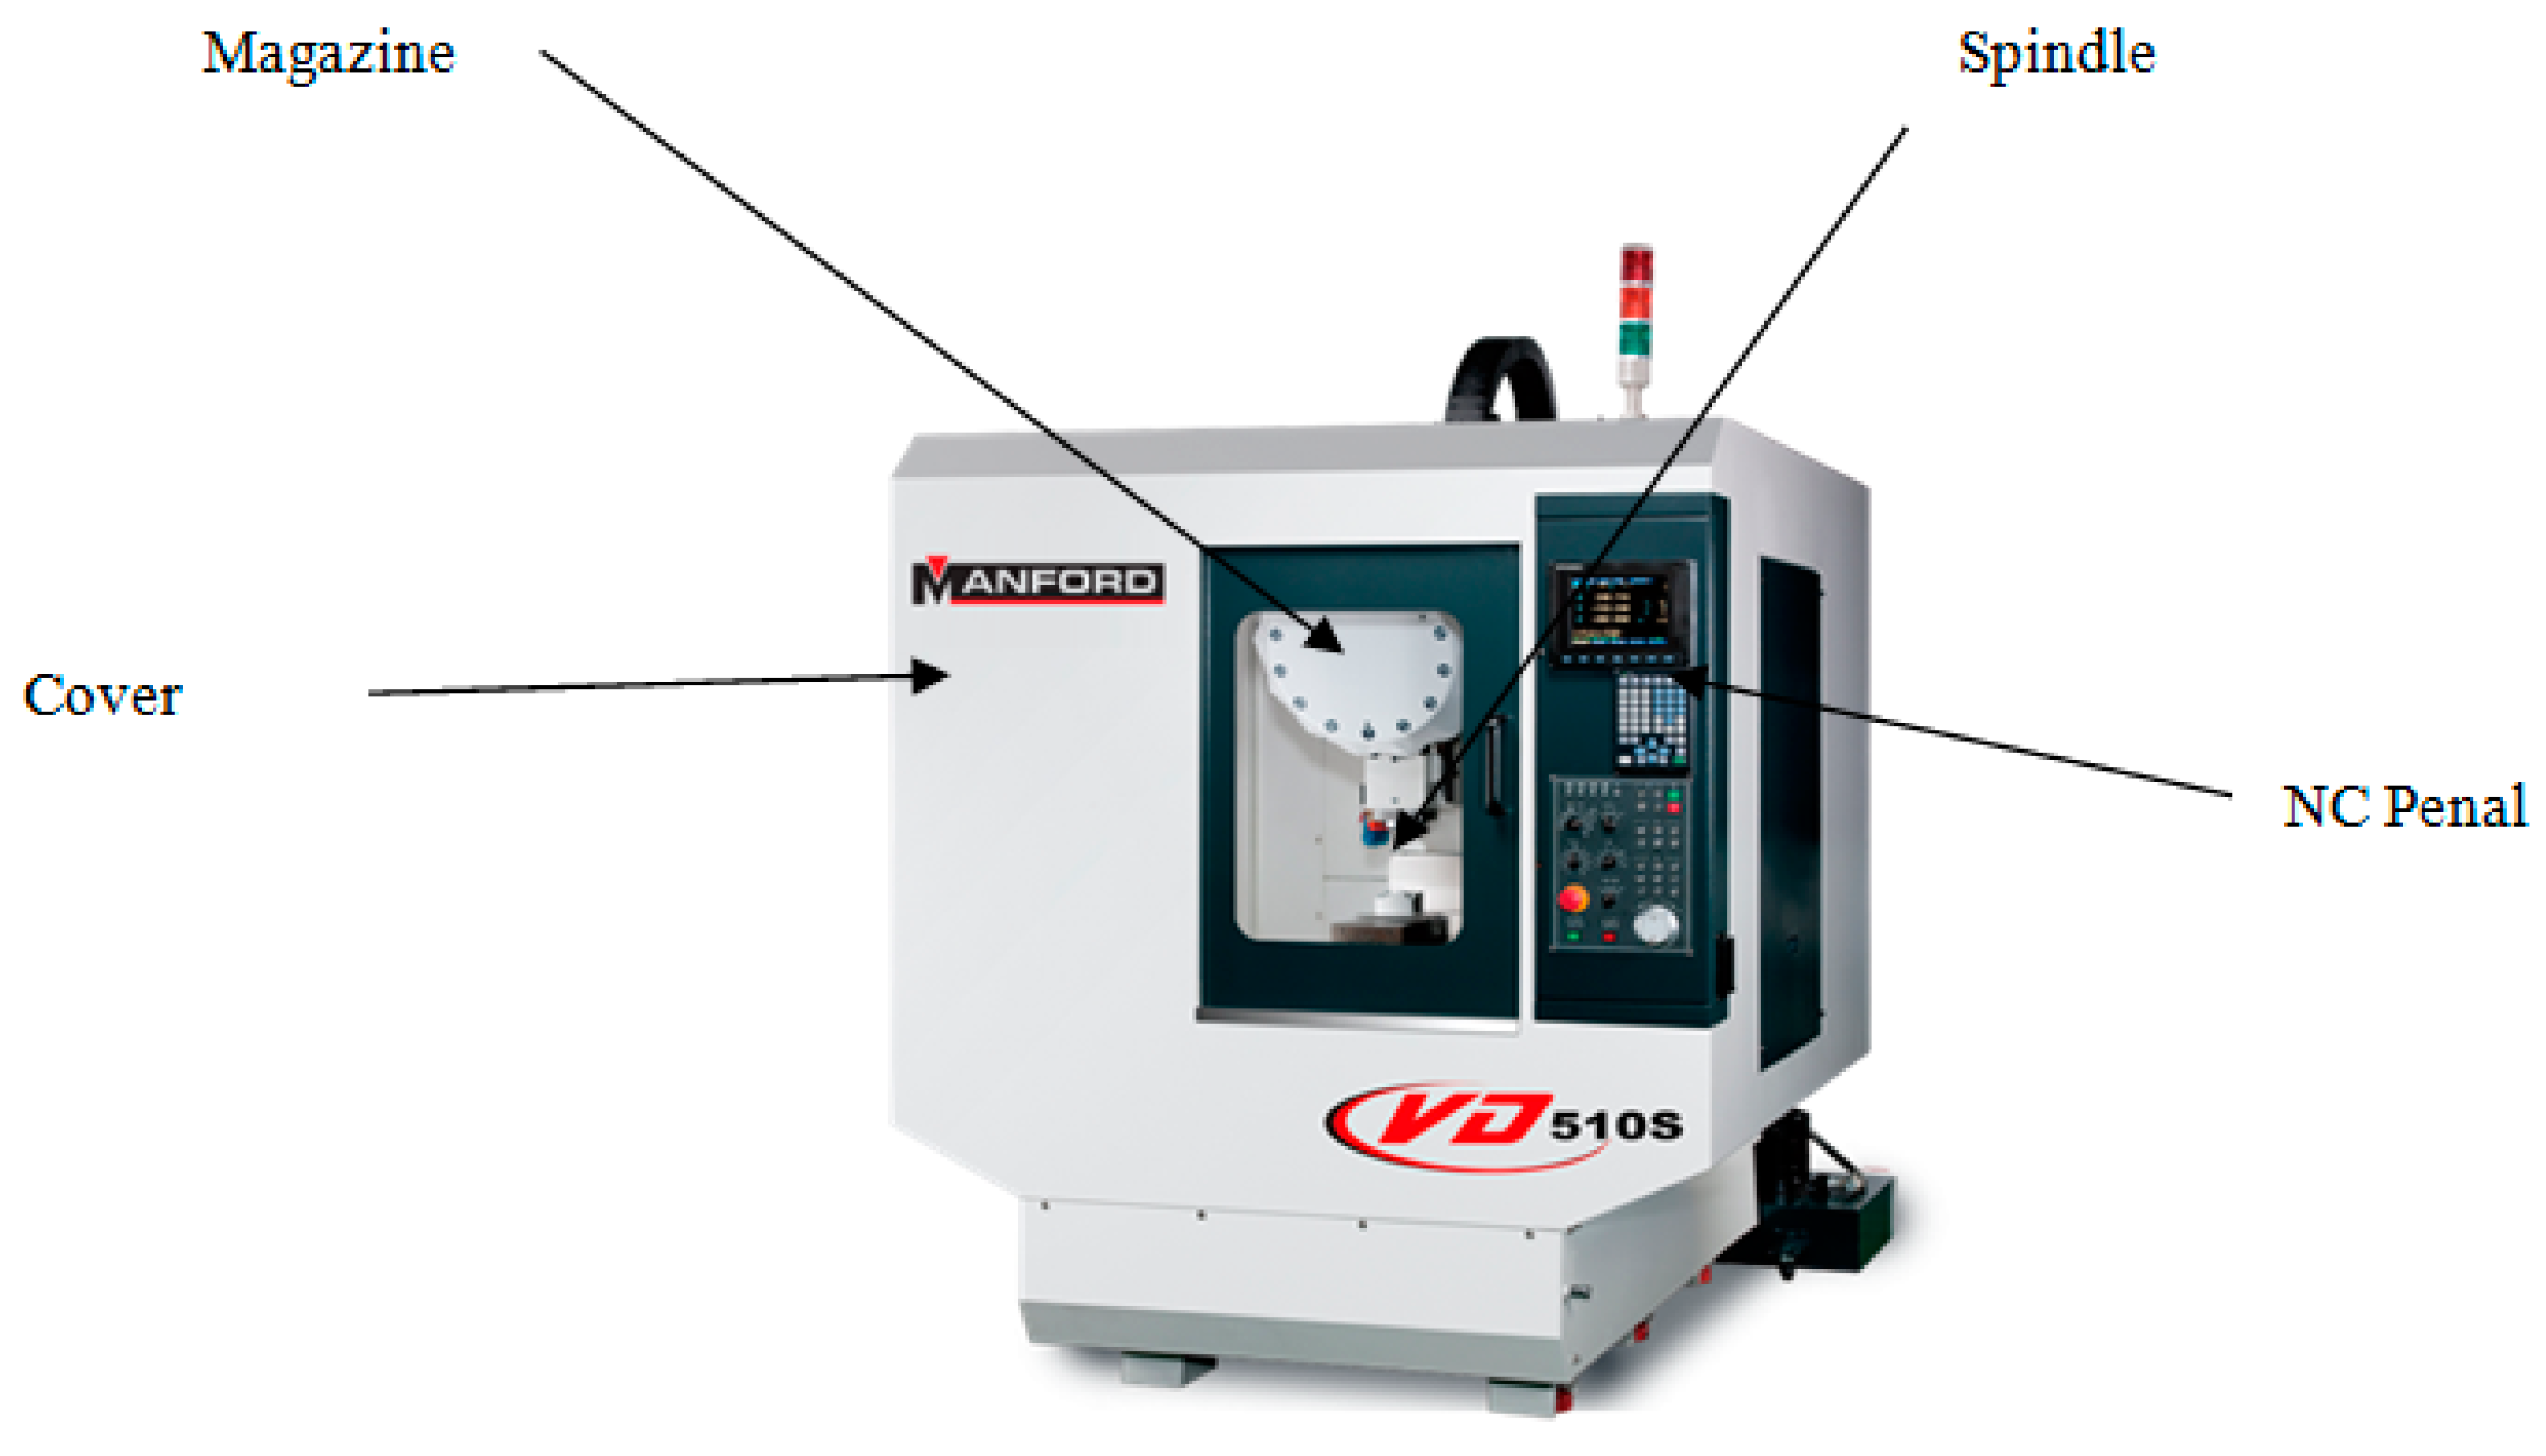
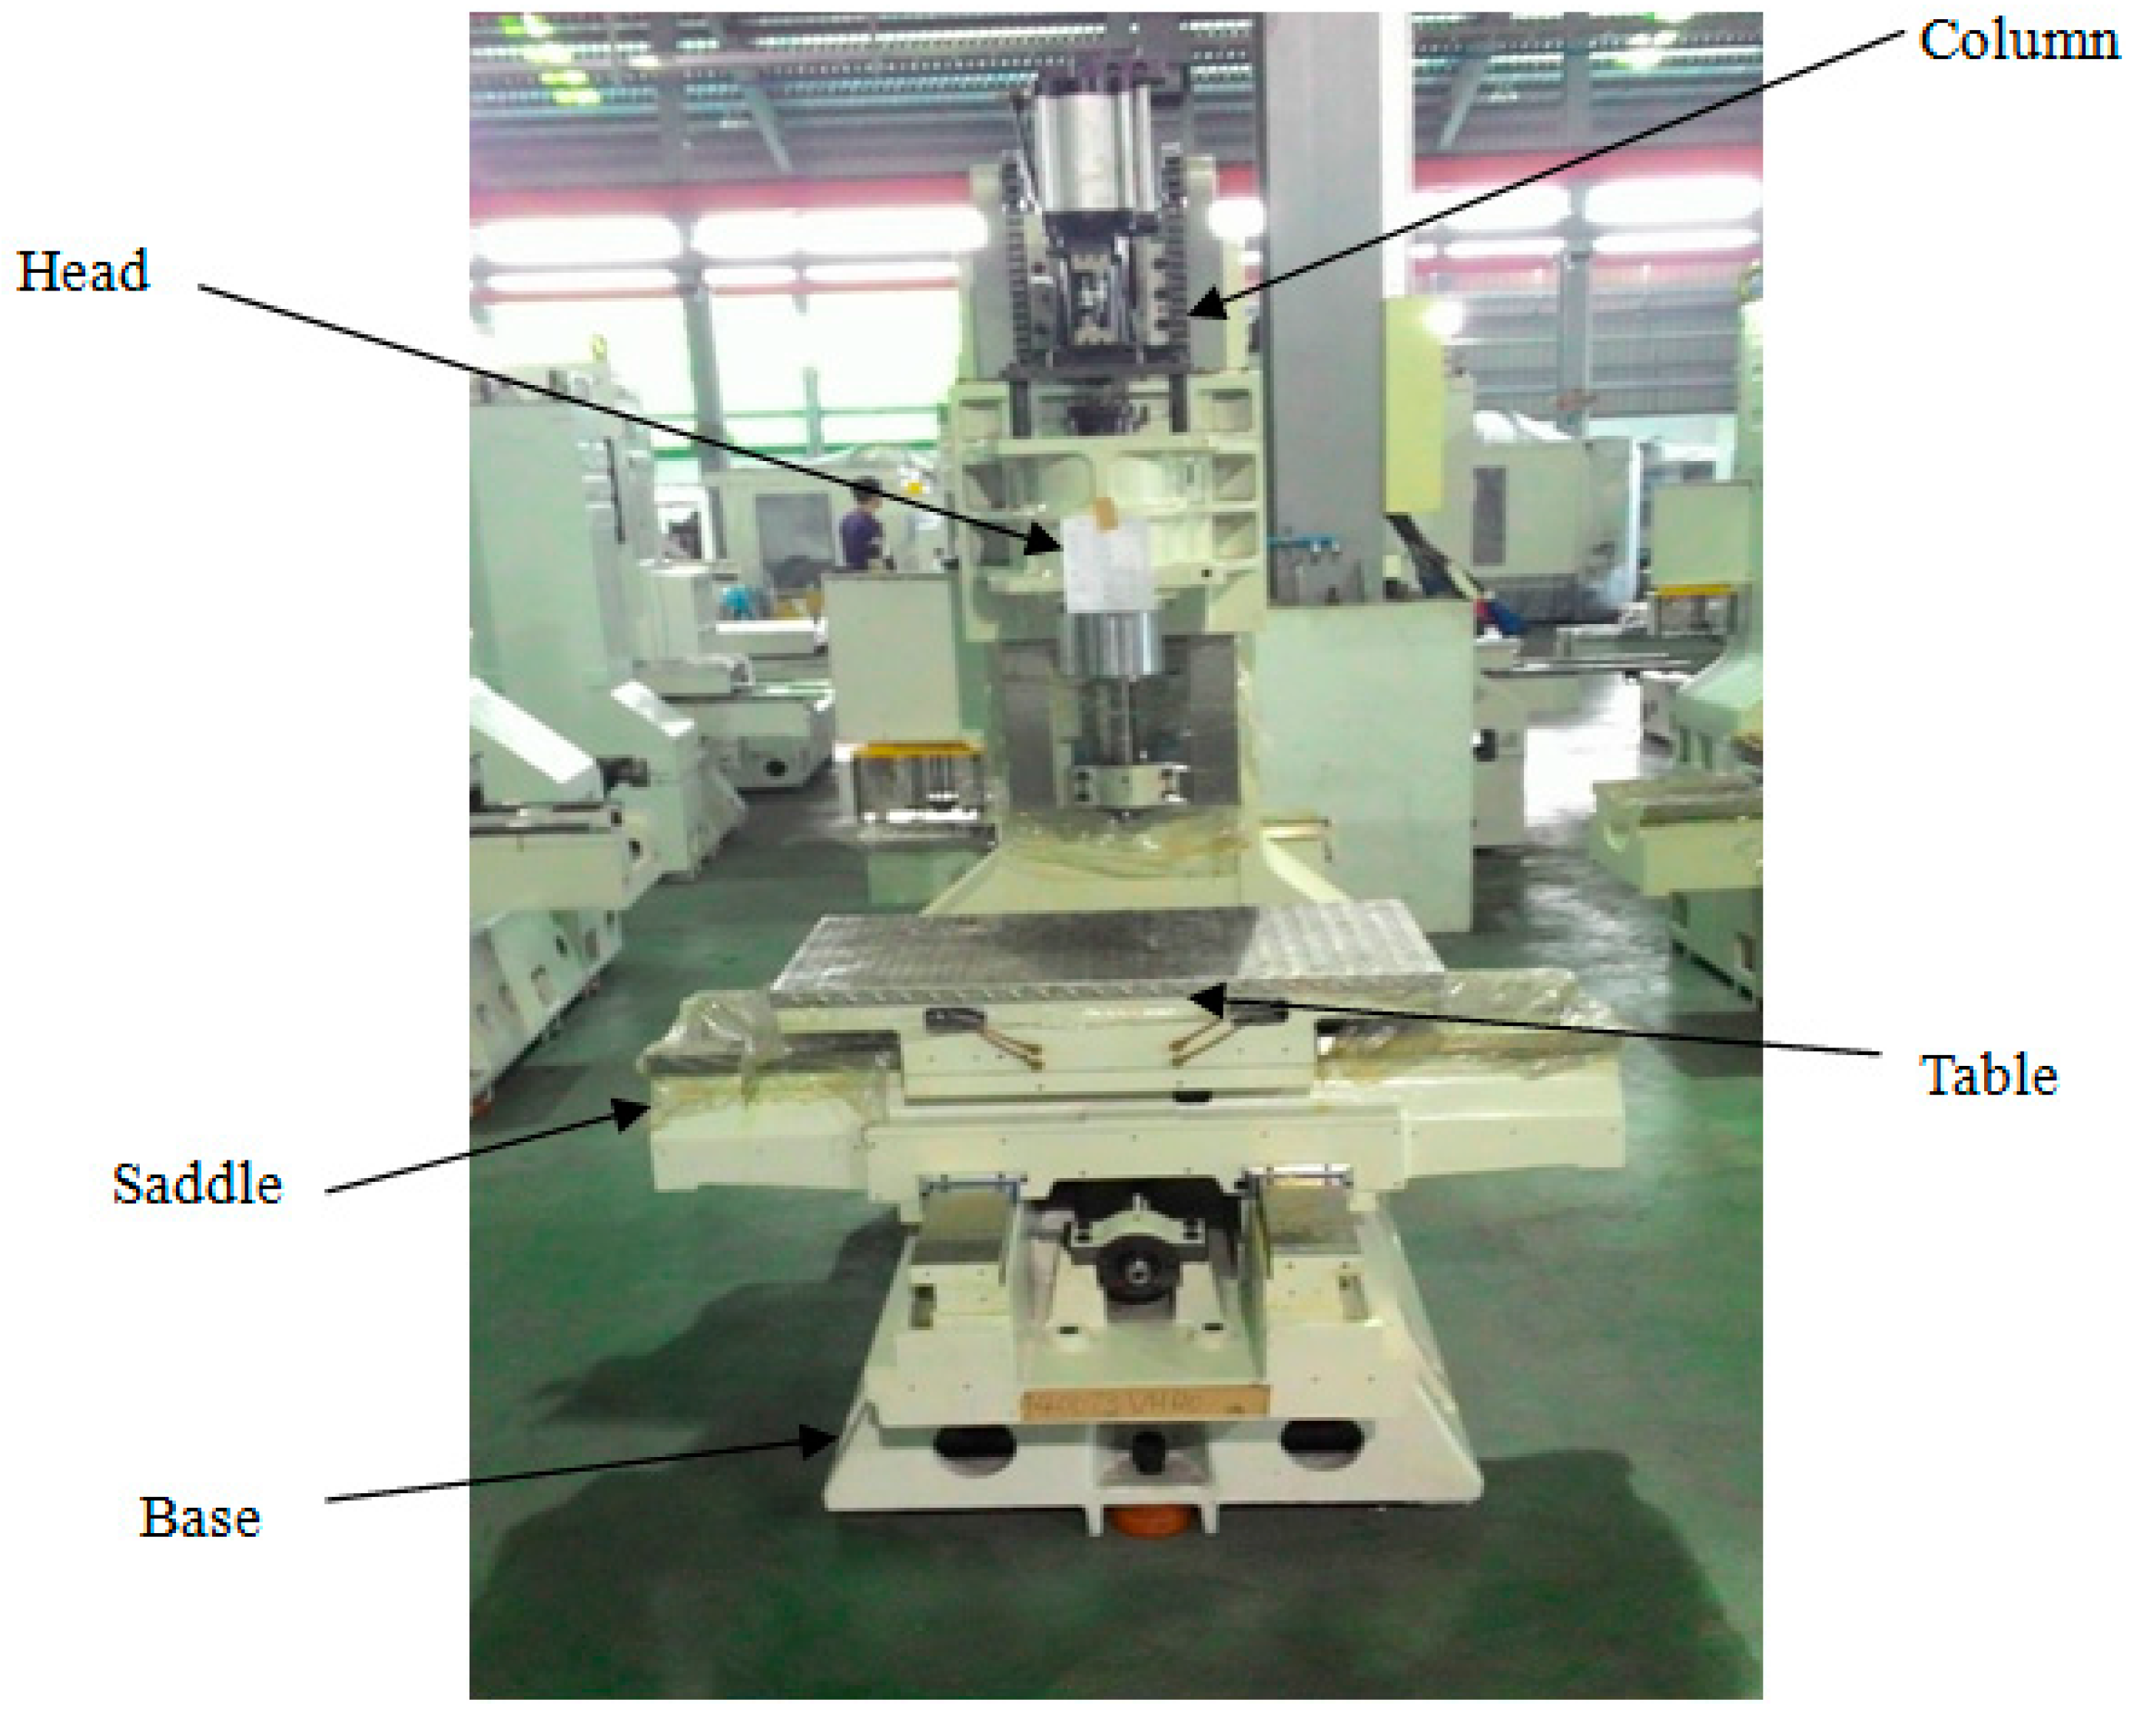
5.1. CNC MillingMachine

Computer numerical control (CNC) milling machines, featuring high speed, high accuracy, and high productivity, have been used for machining parts in many industrial fields. In general, CNC milling machines are grouped by the number of axes they can operate. X- and Y-axes designate horizontal movement of the work piece (forward-and-back and side-to-side on a flat plane), and Z-axis represents the vertical movement. The structure of milling machines includes two sectors: one consisting of the base, saddle, table, head stock and column (Figure 3), and the other consisting of the spindle, magazine, NC panel, cover, and so on (Figure 4).
Figure 3. The cast parts of a milling machine.
Information 07 00007 g003
Figure 4. The accessory parts of a milling machine.
Information 07 00007 g004

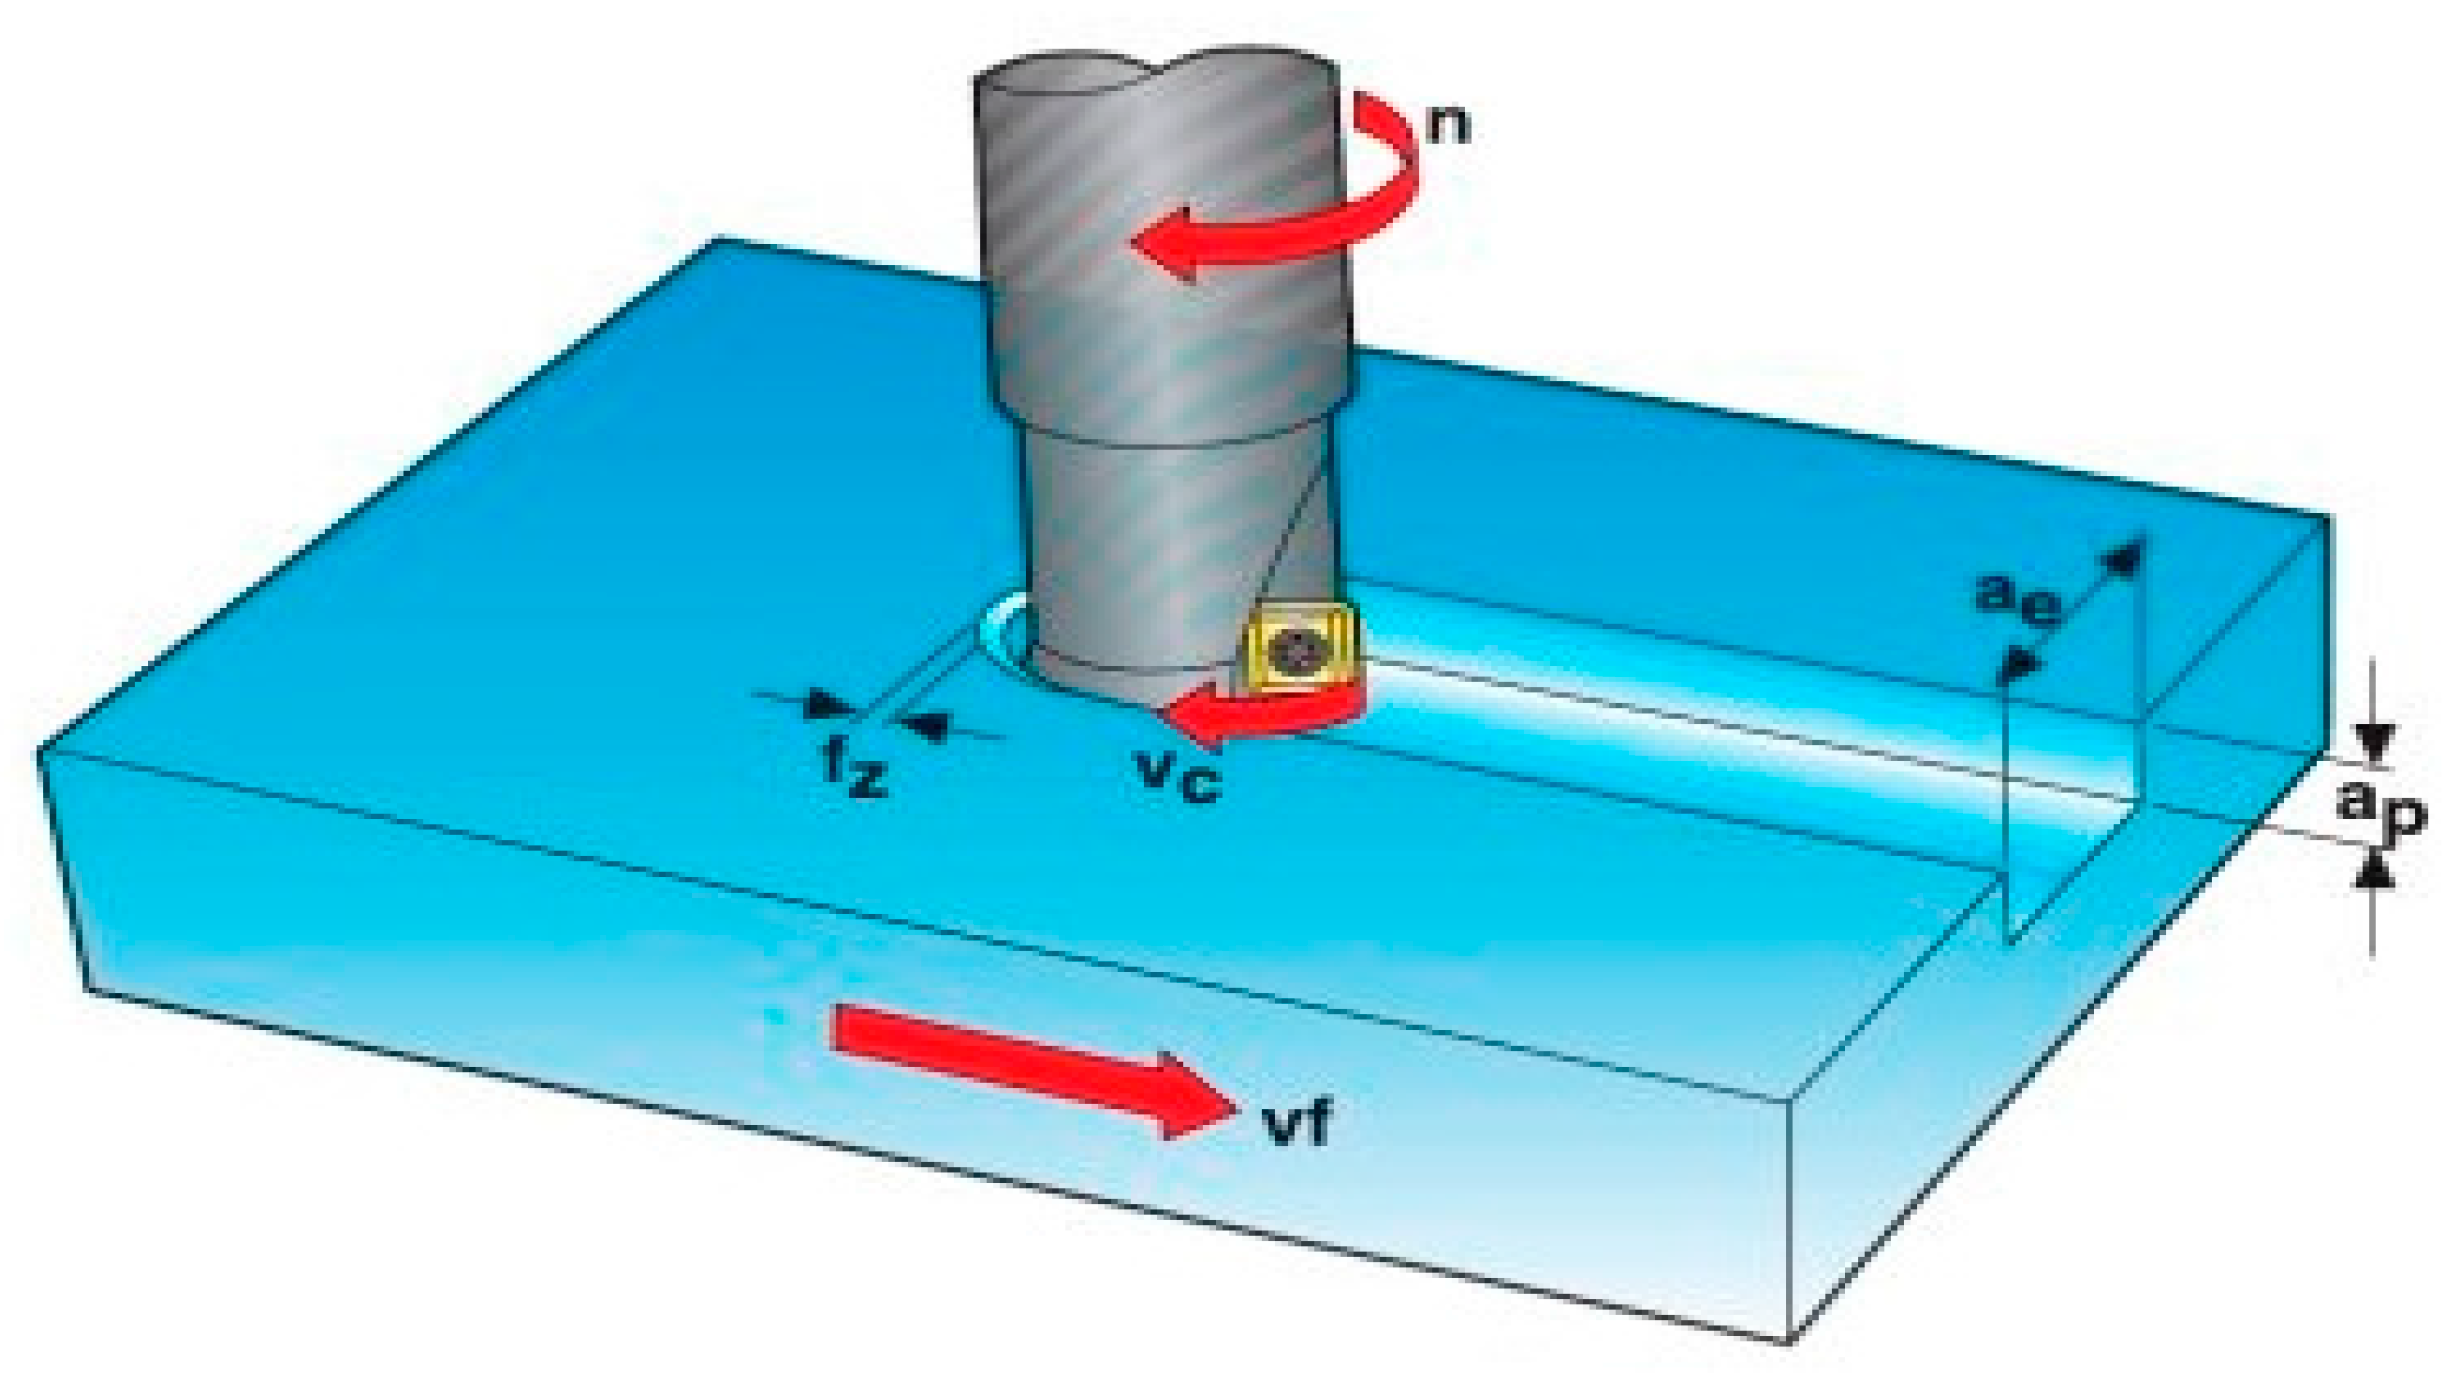
5.2. The Dynamic Behavior of Machine Tools

As mentioned in Section 2.2, machine tools can encounter free vibrations, forced vibrations and self-excited vibrations (chatter) during operating. Free vibrations and forced vibrations are less destructive compared to chatter. Chatter is induced and maintained by forces generated from the cutting process [25]. For example, increasing spindle speeds may result in the onset of chatter. Chatter can create large cutting forces and thus may accelerate tool wear and even cause tool failure, resulting in vibrations of the machine tools. In order to analyze chatter’s dynamic behavior of machine tools, the rigidity and stability are two important characteristics that need to be taken into account. The conditions of rigidity and stability of the machine tools can cause vibrations during machining processes. The rigidity or stability changes resulted from several phenomena including (1) chip thickness variation; (2) penetration rate variation; and (3) cutting speed variation. Each of these phenomena, in turn, is caused by several input parameters during operations (see Figure 5). For example, the chip thickness variation is affected by (a) the number of teeth (n), (b) the diameter of the cutter (de) or the radial tool engagement (ae), and (c) the depth of cut/axial depth of cut (ap). The penetration rate variation is affected by (a) the feed per tooth (fz) and (b) the feed speed (vf). The cutting speed variation is affected by (a) cutting speed (vc) and (b) revolutions per minute (n-rpm).
Figure 5. An example of a milling process.
Information 07 00007 g005

5.3. Identifying Input and Output Variables
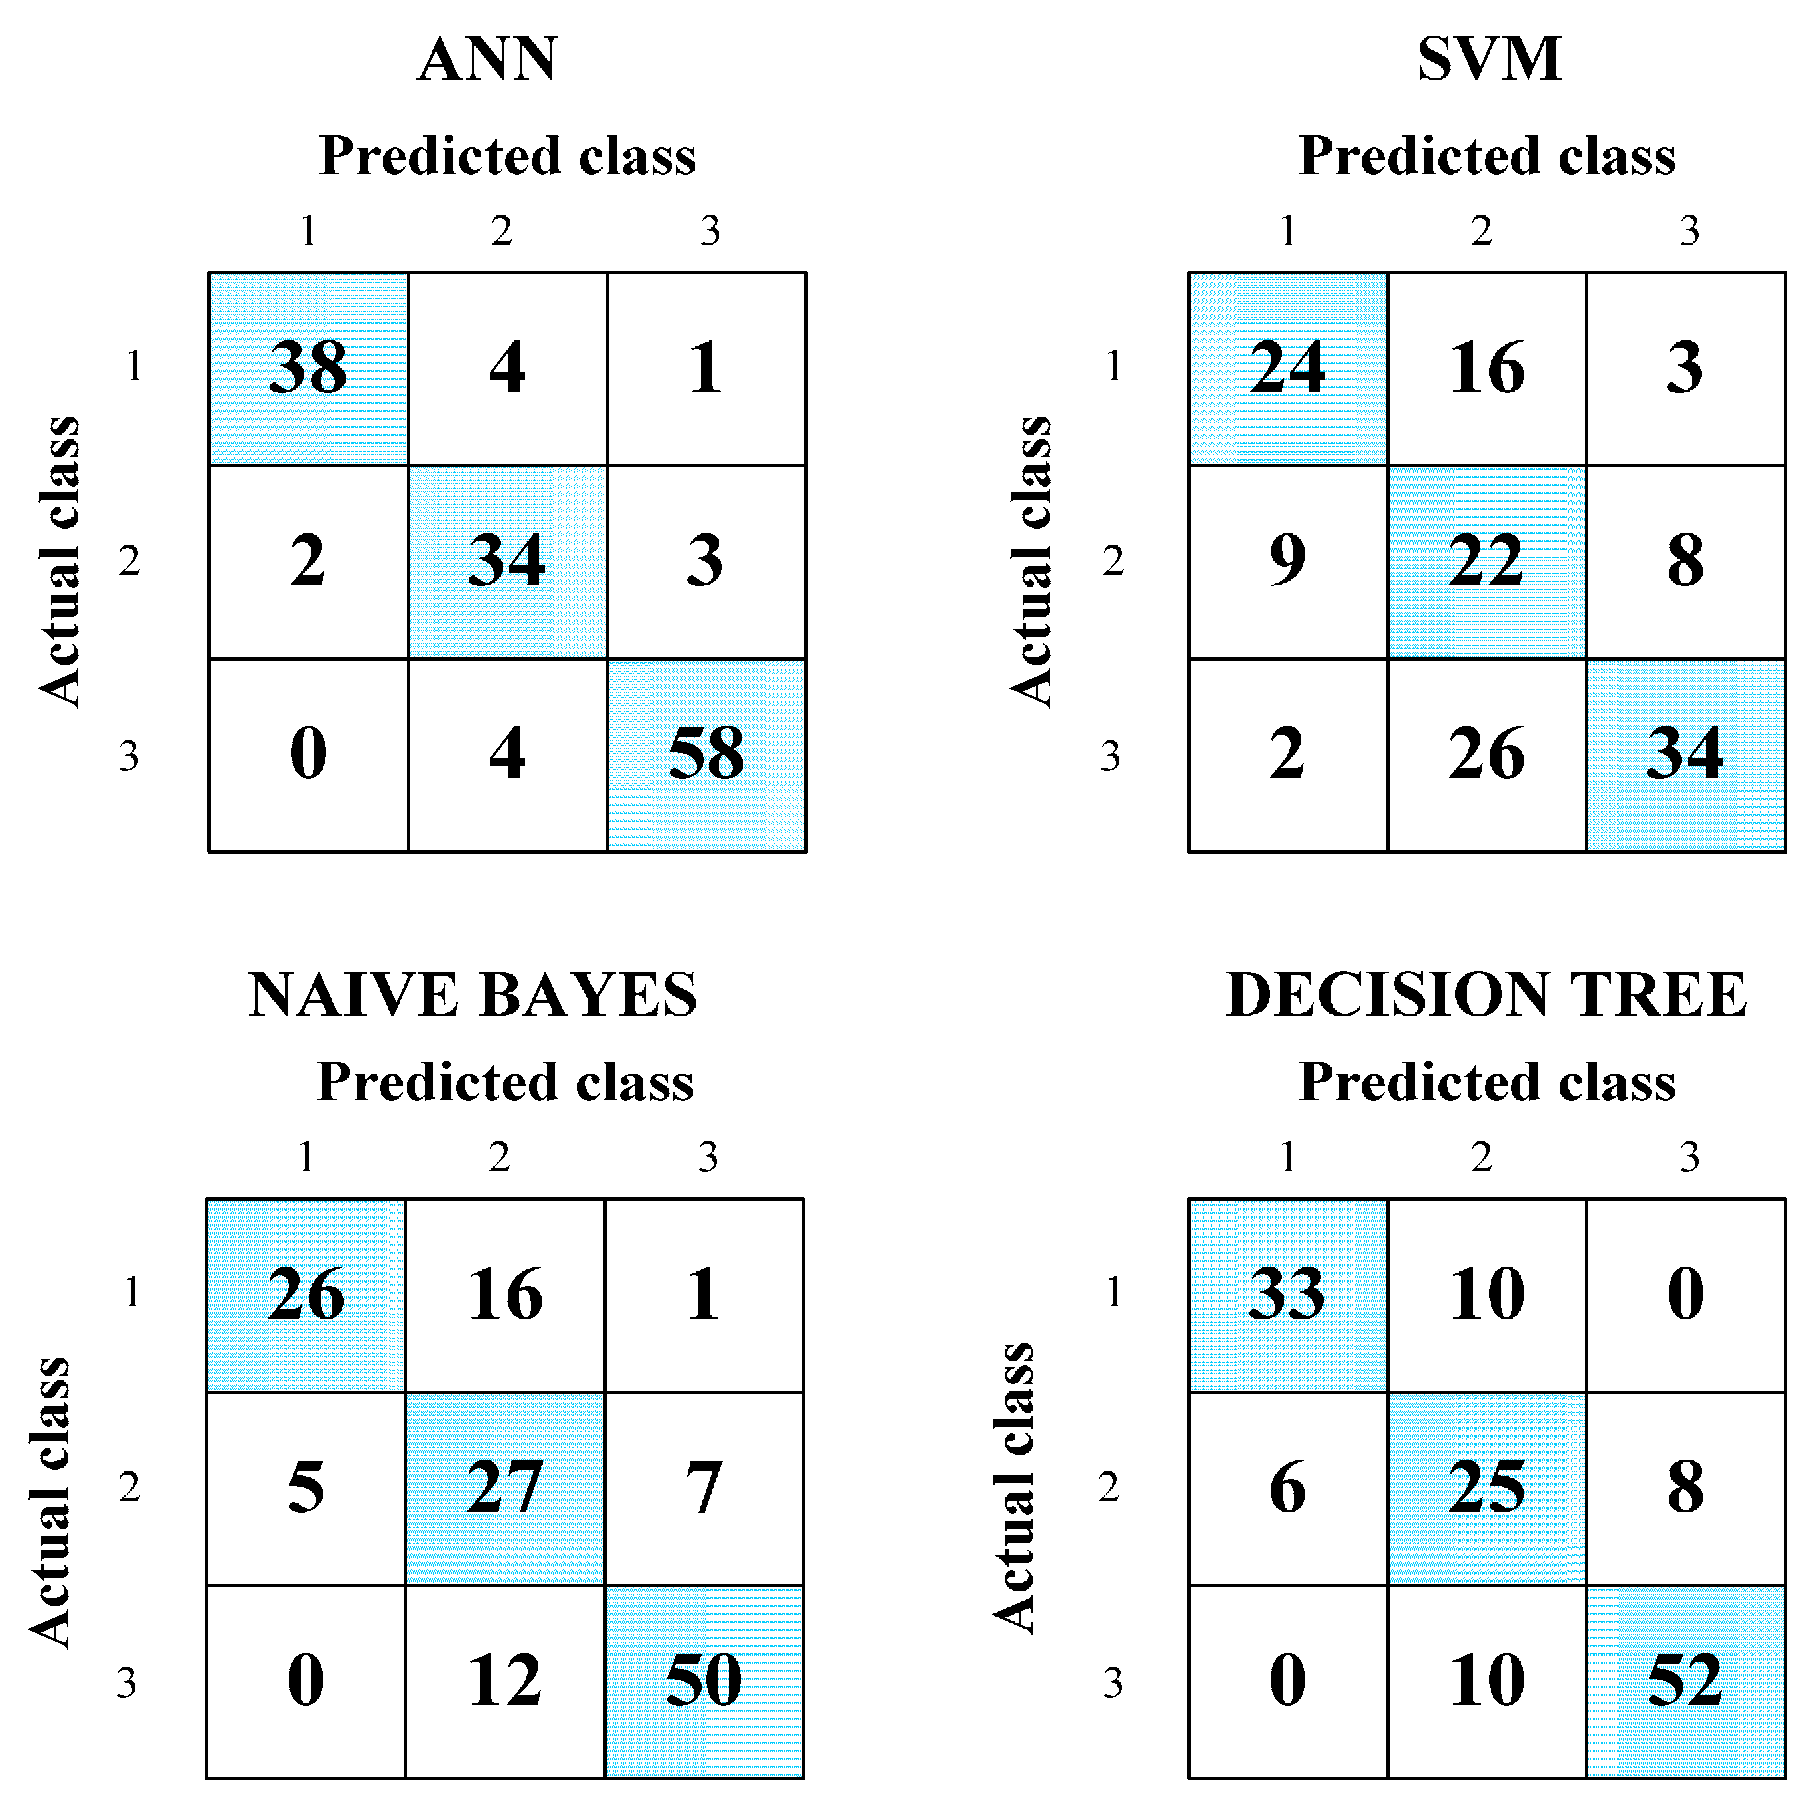
Based on the discussion in Section 5.2 and on a literature review, seven input variables that may affect the vibrations of machine tools during machining were identified. These input variables are (1) the number of teeth (n); (2) the diameter of the cutter (de) or the radial tool engagement (ae); (3) the depth of cut/axial depth of cut (ap); (4) the feed per tooth (fz); (5) the feed speed (vf); (6) the cutting speed (vc); and (7) the revolutions per minute (n-rpm).
The final step of all classification approaches is to assign each data an appropriate output (class label). According to the description at the top of Section 5, the class labels were defined as 1, 2, and 3 for Vibration, Light Vibration, and No Vibration, respectively.

6. Results

The models were coded and implemented in the Matlab environment (Matlab R2013b). In the experiment, a 10-fold cross validation method was employed to avoid over-fitting. In the process, the training dataset was divided into 10 subsets. Each classifying combination was trained 10 times. Each time, one of the 10 subsets served as the validation set and the remaining subsets were treated as the training sets. The classifying combination having the highest accuracy on the validation set (based on averaging over 10 runs) was selected.
Different neural network architectures with different numbers of hidden layers and neurons were investigated. The Levenberg-Marquardt algorithm [26] was used to train the neural networks. The performance was measured using mean squared error, and the network architecture with the highest efficiency was selected. The selected architecture consisted of a single hidden layer with 9 neurons. After training and validating, the ANN classifier was tested using the testing dataset. The efficiency of the classifier was determined by comparing the predicted and actual class labels for the testing dataset. The results show that the overall accuracy of the ANN classifier was 90.27%.
To assess the performance of the ANN, the results obtained by the ANN classifier were compared with those obtained by other classification approaches. The 10-fold cross validation method was also used to select the classifier combinations. The prediction accuracy of the SVM classifier for the testing dataset came out to be 55.56%. For the naive Bayes classifier, the prediction accuracy was 71.53%. The classification and regression tree (CART) algorithm was used for constructing the decision tree model. The obtained accuracy for the decision tree classifier was 76.39%. The performance of these approaches for the classification of vibration classes are summarized in Figure 6, together with confusion matrices. When these results are compared with those obtained by the ANN model, it can be seen that the ANN classifier outperformed the SVM, naive Bayes, and DT classifiers .Based on these results, it is concluded that the ANN model is capable of effectively classifying the vibration conditions.
Figure 6. Confusion matrices obtained by different classification approaches.
Information 07 00007 g006

7. Conclusions

By classifying vibration conditions into different classes, factories are able to provide better managing services. Thus, a classifier that can correctly classify cutting vibration is a necessity for any machine tool factory. Although there are various classifiers, however, increasing the classification accuracy is still a subject of great importance. In this study, an ANN model to classify the vibration conditions is proposed. The classification accuracy of the model was evaluated by comparing it with other well-known classifiers, including SVM, Naive Bayes, and DT classifiers. The obtained results demonstrated that the ANN model outperformed the others. It is hoped that this study may be used as a reference for different machining processes to predict cutting vibrations. It is also expected that this study can make a significant contribution to the machine tool industry.

Acknowledgments

This research was funded by the National Science Council of Taiwan under Grant No. MOST 103-2221-E-035-052.

Author Contributions

Jeng-Fung Chen conceived of the work. Quang Hung Do conducted the literature review. All of the authors developed the research design and implemented the research. The final manuscript has been approved by all authors.

Conflicts of Interest

The authors declare no conflict of interest.

References

  1. Zhu, J.; Ni, J.; Shih, A.J. Robust machine tool thermal error modeling through thermal Mode concept. J. Manuf. Sci. Eng. 2008, 130. [Google Scholar] [CrossRef]
  2. Whalley, R.; Abdul-Ameer, A.; Ebrahimi, M.; El-Shalabi, S. Adaptive machine tool system regulation. Control Theory Appl. IET 2009, 3, 33–48. [Google Scholar] [CrossRef]
  3. Altintas, Y. Research on metal cutting, machine tool vibrations and control. J. Jpn. Soc. Precis. Eng. 2011, 77, 470–471. [Google Scholar]
  4. Kruth, J.-P.; Van Ginderachter, T.; Tanaya, P.I.; Valckenaers, P. The use of finite state machines for task-based machine tool control. Comput. Ind. 2001, 46, 247–258. [Google Scholar] [CrossRef]
  5. Cho, D.W.; Leeb, S.J.; Chu, C.N. The state of machining process monitoring research in Korea. Int. J. Mach. Tools Manuf. 1999, 39, 1697–1715. [Google Scholar] [CrossRef]
  6. Meredith, D. Practical tool condition monitoring. Manuf. Eng. 1998, 120, 34–39. [Google Scholar]
  7. Westkämper, E.; Westerbusch, R. The Diagnosis and monitoring system DIAMANT. Product. Eng. 1993, 1, 131–134. [Google Scholar]
  8. Nakai, M.E.; Aguiar, P.R.; Junior, H.G.; Bianchi, E.C.; Spatti, D.H.; D’Addona, D.M. Evaluation of Neural Models Applied to the Estimation of Tool Wear in the Grinding of Advanced Ceramics. Expert Syst. Appl. 2015, 42, 7026–7035. [Google Scholar] [CrossRef]
  9. D’Addona, D.; Segreto, T.; Simeone, A.; Teti, R. ANN Tool Wear Modelling in the Machining of Nickel Superalloy Industrial Products. CIRP J. Manuf. Sci. Technol. 2011, 4, 33–37. [Google Scholar] [CrossRef]
  10. Leone, C.; D’Addona, D.; Teti, R. Tool Wear Modelling through Regression Analysis and Intelligent Methods for Nickel Base Alloy Machining. CIRP J. Manuf. Sci. Technol. 2011, 11, 327–331. [Google Scholar] [CrossRef]
  11. Ko, T.J.; Jung, M.Y. On-line monitoring of tool breakage in face milling using a self-organized neural network. J. Manuf. Syst. 1995, 14, 80–90. [Google Scholar] [CrossRef]
  12. Ko, T.J.; Dong, W.C. Cutting state monitoring in milling by a neural network. Int. J. Mach. Tools Manuf. 1994, 34, 695–676. [Google Scholar] [CrossRef]
  13. Ko, T.J.; Dong, W.C. Adaptive Optimization of Face Milling Operations Using Neural Networks. J. Manuf. Sci. Eng. 1998, 120, 443–451. [Google Scholar] [CrossRef]
  14. Ko, T.J.; Dong, W.C. Adaptive modelling of the milling process and application of a neural network for tool wear monitoring. Int. J. Adv. Manuf. Technol. 1996, 12, 5–13. [Google Scholar] [CrossRef]
  15. Siddhpura, M.; Paurobally, R. Experimental investigation of chatter vibration in facing and turning process. Int. J. Mech. Aerosp. Ind. Mechatron. Manuf. Eng. 2013, 7, 84–89. [Google Scholar]
  16. Choudhury, S.K.; Goudimenko, N.N.; Kudinov, V.A. On-Line control of machine tool vibration in turning. Int. J.Mach. Tools Manuf. 1997, 37, 801–811. [Google Scholar] [CrossRef]
  17. Ema, S.; Marui, E. Theoretical analysis on chatter vibration in drilling and its suppression. J. Mater. Process. Technol. 2003, 138, 572–578. [Google Scholar] [CrossRef]
  18. Quintana, G.; Garcia-Romeu, M.L.; Ciurana, J. Surface roughness monitoring application based on artificial neural networks for ball-end milling operations. J. Intell. Manuf. 2011, 22, 607–617. [Google Scholar] [CrossRef]
  19. Debeljak, M.; Dzeroski, S. Decision Trees in Ecological Modelling in Modelling Complex Ecological Dynamics; Springer: Berlin/Heidelberg, Germany, 2001. [Google Scholar]
  20. Sharma, A.; Kumar, R.; Varadwaj, P.K.; Ahmad, A.; Ashraf, G.M. A comparative study of support vector machine, artificial neural network and Bayesian classifier for mutagenicity prediction. Interdiscip. Sci. Comput. Life Sci. 2011, 3, 232–239. [Google Scholar] [CrossRef] [PubMed]
  21. Bahler, D.; Stone, B.; Wellington, C.; Bristol, D.W. Symbolic, neural, and Bayesian machine learning models for predicting carcinogenicity of chemical compounds. J. Chem. Inf. Model. 2000, 40, 906–914. [Google Scholar] [CrossRef]
  22. Hornik, K.; Stinchombe, M.; White, H. Universal Approximation of an unknown Mapping and its Derivatives Using Multilayer Feed-forward Networks. Neural Netw. 1990, 3, 551–560. [Google Scholar] [CrossRef]
  23. Cybenko, G. Approximation by superposition of a sigmoid function. Math. Control Signals Syst. 1989, 2, 303–314. [Google Scholar] [CrossRef]
  24. Abdi, H.; Valentin, D.; Edelman, B.; O’Toole, A.J. A Widrow-Hoff Learning Rule for a Generalization of the Linear Auto-associator. J. Math. Psychol. 1996, 40, 175–182. [Google Scholar] [CrossRef]
  25. Siddhpura, M.; Paurobally, R. A review of chatter vibration research in turning. Int. J. Mach. Tools Manuf. 2012, 61, 27–47. [Google Scholar] [CrossRef]
  26. More, J.J. The Levenberg-Marquardt algorithm: Implementation and theory. Lect. Notes Math. 2006, 630, 105–116. [Google Scholar]

