Article

Optimization of China Crude Oil Transportation Network with Genetic Ant Colony Algorithm

Transportation Management College, Dalian Maritime University, Dalian 116026, Liaoning, China
*
Author to whom correspondence should be addressed.
Information 2015, 6(3), 467-480; https://doi.org/10.3390/info6030467
Submission received: 12 June 2015 / Revised: 30 June 2015 / Accepted: 3 August 2015 / Published: 12 August 2015
(This article belongs to the Special Issue Swarm Information Acquisition and Swarm Intelligence in Engineering)

Abstract

:
Taking into consideration both shipping and pipeline transport, this paper first analysed the risk factors for different modes of crude oil import transportation. Then, based on the minimum of both transportation cost and overall risk, a multi-objective programming model was established to optimize the transportation network of crude oil import, and the genetic algorithm and ant colony algorithm were employed to solve the problem. The optimized result shows that VLCC (Very Large Crude Carrier) is superior in long distance sea transportation, whereas pipeline transport is more secure than sea transport. Finally, this paper provides related safeguard suggestions on crude oil import transportation.

1. Introduction

China has experienced an increasing demand for crude oil in recent years due to its economic boom. According to the report of International Energy Data and Analysis by the U.S. Energy Information Administration, China became the largest global energy consumer in 2011 and is the world’s second-largest oil consumer behind the United States. The country was a net oil exporter until the early 1990s and became the world’s second-largest net importer of crude oil and petroleum products in 2009. In 2012, China imported 271 million tons of crude oil in total, mostly from The Middle East, Africa, Russia and the Asian-Pacific. However, 90% of imported oil is carried by maritime transportation; the risk factors en route and the single mode of transportation place constraints on China’s oil supply. Thus, the construction of a reliable crude oil import network is important for the safety of the national crude oil import channel.
In the past few decades, the safety of crude oil transport and optimization of the transportation network have received much attention. Douligeris et al. [1] described the development model of US oil maritime transportation; risk assessment and response measures for oil spills and pollution are analysed in detail. Hamzah and Basiron [2] made suggestions for maritime transportation channel safety through analysis of security factors for maritime transportation in the Malacca strait area. David [3] and other Western scholars devoted more attention to the phenomenon of piracy. They discussed the threat to sea channels from piracy and proposed a number of measures to prevent piracy and armed robbery. In addition, the International Maritime Bureau is advised to play a more important role so that the countries involved can come together to address the piracy crisis. Asian scholars are more concerned about the safety of international shipping channels within their area. Ji [4] reviewed the security status of the Straits of Malacca and the maritime transportation channel of the Asia-Pacific, respectively. Safety factors were analysed and were divided into categories; in addition, proposals and ideas on the protection of maritime transportation security were provided. Valencia [5] devoted more attention to the dispute-prone areas, such as the South China Sea, and provided relevant policy recommendations. As the political and cultural environment of the oil export countries has an impact on transportation safety, some researchers have also shown interest for the impact of diversification of crude oil imports on transportation safety. Lesbirel [6] proposed diversifying oil imports to reduce risk. Leiby [7] suggested that oil import diversification can reduce the crude oil transportation risk caused by disasters, terrorist attacks, war, regime change and so on. Related to this research content, Alhajji [8] summarized the energy security policies in developed countries: supplier diversity, source of diversification, reducing dependence on Middle Eastern oil and reducing volatility. Konoplyanik [9] added that diversification does not mean the diversification of energy suppliers. In terms of the research purpose, Vivoda [10] and other researchers demonstrated the importance of diversity to the importing country’s safety using as examples the United States, China, Japan and other developed countries. Stringer [11] extended the issue; he distinguished the diversification of energy sources and the diversification of suppliers. With respect to the diversification of imports, Jia et al. [12] systematically classified the safety factors influencing the national crude oil import maritime transportation channel and provided advice for factors combing national policy. Wang [13] from Dalian Maritime University applied the Back Propagation Nerve Network to conduct a risk assessment on national crude oil import maritime transportation.
Concerning the optimization of crude oil transportation, Neiro and Pinto [14] established a mathematical optimization model for the operation of the oil supply chain. Iakovo [15] set up a multi-objective model of maritime oil transport route optimization and risk minimization, which achieves the optimization of both transportation routes and risk. Chen and Zhang [16] from Shanghai Maritime University adopted a non-linear programming method to optimize the network of crude oil imports dominating maritime transportation routes. Chu [17] from Dalian Maritime University built a multi-objective programming model based on the objects of minimized transportation cost and risk to analyse the network of crude oil maritime transportation in batch.
As mentioned above, the research on crude oil import transportation has thus far mainly focused on maritime transportation with no consideration for other methods, i.e., pipelines. This article covers both maritime and pipeline transportation of crude oil imports. On one hand, from the perspective of quality, this article analyses the risk factors for the national crude oil import transportation channel. On the other hand, from the perspective of quantity, it sets up an integrated layout that is also the basis for the advice on safety raised herein through the multi-objective programming model with minimized total costs and risks.
This paper is organized as follows: Section 2 describes the current national crude oil import transportation channel. Section 3 analyses the risk factors for the national crude oil import channel. Section 4 proposes a multi-objective programming model for optimizing the national crude oil transportation network. Section 5 provides solution details and results analysis. Section 6 provides the conclusion.

2. Current National Crude Oil Import Transportation Channel

A reliable oil import transportation network is of great importance to the security of China’s oil imports. China has three ways of transporting crude oil. First, it is transported by sea. This is mainly for oil-producing countries and regions, which are far from China and have no land borders, such as the Middle East, Africa. Second, the oil is transported by pipeline to China. This model is mainly applied to oil exporting countries, such as Russia, Kazakhstan and other countries in Central Asia that neighbour China. Third, oil can be transported by rail, which is convenient to neighbouring countries and regions with railway connections to China, such as Mongolia and the Russian Far East. Figure 1 shows the three modes import oil transportation.
Figure 1. Forms of Transportation for Chinese Oil Imports.
Information 06 00467 g001

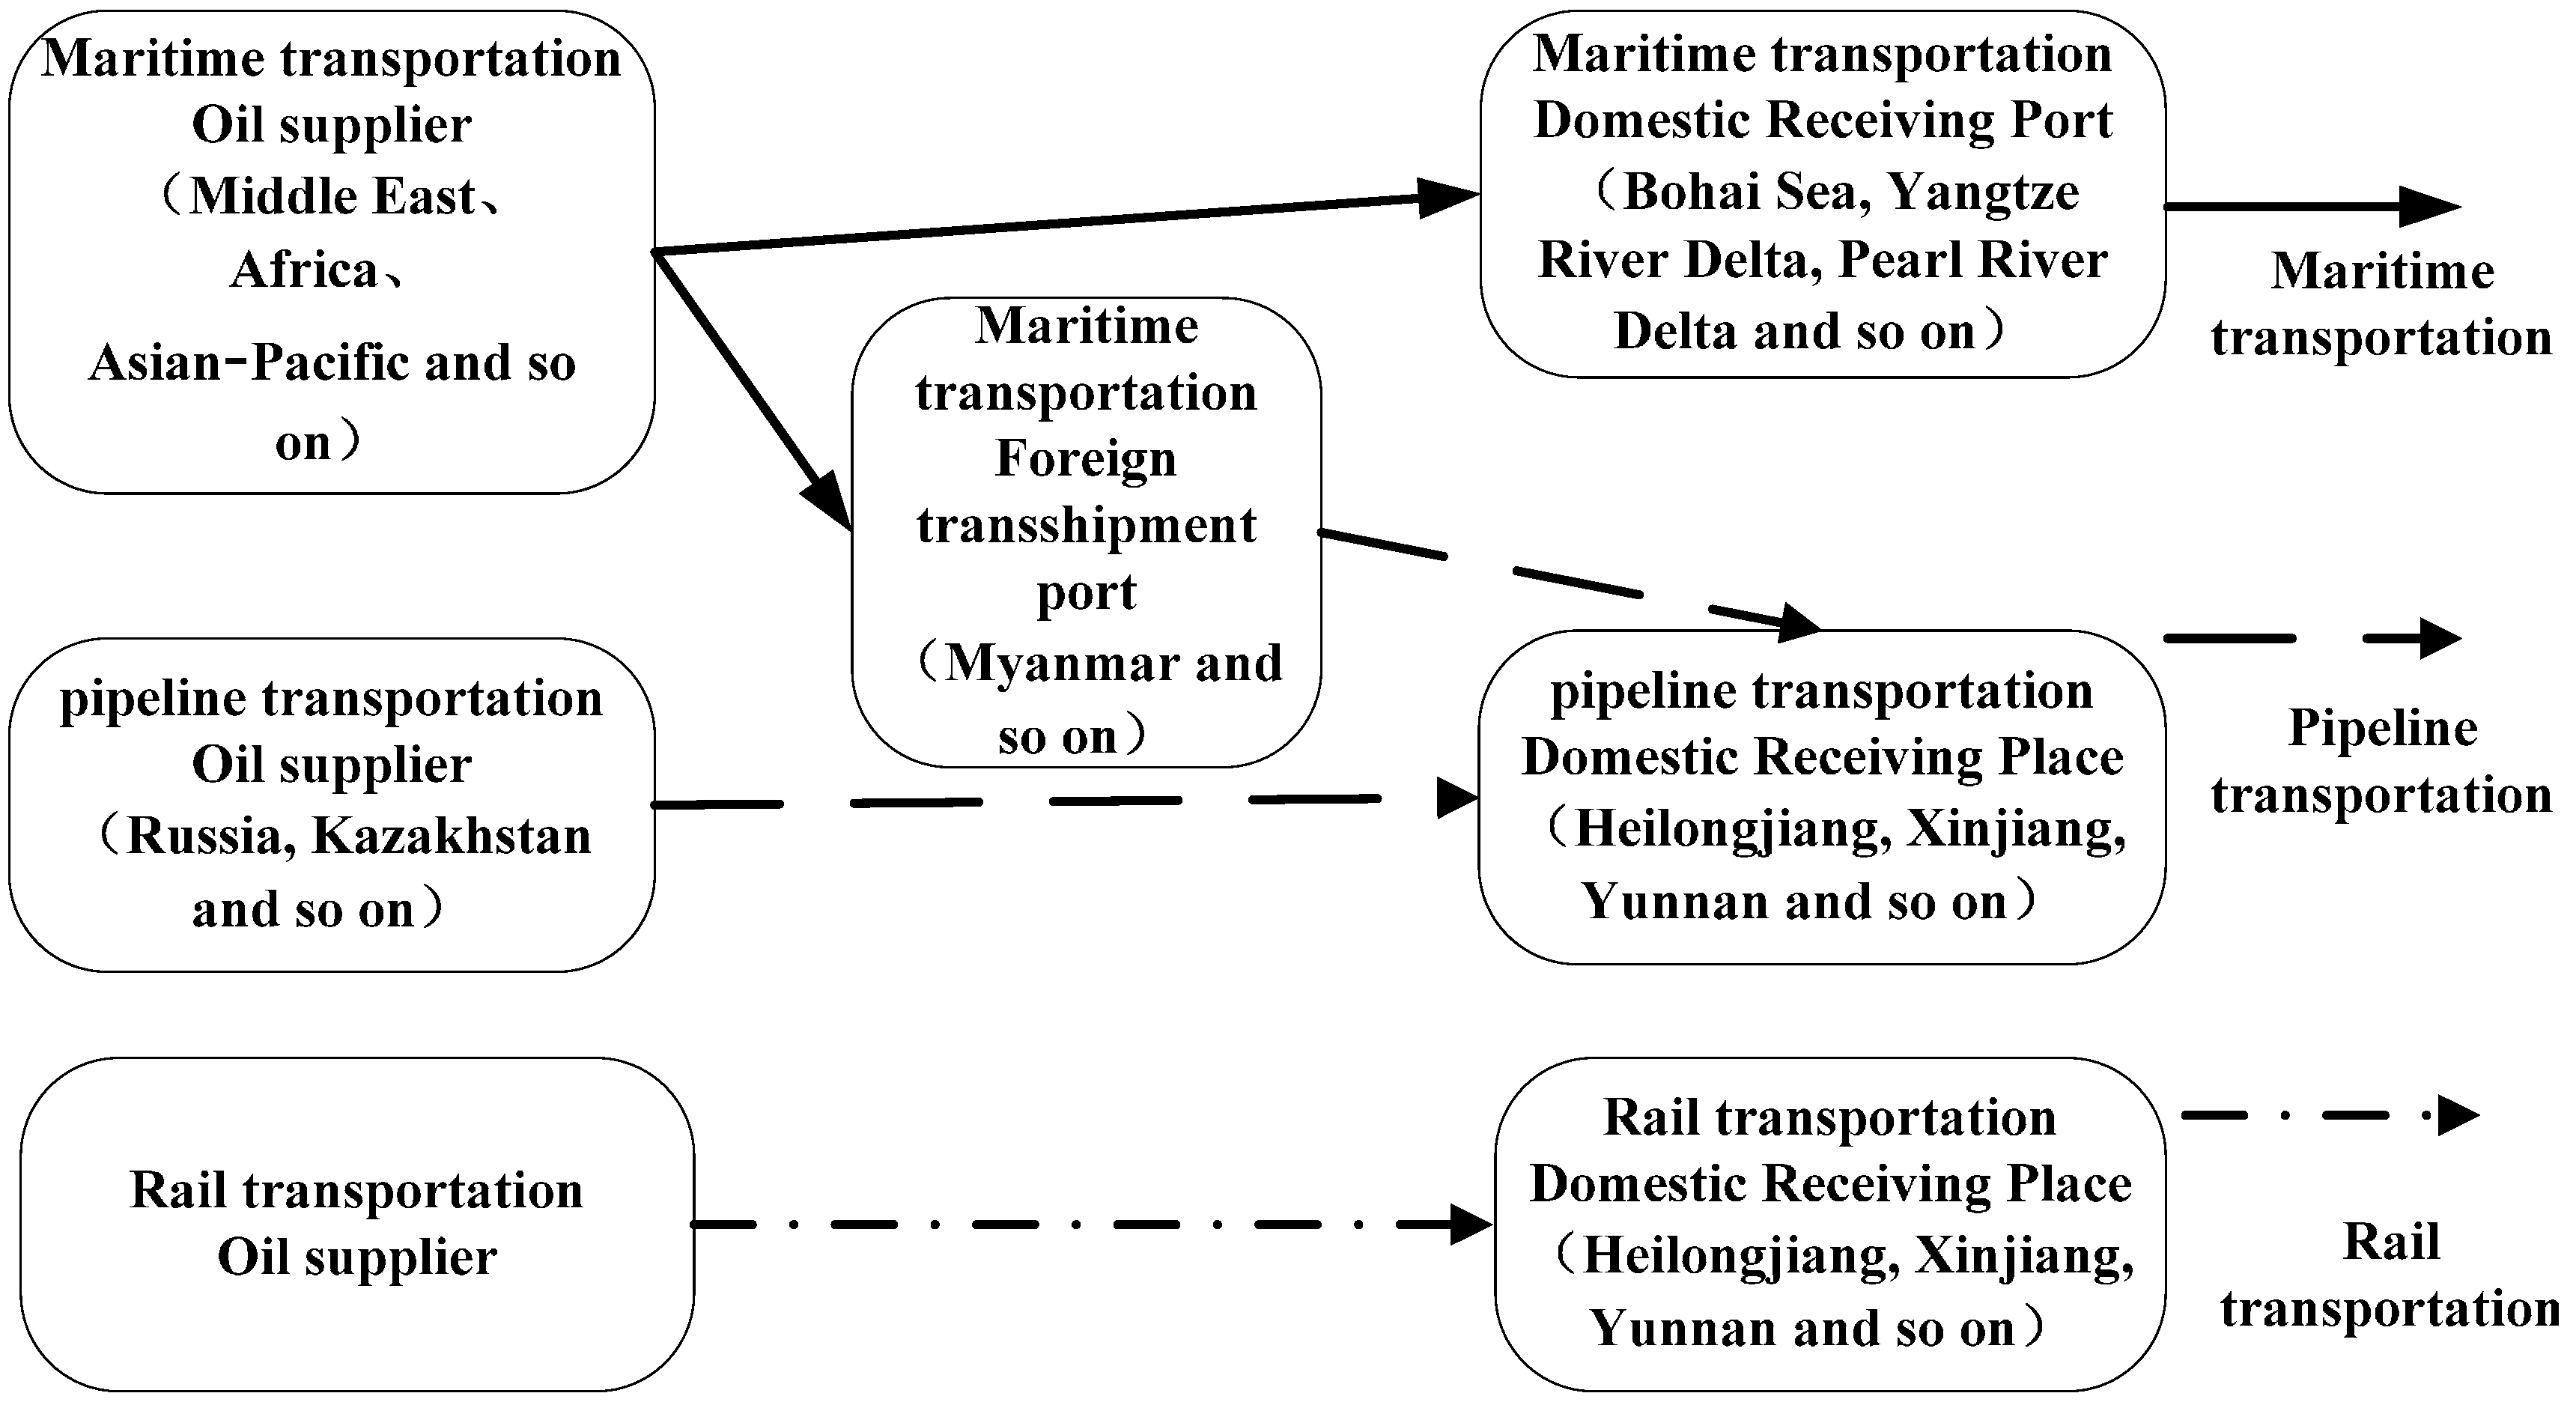
2.1. Maritime Transportation

More than 90% of China’s crude oil imports is by maritime transportation. Currently, there are three primary routes: (1) Persian Gulf-Hormuz Strait-Malacca Strait-China; (2) North Africa-Mediterranean-Strait of Gibraltar-Cape of Good Hope-Malacca Strait-China; and (3) West Africa-Cape of Good Hope-Malacca Strait-China, as shown in Table 1.
The Malacca Strait, the Taiwan Strait, the Bab el-Mandab, the Strait of Hormuz, the Suez Canal, etc., have a significant impact on China’s oil import routes. The Strait of Hormuz is the world’s most important oil chokepoint because of its daily oil flow of 17 million barrels per day in 2013. Energy Information Administration estimates that more than 85% of the crude oil that moved through this chokepoint went to Asian markets, most of which went to China’s. Thus, with the rapid growth in China’s oil imports, the strategic position of the Strait of Malacca in China’s oil security has become increasingly prominent. It can be seen that importing by sea is relatively simple, with a high degree of dependence on the Malacca Strait and Cape of Good Hope.
Table 1. Routes of China’s crude oil imports by maritime transportation.
RoutesDetails of the Routes
Persian GulfPersian Gulf-Hormuz Strait-Malacca Strait-China
North AfricaNorth Africa-Mediterranean-Strait of Gibraltar-Cape of Good Hope-Malacca Strait-China
West AfricaWest Africa-Cape of Good Hope-Malacca Strait-China

2.2. Pipeline

Pipeline transportation is a major mode of importing oil, mainly for transport over land, which has the advantages of large transport volumes, safety, convenience, economy, stability and others. It is an important complement to transportation by sea.
With the completion of the China-Myanmar pipeline project, three strategic crude import inland channels have been formed and situated in the Northwest, Northeast and Southwest. In the Northwest channel, there is the China-Kazakhstan pipeline project and the Middle Asia natural gas pipeline project; in the Northwest channel, the China-Russia crude and gas pipeline; and in the Southwest channel, the China-Myanmar crude and gas pipeline.

2.3. Rail

Rail transport is an important supplement of marine transportation and pipeline transportation. The volume of rail transportation is limited, and transportation costs are higher, but, sometimes, maritime transportation is not viable or there is no pipeline, and rail transportation is thus the only option. In the long term, rail transportation is not expedient.
At present, there are two lines for rail imports; one is Russian Irkutsk-China Manzhouli, and the other is Kazakhstan-China Xinjiang Alashankou. Since the opening of the pipeline, the rail volumes have gradually fallen.

3. Analysis of Risk Factors for the National Crude Oil Import Channel

3.1. Risk Factors for the Maritime Transportation Channel

To provide an overview of the previous studies [18,19,20,21,22,23], the safety of maritime transportation is affected by supply risk, price risk, transportation risk and other risk. This paper gives more attention to the supply risk, transportation risk. Thus, the first tier of risk factors can be summarized. The risk factors of war and regional conflict, geopolitics and international situation, import source stability represent the supply risk, and the other risk factors of terrorism and pirates, transportation distance, weather and sea state, traffic capacity refer to the transportation risk. In order to explain the first tier of risk factors preferably, this paper gives seventeen second tier of risk factors. The risk factors of the maritime transport channel are shown in Table 2.
Table 2. Risk factors for marine transportation of crude oil imports.
Risk Factors (First Tier)Risk Factors (Second Tier)
war and regional conflict (A)racism (A1)
resource competition (A2)
sea territory conflict (A3)
geopolitics and international situation (B)geopolitics change (B1)
international conflict change (B2)
terrorism and pirates (C)seaborne terrorist attack (C1)
terrorist active area en route (C2)
import source stability (D)monopoly of crude supply (D1)
international cooperation (D2)
maritime conventions (D3)
transportation distance (E)passage (E1)
weather and sea state (F)severe weather condition (F1)
sea geography (F2)
sea chart and document preparation (F3)
traffic capacity (G)strait or canal en route (G1)
island en route (G2)
ship density en route (G3)

3.2. Risk Factors of Pipeline Transportation Channel

Factors affecting the safety of oil pipeline transportation are derived from the following aspects: (1) safety of the pipeline, mainly the design, construction procedures and defects after application; stress-corrosion cracking (SCC) for the underground pipe is one of the most important factors of the pipeline system. (2) Sabotage is usually a safety concern of third parties, i.e., theft of oil, damage to construction projects on the ground. (3) Natural disasters and force majeure, a non-ignorable factor. Hurricane Katrina caused heavy damage and interrupted crude and gas production in the US Gulf.

4. Optimizing the National Crude Import Transportation Network Under the Multi-Objective Programming Model

4.1. Assumptions

(1)
The research period is set to 1 year.
(2)
Take no consideration of crude purchase costs and only focus on optimizing transportation costs.
(3)
Risk for the crude import transportation channel in this article only refers to pirate attacks in the Malacca Strait.
(4)
Include the China-Myanmar pipeline project in the model because of its importance.

4.2. Multi-Objective Programming Model

The goal of this paper is to minimize the total travel cost and overall risk; thus, there are two objectives. This paper therefore applies the multi-objective programming model.
Objective function 1: Minimize the total annual cost of the crude transportation network. Annual total cost includes the transportation costs from the supply port via seaborne transportation to port transhipment or receiving port, costs from port transhipment or receiving port via pipeline to the final destination of consumption, and costs from the supply side via pipeline to consumption.
M i n   Z 1 = i = 1 p j = 1 q k = 1 l C i j k × X i j k + i = p + 1 m r = 1 u C i r × X i r + ( i = 1 p t = 1 v k = 1 l C i t k × X i t k + t = 1 v r = u + 1 n C t r × X t r ) = i = 1 p j = 1 q + v k = 1 l C i j k × X i j k + i = p + 1 m + v r = 1 n C i r × X i r
Objective function 2: Minimize the risk from crude oil supply risk and seaborne transportation risk.
M i n   Z 2 = i = 1 p ξ i j = 1 q + v k = 1 l X i j k + i = 1 p j = 1 q + v k = 1 l ξ i j k X i j k
j = 1 q + v k = 1 l X i j k Q i , i = 1 , 2 , ... , p
r = 1 u X i r Q i , i = p + 1 , ... , m
i = 1 p k = 1 l X i j k F j , j = 1 , 2 , ... , q , ... , q + v
i = 1 p t = 1 v k = 1 l X i t k = t = 1 v r = u + 1 n X i r
X i j k 0 , i = 1 , 2 , ... p , j = 1 , 2 , ... , q + v , k = 1 , 2 , ... , l
X i r 0 , i = p + 1 , ... , m + v , r = 1 , 2 , ... , n
where I is the aggregation of the crude supply area, I = { i I | i = 1 , 2 , ... , p , ... , m } . J is the aggregation of crude import receiving ports, J = { j J | j = 1 , 2 , ... , q } . R is the aggregation of crude import pipeline receiving places, R = { r R | r = 1 , 2 , ... , u , ... , n } . T is the aggregation of crude import transhipment ports, T = { t T | t = 1 , 2 , ... , v } . K is the aggregation of crude import tanker size, K = { k K | k = 1 , 2 , ... , l } . X i j k is the import crude volume carried by size k tanker from supply area i via seaborne transportation to receiving ports j . X i r is the import crude volume from supply area i via pipeline to pipeline receiving places r . C i j k is the transportation unit cost of tanker size k carrying crude from supply area i via seaborne transportation to crude import receiving ports j . C i r is the transportation unit cost from crude supply area i via pipeline to pipeline receiving place r . ξ i is the risk factor of i crude supply ξ i j k is the transportation risk factor using size k tanker to carry crude imports from supply area i to crude import receiving ports j .

4.3. Calculation of Risk Factor

4.3.1. Risk Factor of Crude Oil Supply

The article takes the crude oil supply interruption as random and adopts exponential distribution f ( x ) = 1 e a x ; the random variable is sustained event t and event impact r .
Table 3 shows the interruption cases of world oil supply including period, volume, percentage of production, region and last time between 1951 and 1980. Middle East is the region which has the most interruption cases. It has twelve cases between 1951 and 1980, and the other cases happened in Africa between 1970 and 1971. As for the last time of net month of supply cut off, the first case and the last case have the longest last time, they lasted for 12 and 44 month, respectively, which have a serious effect on oil supply safety, especially for the last case, because the volume of oil is large. Adopting statistical methods and through regression analysis, cumulative distribution probability density f ( t ) and f ( r ) for random variables t and r are obtained. In accordance with traits of exponential distribution, the cost factor of supply risk is
E ( ξ ) = n N × φ t × φ r × 365 12 × ρ

4.3.2. Risk Factor of Seaborne Transportation

This article assumes pirate attacks in the Malacca Strait as the crude import seaborne transportation risk, and transhipment via Myanmar is excluded. Further, the higher the ship freeboard is, the more difficult it is to abduct. Therefore, ship size is the best index of pirate risk assessment. x is the ship freeboard, and the cumulative probability function of the pirate abduction is [24]:
P ( x ) = 1 1 + e ( a x + b )
In accordance with ship size and number of pirate encounters in January 2003 and December 2007, Table 4 is obtained by formula calculation.
Table 3. Interruption cases of world crude oil supply.
PeriodVolume/mbpdPercentage of Production/%Last Time (Net Month of Supply Cut Off)Region
1951.03–1954.100.73.544Middle East
1956.11–1957.0329.54Middle East
1966.12–1967.030.723Middle East
1967.06–1967.0825.42Middle East
1970.05–1971.011.32.69Africa
1971.04–1971.080.61.25Africa
1973.03–1973.050.50.92Middle East
1973.10–1974.032.64.46Middle East
1976.04–1976.050.30.52Middle East
1977.05–1977.060.71.11Middle East
1978.11–1979.043.55.46Middle East
1980.10–1980.123.35.23Middle East
1990.08–1990.104.673Middle East
1994.04–2000.033.37.712Middle East
Table 4. Distribution list for freeboard height and cumulative probability of piracy.
Ship SizeFreeboard RangeAverageFrequencyCumulative FrequencyCumulative Probability
Handysize1.5–2.01.7549490.1701
2.0–2.52.2522710.2465
2.5–3.02.7526970.3368
3.0–3.53.25281250.4340
3.5–4.03.75531780.6181
Panamax4.0–4.54.25312090.7257
4.5–5.04.75162250.7813
Aframax5.0–5.55.25212460.8542
5.5–6.05.75212670.9271
Suezmax6.0–6.56.2522690.9340
6.5–7.06.7592780.9653
7.0–7.57.2502780.9653
VLCC7.5–8.07.7502780.9653
8.0–8.58.2512790.9688
8.5–9.08.7572860.9931
ULCC9.0–9.59.2522881.0000
a and b are obtained through log i t alternation linear regression; and the cumulative probability density of a tanker under pirate attack p ( x ) is calculated in accordance with the traffic capacity of crude oil import seaborne transportation in the Malacca Strait ε the cost factor of the pirate risk for different size of tanker is:
ξ i j k = C i j k × ε k × x 1 x 2 p ( x )

5. Model Solving Method and Result Analysis

5.1. Data Preparation

Crude oil import volume by supply region (10,000 tons): (1) Middle East—11,950; (2) Africa—6690; (3) Asia Pacific—1258; (4) Russia—1849; (5) Kazakhstan—1121. Handling capacity of receiving port and transhipment port (10,000 tons): (1) Bohai Bay area—15,780; (2) Yangtze River delta area—12,300; (3) Pearl River delta area—4800; (4) Myanmar (transhipment)—2200. Crude oil import pipeline annual receiving capacity (10,000 tons) and unit cost ($/ton): China-Russia pipeline annual capacity 3000, unit cost 17.43. China-Kazakhstan pipeline annual capacity 2000, unit cost 31.78. China-Myanmar pipeline annual capacity 2200, unit cost 21.61. Crude oil import seaborne transport unit cost as shown in Table 5.
Table 5. Unit cost of shipping transport (unit: US dollar per ton).
Route1-11-21-31-42-12-22-32-43-13-23-33-4
Size
Panamax////////12.6410.788.89/
Aframax23.4721.8119.5913.2////9.858.416.93/
Suezmax17.0715.8614.249.6////////
VLCC11.2410.459.386.3217.316.515.412.57////

5.2. Model Solving—The Genetic Ant Colony Algorithm

The basic idea of the model solution is to transform the double goal programming model into a single objective programming model by a linear combination treatment. Double target network optimization problem solving has been a more difficult problem class; according to the research results, this type of problem is NP (Nondeterministic Polynomial)-Hard, so the type of classical optimization model is powerless. This paper constructs a genetic algorithm based on the following genetic colony ant algorithm for the reference of the relevant research results, as shown in Table 6.
Table 6. The Genetic Process of Model Solving.
StepContent
Step 1Randomly generate the initial population of the shipping line programs
Step 2For each individual program k , the original optimization model is equivalent to a linear programming model; to solve the problem under program k conditions, obtain the lowest oil import program to get (existing traffic) X i j k β , X i r β and the minimum cost of the program. This (generalized cost transportation system) z = α z 1 + β z 2 is the individual fitness of program k
Step 3Perform a crossover and mutation operation to obtain the new population
Step 4Check whether the genetic algorithm termination condition is satisfied: | min ( z k ) av g ( z k ) | < ε , where min ( z k ) represents the maximum value of the current population of individual fitness, a v g ( z k ) represents the average individual fitness of the current population, and ε is the termination threshold. If the termination condition is satisfied, the algorithm terminates, else perform Step 2.
The above algorithm is basically the same as the traditional genetic algorithm process, the only difference is the following: When calculating the fitness, we use the linear programming method to optimally calculate the different modes of transportation volume. This approach allows us to not have to think much about how to express the design algorithm coding but only to consider the encoding method for the route network. Below, we highlight the encoding method that is the most central part of the algorithm: the route network.
Unlike other water transport networks, oil transportation networks are usually relatively simple; two end points with a roundtrip transport is its main mode. For this feature, we design the coding method as shown in Figure 2. Each individual coding is constituted of two parameters, where parameter 1 is used to represent the oil exporter choice. For example, in this case, oil exporter 1 and 2 are selected, so that the gene loci bits 1 and 2 of parameter 1 are 1; because oil exporter 3 is unchecked, the gene bit 3 of parameter 1 is 0. The selection mechanism of Parameter 2 is similar to Parameter 1, and its function is to filter the oil importer. For example, in Figure 2 the ports 1, 2, 3 are selected so that the corresponding funds bit is 1, while port 4 is unchecked, so the gene loci bits 4 is 0 of parameter 2.
Figure 2. Diagram of Coding Method.
Information 06 00467 g002
The final question is how to link the exporter and importer. Actually, this problem is a VRP (Vehicle Routing Problem) problem; the only difference between our problem and the classic one is that we need to consider the oil supply capacity of each exporter. In view of this, we reference Zhan [25] and use the ant colony algorithm to solve this problem.
The ant colony algorithm is inspired by the true nature of ant colony foraging behaviour, which was first proposed in 1992 by Italian scholars Dorigo M. It is a heuristic algorithm that can be used to solve combinatorial optimization problems. After many studies, researchers found that individual ants transfer information through a substance called pheromone. In the course of movement, ants can leave pheromones in their path and tend to move in the direction of a high intensity of pheromones. Based on the principle of the ant colony algorithm and Zhan’s ideas [25], the specific algorithm is as follows:
When the algorithm starts, the ants randomly distribute in the oil export paces; then, according to Equation (12), the savings between every two oil exporters is calculated, which expresses the cost savings by merging two oil exporters; then, according to Equation (13), the transition probability is calculated, which refers to the likelihood of the ant to select oil export h after the selection of g. Finally, let the ants search a path in two phases according to the probability: The first phase is from the start of oil exports to the search for oil imports, and the second stage is from the oil imports to the search for and selection of oil exporters.
q gh = d gm + d h m d g h
q represents savings, d represents the cost, m is on behalf of oil imports, and g,h represents oil exporters.
p gh = { [ τ g h ] [ q g h ] β s Ψ [ τ g h ] [ q g h ] β , l g Ψ , Ψ = { l g L : l g } 0 , otherwise
τ gh represents pheromones; α, β are two parameters used to represent the importance of pheromones and savings.
After all ants complete the path construction, according to Equation (14), the pheromone is updated.
τ gh = ( 1 ρ ) τ g h s + μ = 1 λ 1 Δ τ g h μ + λ Δ τ g h *
1 ≤ ρ ≤ 0 represents the evaporation rate of the pheromone; λ represents the number of elite ants.
However, it should be noted that here we allow the existence of a link with the oil import port, in this case port 4; as the oil output place through port 3 to 4 is a close path, we will connect port 3 and port 4.
By the above genetic algorithm and utilizing MATLAB software, a fuzzy optimal solution is obtained for the crude oil import network: total cost of crude oil import transportation 332,060 ($10,000) and total risk 45,693. The transportation plan is shown in Table 7.
Table 7. Transport plan of China crude oil import.
Bohai AreaYangtze River Delta RegionPearl River Delta RegionMyanmar (Transhipment)Total (10,000 tons)
Middle EastAframax0.20.20.211.6
Suezmax0.40.40.71.12.6
VLCC4866.55267.91805.95.511,945.8
AfricaVLCC1949.42208.81753.4778.46690
Asia PacificPanamax0.40.50.7/1.6
Aframax2.919.71233.8/1256.4
Total (10,000 tons)6819.87497.54794.778619,898
China-Russia////1849
China-Kazakhstan////1121
China-Myanmar////786
In consideration of ship load and transportation feasibility, adjustment to the aforesaid plan is achieved by setting a minimum loadable for each size; the result is the total cost of crude oil import transportation 339,620 ($10,000), total risk 45,576. The adjusted transportation plan is as shown in Table 8.
Table 8. Adjusted transport plan of China crude oil imports.
Bohai AreaYangtze River Delta RegionPearl River Delta RegionMyanmar (Transhipment)Total (10,000 tons)
Middle EastAframax00000
Suezmax00000
VLCC4690.95428.51830.6011,950
AfricaVLCC1941.71923.31711.41113.66690
Asia PacificPanamax000/0
Aframax001258/1258
Total(10,000 tons)6632.67351.848001113.619,898
China-Russia////1849
China-Kazakhstan////1121
China-Myanmar////1113.6

5.3. Result Analysis

Based on Table 7 and Table 8, the following results can be determined:
(1)
In terms of transportation costs and ship load considerations, VLCC is widespread in the Middle East and Africa routes, which illustrates that the lower cost of VLCC is superior in long distance seaborne transportation. This type of tanker dominates the deployments.
(2)
The Aframax and Suezmax tankers from the Eastern-Bohai and the Middle East-Airline Yangtze River Delta region only carry 0.2 and 0.4 million tons, respectively; the Middle East-Pearl triangle routes only carry 0.2 and 0.7 million tons, and the Middle East-Myanmar port transit only carries 1 and 1.1 million tons, which is of little practical significance; these shipments can be ignored and can be supplemented in other places. Similarly, the traffic of VLCC in the Middle East-Myanmar transit, Panamax and Aframax in the Asia-Pacific routes are also very little, which can be ignored.
(3)
The Bohai area and Yangtze River Delta region mainly rely on Middle East and African crude oil imports, and discharge volume accounts for approximately 70% of total crude import seaborne transportation at the national import crude receiving centre.
(4)
Transit traffic in the port of Myanmar is from African routes, not Middle East routes, because oil imports from Africa are smaller than those from the Middle East. This shows that in the case of large traffic, the cost for pipeline transportation is also much larger than that of maritime transport.
(4)
The adjusted crude import transportation plan sharply increases the import volume via the China-Myanmar pipeline with a lower total risk, despite higher total transportation costs, which demonstrates the safety of pipeline transportation.

6. Conclusions

Based on the depth analysis of risk factors for China’s crude oil import transportation channel and rationalization assumptions, a multi-objective programming model for China’s crude oil import transportation network is established; its goal is to minimize the total transport cost and overall risk. Based on the genetic algorithm and ant colony algorithm as well as MATLAB software, an optimized network transportation program for crude oil imports is provided. The optimization results show that, to protect the safety of China’s crude oil import channel, the following conditions must be met:
On one hand, a rational layout for a large scale crude terminal meeting berth and discharge of VLCC-size and larger tankers will in the future improve the receiving process for crude imports. On the other hand, the construction of a diversified crude oil supply source and import channel can reduce the impact of regional political risks and regional conflicts on national crude imports, which will ensure supply stability. In addition, a new transportation channel for crude imports should be explored; land transportation should be enhanced to ease the safety concerns that stem from seaborne transportation; and a multi-layer crude import transportation network should also be established.

Acknowledgments

This work was supported by National Natural Science Foundation of China 71303026, 71302044 & 71473023, the Projects of Philosophy and Social Sciences from Liaoning Province (L13CJY049).

Author Contributions

Both authors contributed extensively to the work presented in this paper. Both authors have read and approved the final manuscript.

Conflicts of Interest

The authors declare no conflict of interest.

References

  1. Douligeris, C.; Iakovou, E.; Englehardt, J.D.; Li, H.; Ip, C.M.; Mooers, C.N.K. Development of a national marine oil transportation system model. Spill Sci. Technol. Bull. 1997, 4, 113–121. [Google Scholar] [CrossRef]
  2. Hamzah, B.A.; Basiron, M.N. The Straits of Malacca: Some Funding Proposals. In MIMA Paper; Maritime Institute: Kuala Lumpur, Malaysia, 1997; p. 67. [Google Scholar]
  3. Piracy and Armed Robbery Against Ships. Available online: http://www.imo.org/OurWork/Security/PiracyArmedRobbery/Pages/Default.aspx (accessed on 31 March 2001).
  4. Ji, G. SLOC Security in the Asia-Pacific; Asia-Pacific Center for Security Studies: Honolulu, HI, USA, 1999. [Google Scholar]
  5. Valencia, M.J. Sea of Japan: Transnational marine resource issues and possible cooperative responses. Mar. Policy 1990, 14, 507–525. [Google Scholar] [CrossRef]
  6. Lesbirel, S.H. Diversification and energy security risks: The Japanese case. Jpn J. Polit. Sci. 2004, 5, 1–22. [Google Scholar] [CrossRef]
  7. Leiby, P.N. Estimating the Energy Security Benefits of Reduced US Oil Imports; Oak Ridge National Laboratory: Oak Ridge, TN, USA, 2007. [Google Scholar]
  8. Alhajji, A.F. What is energy security? Definitions and concepts. Middle East Econ. Surv. 2007, 50, 5. [Google Scholar]
  9. Konoplyanik, A. The view from Brussels. In Emerging Threats to Energy Security and Stability; Springer: Berlin, Germany, 2005; pp. 79–86. [Google Scholar]
  10. Vivoda, V. Diversification of oil import sources and energy security: A key strategy or an elusive objective? Energy Policy 2009, 37, 4615–4623. [Google Scholar] [CrossRef]
  11. Stringer, K.D. Energy security: Applying a portfolio approach. Balt. Secur. Def. Rev. 2008, 10, 121–142. [Google Scholar]
  12. Jia, D.S.; Sun, J.Y.; Luo, H.B. Chinese importing oil marine lane safety evaluation and strategy. J. Dalian Marit. Univ. 2006, 2, 62–66. [Google Scholar]
  13. Wang, B. Analysis on the Safety of SLOCS for Crude Oil Import of China. Master’s Thesis, Dalian Maritime University, Dalian, China, June 2009. [Google Scholar]
  14. Neiro, S.M.; Pinto, J.M. A general modeling framework for the operational planning of petroleum supply chains. Comput. Chem. Eng. 2004, 28, 871–896. [Google Scholar] [CrossRef]
  15. Iakovou, E.T. An interactive multiobjective model for the strategic maritime transportation of petroleum products: Risk analysis and routing. Saf. Sci. 2001, 39, 19–29. [Google Scholar] [CrossRef]
  16. Chen, F.E.; Zhang, R.Y. Optimization of Chinese crude oil import route network. J. Shanghai Marit. Univ. 2006, 27, 75–80. [Google Scholar]
  17. Chu, L.Y. Study on Waterborne Petroleum Logistics System and Distribution & Transportation Network of China. Ph.D. Thesis, Dalian Maritime University, Dalian, China, March 2007. [Google Scholar]
  18. Neiro, S.M.S.; Pinto, J.M. A general modeling framework for the operational planning of petroleum supply chains. Comput. Chem. Eng. 2004, 28, 871–896. [Google Scholar] [CrossRef]
  19. Dempster, M.A.H.; Pedrón, N.H.; Medova, E.A.; Scott, J.E.; Sembos, A. Planning logistics operations in the oil industry. J. Oper. Res. Soc. 2000, 51, 1271–1288. [Google Scholar] [CrossRef]
  20. Al-Otheman, W.B.E.; Lababidi, H.M.S.; Alatiqi, I.M.; Al-Shayji, K. Supply chain optimization of petroleum organization under uncertainty in market demands and price. Eur. J. Oper. Res. 2007, 89, 822–840. [Google Scholar] [CrossRef]
  21. Alcantara, V.; Duarte, R. Comparison of energy intensities in European Union countries, results of a structural decomposition analysis. Energy Policy 2004, 2, 177–189. [Google Scholar] [CrossRef]
  22. Konoplyanik, A. The View from Brussels. In Emerging Threats to Energy Security and Stability; McPherson, H., Wood, W.D., Robinson, D.M., Eds.; Springer: New York, NY, USA, 2005; pp. 79–86. [Google Scholar]
  23. Stringer, K.D. Energy security: Applying a portfolio approach. Balt. Secu. Def. Rev. 2008, 10, 121–142. [Google Scholar]
  24. Shi, J.D. The Risk Assessment on the Piracy in Malacca-Singapore Straight. Master’s Thesis, Dalian Maritime University, Dalian, China, June 2009. [Google Scholar]
  25. Zhan, Y.H.; Wu, Q.J. Research on Ant Colony Optimization (ACO) for the Vehicle Routing Problem. Comput. Eng. Sci. 2008, 30, 60–62. [Google Scholar]

