Raising the Flag: Monitoring User Perceived Disinformation on Reddit


Department of Statistics and Methodology, School of Social Sciences, University of Mannheim, 68159 Mannheim, Germany
*
Author to whom correspondence should be addressed.
Information 2021, 12(1), 4; https://doi.org/10.3390/info12010004
Submission received: 1 November 2020
/
Revised: 15 December 2020
/
Accepted: 16 December 2020
/
Published: 22 December 2020
(This article belongs to the Special Issue Tackling Misinformation Online)
Abstract
:The truth value of any new piece of information is not only investigated by media platforms, but also debated intensely on internet forums. Forum users are fighting back against misinformation, by informally flagging suspicious posts as false or misleading in their comments. We propose extracting posts informally flagged by Reddit users as a means to narrow down the list of potential instances of disinformation. To identify these flags, we built a dictionary enhanced with part of speech tags and dependency parsing to filter out specific phrases. Our rule-based approach performs similarly to machine learning models, but offers more transparency and interactivity. Posts matched by our technique are presented in a publicly accessible, daily updated, and customizable dashboard. This paper offers a descriptive analysis of which topics, venues, and time periods were linked to perceived misinformation in the first half of 2020, and compares user flagged sources with an external dataset of unreliable news websites. Using this method can help researchers understand how truth and falsehood are perceived in the subreddit communities, and to identify new false narratives before they spread through the larger population.
1. Introduction
Tracking misinformation has become a task with rapidly increasing importance in recent years. Massive disinformation campaigns influencing the U.S. 2016 elections and the Brexit referendum have suggested that the spread of false information can have a large scale political impact [1,2]. Even outside a U.S. or UK context, in the last five years, democratic regimes have become more vulnerable to foreign influence efforts directed to sow mistrust in authorities [3,4,5]. Particularly during the COVID-19 pandemic, false information can influence the well-being and life of many. In the midst of rising infection rates, narratives misrepresenting official responses to the virus are among the most common in recent news [6]. The problem has become so widespread that the World Health Organization is talking about an “infodemic” (information epidemic) accompanying the spread of COVID-19 [7], and scientists have called for an interdisciplinary approach to battle misinformation [8].
For all these reasons, it is crucial to be able to detect false information in real time, shortly after it is produced and distributed. However, traditional fact checking requires trained journalists carefully examining each piece of information and labeling it individually. This is hard to do when facing a firehose of falsehood [9] directed by malicious or uninformed actors toward the online public sphere. Existing automated disinformation detection tools are often tested on pre-labeled datasets, and it is not clear how precise they can detect disinformation on unseen topics and how often the labels need to be updated. In contrast, user comments represent a self-perpetuating stream of labels that can be used to complement existing methods.
From media studies, we know that audiences are not just passive recipients of information [10,11]. Especially in online communication, we observe how social media and internet forum users are often actively involved in removing, reporting, or commenting on posts that they suspect present false information. Fact checking and reporting of misinformation are then not performed by software or external experts, but rather by the community itself. In fact, while much research is involved with the spread of misinformation [12,13,14,15,16,17,18,19], the prevention of misinformation from the user side is rarely considered. The aim of our research is to operationalize and analyze one central mechanism of gatekeeping from the user side called informal flagging.
This paper looks into the possibility of externalizing some of the labeling to users of online platforms and aims to build an easy accessible online tool to help investigate Reddit users’ claims of disinformation. Reddit is one of the largest platforms for news sharing, but it is less often studied in comparison to Twitter. Reddit is the ideal platform to perform this task for several reasons: its content is fully accessible and can be easily scraped (unlike Facebook), it is a decentralized platform covering a large number of topics and diverse perspectives from all around the world (unlike blogs, news websites or magazines), it does not limit the character input of its posts (unlike Twitter), it contains posts with links to external websites (that can be fact checked), and it has been the target of disinformation campaigns in the past [20].
We develop a rule-based natural language processing model that can extract and filter posts and comments (using keywords), and detect user flags among the comments (using part of speech tags and dependency parsing). We test the precision and recall scores of our model against a simple keyword matcher and two supervised machine learning models, on a manually labeled set of comments. While it was developed with Reddit in mind, our model is very flexible. It can be customized by adding or removing keywords or dependency rules. It can be applied to any website that has a similar structure to Reddit (text comments replying to posts), since it takes only the content of the comment as input.
For monitoring new Reddit posts, we created a Python+Plotly/Dash powered dashboard freely available online (see Section 7). It shows daily descriptive statistics about flagged posts and permits the user to filter and cluster the posts. The dashboard is named STROO? (short for “Is it true?”), as a reference to the Reddit mascot [21], the alien SNOO (short for “What’s new?”). This dashboard is updated daily, and it can serve as a source for researchers, journalists, or fact checkers to analyze the content and spread of information online. It illustrates both the merits and the downfalls of using informal flags to detect false information spread online.
2. Previous Research
2.1. Scope and Consequences of Online Misinformation
False information is ubiquitous, persistent, and potentially harmful. Rumors tend to intensify in periods of crisis, when there is a lack of official information [22]. False information spreads faster [23], is richer in emotional cues [24,25], and resurfaces more often [26] compared to true information on online platforms. Additionally, there is research claiming negative behavioral effects of exposure to disinformation and misinformation. A current example is the COVID-19 pandemic. Belief in COVID-19 related conspiracy narratives was found to increase non-compliance with public safety regulations [27,28,29], and exposure to media narratives downplaying the importance of the virus was linked to a larger number of COVID-19 cases and deaths at a regional level [30]. This is exacerbated by online platforms providing an easy channel for the spread of misinformation. On Twitter, estimates of misinformation range from 15 to 25 percent of tweets related to a specific topic [31,32]. Online social networks have reacted to such trends. Reddit, after public backlash regarding their laissez-faire handling of hate speech and misinformation on their platform, has started closing controversial subreddits [33] and investigating claims of coordinated misinformation, especially around COVID-19 [34]. Facebook after a scourge of scandals is now applying automated misinformation detection [35]. However, to our knowledge, no standardized approach to combating nor detection has been established.
2.2. Measures against Misinformation
One option to combat the spread of misinformation has been to use automated tools by employing linguistic methods, machine learning, and network-based methods [36]. Supervised machine learning is very popular for this task, but it requires labeled data for training, validating, and testing the model. There is no established way to obtain labels. Some researchers propose to use existing annotated datasets, either to label articles [19,37], specific claims and rumors [38], websites and domains [12,16,24] or even users that function as sources for (mis)information [13]. Other researchers employ manual classification on a subset of the data [14]. Still others rely on weakly labeled datasets, such as websites known to post disinformation [15]. All in all, applying even automated approaches for combating misinformation is resource heavy and expensive, and both false positives as well as false negatives abound.
On the other hand, when facing scarce resources and uncertainty, crowd based solutions have been applied on different domains, ranging from Cancer Research [39], Linguistics [40], and Organizational Learning [41]. Particularly regarding the detection of misinformation, recent results involving the decentralized ability of crowds have been promising. Rand and Pennycook [42] have found that, even when accounting for partisan bias, crowd estimates of trustworthy news sources are strongly correlated with expert estimates. Furthermore, studies presenting news stories to participants report that the majority of true stories are correctly found to be true by the participants and 80% of fabricated news are found to be false [43]. Finally, Becker and colleagues [44] have shown that, if given an incentive, participants estimate the correctness of news on average more accurately when involved in a group context than when asked alone. Classical simulation studies of learning would generally be consistent with such findings by highlighting the value of consensus as opposed to polarization, since polarization undermines the ability to detect true information [45].
2.3. Capturing User Interaction
Aforementioned studies demonstrate the demand for tracking misinformation, the technical ability to do so, and evidence of crowd based solutions that allows leveraging user interaction. However, the question remains: how can one discern user interaction regarding misinformation from interaction which is completely atopical? While providing simulations, algorithmic solutions, and experimental evidence, the literature has not, to our knowledge, accounted for specific user interaction patterns that may prevent misinformation. This point is vital, as it allows for generalizing from experimental evidence to a real life context. The crowdsourcing studies cited above, while impressive, use an artificial setting (like Amazon Mechanical Turk) and offer incentives to participants. In an actual online setting, users sanction misinformation without the necessity for reward from researchers. Crowdsourced data are generated through an obtrusive procedure, recruiting people specifically for the task of labeling. In a realistic setting, participants may belong to a community where they interact with other users. However, in order to understand whether the results of experimental studies hold in real life, one needs to first identify relevant actions: when do users react to misinformation and when are they silent. Our study allows such an identification with a relatively simple dictionary-based NLP method.
Only a few recent studies from Eastern European newspaper forums [17,46] attempt to use replies to online newspaper articles as labels for detecting content posted by non-genuine users (trolls). Such an approach gives a more realistic account of the process within online platforms that function as gated communities [47]. In such cases, users are not only consumers of information but actively fight and prevent the spread of specific information, functioning as gatekeepers. This is in line with Lazarsfeld’s classic theory of the two step flow of communication [10], in which the people’s role in mediated communication is not merely to function as homogeneous masses that are easily manipulated, but to criticize, reinterpret, and spread information they receive from mass media in their own communities. While acknowledging the increased agency afforded to the public, this theory was criticized by Bratich [11] as painting audiences as merely reactive to stimuli originating from the media, rather than active subjects capable of original cultural production. While we acknowledge that Reddit is a good illustration of the active audience model, rich in original content and subcultural spaces, we choose to focus in our research on the reactive aspect of Reddit users: not only sharing articles from news websites, but also interpreting them as purveyors of true or false information.
Our approach builds on these contributions and offers several advantages. Placed within the theoretical disinformation framework [48], this work operationalizes the concept of user flagging: a specific type of commenting (e.g., “fake news!”) to label Reddit posts as illegitimate, and thus to warn other users and moderators about the presence of false information that may breach the community standards. By identifying such flags, we can not only capture a type of interaction specific to online platforms, but also measure the effectiveness of user comments in detecting fake news. The promise of such an approach is consistent with previous literature on crowdsourcing, or harnessing decentralization for resource gathering [40]. If true information is a scarce resource and expert feedback is expensive, simple user feedback might help to detect misinformation.
This paper presents a linguistic model integrated in a dashboard that presents data about user-flagged posts from Reddit in real time, therefore measuring Reddit users’ own ability to handle misinformation during a pandemic. In the following sections, we describe our pipeline for collecting and processing the data, a test of our model against alternative approaches, as well as some descriptive analyses, including a comparison between web domains flagged by Reddit users and web domains flagged by professional fact checkers.
3. Data Collection
We collect posts and comments (text and metadata) from Reddit using the Pushshift API [49] with Python 3.6. We follow the hierarchical structure of Reddit in our data collection mechanism. On Reddit, comments are nested in posts (also called submissions), which are nested in subreddits (discussion groups hosting online communities focused on particular topics).
Reddit users can subscribe to one or more subreddits. They can post in a subreddit, or they can comment on posts from other users. In subreddits focused on news and politics, usually a user will post a link to an article from an external website, and choose a title for their post, which is not always identical to the original article title. It is mostly through these posts that false information can creep in, and through the replies to these posts (comments) that other users can point out that this has happened.
3.1. Data Collection: Selecting Subreddits
The immense amount of data available on Reddit—more than 130,000 subreddits and 10 million posts and comments per month [50]—means that a preselection is required. At the same time, the data collection needs to reflect the dynamic nature of Reddit, as new subreddits emerge periodically. The general idea at the start of the project was to select subreddits that are relevant for the spread of misinformation around COVID-19. Therefore, we daily scrape posts matching COVID-19 related terms (all terms in Appendix B). The focus is on high-engagement subreddits where real world issues are discussed. We retain the subreddits that meet the following conditions: the primary language is English, a minimum of 10,000 subscribers, a minimum 10 daily coronavirus-related posts, most posts share a link to an external website, and there is at least one comment per post (in average). The remaining subreddits are manually categorized into 10 groups, and the entertainment focused subreddits are discarded. Remaining categories are: coronavirus, news, politics, ideological, local, science, technology, health, and business. Each week, we check if new subreddits fit the criteria, classify, and include them in the list.
It is of course possible that many Reddit posts share information as part of images or videos. Previous research has shown the usefulness of combining features from textual data with features from visual data when detecting fake news [51]. We use only links because we want to focus on the sharing of news from external websites, which can be matched to lists of websites known for spreading false information. While including image recognition may be a further expansion to the dashboard, it is currently outside of our resource capacities.
3.2. Data Collection: Selecting Posts
From each subreddit, we collect all user posts daily, for further inspection (including ones removed by moderators). We retain the following variables for each post: title, author, link to Reddit URL, link to external site, date and time of post, rating/score, number of comments replying to post, and removal status. Because the status of a post can change (number of comments, removal status), we always scrape three days behind every day.
3.3. Data Collection: Selecting Comments
The number of comments can exponentially increase the size of the dataset. Therefore, we only select the comments from posts that share a link to a website (excluding images or a videos). We select the first 1000 first-level comments (direct replies to a post), assuming that, if flagging does not occur in the first 1000, it will probably not occur later. We retain the following variables for each comment: comment body (text), author, rating, date, and time it was published.
4. NLP Model for Detecting Informal Flags
Our approach to detecting posts suspicious of presenting false information is to inspect the text content of the comments that are direct replies to posts from the selected subreddits. This is not a simple task, and requires using several Natural Language Processing methods, with increased levels of complexity: keyword filtering < tokenization < lemmatisation < part of speech (POS) tagging and dependency parsing < sentence embedding (for clustering). In other studies, manual coding was employed to obtain the flags [17,46]. In this paper, we attempt to create a set of lexical and grammatical rules to determine whether a comment is likely a flag or not. The steps are illustrated in Figure 1 and described in the following subsections.
4.1. Keyword Filtering
The initial dataset of scraped comments is very large: 17 million comments from January to June 2020, increasing by more than 2 million comments each month. Before a computationally expensive matching method can be used, it is necessary to filter out irrelevant comments (as most comments are not informal flags). To reduce the amount of data to a manageable level, we retain all comments containing at least one keyword related to different types of false information. We operationalize the text of the informal flag by developing a set of six broad categories:
- disinformation or misinformation
- fake or false news
- misleading or clickbait
- unreliable
- propaganda
- bullshit/bs
The categories were selected to cover a wide definition of content associated with false information. They were developed based on terminology used in previous research [3,4,8,9,23,48,52], while also keeping in mind the less formal communication style on Reddit (hence the sixth category). The exact terms used for each category can be inspected at the end of Appendix B. Based on our observations from qualitatively inspecting a subset of the comments matching these keywords (in March–May 2020), we noticed the particularities of each type of flagging. The six categories capture different intensities (“misleading” is weaker than “fake news”, and often refers to the title of the post), targets (“misinformation” refers often to the content, “unreliable” and “propaganda” often to the source), intentions (“propaganda” assumes intention, “false news” not necessarily), or levels of ambiguity (“bullshit” may signal disbelief as well as displeasure). In the final dashboard, these categories can be activated or deactivated, allowing each user to select their own definition of false information.
4.2. POS Matching on Sentences
Keywords alone are not sufficient to establish whether a comment is an informal flag or not. Comments that are just discussing false information are mixed with those where a clear accusation is made. Enhancing the text data with syntactic and morphological information can help make this difference.
Comments were split into sentences. Then, we created a set of patterns, based on a vocabulary and grammar of the informal flag, and checked if they match each sentence. We use the POS tagger and dependency matcher for the English language from the Python package spaCy (https://spacy.io) to parse each sentence from each comment.
4.3. The Vocabulary and Grammar of Flagging
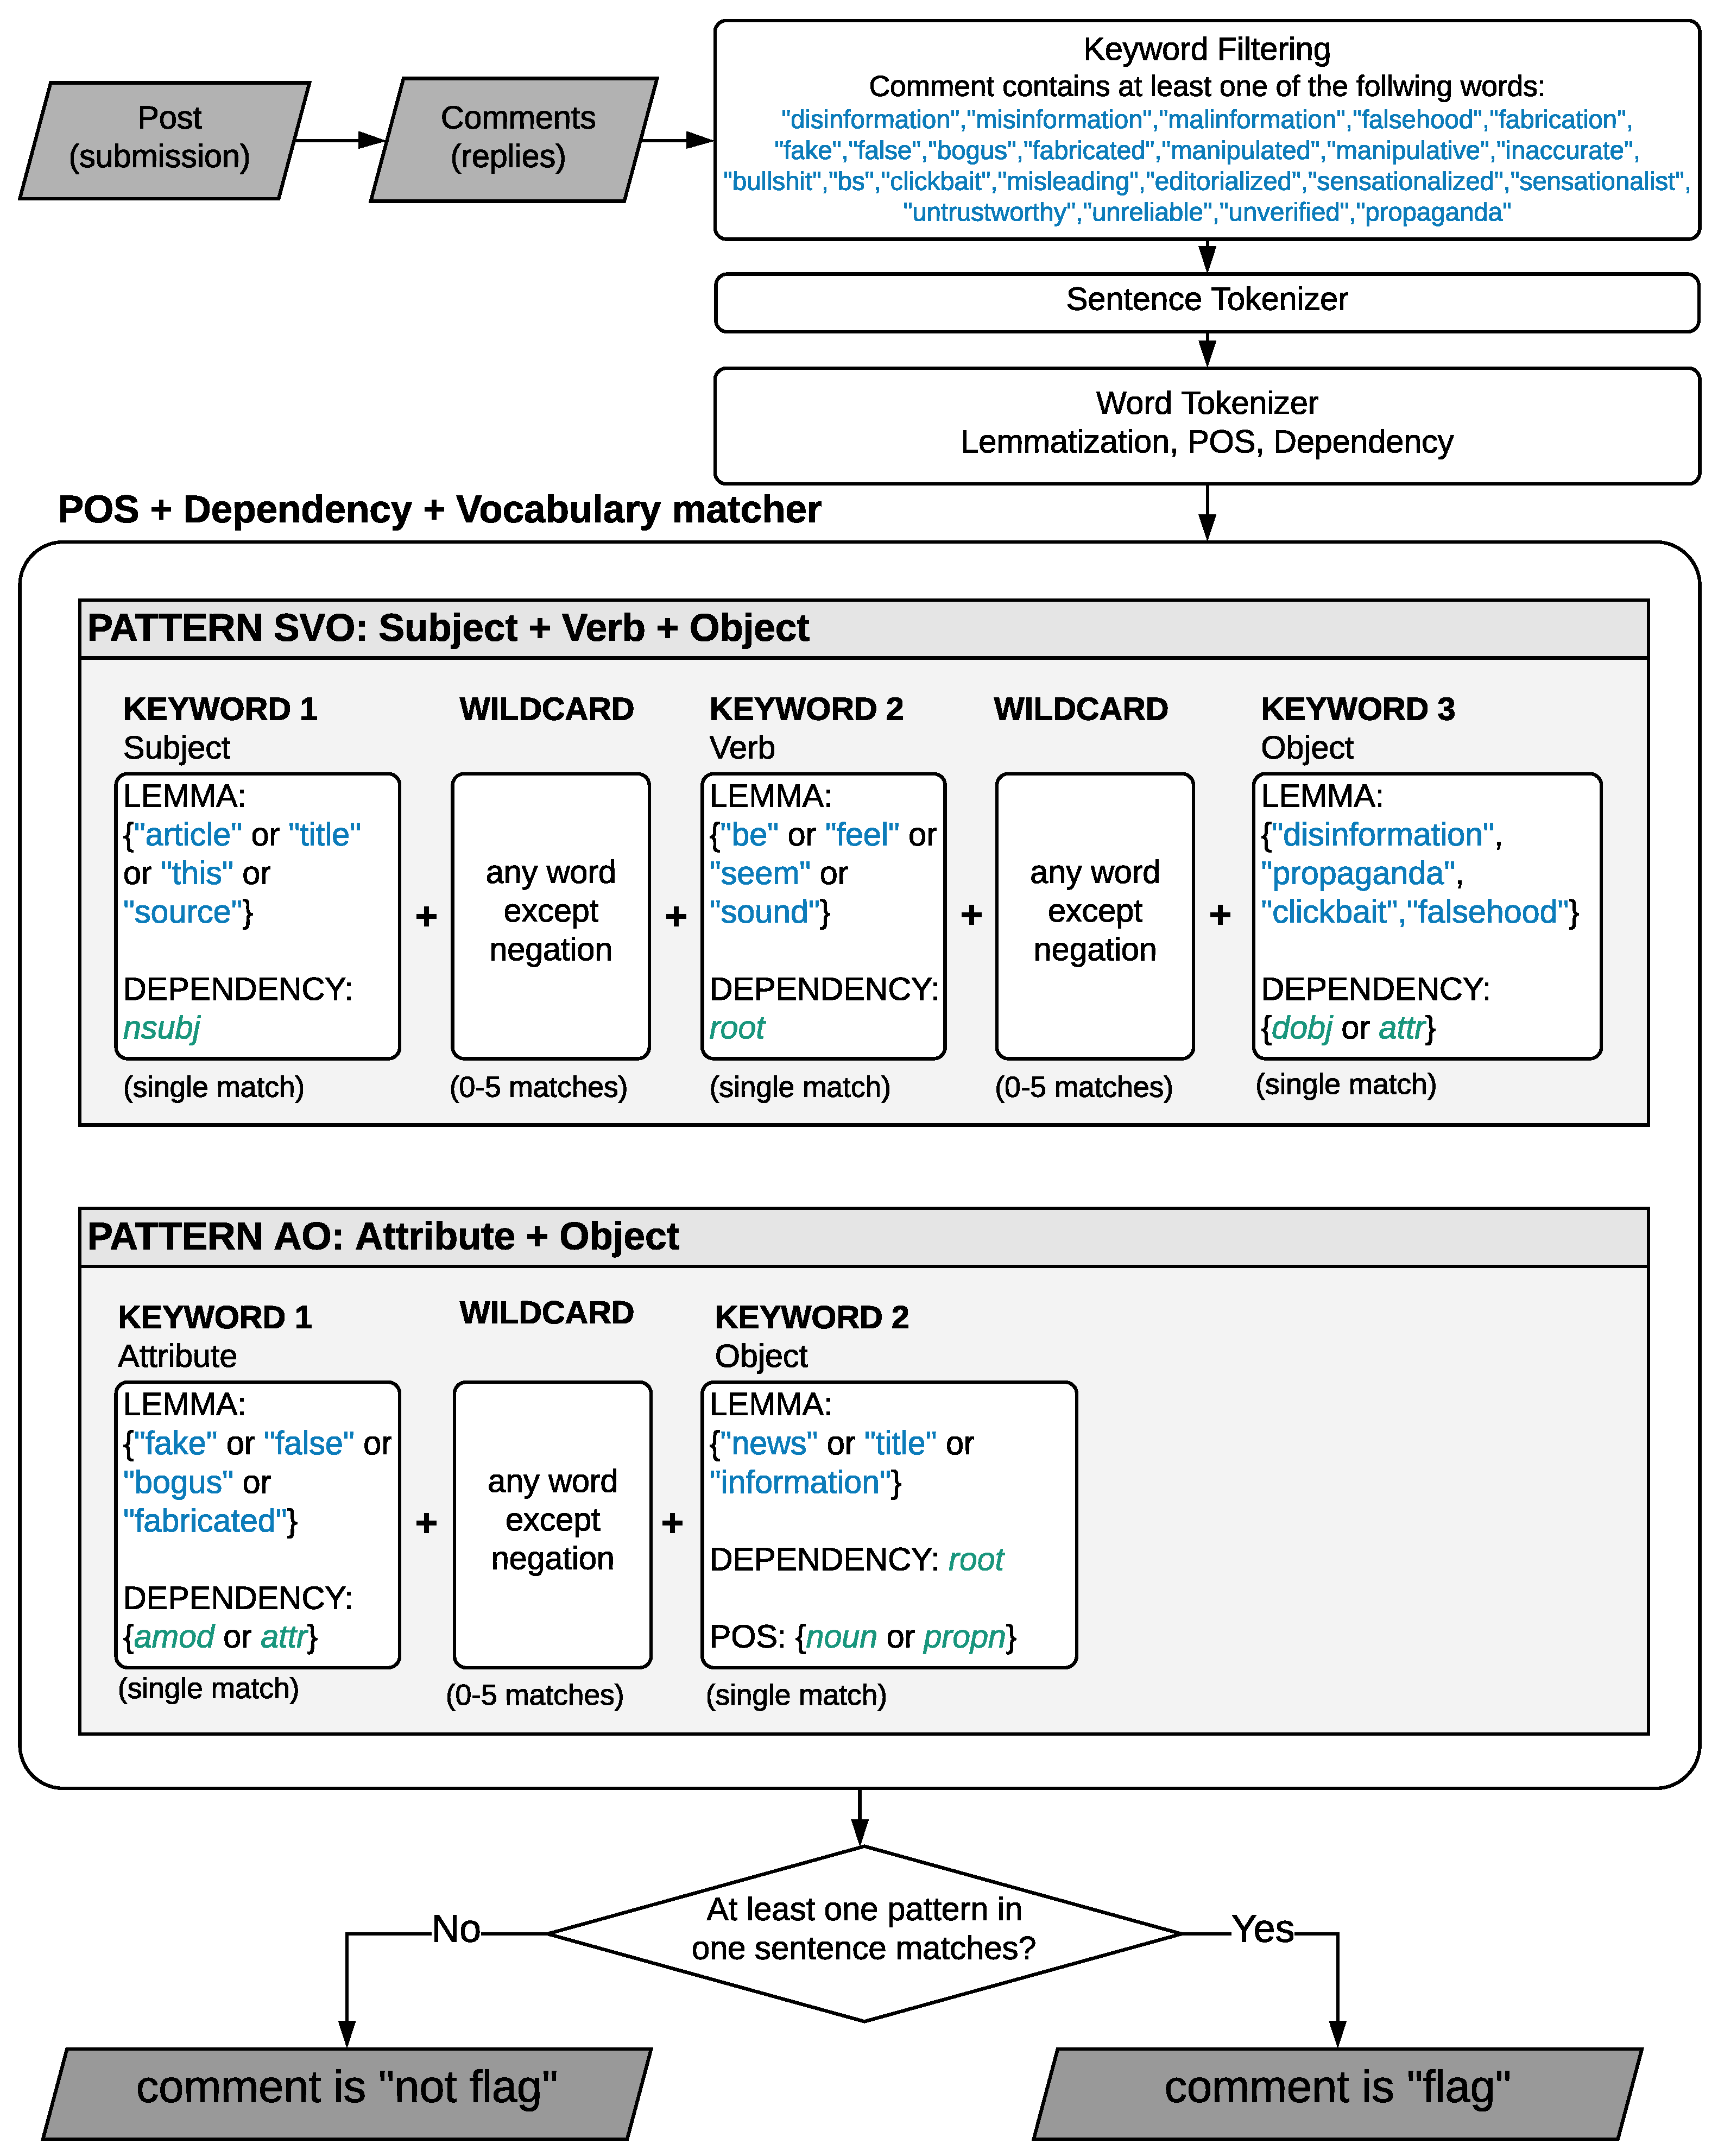
In this step, we combine the keyword filtering with the POS matching. A pattern for flag detection is a specific keyword related to misinformation (e.g., “fake news”) embedded in a grammatical structure (e.g., “This is fake news”). A flag is a comment where at least one sentence matches our pattern. For example, the ideal type of the informal flag is a simple phrase of the form SUBJECT + VERB + (ATTRIBUTE) + OBJECT, where the main clause contains the verb. “This is fake news” would match the pattern, and so would “This is disinformation”. “This is great news”, however, would not since “great news” is not part of our vocabulary concerning misinformation. In addition, while “Looks like false news” would not match this particular pattern, it would match the pattern VERB + (ATTRIBUTE) + OBJECT. Negations (“Post is not false.”) or multiple clauses (“They doubt that the source is unreliable”) do not match the pattern.
Dependency parsing is particularly useful because it codifies syntactic relationships between words, and thus we can filter out matches where the relationship is different. For example, a phrase like “Fake news is an overused trope” would not match because “news” is the subject, while a phrase like “This is fake news!” will match because “news” is the object. We identify 20 phrase structures that will help identify informal flags. A simplified example for patterns Subject–Verb–Object (SVO) and Attribute–Object (AO) is presented in Figure 1; phrases matching all patterns are shown in Table 1.
We also built a vocabulary of subjects, verbs, objects, and attributes to plug into these patterns. The full vocabulary is defined as a Python class and can be inspected in Appendix B. We distinguish between the six types of flagging mentioned in the previous subsection, depending on the main keyword used in the object (e.g., “disinformation”) or attribute (e.g., “fake”) part of the vocabulary.
The method can be overall described as POS and dependency tree enhanced skip-gram detection, but we shorten it to POS matcher. We mention skip-gram detection because the model allows the presence of (up to five) additional words between the predefined positions, matching longer phrases.
To summarize a typical sequence of our data collection and processing pipeline:
- We extract all posts from subreddits that we track every day at midnight.
- Further filtering is performed to remove comments that are sarcastic, or those replying to posts that share articles directly referencing false information. Common procedures for sarcasm detections use rule-based, statistical, or deep learning methods [53], and more recently transfer learning from sentiment to neural models has shown good results [54]. Because it is not the main focus of the paper, we use a relatively simple rule-based method, contained in a regular expression (full regex in Appendix B). It is by no means a perfect sarcasm filter, but it does manage to remove the more obvious forms (such as “Oh, this must be ’fake’ news \s”).
- We extract the top 1000 comments, and match each sentence of each comment to our keyword-flag syntax patterns. If at least one match is present in a comment, the comment is marked as a flag (Figure 1).
- Finally, all sentences that match the POS pattern are added to the database of matches. This database is updated daily, and serves as the main input in the dashboard.
The final POS matcher contains 21 patterns (named in Table 1). The POS matcher is a rule-based technique. It requires human input to define the rules. Building the patterns was an iterative process. We wrote down a list of ideal sentences that clearly signal informal flagging (such as “this post is fake news”, “not a reliable source”, “title is clickbait”). We analyzed the syntax of these sentences and set the specific dependency types (e.g., “title” should be the subject of the sentence, and not the object). The patterns were expanded to allow wildcards between the matched words (e.g., “This article is undoubtedly and clearly false.”). Negation preceding a keyword was set to not match the pattern for certain keywords (“source is not misleading”), but two patterns were created for relevant negations that should match (“source is not reliable”). Then, we tested the patterns on the list of ideal sentences. We also tested them on a list of sentences generated by us that contain the keywords, but are not likely to be flags (e.g., “propaganda is bad”, “they always talk about fake news”). Next, we tweaked the patterns (added or removed keywords or part of speech restrictions) to maximize the correct identification of the ideal sentences and minimize the identification of non-flag sentences. Finally, we matched the patterns to the most common sentences extracted from the comments in our dataset (from January to July). We made minor adjustments based on the data (removed a few patterns that had very few matches, removed some keywords that were picking up many non-flags).
We validate the POS matcher by comparing its performance to the simple keyword matcher, and then we test it against two ML models (on a separate test set of comments written after July 2020). We present the results in the following subsection.
4.4. Evaluation of the POS Matcher
To assess the performance of our POS matcher, we compare it against the baseline keyword filtering model (see Section 4.1), to check if our method shows any improvement in precision. Then, results from two machine learning models are compared to results from applying the POS matcher on a test set of newer, unseen data, to check if our transparent rule-based method performs similarly to more opaque automated classification methods.
4.4.1. Manual Labeling
To provide labels, manual annotations were performed. In total, 1500 comments were manually labeled, out of which 1455 were retained for validation and model testing. We annotated three different sets of comments (see Table 2).
We selected a stratified random sample of 600 comments from the full set of 221,750 comments (from January to July 2020) that match the keywords. For each of the six keyword groups (misleading, propaganda, fake news, unreliable, disinformation, bullshit), we randomly selected 100 comments. These 600 annotated comments serve as part of the validation set for the POS matcher. They also serve as a training set for the machine learning models we test against it.
We annotated an additional 600 comments randomly sampled from the 2603 comments (from January to July 2020) that match the POS + vocabulary patterns (again, 100 from each of the six flag types). The extra 600 comments were included to have a larger base to report precision for the POS patterns in the validation process. They are not used in training the machine learning models, to avoid bias in favor of our POS model. Training the ML models is only done on the first 600 comments (that match the keywords, but not necessarily the POS patterns).
Finally, we annotated 300 comments (6 × 50) from the full set of 522,320 comments (from August to October 2020) that match the keywords. These comments serve as the test set when comparing the performance of our POS matcher against two machine learning models. These comments were created in a time period that does not overlap with the time period in which we developed the POS matcher; therefore, we can argue that it serves as a true test set, with data that could not have influenced the way we built the POS patterns.
Two coders independently judged whether each comment is an informal flag (positive class) for false information, not an informal flag (negative class), or uncertain. Annotation was done on complete comments (many containing multiple sentences), and the coders had access to other contextual information (post title, web domain shared in post), to be able to properly judge if a comment is a flag or not. The inter-rater agreement was 83%, with Cohen’s Kappa = 0.63. The coders re-classified all disagreements by consensus, and 45 uncertain comments were excluded. In the end, 51% of comments were labeled as flags, and 49% as non flags.
All manual annotations were performed after the POS matcher was completed.
4.4.2. Comparison with Simple Keyword Filtering
We validate our POS matcher by comparing its performance to the initial keyword matcher. We expect the precision of the POS matcher to exceed that of the keyword matcher, as it was designed for this purpose. In other words, we expect that the sentences identified by the POS matcher are much more likely to signal an informal flag than the sentences identified by the keyword matcher.
For this comparison, the manual classification will serve as a ground truth. We can compute the precision of the keyword filtered comments as in Equation (1). Precision is computed by dividing the number of comments matching the keywords correctly identified (through manual labeling) as informal flags by the total number of comments matching the keywords. A low number for precision would mean that many comments are incorrectly identified as flags through keywords.
In a similar fashion, the precision of the POS matcher is defined in Equation (2), as the number of comments matching POS patterns correctly identified (through manual labeling) as informal flags divided by the total number of comments matching the POS patterns. Using these measures, we can check if the POS matcher is more precise than the simple keyword matcher:
We can also compute a recall measure for the POS matcher, as in Equation (3). Recall can be interpreted as the percentage of the informal flags (manually classified as such) matched by the POS patterns. A low number here would mean overlooking some comments that are informal flags. Recall for the keyword matcher is not computed because it is by definition equal to 1, as only comments that match the keywords were selected for the manual classification. It is likely that the true recall for the keyword matcher would have been lower than 1 if we would have sampled from the full set of comments. However, sampling from the non-filtered dataset would have highly increased the level of noise because most comments are not informal flags for misinformation. With a very small denominator, the precision measure could not have been computed with any degree of certainty.
There is a trade-off between precision and recall. The F1 score for the POS matcher in Equation (4) is an overall measure of performance, balancing both precision and recall:
Performance metrics are presented in Table 3. The precision of the baseline keyword model is low for four out of six keyword groups. Less than 30% of comments that match keywords from the groups “fake news”, “disinformation”, “unreliable”, and “bullshit” were manually labeled as informal flags. Only for the “misleading” group the precision of the keyword model is relatively high (0.83).
When using the POS matching, there is a significant increase in precision for all flag types. Overall, three quarters of matched sentences belong to comments that were manually classified as flags. The increase in precision is particularly large for “fake news” (from 0.27 to 0.73), “unreliable” (from 0.15 to 0.67), and ”dis/misinformation” (from 0.29 to 0.65). The recall values of the POS matcher are lower than the precision, ranging from 0.32 for “disinformation” to 0.62 for “propaganda”. Overall, more than half of the comments manually classified as flags match the POS patterns.
For the dashboard to provide meaningful information, we favor precision over recall, to reduce the prevalence of false positives in the matched results, and the POS matcher shows a greatly improved precision. In future versions, we will strive to improve recall by examining the mismatches and altering the POS patterns.
4.4.3. Comparison with Machine Learning Models
Finally, we compare the POS matcher with two machine learning models: regularized logistic regression (with L1/L2 penalty) and random forests. Logistic regression is an additive model, while random forests are ensembles of classification trees that find several combinations of features (such as the co-presence of several words in a comment) associated with the desired outcome (in our case, whether a comment is an informal flag for false information or not).
The train/test split ratio is approximately 2:1. The training set for the ML models consists of all the valid 573 manually annotated comments (labeled set 1) that match the keywords. All the comments in the training set were posted on Reddit from January to July 2020. As a test set, we use the 291 manually annotated comments (labeled set 3) posted after July (from August to October 2020). We used this splitting strategy to make sure that the way we built our POS matcher was not in any way influenced by the data in the test set. Not one comment from the test set existed when the POS matcher was finalized.
In the ML models, the comment word counts are used as features in a bag of words approach. We fit the two machine learning models with 5-fold cross-validation, to find the optimal value of the hyperparameters (number of variables sampled for each tree for random forests; penalty and L1/L2 mix for regularized regression). We compute the final diagnostics on the same test set of 291 comments.
Classification diagnostics on the test set (Table 4) show that, while the machine learning models perform somewhat better (F1 scores of 0.64 and 0.61 compared to 0.55 for the POS matcher), the difference is not very large, and the POS matcher performs slightly better than the regularized regression in terms of precision (0.73 compared to 0.62) and slightly worse than the random forest (0.78). We favor precision over recall (reducing the number of non-flags matched as flags at the price of overlooking some unmatched flags), and believe recall can be improved by adding more matching patterns, while ML performance might only significantly improve with a larger labeled set. We thus find support for not dismissing the POS matcher as an adequate, if imperfect method to use as the default in the dashboard showing perceived false information on Reddit. We describe the dashboard in detail in Section 7.
5. Results
In this section, we present a few exploratory analyses on the dataset of posts flagged as false information detected with the POS matcher described in Section 4.2 and Section 4.3. The Plotly/Dash dashboard described in Section 7 was used to analyze the data.
5.1. Informal Flagging: Trends and Peaks
Between 1 January and 30 June 2020, over 3 million posts and 17 million comments were retrieved using the API. More than 500 thousand comments (3% of all comments) matched the flag keywords. The POS matcher retrieved 33,609 potentially flagged posts. Each day, an average of 184 new posts are retrieved using the POS matcher (see Table 5). We will refer to these as flagged posts in the following paragraphs.
Overall, about a quarter of flagged posts come from dedicated Coronavirus subreddits, another quarter from generic political subreddits, less than 20% from generic news subreddits, 12% from local (U.S. regions or non-U.S. English speaking countries) subreddits, 9% from ideological subreddits, and 6% from other subreddits. In addition, 47% of flagged submissions are COVID-related.
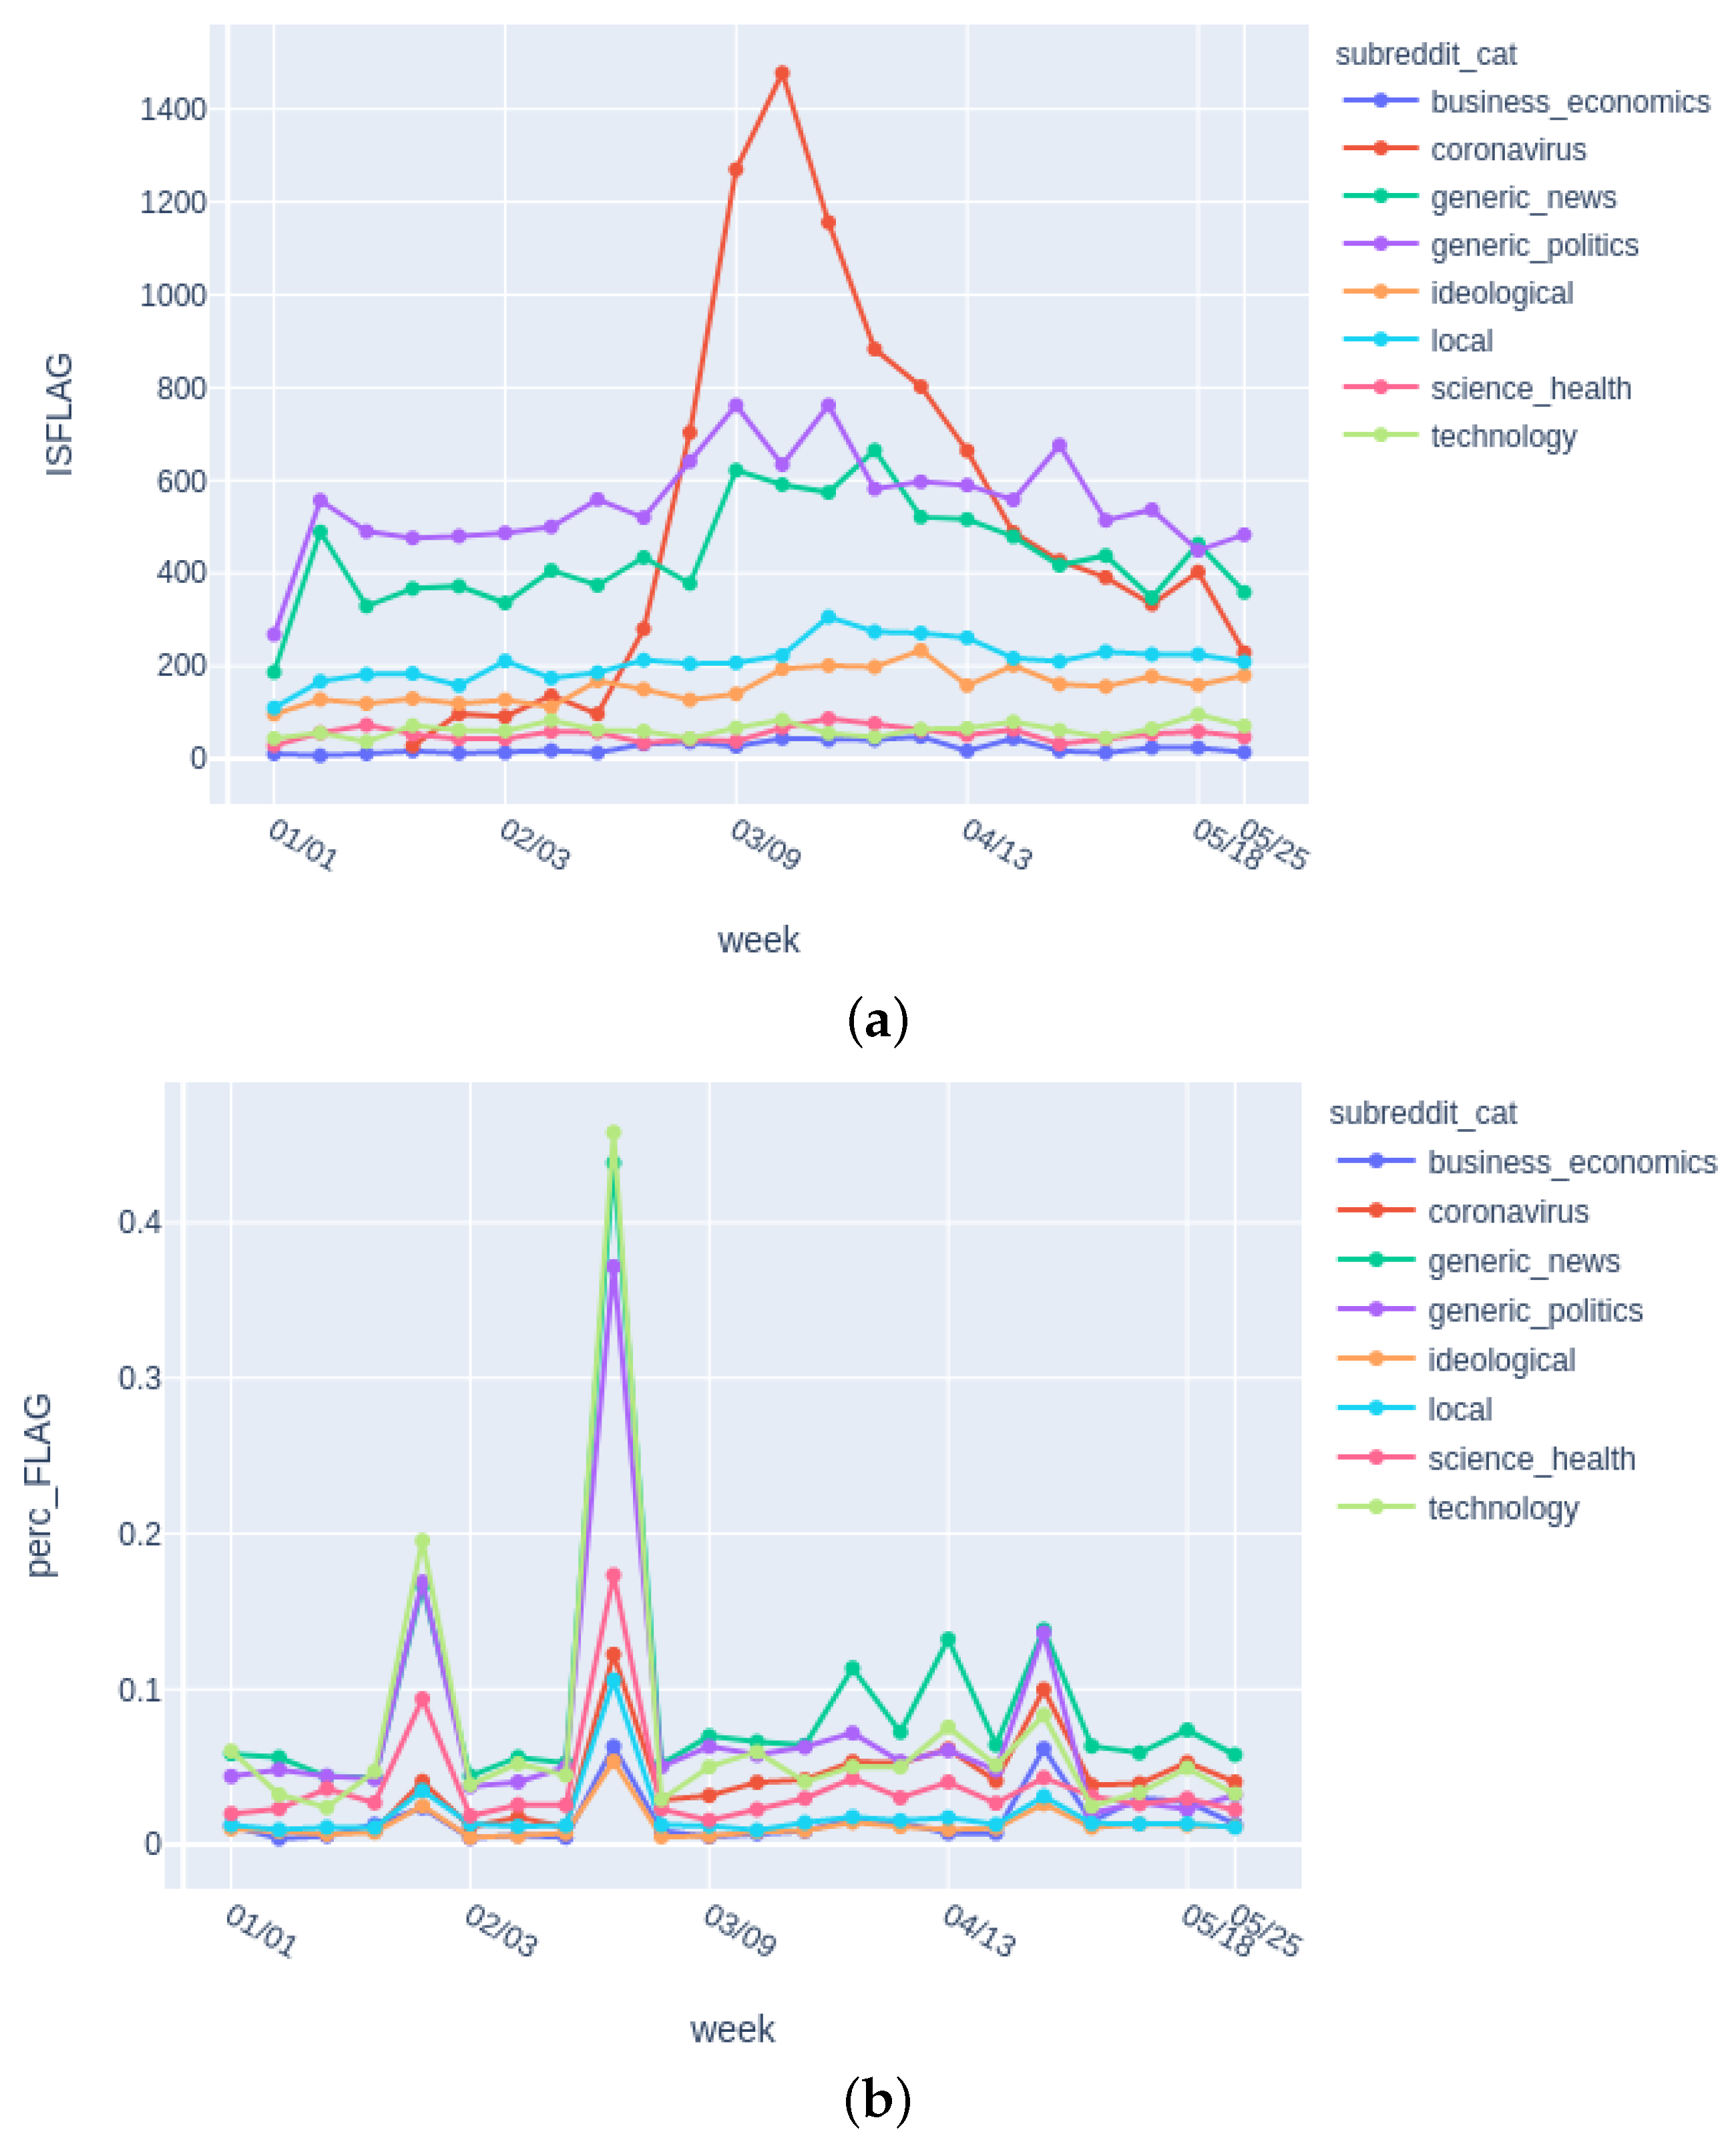
The month with the highest number of flagged posts was March 2020, with over 10,000 flagged posts. Flagged posts from the Coronavirus related subreddits have peaked at the beginning of March, decreasing ever since (Figure 2a). This however reflects the fact that the number of overall scraped posts was highest in that period. When looking at the percentage of posts that were flagged, the pattern is strikingly different (Figure 2b).
In most weeks, less than 5% of posts are flagged as false information (number varies from one subreddit to another). There are, however, three weeks showing discontinuities, with higher peaks than all other weeks. The first is a week at the end of January, with approximately 8% of posts flagged, around the time of the U.S. President’s impeachment trial (most frequent words not common to other weeks: impeachment, Bolton, vote, trial, witnesses). The second period is at the end of February, with approximately 16% of posts flagged, with topics featuring the Democratic primaries, and violence in India (most frequent words: Delhi, democratic, Pence, woman, workers). The third period is at the end of April, and features sexual assault allegations against the former Vice President of the U.S. and accusations that COVID-19 started from a laboratory in China (most frequent words: evidence, assault, Reade, deaths, lab).
5.2. Informal Flagging: "Lone Wolf" or "Brigading"?
Flagging is not often a group activity. In our dataset, 82% of posts were flagged only once, 10% flagged twice, and only 8% flagged more than three times. We present in Figure 3 two rare examples of posts flagged more than 10 times.
5.3. Informal Flagging: How Do Redditors Flag When They Flag?
The six types of flagging do not occur with the same frequency. In terms of the language, “bullshit” is the most commonly used expression (36% of all flags), followed by variations on “misleading” (25%), “fake news” (23%), and “propaganda” (12%). The terms “disinformation” and “misinformation” appear in less than 3% of cases, and ”unreliable” in less than 1% of comments.
5.4. Informal Flagging: Topic Clustering
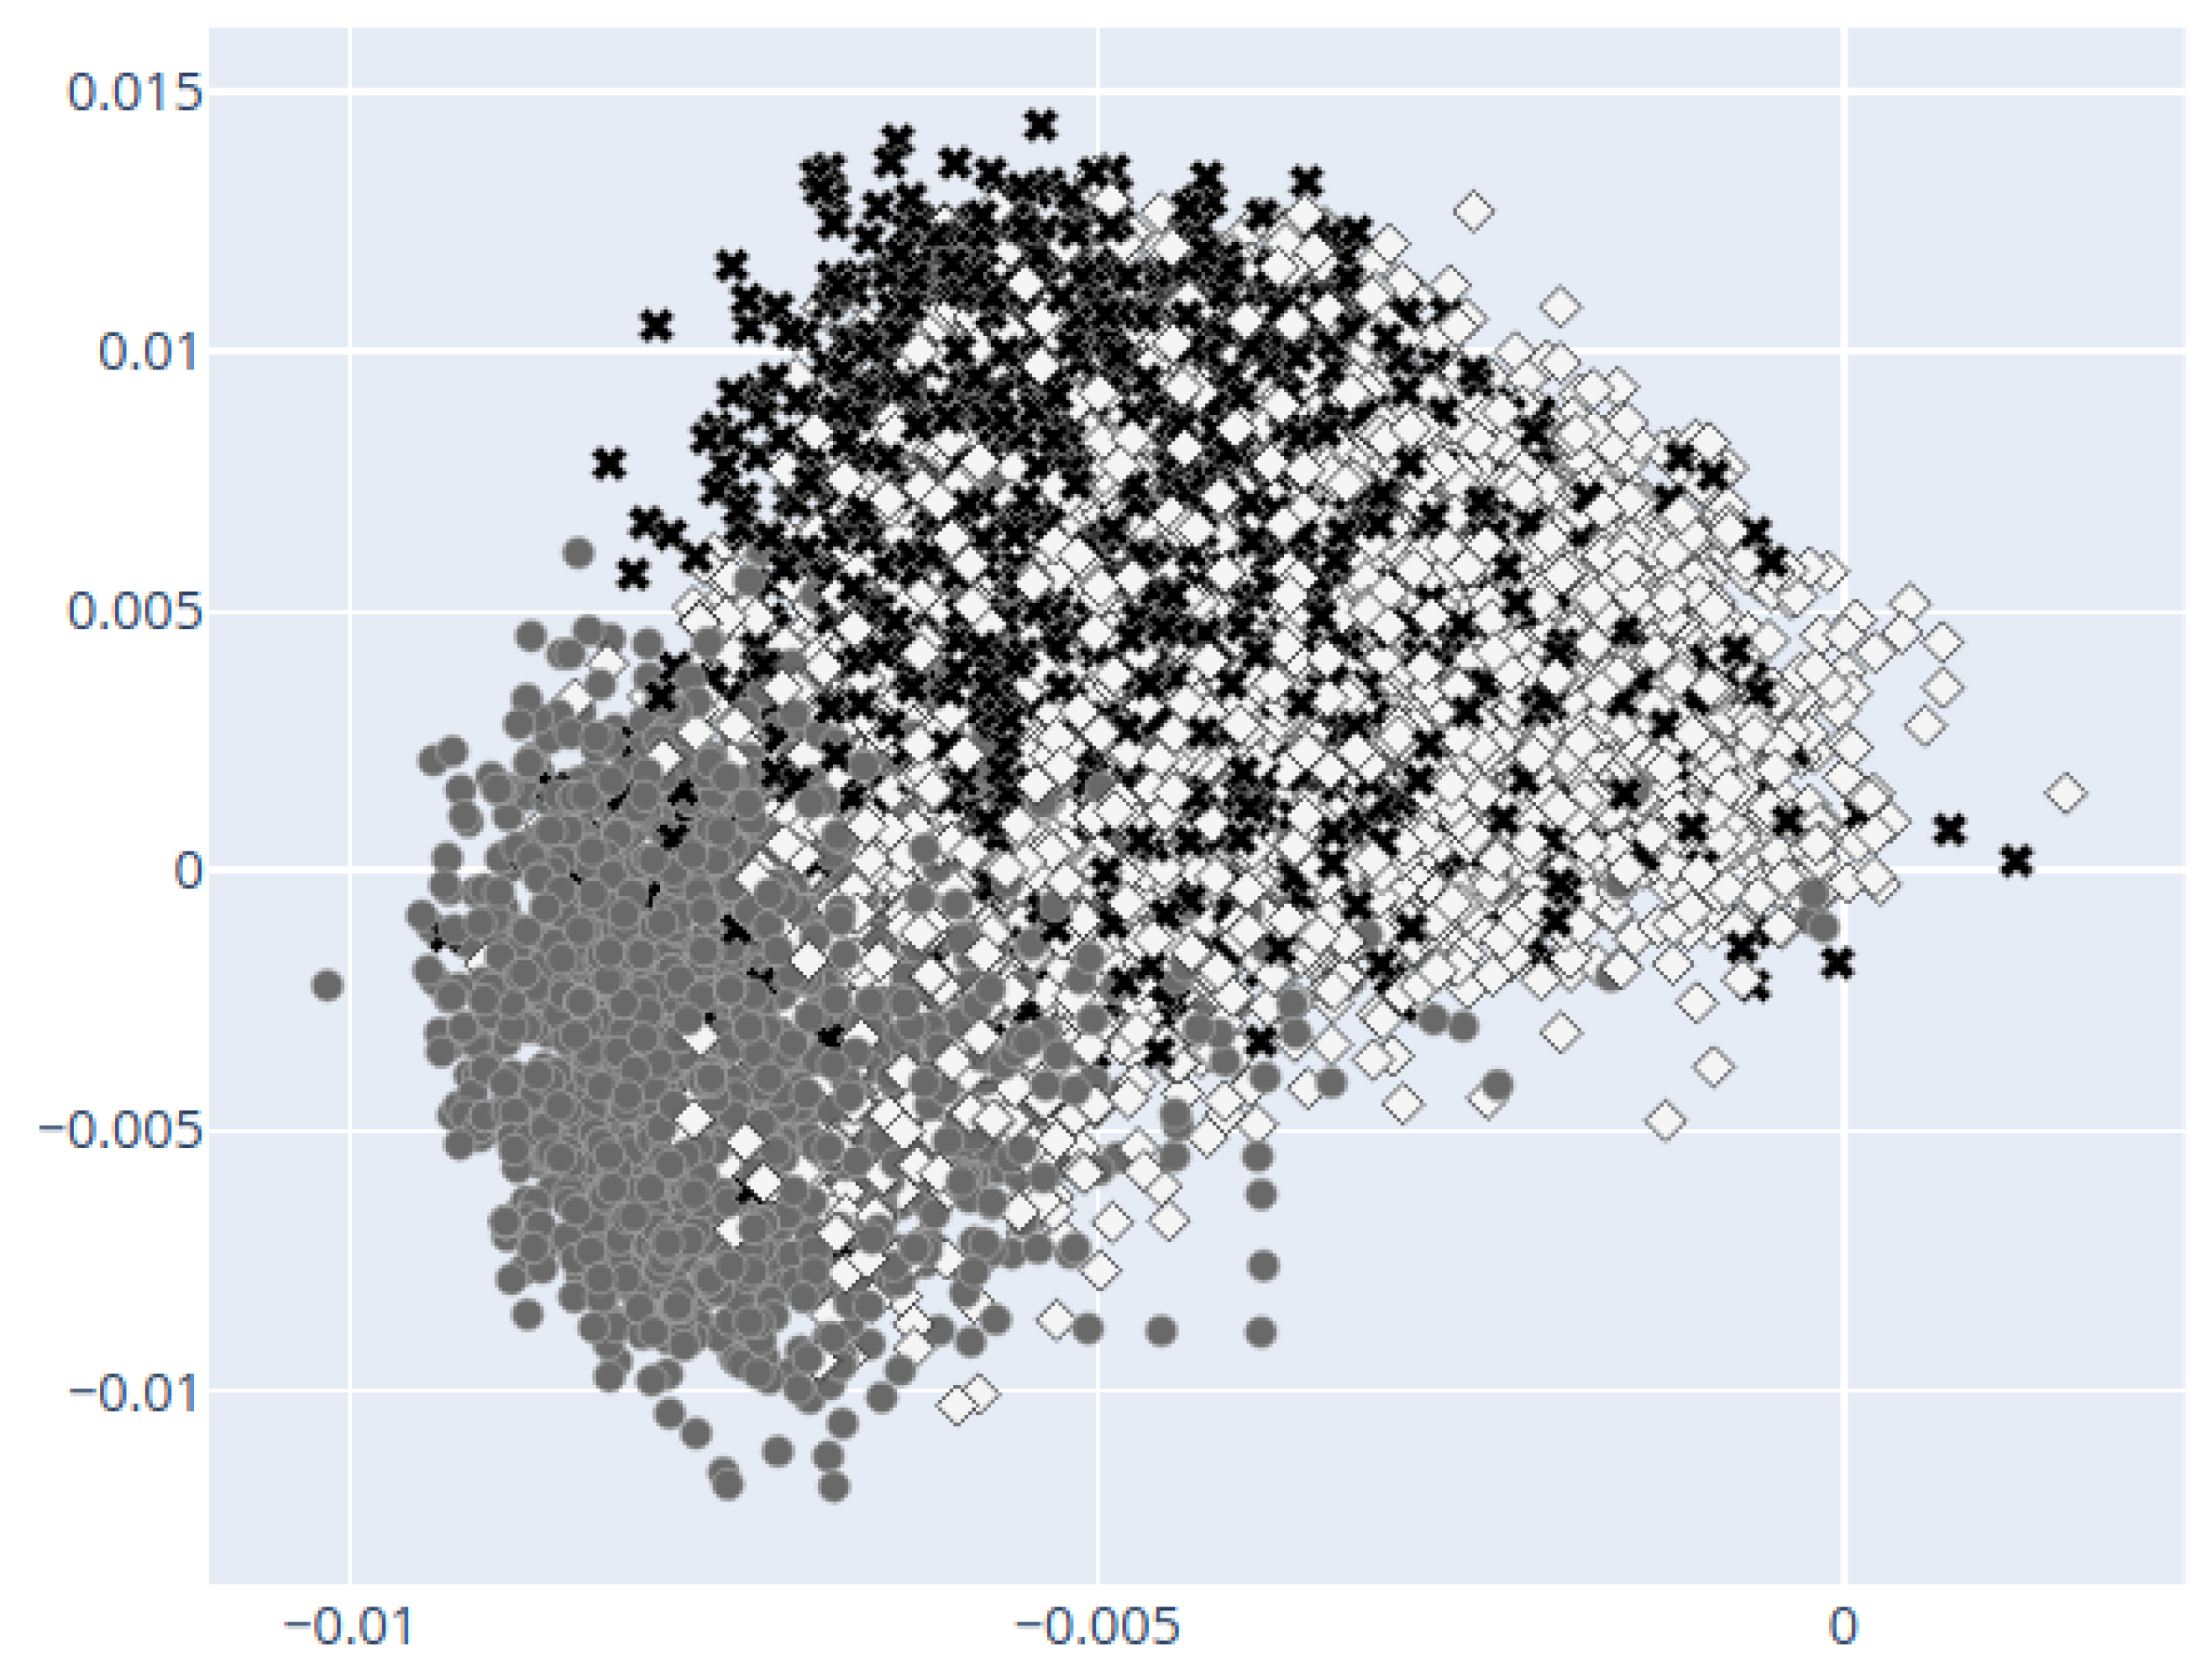
These data were collected during the COVID-19 crisis. To understand which major subtopics referring to this crisis tend to be flagged as false information, we first isolated the posts strictly about the virus (using a regular expression given in Appendix B). Then, we used the dashboard to run a K-means cluster analysis (described in Section 7.3) with three topics (see Figure 4). Looking at word frequencies per topic, we can distinguish three topics:
- a topic about the U.S. president and the Government’s response to the pandemic,
- a topic about China, and
- the largest topic about COVID-19 generic information: reports on deaths, infected, and health concerns.
Given the evolution of the pandemic, it is no surprise that the China topic is decreasing in prevalence (from 44% in January to 8% in June), while the other two are increasing in relative terms.
5.5. Comparison to Fact Checking Websites
Assessing the truth value of the information flagged as false is beyond the scope of this paper but will be dealt with in future research. However, we offer a preview, by comparing our results with those from an external dataset. The organization known as NewsGuard (https://www.newsguardtech.com) evaluates news websites in terms of credibility and transparency. Recently, they published a list of untrustworthy websites, and it is currently numbering 369 web domains, as of 29 November 2020. We shall refer to them as suspicious websites.
From January to June 2020, news pieces from 153 of these domains were shared on Reddit. The subreddit with the most suspicious websites referenced (71 domains) is, unsurprisingly, r/conspiracy, followed by r/Coronavirus (62 domains), but they also make an appearance (40–50 domains) on the major news and politics subreddits: r/news, r/POLITIC, r/politics, or r/worldnews.
It is important to note that more than 50% of suspicious websites were flagged at least once by Reddit users (compared to only 7% of all other domains). However, they were not flagged very often. Out of 23,076 articles shared on Reddit from these suspicious websites in the first half of 2020, only 830 were flagged (3.6% of all comments), according to our POS matcher. This is slightly higher than the percentage of flagged posts from all other websites (2.8%). A post is 1.29 times more likely to be flagged if it belongs to a suspicious website than if it does not. However, the list of suspicious websites provided by NewsGuard cannot be considered exhaustive. Future research is needed to establish whether there are confounding variables or whether the ’fake news detector’ of Reddit users is properly tuned.
6. Discussion
We agree that, for the task of detecting false information, “tools should be designed to augment human judgement, not replace it.” [36]. Our project aims to fulfill this goal, by narrowing down the list of potential false information to posts flagged as false by members of online communities. Using this method, we highlight what can be considered an informal vote of non-confidence from parts of an online community toward individual posts. Aggregating such information in real time can then be used as a barometer of how much misinformation is perceived by users at a specific time. Such a technology is complementary to expert based fact-checking. We also agree that the methods should be fully transparent, and our patterns can be easily inspected and modified even by less technical users.
Our tool does not require training on manually labeled data and is less vulnerable to the particularities of a specific training set. It is highly customizable and can be adapted to any internet forum where news are discussed. It performs better than a keyword filtering model, and not significantly worse than machine learning models. Our model extracts labels in real time, by unobtrusively tapping into the actual behavior of online platform users.
There are several limitations to this method. We are aware that it is a rather simple model of text analysis. However, compared to novel developments in Natural Language Processing and Deep Learning, we find our approach to be more conductive for user transparency, especially for users who might not have a background in machine learning. Efficient machine learning requires a large amount of costly manual labeling for training data, and it is sensitive to concept drift. The simple vocabulary and matchers can be easily changed to accommodate new patterns or to remove irrelevant ones. The qualitative derivation of the keywords for the POS matcher was the chosen way to operationalize flagging, as we are currently not aware of any literature defining online sanctioning behavior in a consistent manner. Therefore, this method may not capture “flagging” exhaustively, as the recall measures show. It does, however, leave the possibility of improvement by adjusting the vocabulary or rules.
It should be kept in mind that the model is potentially detecting user-perceived false information, and not necessarily actual false information. Reddit users are probably less informed compared to professional fact checkers and have their own ideological lenses by which they judge a piece of news as true or false. The Reddit demographics are highly skewed toward young and male [50], and their evaluations might not reflect the views of the general U.S. population. Online anonymity can encourage antisocial behavior; therefore, some informal flagging may not be done in full honesty, especially if it is infiltrated by bots and paid trolls [20]. In addition, given Reddit’s meme-centric ethos and creativity, irony, and sarcasm cannot always be filtered out. The intensity of an informal flag can vary (from “absolutely false” to “slightly misleading”), and so does the target of the flag (from the content of article, to the source referenced, or Reddit user). In addition, in terms of flagging accuracy, not all subreddits are created equal. There is a risk that malevolent actors become aware that their content is being flagged, and attempt to break the algorithm by “flooding the zone” with false flags. This is why future research should also take into consideration user reputation and their tenure on the platform, and to find a way to filter out the false flaggers.
That being said, even if many of the flagged posts are not objectively presenting false information, the dataset of user flags can be used by social scientists to study how perception about what is true and what is false online emerges and changes over time. As an example, sociologists have long theorized that actors with ambivalent traits concerning valuation can receive sanctions from an audience for not adhering to role-based expectations [55,56]. This in turn may enhance conformity and reduce innovations in a field. However, which acts of communication constitute sanctions and which do not is something that has not been systematically analyzed. In a similar manner, Bratich [11] has argued for revising classical communication models of audience interaction, so that the active production of meaning as well as the influence of the audience on media production can be included. Our analysis in this respect not only traces flags, therefore including an active process of meaning generation. It is also possible for researchers to use these techniques to trace how the production of posts might change as a consequence of flagging.
Within this project, we are building a dataset that is made public, and we are providing the source code for the data collection and for recreating the dashboard (see Section 8). The next steps will involve bringing more external data from known datasets of fact checked information, and further inquiries into the relationship between the veracity (reflected by expert reviews) and credibility (reflected by user flagging) of news published online, as well as the effects of being flagged on posting behavior.
When detecting whether flagging correctly predicts false information (based on reports of fact checkers), more information should be considered as possible moderators. Previous research shows that a wider range of features can be used to predict disinformation or propaganda, such as metadata [17,46], emotional cues [24,25], or visual data [51]. Useful metadata can include the weekday and time of posting, the time spent by the user on the platform, the rating of the post or comment, and the concentration or dispersion of user posts among subreddits. Emotional signals, extracted through sentiment scores, might help in separating between flag types or types of false information. The memes and other images shared on these forums can be also mined for useful features. More advanced deep learning models [53,54] can be incorporated to filter out sarcastic comments.
Finally, we aim to expand the current approach to problems beyond the current COVID-19 pandemic and online contexts different from Reddit. The model only depends on the text content of a reply to a post, so it can be easily adapted to other online platforms, including Twitter or online newspaper websites. The dictionary and rules are fully customizable, as long as the input text is in the English language (although similar tools can be created for other languages). We hope the tool will be of use to academics, journalists, fact checkers, data scientists, medical experts, Reddit users and moderators, and all members of society.
7. Materials and Methods
7.1. Data Analysis Dashboard
We created and are maintaining a dashboard for monitoring flagged posts. It covers posts from 1 January 2020 to the present (currently: 28 October 2020). This tool is built using Python 3.6 and the User Interface is provided by the package Dash, which relies on the package Plotly for creating interactive charts. The dash app is built on top of Flask. The Flask application runs on a Ubuntu virtual machine, and is served using Gunicorn and Nginx.
The user interface is separated in two columns. The left column is meant for filtering the dataset (for all tables and graph). On the left column, users can select the period (from week A to week B), the type of flags (“disinformation”, “fake news”, “clickbait”, “unreliable”, “bullshit” and “propaganda”). There is also an option to display only COVID-19 related posts.
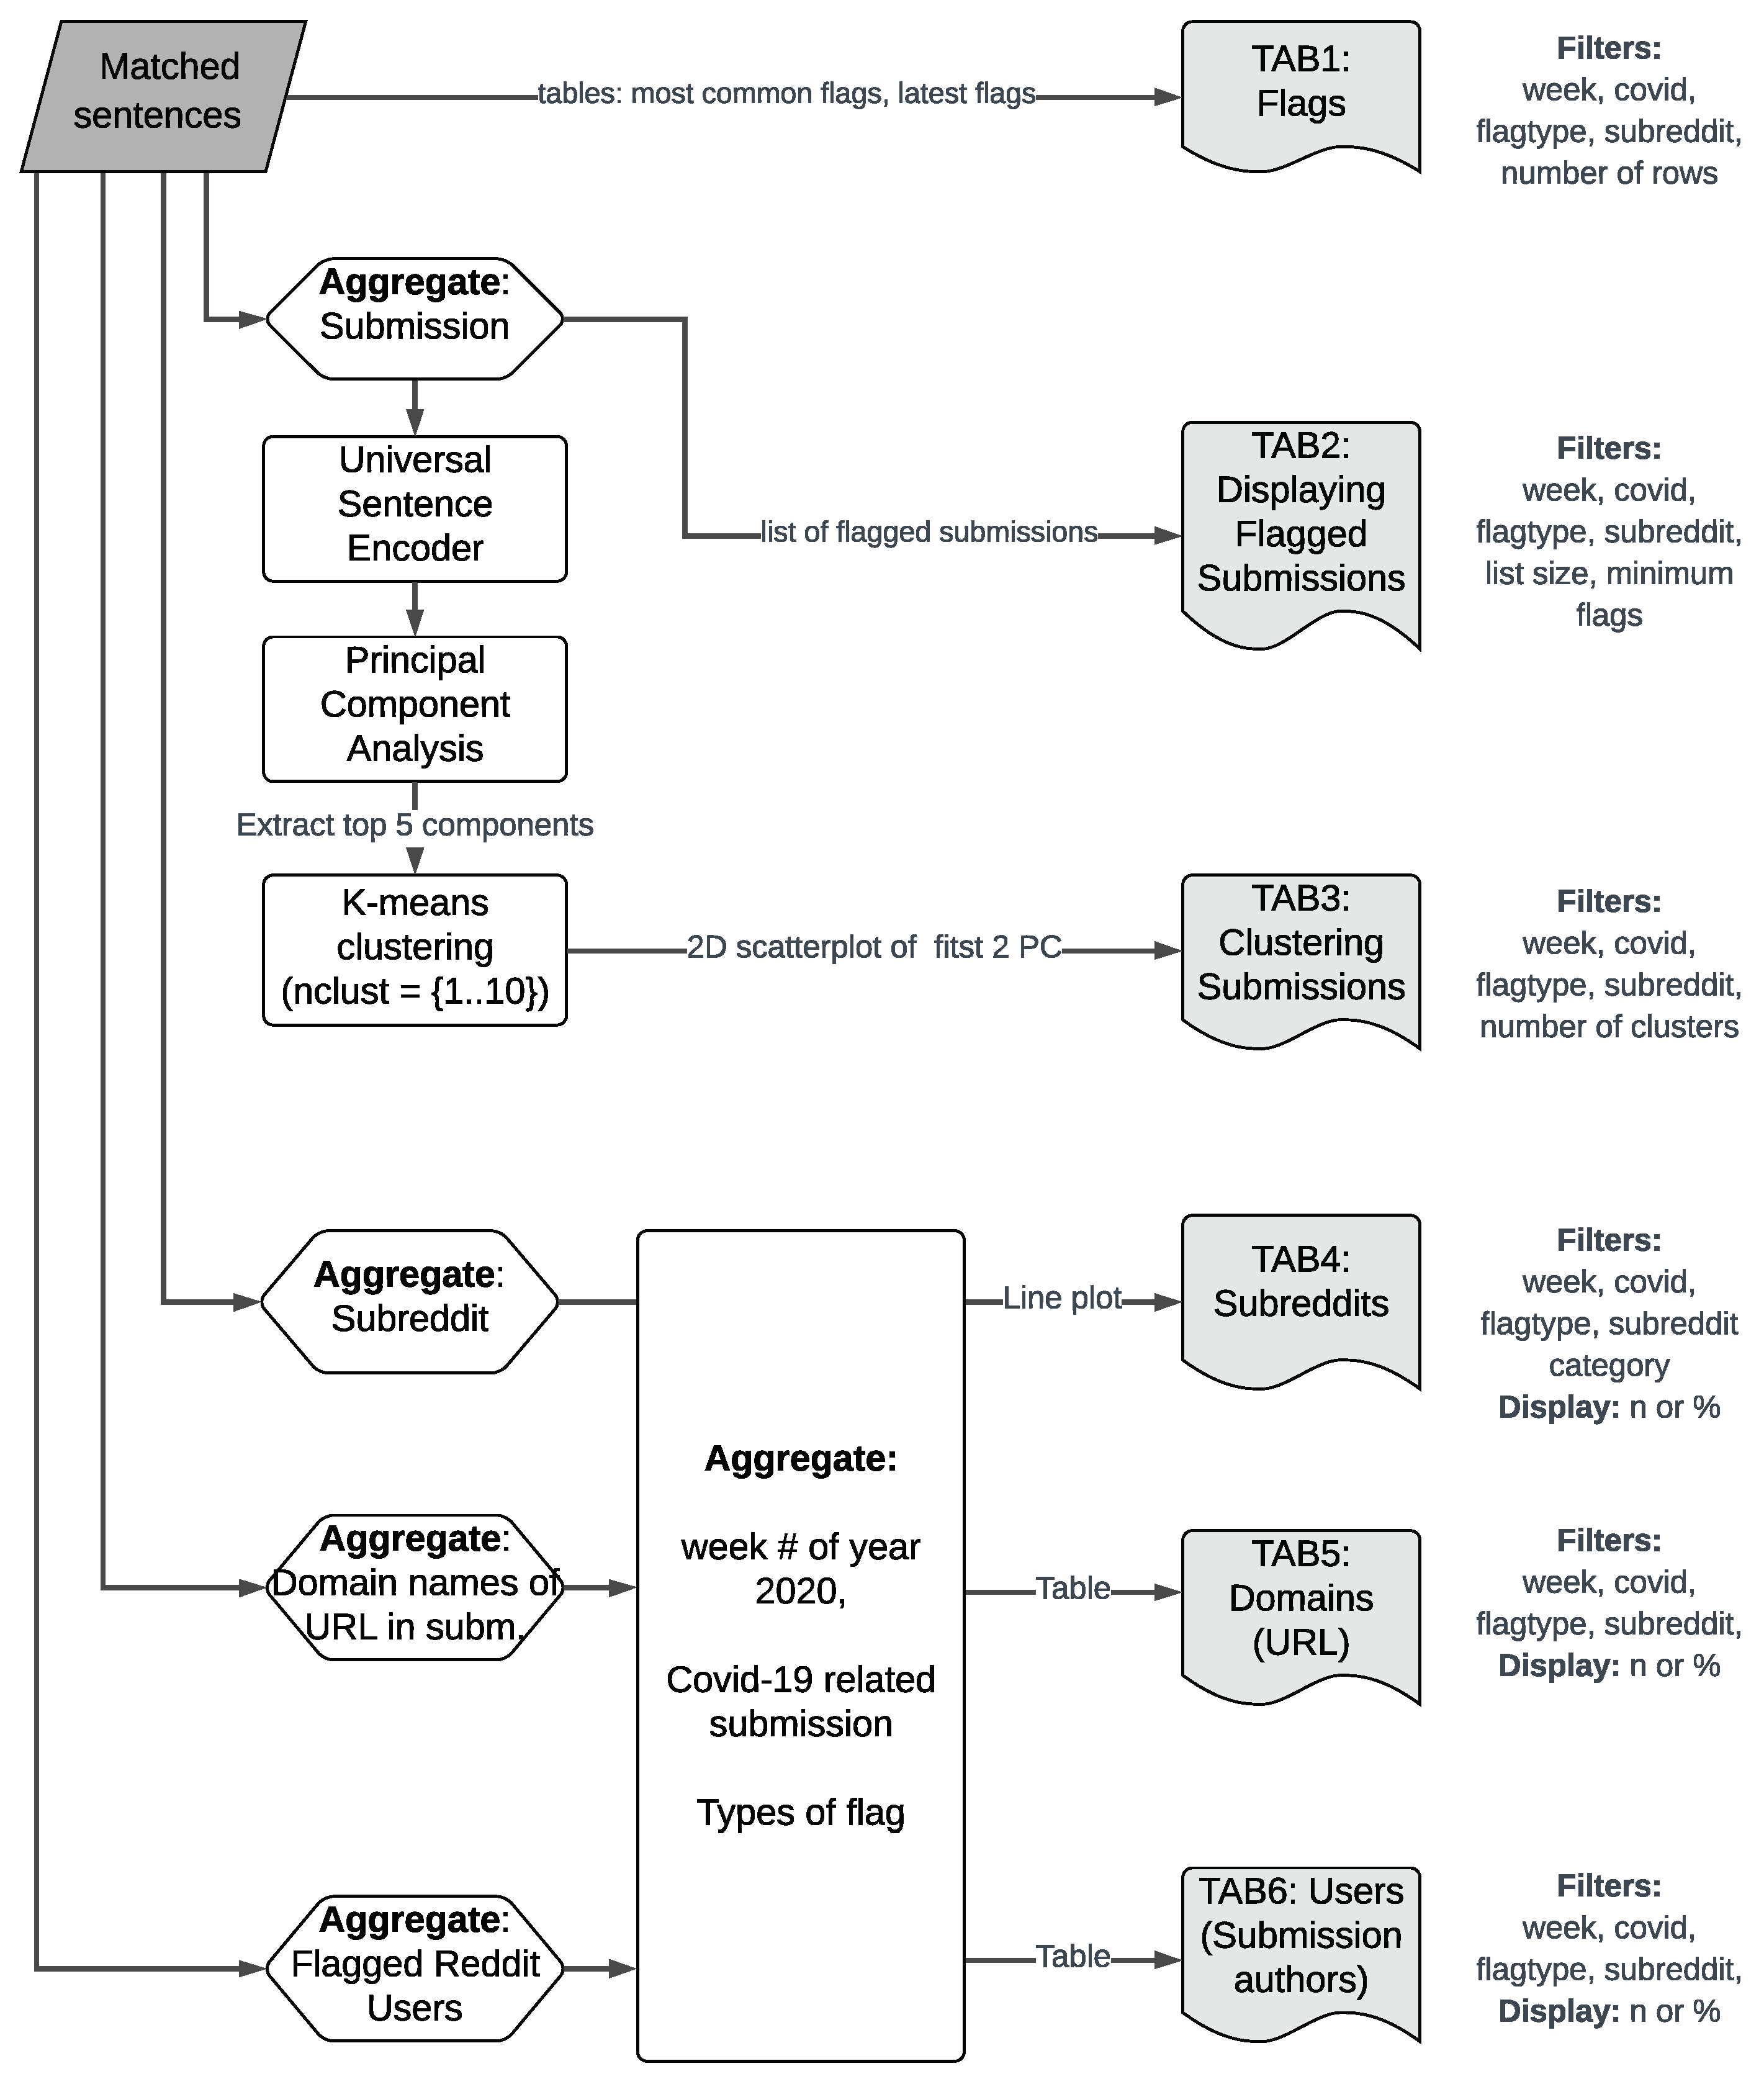
The right column shows tables and graphs. The file with matched sentences (flags identified with the POS matcher) is the main input file. This file is aggregated at different levels (posts, subreddits, authors of posts, domain of linked URL in post), and each resulting dataset has its own separate tab on the right column of the UI. We briefly describe each of the six tabs and their potential uses for data analysis. A full flowchart of the dashboard can be found in Appendix A.
7.2. Dashboard: Flags
This tab uses the non-aggregated dataset of sentences matched as informal flags. It contains frequency tables. It serves mainly to check and validate the results of the instrument (if the sentences are really flags), to show the most common flags (information which can also be used to find potential bot activity), and to show the latest flags and the subreddit in which they were employed.
7.3. Dashboard: Posts (Submissions) and Clustering
In the second tab, the flags are aggregated at a post level and the latest 10 to 100 posts are shown. Information displayed includes the title of flagged article, date when it was published, whether it was removed by moderators and the wording of the comments identified as user flags. It links to the Reddit post and the original article. Users can filter out posts from specific subreddits or posts with multiple flags. For two examples of heavily flagged posts, see Figure 3. This is the most important tab of the dashboard because it can be a starting point for fact checking the users’ claims of disinformation.
The fourth tab is used to cluster posts into topics. When analyzing a large number of posts titles, it can be useful to filter by topic. The dashboard allows the user to run a predefined unsupervised machine learning algorithm (see Appendix A for a diagram of the pipeline). First, sentence embeddings are calculated for each flagged post title. The Universal Sentence Encoder [57] was chosen because it is specifically tuned to sentences rather than words, and most tiles consist of a single sentence. It generates sentence vectors with 512 elements. Then, the dimensionality of the data are reduced using Principal Component Analysis, and the top 5 components are chosen. Finally, the five principal components are included as variables in a K-mean cluster analysis to group each post in a single category (cluster). The user can choose the number of clusters (from 1 to 10, default is 3), and after that the most frequent words in each category are shown, to help label each cluster. The user can also inspect the post titles closest to each cluster’s centroid. This method is an alternative to more complex approaches [19] for grouping COVID-19 related news pieces.
7.4. Dashboard: Subreddits, Domains, Authors
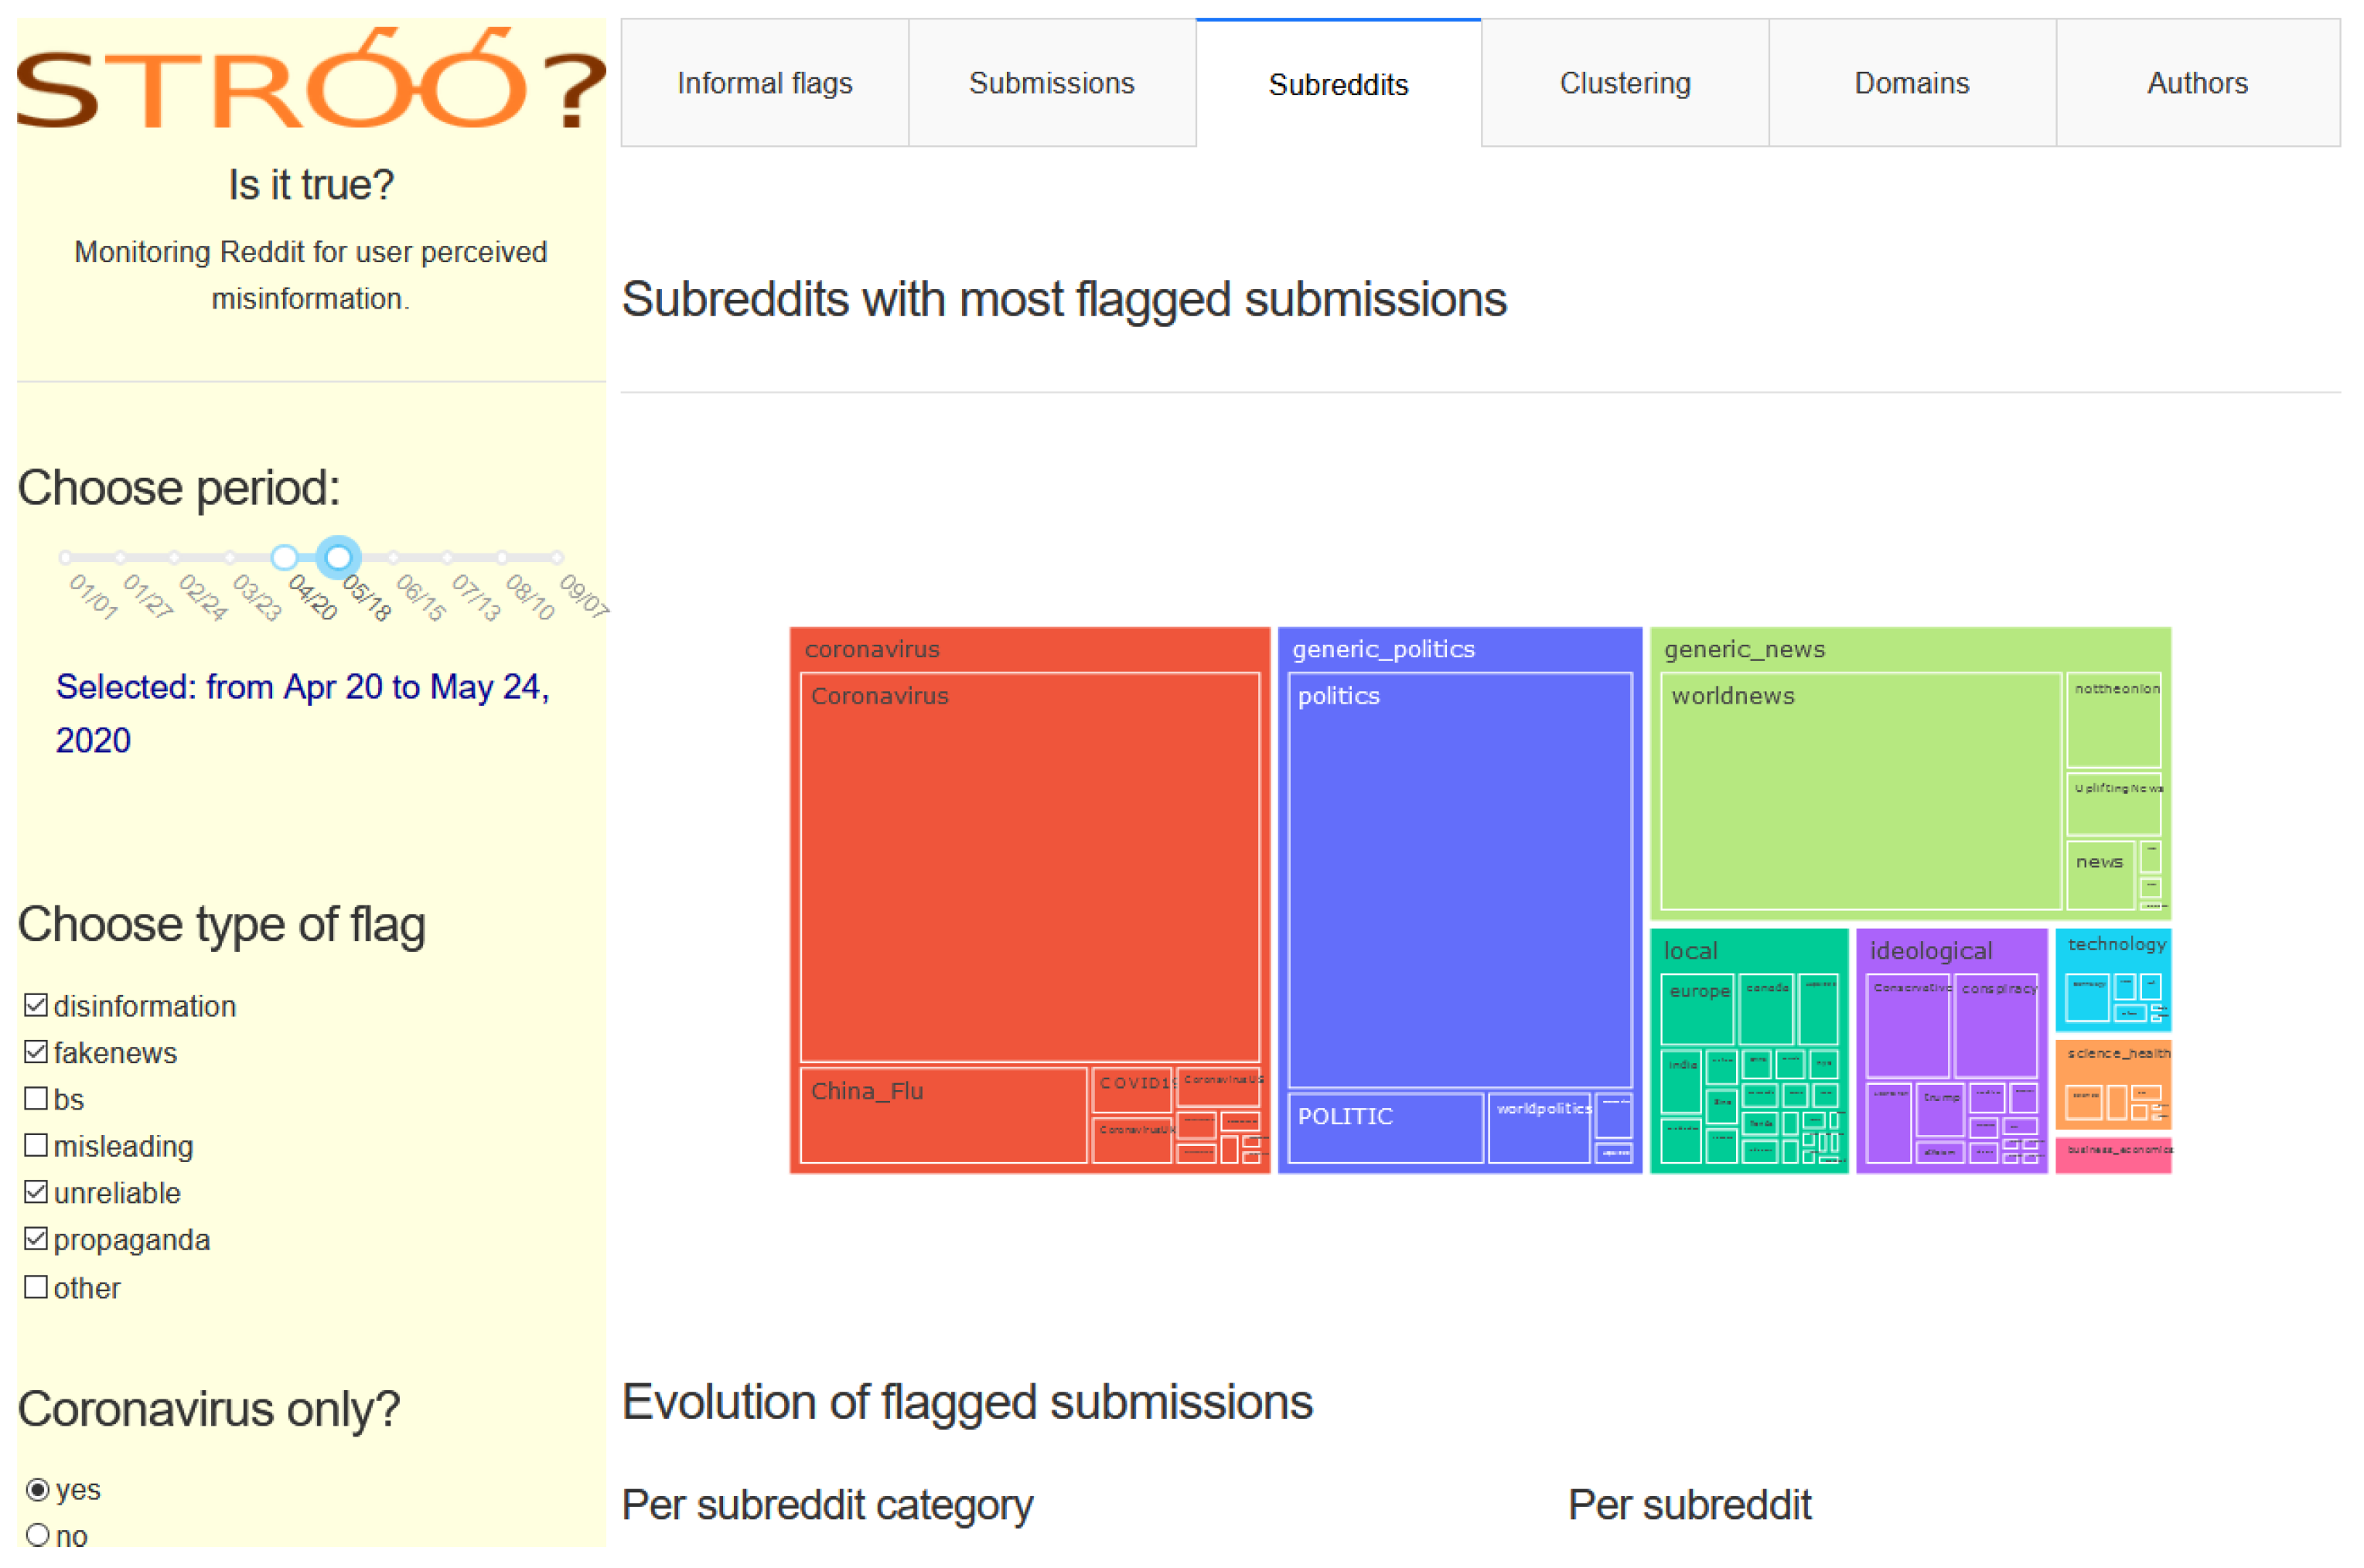
In Tabs 3, 5, and 6 of the dashboard (Figure A1), the data are aggregated at the subreddit, domain, and author level. The subreddit tab presents the frequency and percentage of flagged posts in each subreddit over time. It can show the concentration of flagged disinformation in certain subreddits and temporal peaks. A screenshot of the third tab is presented in Figure 5.
The domain tab shows the most often flagged web domains, and it can be used to investigate the websites that might be spreading false information. Finally, the ”authors” tab shows the most flagged users (as percent of total submisions). This can be useful to detect potential coordinated activity by groups of non-genuine users [52], social bots, or trolls that might stand out for having an unusually high number of flagged comments.
8. Data Availability Statement
The syntax, source code, and data used in this paper are made available in a publicly accessible repository (https://figshare.com/).
8.1. Manual Annotation Files
Two.csv files containing the manual annotations (described in Section 4.4.1) used in the training and test set for the ML models are uploaded on Figshare. All 1500 annotations are provided. DOI:10.6084/m9.figshare.13315259.
8.2. Descriptive Analyses
A Jupyter Notebook file where descriptive statistics from Section 5 are computed was uploaded on Figshare. DOI:10.6084/m9.figshare.13174145.
8.3. Source Code of Dashboard
Snippets from the POS matcher can be found in Appendix B. The full Python source code for the (dash/plotly) dashboard, as well as the data that it uses, was uploaded on Figshare. DOI:10.6084/m9.figshare.13174136.
8.4. Testing Dashboard
The dashboard is still in the development stage, but fully functional at the time of writing. The dashboard can be tested by accessing the following link: http://134.155.109.58.
Author Contributions
Conceptualization, V.A. and P.D.C.; methodology, V.A. and P.D.C.; software, V.A.; validation, V.A. and P.D.C.; formal analysis, V.A. and P.D.C.; investigation, V.A. and P.D.C.; resources, V.A.; data curation, V.A.; writing—original draft preparation, V.A. and P.D.C.; writing—review and editing, V.A. and P.D.C.; visualization, V.A.; project administration, V.A. All authors have read and agreed to the published version of the manuscript.
Funding
This research received no external funding.
Acknowledgments
We would like to thank the Statistics and Methodology research group at the University of Mannheim, led by Frauke Kreuter and Florian Keusch, for providing useful feedback at each step of the research process. We are grateful to the anonymous reviewers for pointing us to additional relevant theory and research on the topic, and for suggesting ways to fortify our methodology. The publication of this article was funded by the Ministry of Science, Research, and the Arts Baden-Württemberg and the University of Mannheim.
Conflicts of Interest
The authors declare no conflict of interest.
Abbreviations
The following abbreviations are used in this manuscript:
| ML | Machine Learning |
| NLP | Natural Language Processing |
| POS matcher | Matcher Using Part of Speech Tagging and Dependency Parsing |
| MDPI | Multidisciplinary Digital Publishing Institute |
Appendix A. Data Processing Flowchart for Dashboard
This chart shows which dataset the tabs in the dashboard are using.
Figure A1.
Data processing flowchart for dashboard.

Appendix B. Vocabulary, POS, Dependency Classes, and Matching Patterns
All code is Python 3.6 code.

Listing 1.
The vocabulary Python classes.
 |
Listing 2.
The POS and dependency Python/SpaCy classes.
 |
An example on how the vocabulary is plugged in the patterns along with POS tags and dependencies (Patterns SVO and AO shown):
Listing 3.
Python/SpaCy matching patterns for informal flags.
 |
Listing 4.
Regular expressions.
 |
Creating a matcher for each of the six types of informal flags: disinformation, fake news, bullshit, misleading, unreliable, and propaganda, using the classes for keywords defined at the beginning of the appendix (Listing 1).
Listing 5.
Matchers for each type of informal flag.
 |
References
- Bovet, A.; Makse, H.A. Influence of fake news in Twitter during the 2016 US presidential election. Nat. Commun. 2019, 10, 1–14. [Google Scholar] [CrossRef] [PubMed]
- Bastos, M.T.; Mercea, D. The Brexit Botnet and User-Generated Hyperpartisan News. Soc. Sci. Comput. Rev. 2017, 37, 38–54. [Google Scholar] [CrossRef] [Green Version]
- Bradshaw, S.; Howard, P.N. The Global Disinformation Order 2019 Global Inventory of Organised Social Media Manipulation; Working Paper; Project on Computational Propaganda: Oxford, UK, 2019. [Google Scholar]
- Woolley, S.C.; Howard, P.N. (Eds.) Computational Propaganda: Political Parties, Politicians, and Political Manipulation on Social Media; Oxford Studies in Digital Politics; Oxford University Press: New York, NY, USA, 2019. [Google Scholar] [CrossRef]
- Bentzen, N. Foreign Influence Operations in the EU. 2018. Available online: http://www.europarl.europa.eu/RegData/etudes/BRIE/2018/625123/EPRS_BRI(2018)625123_EN.pdf (accessed on 29 November 2020).
- Brennen, J.S.; Simon, F.; Howard, P.N.; Nielsen, R.K. Types, Sources, and Claims of COVID-19 Misinformation; Oxford University Press: Oxford, UK, 2020; Volume 7, pp. 1–13. [Google Scholar]
- Zarocostas, J. How to fight an infodemic. Lancet 2020, 395, 676. [Google Scholar] [CrossRef]
- Lazer, D.M.J.; Baum, M.A.; Benkler, Y.; Berinsky, A.J.; Greenhill, K.M.; Menczer, F.; Metzger, M.J.; Nyhan, B.; Pennycook, G.; Rothschild, D.; et al. The science of fake news. Science 2018, 359, 1094–1096. [Google Scholar] [CrossRef]
- Paul, C.; Matthews, M. The Russian “Firehose of Falsehood” Propaganda Model: Why It Might Work and Options to Counter It; RAND Perspective; RAND: Santa Monica, CA, USA, 2016; Volume 198. [Google Scholar]
- Lazarsfeld, P.F.; Berelson, B.; Gaudet, H. The People’s Choice. How the Voter Makes Up His mind in a Presidential Campaign; Duell, Sloan & Pearce: New York, NY, USA, 1944. [Google Scholar]
- Bratich, J.Z. Amassing the Multitude: Revisiting Early Audience Studies. Commun. Theory 2006, 15, 242–265. [Google Scholar] [CrossRef]
- Baly, R.; Karadzhov, G.; Alexandrov, D.; Glass, J.; Nakov, P. Predicting Factuality of Reporting and Bias of News Media Sources. In Proceedings of the 2018 Conference on Empirical Methods in Natural Language Processing, Brussels, Belgium, 31 October–4 November 2018. [Google Scholar] [CrossRef] [Green Version]
- Canini, K.R.; Suh, B.; Pirolli, P.L. Finding Credible Information Sources in Social Networks Based on Content and Social Structure. In Proceedings of the 2011 IEEE Third Int’l Conference on Privacy, Security, Risk and Trust and 2011 IEEE Third Int’l Conference on Social Computing, Boston, MA, USA, 9–11 October 2011; pp. 1–8. [Google Scholar] [CrossRef]
- Gupta, A.; Kumaraguru, P. Credibility ranking of tweets during high impact events. In Proceedings of the 1st Workshop on Privacy and Security in Online Social Media—PSOSM ’12, Lyon, France, 17 April 2012; Kumaraguru, P., Almeida, V., Eds.; ACM Press: New York, NY, USA, 2012; pp. 2–8. [Google Scholar] [CrossRef] [Green Version]
- Helmstetter, S.; Paulheim, H. Weakly Supervised Learning for Fake News Detection on Twitter. In Proceedings of the 2018 IEEE/ACM International Conference on Advances in Social Networks Analysis and Mining (ASONAM), Barcelona, Spain, 28–31 August 2018; pp. 274–277. [Google Scholar] [CrossRef]
- Hounsel, A.; Holland, J.; Kaiser, B.; Borgolte, K.; Feamster, N.; Mayer, J. Identifying Disinformation Websites Using Infrastructure Features. Available online: https://www.usenix.org/system/files/foci20-paper-hounsel.pdf (accessed on 22 December 2020).
- Mihaylov, T.; Mihaylova, T.; Nakov, P.; Màrquez, L.; Georgiev, G.D.; Koychev, I.K. The dark side of news community forums: Opinion manipulation trolls. Internet Res. 2018, 28, 1292–1312. [Google Scholar] [CrossRef]
- Shu, K.; Wang, S.; Lee, D.; Liu, H. Disinformation, misinformation, and fake news in social media: Emerging research challenges and opportunities.; Springer: Cham, Switzerland, 2020. [Google Scholar]
- Song, X.; Petrak, J.; Jiang, Y.; Singh, I.; Maynard, D.; Bontcheva, K. Classification Aware Neural Topic Model and its Application on a New COVID-19 Disinformation Corpus; 2020. arXiv 2020, arXiv:2006.03354. [Google Scholar]
- Zannettou, S.; Caulfield, T.; Setzer, W.; Sirivianos, M.; Stringhini, G.; Blackburn, J. Who Let The Trolls Out? In Proceedings of the 10th ACM Conference on Web Science—WebSci ’19, Oxford, UK, 28 June–1 July 2019. [Google Scholar] [CrossRef] [Green Version]
- Lagorio-Chafkin, C. We Are the Nerds: The Birth and Tumultuous Life of Reddit, the Internets Culture Laboratory; Hachette Books: New York, NY, USA, 2018. [Google Scholar]
- Allport, G.W.; Postman, L. An analysis of rumor. Public Opin. Q. 1946, 10, 501–517. [Google Scholar] [CrossRef]
- Vosoughi, S.; Roy, D.; Aral, S. The spread of true and false news online. Science 2018, 359, 1146–1151. [Google Scholar] [CrossRef]
- Giachanou, A.; Rosso, P.; Crestani, F. Leveraging Emotional Signals for Credibility Detection. In Proceedings of the 42nd International ACM SIGIR Conference on Research and Development in Information Retrieval; Association for Computing Machinery, New York, NY, USA, 21–25 July 2019; pp. 877–880. [Google Scholar] [CrossRef]
- Ghanem, B.; Rosso, P.; Rangel, F. An Emotional Analysis of False Information in Social Media and News Articles. ACM Trans. Internet Technol. 2020, 20. [Google Scholar] [CrossRef]
- Shin, J.; Jian, L.; Driscoll, K.; Bar, F. The diffusion of misinformation on social media: Temporal pattern, message, and source. Comput. Hum. Behav. 2018, 83, 278–287. [Google Scholar] [CrossRef]
- Allington, D.; Dhavan, N. The Relationship between Conspiracy Beliefs and Compliance with Public Health Guidance with Regard to COVID-19; Centre for Countering Digital Hate: London, UK, 2020. [Google Scholar]
- Imhoff, R.; Lamberty, P. A Bioweapon or a Hoax? The Link Between Distinct Conspiracy Beliefs About the Coronavirus Disease (COVID-19) Outbreak and Pandemic Behavior. Soc. Psychol. Personal. Sci. 2020. [Google Scholar] [CrossRef]
- Sultănescu, D.; Achimescu, V.; Sultănescu, D.C. Conspiracy Narratives and Compliance with Public Health Recommendations During the COVID-19 Crisis in Romania. In Proceedings of the 7th ACADEMOS Conference 2020 International Conference, Bucharest, Romania, 7–10 October 2020; pp. 393–401. [Google Scholar]
- Burstyn, L.; Rao, A.; Roth, C.; Yanagizawa-Drott, D. Misinformation during a Pandemic; Working Paper; University of Chicago, Becker Friedman Institute for Economics: Chicago, IL, USA, 2020. [Google Scholar]
- Huang, B.; Carley, K.M. Disinformation and Misinformation on Twitter during the Novel Coronavirus Outbreak. Available online: https://arxiv.org/abs/2006.04278 (accessed on 22 December 2020).
- Kouzy, R.; Abi Jaoude, J.; Kraitem, A.; El Alam, M.B.; Karam, B.; Adib, E.; Zarka, J.; Traboulsi, C.; Akl, E.W.; Baddour, K. Coronavirus Goes Viral: Quantifying the COVID-19 Misinformation Epidemic on Twitter. Cureus 2020, 12, e7255. [Google Scholar] [CrossRef] [PubMed] [Green Version]
- Reddit. Update to Our Content Policy. 2020. Available online: https://www.reddit.com/r/announcements/comments/hi3oht/update_to_our_content_policy/ (accessed on 29 November 2020).
- Reddit. Misinformation and COVID-19: What Reddit Is Doing. 2020. Available online: https://www.reddit.com/r/ModSupport/comments/g21ub7/misinformation_and_covid19_what_reddit_is_doing/ (accessed on 29 November 2020).
- Silverman, H. Helping Fact-Checkers Identify False Claims Faster. 2019. Available online: https://about.fb.com/news/2019/12/helping-fact-checkers/ (accessed on 29 November 2020).
- Conroy, N.K.; Rubin, V.L.; Chen, Y. Automatic deception detection: Methods for finding fake news. Proc. Assoc. Inf. Sci. Technol. 2015, 52, 1–4. [Google Scholar] [CrossRef] [Green Version]
- Shu, K.; Cui, L.; Wang, S.; Lee, D.; Liu, H. dEFEND. In Proceedings of the 25th ACM SIGKDD International Conference on Knowledge Discovery & Data Mining, Anchorage, AK, USA, 4–8 August 2019; Teredesai, A., Kumar, V., Li, Y., Rosales, R., Terzi, E., Karypis, G., Eds.; ACM: New York, NY, USA, 2019; pp. 395–405. [Google Scholar] [CrossRef]
- Karadzhov, G.; Nakov, P.; Màrquez, L.; Barrón-Cedeño, A.; Koychev, I. Fully Automated Fact Checking Using External Sources. arXiv 2017, arXiv:1710.00341. [Google Scholar]
- Griffith, M.; Spies, N.C.; Krysiak, K.; McMichael, J.F.; Coffman, A.C.; Danos, A.M.; Ainscough, B.J.; Ramirez, C.A.; Rieke, D.T.; Kujan, L.; et al. CIViC is a community knowledgebase for expert crowdsourcing the clinical interpretation of variants in cancer. Nat. Genet. 2017, 49, 170–174. [Google Scholar] [CrossRef] [Green Version]
- Keuleers, E.; Stevens, M.; Mandera, P.; Brysbaert, M. Word knowledge in the crowd: Measuring vocabulary size and word prevalence in a massive online experiment. Q. J. Exp. Psychol. 2015, 68, 1665–1692. [Google Scholar] [CrossRef]
- Schlagwein, D.; Bjorn-Andersen, N. Organizational Learning with Crowdsourcing: The Revelatory Case of LEGO. J. Assoc. Inf. Syst. 2014, 15, 754–778. [Google Scholar] [CrossRef]
- Pennycook, G.; Rand, D.G. Fighting misinformation on social media using crowdsourced judgments of news source quality. Proc. Natl. Acad. Sci. USA 2019, 116, 2521–2526. [Google Scholar] [CrossRef] [Green Version]
- Pennycook, G.; Bear, A.; Collins, E.T.; Rand, D.G. The Implied Truth Effect: Attaching Warnings to a Subset of Fake News Headlines Increases Perceived Accuracy of Headlines Without Warnings. Manag. Sci. 2020. [Google Scholar] [CrossRef] [Green Version]
- Becker, J.; Porter, E.; Centola, D. The wisdom of partisan crowds. Proc. Natl. Acad. Sci. USA 2019, 116, 10717–10722. [Google Scholar] [CrossRef] [PubMed] [Green Version]
- Degroot, M.H. Reaching a Consensus. J. Am. Stat. Assoc. 1974, 69, 118–121. [Google Scholar] [CrossRef]
- Achimescu, V.; Sultanescu, D. Feeding the troll detection algorithm. First, Monday 2020. [Google Scholar] [CrossRef]
- Singer, J.B. User-generated visibility: Secondary gatekeeping in a shared media space. New Media Soc. 2014, 16, 55–73. [Google Scholar] [CrossRef]
- Wardle, C.; Derakhshan, H. Information Disorder: Toward an Interdisciplinary Framework for Research and Policy Making; Technical Report; Council of Europe: Strasbourg, France, 2017. [Google Scholar]
- Baumgartner, J.; Zannettou, S.; Keegan, B.; Squire, M.; Blackburn, J. The Pushshift Reddit Dataset. arXiv 2020, arXiv:cs.SI/2001.08435. [Google Scholar]
- Amaya, A.; Bach, R.; Keusch, F.; Kreuter, F. New Data Sources in Social Science Research: Things to Know Before Working with Reddit Data. Soc. Sci. Comput. Rev. 2019, 6. [Google Scholar] [CrossRef]
- Giachanou, A.; Zhang, G.; Rosso, P. Multimodal Multi-image Fake News Detection. In Proceedings of the 2020 IEEE 7th International Conference on Data Science and Advanced Analytics (DSAA), Sydney, Australia, 6–9 October 2020; pp. 647–654. [Google Scholar] [CrossRef]
- Paletz, S.B.F.; Auxier, B.E.; Golonka, E.M. A Multidisciplinary Framework of Information Propagation Online; Springer Briefs in Complexity; Springer: Cham, Switzerland, 2019. [Google Scholar]
- Joshi, A.; Bhattacharyya, P.; Carman, M.J. Automatic Sarcasm Detection. ACM Comput. Surv. 2017, 50, 1–22. [Google Scholar] [CrossRef]
- Zhang, S.; Zhang, X.; Chan, J.; Rosso, P. Irony detection via sentiment-based transfer learning. Inf. Process. Manag. 2019, 56, 1633–1644. [Google Scholar] [CrossRef]
- DiMaggio, P.J.; Powell, W.W. The Iron Cage Revisited: Institutional Isomorphism and Collective Rationality in Organizational Fields. Am. Sociol. Rev. 1983, 48, 147–160. [Google Scholar] [CrossRef] [Green Version]
- Zuckerman, E.; Kim, T.; Ukanwa, K.; von Rittmann, J. Robust Identities or Nonentities? Typecasting in the Feature-Film Labor Market. Am. J. Sociol. 2003, 108, 1018–1073. [Google Scholar] [CrossRef] [Green Version]
- Cer, D.; Yang, Y.; Kong, S.y.; Hua, N.; Limtiaco, N.; St John, R.; Constant, N.; Guajardo-Cespedes, M.; Yuan, S.; Tar, C.; et al. Universal Sentence Encoder for English. In Proceedings of the 2018 Conference on Empirical Methods in Natural Language Processing: System Demonstrations; Association for Computational Linguistics, Brussels, Belgium, 31 October–4 November 2018; pp. 169–174. [Google Scholar] [CrossRef]
Figure 1.
NLP processing pipeline. Only 2 out of 21 matching patterns shown. The Pattern SVO starts with a word with the grammatical function of subject that has the lemma “article”, “title”, “this”, or “source” (including plurals), optionally followed by one to five non-negative words, followed by the root node in the dependency structure with the lemma “be” or “feel” or “seem” or “sound”, optionally followed by one to five non-negative words, and ending with a word that has the grammatical function of a direct object, with the lemma “disinformation” or “propaganda” or “clickbait” or “falsehood”. It can match phrases such as “These articles sure feel like some sort of disinformation”. Not all keywords are shown in the graph, see Appendix B.

Figure 2.
Evolution of posts flagged as false information, by subreddit type—figures extracted from the dashboard. Each point represents one week of data collection. (a) top: raw counts; (b) bottom: percent of posts.
Figure 2.
Evolution of posts flagged as false information, by subreddit type—figures extracted from the dashboard. Each point represents one week of data collection. (a) top: raw counts; (b) bottom: percent of posts.

Figure 3.
Two examples of post flagged multiple times, from the dashboard.

Figure 4.
Results of cluster analysis on sentence embeddings (2D scatterplot). The axes are the first two principal components. Most frequent words/cluster: CL1 (left): trump, says, president, pandemic, response, trump’s, white, house, donald; CL2 (up): china, chinese, wuhan, new, virus, cases, says, lockdown; CL3 (right): new, says, people, pandemic, cases, virus, patients, health, deaths, death.

Figure 5.
Screenshot of the dashboard analyzing posts flagged by users as disinformation on Reddit.

Table 1.
Examples of matched phrases for each pattern of POS matcher (notation: s = subject; v = verb; o = object; a = attribute; n = negation; i = ”I”; y = ”you”; st = ”stop”).
Table 1.
Examples of matched phrases for each pattern of POS matcher (notation: s = subject; v = verb; o = object; a = attribute; n = negation; i = ”I”; y = ”you”; st = ”stop”).
| Patterns | Examples of Matched Phrases | Freq | |
|---|---|---|---|
| o, ao | Fake news! | Clickbait! | 35.8% |
| svo, svao | The whole post is disinformation. | This has to be fake news. | 27.0% |
| sva, svna, svna2 | Title is misleading. | Source is not reliable. | 15.5% |
| nao | Not a reliable source. | Not a correct headline! | 12.4% |
| vo, vao | Looks like false news. | Smells like propaganda | 3.2% |
| stvo, stvao | Quit spreading misinformation. | Stop posting fake news. | 2.8% |
| ivo, ivao | I call bullshit. | I’m calling bs. | 2.0% |
| yvo, yvao | You are spreading falsehoods. | You’re posting false information. | 0.4% |
| ivsva, ivsvo, ivsvao | I think this is propaganda. | I know that the title is false. | 0.3% |
| svsv, svsav | This is how fake news spreads. | This is what fake news looks like. | 0.1% |
| Total | All patterns | 100.0% |
Table 2.
Description of the three manually annotated sets of comments used to validate and test the POS matcher.
Table 2.
Description of the three manually annotated sets of comments used to validate and test the POS matcher.
| Set 1 | Set 2 | Set 3 | Total | |
|---|---|---|---|---|
| Period | January–July 2020 | January–July 2020 | August–October 2020 | |
| Extracted from | keyword matches | POS matches | keyword matches | |
| N (number of comments) | 600 | 600 | 300 | 1500 |
| Valid N | 573 | 591 | 291 | 1455 |
| Used for: | Training set for ML models | Test set for ML models | ||
| Additional use: | Validation set for POS matcher | Validation set for POS matcher |
Table 3.
Classification Diagnostics. Precision and recall for Keyword and POS matchers.
| Flag Type | prec_KEYWORD | Precision_POS | Recall_POS | F1_POS | n_Comments |
|---|---|---|---|---|---|
| misleading | 0.83 | 0.99 | 0.44 | 0.61 | 233 |
| propaganda | 0.51 | 0.87 | 0.48 | 0.62 | 248 |
| fake news | 0.27 | 0.73 | 0.54 | 0.62 | 257 |
| unreliable | 0.15 | 0.67 | 0.36 | 0.47 | 204 |
| disinformation | 0.29 | 0.65 | 0.32 | 0.43 | 216 |
| bullshit | 0.23 | 0.52 | 0.50 | 0.51 | 241 |
Table 4.
Classification diagnostics on the test set for POS matcher and two machine learning models.
Table 4.
Classification diagnostics on the test set for POS matcher and two machine learning models.
| POS Matcher | L1/L2 Logistic Regression | Random Forests | |
|---|---|---|---|
| accuracy | 0.72 | 0.70 | 0.76 |
| precision | 0.73 | 0.62 | 0.78 |
| recall | 0.45 | 0.60 | 0.54 |
| F1 | 0.55 | 0.61 | 0.64 |
| AUC-ROC | 0.67 | 0.68 | 0.72 |
| 291 | 291 | 291 |
Table 5.
Descriptive statistics on Reddit data extracted from 1 January to 30 June 2020.
| N | N/Month | N/Week | N/Day | |
|---|---|---|---|---|
| posts | 3,395,847 | 565,974 | 147,645.52 | 18,658.50 |
| comments | 17,254,621 | 2,875,770 | 750,200.91 | 94,805.61 |
| keyword matches | 522,320 | 87,053 | 22,709.57 | 2869.89 |
| POS matches | 33,609 | 5,601 | 1,461.26 | 184.66 |
Publisher’s Note: MDPI stays neutral with regard to jurisdictional claims in published maps and institutional affiliations. |
© 2020 by the authors. Licensee MDPI, Basel, Switzerland. This article is an open access article distributed under the terms and conditions of the Creative Commons Attribution (CC BY) license (http://creativecommons.org/licenses/by/4.0/).
Share and Cite
MDPI and ACS Style
Achimescu, V.; Chachev, P.D. Raising the Flag: Monitoring User Perceived Disinformation on Reddit. Information 2021, 12, 4. https://doi.org/10.3390/info12010004
AMA Style
Achimescu V, Chachev PD. Raising the Flag: Monitoring User Perceived Disinformation on Reddit. Information. 2021; 12(1):4. https://doi.org/10.3390/info12010004
Chicago/Turabian StyleAchimescu, Vlad, and Pavel Dimitrov Chachev. 2021. "Raising the Flag: Monitoring User Perceived Disinformation on Reddit" Information 12, no. 1: 4. https://doi.org/10.3390/info12010004
Note that from the first issue of 2016, this journal uses article numbers instead of page numbers. See further details here.