Worldwide Availability of Maritime Medium-Frequency Radio Infrastructure for R-Mode-Supported Navigation

German Aerospace Center (DLR), Institute of Communications and Navigation, Kalkhorstweg 53, 17235 Neustrelitz, Germany
*
Author to whom correspondence should be addressed.
J. Mar. Sci. Eng. 2020, 8(3), 209; https://doi.org/10.3390/jmse8030209
Submission received: 10 January 2020
/
Revised: 6 March 2020
/
Accepted: 11 March 2020
/
Published: 18 March 2020
(This article belongs to the Special Issue Maritime Traffic Engineering and International Symposium Information on Ships Conference MTE-ISIS 2019)
Abstract
:The Ranging Mode (R-Mode), a maritime terrestrial navigation system under development, is a promising approach to increase the resilient provision of position, navigation and timing (PNT) information for bridge instruments, which rely on Global Navigation Satellite Systems (GNSS). The R-Mode utilizes existing maritime radio infrastructure such as marine radio beacons, which support maritime traffic with more reliable and accurate PNT data in areas with challenging conditions. This paper analyzes the potential service, which the R-Mode could provide to the mariner if worldwide radio beacons were upgraded to broadcast R-Mode signals. The authors assumed for this study that the R-Mode is available in the service area of the 357 operational radio beacons. The comparison with the maritime traffic, which was generated from a one-day worldwide Automatic Identification System (AIS) Class A dataset, showed that on average, 67% of ships would operate in a global R-Mode service area, 40% of ships would see at least three and 25% of ships would see at least four radio beacons at a time. This means that R-Mode would support 25% to 40% of all ships with position and 67% of all ships with PNT integrity information. The relatively high number of supported ships compared to the total radio beacon coverage of about 9% of the earth’s surface is caused by the good coverage of busy ports and areas such as the coast of China, North Sea and Baltic Sea. These numbers emphasize the importance of marine radio beacons for the R-Mode system.
1. Introduction
Maritime traffic today is, with respect to navigation, tightly coupled on one or several Global Navigation Satellite Systems (GNSS). Many bridge systems use position, navigation and timing (PNT) information provided by GNSS receivers for their data processing, synchronization or information to the mariner. Unfortunately, GNSS signals are very weak when they arrive at the user so they are prone to interferences [1]. Furthermore, the ionosphere degrades the GNSS performance [2]. In order to provide reliable PNT information, additional sensors have to be included [1,3].
One approach is to use, in addition to satellite-based absolute positioning, terrestrial sources for positioning. Here, the low-frequency navigation systems Loran-C/eLoran and Chayka were developed in the past to provide positioning over wide areas of the earth’s surface. Since several countries have started decommissioning Loran-C sites, it is very unlikely that it will again become a global system in the future.
An alternative terrestrial approach is the R-Mode (Ranging Mode) [4]. Here, an existing maritime radio infrastructure will be synchronized with 10 ns accuracy with an external R-Mode reference time [5]. The radio infrastructure is modified so that it is able to broadcast R-Mode signals or messages, which are carrying the R-Mode time information, together with the communication signal or messages of the legacy service. The user measures either the time of arrival of the R-Mode broadcast or the time difference of the arrival of the broadcast from two R-Mode stations and can from this calculate the distance or distance difference and finally its own position with a trilateration or hyperbolic lateration approach [6,7,8]. Transmitter sites considered so far are marine radio beacons [6,9] and base stations of the Automatic Identification System (AIS) [6,7,10] or the Very high frequency Data Exchange System (VDES) [11]. These systems share the common factor that they are well distributed along the shore of waters with high traffic density and/or challenging navigation conditions.
The R-Mode system is designed as a backup for GNSS. It extends the positioning capabilities of the mariner with additional navigation signals, which are transmitted in different frequency bands and using different propagation paths as compared to GNSS. Furthermore, the R-Mode signals are received with higher signal strength by the user. They are therefore unaffected by the sources of GNSS signal disturbances. Additionally, the R-Mode is a cost efficient way to implement a terrestrial navigation system by reusing existing maritime radio infrastructure.
Marine radio beacons are providing a differential GNSS (DGNSS) correction service with Medium Frequency (MF) broadcasts within a coverage of up to 550 km. Using this correction service enables the mariner to perform positioning with an accuracy better than 10 m [12], which is needed for sailing in coastal and restricted waters, harbor entrances, harbor approaches and inland waterways [13,14]. Any adaptation of marine radio beacons on the R-Mode service has to be done without disturbing the legacy service and equipment. One approach that makes use of the entire channel of the 500 Hz–1000 Hz bandwidth, which is dedicated to each radio beacon, is to add two continuous wave signals near the channel boundaries [15,16]. By estimating the phases of the two continuous wave signal components at full seconds, it is possible to measure the distance [15].
AIS is a communication system for exchanging relevant information between ships and base stations operating in the Very High Frequency (VHF) radio band around 162 MHz [17]. It uses a time-division multiple access method to separate the broadcasts of ships and ashore base stations. Each data slot has a length of about 27 ms. Depending on the antenna heights of the transmitter and receiver, the signals can usually be received up to a distance of several 10 km. R-Mode can be implemented on AIS using customized AIS messages, which could use up to five AIS slots [7]. AIS works with a 9.6 kbit/s data rate on two channels with a bandwidth of 25 kHz each.
VDES is the successor of AIS. It includes AIS frequencies and services, and has additional channels of up to a 100 kHz bandwidth available for the communication [18]. It also usesthe time-division multiple access method with 2250 slots per minute. With VDES, data rates of 307.2 kbits/s are possible. Using VDES for R-Mode transmissions would significantly increases the R-Mode performance as compared to AIS [11,19]. Therefore, currently the VHF R-Mode activities concentrate on the usage of VDES.
This paper focuses on the potential availability of marine radio-beacon signals for R-Mode positioning and support of the integrity evaluation of PNT information. It presumes that all marine radio beacons are upgraded to broadcast MF R-Mode signals that enable ranging [15]. Depending on the number of received R-Mode signals, the mariner’s multi-system ship borne radio navigation receiver (MSR) [20] is able to perform position and timing estimation based on R-Mode or even perform integrity checks of the PNT information. For the position and timing estimation, the signals of four R-Mode stations are necessary [5]. If additional information such as bearing, rough position or timing is available, three R-Mode signals might be sufficient. Any number of R-Mode signals can be used in the MSR for integrity checks of the PNT information.
Due to the limited range of marine radio beacons of 50–550 km [21], the R-Mode will not cover the entire world. It is restricted to waters near the shore where higher requirements were defined by the International Association of Marine Aids to Navigation and Lighthouse Authorities (IALA) for a backup system [22]. The paper shows which services could be offered based on the areas analyzed to increase the safety of maritime transport with integrity checks, positioning with additional information and full R-Mode-based positioning.
The density of maritime traffic in a region depends on many factors, e.g., geographical conditions and nearby important ports. The traffic is therefore far from evenly distributed. With AIS, a system exists that is mandatory for medium and large ships (e.g., merchant and passenger ships). These ships have to implement the International Convention for the Safety of Life at Sea (SOLAS), which means they are obliged to have an AIS transceiver on board [23]. Their transmission of dynamic and static ship data can be used to track single ships. Unfortunately, the range of the AIS transmission is limited to the line of sight. Therefore, only a combination of the received AIS messages from many AIS base stations ashore and AIS satellites enable the generation of a worldwide maritime traffic picture. Within this paper, a combined AIS dataset from shore and satellite AIS receivers is used to estimate the worldwide maritime traffic density and to combine it with the potential availability of the R-Mode service.
2. Worldwide Potential Service Area for the Medium-Frequency R-Mode
Due to the high demand in position and timing backup on a global scope, it is necessary to provide an overview of the possible service area of the R-Mode system using a worldwide coverage prediction. Based on the assumption that marine radio beacons’ nominal ranges provide a reasonable estimate of an R-Mode station range, this coverage prediction provides an overview of possibly covered areas.
To compile a comprehensive overview of available marine radio beacons, it was necessary to create a list of all operational radio beacons and their respective position and nominal range. The IALA was commissioned by the International Telecommunication Union (ITU) to coordinate the allocation of the unique identification numbers for the marine radio beacons [24], hence the IALA keeps a list of all worldwide radio beacons [21] and their respective properties. It has to be noted that the IALA gives no guarantee for correct information of the data provided, since the global list is only a compilation of the data provided by national maritime service providers. All subsequent calculations are based on data from the official IALA list dated to March 2019 [21], which is also made available in machine-readable form on an unofficial website [25], which was used for further data processing. A cross-check of the exported list with the IALA list confirms accordance.
Worldwide coverage calculations are intended to show a quantifiable evaluation of the potential R-Mode service area in the case of all radio beacons transmitting R-Mode signals. Resulting data is needed to create a worldwide map showing a visually perceptible image of the possible R-Mode service area and calculate the potential coverage of worldwide maritime traffic and high-volume ports. The base parameter for estimating the coverage of a potential service area is the total number of stations in range at a specific point on the map. Since the levels of implementation of the R-Mode system strongly rely on the number of available signals, a coverage map has to give the number of radio beacons in range using a specified spatial resolution. To simplify the process, the grid was generated by equally spaced lateral and longitudinal points using a resolution of 0.05° in either direction. Therefore, the resulting data is a uniform grid of equidistant geographical coordinates. Each cell covers, depending on the lateral distance from the equator, an area ranging from 31 to over 20 km2 near 50° north/south to near zero at the poles due to the decrease in length of meridians closer to the poles. It has to be noted that the grid is therefore uniform in geographical coordinate distances but not area-wise.
The grid values have been calculated by summing up the number of R-Mode stations for which the great circle distance between the grid-cell center and the station is smaller than the nominal range of the station. The values for the great circle distance were calculated using the Haversine formula given in Equations (1)–(3), where and are the latitude at the first and second coordinate, is the difference in longitude between the two coordinates () and represents the difference between the two lateral coordinates (.
By compared calculations, it could be shown that approximating the earth as a sphere instead of an ellipsoid is sufficient for producing desired results. All subsequent calculations are therefore based on the median radius of the earth of 6371 km, which is defined by the WGS-84 reference ellipsoid.
When choosing the resolution, it was fundamentally important that the resolution was sufficient to cover all areas in adequate resolution by keeping the size of the matrix reasonably small in order to increase the efficient use of the generated coverage-prediction matrix.
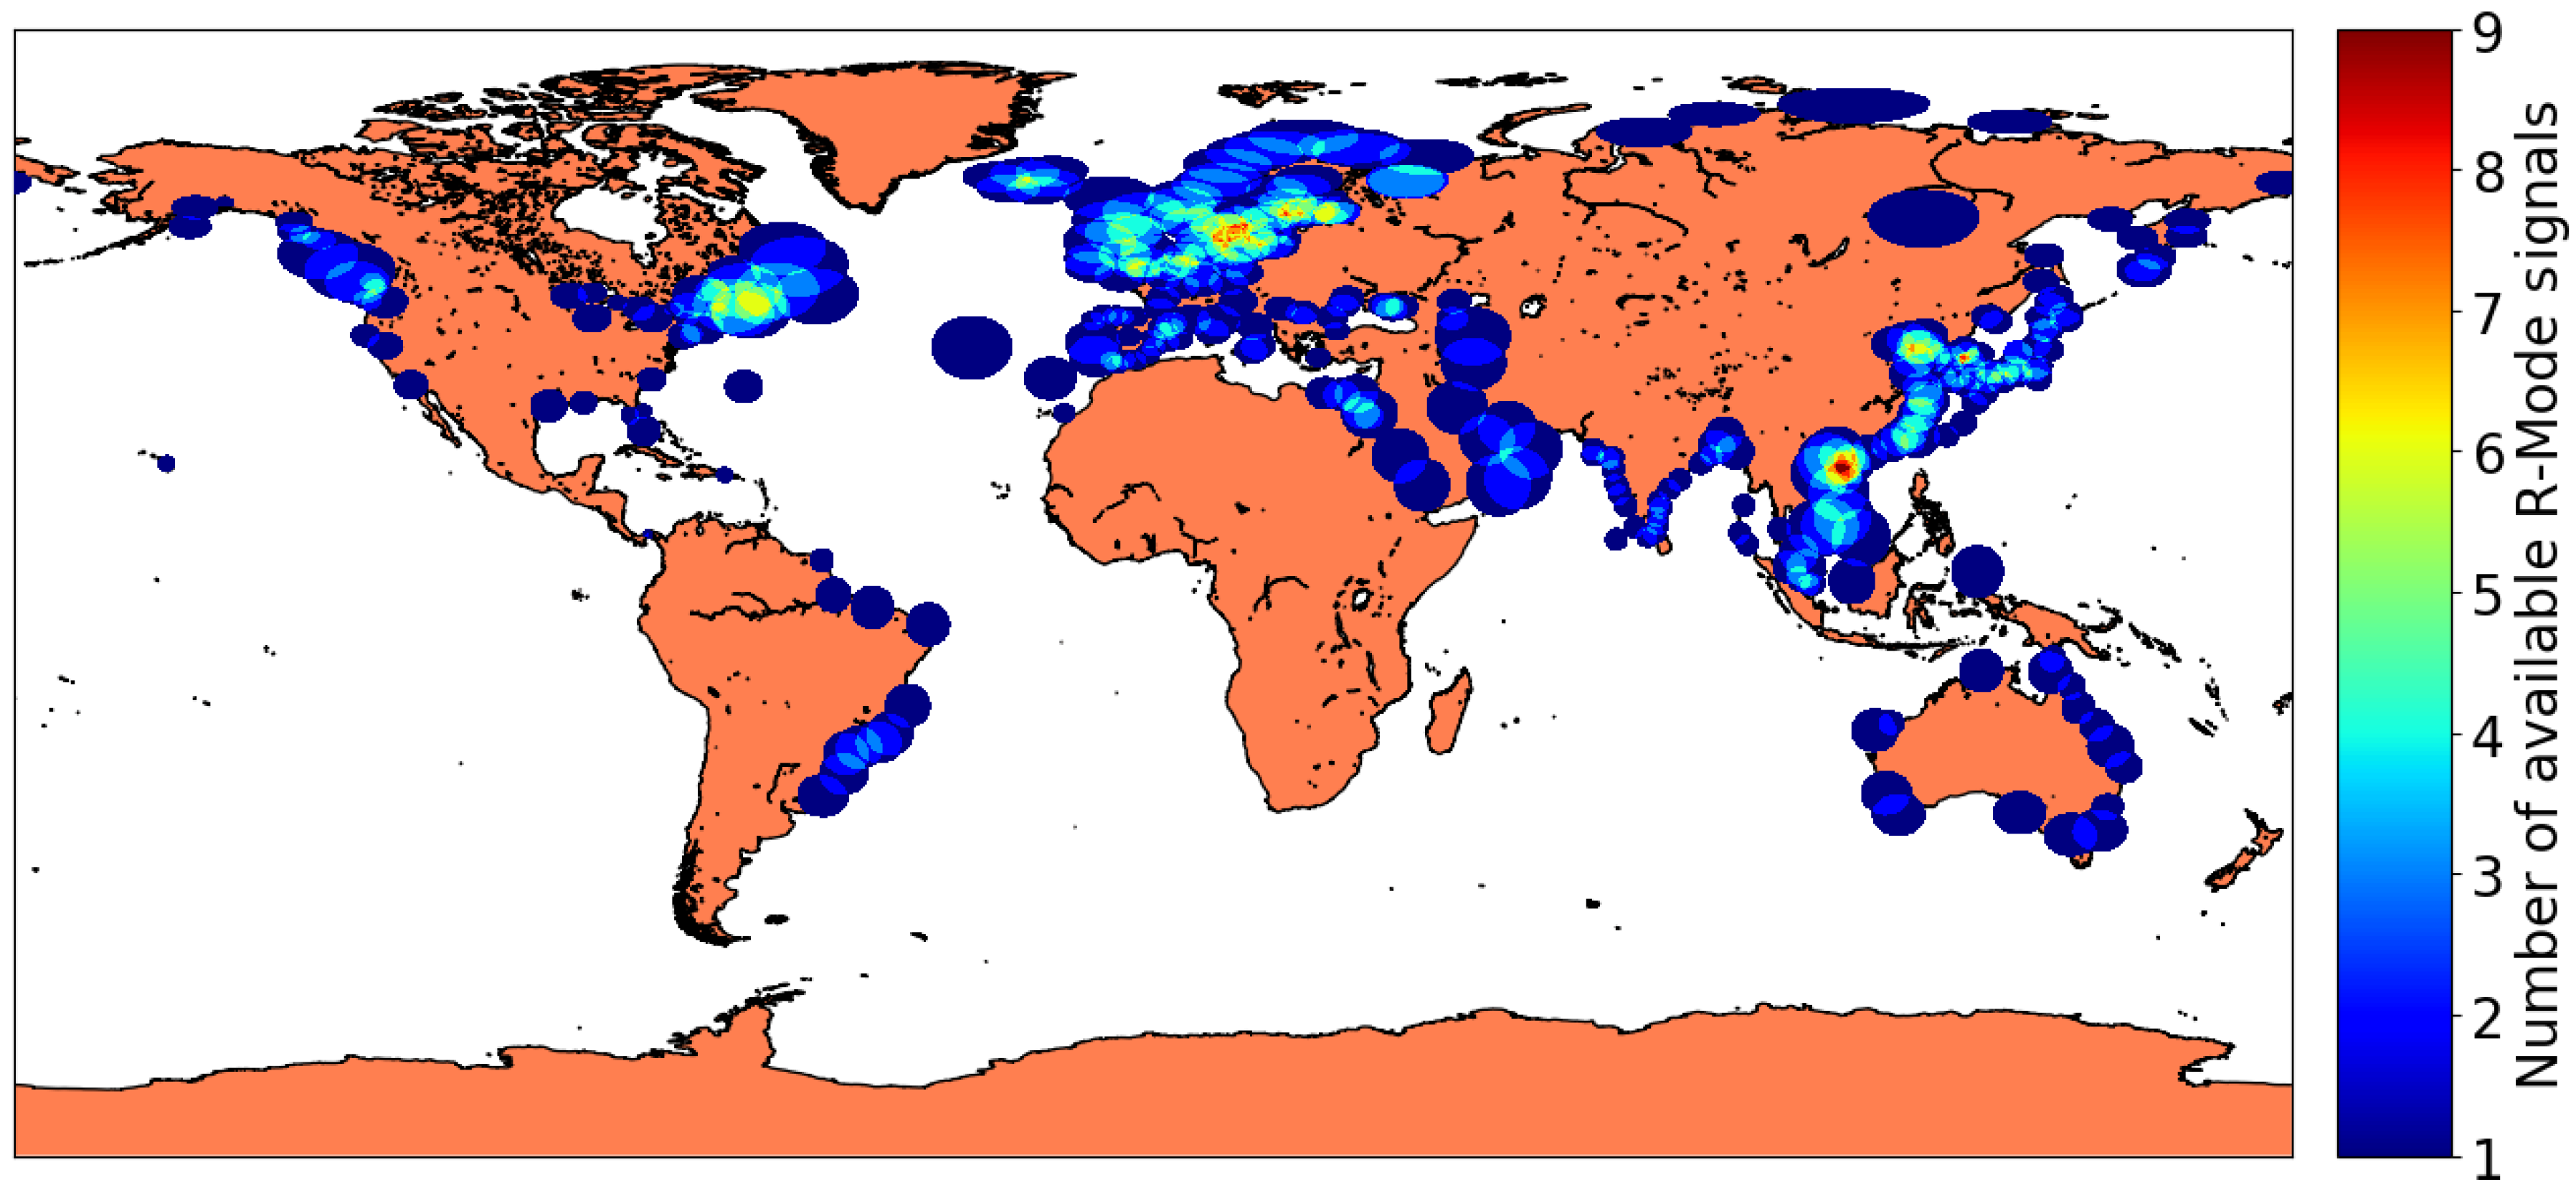
By comparing different resolution parameters provided in Figure 1, it can be seen that a resolution of 0.10° is insufficient due to finer features of coverage layers (i.e., the number of R-Mode signals available at this point) becoming lost as a result of the size of grid points available. Increasing the resolution to 0.05° yields a sufficient result by maintaining a manageable grid size and preserving finer grid features. Increasing the resolution to 0.01° would considerably increase the file size due to the fact that doubling the resolution results in 4-times the number of elements without having a particular benefit in generating a meaningful statement. Calculations have been performed for all 357 operational radio beacons contained in the IALA list [21] and visualized in Figure 2 by using an equidistant cylindrical projection.
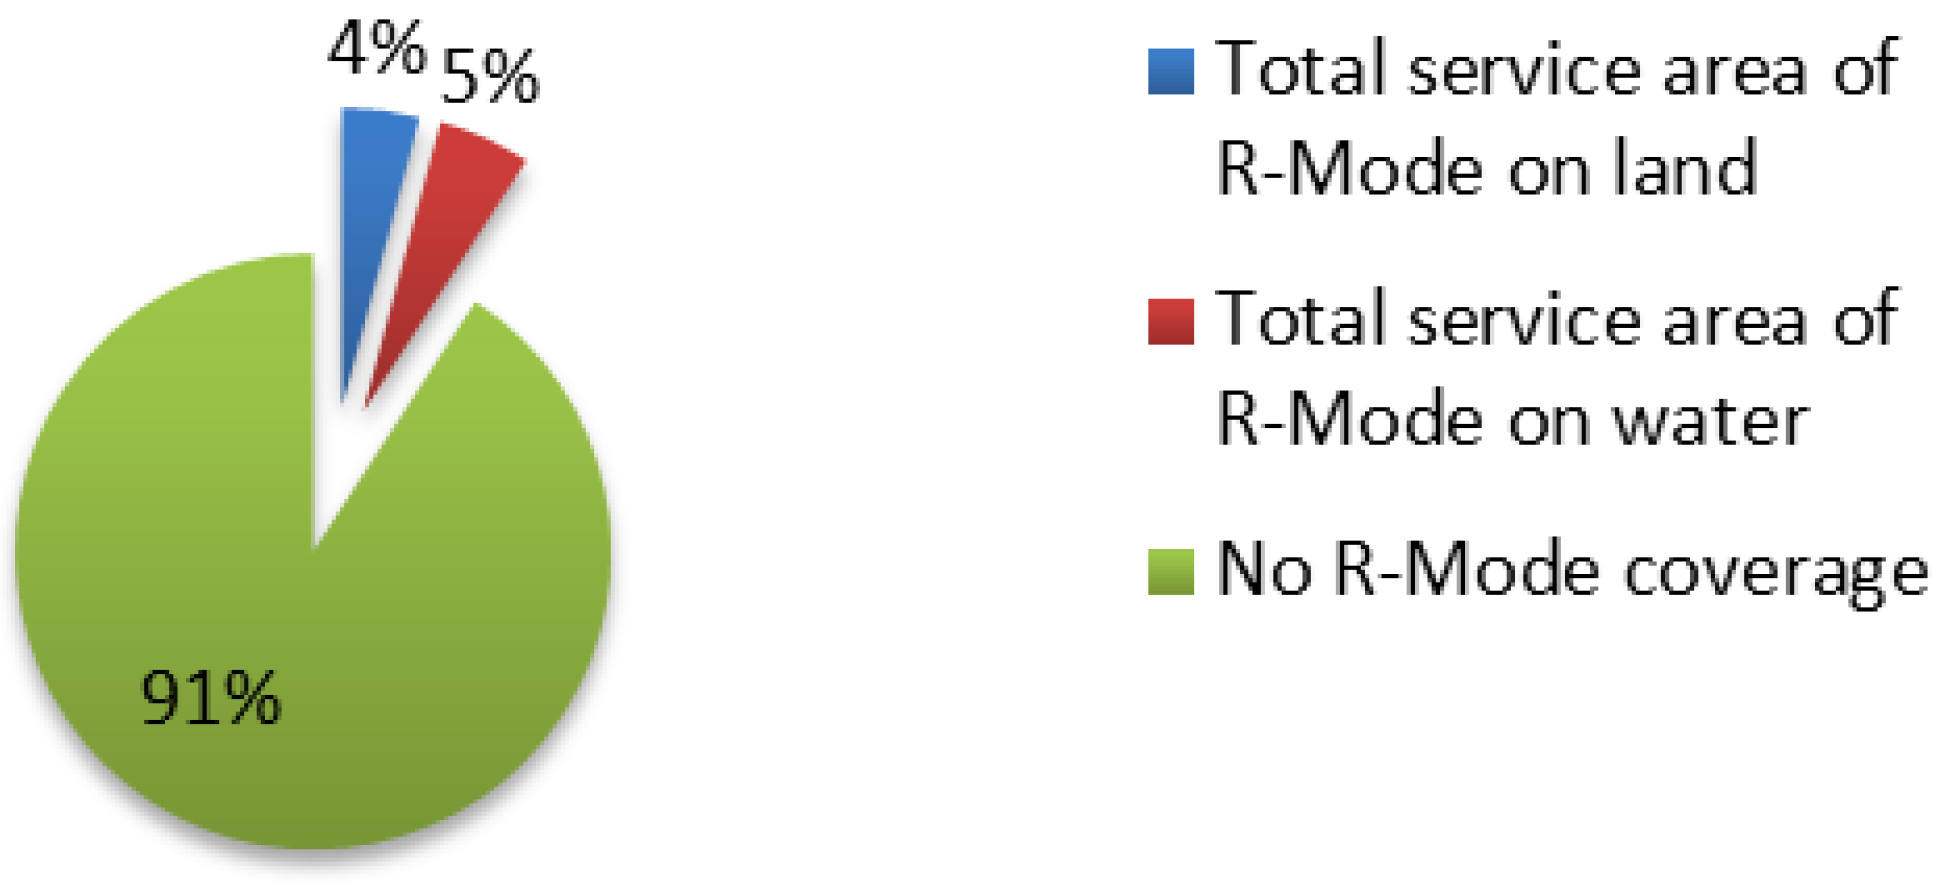
To convert the calculated coverage map into a ratio of area inside and outside of the potential R-Mode service area, each grid cell was correlated with the respected area of the grid cell in km2. From this, it can be deduced that the total area of the earth, which could be covered by one or more R-Mode stations is about 9% of the earth’s surface. This corresponds to an area of 46.8 million km2, of which about 54% is above water and 46% over land (Figure 3).
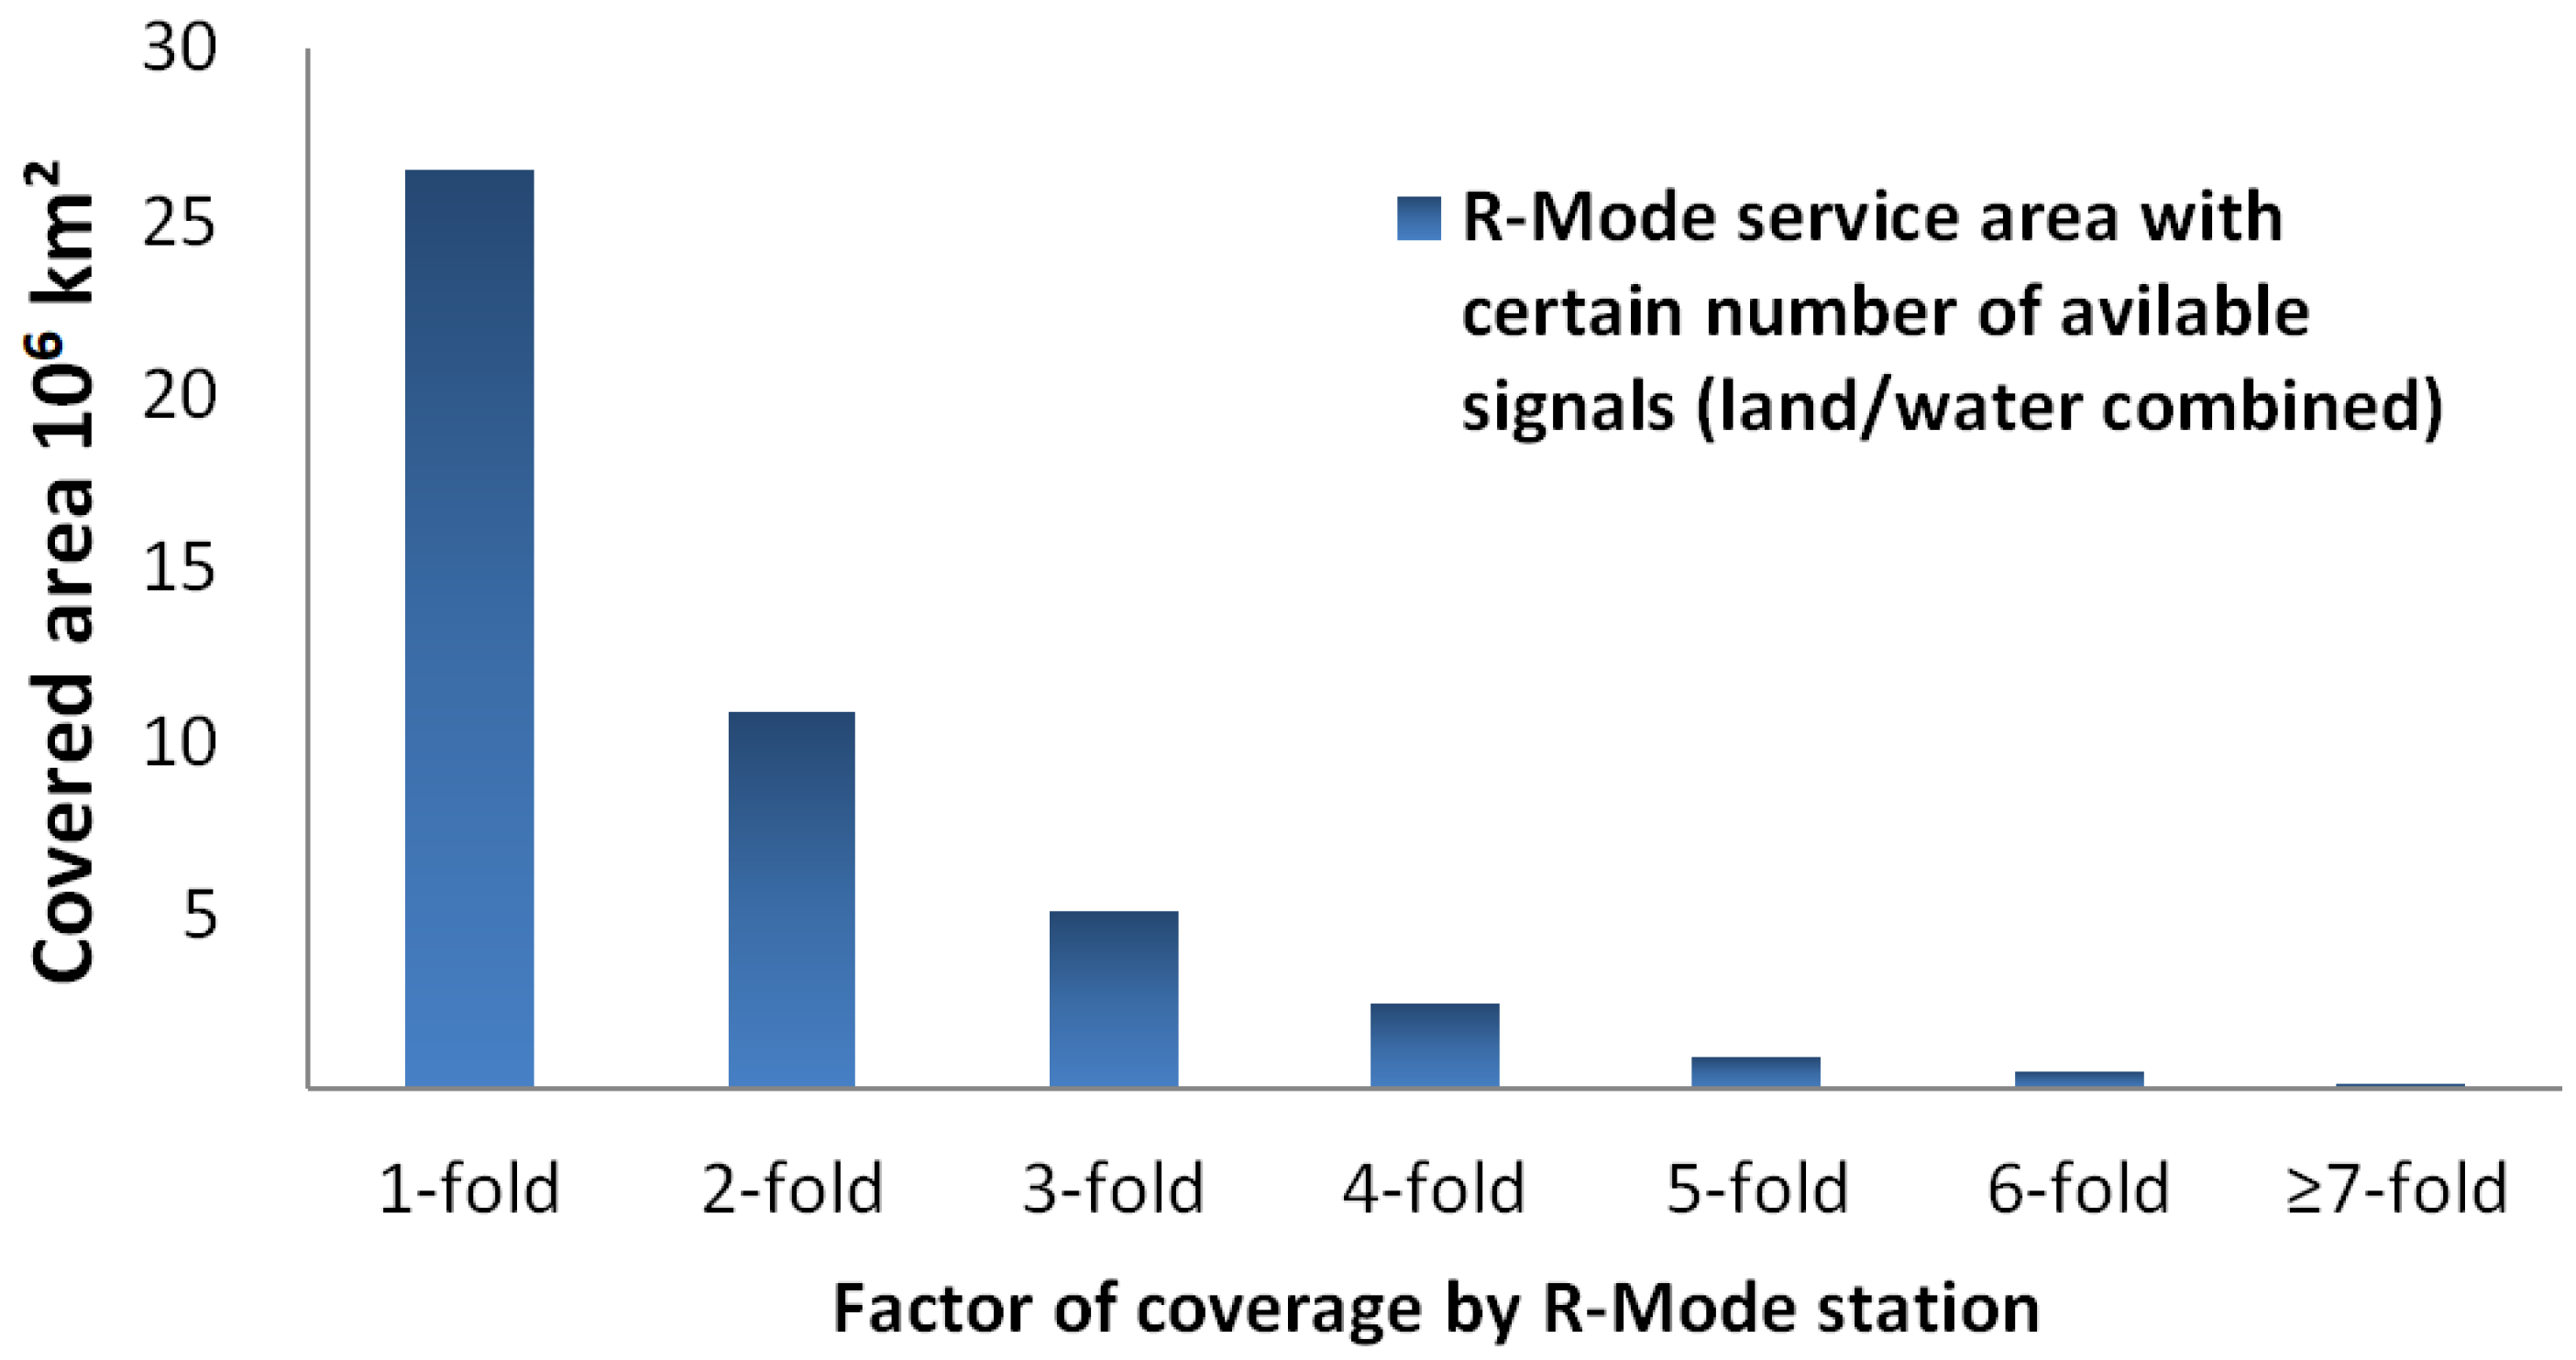
Figure 4 shows the size of the overall area where exactly one to seven and more potential R-Mode signals could be available. It is clearly visible that only in an area of 4.2 million km2, four and more stations would be available for R-Mode based positioning. It increases by 5.2 million km2 if the chosen positioning approach considers additional information such as bearing of the ranging signals or time from an accurate clock. For the overall area of 46.8 million km2, an integrity check of GNSS-based positioning is possible. This would allow early detection of possible malfunctions or failures in the GNSS receiver or GNSS and would allow the crew of a vessel to intervene quickly and in a timely manner.
The tendency of the distribution towards single and double covered areas can be explained with the provided service of the marine radio beacons. These support the maritime navigation in coastal areas, port approaches, ports and inland waterways. Since no multiple coverage is required to provide GNSS corrections and integrity information along the coastline, the stations are distributed accordingly to ensure the most efficient coverage for service providers. To ensure a continuously available service in certain areas, the radio beacon service areas have to overlap at least twice. In some areas with close coasts or international borders, a higher density of radio beacons can be found, which results in a higher number of overlapping service areas.
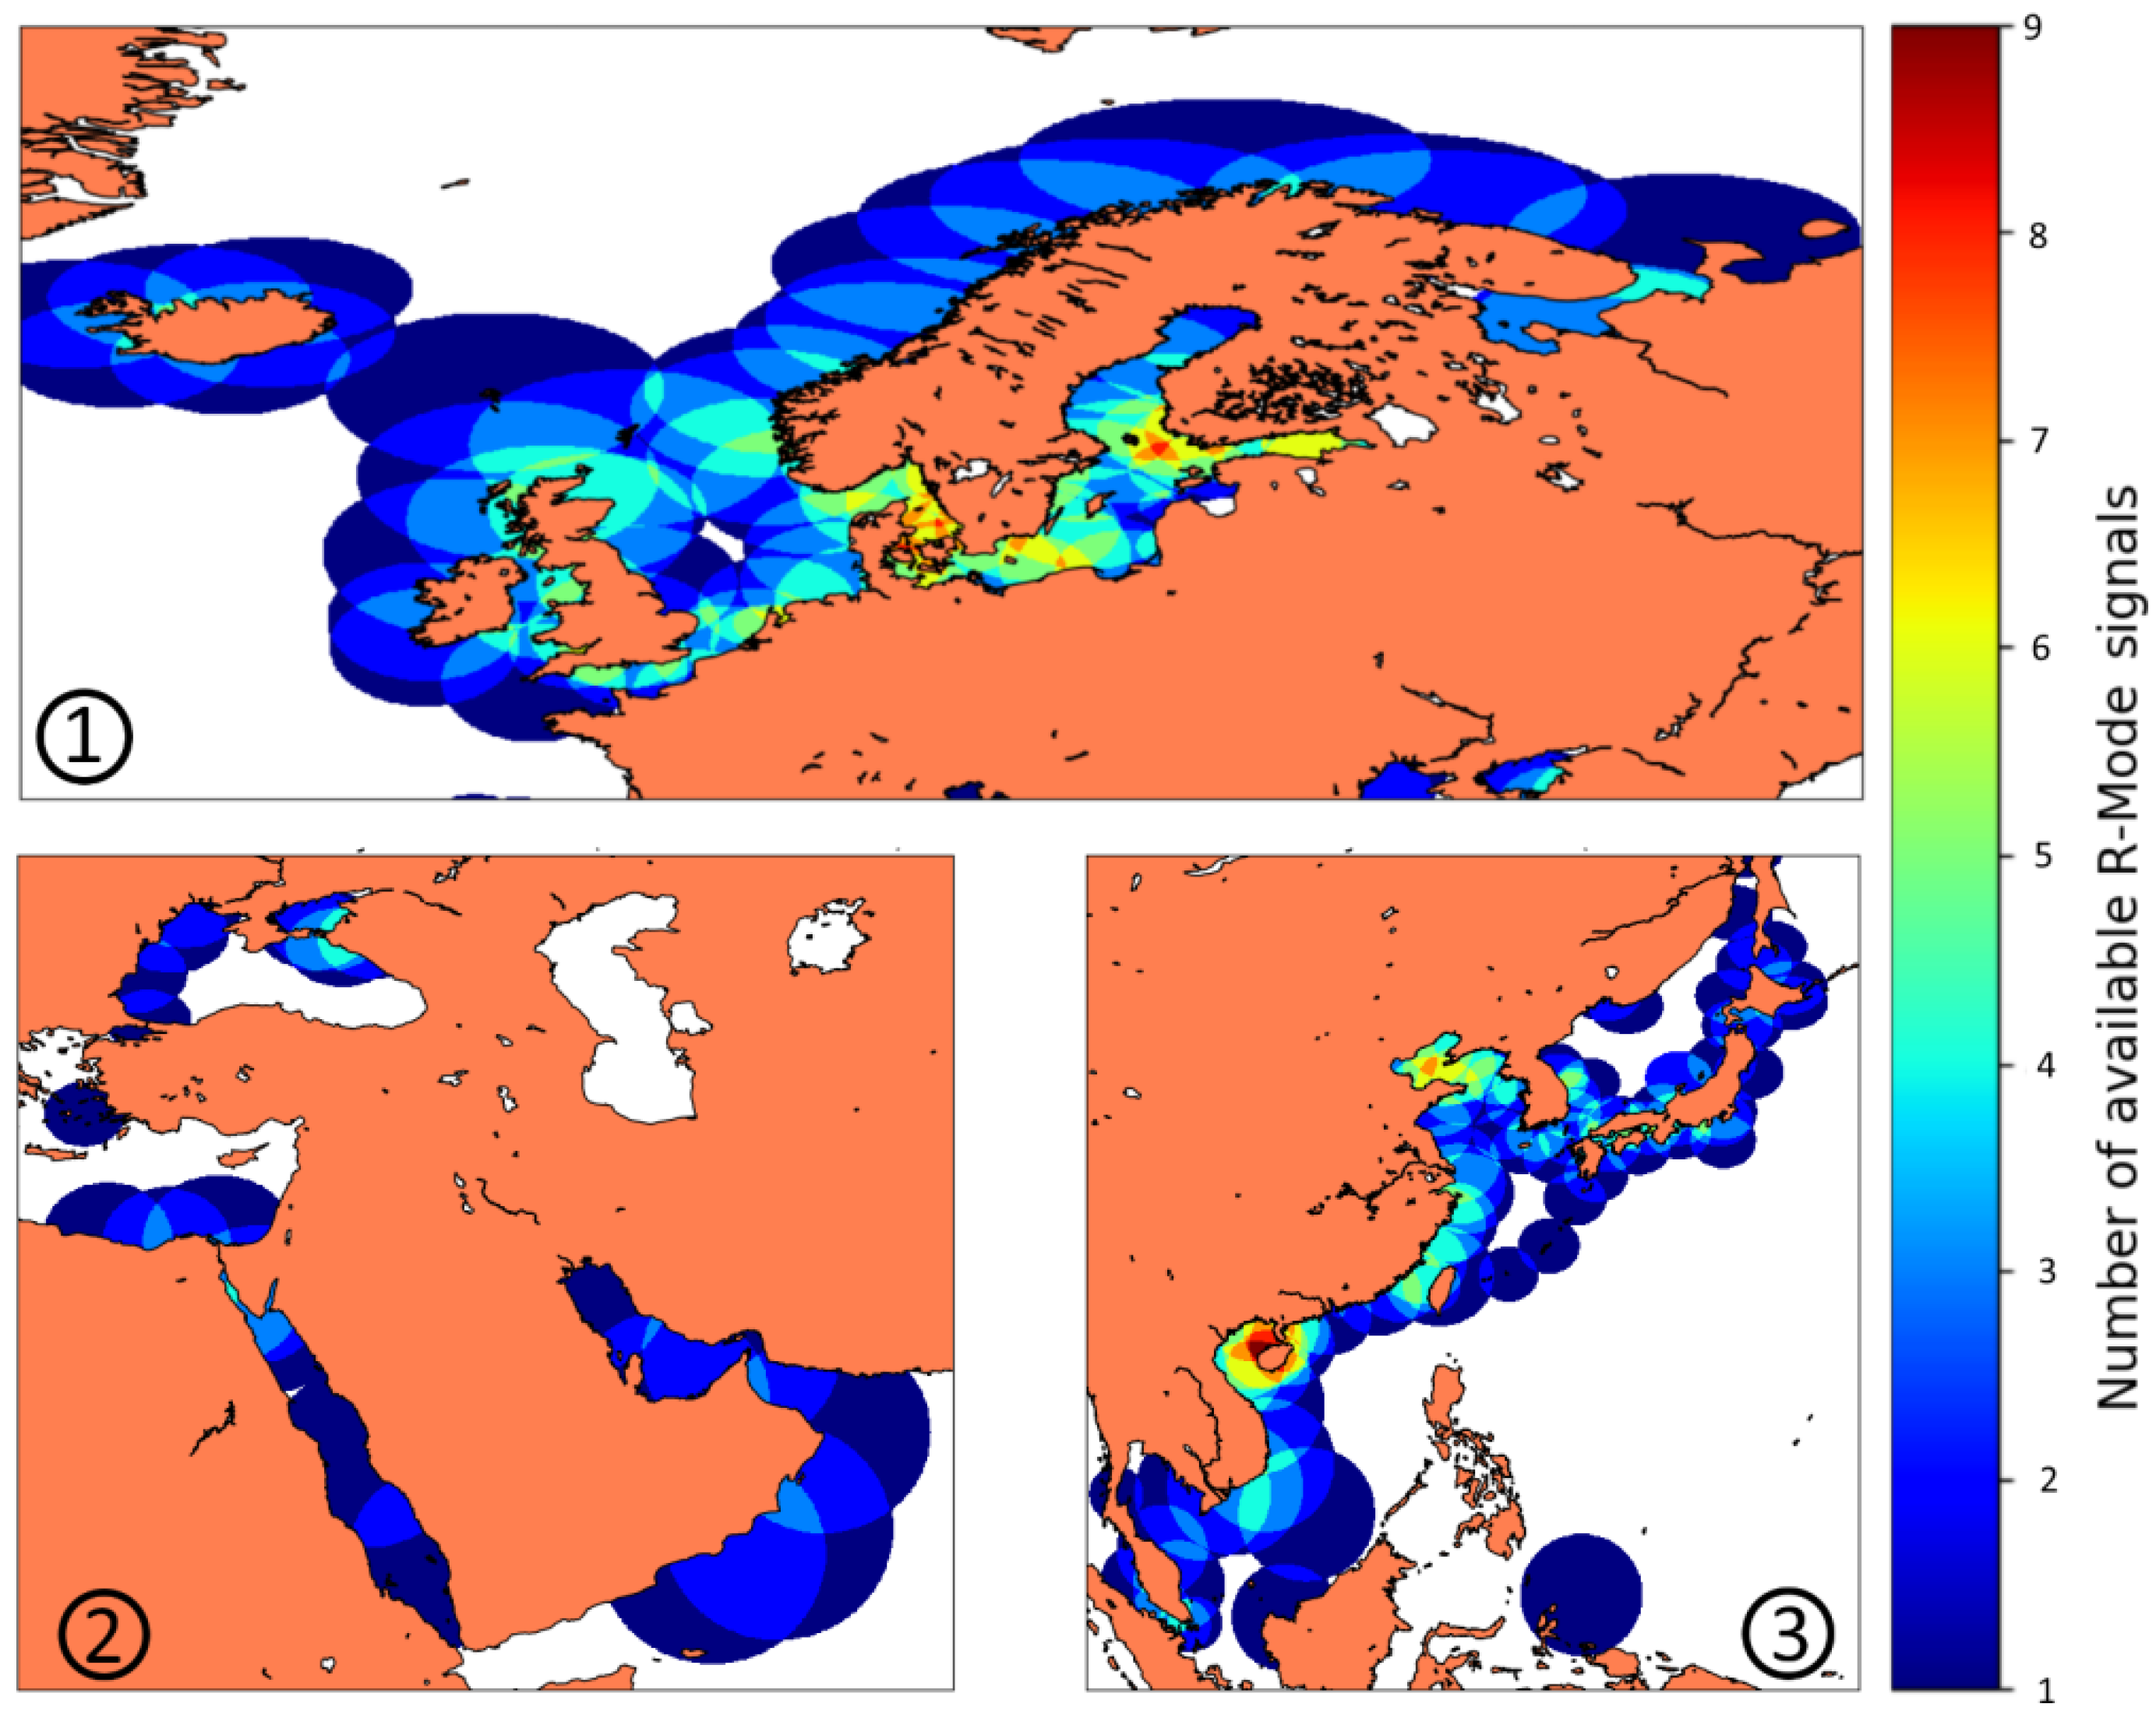
When examining potential R-Mode service areas around the globe, it can be observed that many potentially interesting areas lay within the range of radio beacons. Three examples shown in Figure 5 demonstrate the coverage of radio beacons in complex marine environments.
The areas around the North of Europe in Figure 5(1) consist of several challenging regions, including the English Channel, the traffic separation scheme of Terschelling and the Skagerrak passage. Here, an increased demand for high reliability of PNT data exists. These areas show coverage well within the bounds of positioning using R-Mode signals. Areas around the Mediterranean, especially the approaches and passage through the Suez Canal in Figure 5(2), are covered by marine radio beacons, although the coverage at the moment is still more in the 1–2-fold range. Support with PNT integrity information would therefore be feasible. The last example is the area around the south-eastern coast of China as well as Japan and Korea in Figure 5(3), which shows a particularly dense coverage and provides a good basis for the use of the R-Mode as a backup system. In particular, the well-covered and heavily frequented ports along the Chinese coast offer a good basis for the use of the R-Mode.
3. Worldwide Maritime Traffic Density
To introduce a benchmark for the assessment of the potential R-Mode area coverage, AIS traffic densities were calculated utilizing a global AIS dataset. AIS data form a good basis for the compilation of maritime situational images due to the legal obligation of ships to be equipped with AIS transceivers in accordance with SOLAS Chapter V [23]. Several processing steps were necessary for the creation of maritime situational images and the use of the received data. These are briefly described and explained below.
The traffic density , which was used in the paper, is defined as the average number of ships per area (unit km2). It is calculated for the grid cell with size as shown in Equation (4).
In order to simplify the simultaneous analysis of coverage prediction and traffic density, the same grid resolution of 0.05° was used throughout.
JAKOTA Cruise System GmbH provided a global AIS dataset containing dynamic and static data of worldwide ship traffic. Presented data in this paper shows an excerpt of the data consisting of 170 million dynamic AIS records representing about 90,000 different Maritime Mobile Service Identities (MMSI). The analyzed data has been restricted to Class A AIS messages only, due to merchant ships being the primary user of such a backup system to improve safety during critical phases of navigation (e.g., port approaches, narrow traffic separation schemes, shallow waters, etc.).
AIS data providers typically use one or more networks of AIS base stations and several AIS satellites as sources for their worldwide AIS datasets. Even with this high effort, gaps in the track of single ships cannot, however, be avoided. This results in gaps from several minutes up to hours when observing a single ship.
To overcome the problem of smaller gaps and to reduce the number of data for the evaluation of the traffic density, it was decided to split the day into 96 equal periods of 15 min length and take the position from the first dynamic AIS message in this period as the location of the ship in this period. The value of 15 min was chosen empirically. It should be large enough to have continuous tracks of the ship (at least one AIS message per period) but not so large that it jumps from one to the next period significantly in relation to the size of the radio beacon service area. A fast vessel with a speed of 20 kn will sail about 9 km in 15 min. That is only a small fraction of the nominal range of most radio beacons, which, for the 357 radio beacons, is on average 250 km.
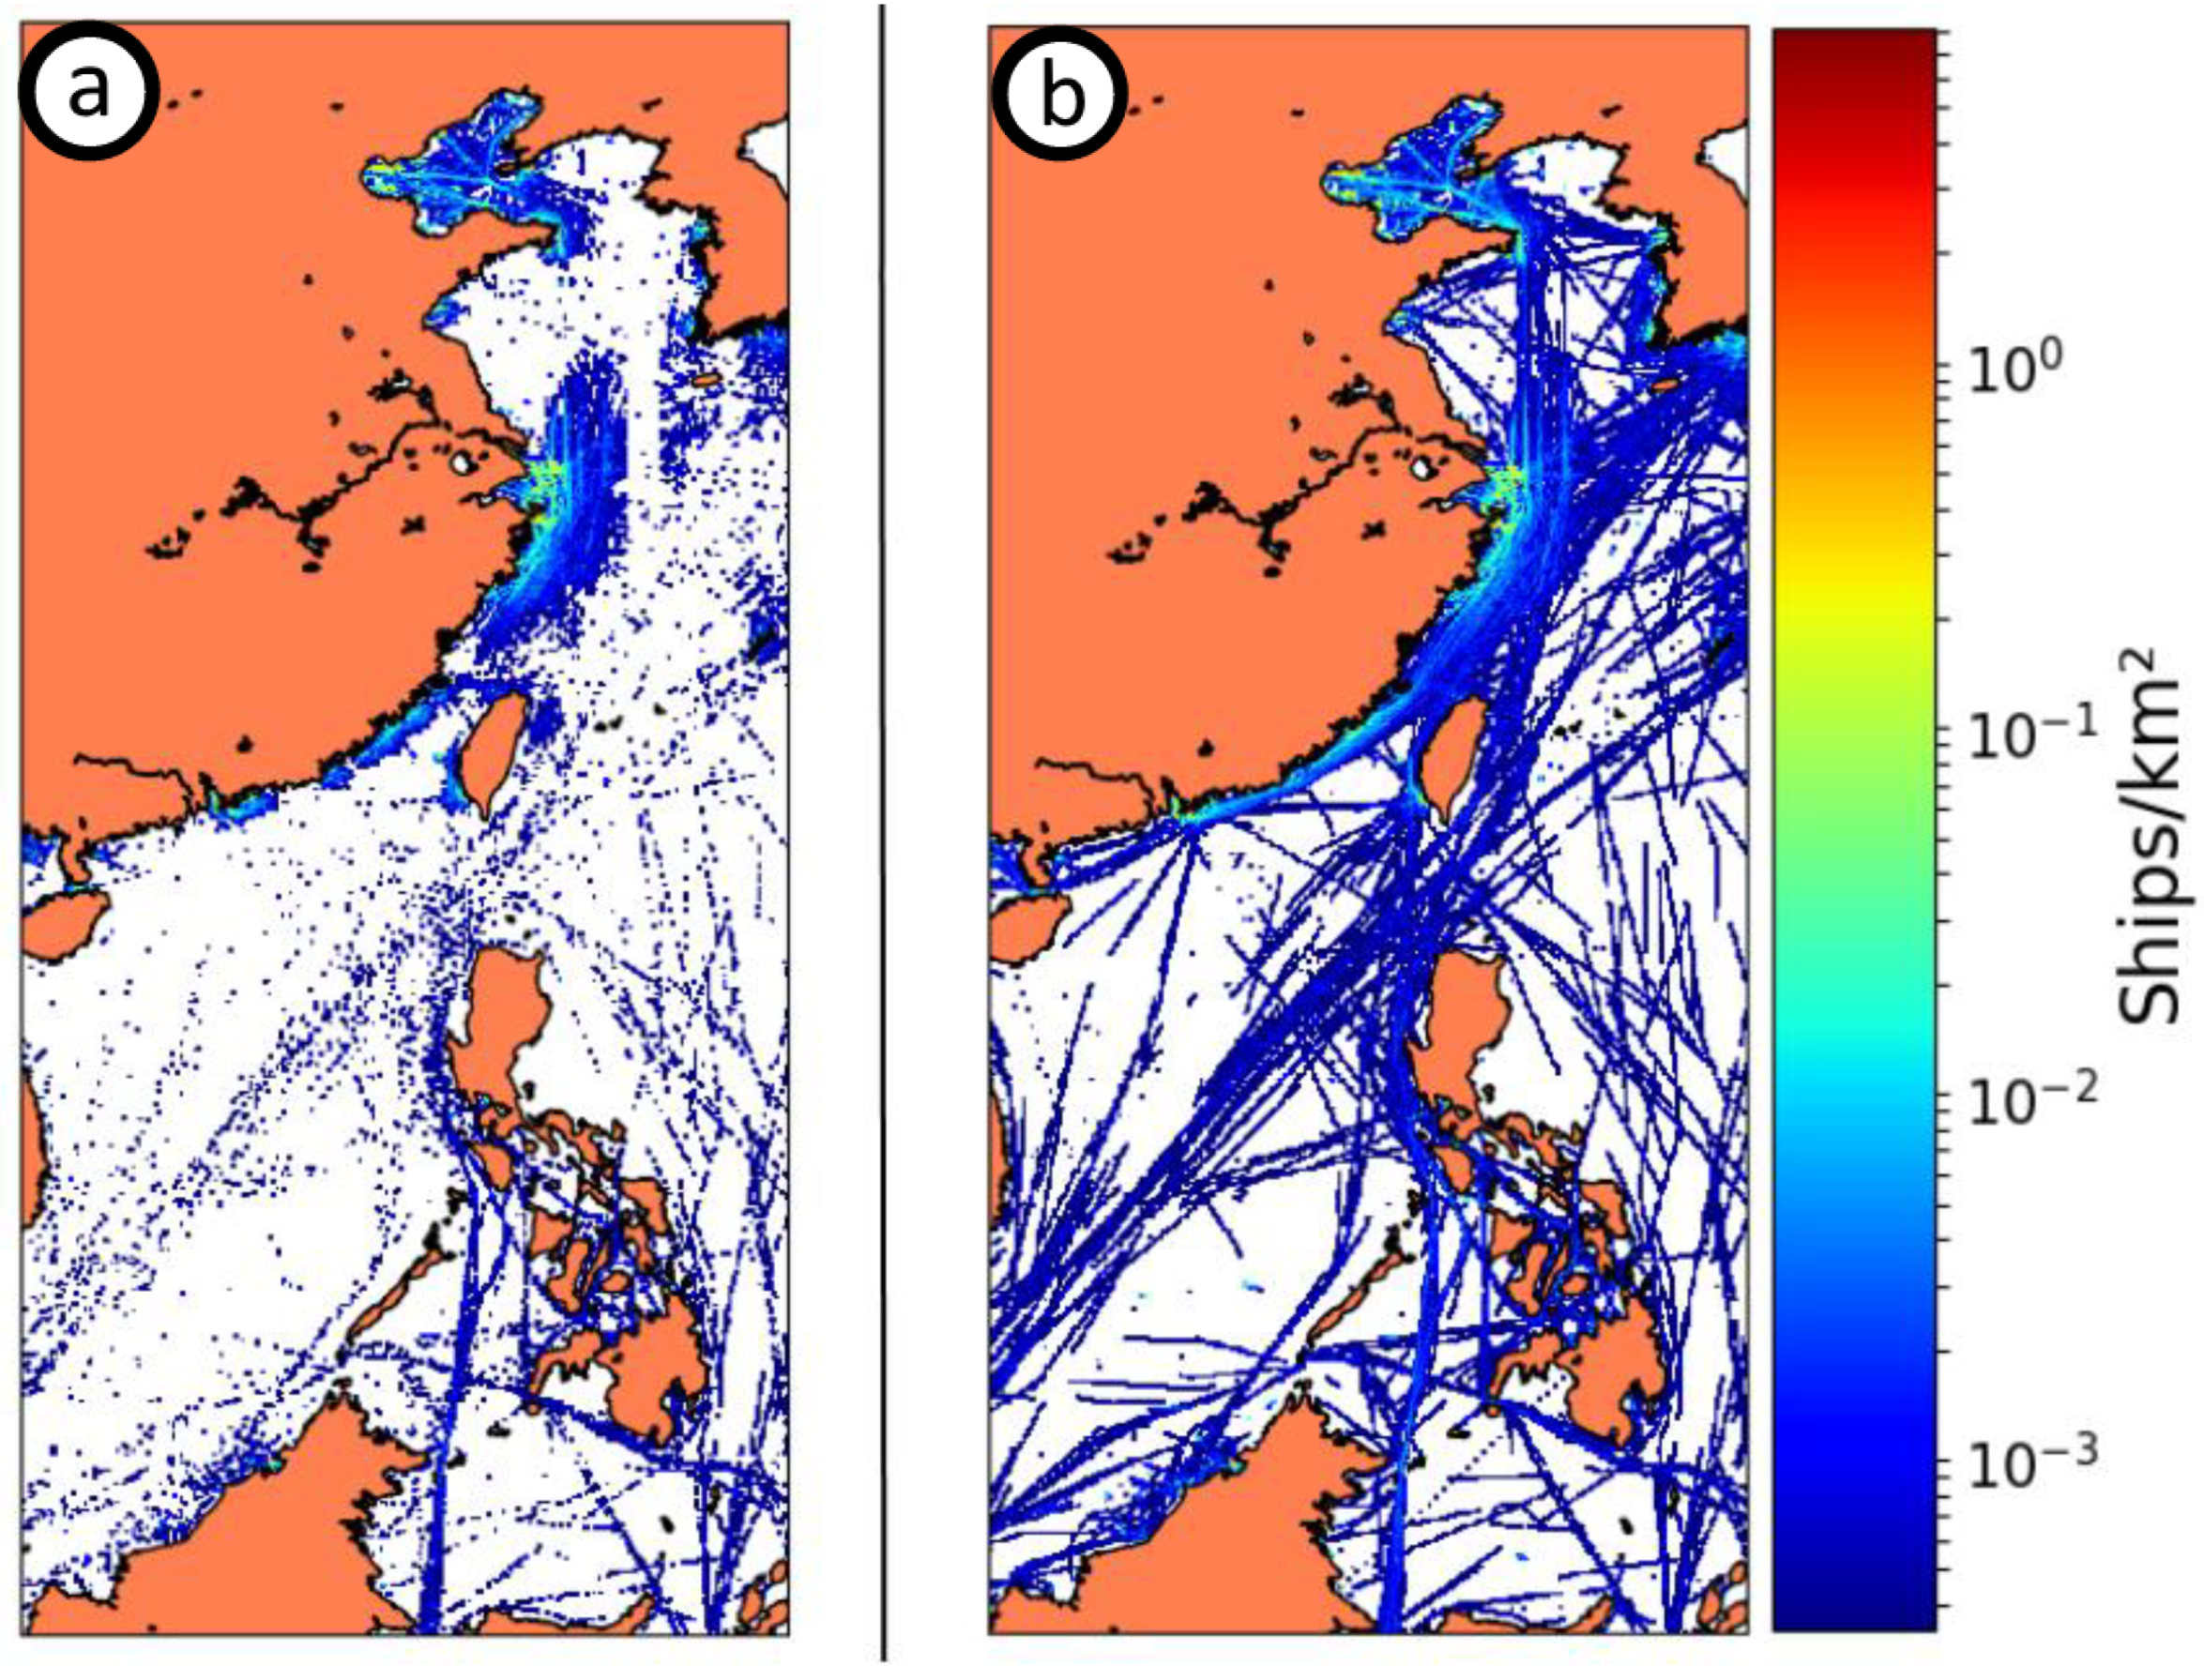
Larger gaps in the tracks of a ship that are at least 15 min long were filled with interpolated positions considering the ship positions before and after the gap. In order to prevent the erroneous interpolation in the case of insufficient data in the records, only ships with more than three observations were considered for the intermediate gap-patching. This applied to around 90% of all data being eligible for interpolation. Figure 6 shows color-coded the traffic density as ship per km2 for the cases without and with interpolation. Here, the average number of ships per grid cell, which goes into Equation (4), was calculated by summing up for all ships the number of periods that the ship stayed in this grid cell and dividing it by the number of periods (96).
Figure 6 clearly shows the success of the interpolation approach. In the case of non-interpolated data (Figure 6a), many ship tracks in the China Sea and also along the Chinese coastline show recurring gaps. With interpolation (Figure 6b), the tracks appear in the data presentation mostly as continuous lines. Only the track from 10,000 ships out of the around 90,000 MMSI could not be interpolated due to limited AIS data for the ship. Figure 6 also shows that the interpolation generates mostly realistic ship tracks. The ships sail over the water. Only in some regions with narrow waterways were a few ships seen to be sailing over land for a short time.
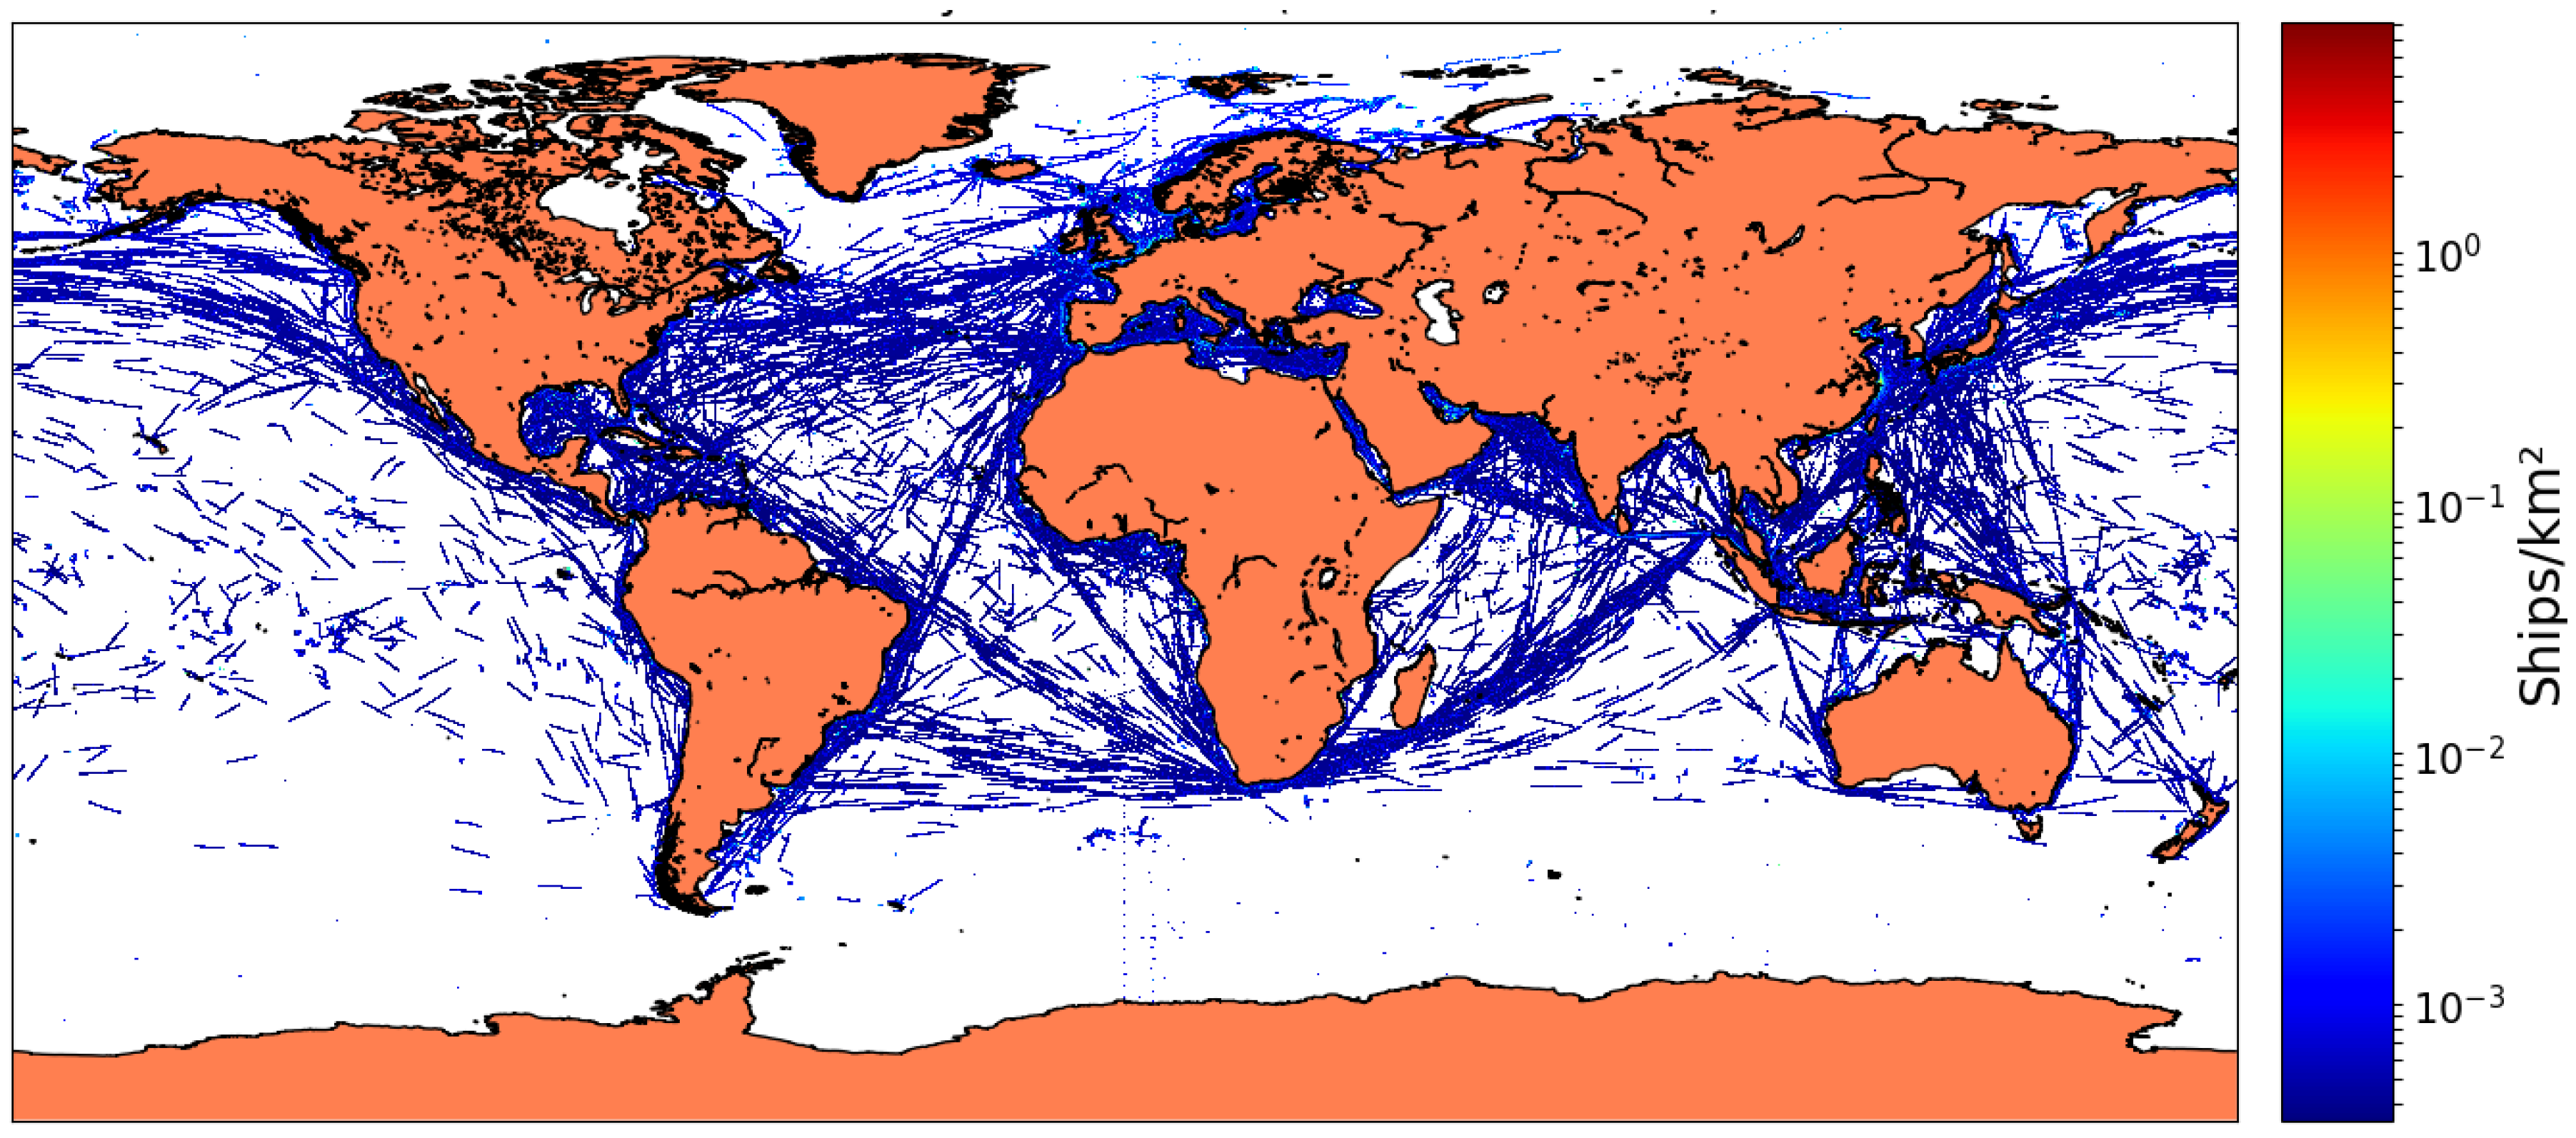
Figure 7 shows the world’s averaged maritime traffic density on one day in the middle of 2016. Clearly visible here are the main traffic routes, which connect the world’s busiest ports and the increased traffic density near these ports as well as in straits. Furthermore, Figure 7 shows a concentration of the maritime traffic particularly along the coastlines of America, Europe, Asia and Africa. This fits very well to the distribution of marine radio beacons in America, Europe and Asia (Figure 2).
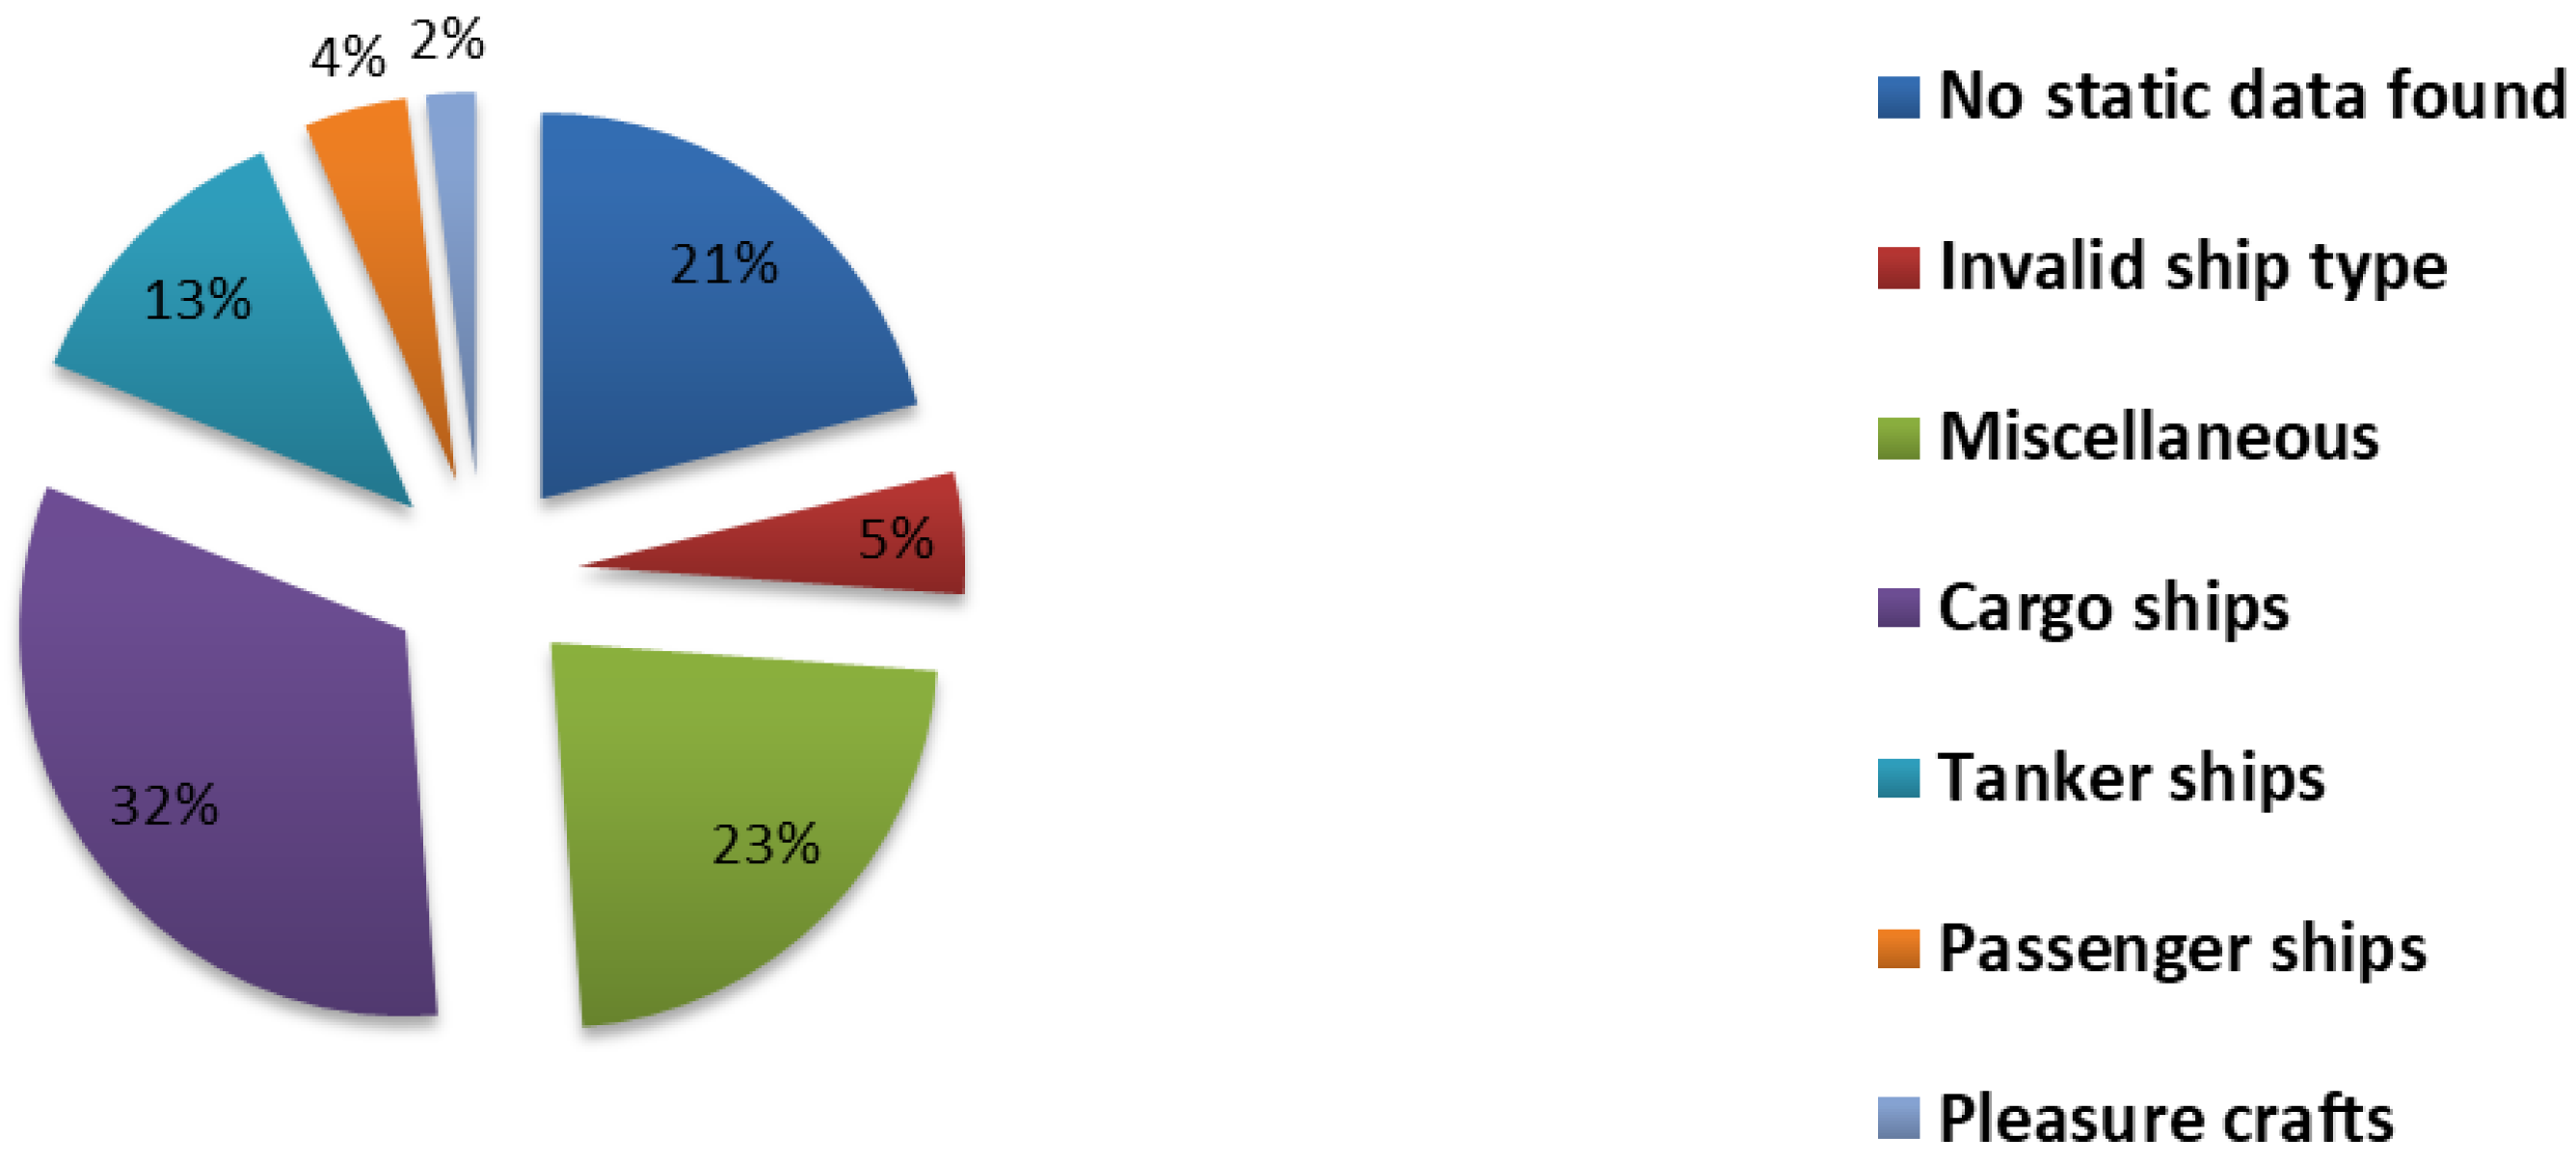
The underlying dataset can be broken down according to the distribution shown in Figure 8. In order to achieve the division of the database into ship types, the MMSI of each dynamic dataset was correlated with the corresponding MMSI in a static database containing all MMSIs of the respective year. The database of the static data records was generated from an extended database of the data provider. The types of ships considered in this paper only refer to the already mentioned Class A AIS. Looking at the individual ship types, it can be seen that tankers, cargo ships and passengers account for about 50% of the ships observed and thus make up a significant proportion. Furthermore, it can be seen that 21% of the ships could not be assigned to any ship type at all, as static data for these MMSI were not available. Of the static data 5% contained ship types that are not defined in the official AIS specification or that are stated as “Not available” according to the official AIS specification.
4. Potential Availability of the R-Mode Service for Maritime Traffic
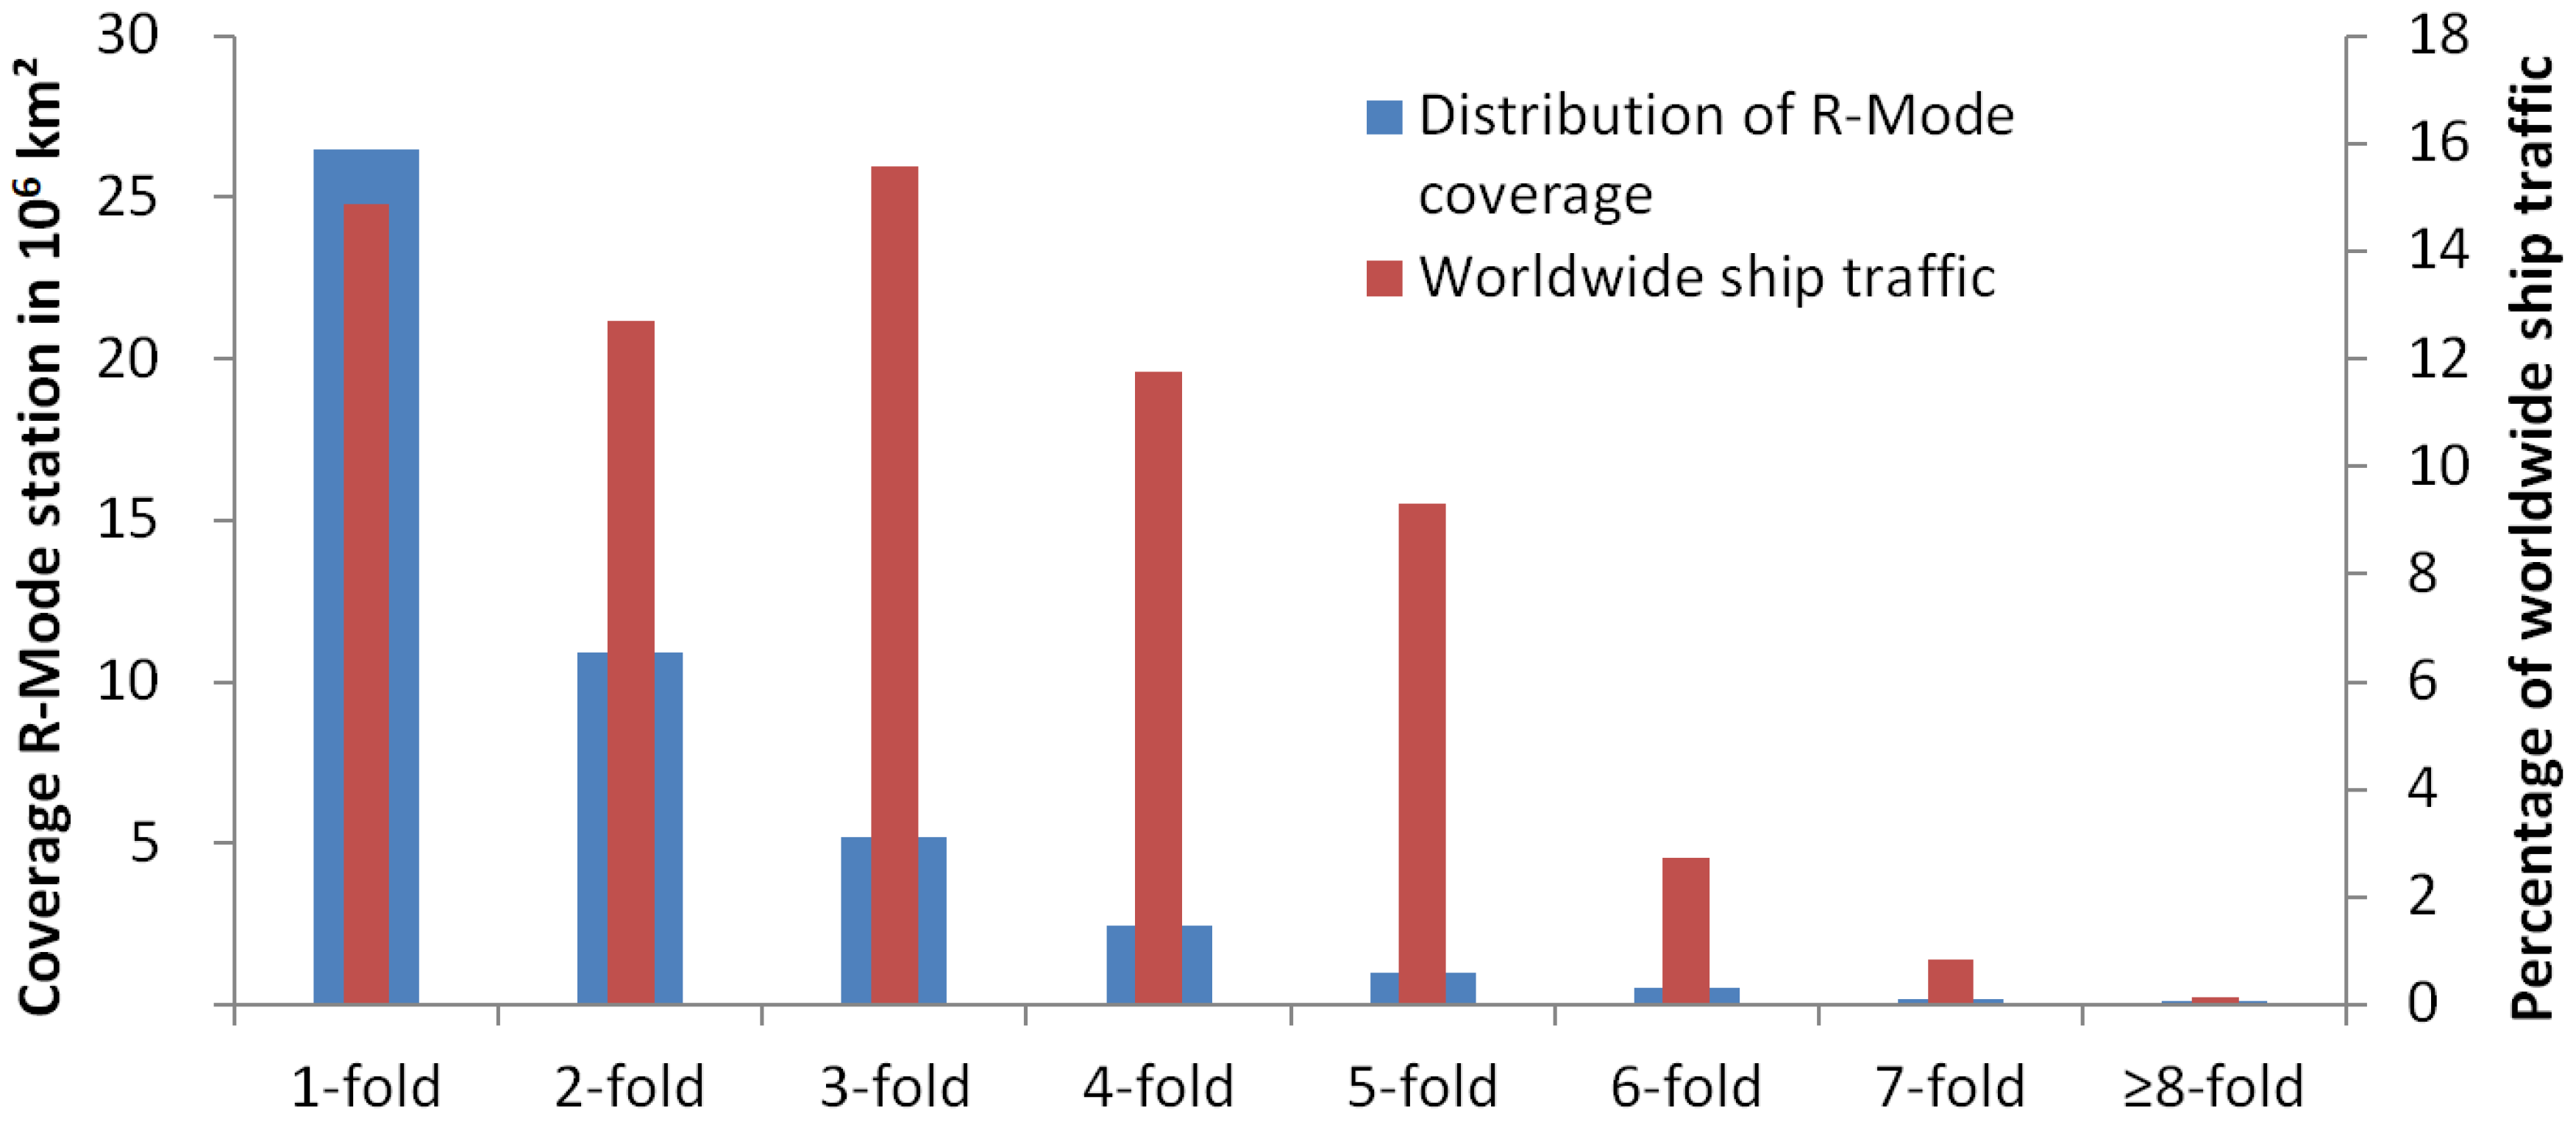
To understand the potential support for maritime traffic that the R-Mode service could provide, a quantitatively comparison between the radio-beacon coverage of Figure 2 and the traffic density shown in Figure 7 was carried out. For each area of single to eight-fold and more coverage, the number of ships over the day in these areas was calculated. This number was divided by the total number of vessels counted to determine the percentage of ships within the desired coverage level. These calculations were performed for the areas with one to eight and more R-Mode signals available.
Figure 9 shows the calculation result for the analyzed day. The percentage of the world’s ship traffic in red overlays the total area single to eight-fold and more covered area of potential R-Mode stations in blue. If the traffic was homogenously distributed over the world’s sea area, it would be expected that the percentage of the ships would follow the size of the covered area. Instead, a maximum of ship traffic at three-fold coverage can be observed. Even the four-fold and five-fold covered areas are heavily frequented by ships.
In sum, around 67% of worldwide maritime traffic operates inside the potential R-Mode service area. The R-Mode would support these ships with integrity information. For 40% of the world’s ships, the R-Mode could provide a position if additional information exists, and for 25% of the ships, positioning with the R-Mode is possible.
The numbers in Figure 9 can be explained by good coverage of the R-Mode in traffic-intensive areas. The result of further investigations into reasons for the high amount of traffic in the potential R-Mode service area is presented in Table 1.
The table shows the top nine container ports worldwide according to a current ranking provided by the World Shipping Council [26] and their respective coverage by marine radio beacons. The presented analysis supports the assumption that particularly traffic-intensive areas have a good extension with maritime antennas and are therefore suitable for the implementation of the R-Mode system. A visual representation of the values listed in Table 1 in combination with the traffic densities determined shows high accumulation of maritime traffic at intersections with good coverage. Such visual comparison is provided below in Figure 10, showing the coverage and traffic density at the port locations.
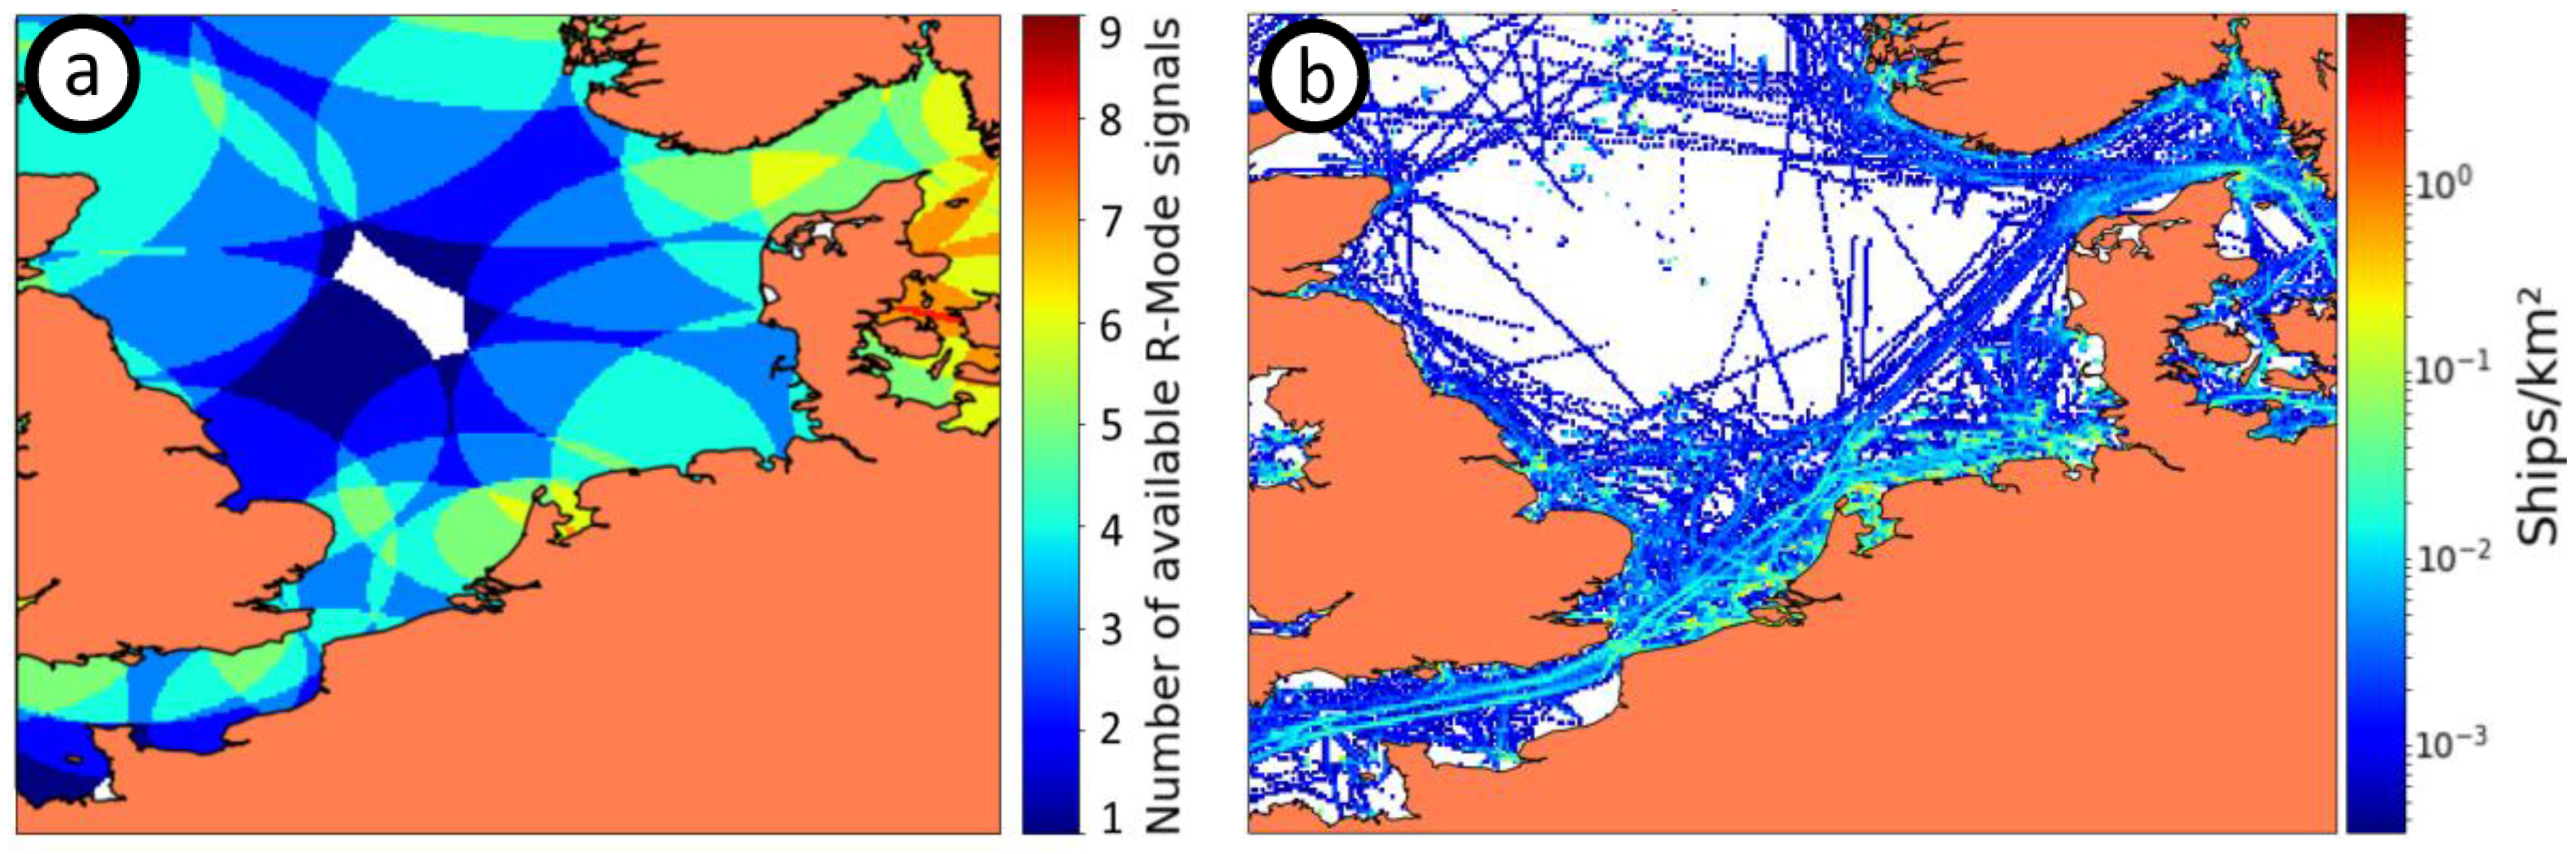
For a more in-depth analysis of the shares in ships in the potential R-Mode service area, the North Sea and Baltic Sea regions were analyzed. The North Sea, as shown in Figure 11, shows an overall good coverage along the coasts, with a peak in coverage around the English Channel. Due to the geometric distribution of the R-Mode stations on both sides of the Channel, three stations or more can be received simultaneously. Especially the approaches for Rotterdam and Hamburg have a continuous coverage of multiple stations. The passage between Denmark and Sweden (Skagerrak/Kattegat) shows a consistently good coverage of up to eight and nine stations in high-risk areas near narrow channels and high-density sections of the passage. Please note an area in the middle of the North Sea, which has no coverage. Due to the distribution of large oil fields and wind farms, a possible retrofitting of R-Mode-capable transmission infrastructure has to be considered in order to ensure continuous coverage of the North Sea. Alternatively, the R-Mode could be implemented on the basis of the AIS or VDES of the oil platforms, which could enable positioning. This problem is not considered to be particularly drastic due to the absolutely low level of shipping traffic in this area, as can be seen by comparing the analysis of the traffic density.
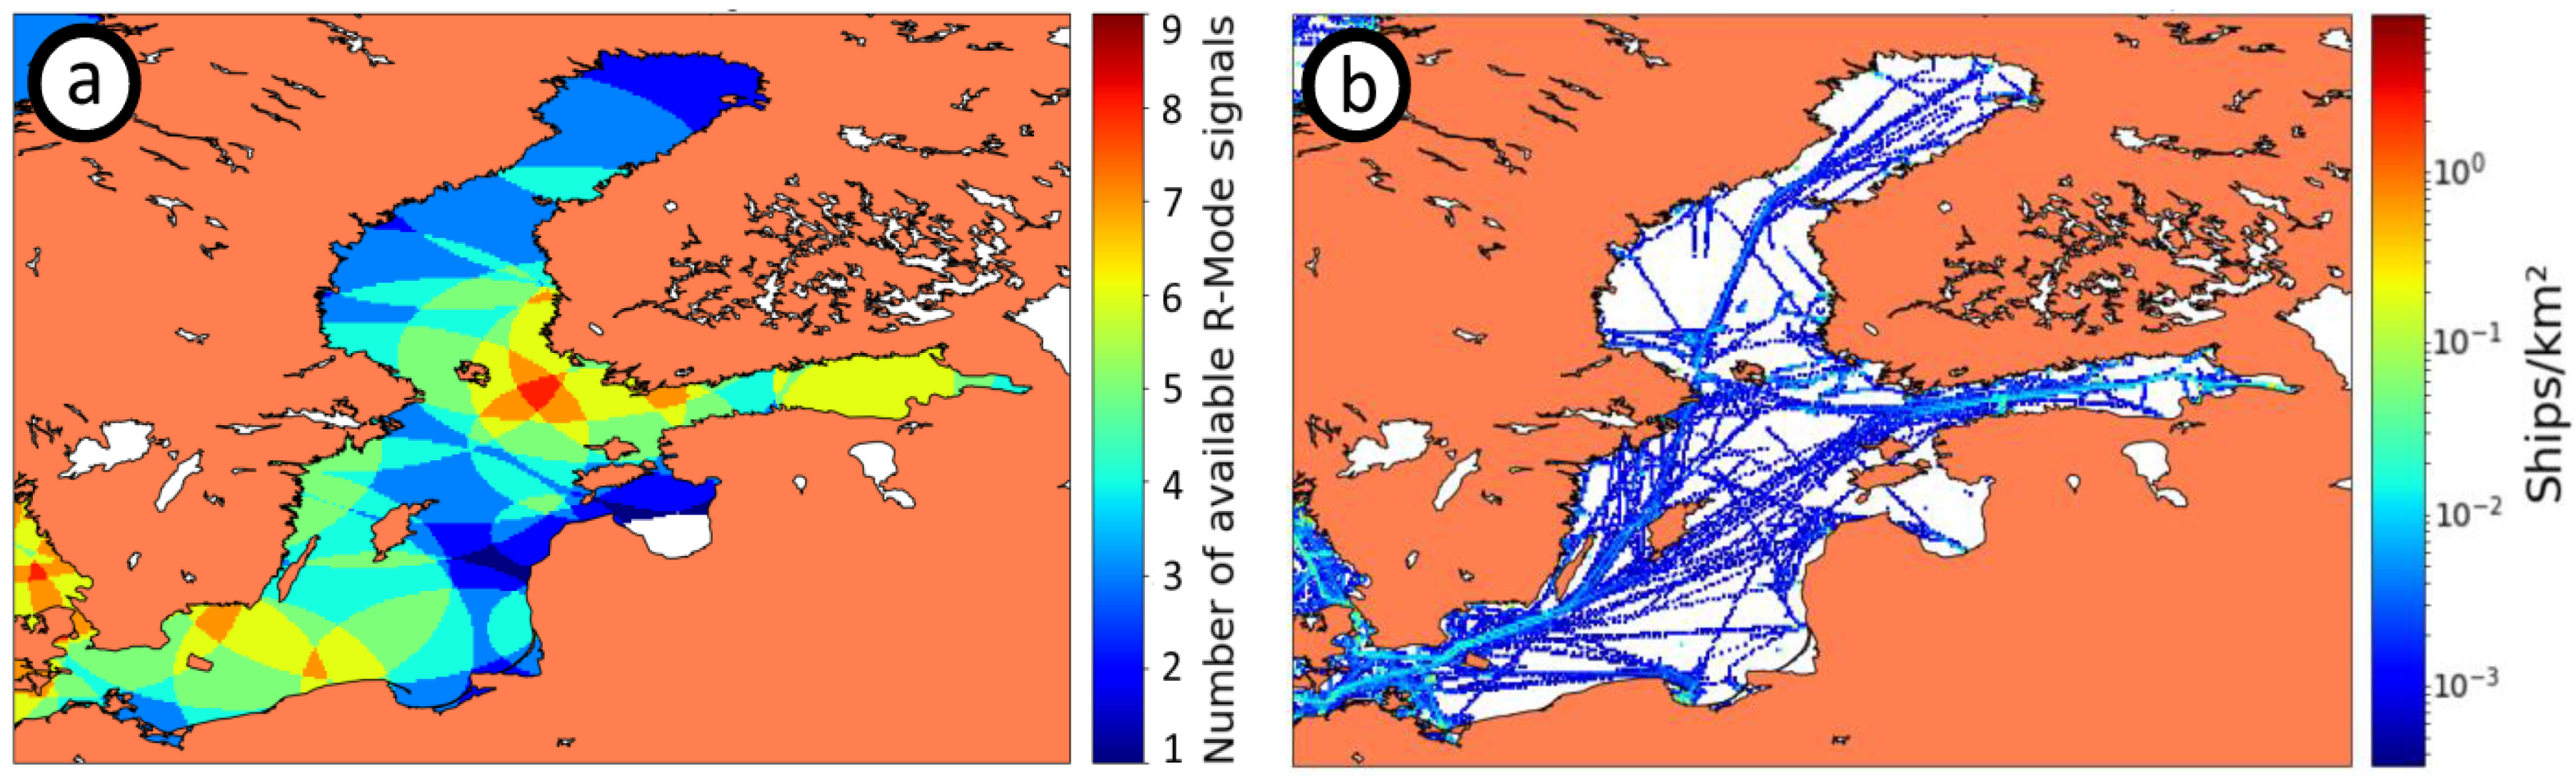
Further consideration of the adjacent Baltic Sea region reveals comparable coverage (Figure 12). For the use of the Baltic Sea as a test bed for the implementation of the R-Mode system [8], good coverage is a basic requirement. With comparative consideration of the traffic density in the Baltic Sea region, as shown in Figure 12 on the right side, an increase of high correspondence between traffic-intensive areas and the potential R-Mode service area can be found. Due to the high proportion of potential R-Mode service areas with four and more available signals per grid cell, positioning in these areas could probably be achieved when implementing the R-Mode.
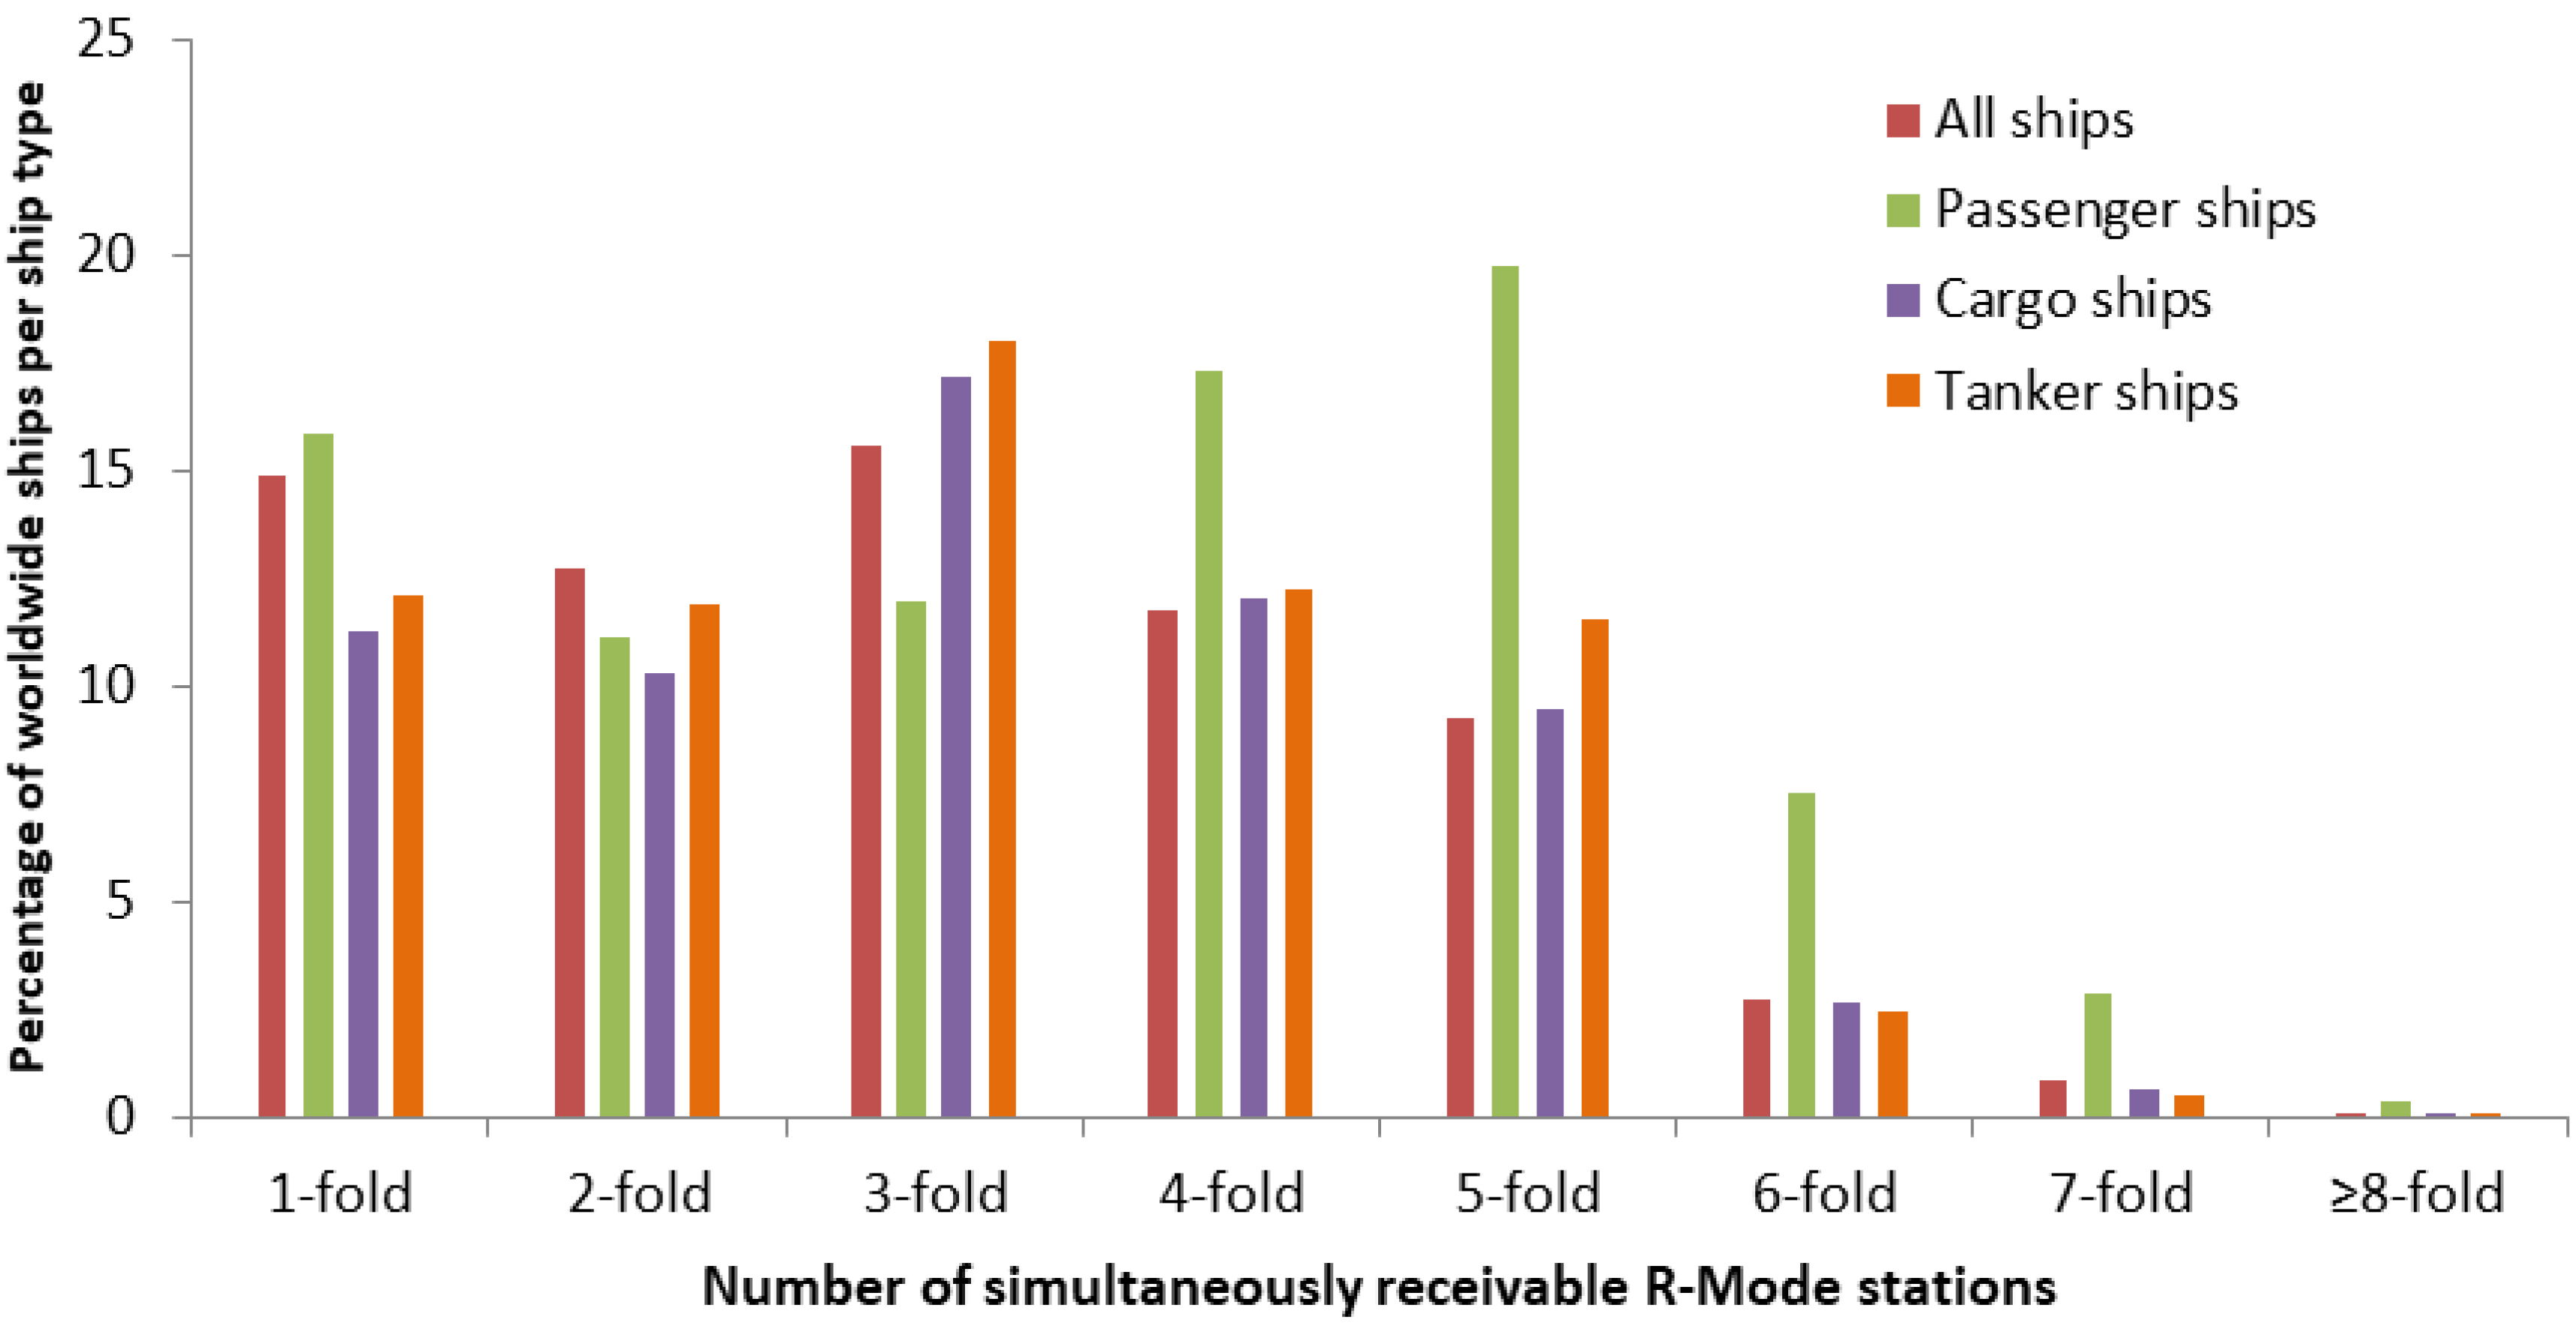
A breakdown of the ship types into passenger ships, tankers and cargo ships reveals some minor differences in the potential R-Mode support Figure 13. Passenger ships show a clear increase in potential coverage in the range of four–six-fold coverage. In absolute terms, 86% of all passenger ships operate within the R-Mode area. This significant share of passenger ships allowed a large part of the passenger ships the possible positioning with R-Mode (four-fold) with increasing accuracy of the positioning solution and possible integrity check (four plus-fold coverage). This distribution was to be expected due to the high proximity of passenger ships to the coast and the high frequency of calls from ports. When looking at cargo ships and tankers, only minor differences can be seen in the different levels of coverage. This distribution is not surprising as these ships account for the largest portion of ships.
5. Limits of the Study
The current study set the focus on the potential availability of MF R-Mode signals under the assumption that all marine radio beacons would, in addition to the legacy signal, also transmit R-Mode signal components and that the R-Mode service area is equal to the service area of the legacy service. The results of tests in the North Sea [27] show the feasibility of the technical approach. Unfortunately, the given size of the radio-beacon service area in the IALA list is only an indicator for the size of the R-Mode service area. Measurements show that the R-Mode signal of Heligoland (Germany) could be received in the United Kingdom at distances of about 500 km during the daytime, even though the given nominal range of Heligoland is 285 km [9,21]. During the night, the R-Mode service area decreases [27].
The observed R-Mode signal availability can be explained with the process of measuring the distance by estimating the phase of the R-Mode signal components [27], which propagates as a ground-wave. The achievable accuracy strongly depends on the signal-to-noise or signal-to-interference ratio.
As with free-space radio waves, the R-Mode signal strength decreased with distance. Additional attenuation is caused on the propagation path by decreased ground conductivity [28,29]. The radio beacon service area is therefore typically very irregular (shown in Figure 18 of [16]), which is typically approximated as a circle with the given nominal range as radius [30]. The noise also has some dependencies on the time of the day and the year as well as the region [31].
During the night the sky-wave, which is reflected at the E-layer of the ionosphere, is subjected to weaker damping than during the day. Therefore, both sky-wave and ground-wave interfere at the user side and disturb phase measurements in the night [27]. This effect is not considered in the nominal range but has to be considered for the R-Mode, because it will have an impact on the ranging and positioning accuracy [16]. Future studies should consider these effects as well as the geometry of the radio beacons.
Using AIS for the generation of the traffic maps has a few shortcomings, which the authors have summarized as follows. Each ship has to send its own correct position report with an update rate of seconds to minutes. Many receivers with worldwide distribution are needed to forward the information to a central data-processing and storage facility. For several reasons, this information-provision and forwarding chain is interrupted from time to time, as seen in the data from JAKOTA Cruise System GmbH. The same limitations were also determined for the data of other AIS data providers.
This study was based on the tracks of worldwide-operating SOLAS ships. In order to mitigate a weighting of AIS traffic data due to uneven distribution of received datasets, missing ship positions have been interpolated with a straight line and constant velocity. This type of interpolation was considered sufficient because ships usually follow a predictable path, which is only in rare cases accompanied by incomprehensible course changes. However, it cannot be completely excluded that the interpolated tracks are crossing land masses.
The evaluated sample of about 90,000 ships was very large and distributed worldwide. Due to limited availability of AIS data and processing capacity, this study was limited to the 4th July 2016. In order to generate a further in-depth analysis of possible user groups of the R-Mode system from AIS data, a broader analysis is necessary and could be realized by evaluating more extensive datasets (1 year or more).
6. Conclusions
The maritime community is looking for a backup system to GNSS that can support navigators and new maritime applications for operation in challenging environments. Especially in areas with high traffic density, limited fairways or shallow waters, as it is often the case in coastal areas, ports and port approaches, there is the need for resilient provision of PNT data. The R-Mode, a terrestrial positioning system that utilizes shore maritime radio infrastructure, could fill this gap.
Under the assumption that the currently declared marine radio-beacon service areas would be the same for R-Mode, the authors deduced that especially the coastlines of the northern hemisphere would be well covered by R-Mode signals. In the southern hemisphere, only areas with high traffic density or the coastlines of economically strong countries would benefit from R-Mode on radio beacons. Due to the limited nominal range of 250 km on average and their limited number (357), the radio beacons cover only about 7% of the earth’s water surface.
For a backup system, the overlap of the R-Mode station service areas is important. In 4.2 million km2, R-Mode-based positioning with four and more available signals is possible. Outside this R-Mode core region, the user can benefit from R-Mode with positioning with additional information or integrity check for any other PNT data.
The R-Mode system shall support maritime operations. Therefore, the authors compared the covered area with the averaged maritime traffic, which was deduced from a 1-day global AIS dataset. The results show that a significant proportion of ship traffic of 67% operated over the day in the area of at least one potential R-Mode station. For 25% of the ships, positioning with R-Mode was possible. This underlines that the marine radio beacons support the majority of maritime traffic. For certain areas with high traffic density and the most important container ports, three and more beacon signals were often available. Passenger ships would benefit over-proportionally from the R-Mode service.
The study was based on the given nominal ranges of the marine radio beacons. This is a good approximation of the R-Mode service area. In reality, the R-Mode performance degraded over distance and depended on the time of the day and on the direction of radiation. Future studies that evaluate the number of ships that would operate in an area with certain R-Mode positioning accuracy therefore have to take this into consideration. Measurements of the R-Mode signal strength and noise are helpful in calibrating the channel model.
Beside marine radio beacons, AIS or VDES base stations could also be the source of R-Mode ranging signals [6]. These stations typically support the same coastline but with reduced range. It could be shown for the North Sea and Baltic Sea that the combination of all R-Mode signal sources makes positioning in wide areas of these regions possible. Yet to be proven is how R-Mode on AIS/VDES would increase the worldwide R-Mode service quality.
Author Contributions
Conceptualization, S.G.; Data curation, P.K.; Formal analysis, P.K. and S.G.; Investigation, P.K.; Project administration, S.G.; Software, P.K.; Supervision, S.G.; Visualization, P.K.; Writing–original draft, P.K. and S.G.; Writing–review & editing, P.K. and S.G. All authors have read and agreed to the published version of the manuscript.
Funding
This study has been conducted in the framework of the institutionally funded project ‘Automated Aids for Safe and efficient vessel traffic processes (A++Set)’ of the German Aerospace Center (DLR).
Acknowledgments
The authors thank JAKOTA Cruise System GmbH for providing the AIS dataset for the analysis of global maritime traffic.
Conflicts of Interest
The authors declare no conflict of interest.
References
- Grant, A.; Williams, P.; Ward, N.; Basker, S. GPS jamming and the impact on maritime navigation. J. Navig. 2009, 62, 173–187. [Google Scholar] [CrossRef] [Green Version]
- Hoque, M.M.; Jakowski, N. Ionospheric Propagation Effects on GNSS Signals and New Correction Approaches. In Global Navigation Satellite Systems: Signal, Theory and Applications; Jin, S., Ed.; InTech: Rijeka, Croatia, 2012; pp. 381–404. [Google Scholar]
- Ziebold, R.; Medina, D.; Romanovas, M.; Lass, C.; Gewies, S. Performance Characterization of GNSS/IMU/DVL Integration under Real Maritime Jamming Conditions. Sensors 2018, 18, 2954. [Google Scholar] [CrossRef] [PubMed] [Green Version]
- Oltmann, J.-H.; Hoppe, M. Contribution to the IALA World Wide Radio Navigation plan (IALA WWRNP)/Recapitalization of MF DGNSS Systems, ENAV4-7.10A and ENAV4-7.10B. In Proceedings of the 4th IALA ENAV Committee Meeting, Shanghai, China, 25–29 February 2008. [Google Scholar]
- Dziewicki, M.; Hoppe, M.; Gewies, S.; Ehlers, T.; Bronk, K.; Eliassen, C.G.; Ledochowski, M. R-Mode Baltic Project Report—Baseline and Priorities; German Aerospace Center (DLR): Neustrelitz, Germany, 2018. [Google Scholar]
- Johnson, G.W.; Swaszek, P.F. ACCSEAS Project Report on Feasibility Study of R-Mode Combining MF DGNSS, AIS, and eLoran Transmissions. Available online: https://www.iala-aism.org/content/uploads/2016/08/accseas_r_mode_feasibility_study_combined_dgnss_ais_and_eloran.pdf (accessed on 18 March 2020).
- Hu, Q.; Jiang, Y.; Zhang, J.; Sun, X.; Zhang, S. Development of an Automatic Identification System Autonomous Positioning System. Sensors 2015, 15, 28574–28591. [Google Scholar] [CrossRef] [PubMed] [Green Version]
- Gewies, S.; Dammann, A.; Ziebold, R.; Bäckstedt, J.; Bronk, K.; Wereszko, B.; Rieck, C.; Gustafson, P.; Eliassen, C.G.; Hoppe, M.; et al. R-Mode Testbed in the Baltic Sea. In Proceedings of the 19th IALA Conference, Incheon, Korea, 27 May–2 June 2018. [Google Scholar]
- Hoppe, M.; Grant, A.; Hargreaves, C.; Williams, P. R-Mode: The Story so far. In Proceedings of the 19th IALA Conference, Incheon, Korea, 27 May–2 June 2018. [Google Scholar]
- Jiang, Y.; Wu, J.; Zhang, S. An Improved Positioning Method for Two Base Stations in AIS. Sensors 2018, 18, 991. [Google Scholar] [CrossRef] [PubMed] [Green Version]
- Šafář, J.; Grant, A.; Williams, P.; Ward, N. Performance Bounds for VDES R-mode. J. Navig. 2020, 73, 92–114. [Google Scholar] [CrossRef]
- Monteiro, L.S.; Moore, T.; Hill, C. What is the accuracy of DGPS? J. Navig. 2005, 58, 207–225. [Google Scholar] [CrossRef]
- IMO. Resolution A.1046(27) Worldwide Radionavigation System; IMO: London, UK, 2011. [Google Scholar]
- IMO. Resolution A.915(22) Revised Maritime Policy and Requirements for a Future Global Navigation Satellite System (GNSS); IMO: London, UK, 2002. [Google Scholar]
- Swaszek, P.F.; Johnson, G.W.; Alberding, J.; Hoppe, M.; Oltmann, J.-H. Analysis of MF-DGNSS Modifications for Improved Ranging. In Proceedings of the European Navigation Conference (ENC), Rotterdam, The Netherlands, 15–17 April 2014. [Google Scholar]
- Johnson, G.W.; Swaszek, P.F. ACCSEAS Project Report on Feasibility Study of R-Mode Using MF DGPS Transmissions. Available online: https://www.iala-aism.org/content/uploads/2016/08/accseas_r_mode_feasibility_study_mf_dgps_transmissions.pdf (accessed on 18 March 2020).
- ITU-R. Recommendation ITU-R M.1371-4 Technical Characteristics for an Automatic Identification System Using Time-division Multiple Access in the VHF Maritime Mobile Band; ITU: Geneva, Switzerland, 2010. [Google Scholar]
- ITU-R. Recommendation ITU-R M.2092-0 Technical Characteristics for a VHF Data Exchange System in the VHF Maritime Mobile Band; ITU: Geneva, Switzerland, 2015. [Google Scholar]
- Wirsing, M.; Dammann, A.; Raulefs, R. Investigating R-Mode Signals for the VDE System. In Proceedings of the OCEANS 2019, Seattle, WA, USA, 27–31 October 2019. [Google Scholar]
- IMO. Resolution MSC.401(95) Performance Standards for Multi-system Shipborne Radionavigation Receivers; IMO: London, UK, 2015. [Google Scholar]
- IALA. Table of DGNSS Stations. 2019. Available online: https://www.iala-aism.org/content/uploads/2019/06/Table-of-DGNSS-stations-March-2019-v3.pdf (accessed on 20 March 2019).
- IALA. IALA Redommendation R-129 on GNSS Vulnerability and Mitigation Measures, 3rd ed.; IALA: Saint Germain en Laye, France, 2012.
- IMO. SOLAS Chapter V; IMO: London, UK, 2002. [Google Scholar]
- IALA. Information and Guidance on Allocation of ID Numbers for World DGNSS. 2019. Available online: https://www.iala-aism.org/technical/positioning-navigation-and-timing/world-dgnss-stations-list/allocation-world-dgnss-ids/ (accessed on 30 October 2019).
- Gils, J.V. List of DGNSS Stations. Available online: http://www.e-navigation.nl/list-DGNSS-stations (accessed on 20 March 2019).
- World Shipping Council. Top 50 World Container Ports. 2019. Available online: http://www.worldshipping.org/about-the-industry/global-trade/top-50-world-container-ports (accessed on 15 October 2019).
- Johnson, G.W.; Swaszek, P.F.; Hoppe, M.; Grant, A.; Šafář, J. Initial Results of MF-DGNSS R-Mode as an Alternative Position Navigation and Timing Service. In Proceedings of the 2017 International Technical Meeting of The Institute of Navigation, Monterey, CA, USA, 30 January–2 February 2017. [Google Scholar]
- ITU-R. Recommendation ITU-R P.368-9 Ground-wave Propagation Curves for Frequencies between 10 kHz and 30 MHz; ITU: Geneva, Switzerland, 2007. [Google Scholar]
- ITU-R. Recommendation ITU-R P.832-4 World Atlas of Ground Conductivities; ITU: Geneva, Switzerland, 2015. [Google Scholar]
- IALA. IALA Guideline 1119 on Marine Beacon Coverage Prediction; IALA: Saint Germain en Laye, France, 2016.
- ITU-R. Recommendation ITU-R P.372-14 Radio Noise; ITU: Geneva, Switzerland, 2019. [Google Scholar]
Figure 1.
Comparison of different grid-cell resolutions for the number of available radio beacon signals (left to right): 0.10°, 0.05° and 0.01°.
Figure 1.
Comparison of different grid-cell resolutions for the number of available radio beacon signals (left to right): 0.10°, 0.05° and 0.01°.

Figure 2.
Potential R-Mode service area using radio beacon nominal range. The colors from blue to red indicate the number of available beacon signals in one location.
Figure 2.
Potential R-Mode service area using radio beacon nominal range. The colors from blue to red indicate the number of available beacon signals in one location.

Figure 3.
Distribution of the potential R-Mode service area.

Figure 4.
Single and multiple covered areas with potential Medium Frequency (MF) R-Mode signals.

Figure 5.
Potential R-Mode service area: (1) North Europe; (2) Black Sea, Suez, Red Sea and Gulf of Oman and (3) Coast of China and Japan.
Figure 5.
Potential R-Mode service area: (1) North Europe; (2) Black Sea, Suez, Red Sea and Gulf of Oman and (3) Coast of China and Japan.

Figure 6.
Traffic density derived from non-interpolated (a) and interpolated (b) AIS dataset.

Figure 7.
Average maritime traffic density based on an interpolated AIS dataset for one day.

Figure 8.
Breakdown of AIS dataset by ship type.

Figure 9.
Comparison of R-Mode coverage and traffic density.

Figure 10.
Comparison of location of the top nine container ports in respect to R-Mode coverage (a) and traffic density (b).
Figure 10.
Comparison of location of the top nine container ports in respect to R-Mode coverage (a) and traffic density (b).

Figure 11.
Comparison between the potential R-Mode coverage in the North Sea (a) and the traffic density in the same area (b).
Figure 11.
Comparison between the potential R-Mode coverage in the North Sea (a) and the traffic density in the same area (b).

Figure 12.
Comparison between the potential R-Mode coverage in the Baltic Sea (a) and the traffic density in the same area (b).
Figure 12.
Comparison between the potential R-Mode coverage in the Baltic Sea (a) and the traffic density in the same area (b).

Figure 13.
Comparison of R-Mode coverage and traffic density.


Table 1.
Top nine container ports and their respective potential R-Mode coverage [16].
Table 1.
Top nine container ports and their respective potential R-Mode coverage [16].
| Top 9 Ports Worldwide (by Container Handling) | |||||||||
|---|---|---|---|---|---|---|---|---|---|
| Shanghai | Singapore | Shenzhen | Ningbo-Zhousan | Guangzhou Harbor | Busan | Hongkong, S.A.R | Quingdao | Tianjin | |
| Number of R-Mode stations | 3 | 4 | 2 | 5 | 1 | 3 | 3 | 3 | 3 |
© 2020 by the authors. Licensee MDPI, Basel, Switzerland. This article is an open access article distributed under the terms and conditions of the Creative Commons Attribution (CC BY) license (http://creativecommons.org/licenses/by/4.0/).
Share and Cite
MDPI and ACS Style
Koch, P.; Gewies, S. Worldwide Availability of Maritime Medium-Frequency Radio Infrastructure for R-Mode-Supported Navigation. J. Mar. Sci. Eng. 2020, 8, 209. https://doi.org/10.3390/jmse8030209
AMA Style
Koch P, Gewies S. Worldwide Availability of Maritime Medium-Frequency Radio Infrastructure for R-Mode-Supported Navigation. Journal of Marine Science and Engineering. 2020; 8(3):209. https://doi.org/10.3390/jmse8030209
Chicago/Turabian StyleKoch, Paul, and Stefan Gewies. 2020. "Worldwide Availability of Maritime Medium-Frequency Radio Infrastructure for R-Mode-Supported Navigation" Journal of Marine Science and Engineering 8, no. 3: 209. https://doi.org/10.3390/jmse8030209
Note that from the first issue of 2016, this journal uses article numbers instead of page numbers. See further details here.