Characterizing the Evolution of the Container Traffic Share in the Mediterranean Sea Using Hierarchical Clustering


1
Barcelona Innovative Transport (BIT), Department of Civil and Environmental Engineering (DECA), Universitat Politècnica de Catalunya–BarcelonaTech (UPC), 08034 Barcelona, Spain
2
Australian Maritime College (AMC), University of Tasmania, 7250 Launceston, Tasmania, Australia
3
Department of Civil and Environmental Engineering (DECA), Universitat Politècnica de Catalunya–BarcelonaTech (UPC), 08034 Barcelona, Spain
*
Author to whom correspondence should be addressed.
J. Mar. Sci. Eng. 2018, 6(4), 121; https://doi.org/10.3390/jmse6040121
Submission received: 20 August 2018
/
Revised: 10 October 2018
/
Accepted: 13 October 2018
/
Published: 16 October 2018
(This article belongs to the Special Issue Ports and Terminal Management)
Abstract
:This research investigates the traffic share evolution of the container throughput in the Mediterranean ports from 2000 to 2015 considering hierarchical clustering and concentration indexes. Compositional Data analysis techniques are used to illustrate periods with similar traffic share composition. Two different regions (East and West) in the Mediterranean Sea (Med) are selected in the function of the long haul services. The standard concentration indexes (i.e., concentration ratio, Gini coefficient, and Normalized Herfindahl-Hirschman) reveal a gentle decreasing of the concentration with relevant fluctuations mainly in the East region. This is due to the investment in port infrastructure in the area resulting from privatization initiatives in many Eastern Mediterranean countries. The periods obtained from the hierarchical clustering show a differentiated pattern in traffic share composition. For these periods, the shift-share results are consistent with traffic fluctuations and in line with the evolution of the concentration indexes. The combination of methods has allowed a good interpretation of the spatial and temporal evolution of the Med ports’ traffic being the methodology applicable elsewhere in the context of port system analysis.
1. Introduction
The development of the containerization since the 1960’s has revolutionized the international trade. As a consequence, new port connection structures, such as the hub-and-spoke and transhipment emerged in order to optimize resources and obtain economies of scale. Integration of ports and transport systems (e.g., [1]) have been suggested taking into account the hinterland development, the strategic location, the regional integration, and the port competition. The advantages of the containerization, such as safety in handling, enhanced a rapid growth in container ports throughput following a k-wave behavior with the last phase of maturity [2]. These confirm an evident temporal evolution of the container throughput and traffic share of the ports in the international market. Additionally, differences in developing economies and in governance models added to a delocalization suggesting a differentiated spatial pattern in the traffic share of a port system. Jointly with events such as the financial crisis of 2008–2009 and privatization strategies lead to port container traffic and concentration changes. As a consequence, the development of container port system is dynamic and deserves periodic examination of its evolution (e.g., [3,4]).
As a key part of the international trade network and particularly of the East-West trade lane, the Mediterranean (Med) basin is under a permanent evolutionary process of the container port system. The dynamism of the container port system in the Med has attracted the interest of academia (e.g., [3,5,6,7,8,9,10]). The modification of trade strategies has led to the emergence of transhipment hubs in the mid-1990’s along the Asia-Mediterranean trade route [6], which affects the traffic share of the port system. This region has also undergone strong restructuring in port activity affected by the manufacturing delocalization, EU enlargement, and concentration and structural changes in the shipping industry. The total container throughput in the European Mediterranean shore during the last twenty years has experienced an impressive growth [2,3,4] consistent with the increase of seaborne trade after the 2000’s. Additionally, the traffic in the Asian and African shores has also increased significantly [2,7].
From a methodological point of view, the evolution of the container throughput in a port system has been investigated using basic statistics, classical concentration, and competition indices (e.g., Herfindahl-Hirschman or shift-share analysis), analytical models based on wave theory and connectivity exploratory tools [7,11,12,13]. Other researchers apply analytical models to infer demand flows in maritime container transport at different spatial scales [14,15]. These models allow for the overcoming of the limits of descriptive indexes in the analysis of the container traffic evolution and prognosis. However, many of the mentioned contributions use techniques based on traffic share as a percentage of a whole for understanding of the port competition and traffic concentration. The simplicity of the basic approach has led to a considerable understanding of the port competition and traffic concentration. However, exploratory techniques focusing on the compositional character of the data are used in other disciplines to investigate potential correlation trends and similarity of compositional data (e.g., [16,17]). In this sense, the assessment of data association and trends among the port traffic share are a challenging investigation using more suitable tools such as the Compositional Data (CoDa) Analysis.
The fact that the Mediterranean is the intermediate point of Asia-Europe maritime trade route, without attracting equivalent traffic to the corresponding port system in Northern Europe, creates a reasonable basis for analysis. The Mediterranean being at the Western end of the 21st Century Maritime Silk Road already attracts investments in ports and transport infrastructure [18]. Nevertheless, there is indication that a qualitative differentiation of freight flows in the Mediterranean ports exists. In the last decade the Mediterranean ports indicate faster rates of growth compared to the Northern European port system. From this perspective, the evaluation of the Mediterranean port system, is useful as it allows to identify shifts in the structure of cargo flows and also provides a basis for future evaluation when the impact of Foreign Direct Investment (FDI) in Mediterranean ports become more evident.
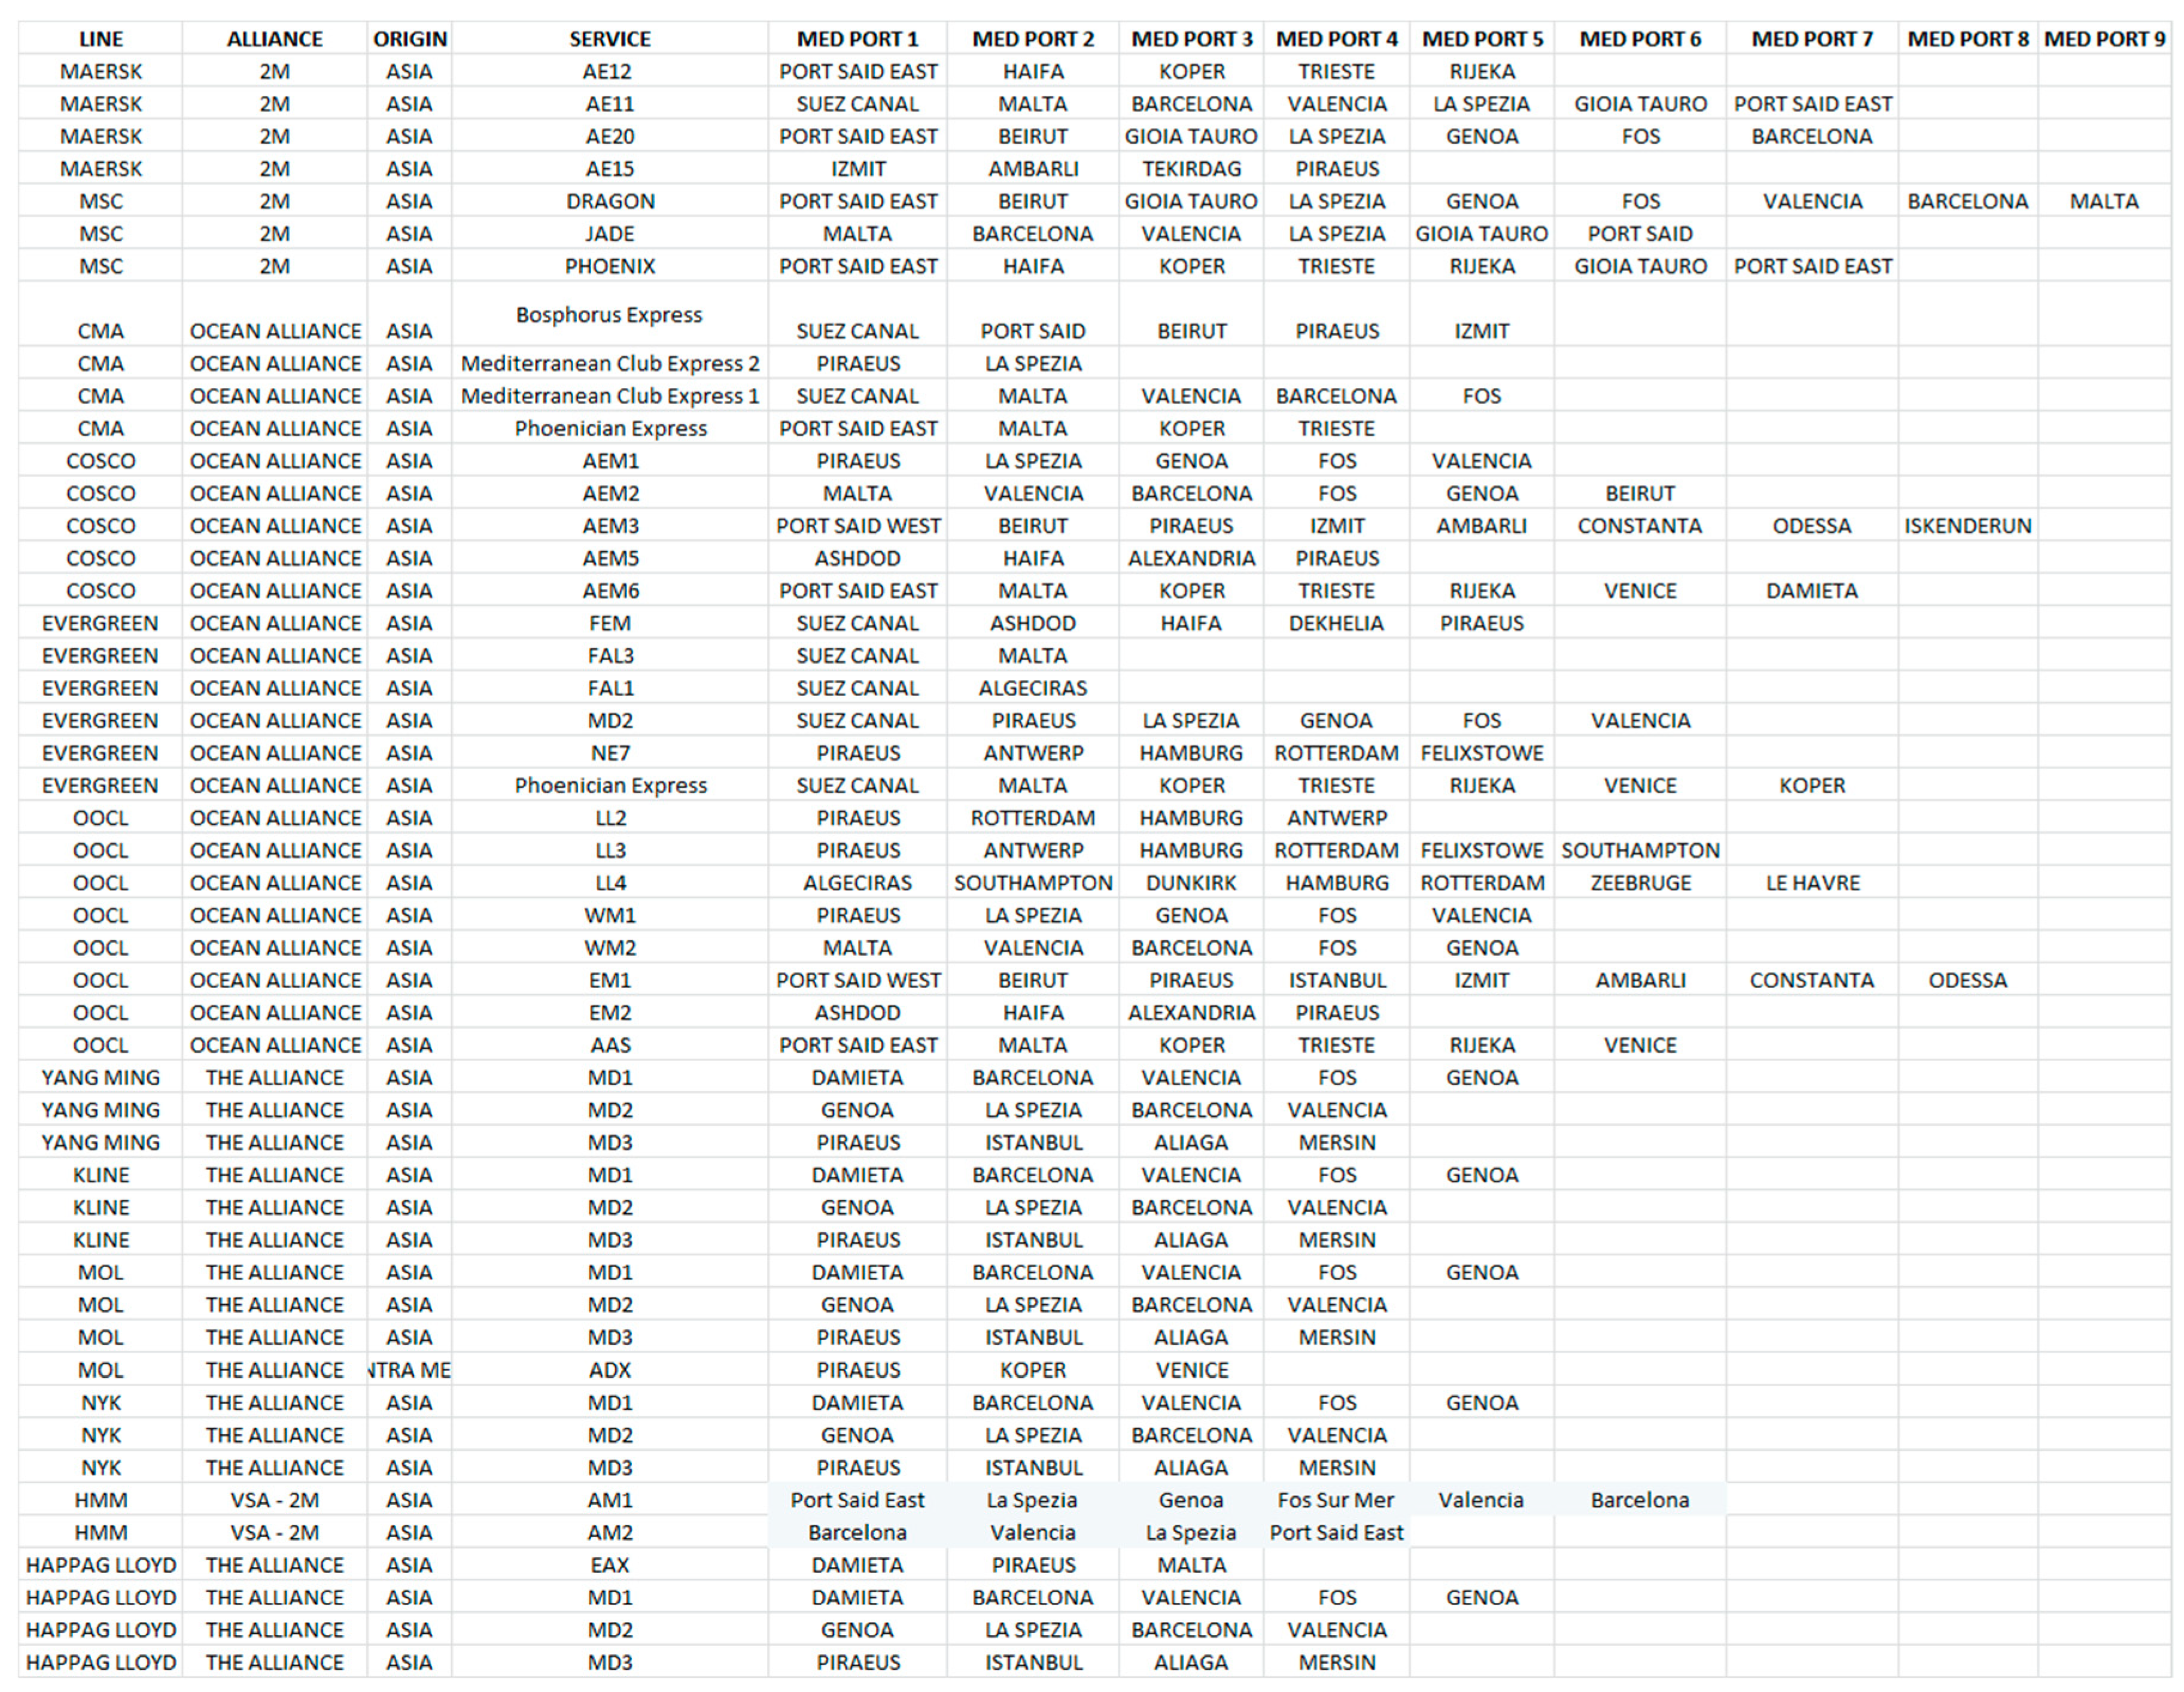
The investigation of the development of concentration and traffic share trend in the Med ports is undertaken with two complementary tools. First, the widely used concentration indices are applied to investigate the temporal evolution of the concentration in the Med region. Second, the traffic share evolution has been investigated using Compositional Data (CoDa) methods in order to determine temporal patterns in the traffic data set. In consequence, the regional traffic in the Med is investigated defining two areas in operation within the main long-haul market (East and West) regions. The breakdown of the regions is based on the current structure of the liner services based on existing schedules (see an illustrative example in Appendix A).
This paper is organized as follows: After the introduction (Section 1), the materials (container throughput data in Med) and the specific methodology (i.e., CoDa tools and concentration indexes) used in the analysis is presented in Section 2. The results of the applied tools at the Med port systems are presented in Section 3. Section 4 includes a discussion of the results in the framework of port and shipping strategies. This section also highlights the suitability of the methodology for port system analysis. Finally, we close the contribution with the Conclusions section (Section 5).
2. Methodology Tools
2.1. Time-series of Container Throughput
The analysis is based on a dataset of 43 container ports, corresponding to the period 2000–2015. The historical time series data is complete for the main ports. However, for some small (mainly African) ports the time-series set is not complete (i.e., data has not been found). In this case, the data has been interpolated to provide continuity in the time series for the subsequent analysis. The incomplete data represent only the 5.4% of the total data of container throughput during the period analyzed and correspond to ports with annual traffic less than 200,000 TEU (Twenty Foot Equivalent Units) during 2015.
The consideration of two geographical regions (East and West) is also useful to include the spatial variability of the container throughput evolution. It is also a critical definition when applying the concentration indices. The boundary of the two regions is depicted in Figure 1 and Figure 2. Table 1 includes the selected ports for each one of the regions. In order to identify the regions for the application of the data analysis, the service network of all lines were collected. These were categorized based on the ports of call for each service (Appendix A). Where a service included ports in both regions, for categorization purposes, the decision was based on the majority of port calls in each region. Based on the analysis of the services currently on offer (see mentioned Appendix A), a tendency of two serviced regions emerged that dictated our approach to analysis.
2.2. Hierarchical Clustering Using CoDa
Compositional Data (CoDa) are defined as a quantitative description of the parts of a whole [19]. The most common type of compositional data vectors, X = [x1, …, xD], are vectors with D strictly positive components summing to a constant (c). For instance, vectors of proportions. The parts of the composition carry relative information. The sample space for compositions is called the Simplex (SD):
where c is the closure. The closure is the vector operation assigning the constant sum representative of the data vector. That is, proportional vectors carry the same information, and by closing, a representative is chosen.
If compositions are treated using the standard real Euclidian geometry, some problems may arise. The most common problem is the appearance of spurious correlations. In order to formulate operations in the simplex space, we must work in ratios among parts, which measure the differences between compositional vectors in a relative manner. As the parts of the composition carry relative information, the operations in the simplex must be based in ratios among parts. Indeed, the Simplex is mathematically characterized as a Euclidian space by defining two operations and a distance. This is the so-called Aitchison geometry [19]. However, most practitioners apply the principle of working in coordinates. That is, expressing the compositions in a suitable basis and treating the coordinates of the compositions with the standard tools, based on the Euclidian distance. Several transformations based on log-ratios may be used, and they are quite easy to handle. In this sense, we mention the centred-log ratio (clr) introduced by Aitchison [20]. The clr-transformation introduces the geometric mean of the parts and keeps the same number of components as the number of parts in the composition:
where gm is the geometric mean of the composition x. This transformation preserves the metrics (the distances and the angles) between the Simplex space and Euclidean space (i.e., it is isometric) [21]. This means that it is useful to use this transformation when using exploratory tools such as the hierarchical clustering, which allows investigating the similarity, proximity, and linkage of data set. In the Med ports case, the hierarchical cluster pursues the task of grouping the data using distance connectivity. The properties of the clr transformation allows computing a hierarchical cluster using the Euclidean distance on the transformed compositions. In this example, conventional techniques to obtain agglomerative hierarchical clusters are used for the yearly data of container traffic share. A hierarchical cluster of the clr coordinates using the Euclidean distance is performed. Ward’s criteria is used because it is based on the inner square distance (minimum variance algorithm) preserving the data variability.
2.3. Concentration Index
Concentration indices are well-known tools oriented to assess the level of concentration in a market. They have been used widely in port systems to evaluate port competition, estimate the historical trend of the concentration, establish models of port development or as general descriptors of the market (e.g., [4,7,8,22]). However, some authors give reasons to doubt the suitability to apply indices based only on traffic shares without taking into account their geographical locations and economic characteristics [23]. Additionally, Reference [24] notes that these indices are sensitive to market definition in terms of both product homogeneity and geographical domains. Further, the most common concentration indices ignore the suitable scale of the measured data, for instance, when applied to compositional data. Despite their evident limitations, concentration indices are currently used as a port system characterization and they are considered a useful tool due to their ease of application and simplicity of interpretation. The easiest method to apply is the Concentration Ratio CR(k), which measures the percentage of the traffic share accumulated by the busiest k-ports. The Normalized Herfindahl-Hirschman Index and the Gini coefficients, also used in this contribution, are described briefly in the following subsections.
2.3.1. Herfindahl-Hirschman Index
The Herfindahl-Hirschman Normalized index (H*) is a widely accepted measure of market concentration or asymmetry in the market shares and conceptually has been used to describe regional port systems in similar formulations [3,4,11,22,23]. The H* is a function of the number of ports included in the analysis and the container throughput for each one. The index is computed as follows:
where i to n is the number of ports in the system and qi the traffic container throughput in TEU of port i. As a result of squaring the market shares, the H* gives a much heavier weight-to-firms with a large market share than to firms with a small share. When H* approaches to 1, this means that the total traffic flow is dominated by one specific container port. On the other hand, when H* tends to 0 the traffic flow is spread widely among the ports indicating a share disparity of competitors in the market. The calculation of the H* is simple and straightforward, requiring only basic traffic data of the port system, which is the main advantage of using the H*. H* is an evolution of the Herfindahl-Hirschman index, which by its nature is a more realistic index because it is almost impossible to have perfectly evenly matched ports in order to compare [25]. H* index below 0.1 indicates an unconcentrated port system. H* index between 0.1 and 0.18 indicates moderate concentration, and the H* index above 0.18 indicates high concentration [26].
2.3.2. Gini Coefficient
The distribution of traffic share in a port system may be represented by the Lorenz Curve and the degree of inequality is measured through the Gini Coefficient (G). This index has traditionally been used to assess the industry concentration and income distribution, and compares equally concentrated levels of port ranges with a different number of terminals [3]; this means that the Gini coefficient measures the statistical dispersion of container throughput distribution. The Lorenz curve presents the variation in the cumulative throughput of all container terminals [22]. Thus, the Gini coefficient is calculated by the ratio of the area between the Lorenz curve and a diagonal line of equal distribution, and the area below the line of equal distribution. The Gini coefficient is calculated as follows:
where Xi is the cumulative percentage of the number of ports up to the i-th container port, and Yi is the cumulative percentage of the market shares of all container ports up to the i-th port. The Gini coefficient ranges from 1 to 0. A value of 0 corresponds to the absence of inequality so that traffic share is equally distributed (Lorenz curve would coincide with the diagonal or line of equality). In contrast, a value of 1 corresponds to inequality in its most extreme form; and in this case, there is concentration.
3. Results
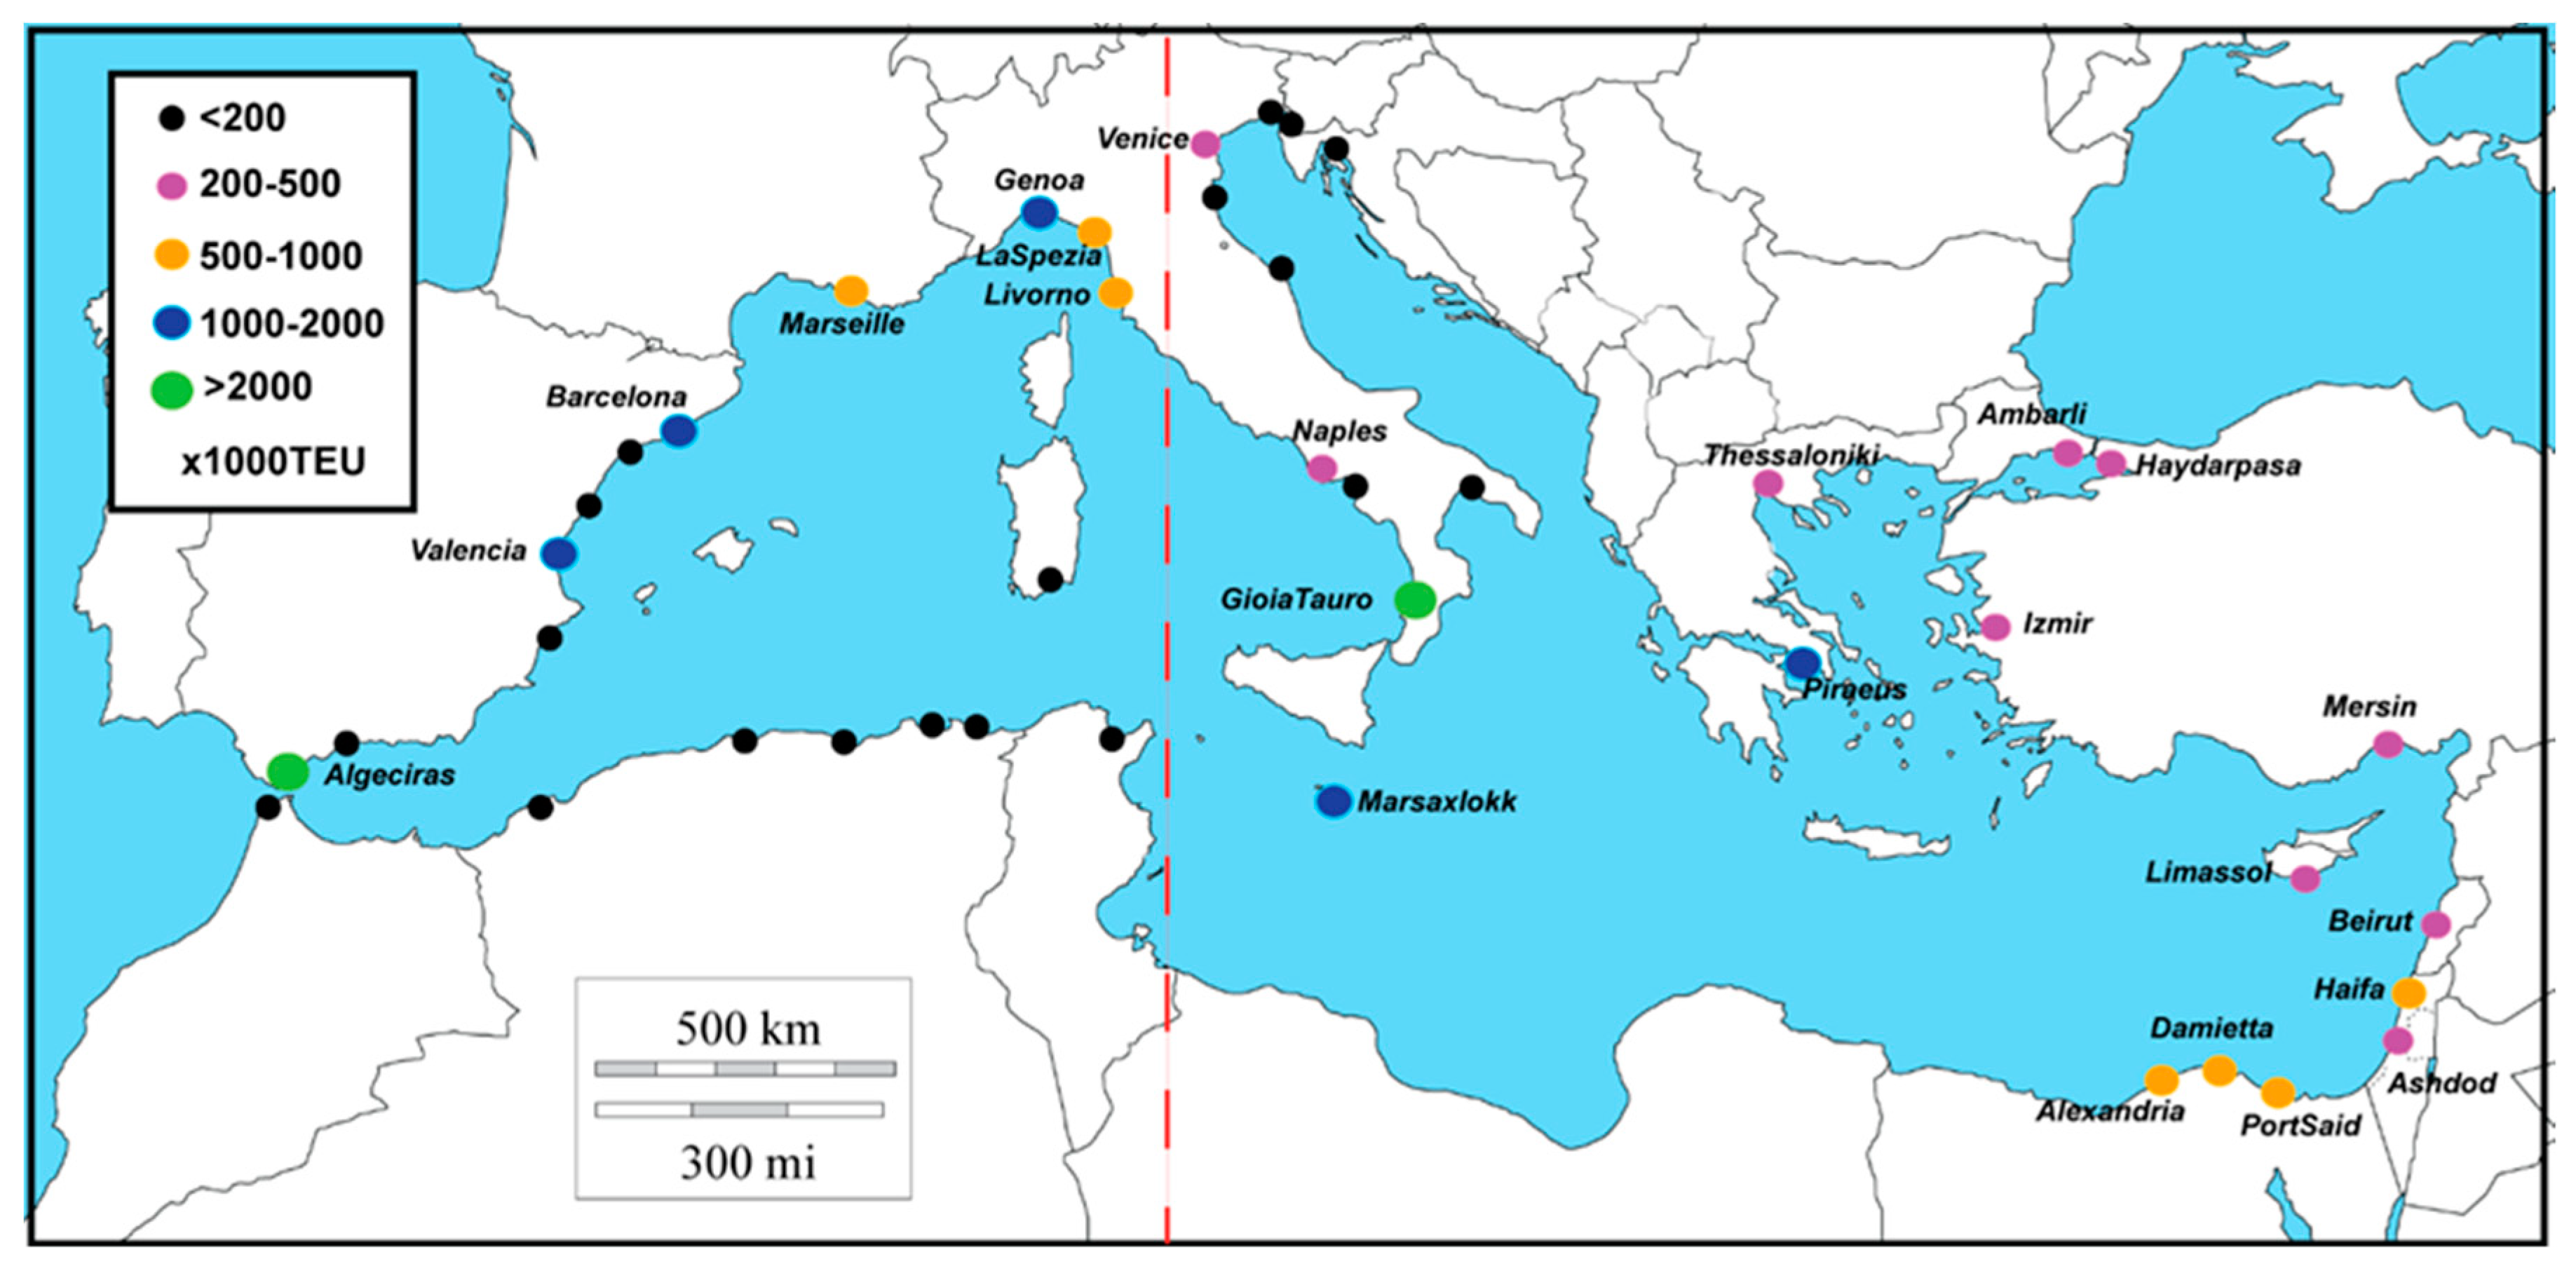
The Mediterranean region acts both as a transhipment region and as a final destination of Europe and Far East trade route. This route becomes the most important during the second half of the 1990’s [4]. During this period, some Mediterranean Ports increased significantly their container throughput due to the increase of transhipment flows. For instance, currently, pure transhipment hubs in the Med are Marsaxlokk, Algeciras, and Gioia Tauro among others. From a historical point of view, in the European Med region, the main ports have been Marseille, Genoa, La Spezia, Valencia, Marsaxlokk, and Piraeus (see container throughput data during 1985 and 1995 in Reference [4]). According to our data, during the last fifteen years, the Mediterranean container throughput increased from ~20M TEU in 2000 to ~51 M TEU in 2015 consistent with the expansion and maturity of the containerization in the global context of the trade evolution. Figure 1 and Figure 2 depict the Mediterranean container port system in terms of container throughput during 2000 and 2015, respectively. In 2000, the hub ports of Algeciras and Gioia Tauro were the largest container handling ports with a traffic volume of more than 2 M TEU. In the coming years, several ports handled traffic in the range between 1 M and 2 M TEU including import-export container throughput. The contemporary situation of container traffic in 2015 maintains the mentioned ports in the top-10 ranking with the new appearances of Ambarli, Port Said, and Tanger Med as ports of more of 2 M TEU. The largest ports have a dominant function as transhipment hubs (Algeciras or Marsaxlokk) or a combination of both such as Valencia or Piraeus. It is worthy to mention the positive growth of Valencia during 2008 (crisis period) due to the settling of the MSC (Mediterranean Shipping Company) shipping line that transformed Valencia into one of the main hubs in the Med. The recent appearance of TangerMed as a pure container hub in the Gibraltar strait during 2015 also deserves attention due to its substantial growth in the recent years (growth of 1 M TEU during the period 2014–2015).
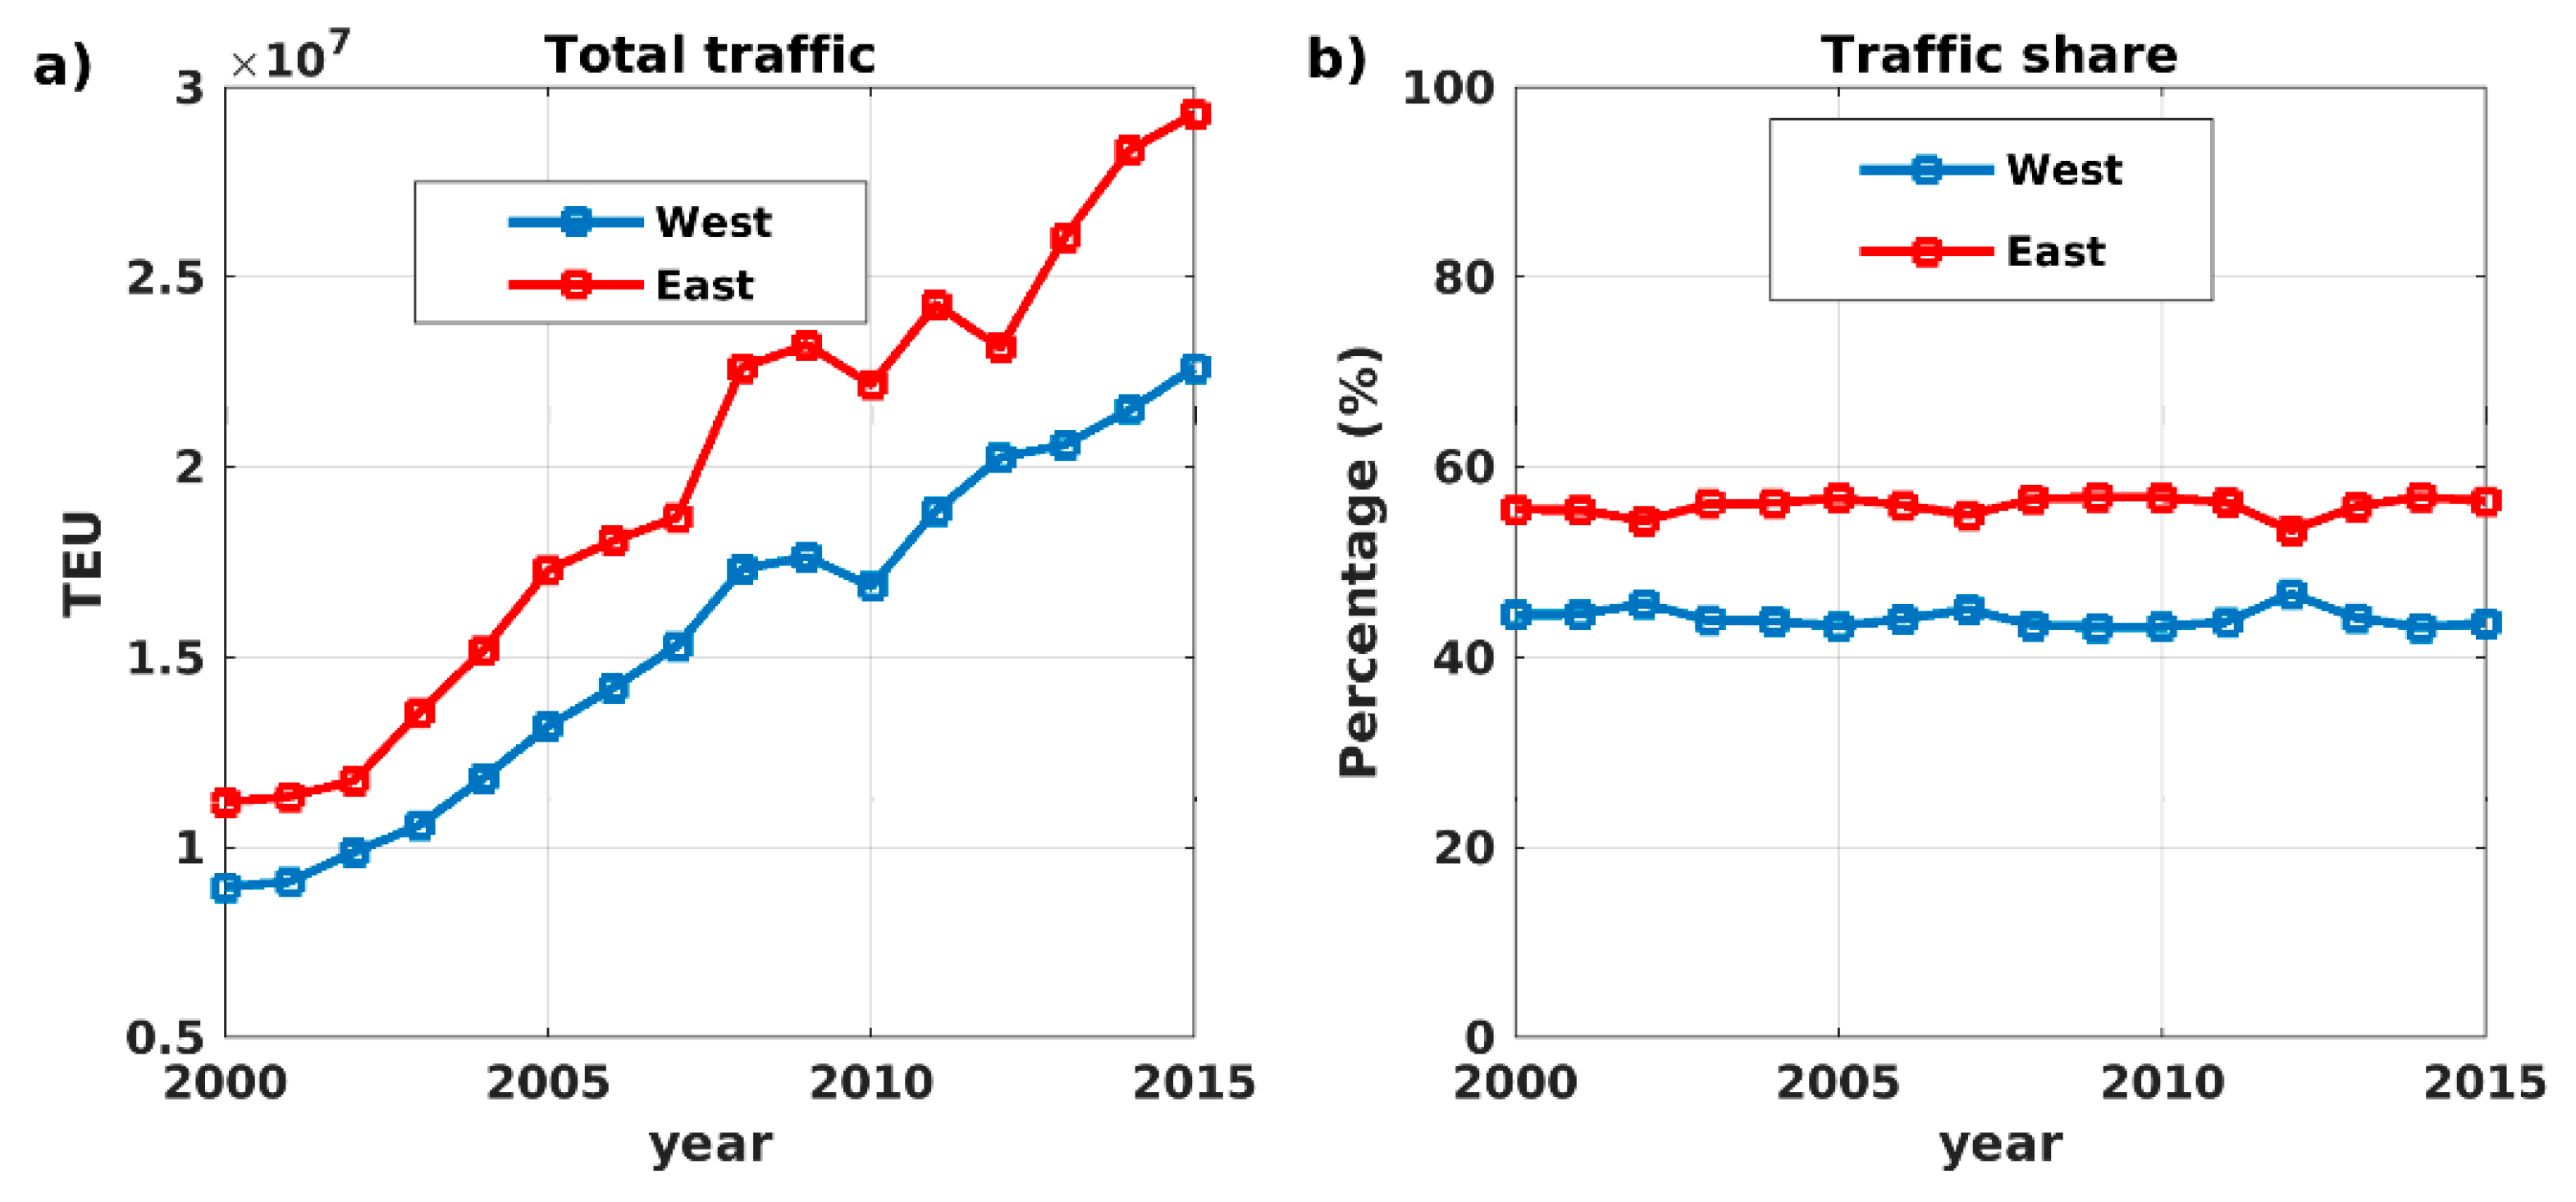
Figure 3 illustrates the container throughput evolution (in TEU) and the traffic share evolution for the two regions considered. The data shows a constant increase of the total volume in both areas (except certain years) from 8.9 M of TEU to 22.6 M of TEU in the West region. In the East region, the increase is from 11.2 M of TEU to 28.5 M of TEU. This means that in 15 years the container volume has more than doubled in both areas. Comparing the two regions, in the period between 2000 and 2015 container volumes tend to increase faster in the East region. However, the traffic share between both regions remains similar during the study period: The traffic share of the East region ranges between 52% (2012) and 56% (2010). During 2015 the top-5 ports in TEU are Algeciras, Valencia, TangerMed, Genoa, and Barcelona in the West region. In the East region, the main ports are Piraeus, Ambarli, Port Said, and Gioia Tauro during 2015.
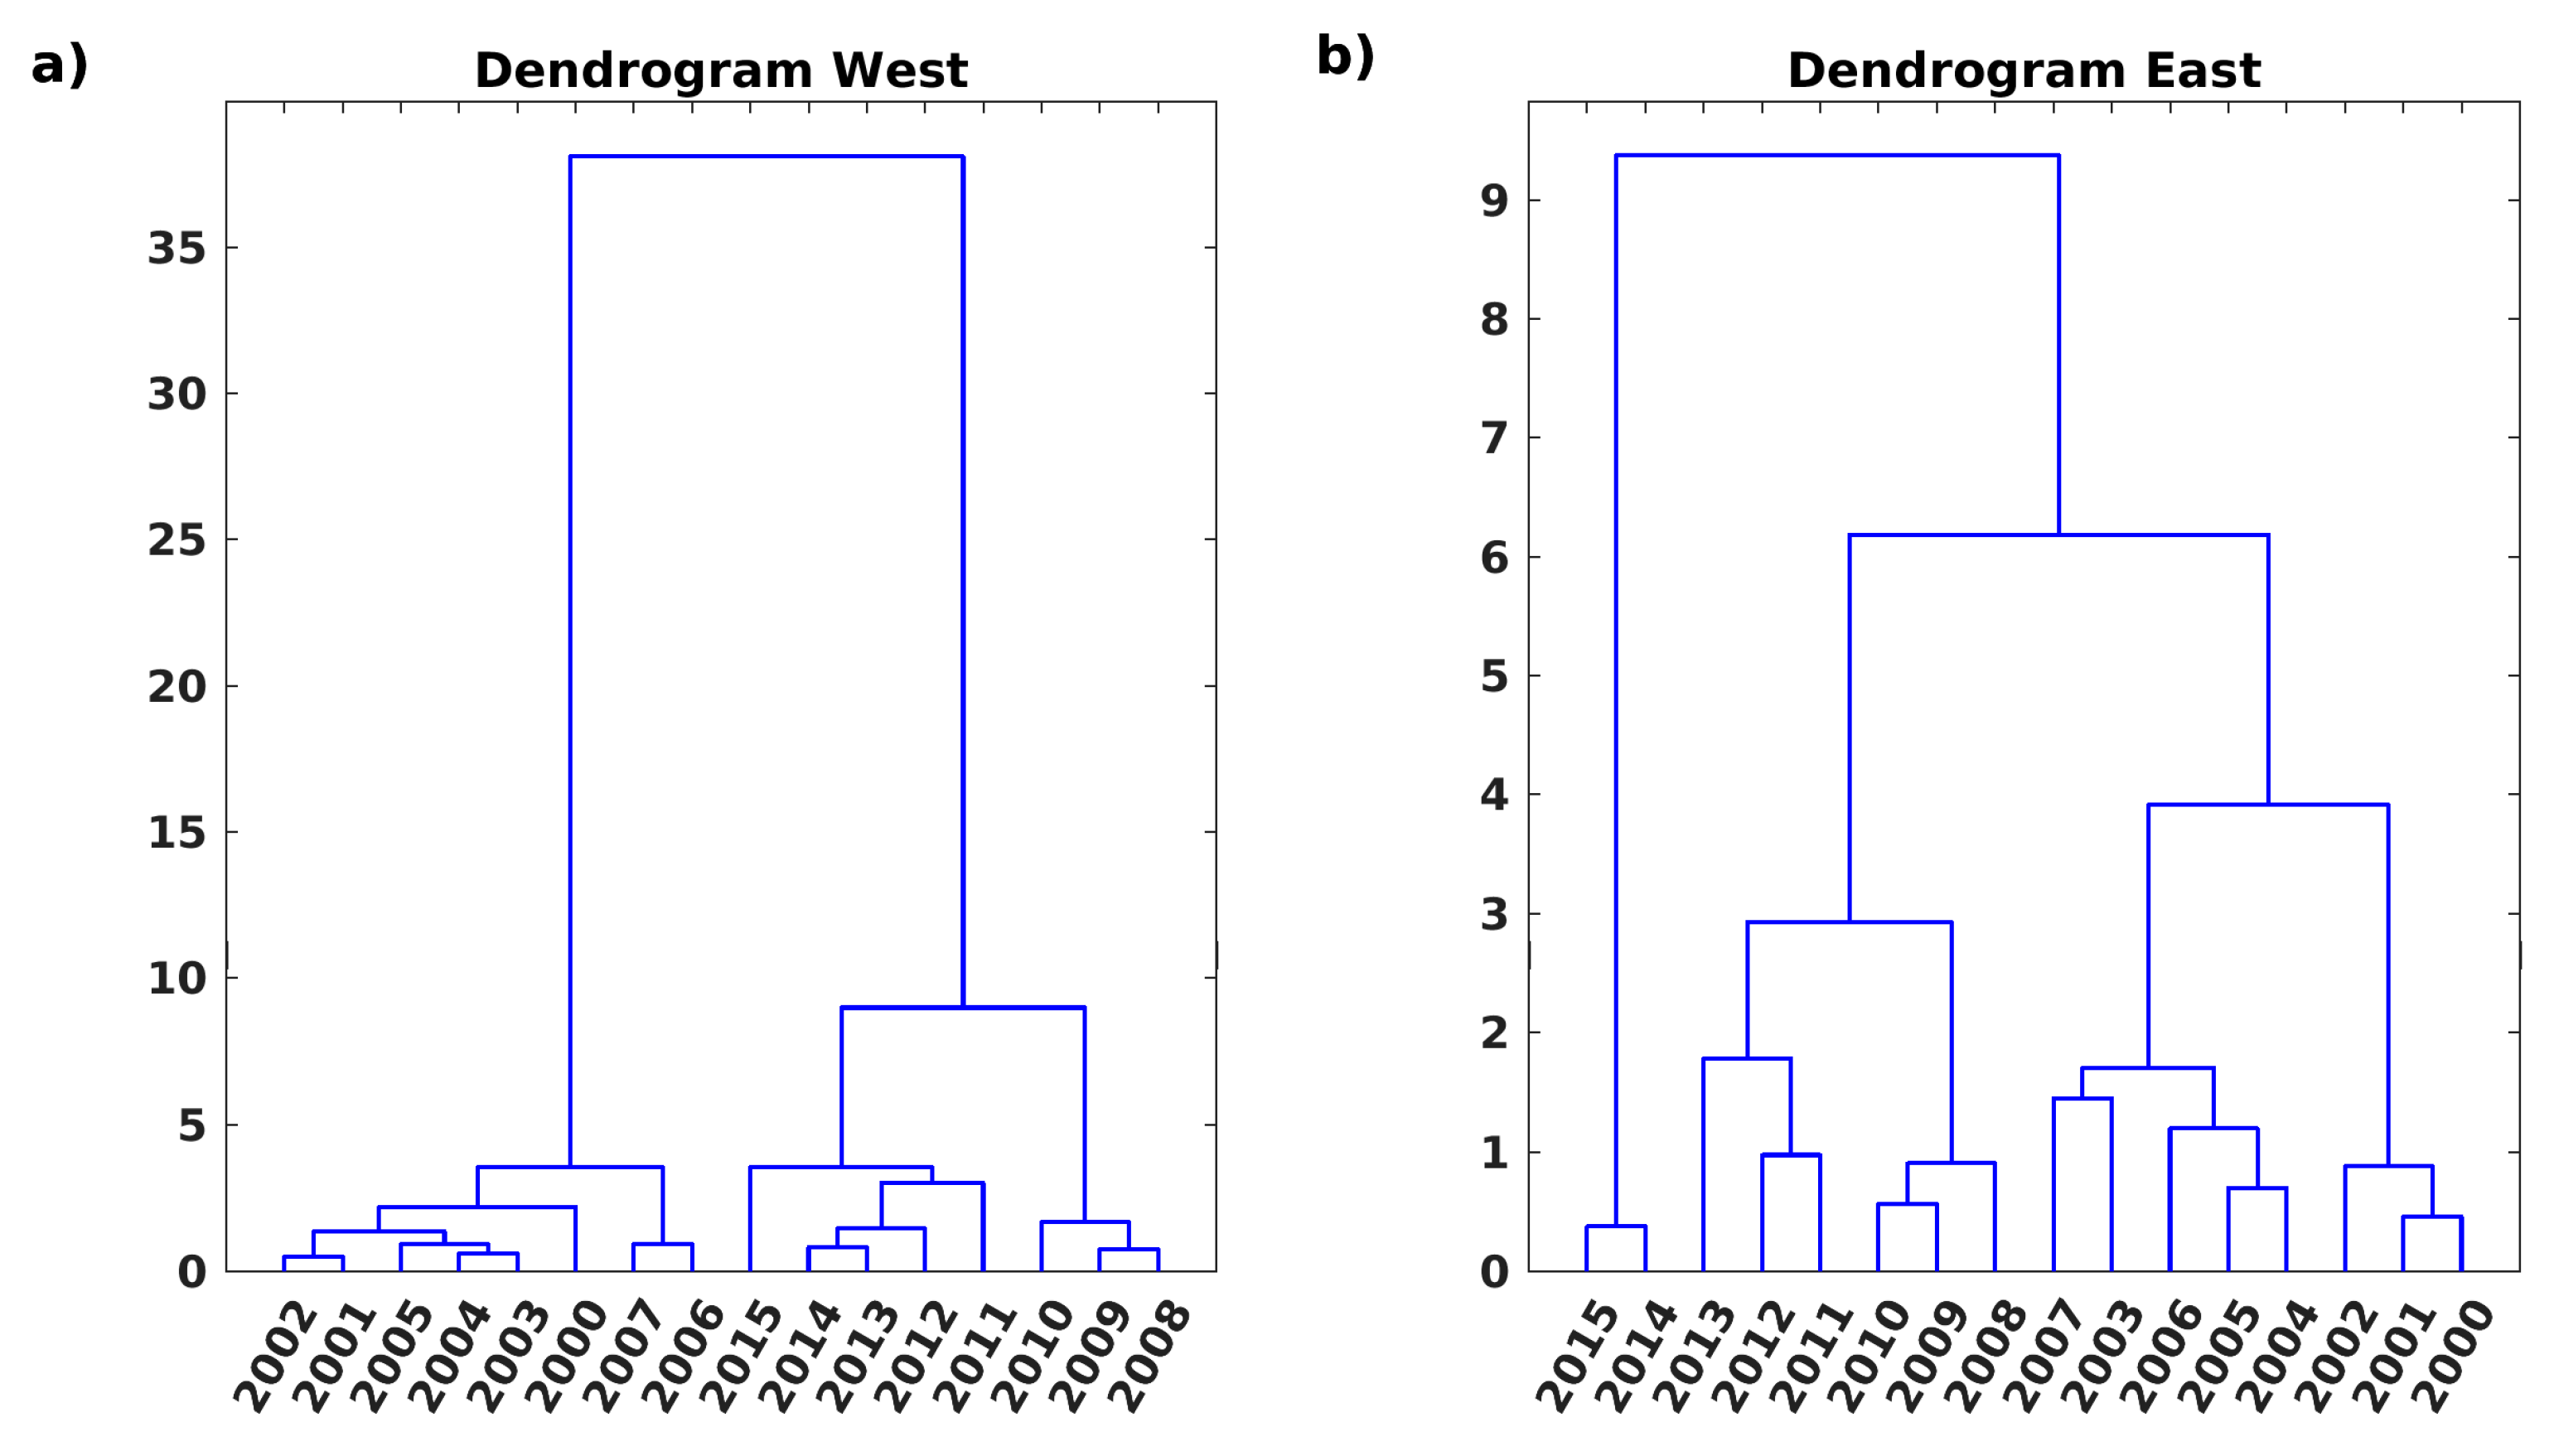
Figure 4 shows the dendrogram plot corresponding to the hierarchical cluster applied to the clr-transformed traffic composition. The dendrogram, as a tree diagram, allows hierarchically organizing the data down to the desired level. This is useful for extracting information on the temporal evolution in compositional data by defining the similarity over the years. From an analytical point of view, each cluster suggests an association of years within the traffic share evolution. In the West region, if we consider three clusters, they correspond to the periods: 2000–2007, 2008–2010, and 201–2015. In the case of the East region, the 3-cluster periods are 2000–2007, 2008–2013, and 2014–2015. In both regions, the results reveal chronologically continuity among three clusters suggesting consistency in the data.
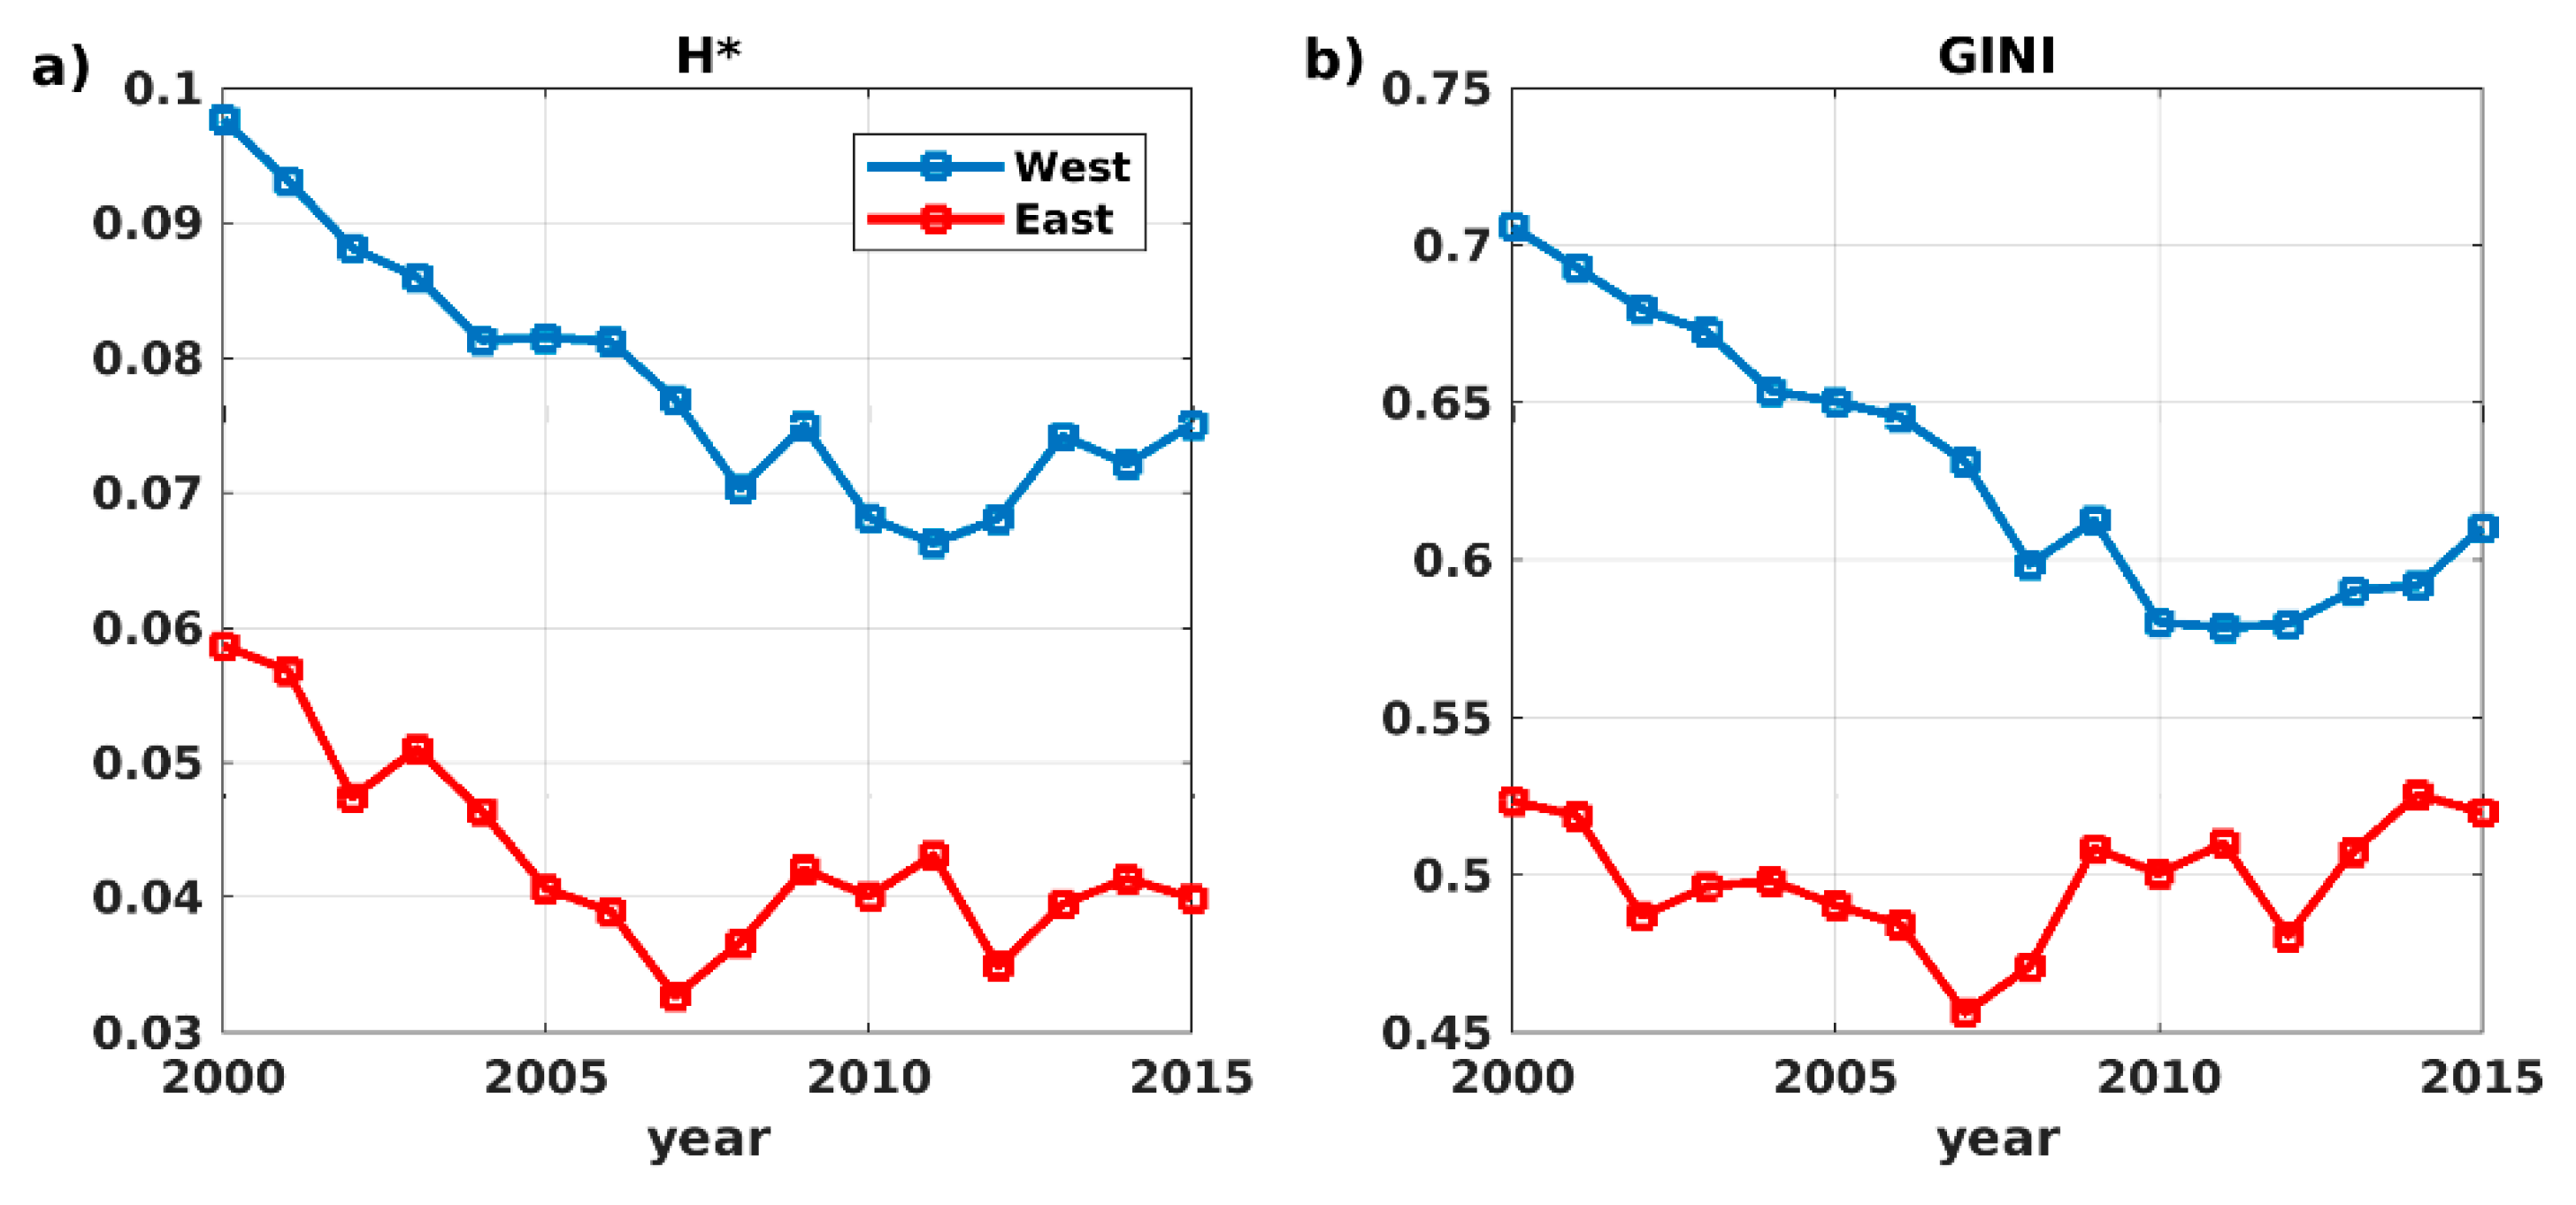
Figure 5 shows the concentration indexes H* and G (normalized Herfindahl-Hirschman and Gini coefficient respectively) for each region. In both geographical areas, H* and G show a decrease of the concentration level in the period between 2000 and 2005. In the East (West) region H*, decreases from 0.06 (0.1), to 0.04 (0.07) during the period 2000–2015. The gradual overall decrease includes fluctuations. These fluctuations show qualitatively dependence with the total traffic volume, suggesting variations in traffic share compositions. The deconcentration trend is also identified by the Concentration Ratio, CR(k), which takes into account the accumulated percentage of the container throughput of the largest k-ports. In the East (West) region, the five largest container ports (CR5) account for a traffic share of 56% (79%) in 2000, decreasing to 55% (71%) in 2015. In the same line, CR3 reaches 43% (55%) in 2000 against 35% (53%) in 2015. These values are far from the 75% benchmark, which is considered an indication of an oligopoly market. The gradual deconcentration, which seems stronger in the East region, is alternated with certain fluctuating periods.
4. Discussion
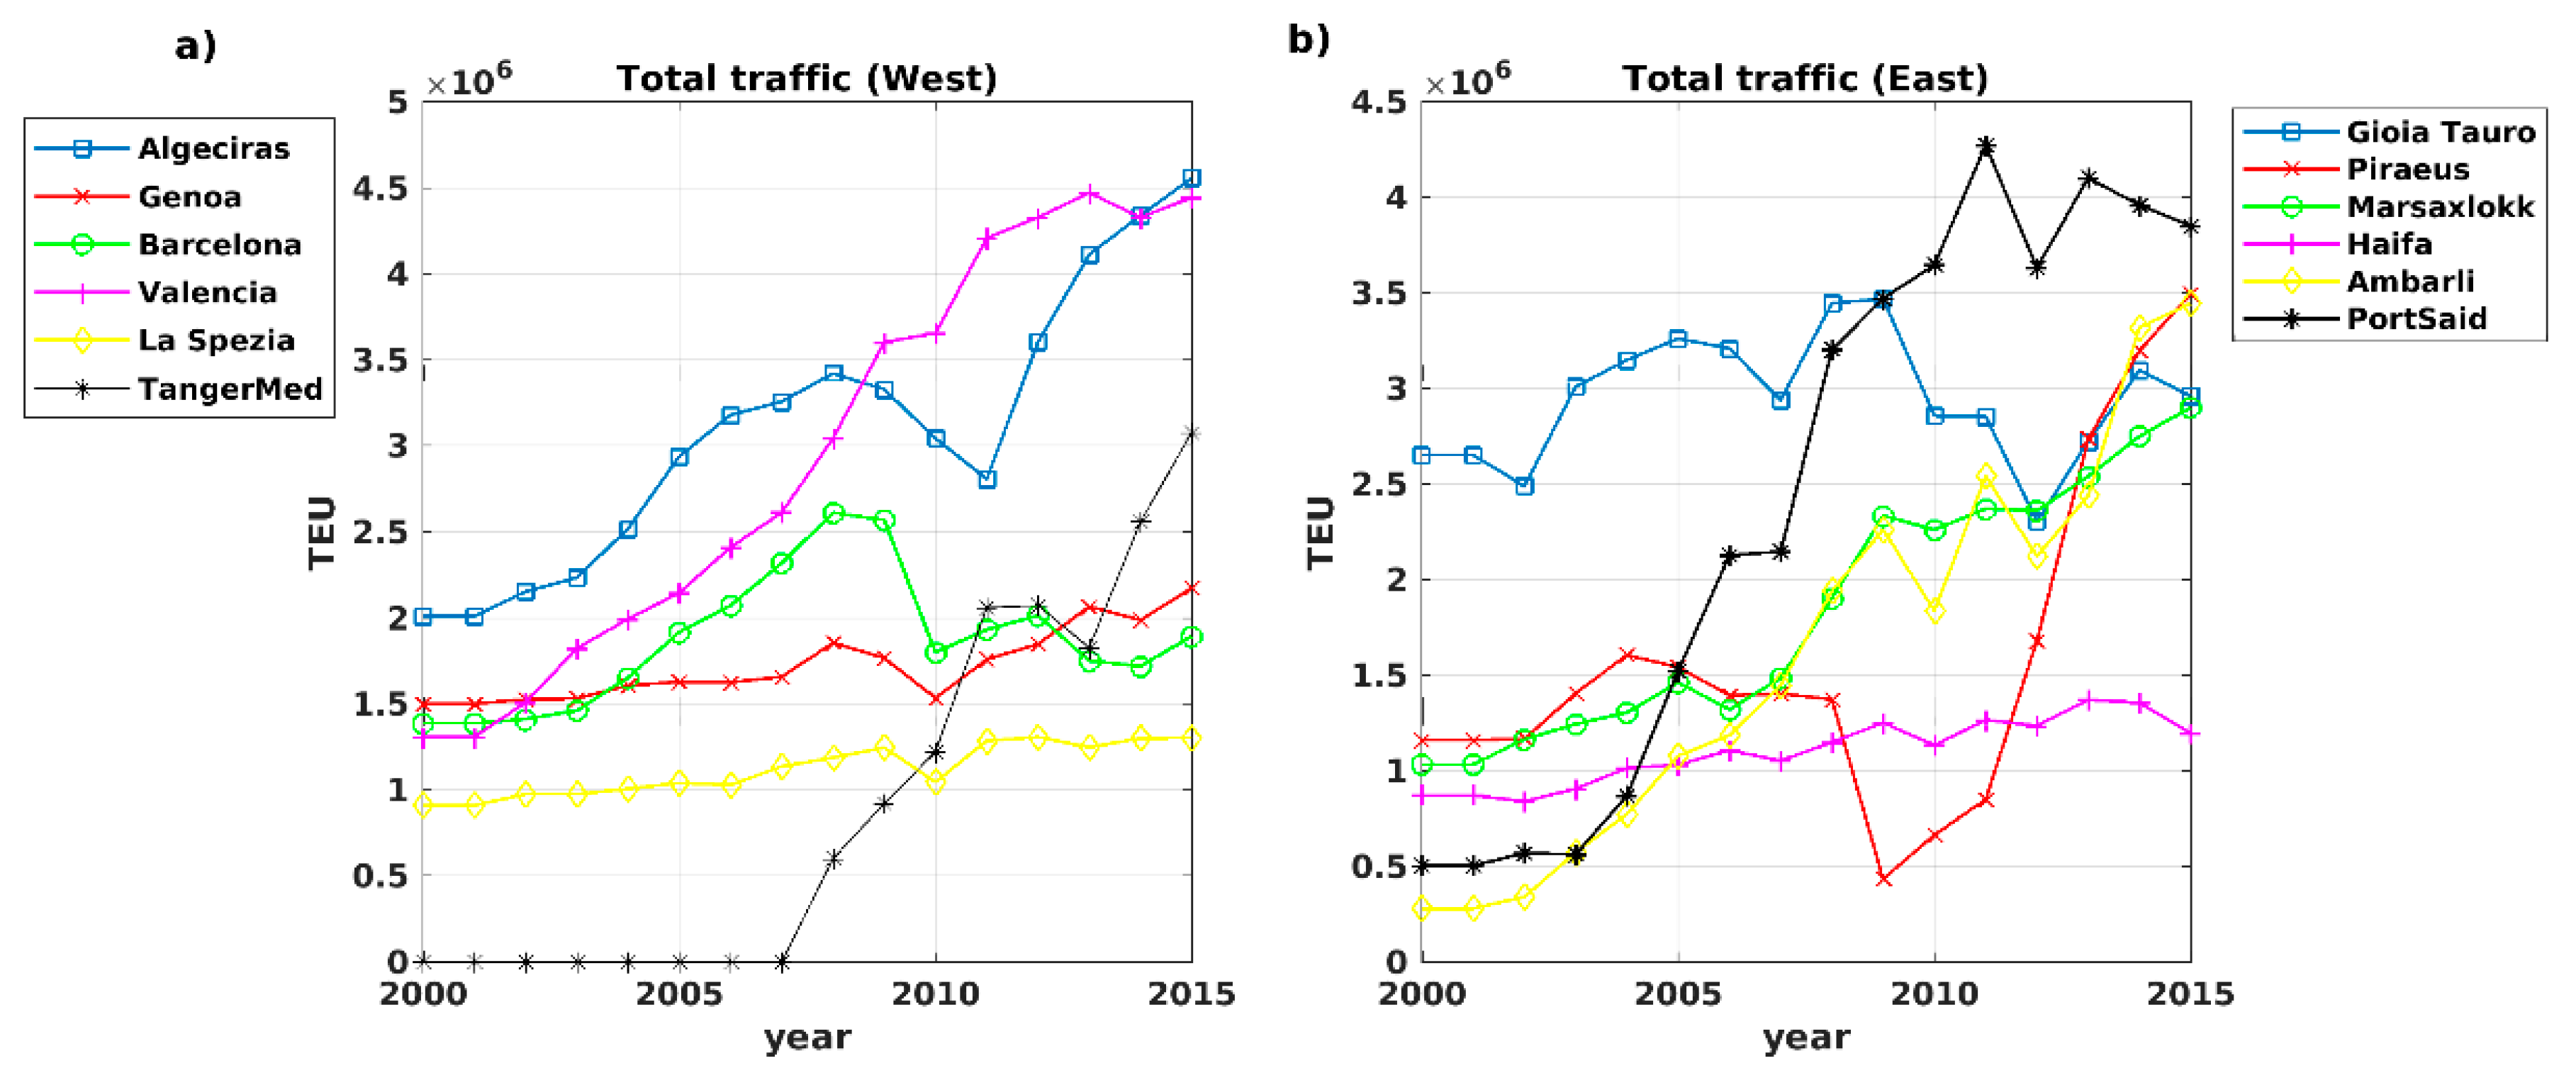
The delineation of the East and West region has been assessed by the analysis of the configuration of the long haul routes. However, the Mediterranean Sea presents very heterogeneous port ranges for a number of reasons: Geography (positioning respect to trunk routes, etc.), country population and economy, geopolitical stability, hinterland infrastructures, and inward FDIs in ports or governance rules among others. In consequence, the East/West geographical definition may be not unique (for instance Adriatic ports may included as a third region). In particular, the inclusion of Goia Tauro or Marsaxlokk in West side may be also reasonable inducing significant changes in both regions. However the results presented in the previous sections reveals a differentiated characteristic that support the West/East delimitation. For instance, the variability of the traffic share is larger in the East side compared to the West side ports in the second half of the decade of the 2000’s (see Figure 6).
During the period between 2000 and 2015, the Med region presents a port system dominated by transhipment hubs (e.g., Algeciras, Gioia Tauro, etc.) as result of the transhipment insertion in the mid-1990’s. Ten ports control 63% (CR10) of the total traffic in 2015. However, a substantial increase of container throughput occurs in small/medium sized ports. This is likely due to dis-economies of scales stemming from port congestion, new opportunities in dynamic economies, and flexible labor regimes. Ports such as La Spezia, Ashdod, or Castellón have increased significantly their traffic share in the recent years as alternatives to big gateway ports. Similarly, this was defined as “the challenge of the periphery” leading to a multi-port gateway region instead of a single gateway port [4]. The substantial traffic increase at medium size ports and the emergence of new hubs with transhipment traffic (such as TangerMed and Ambarli) corroborate the increase of the number of market players and the subsequent decrease of concentration indices shown in Figure 5. The emergence of new transhipment hubs is connected to the flexible labour market and tax policies (e.g., Tanger-Med port), liberalization process (for instance in Piraeus a berth was put under concession to COSCO (China Ocean Shipping Company) in 2009) or as a positive result of fast-growing emerging economies such as Turkey (i.e., Ambarli port). Other Med hubs, such as Gioia Tauro, are in a relative stagnation falling from the top-5 of Med ports.
The concentration indices calculated (e.g. CR(k), H* and G) coincide and reaffirm the mentioned deconcentration process. This deconcentration trend has also been reported by other researchers using traffic data of several Med ports (e.g., References [4,7,9]). In accordance with our results, Reference [25] found a fluctuation pattern in European ranges ports during and after the crisis. H* shows that Med is an unconcentrated port system (H* < 0.1). The range of the H* in both Med regions during 2000–2015 is lower in comparison to other port systems investigated (e.g., in References [4,22]). While a direct comparison with other areas may be far fetched, the temporal variability of the traffic share tends to be relatively stable during the period investigated. For instance, four of the five busiest ports in the West region used to calculate the CR(5) remain in the top five positions during the period between 2000 and 2015 (namely Algeciras, Genoa, Barcelona, and Valencia). In the East region, Piraeus, Port-Said and Marsaxlokk appear steadily in the top-list position. This leads to a relatively low temporal variability of the traffic share throughout the years that is consistent with previous studies [3]. This low variability is possibly due to the location advantages of those ports being either on the least cost route from East to West Med or the centrality advantages as distribution hubs. However, the appearance of new players may have a decisive role in the future structure of the Eastern port system as new ports are developed by shipping lines such as AsiaMed (MSC). In addition, the Eastern port system developed infrastructure relatively later than the Western counterparts. This means that investments are still maturing and shipping lines or port operators that have devoted funds are not willing to look for alternatives and ports aggressively provide incentives in order to utilize the new port capacity that came recently online.
The concentration indices and hierarchical clustering based in CoDa have a different underlying foundation, so their comparison is interesting. Understanding the concentration pattern may help to identify the future development of a port system [22]. Several cases have illustrated that the past concentration data may infer future tendencies on port system throughput (e.g., Reference [8]). Additionally, this information is useful in assessing uncertainties and risks of future investments in infrastructure system [27]. The hierarchical cluster of the clr-transformed traffic composition and its dendogram helps a complementary interpretation of the traffic share evolution considering the natural turning points; for instance, after 2007 takes place a substantial rise in volume in TangerMed in the West region. This coincides with the limit range of the clustered period 2000–2007. The subsequent period (2008–2010) coincides with the financial crisis period which led to a decrease in traffic volume in some ports of the West region (e.g., Barcelona or Algeciras). In consequence, the hierarchical cluster of the clr-transformed traffic composition is useful to identify the turning points and change of trend in the traffic share values and it is suggested as a complementary tool of the concentration indexes and traffic data for the investigation of the dynamics in port systems.
The hierarchical clustering suggests an association of years of similar traffic share. In this sense, it is useful to analyze the periods obtained by the classification shown in the dendrogram. In the West region and considering three levels of clustered periods, the first period between 2000 and 2007 is characterized by a stagnation of the concentration indices (e.g., H* is around 0.09). To complement the analysis, Figure 6 shows the total traffic of the 6 busiest port: Algeciras, Valencia, TangerMed, Genoa, Barcelona, and La Spezia. This reveals that during the period between 2000 and 2007 Algeciras is the leader, followed by Valencia and Barcelona. During this period, the traffic fluctuation is relatively small and the TangerMed traffic is negligible. The second period (2008–2010) provided by the dendrogram is characterized by strong fluctuations in the traffic share due to the financial crisis and the subsequent traffic redistribution: Strong decreasing of traffic in all ports with the exception of a substantial increase in TangeMed, and to a lesser extent, in Valencia. The index deconcentration falls during this period in the West region. The third period (2011–2015) is characterized by a recovering of traffic volumes in some ports (Algeciras or Genoa) with a minor fluctuation in others ports (e.g., Valencia, Barcelona, or La Spezia). This leads to another stagnation of concentration indices in the West region.
The picture in the East region differs, recording a larger volatility in the total traffic of the main ports. The first period shown by the dendrogram (2000–2007) is a period with a gentle increase of traffic in Port-Said, Gioia-Tauro and Ambarli. During this period the concentration indices decrease. The second period (2008–2013) is characterized by strong fluctuations in all the ports except Haifa. This is probably due to a strong privatization wave that was recorded in many key East Med ports such as Piraeus, Port Said, Ambarli, and Izmir. These privatizations also increased port infrastructure investment that intensified port competition for the attraction of transhipment traffic from other ports in order to increase capacity utilization. Furthermore, following the 2008 reduction of traffic volumes, a reshuffle of shipping lines’ alliances and consolidation of services are recorded. This leads to volumes shifting between ports according to the alliances formed and the port hubs directly or indirectly controlled by the members. Piraeus is probably the most obvious example that following the acquisition of a container terminal by COSCO, other alliance members gradually shifted their volumes to the port as well. This is reasonable as an alliance requires a coordination of service routes and this can only be achieved through a common hub. The East region indicates, in the short period (2014–2015), a relative stability in the traffic volumes and concentration indices.
In order to explore the consistency of the periods obtained from the hierarchical clustering, the shift volumes are computed using the classical shift-share analysis. The shift-share analysis of a port system divides the change of volume into two elements: The shift effect and the share effect. The share effect considers the change in volume for each port according to the mean growth of the market. The shift volume reflects the share won or lost from other ports eliminating the growth of the port system. The shift (SHIFTi) and share (SHAREi) effect of the container in port i for the period t0–t1 are computed in the base of the absolute growth of container traffic (ABSGRi):
where n is the number of ports in the container port system.
Table 2 shows the three main ports with shifts in volumes of the periods given by the hierarchical clustering for each region. For the West region, the periods are consistent with the fluctuations of Valencia and Algeciras (positive and negative shift volumes for the periods 2008–2010, respectively, being negative and positive for the period 2011–2015). In the case of the East region, the periods derived from the hierarchical clustering are consistent with the fluctuations of the shift volumes of Piraeus for the period 2000–2007 (negative shift volume) and 2008–2013 (positive shift volume) or Port Said (positive for 2008–2013 and negative for 2014–2015). Our methodology differs from other contributions, where the periods under examination analyzing the evolution of a port system are selected arbitrarily (e.g., in References [3,4,22]). In our case, the periods are based on the hierarchical clustering of clr-transformed traffic shares and provides consistency based on the evolution of traffic share.
Most ports depend on transhipment traffic on top of their hinterland with import/export cargoes in order to make port investments viable. For instance, the transshipment ratio of some ports reach the 90% (e.g., Algeciras Bay and Piraeus corresponds to 0.92 and 0.90, respectively during 2016). This means that as market consolidation on the demand side for port services increases port competition intensifies. On the other hand, as routes become more and more critical for a shipping line’s network and service reliability depends on port service quality shipping lines either enter in long-term contracts or invest in port terminals in order to control service quality. This further intensifies port competition for transhipment traffic between ports not directly controlled by shipping lines. This leads to a considerable volatility of the volumes mainly due to the variability of the transhipment flows. In this sense, one of the main limitations of our work stems from the data set that did not include a breakdown of transhipment and import/export volumes. The use of transhipment data could depict the temporal evolution of seaborne transfer reflecting the relevance of the port hub in the Mediterranean Sea. However, import/export volumes are directly related to the economic growth of the port’s hinterland and in the absence of extreme economic conditions, gateway volumes do not usually present extreme fluctuations, and thus, the results adequately capture the market evolution. Nevertheless, different profiles of import/exports, and hub ports are present in MedSea. For instance, Barcelona port with a clear import/export profile (transhipment ratio 0.19) in opposition to the mentioned Algeciras and Piraeus. Our evaluation could be further developed to include the consideration of break down volumes (local vs. transshipment) which will affect the hierarchical clustering and the evolution of the concentration index and shift share analysis. Also the delimitation of the boundary between the East/West region (for instance the inclusion of Goia Tauro in the West side) may impact the results and deserve future research.
The application of Compositional Data (CoDa) analysis for the first time in port market analysis suggest a promising way to investigate port traffic evolution in terms of port agglomerations or similarity patterns. In this sense, the use of suitable techniques for the characteristics of the data at hand, CoDa analysis open new opportunities for the researchers and port managers that focus on trend assessment, market evaluation and/or risk investment analysis. However, the presence of zeroes in the datasets makes hard to apply the log-ratio approach. There are several “compositional coherent” techniques to deal with zeroes, but still, some sensitivity to the substitution may be present.
5. Conclusions
The main conclusions derived from the analysis are the following. Firstly, the total container throughput in the Mediterranean area during the last fifteen years has experienced an impressive growth, from 20 million TEU in 2000 to 51 million TEU in 2015. In both considered areas (i.e., West and East), the container throughput concentration has experienced a gradual decrease during the first decade of the 2000’s followed by a period with fluctuations in the volumes and shares. This is in line with previous studies focusing on Med ports. The variability of the traffic share is larger in the East side compared to the West side ports in the second half of the decade of the 2000’s (basically due to the traffic oscillation in Piraeus, Gioia Tauro, and Port-Said). The hierarchical clustering based on CoDa has allowed to identify different periods of traffic share evolution considering the temporal variability in the Med ports traffic. These periods are consistent with the evolution of the concentration indexes and shift-share analysis. The analysis can be linked to an actual assessment of uncertainties and risks of future investments in port infrastructure. While this combined technique (hierarchical clustering of compositional data and concentration indexes) has been applied here to the container Mediterranean port system, the findings obtained demonstrate that the methodology could be useful for a detailed temporal and spatial evolution analysis in other port systems such as cruise, car terminals, etc. The analysis can be linked to an assessment of uncertainties and risks of future investments in port infrastructure. Since the investigated ports have complex ownerships, the analysis may have policy implications related to port categorization, competitive evaluation or resource assignment based on traffic share evolution.
Author Contributions
M.G. conceived and design the analysis. T.K. provided skills in the topic. M.I.O. helps in the methodological section. All of the authors contributed ideas in the writing paper. Contact with M.G. about the data availability.
Funding
This research has been funded by the Ministerio de Economía y Competividad from the Spanish Government under project “CODA-RETOS” (MTM2015-65016-C2-2-R (MINECO/FEDER)); and by the Agència de Gestió d'Ajuts Universitaris i de Recerca (AGAUR) of the Generalitat de Catalunya under the projects “Compositional and Spatial Data Analysis” (COSDA) (Ref: 2017SGR656;2017-2019) and “Barcelona Innovative Transportation (BIT)” (Ref: 2017SGR1623; 2017-2019).
Acknowledgments
This research has been partially funded by the Spanish Ministerio de Economía y Competividad under project CODA-RETOS (MTM2015-65016-C2-2-R (MINECO/FEDER)).
Conflicts of Interest
The authors declare no conflict of interest.
Appendix A
Figure A1.
Liner service as of September 2017.

References
- Ducruet, C.; Notteboom, T.; De Langen, P.W. Revisiting inter-port relationships under the New Economic Geography research framework. In Ports in Proximity: Competition and Coordination among Adjacent Seaports; Notteboom, T., Ducruet, C., De Langen, P.W., Eds.; Ashgate: Aldershot, UK, 2009; pp. 11–27. [Google Scholar]
- Guerrero, D.; Rodrigue, J.P. The waves of containerization: Shifts in global maritime transportation. J. Transp. Geogr. 2014, 34, 151–164. [Google Scholar] [CrossRef]
- Notteboom, T.E. Concentration and load centre development in the European container port system. J. Transp. Geogr. 1997, 5, 99–115. [Google Scholar] [CrossRef]
- Notteboom, T.E. Concentration and the formation of multi-port gateway regions in the European container port system: An update. J. Transp. Geogr. 2010, 18, 567–583. [Google Scholar] [CrossRef]
- Gouvernal, E.; Debrie, J.; Slack, B. Dynamics of change in the port system of the Western Mediterranean. Marit. Policy Manag. 2005, 32, 107–121. [Google Scholar] [CrossRef]
- Medda, F.; Carbonaro, G. Growth of container seaborne traffic in the Mediterranean Basin: Outlook and policy implications for port development. Transp. Rev. 2007, 27, 573–587. [Google Scholar] [CrossRef]
- Mohamed-Chérif, F.; Ducruet, C. Regional integration and maritime connectivity across the Maghreb seaport system. J. Transp. Geogr. 2016, 51, 280–293. [Google Scholar] [CrossRef] [Green Version]
- Elbayoumi, O.; Dawood, A. Analysis of the competition of ports in the Middle East container ports using HHI. J. Shipp. Ocean Eng. 2016, 6, 339–347. [Google Scholar]
- Twrdy, E.; Batista, M. Modeling of container throughput in Northern Adriatic ports over the period 1990–2013. J. Transp. Geogr. 2016, 52, 131–142. [Google Scholar] [CrossRef]
- Grifoll, M. A statistical forecasting model applied to container throughput in a multi-port gateway system: The Barcelona-Tarragona-Valencia case. Int. J. Shipp. Transp. Logist. 2019, 11, 1–18. [Google Scholar] [CrossRef]
- Veenstra, A.; Notteboom, T. The development of the Yangtze River container port system. J. Transp. Geogr. 2011, 19, 772–781. [Google Scholar] [CrossRef]
- Wilmsmeier, G.; Monios, J.; Pérez-Salas, G. Port system evolution-the case of Latin America and the Caribbean. J. Transp. Geogr. 2014, 39, 208–221. [Google Scholar] [CrossRef]
- Merkel, A. Spatial competition and complementarity in European port regions. J. Transp. Geogr. 2017, 61, 40–47. [Google Scholar] [CrossRef]
- Tavasszy, L.; Minderhoud, M.; Perrin, J.F.; Notteboom, T. A strategic network choice model for global container flows: Specification, estimation and application. J. Transp. Geogr. 2011, 19, 1163–1172. [Google Scholar] [CrossRef]
- Russo, F.; Musolino, G.; Assumma, V. An integrated procedure to estimate demand flows of maritime container transport at international scale. Int. J. Shipp. Transp. Logist. 2014, 6, 112. [Google Scholar] [CrossRef]
- Vives-Mestres, M.; Martín-Fernández, J.A. Some comments on compositional analysis in management and production engineering. Manag. Prod. Eng. Rev. 2015, 6, 63–72. [Google Scholar] [CrossRef]
- Muriithi, F. Centered log-ratio (clr) transformation and robust principal component analysis of long-term NDVI data reveal vegetation activity linked to climate processes. Climate 2015, 3, 135–149. [Google Scholar]
- Karlis, T.; Polemis, D. Chinese outward FDI in the terminal concession of the port of Piraeus. Case Stud. Transp. Policy 2018, 6, 17–24. [Google Scholar] [CrossRef]
- Pawlowsky-Glahn, V.; Egozcue, J.J.; Tolosana-Delgado, R. Modeling and Analysis of Compositional Data; John Wiley & Sons, Ltd.: Chichester, UK, 2015; p. 253. [Google Scholar]
- Aitchison, J. The statistical analysis of compositional data. J. R. Stat. Soc. 1982, 44, 139–177. [Google Scholar]
- Egozcue, J.J.; Pawlowsky-Glahn, V.; Mateu-Figueras, G.; Barceló-Vidal, C. Isometric logratio for compositional data Analysis. Math. Geol. 2003, 35, 279–300. [Google Scholar] [CrossRef]
- Pham, T.Y.; Jeon, J.W.; Dang, V.L.; Cha, Y.D.; Yeo, G.T. A longitudinal analysis of concentration developments for container terminals in Northern Vietnam. Asian J. Shipp. Logist. 2016, 32, 157–164. [Google Scholar] [CrossRef]
- Le, Y.; Ieda, H. A modified Herfindahl-Hirschman index for measuring the concentration degree of container port systems and its application to Japan, China and Korea. Transp. Res. Rec. 2010, 2166, 44–53. [Google Scholar] [CrossRef]
- Lijesen, M.G. Adjusting the Herfindahl index for close substitutes: An application to pricing in civil aviation. Transp. Res. Part E Logist. Transp. Rev. 2004, 40, 123–134. [Google Scholar] [CrossRef]
- Kitsos, V. Changes of Concentration Patterns in European Container Ports during and after the Crisis. Master’s Thesis, Erasmus Universiteit of Rotterdam, Rotterdam, The Netherlands, April 2014. [Google Scholar]
- Notteboom, T. Economic Analysis of the European Seaport System Economic Analysis of the European Seaport System; Report Serving as Input for the Discussion on the TEN-T Policy; European Sea Ports Organizatio: Brussels, Belgium, 2009. [Google Scholar]
- Suau-Sanchez, P.; Burghouwt, G. The geography of the Spanish Airport System: Spatial concentration and deconcentration patterns in seat capacity distribution, 2001–2008. J. Transp. Geogr. 2011, 19, 244–254. [Google Scholar] [CrossRef] [Green Version]
Figure 1.
Container throughput in the main Mediterranean Ports for 2000 (in × 1000 TEU). The red dashed lines show the division used in the analysis. For clarity, only the names of the ports with > 200,000 TEU appear on the map.
Figure 1.
Container throughput in the main Mediterranean Ports for 2000 (in × 1000 TEU). The red dashed lines show the division used in the analysis. For clarity, only the names of the ports with > 200,000 TEU appear on the map.
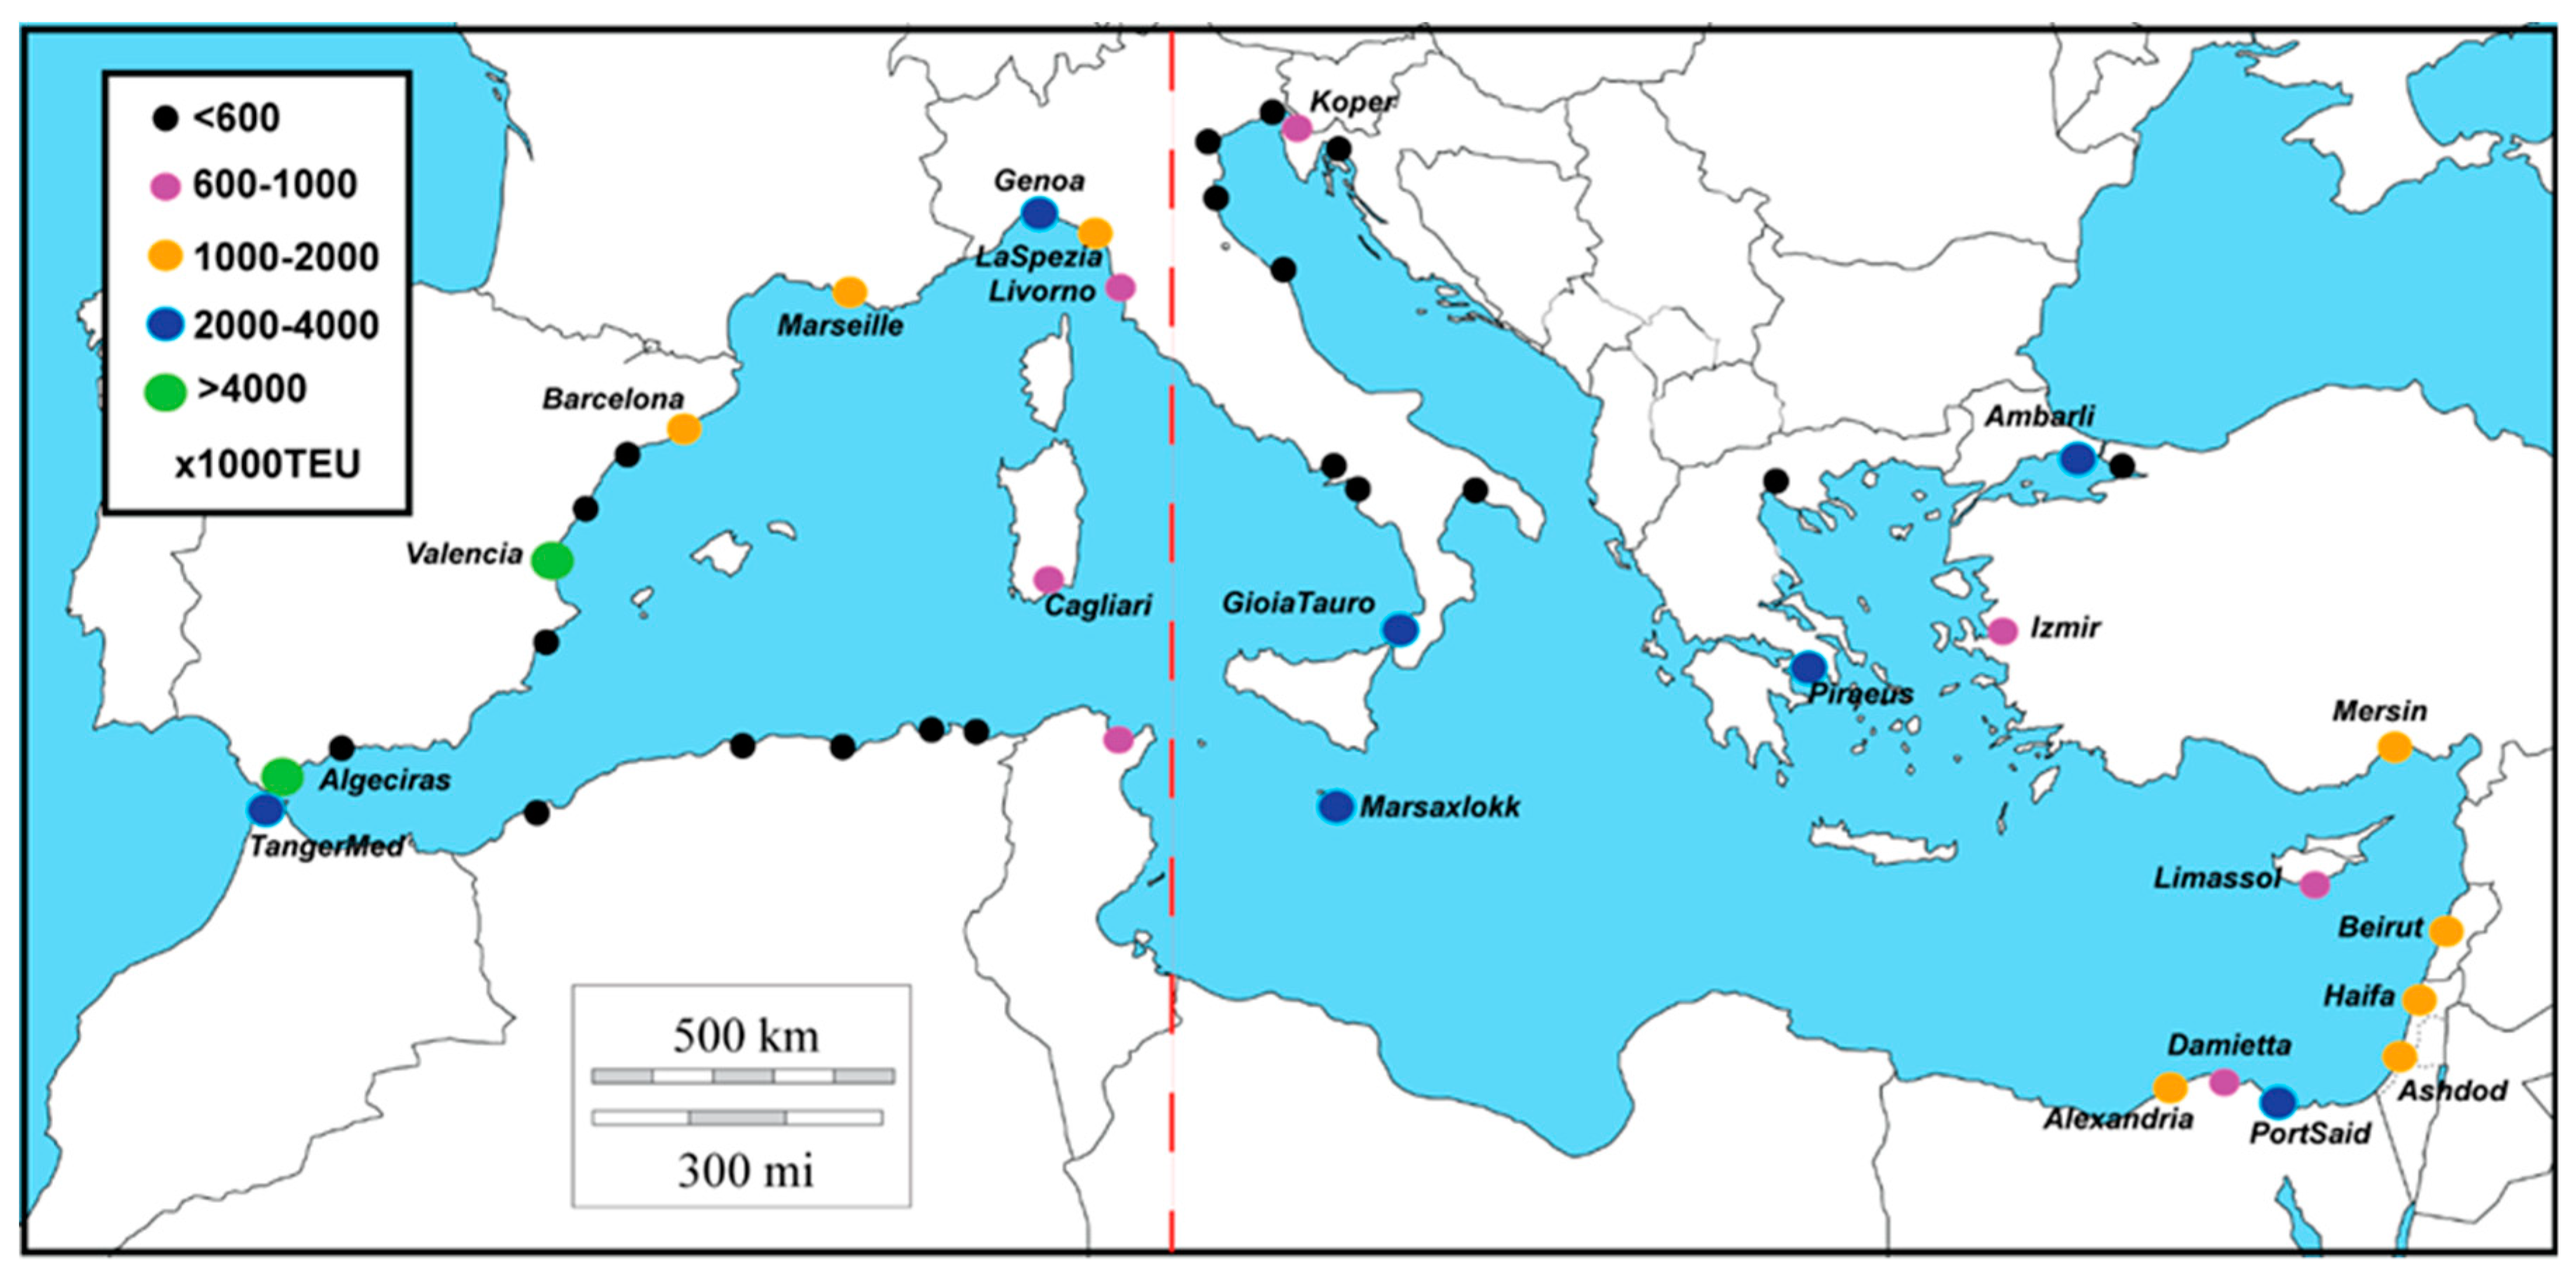
Figure 2.
Container throughput in the main Mediterranean Ports for 2015 (in × 1000 TEU). The red dashed lines show the division used in the analysis. For clarity, only the names of the ports with > 200,000 TEU appear on the map. Note that the range of the symbols differs in comparison to Figure 1.
Figure 2.
Container throughput in the main Mediterranean Ports for 2015 (in × 1000 TEU). The red dashed lines show the division used in the analysis. For clarity, only the names of the ports with > 200,000 TEU appear on the map. Note that the range of the symbols differs in comparison to Figure 1.

Figure 3.
Traffic data description for container ports in the Mediterranean, 2000–2015, according to the two regions defined in Table 1. (a) Total container throughput. (b) Traffic share.
Figure 3.
Traffic data description for container ports in the Mediterranean, 2000–2015, according to the two regions defined in Table 1. (a) Total container throughput. (b) Traffic share.

Figure 4.
Dendrogram (hierarchical clustering) for clr-transformed container traffic of ports in the Mediterranean, 2000–2015 considering two regions: (a) West and (b) East.
Figure 4.
Dendrogram (hierarchical clustering) for clr-transformed container traffic of ports in the Mediterranean, 2000–2015 considering two regions: (a) West and (b) East.

Figure 5.
(a) Normalized Herfindahl-Hirschman index (H*) and (b) Gini coefficient for container ports in the Mediterranean, 2000–2015 for each region. Note that the scales do not cover the range of the indexes (i.e., 0–1).
Figure 5.
(a) Normalized Herfindahl-Hirschman index (H*) and (b) Gini coefficient for container ports in the Mediterranean, 2000–2015 for each region. Note that the scales do not cover the range of the indexes (i.e., 0–1).

Figure 6.
Traffic data for the 6 main ports in the West region (a) and the East region (b).


Table 1.
Ports considered in each one of the two regions defined for the analysis.
| West | East |
|---|---|
| Annaba, Algeciras, Algier, Alicante, Barcelona, Bejaia, Cagliari, Castellon, Genoa, Malaga, Marseille, La Spezia, Livorno, Oran, Skikda, Tanger-Med, Tarragona, Tunisia, Valencia. | Ancona, Alexandria, Ambarli, Ashdod, Beirut, Damietta, Goia Tauro, Haifa, Haydarpasa, Izmir, Koper, Limasol, Marsaxlokk, Mersin, Naples, Piraeus, Port Said, Ravenna, Rijeka, Salerno, Taranto, Trieste, Venice. |
Table 2.
Shift volumes (in TEU) of the top-3 lost (negative) and won (positive) for each period derived from the hierarchical clustering in function of each geographical region.
Table 2.
Shift volumes (in TEU) of the top-3 lost (negative) and won (positive) for each period derived from the hierarchical clustering in function of each geographical region.
| West Region | |||||
| 2000–2007 | 2008–2010 | 2011–2015 | |||
| Genoa | −1,093,675 | Barcelona | −740,567 | Valencia | −606,953 |
| La Spezia | −531,375 | Algeciras | −286,907 | Barcelona | −424,205 |
| Marseille | −377,043 | Genoa | −272,133 | Malaga | −270,133 |
| Valencia | 214,187 | Valencia | 204,184 | Bejaia | 94,795 |
| Malaga | 457,392 | TangerMed | 637,935 | TangerMed | 607,374 |
| Cagliari | 648,006 | Cagliari | 692,033 | Algeciras | 1,187,846 |
| East Region | |||||
| 2000–2007 | 2008–2013 | 2014–2015 | |||
| Goia Tauro | −1,489,920 | Goia Tauro | −1,249,457 | Port Said | −239,344 |
| Piraeus | −534,624 | Taranto | −607,712 | Goia Tauro | −236,325 |
| Marsaxlokk | −239,364 | Damietta | −274,849 | Haifa | −205,677 |
| Taranto | 886,627 | Marsaxlokk | 348,993 | Venice | 89,218 |
| Ambarli | 978,871 | Port Said | 409,868 | Alexandria | 108,776 |
| Port Said | 1,286,034 | Piraeus | 1,151,537 | Piraeus | 188,678 |
© 2018 by the authors. Licensee MDPI, Basel, Switzerland. This article is an open access article distributed under the terms and conditions of the Creative Commons Attribution (CC BY) license (http://creativecommons.org/licenses/by/4.0/).
Share and Cite
MDPI and ACS Style
Grifoll, M.; Karlis, T.; Ortego, M.I. Characterizing the Evolution of the Container Traffic Share in the Mediterranean Sea Using Hierarchical Clustering. J. Mar. Sci. Eng. 2018, 6, 121. https://doi.org/10.3390/jmse6040121
AMA Style
Grifoll M, Karlis T, Ortego MI. Characterizing the Evolution of the Container Traffic Share in the Mediterranean Sea Using Hierarchical Clustering. Journal of Marine Science and Engineering. 2018; 6(4):121. https://doi.org/10.3390/jmse6040121
Chicago/Turabian StyleGrifoll, Manel, Thanassis Karlis, and M. I. Ortego. 2018. "Characterizing the Evolution of the Container Traffic Share in the Mediterranean Sea Using Hierarchical Clustering" Journal of Marine Science and Engineering 6, no. 4: 121. https://doi.org/10.3390/jmse6040121
Note that from the first issue of 2016, this journal uses article numbers instead of page numbers. See further details here.