Experimental and Numerical Investigation of Propeller Loads in Off-Design Conditions
by
 , , and
Fabrizio Ortolani
1,* ,
,
Giulio Dubbioso
1,
Roberto Muscari
1,
Salvatore Mauro
1 and
Andrea Di Mascio
2 1
CNR-INSEAN, National Research Council—Marine Technology Research Institute, Via di Vallerano 139, 00128 Rome, Italy
2
CNR-IAC—Istituto per le Applicazioni del Calcolo, Via dei Taurini 19, 00185 Rome, Italy
*
Author to whom correspondence should be addressed.
J. Mar. Sci. Eng. 2018, 6(2), 45; https://doi.org/10.3390/jmse6020045
Submission received: 27 February 2018
/
Revised: 21 March 2018
/
Accepted: 4 April 2018
/
Published: 24 April 2018
(This article belongs to the Special Issue Marine Propulsors)
Abstract
:The understanding of the performance of a propeller in realistic operative conditions is nowadays a key issue for improving design techniques, guaranteeing safety and continuity of operation at sea, and reducing maintenance costs. In this paper, a summary of the recent research carried out at CNR-INSEAN devoted to the analysis of propeller loads in realistic operative scenarios, with particular emphasis on the in-plane loads, is presented. In particular, the experimental results carried out on a free running maneuvering model equipped with a novel force transducer are discussed and supported by (Computational Fluid Dynamics) analysis and the use of a simplified propeller model, based on Blade Element Momentum Theory, with the aim of achieving a deeper understanding of the mechanisms that govern the functioning of the propeller in off-design. Moreover, the analysis includes the scaling factors that can be used to obtain a prediction from model measurements, the propeller radial force being the primary cause of failures of the shaft bearings. In particular, the analysis highlighted that cavitation at full scale can cause the increment of in-plane loads by about 20% with respect to a non-cavitating case, that that in-plane loads could be more sensitive to cavitation than thrust and torque, and that Reynolds number effect is negligible. For the analysis of cavitation, an alternative version of the solver, improved with cavitation linear theory, was developed.
1. Introduction
The performance of marine propellers during realistic and off-design conditions nowadays represents a topic worth of investigation for the perspective of both scientific research and marine technology development. Traditionally, the propeller performance was analyzed considering the wake of the ship advancing at the desired speed in calm water. However, a seagoing ship is often subjected to environmental perturbations or desired control maneuvering actions that depart it from the ideal straight ahead motion. In these circumstances, the inflow to the propeller is altered with respect to the one adopted for the blade shape optimization and, consequently, the developed loads may change considerably. During motion in waves or maneuvering, the cross flow induced by the motion and the consequent modification of the viscous wake of the hull alter the blade hydrodynamics and, consequently, the resultant propeller loads. In particular, in addition to the modification of thrust and torque, undesired in-plane forces and moments that further stress the propulsion system (shaftline and bearings) and hull structure are generated.
An extensive investigation carried out by different Classification Societies (i.e., DNV, ABS, Germanisher Lloyd) stressed that the failure of the tail shaft bearing resulted one of the most frequent accident of the propulsion system for on–going vessels. In fact, due to the the higher power installed to achieve higher speed in modern designs, very large radial loads are developed by the propeller during maneuvers [1,2]. Moreover, this aspect is central for the safe mechanical sizing of orientable propulsive devices; these novel propulsive devices replace the rudder to control and maneuver the ship and, hence, might operate at relatively high drift angles. Moreover, free running CFD maneuvering simulations highlighted that the in-plane forces acting on the propeller are not negligible during large amplitude motions and, therefore, their quantification is fundamental to correctly predict the response of the vessel during maneuvering [3,4,5] or in motion in waves.
Recently, propeller design procedures oriented to account for realistic ship operative scenario were explored by the NATO STO Task Group AVT-204, “Assess the Ability to Optimize Hull Forms of Sea Vehicles for the Best Performance in a Sea Environment” [6]. A marine propeller design optimization procedure was proposed accounting for hull wakes calculated by CFD at different relative position of the hull with respect to the wave profile. A systematic analysis on the effect of waves on propeller performance, cavitation and pressure pulses was addressed in [7,8,9]. In these works, it became apparent that changes of the wake distribution on the propeller disk play a crucial role in the performance of the propulsion device and the related problems of fluid structure interactions with the hull.
Although an increased level of attention is paid to the understanding and quantification of the propeller performance in off-design condition, studies (both numerical and experimental) are limited and mainly focused on idealized conditions for the isolated propeller [10,11,12,13,14,15,16,17,18]. In fact typical size of ship models makes it challenging the installation of dedicated devices to measure all propeller loads in behind hull conditions; from the computational perspective, although CFD techniques were successfully applied to many topics of naval architecture, including off-design scenario such as ship maneuvering, the direct simulation of rotating propeller in behind hull is beyond the computational availability of day-by-day design applications.
Numerical simulations employing the discretization of the rotating propeller for self–propulsion or ship maneuvering studies are limited in the open literature [19,20,21,22,23]. Moreover, even if at disposal, the detailed description of the propeller behavior is not provided and the results on hub and blade loads are not validated with experiments. In turn, the availability of experimental data or validated, high accurate data can be useful to improve low order propeller models usually coupled with CFD solvers for ship motion predictions, this being an established approach to speed-up the simulations.
A series of free running model tests were carried out at CNR–INSEAN to investigate systematically these issues. In particular, twin screw configuration was the subject of the investigation, because the inflow conditions for the propellers cause their off-design operation more critical with respect to single screw ships. In fact, in twin screw propulsive configurations, the propellers are located at larger distance from wall of the hull and, during maneuvering, the “shadow” effect of hull is weaker; for this reason, the external propeller experiences an inflow inclined by an equivalent angle given by the kinematic of the model (during tight maneuver this angle might be of the order of 30). On the contrary, the internal propeller has the higher probability to be impinged by coherent structures detached from the fore portion of the hull or appendages that are convected toward the leeward side. Moreover, the quantification of the asymmetric behavior of the propellers is of utmost importance in case of cross-connect configurations, because the reduction gear can experience very large fatigue loads. In particular, in [24] the analysis was entirely focused to monitor the overloading and unbalancing phenomena of propeller thrust and torque during maneuvering conditions for a modern twin screw ship. The same experimental set-up and the model was also considered for a campaign dedicated to the quantification of the in-plane loads developed by the propeller during steady and unsteady maneuvers [25,26]; for this purpose, a novel 2–component transducer was developed. The relation between the motion and propeller loads were preliminary assessed by simple momentum theory. The analysis was then broadened by CFD computation and the use of simplified propeller modeling in order to clarify the effects of the wake evolution on propeller loads [27,28,29]. In the present work, a synthesis of the experimental and numerical activity of these works is proposed to recap the key aspects that drive the propeller performance in off-design functioning. In particular, the asymmetric behavior of the propellers of the twin screw configuration is related to the wake morphology obtained by CFD computations analyzed by blade element propeller solver. Since the problem of damages of the bearing loads is a critical aspect for the reduction of maintenance costs of a vessel, the problem to full scale extrapolation of model test data was tackled. For this purpose, the blade element theory was modified in order to analyze the effects of Reynolds number and cavitation number on blade loads, with particular emphasis on the in-plane forces and moments. Finally, the future research activities inspired by the present work on the off–design propeller performance are briefly introduced.
2. Test Case
In this section, the experimental and numerical set-up are described.
2.1. Experimental Set-Up
The experimental activities were carried out at the outdoor maneuvering basin of the CNR–INSEAN located at the Nemi lake. This location is ideal due to frequent long-term dead-calm water conditions and environmentally protected area. The water surface is large enough to allow the execution on any kind of manoeuvring test regardless the model size and speed.
The ship selected for present analysis is a fast twin screw/twin rudder ship, similar to those analyzed in previous studies [24]. The model was equipped with bilge keels, propeller shafts with brackets, a centerline skeg and two all–movable rudders; the propellers are inward rotating from the top. In Table 1, principal geometric characteristics of the model and the propeller are reported and an overview of the hull geometry and stern appendages configuration is shown in Figure 1a,b.
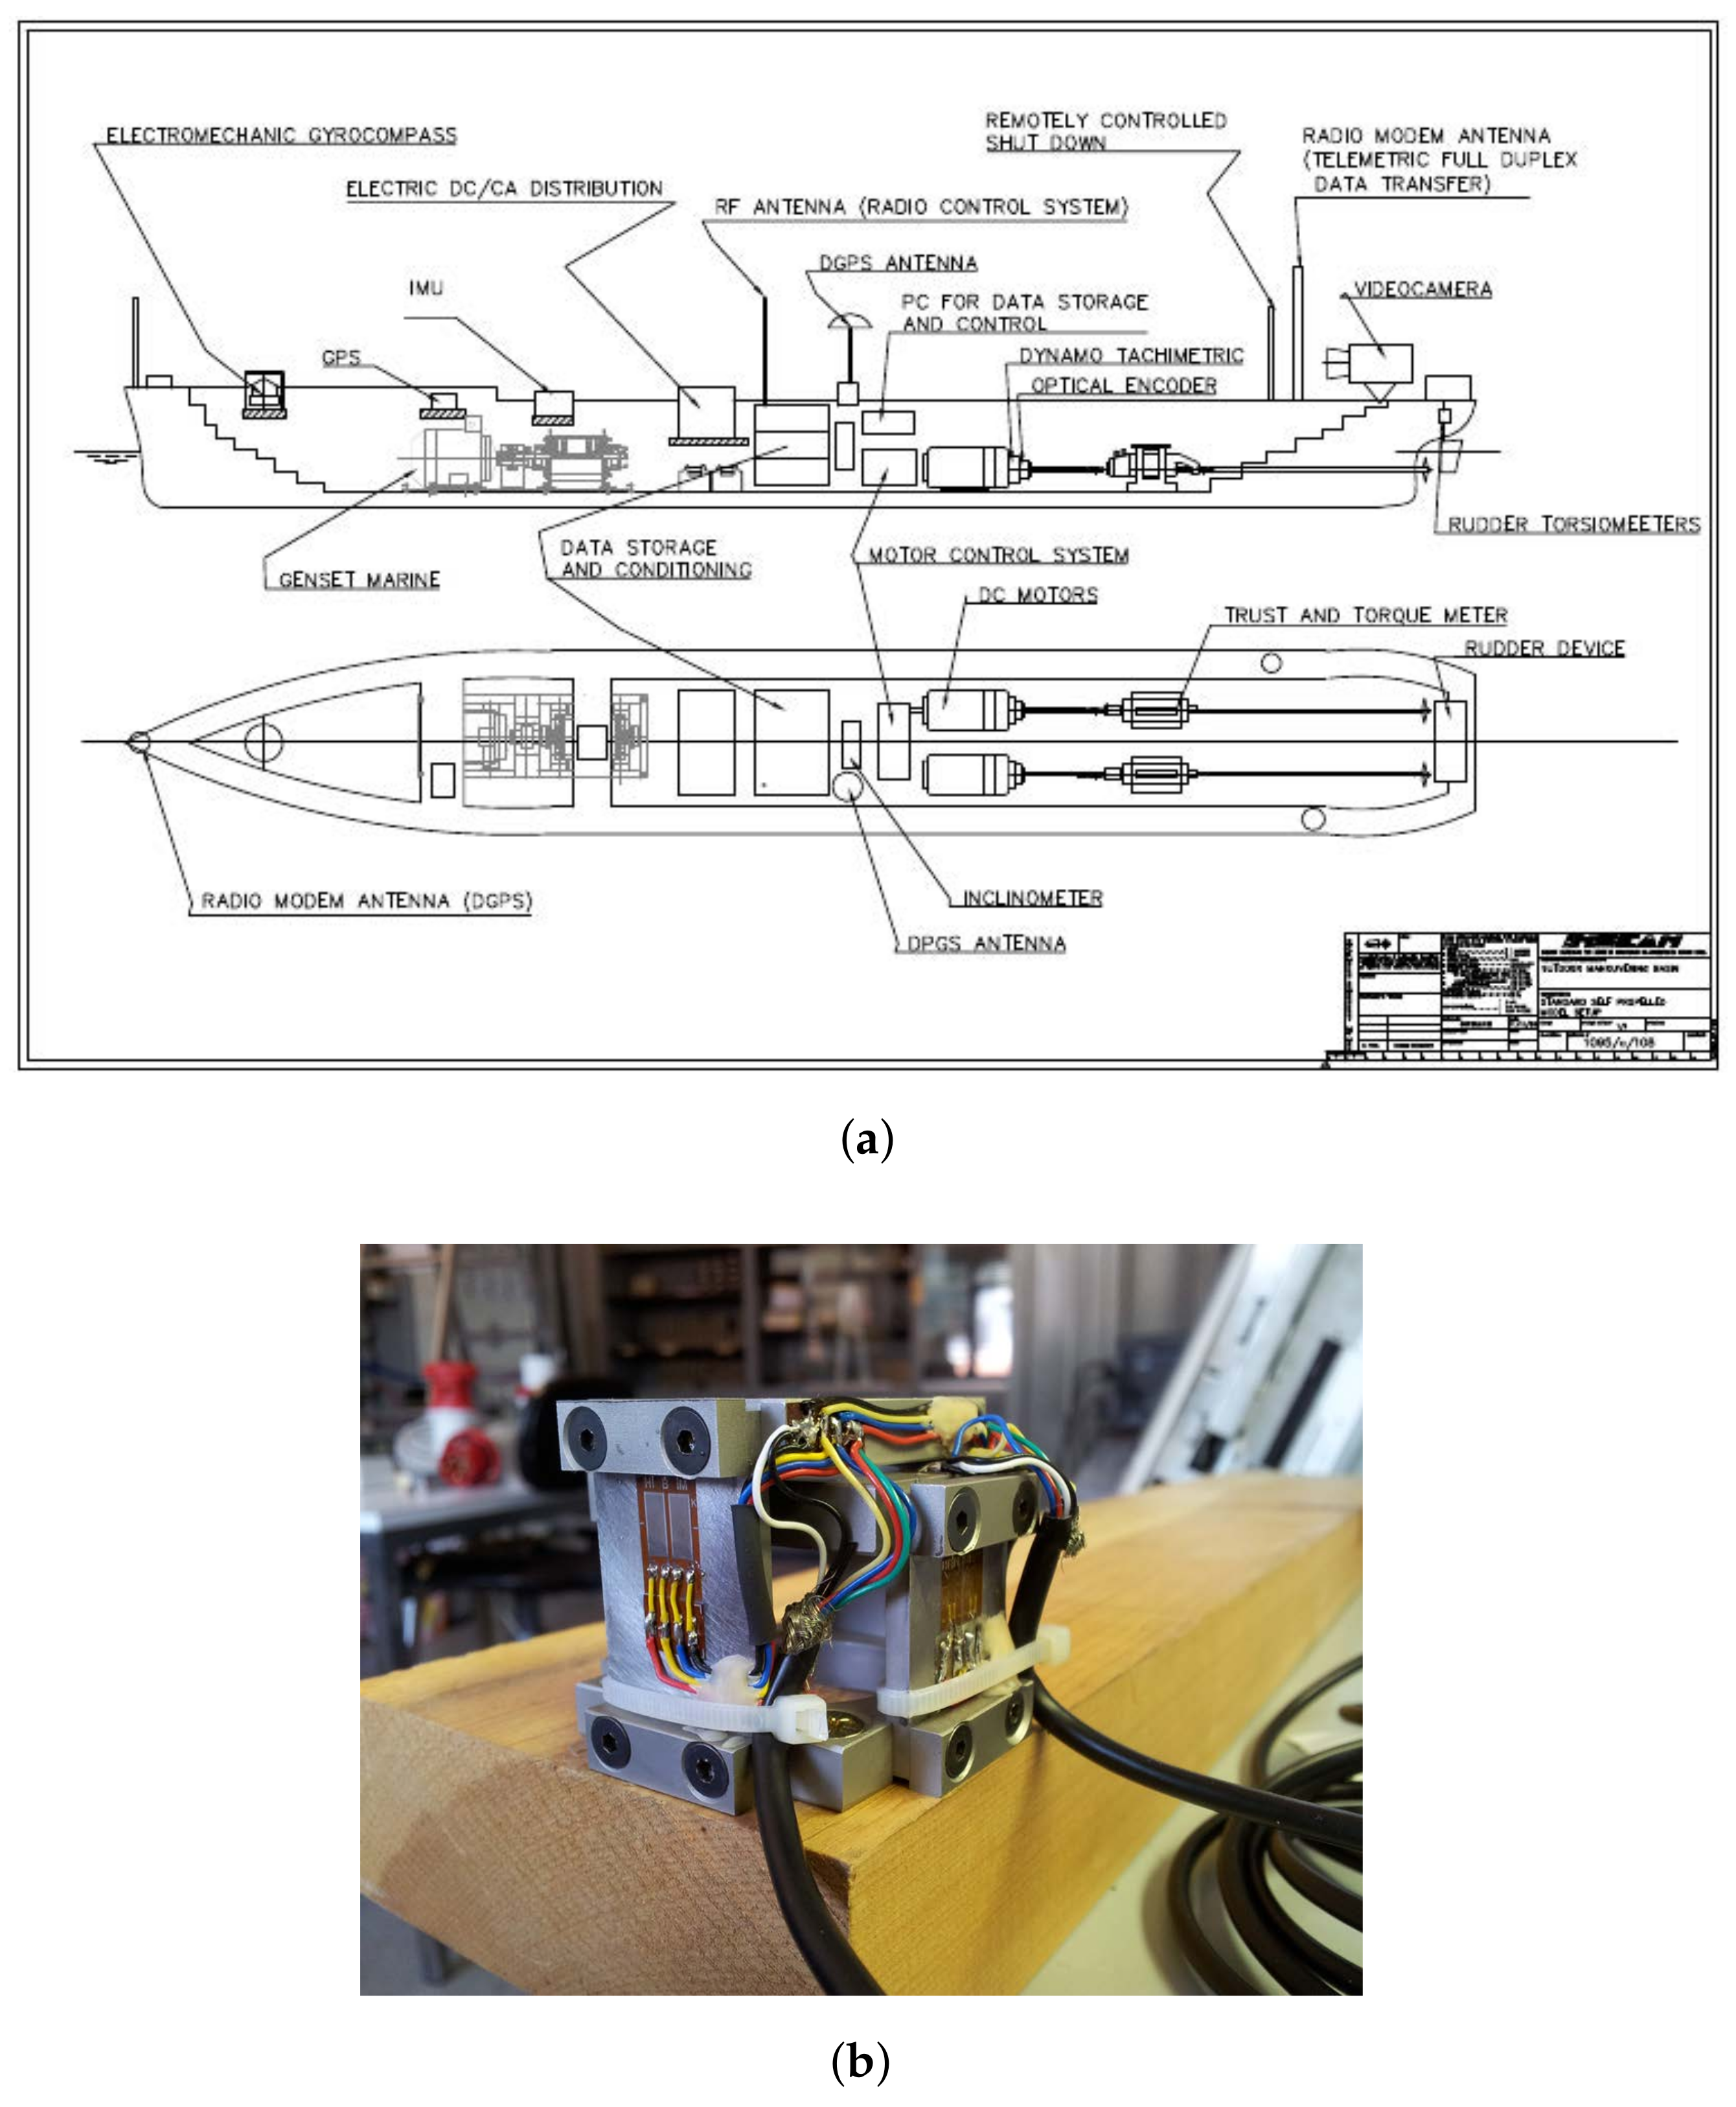
The layout of a typical set-up and the measurements devices employed in free manevering model tests is sketched in Figure 2a. The model is equipped with IMU for the reconstruction of the motion, DGPS (differential GPS) and real time data transmission devices. Each propeller shaft is driven by a dedicated electric brush–less motor and is equipped with a load cell for the measurement of thrust and torque. The overall energy demand of the on–board instruments was provided by a diesel electric generator.
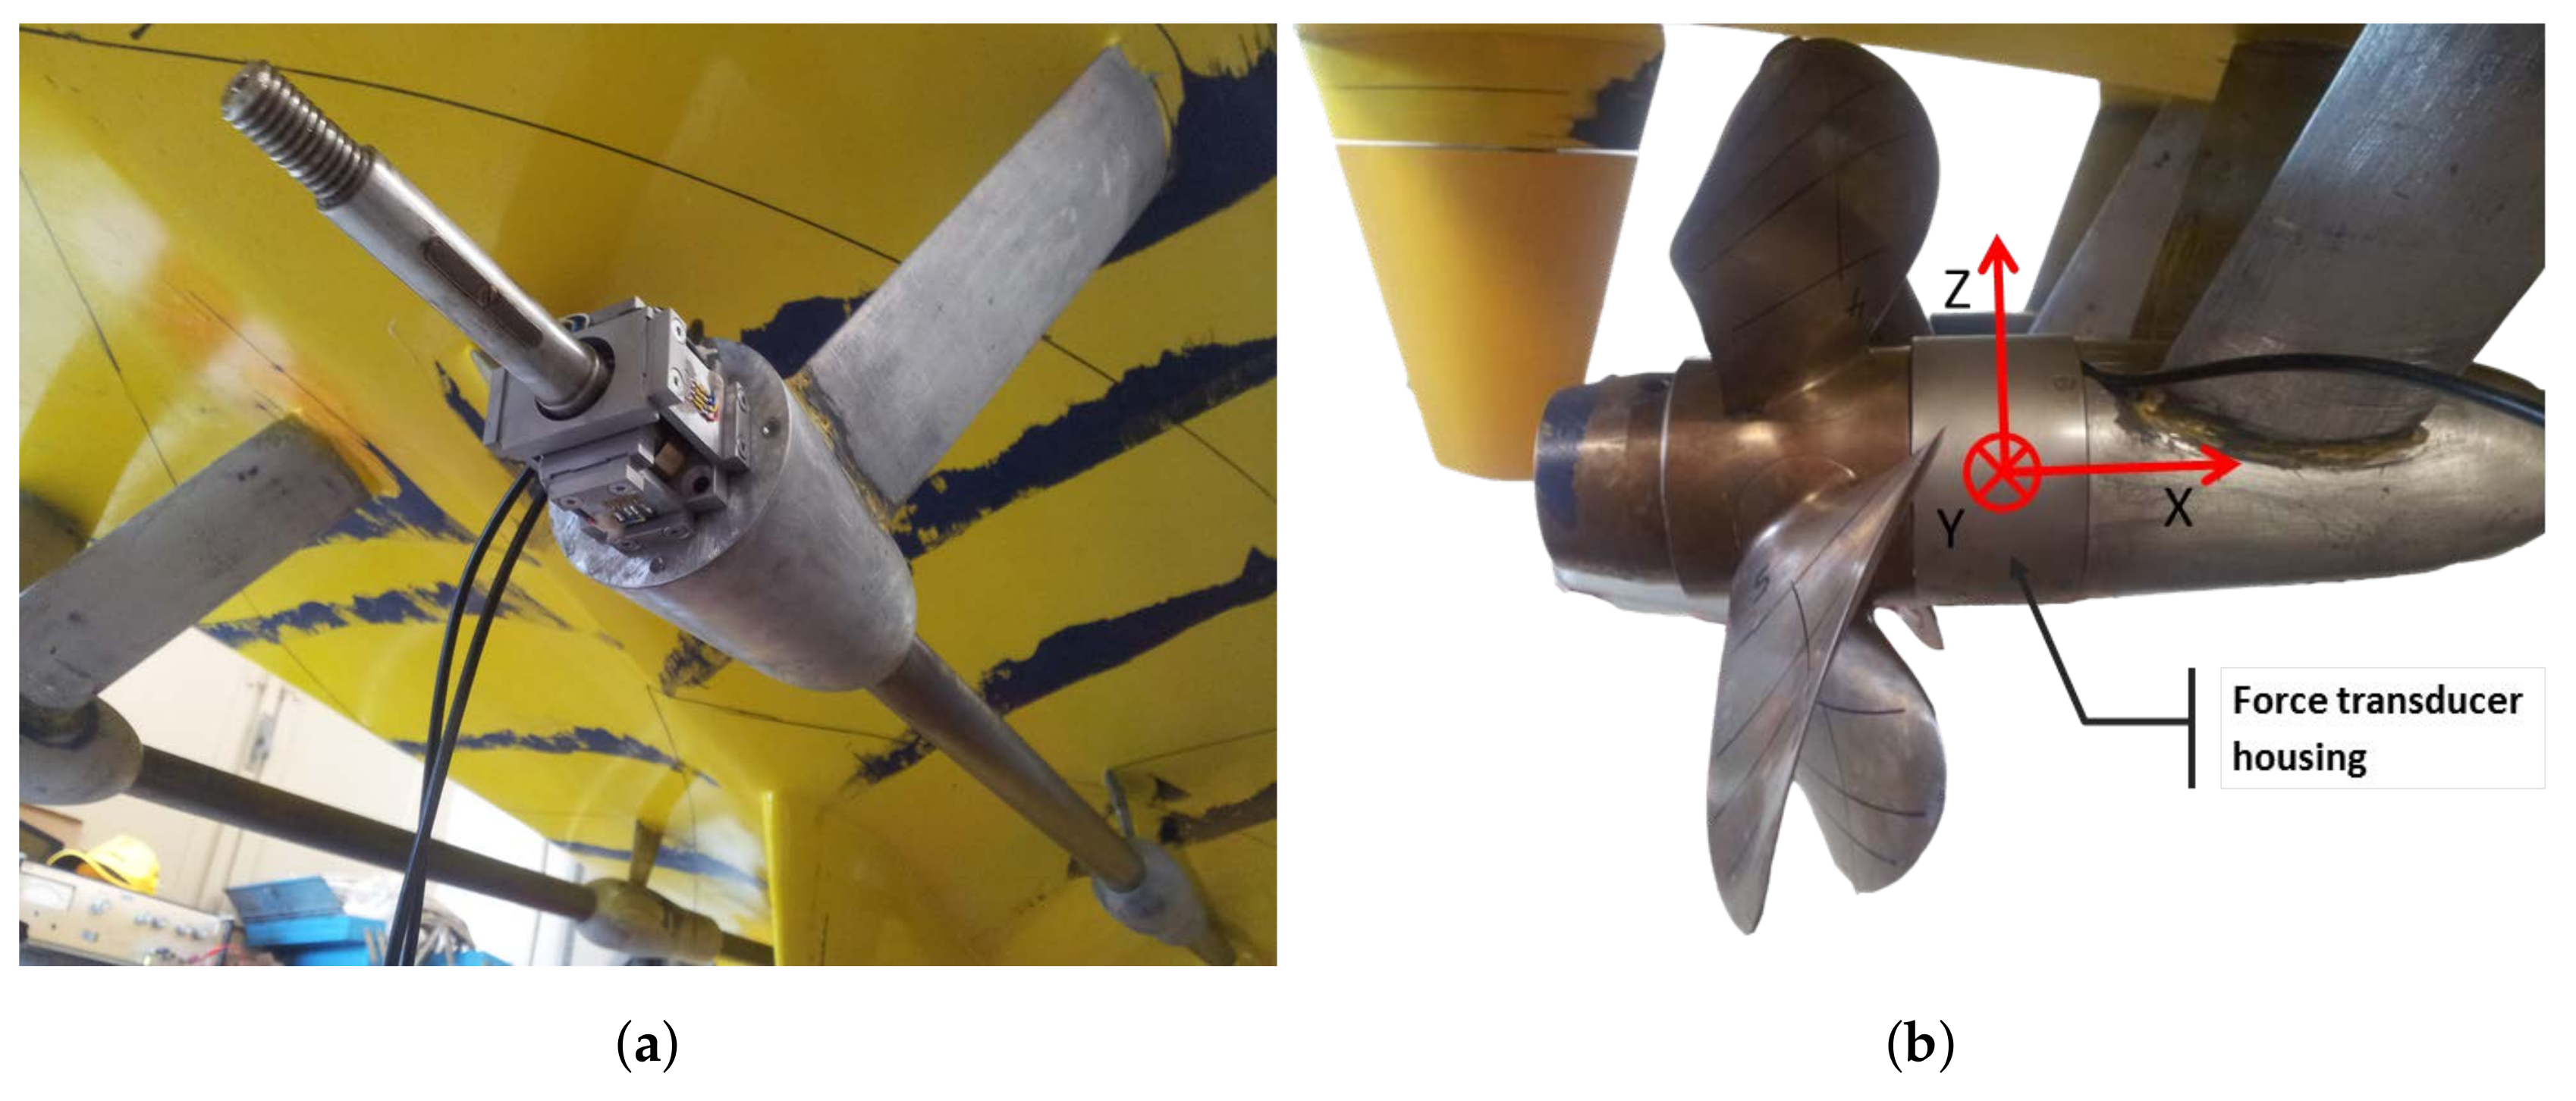
The bearing radial force components were measured on the starboard shaft by an in-house developed, pass-through hole 2–component transducer, positioned between the propeller and the tail of the bossing of the astern V-brackets (see Figure 2b). The installation of the transducer at the tail shaft and the shaftline configuration are visualized in Figure 3a. The transducer was made waterproof, because the layout of the propulsive shaft and the limited useful space inside the shaft bossing or stern tube, constrain the transducer to be submerged in water (see Figure 3b).
The transducer is composed by two systems of opposite cantilever beams that are the sensing element of the device. Each couples of beams are connected each other by a pierced rigid beam through which the propeller shaft passes. With this configuration the deflection of the shaft caused by the forces generated by the propulsor is transmitted to the sensing beams that are equipped with strain gauge sensors. The rigid beams are properly designed in order to obtain a decoupled measure of the orthogonal components of the radial force. This configuration allows to directly obtain the radial load with respect to a fixed frame and its set-up does not require any temporal synchronization of the measure with the angular position of the shaft, as it is needed in case of transducer rotating with the shaft [10].
In Table 2 the test matrix of the experimental activity is listed; various kind of maneuvers were carried out in order to investigate as broader as possible realistic operative scenario. In addition to self–propulsion tests, the maneuvers considered both quasi–steady (turning circles) and unsteady motions (zig–zag trajectories) at different rudder angles. All tests were carried out at constant propeller rate of revolution and in a calm environment, in order to avoid external disturbances. The present work does not consider the unsteady cases, the interested reader is referred to [26].
2.2. Numerical Set-Up
The numerical computations were performed on the geometry with rudder and propeller removed (see Figure 1b), since the task was the evaluation of the nominal wake. In particular, the computations focused both on quasi steady and transient periods of a turning maneuver; the core of the present review is mainly focused on the steady turning maneuvers, because the phenomenology is driven by similar propeller wake interactions also during unsteady motions [28].
The domain has been discretized by 186 body–fitted patched and overlapped blocks, for a total of about 10M cells. Grid distribution is such that the thickness of the first cell on the wall is always below one in wall unit, and at least 30 cells are within the boundary layer thickness (, with , being the thickness of the cell adjacent to the wall). A four level multi–grid technique is exploited in order to speed–up convergence, each level being obtained from the next finer one by removing every other point along each spatial direction. Details of the cells distribution are listed in Table 3.
Mesh topology and particular of the overlapping grids in the stern region of the model is sketched in Figure 4a,b, respectively.
The numerical simulations corresponded to straight ahead and steady turning maneuvers with rudder deflection angles and at the lowest velocity considered in the experiments, i.e., , for which ; without loss of generality of the phenomenological analysis, the numerical simulations were carried out at the lowest speed. This had the advantage to reduce the computational burden of the simulations, neglecting the modeling of the free surface. In fact, the analysis of the experimental data highlighted that the variation of the in-plane loads was not altered with the speed; moreover, at this speed the wave pattern of the model was weak and the transom stern was completely wet and, therefore, ventilation phenomena that could have affected the propeller loads were avoided.
The maneuvering simulations were carried out prescribing the angular velocity, drift angle and turning radius monitored during the experiments. These parameters are listed in Table 4 for each rudder angle considered.
3. Models and Methodologies
The CFD code solves the Navier-Stokes Equations for unsteady high Reynolds number (turbulent) free surface–flows around complex geometries. The interested reader is referred to [17,19,30,31,32,33,34] for detailed description of the features of the solver.
The basic concepts of the propeller model are briefly described, because are useful to follow the discussion of the results and the correlation of the propeller loads with the wake features. The propeller solver is based on the blade element method. In the present work, the basic solver described in [27,35] was modified to account for scale effects; in this paragraph the basic algorithm is briefly reviewed (the interested reader can refer to [27,35]) and the modified one is discussed in Section 6.
The blade element method synthesizes the blade performance by the contribution provided by its cross sections, each one formally treated independent from the others by the airfoil representation. Formally, the propeller loads are obtained by summation of the contribution provided by each blade section once the “polar” characteristics, i.e., the coefficients of lift () and drag (), and the inflow (velocity magnitude and incidence angle ) are known. Referring to a representative section of the propeller blade (see Figure 5a), the inflow and the elemental forces are described in Figure 5b. According to the representation, we neglect the radial components. Without loss of generality, the representation neglects the effects of the self–induced velocity. In particular:
where is the geometric pitch of the blade and is the inflow angle of the section, given by the velocity system in the plane of the section ( is the tangential velocity given by the combination of the components of the wake in the plane of the propeller in the azimuthal direction, see Figure 5a). In addition, therefore, the loads are given by:
where is the lift and drag coefficients. Once lift and drag forces generated by the foil are determined, the elemental contribution to thrust and tangential force can be derived:
The step from a pure 2D representation to a three dimensional one that tries to model the key physic of the blade (self–induced velocity due to trailing vortices and blade–to–blade interaction) can be achieved by solving the non linear Prandtl–Betz relation for every section:
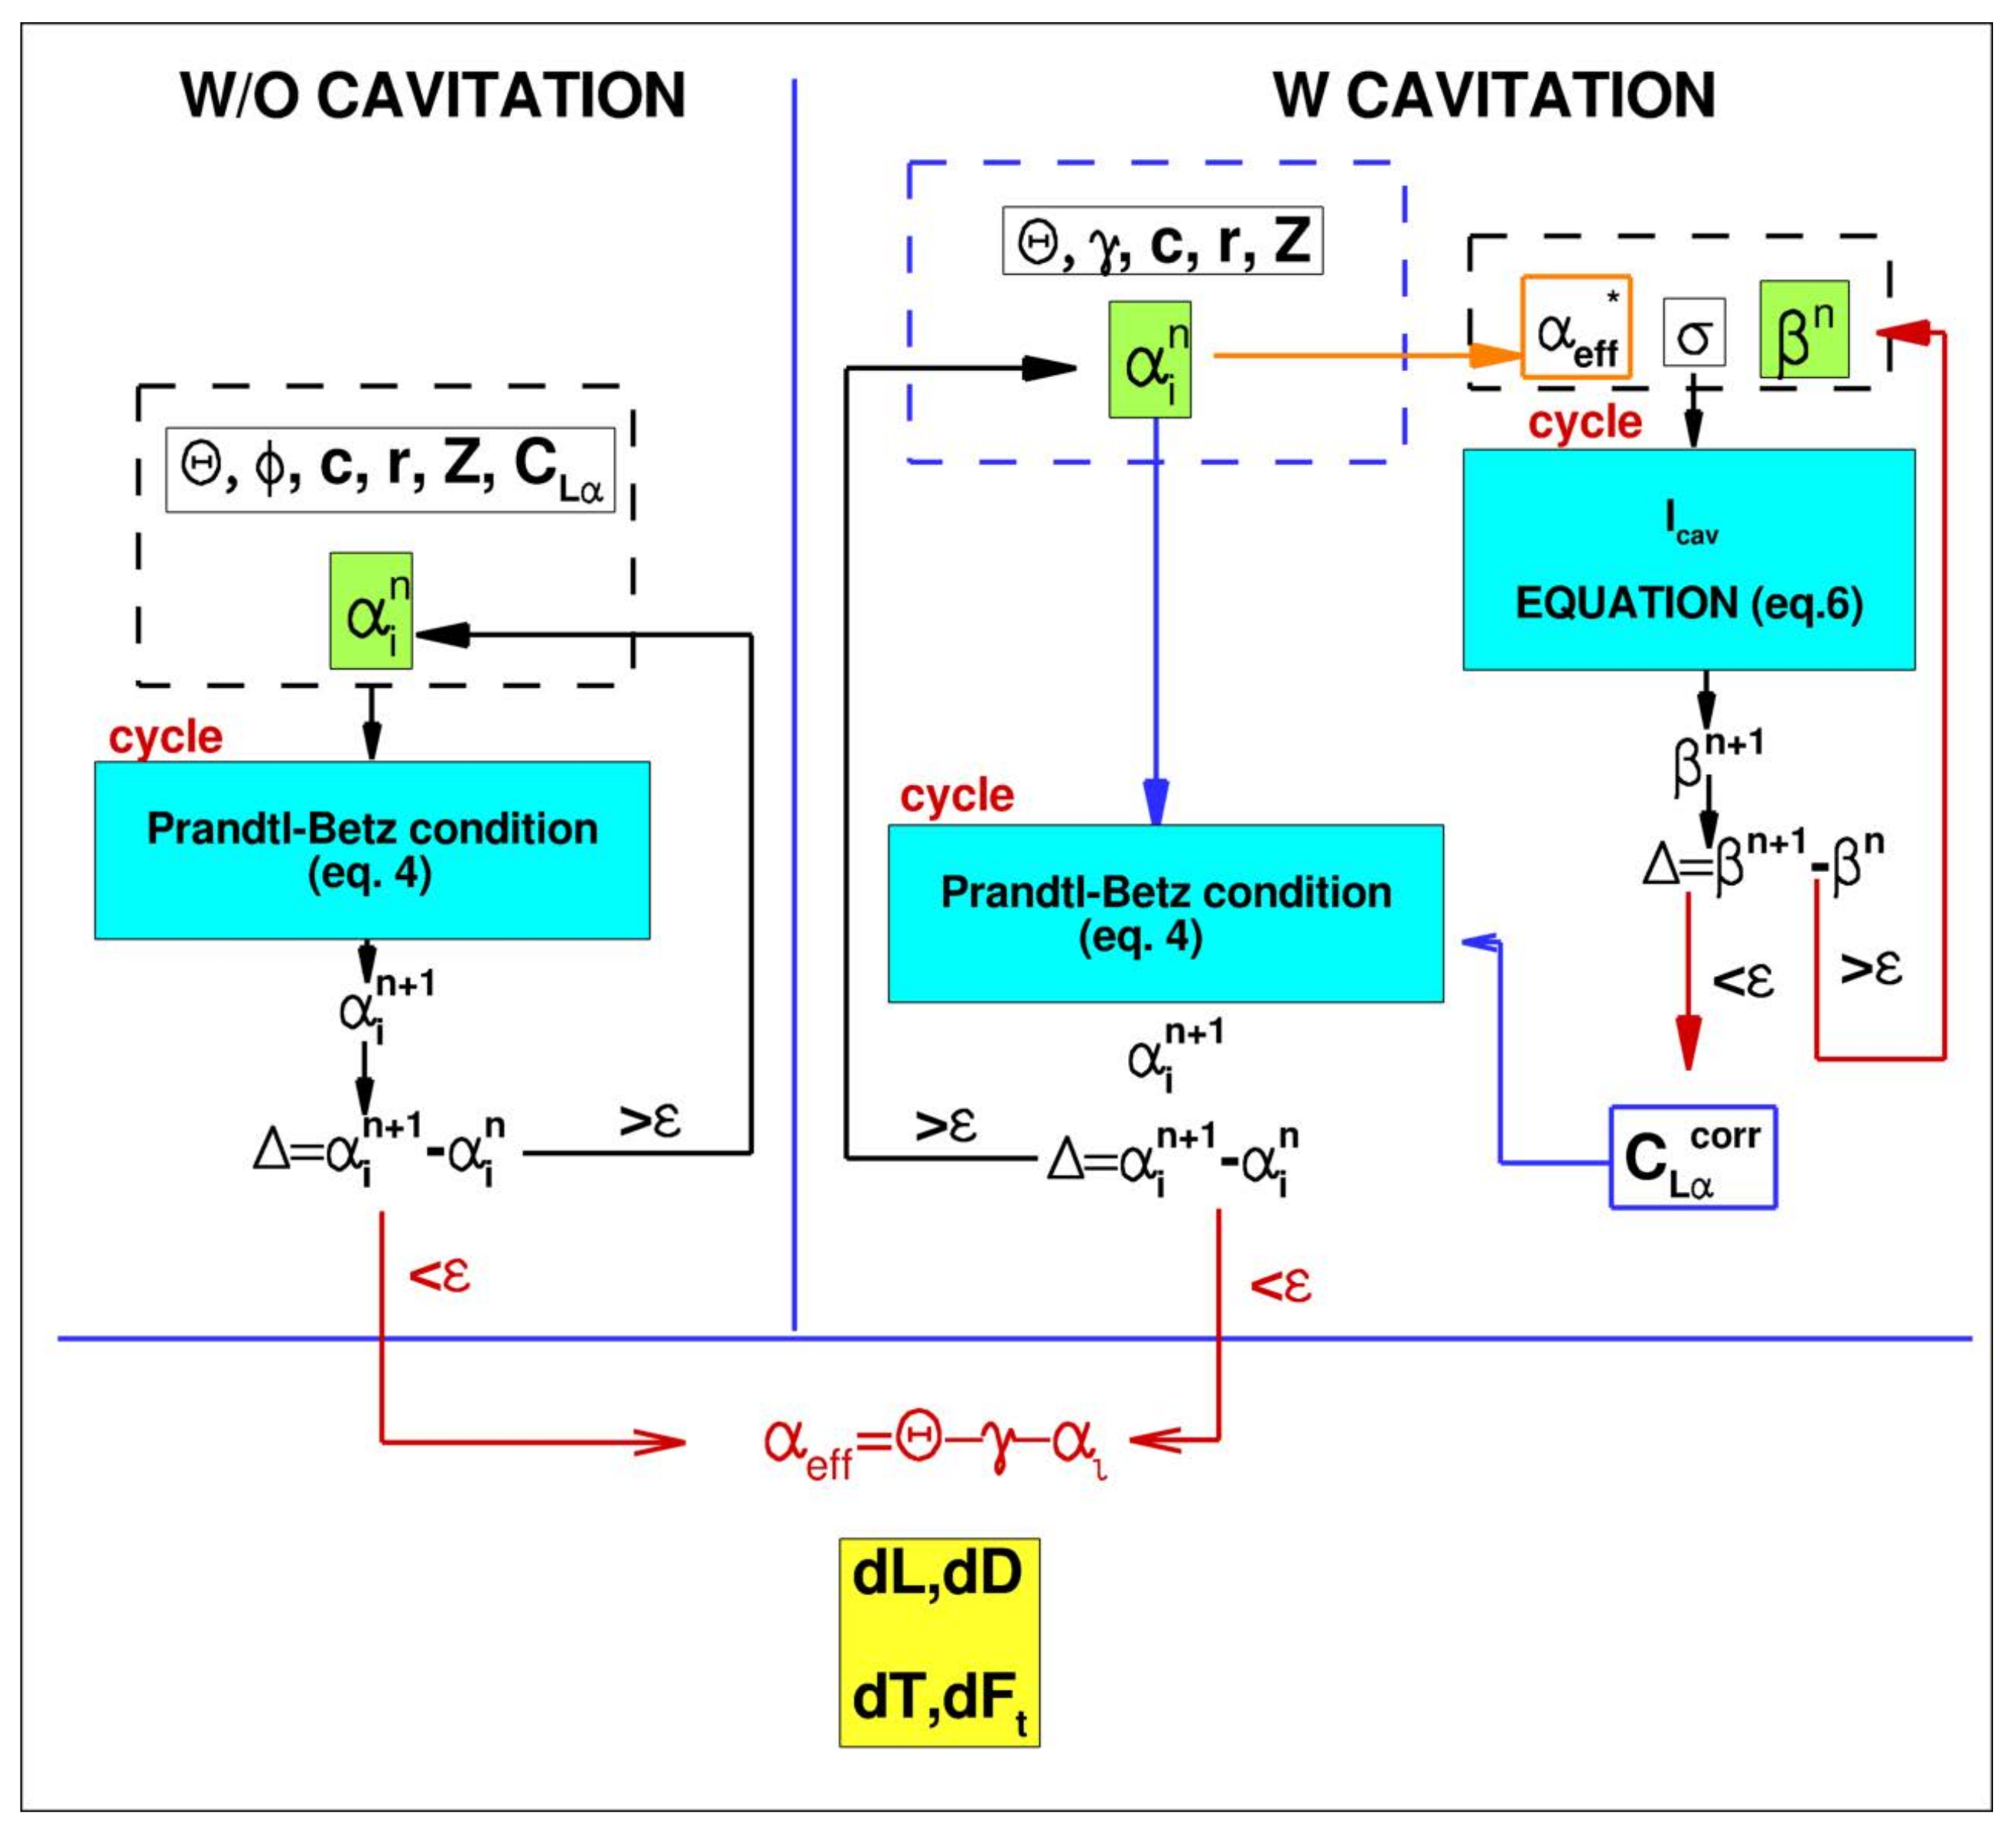
where Z is the number of blades, r and c are the spanwinse position and chord of the foil, respectively, is the picth angle of the section and is inflow angle of the nominal flow (see Figure 5b); the equation is non-linear and it is solved iteratively in terms of the self induction angle . The flow chart reported on the left half of Figure 6, explains the pseudo-code of the non-cavitating propeller solver: given the nominal incidence and the geometric details of the section, the Prandtl-Betz equation is solved to determine the self-induced velocity field. The strict coupling between the lift (circulation) generated by the section and the induced velocity field give rise to the non linear nature of the Prandtl-Betz equation.
It has to be stressed that the model is inherently quasi steady, because the Prandtl–Betz condition implicitly assumes the balance of the load developed by the blade strip and the vorticity (constant) carried by trailing vortex. However, as long as the inflow is time–varying, this equilibrium condition is not suddenly met and its lag depends on the time rate of circulation detached at the trailing edge of the airfoil, because it is responsible of an additional perturbation to the blade section [36].
4. Results
In this section, the experimental results are synthesized with the complementary results and wake analysis by the BEMT solver. The discussion is carried out qualitatively to focus on the key mechanisms that govern the off-design performance of the propeller and a comparison of the numerical and experimental work is not reported. BEMT is reliable to capture the trends and the order of magnitude of the loads, although absolute errors were rather high. These discrepancies were ascribed, aside from the approximation of the propeller solver, to the off-line analysis of the nominal wake. By this approach, the modification of the wake due to the self–induction effect of the propeller is obviously neglected and, consequently, the prediction of the loads might be affected. In particular, on the internal side, this interaction can modify the strength and distribution of the swirling flow and, on the external shaft, the flow around the appendages and the shaft. For this reasons, weakly-coupled simulations in transverse plane should be carried out to achieve a more accurate prediction of these loads; moreover, the real attitude in the transverse plane (roll angle) should be considered in the simulation, because the in-plane loads are sensitive to the wake and load distribution over the propeller disk as described in the following analysis. The interested reader is referred to [27,28] for a deeper discussion on these aspects.
The velocity profiles are referred to the hub reference system, the propeller disk is viewed from the stern, and the circumferential coordinate is positive signed when oriented in the same sense of propeller rotation (that is, increases clockwise and anticlockwise for the port and starboard propellers, respectively). In the discussion, the propeller disk is divided into four sectors, the first one being defined by , and so on. Finally, consistently with [25,26], results for propeller loads are summarized in unified graphs, where positive and negative rudder angles correspond respectively to internal and external propellers.
In the following, all the quantities are made non dimensional using as reference quantities the length between perpendiculars (), the approach speed at model scale (), and the density of water ( kg/m). The propeller loads are expressed in terms of coefficients defined, as usual, by dividing the thrust and torque by the factors and respectively, where D is the propeller diameter and N is the propeller rate of revolution (RPS). Without loss of generality, kinematic values, forces and moments are always presented in terms of ratio with respect to values in the approach phase (identified with the subscript “0”).
Experimental Results
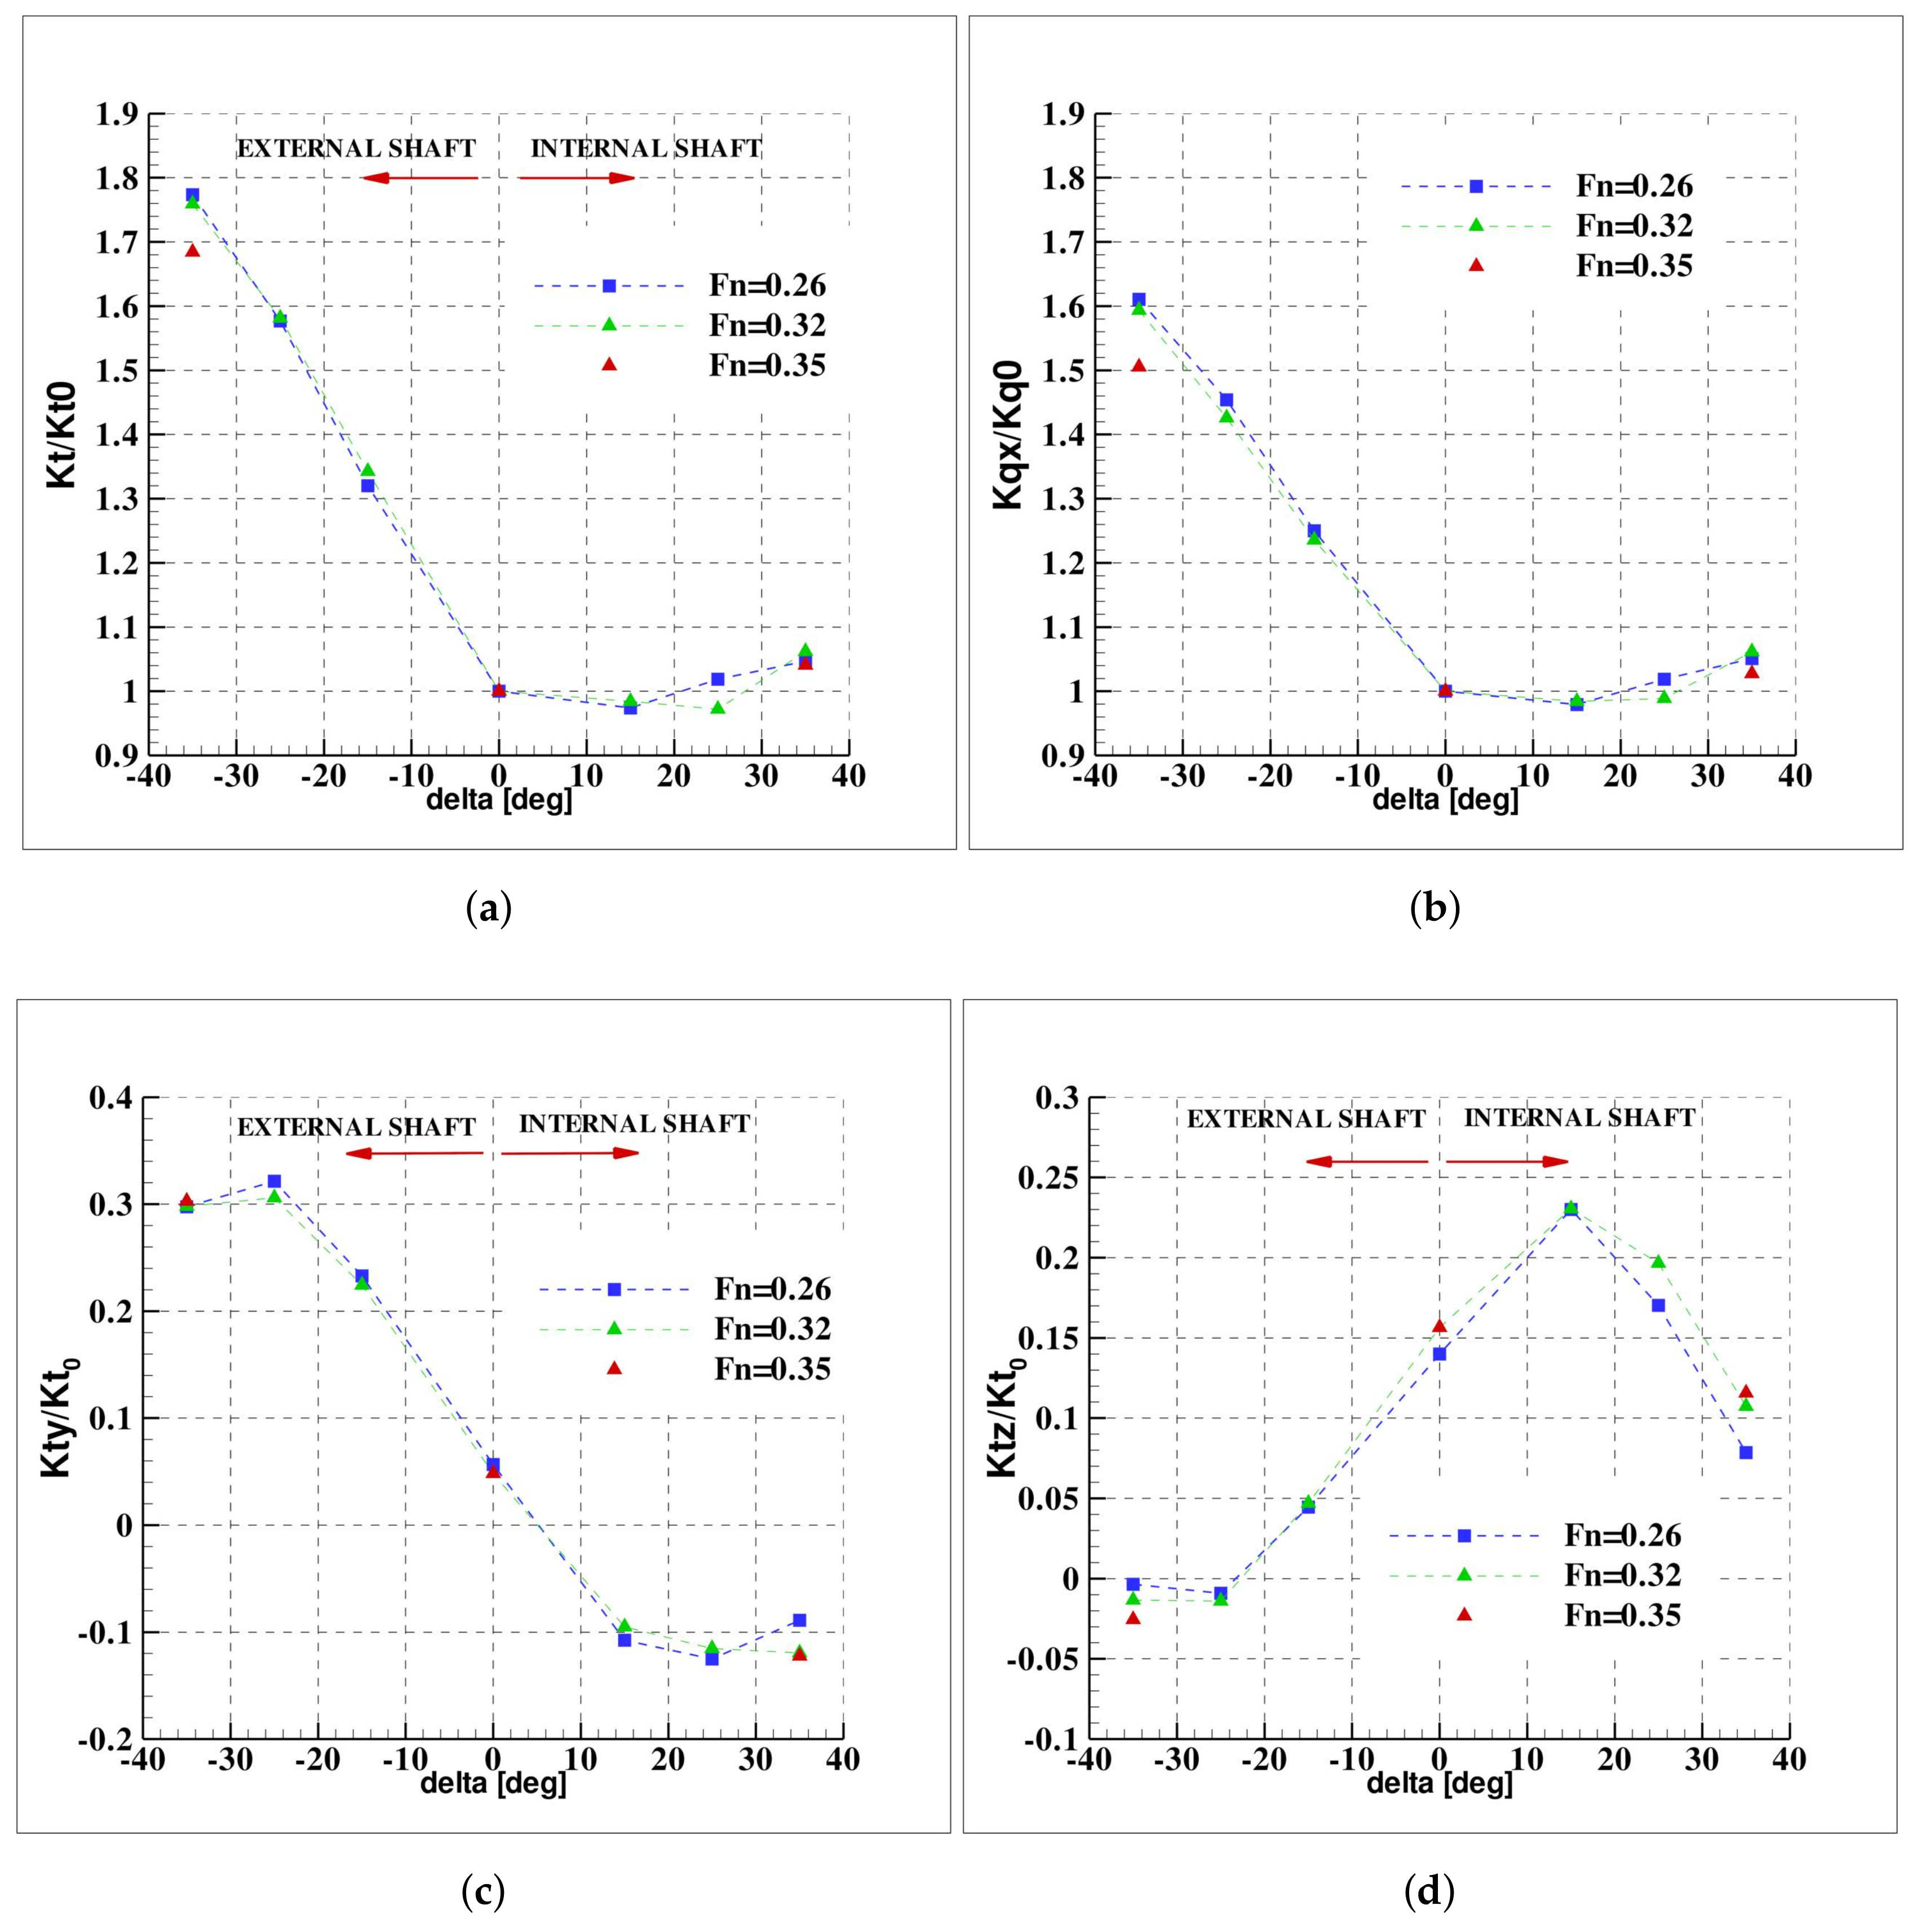
The experimental results are reported in Figure 7 in terms of thrust, torque and radial force components ratio for the three different . The results refer to the starboard propeller.
In general, a marked asymmetry of the loads generated by the external and internal propeller is experienced. Moreover, the effect of speed is negligible: this fact is indicative of the limited effect of the on the maneuvering response, as was also reported in terms of kinematic response and macroscopic parameter of the maneuver in [25]. In other words, the propeller inflow (and therefore, the propeller performance) would be morphologically similar for maneuvers carried out at the same rudder angle.
The thrust and torque show a similar behavior; on the external propeller () a remarkable increase of almost 80% and 60% of the value in the approach phase, can be evidenced for thrust and torque, respectively. The increase is almost linear with . On the internal side, the overloading is considerably weaker (less than 10% for both thrust and torque) and the trend non-linear, the slope being negative for and then positive.
The side force, Figure 7c, is always oriented to stabilize the vessel, i.e., it is oriented toward the centre of curvature of the trajectory. During straight ahead motion, this force is oriented toward the plane of simmetry of the model. On the internal side, the force shows a non-linear trend, it slightly increases up to and then diminishes in case of the tighter maneuver. The average value over the range of rudder angles corresponds to about about 15% of . On the external side, this force increases almost linearly up to (where it reaches a value doubled with respect to the internal shaft) and at slightly diminishes. The external propeller develops a side force that is more than doubled with respect to internal propeller.
The vertical component, reported in Figure 7d, resembles the same character of . At the force is upwards oriented due to the inclination of the shafts and the mean direction of the flow in the stern region; on the internal side, the trend is markedly non linear, experiencing first a maximum at and thereby a linear decrease til (50% lower than the value observed during the approach phase). On the external shaft, this component gradually weakens and achieves a negligible value with respect to the side force at the maximum rudder angle. In general, it is interesting to observe that, although the absolute magnitude of the radial force (given by the combination of and ) is similar for the internal and external shaft, it is developed at completely different maneuvering conditions that lead to completely different inflow conditions to the propeller, as described in the next section.
5. Discussion
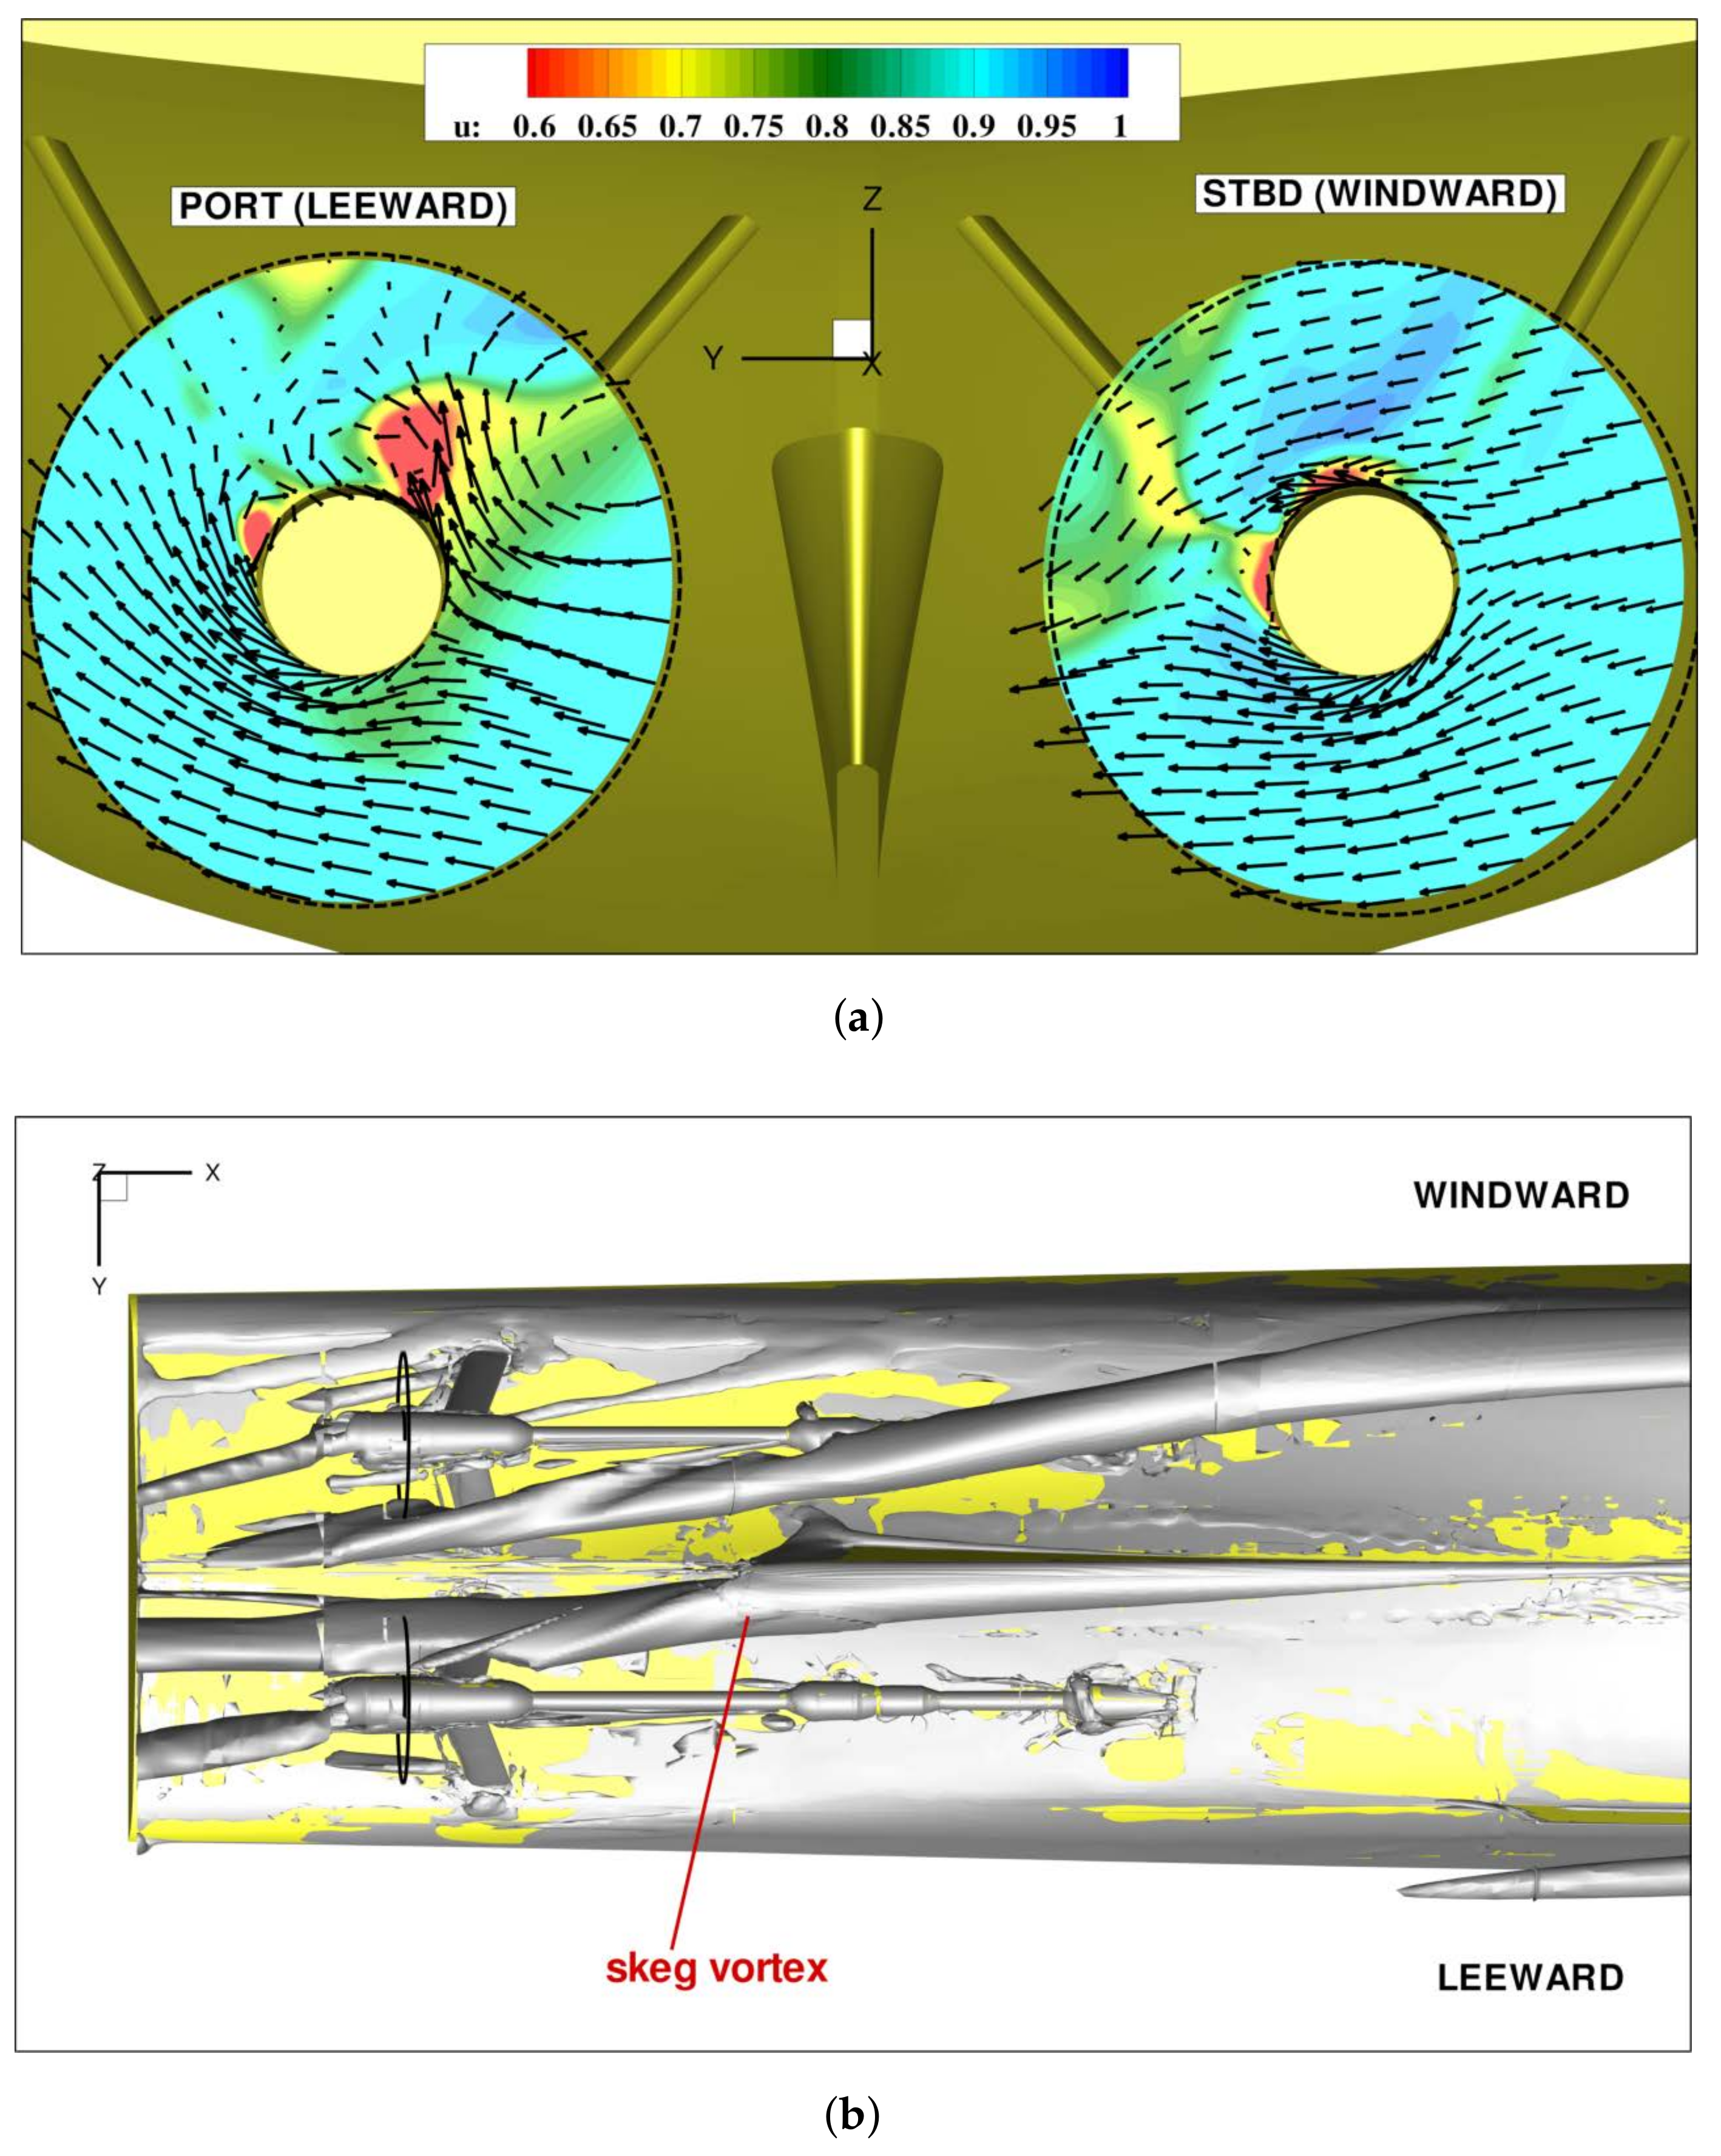
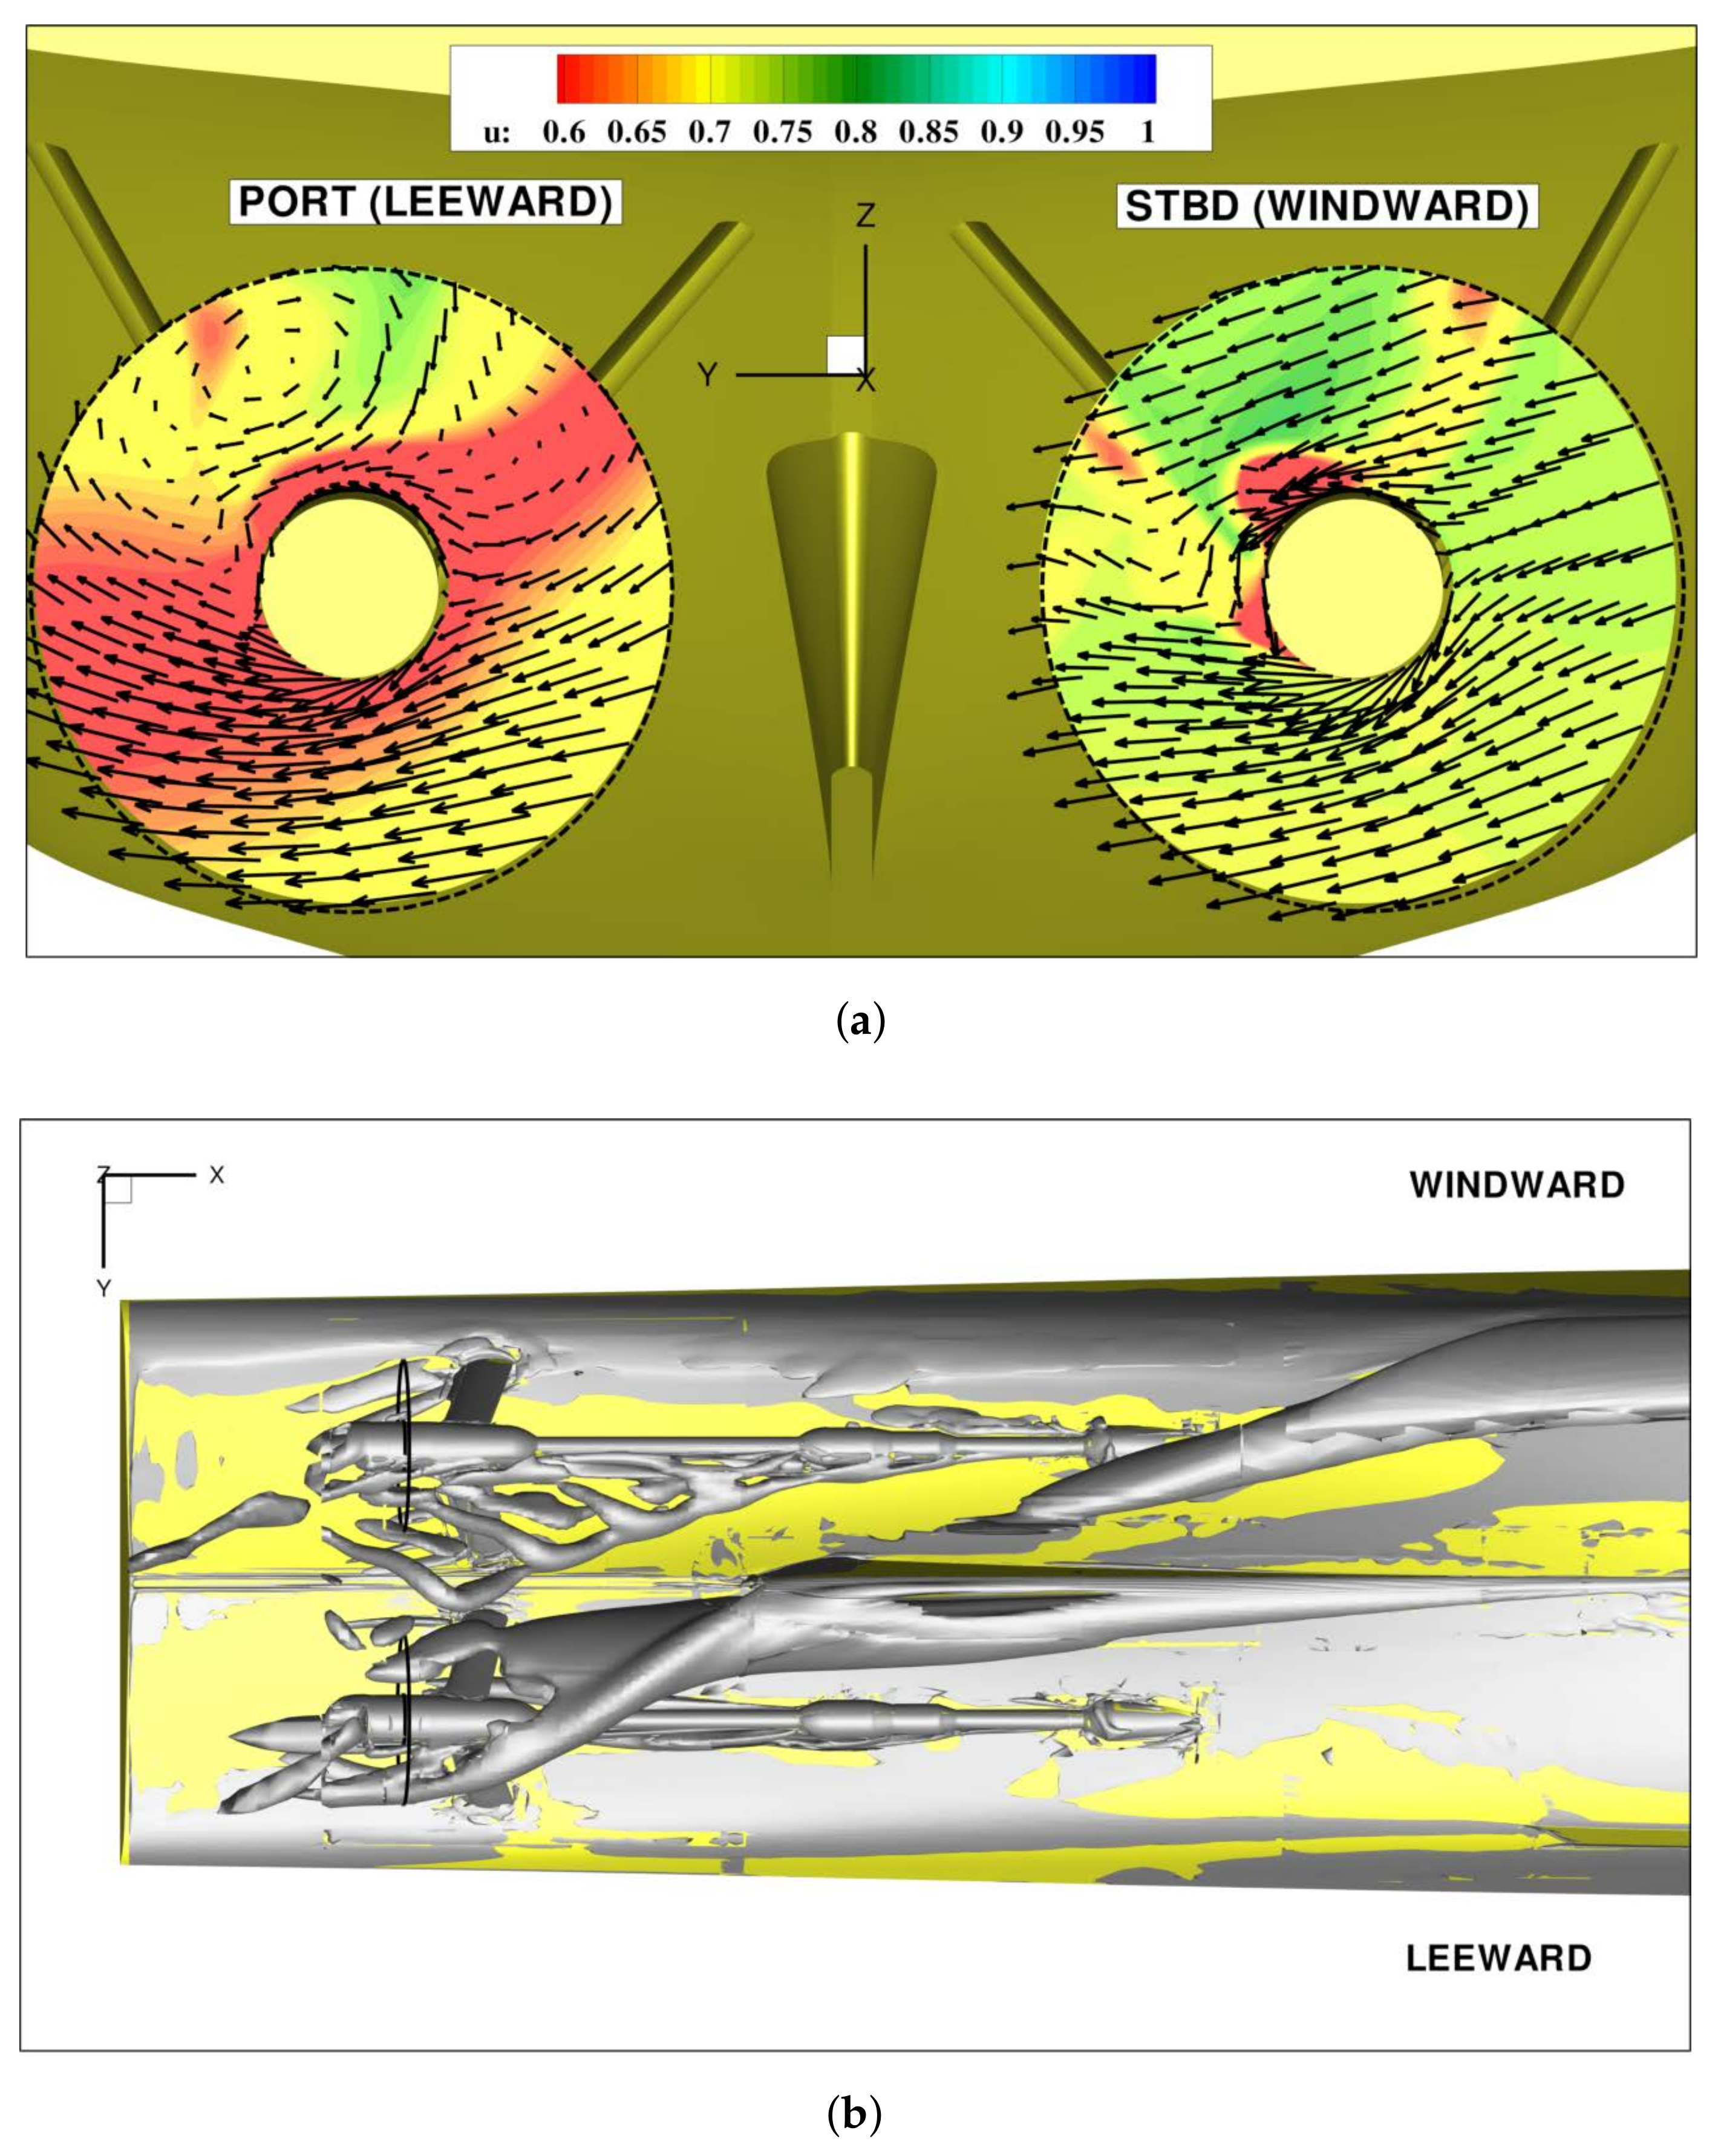
The different behavior of the propeller loads during the maneuvers, synthesized by a marked asymmetry between the internal and external propeller and a linear variation of the loads on the external side by contrast to a non-linear trend on the internal side, has to be ascribed to the different evolution of the inflow to the propellers. The nominal wake experienced by the propellers in straight ahead motion and during maneuvering conditions at small and high turning rates ( and ) is described in terms of axial velocity contours and tangential velocity and field in Figure 8 and Figure 9a, Figure 10a. In order to relate the flow field with the system of vortices detached from the hull and appendages, Figure 9b and Figure 10b visualize the coherent structures obtained by the vortex identification method based on the –criterion [37].
In rectilinear motion (see Figure 8) the inflow to the propeller is perturbed only on the upper half of the disk, the velocity defect being associated to the wake past the brackets and the boundary layer of the hull; moreover, the tangential flow on the propeller disk (represented with vectors) is directed upwards due to the inclination of the shaft and the mean orientation of the flow along the stern cut-off of the hull [25,27].
During maneuvering conditions, the wake is gradually modified and the asymmetry between the internal and external propeller are evident also for the weaker maneuver at . In fact, on the external shaft, the flow always resembles a pure oblique flow, the axial flow being almost homogeneous and the tangential flow oriented horizontally; it can be noticed that at , the propeller is moderately affected by the disturbance of a vortex detached from the bilge keel in the 1st quadrant, whereas at the disk is weakly affected by smaller structures detached from the propeller shaft (see Figure 9b and Figure 10b). On the contrary, the inflow to the internal propeller develops in relation to the evolution and interaction of the vortical structures detached from the hull and appendages. In fact, at , the strong recirculation region in the 1st quadrant of the port propeller (see Figure 9a) is associated to the passage of the vortex detached at the skeg and deflected toward the propeller disk (see Figure 9b). At , the propeller is completely immersed in a large vortical structure formed by the combination of skeg and bilge keel vortices; this large structure interacts also with the shaft and brackets and causes the separation of smaller structures, whose trace is for example evidenced by the recirculation region in the upper half of the disk (see Figure 10a).
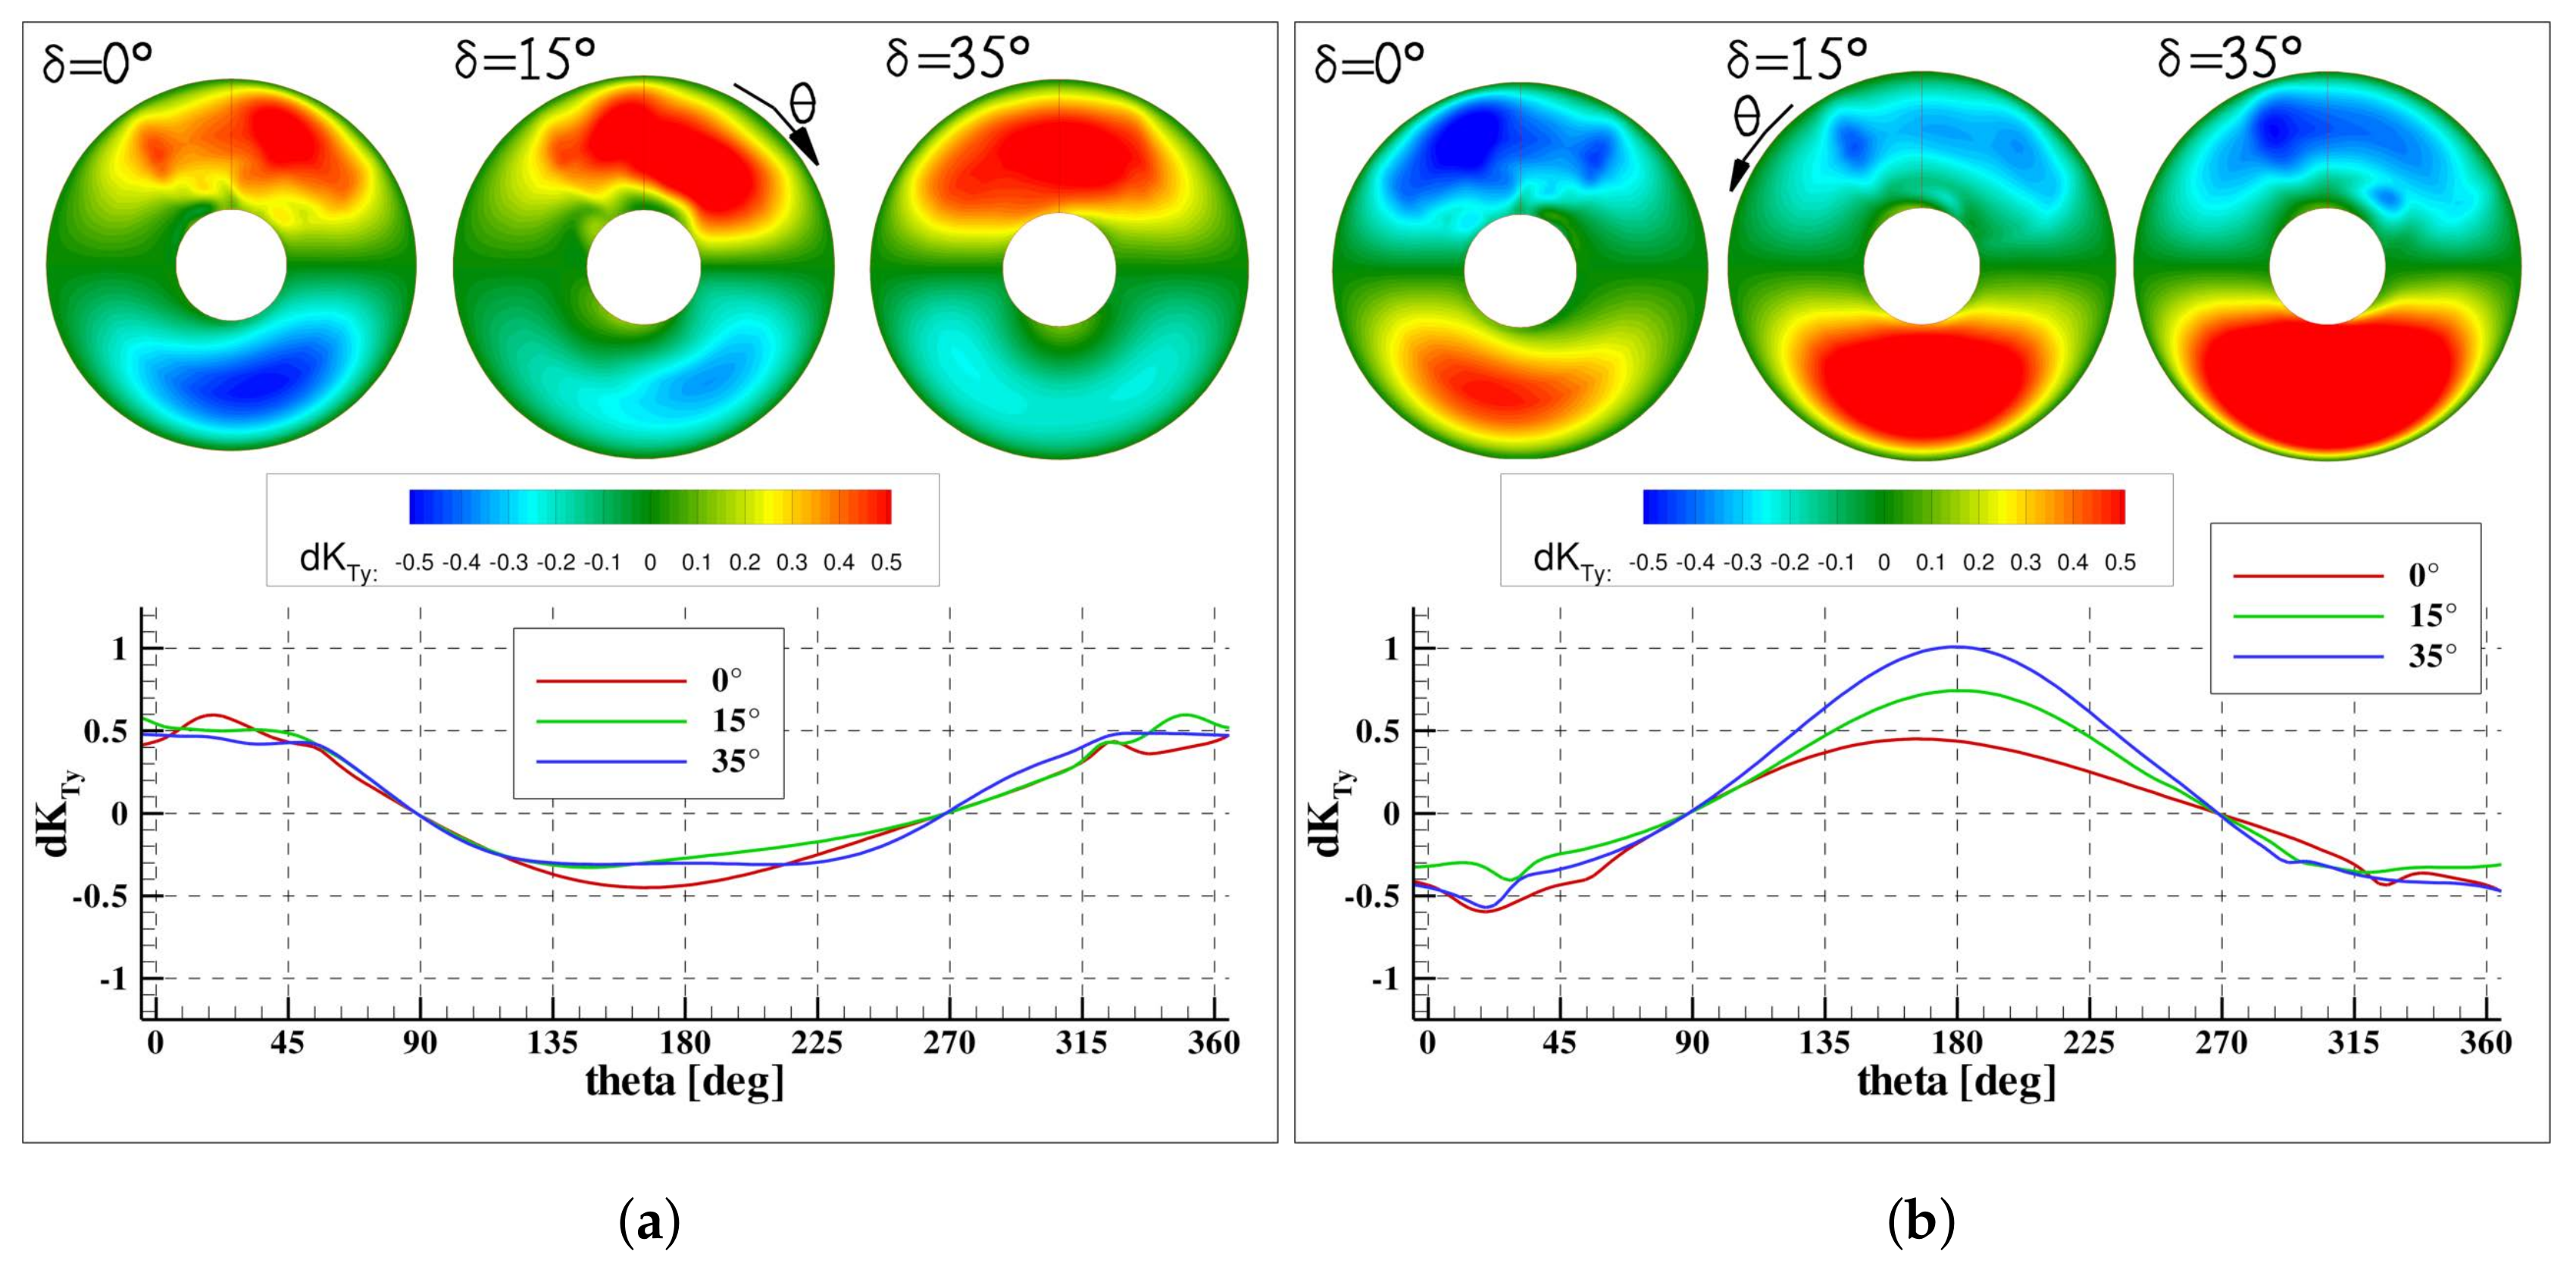
The relation of the wake with the propeller loads can be effectively established focusing on the single blade performance. Moreover, in the framework of blade element description (see Section 3), a very effective and simple method can be introduced to explain the onset of the in-plane loads and moments and to better synthesize the blade loads during the period of revolution [27]. For example, the in-plane force, i.e., the lateral force, is due to the imbalance of the force developed by the blade in the upper and lower half of the disk. Similarly, considering the thrust force, this asymmetric variation of the blade loads generates the pitching moment. Similar conclusion can be easily derived for the components relative to the vertical axis.
The thrust, side and vertical forces developed by the single blade and their distribution over the disk are reported in Figure 11, Figure 12 and Figure 13; the integral on single halves that support the simplified description of the generation of the in-plane loads are reported in Figure 14 and Figure 15.
At , the blade experiences higher local incidence angle in the 1st and 2nd quadrants (downstroke cycle), (red line in Figure 11a,b) due to the velocity defect and the upwards tangential velocity that acts to increase the local angle of incidence of the blade sections (according to a blade element representation). Consistently, the blade develops higher thrust in this sector, as clearly described by its distribution over the disk at the top half of Figure 11, causing the generation of in-plane moments (see Figure 14); considering the starboard propeller (and the hub frame of reference in Figure 5a), these consist of a positive pitching moment and a negative yaw moment. Moreover, the vertical force is dominant with respect to the side force, because the asymmetry of the load distribution is stronger between the left–right halves of the disk. This aspect is quantitatively supported by the imbalance of and in the bottom/upper and left/right halves of the disk in Figure 15a,b and by the trend of the single blade loads at the correspondent sectors (red line in Figure 12b and Figure 13b).
In maneuvering conditions, the performance of the external propeller is markedly affected by the cross flow, its behavior being similar to the functioning of a propeller in pure oblique flow. In general, the load distribution over the disk is very different with respect to the rectilinear motion and shows an imbalance between the lower half (2nd and 3rd quadrants) and upper half (1nd and 2rd quadrants) of the disk. The blade develops higher load in the lower half of the disk with respect to the opposite half. In fact, the cross flow induced by the motion, being opposite to the blade rotation, acts to increase the tangential flow experienced by the blade and consequently the developed loads; differently, this mechanism is inverted in the upper half. This behavior is similar for the maneuvers considered and it gradually amplifies with the increase of rudder angle , as it can be clearly evidenced by the distribution of the loads over the disk and the trend of the single blade loads (thrust and in-plane forces) visualized in the figures. Specifically, the imbalance of the thrust causes a negative pitching moment that is prevalent with respect to the yaw moment (see Figure 14); the side force, oriented in the positive direction, is originated in the lower half of the disk, its partial contribution increasing faster with respect to the upper half (where it is almost constant) (see Figure 15a). Obviously, the vertical force is negligible, the counteracting contributions from the left and right halves of the disk being almost coincident. It has to be stressed that the effects of the cross flow is the primary element that determines the behavior of the external propeller synthesized in Figure 7a–d [27]. In fact, the self-similar character of the blade hydrodynamics determines the linear increase of thrust, torque and side force and, conversely, the smooth drop of the vertical force; moreover, the marked overload with respect to the internal propeller has to be also ascribed to the increase of the sectional incidence angle by the cross flow, since the mean velocity defect is stronger on the internal propeller (see Figure 9a and Figure 10a).
On the contrary, on the internal side the blade hydrodynamics is more complicated, because the disturbance due to the wake of the hull and appendages is superposed to the cross flow. As a matter of fact, the blade hydrodynamics is affected by the wake and interaction with vortical structures in the upper half of the disk, while by cross-flow in the lower half. At , interaction of the blade with the skeg vortex (it acts to increase the tangential speed relative to the section, and consequently, the loads) causes the localized increase of thrust at about , and amplifies its fluctuation during the cycle (see Figure 11a). This interaction also provokes the increase of the magnitude of in-plane moments and the relevant peak of the vertical force reported in Figure 7d. In particular, the increase of the vertical force has to be ascribed to this localized phenomenon, because the trend of this load developed by the single blade is similar to the one experienced in rectilinear motion with the exception of the passage about . Moreover, because of the reduction of blade load in the lower half of the disk due to cross flow, the side force increases (see Figure 15a). At the maximum rudder angle, , the localized effect of the skeg vortex is weakened, since the vortex moved further to the lee side. The further buildup of thrust is originated in the left half of the disk, as it is proved by the increase of the single blade load for (see Figure 7a); this is associated to the combination of velocity defect and speed drop (experienced by the model during the maneuver), since the tangential flow, upwards oriented (see Figure 10a), acts to reduce the incidence angle of the blade sections. The increase of the pitch moment and the yaw moment is weakened, as demonstrated by the inversion of the trend of the load in the lower and left halves of the disk (see Figure 14). Consistently, the in-plane loads are also reduced: the drop of has to be ascribed to the weakening of left/right imbalance of the load associated to the increase of the magnitude of vertical force in the left half of the disk (see Figure 7d and Figure 15b); similarly, the increase of the side force in the lower half of the disk counteracts the force on the upper half and, hence, the asymmetry with respect to the horizontal axis is reduced.
6. Semi Empirical Method for Full Scale Prediction of in-plane loads
Scaling of results from model to full scale represents the most long been debated topic in marine hydrodynamics since ever. The scaling to full scale during maneuvering is further complicated (with respect to rectilinear motion) by the fact that the attitude of the model is also affected by scale effects, influencing the distribution of the wake and the inflow over the propeller disk [25]. In this investigation, only the effects of Reynolds number and cavitation on propeller loads are analyzed by a simplified approach based on a modified versions of the blade element solver described in Section 3. However, the same approach could be equally used together with a more advanced solver (i.e., Boundary Element Method) and with an increasing level of accuracy by considering also the wake distribution at full scale.
6.1. Effect of Reynolds Number
The scale effect due to different Reynolds number was accounted for by the ITTC procedure. The method (the formulation is not reported for the sake of conciseness) provides the corrections for thrust and torque of a propeller operating in open water conditions referring to the section at . In our study, since the propeller sections meet a variable flow during a period of revolution, the method was implemented in the solver in two different ways. In particular, the corrections were applied both for each blade section and only for the one at ; in both cases, the total correction was the result of the integral performed along the span and the complete revolution, and the complete revolution only, respectively. In the propeller solver, the torque correction was properly transformed to a modification of the tangential force developed by element in order to compute the scale effects also for the in-plane loads. The outcome of the study was that the viscous correction provided a negligible contribution to the propeller loads, therefore the results were not reported. The difference between the two implemented approaches was small; this was due to the fact that the size of the propeller model is sufficiently big to guarantee that the local Reynolds number over the largest portion of the blade is grater than the suggested one (i.e., ) [38]. It has to be pointed out that the ITTC scaling does not account for the effects of propeller loading and this aspect can be important during maneuvering because the propeller loading increases.
6.2. Effect of Cavitation Number
The model is improved to account for the effects of cavitation extension on blade loads by means of the 2D partially cavitating foil linearized theory [39]. In fact, the lift coefficient of a partially cavitating foil depends on the cavitation length by:
where is parameter that defines the cavitation length (); is made non dimensional with respect to the chord of the foil. To obtain , the following equation must be solved:
where is the cavitation number (), and is the (geometric) angle of attack of the foil. Moreover, the volume of the attached bubble can be also determined:
The algorithm of the modified propeller solver is explained in Figure 6. In particular, the solution for the cavitation length introduces an additional iterative cycle (Equation (6) is non linear) that is nested in the iterative solution of the Prandtl–Betz condition: in–fact, the self–induced velocity field, being strictly coupled with the circulation (lift) generated by the section, is obviously related to the cavitation extension (i.e., , see Equation (5)). It can be observed that as long as the induced angle of incidence changes to fulfill the Prandtl–Betz relation, the lift coefficient is consistently adjusted to obtain a physically consistent model. Obviously, this method presents the following drawbacks:
- the cavitation lenght is overestimated because the linear theory does not account for thickness
- during off-design conditions, the higher angle of incidences experienced by the blade sections may give rise to types of cavitation other than the attached sheet cavity assumed in linear theory (cloud cavitation, bubble cavitation)
In the computations, is calculated by considering the incident flow magnitude scaled at full scale and the nominal wake is kept the same of the model scale. The use of semi–empirical wake scaling technique was out of the aim of this approximate analysis; it has to be noted that these scaling techniques were not validated for maneuvering conditions and the most immediate way to assess or improve their capabilities to ship maneuvering problems could be the use of .
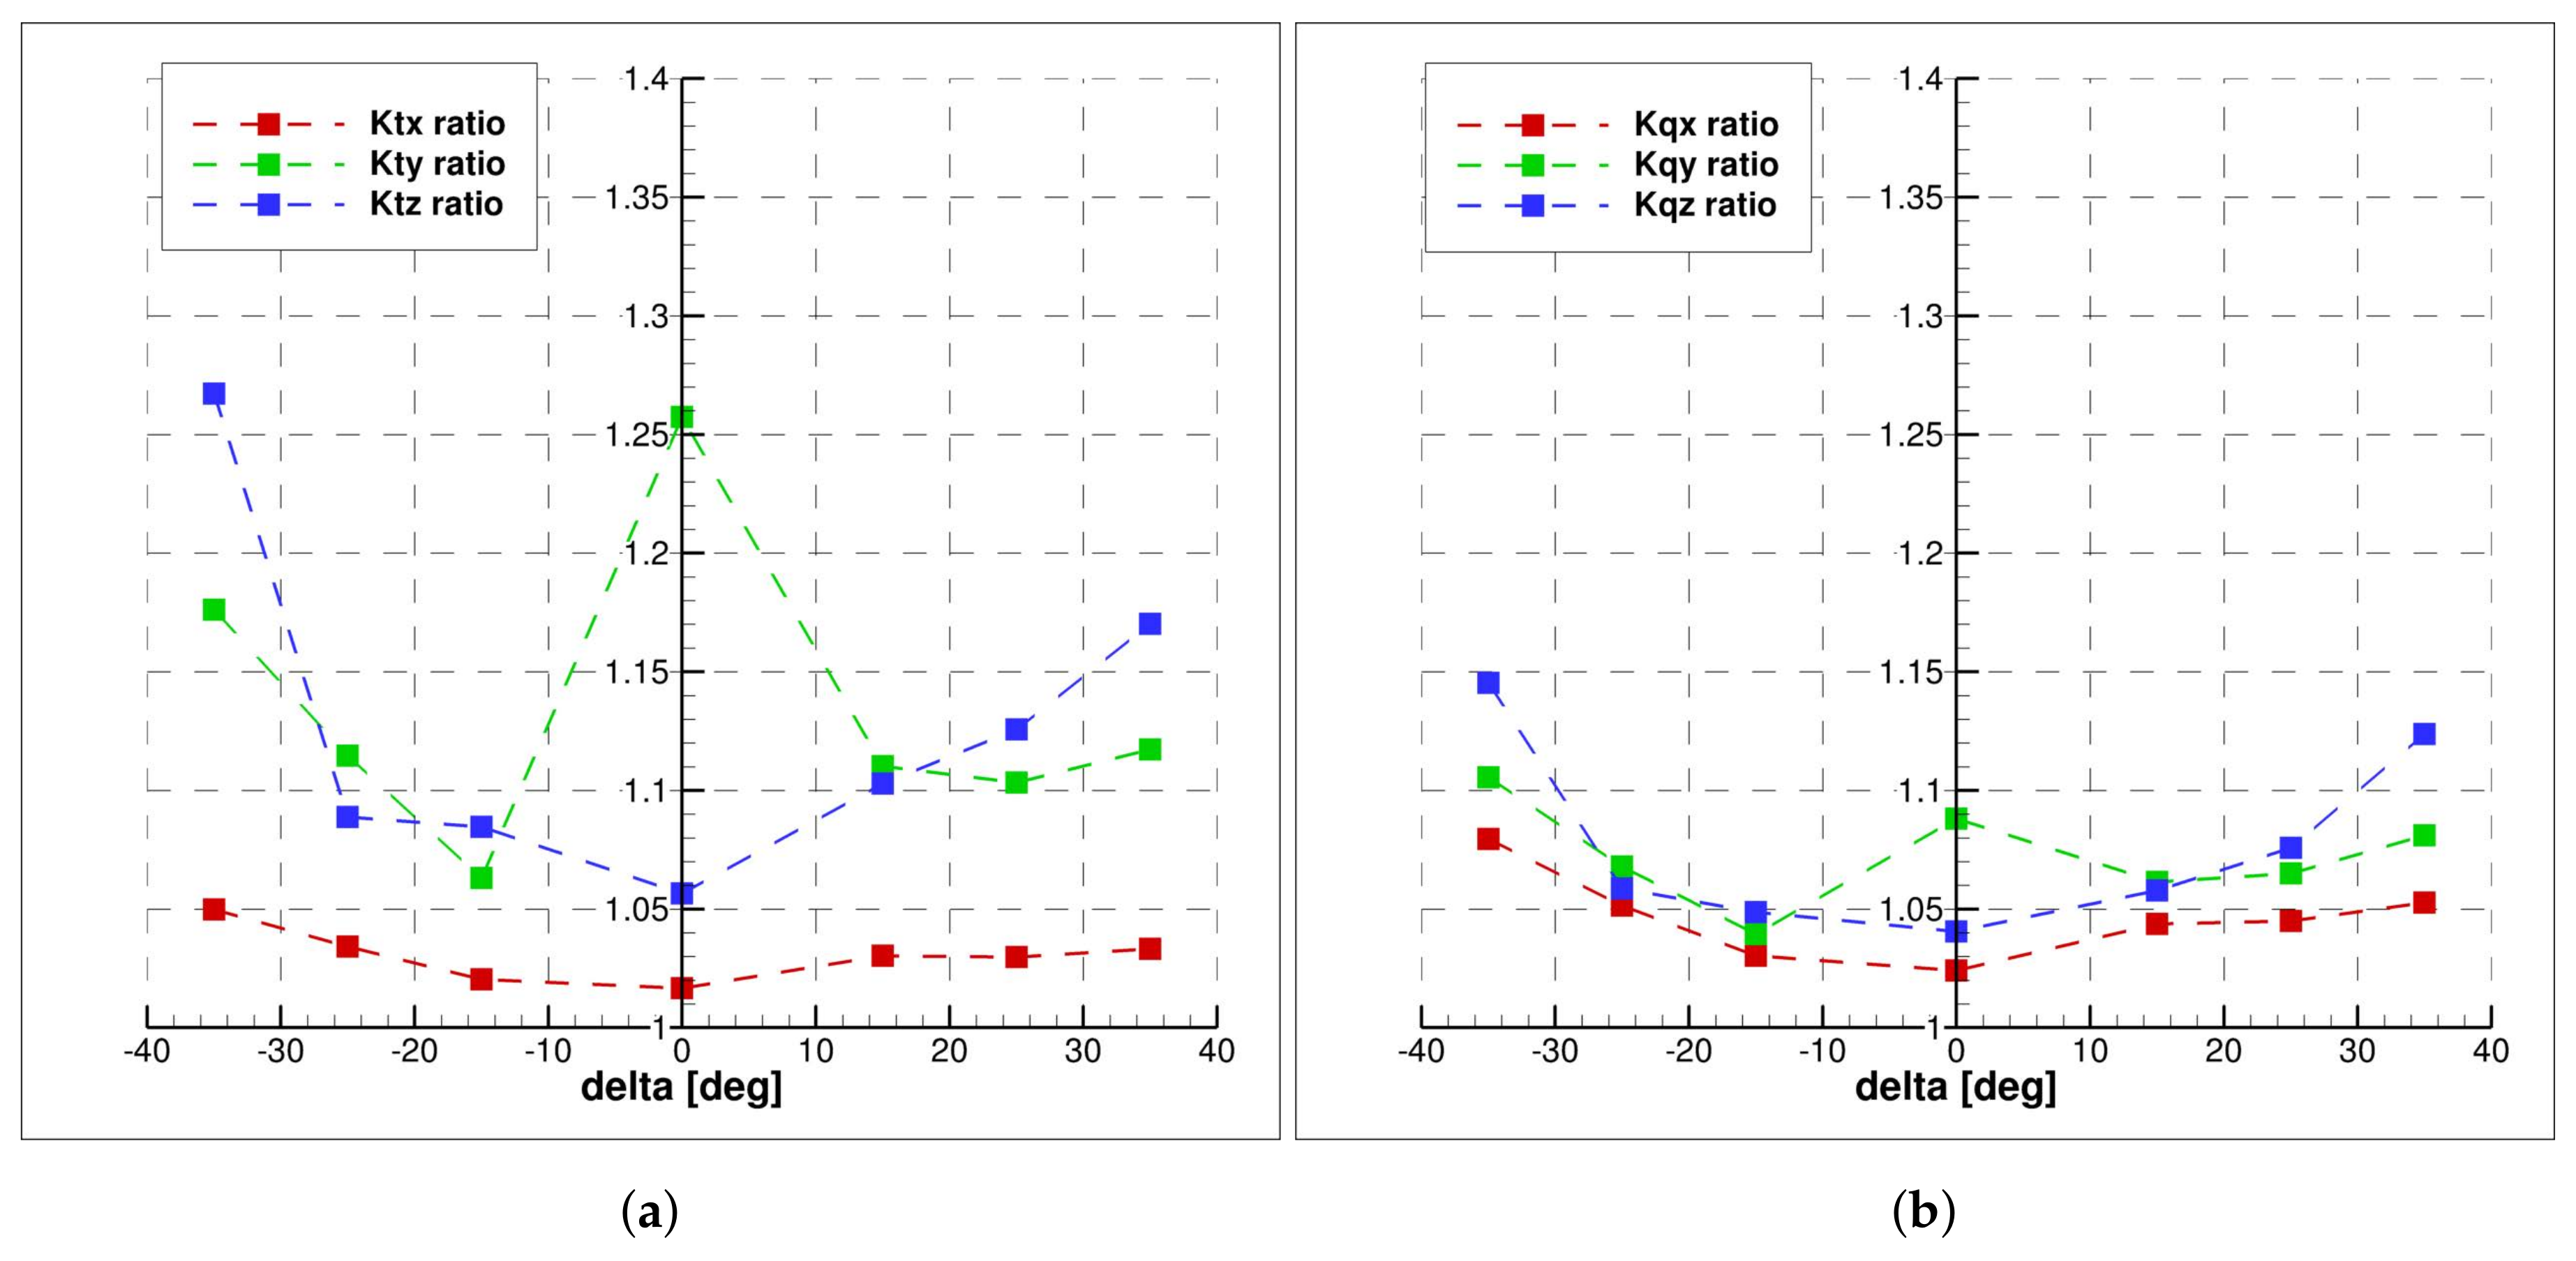
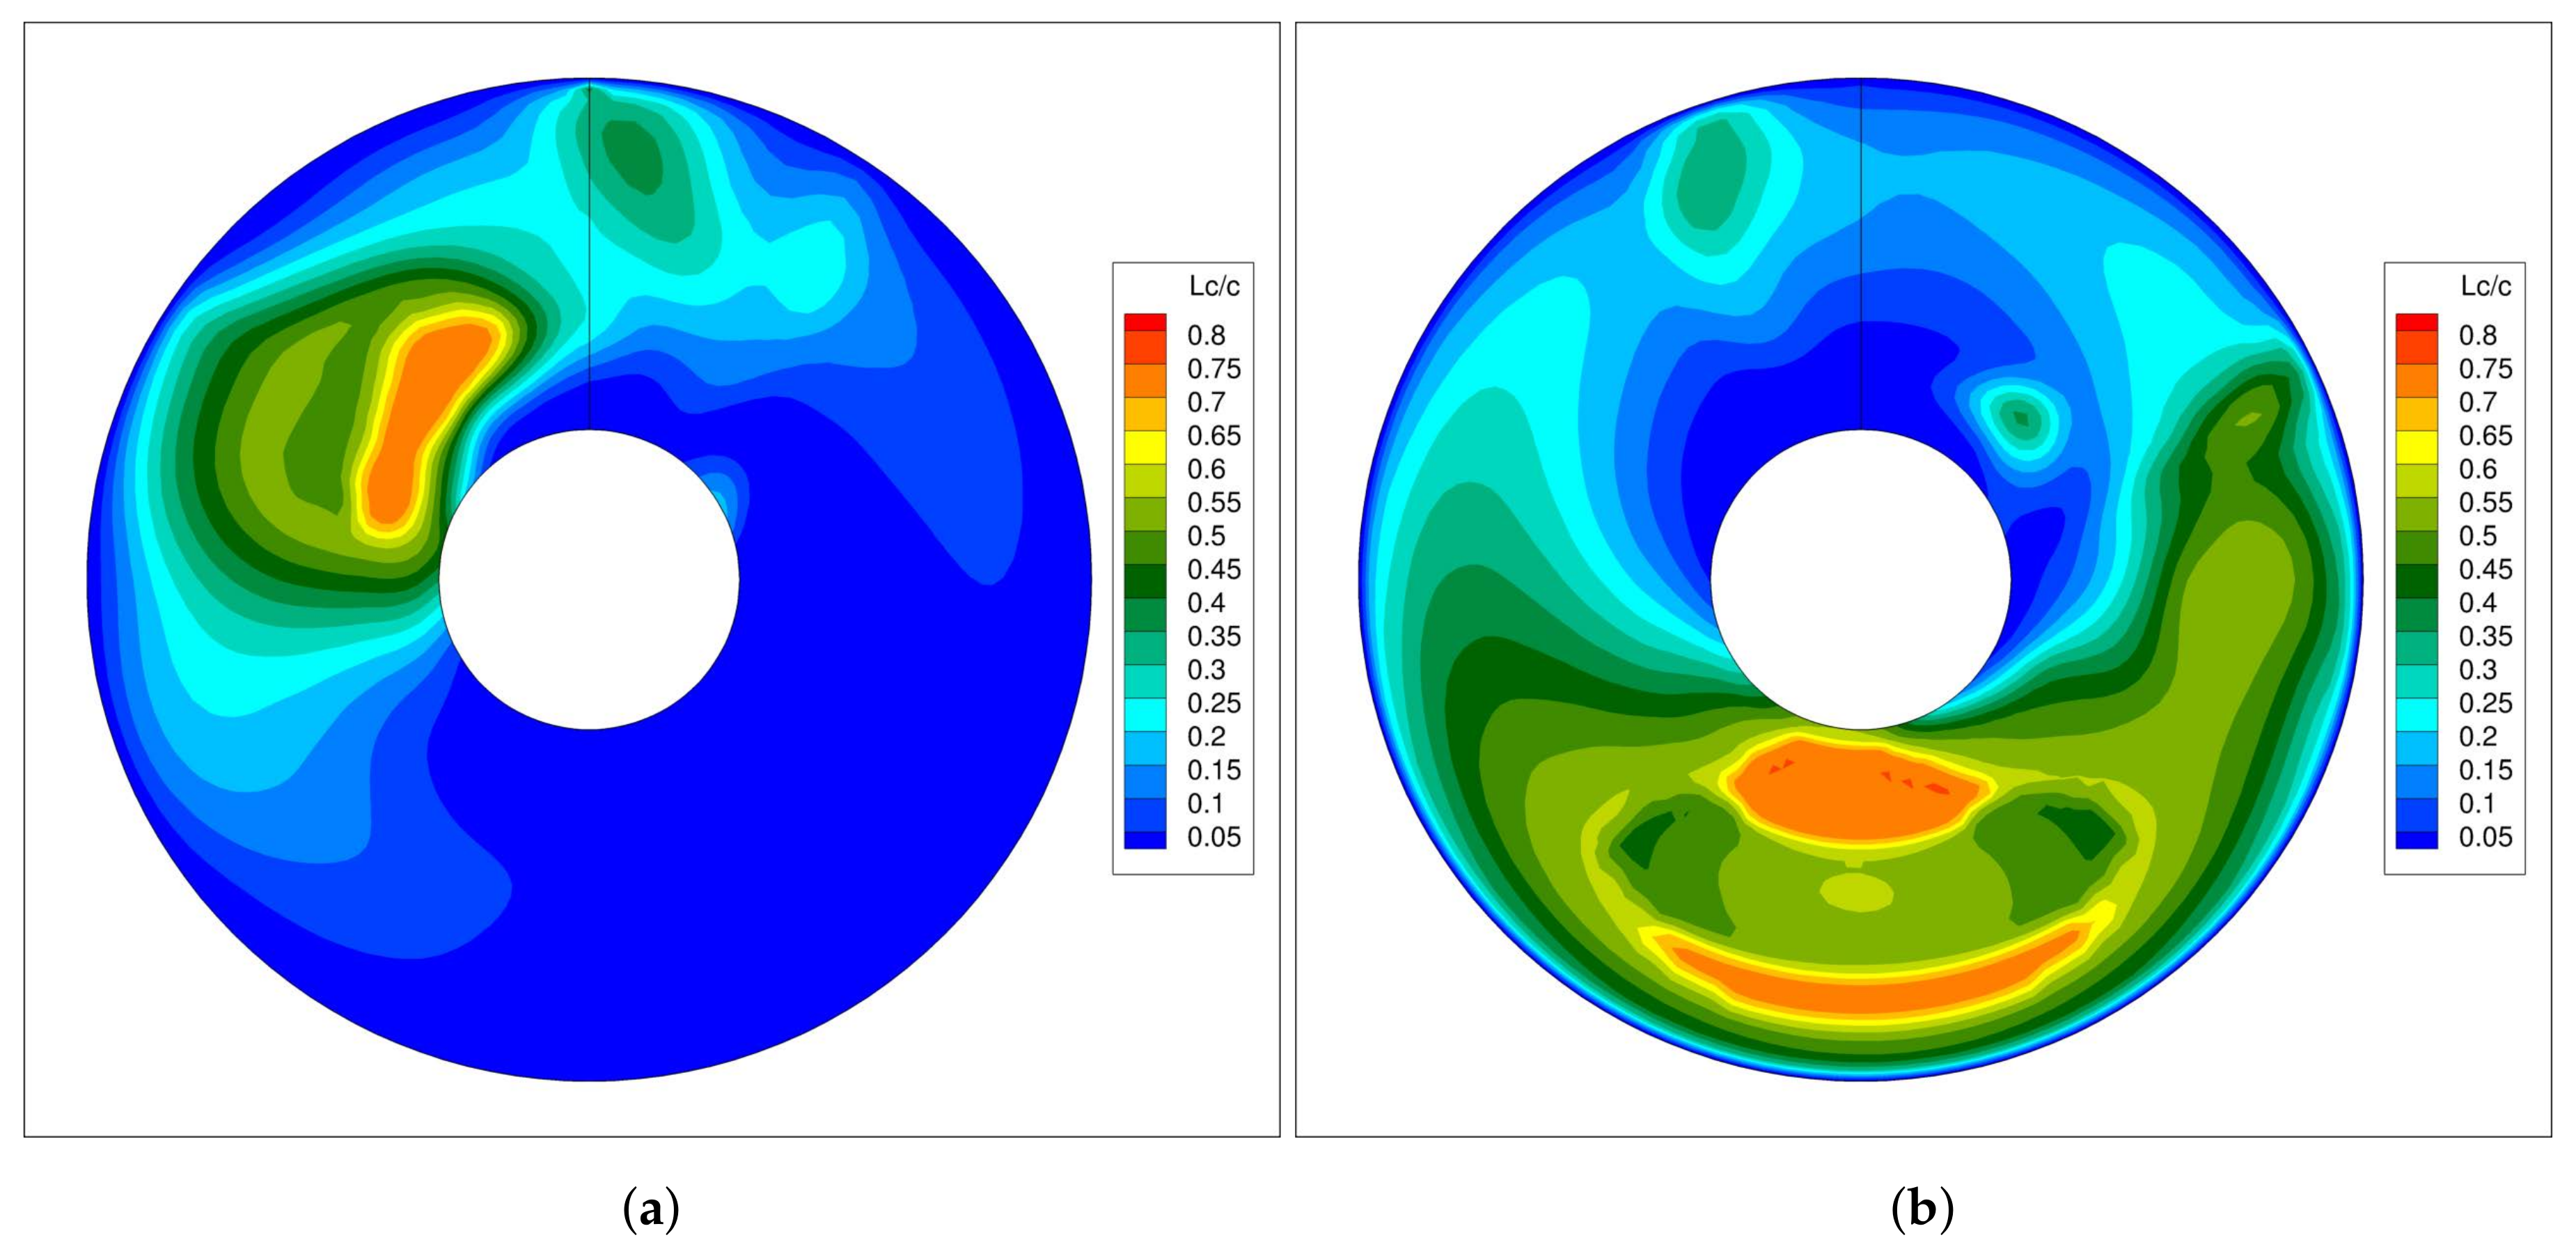
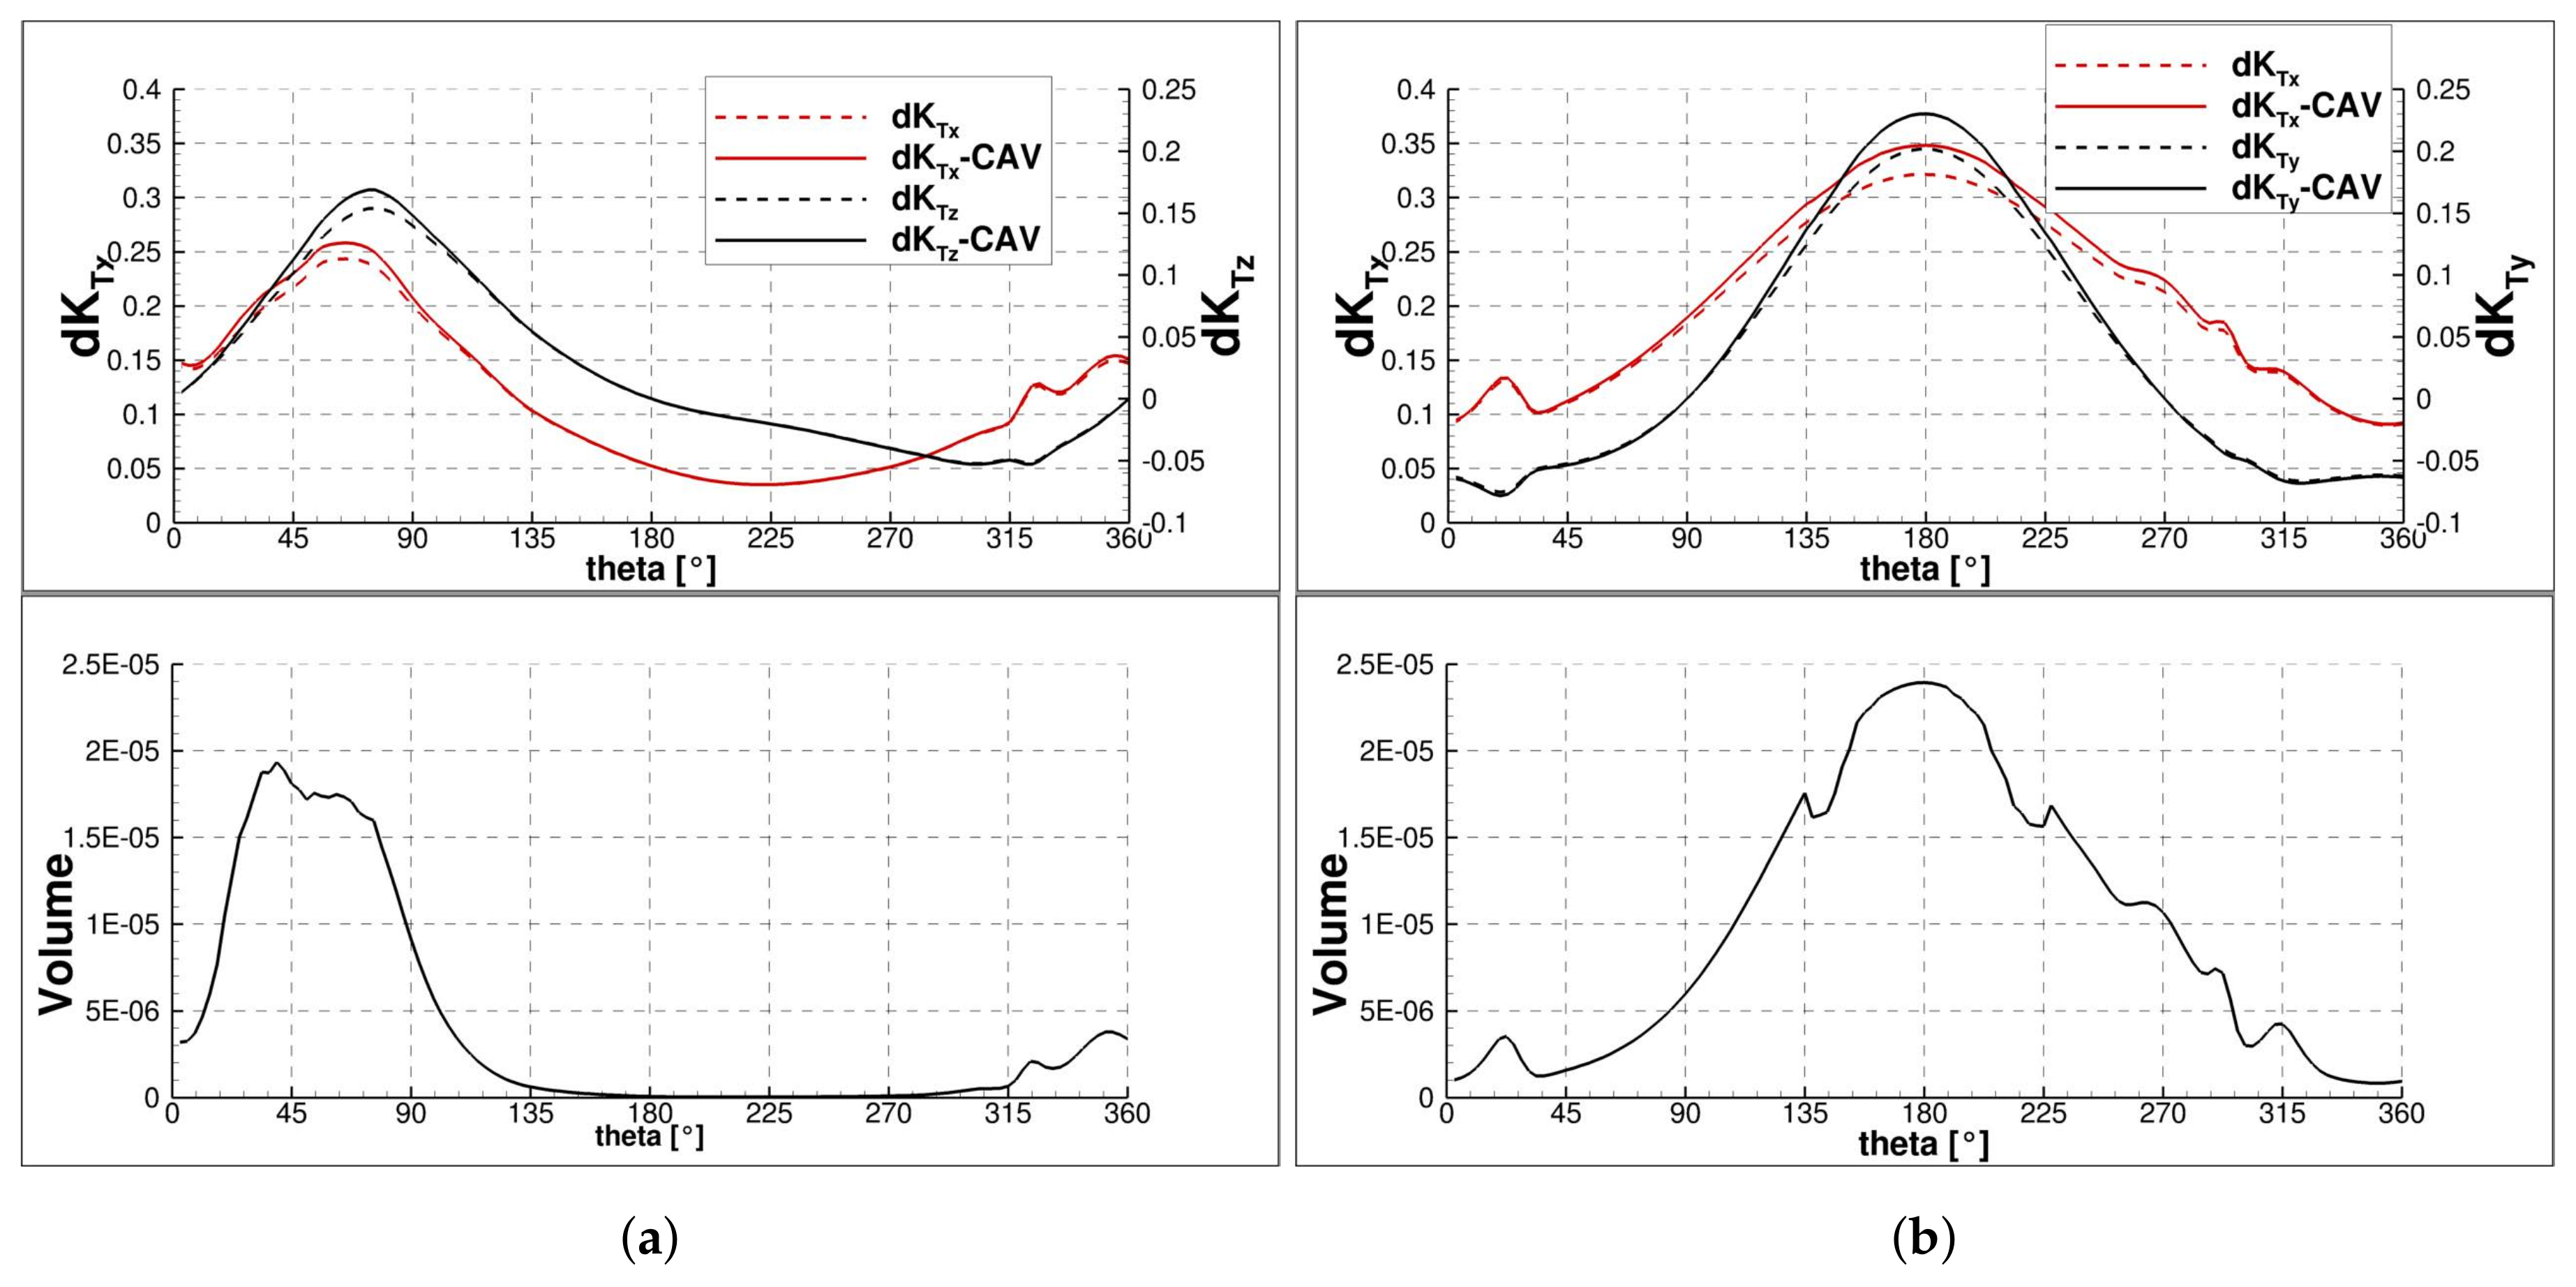
The propeller forces and moments obtained with the new model are reported in Figure 16 in terms of ratio with respect to the values with cavitation switched off. The increase of the loads is qualitatively similar on the external and internal propeller. Figure 16 highlights that the in-plane forces and moments are more sensitive to cavitation phenomena with respect to the thrust and torque. This is due to the fact that cavitation amplifies the imbalance of these loads between the upper/lower and left/right halves of the disk. This aspect is supported by the distribution of over the propeller disk for the internal propeller at and the external one (see Figure 17). The cavitation pattern resembles the same features of load distribution discussed previously and, in particular, the asymmetry of their distribution over the disk; therefore, the consequent amplification of the loads can be qualitatively expected by relation (5). This aspect is further supported in Figure 18a,b, that show a comparison of the propeller thrust and in-plane loads in cavitating and non cavitating conditions with the cavitation extent (Equation (7)) for the same representative maneuvers considered in the previous analysis. In the figures, the vertical and the lateral force are reported with the thrust for the internal and external propeller at and , respectively. In particular, it can be observed that the discrepancy between the loads during the cavitating (solid line) and the non cavitating (dashed line) conditions are experienced in correspondence of the blade/wake interaction on the leeward side and in the lower half of the disk on the windward side; moreover, in the cavitating conditions, the amplitude of the fluctuation of the blade load is higher (with consequent increase of the in-plane loads).
It is interesting to observe that on the internal propeller the increase of the loads is faster than the external propeller up to for all the loads with the exception of the side force (see Figure 16a). This can be ascribed to the large gradients of the inflow caused by the evolution of the wake and coherent structures detached from the appendages. The effect of the non–homogeneity of the wake on the onset and development of cavitation was also remarked in [7,8]. It has to be pointed out that the abrupt increase of the vertical force on the external shaft and the peak of the side force at are not relevant converted to dimensional quantities. It can be further noticed that on the external propeller , , and increase with a linear trend, the flow being unperturbed by the wake of the hull.
In general, for the worst conditions resulted at the maximum rudder angle, , the increase of thrust amounts to about 5%; on the other hand, the side force and the vertical force experience a 20% increment with respect to the non cavitating case, for the external and internal propeller, respectively. The discrepancy between the torque and the other moments is weaker, although the torque increase is almost halved with respect to the pitching and yawing moments. In order to obtain a full scale prediction of the experimental data, the percentage increases obtained from this numerical analysis could be imposed to the experimental data, considering also the fact that the Reynolds number effect was negligible. For the mechanical sizing of the bearings of the propulsive shaft, the maximum values of the loads exerted by the propeller should be known; extrapolation to full scale of the experimental data can be performed, according to the present analysis, considering maximum percentage increase of the load due to cavitation. Since this condition is experienced on the external propeller, characterized by a pure oblique inflow condition, a cheaper approach could be to modify experimental value on a free running model by the percentage increase of the loads for a propeller in open water set at the same incidence of the model (determined by the kinematic of the maneuver) or, alternatively, presumed at the full scale achieved numerical (by a computation) or water tunnel experiments. In principle this approach is cheaper than a complete analysis for the complete ship configuration.
6.3. Further Remarks on the Scale Factors in Cavitating Conditions
The scaling factors were evaluated under the assumption that the maneuvering response and the inflow to the propeller at model and full scale are the same. Obviously, the knowledge of the wake at full scale is of utmost importance to obtain reliable predictions of propeller performance, in particular when cavitation analysis and related side effects (pressure pulses and noise) are of concern. In [40], it was highlighted that the nominal wake can lead to under prediction of the cavitation pattern and evolution (pressure pulses) with respect to the use of the wake at full scale. Referring to the case analyzed in this work, assuming a pure “contraction” of the nominal wake for its scaling, the gradients of the inflow experienced by the blade section of the propeller could be stronger and hence, the increase of the load be higher than the predicted one. During maneuvering, on the internal propeller, the evolution of the wake is characterized by a concurrent contribution of vortical structures and non-organized separate swirling flow, moving from smaller to higher rudder angles. Therefore, the modification of the scaling factor could be expected to be different for the various maneuvers. On the external propeller, the flow and the global propeller performance of the propeller are governed by the cross-flow induced by the motion; moreover, since these global effects are (almost) linearly amplified with the rudder, it can be expected that the eventual correction of the scaling factor changes in a similar way. For the purpose of the proposed analysis, i.e., the quantification of a scaling factor, the key point is the identification of the most critical condition characterized by the maximum amplification of the loads due to cavitation. On the internal shaft, the worst condition remains the maneuver at in terms of absolute increment of the load; in this case, the radial force in non cavitating condition is of the same order of magnitude of the one experienced by the external propeller. The obtained scaling factors for both cases lead to similar increment of the loads. The critical phenomenology on the internal propeller is governed by a localized development of the cavitation due to the interaction between the blade and the vortex; on the external propeller, the cavitation is completely developed in the lower half of the disk and it is caused by the effect of cross-flow that cause the strong overload of the propeller in this sector. Although the contraction of the wake at full scale probably amplifies the extension of the cavitation pattern, a global effect similar to the that experienced on the external propeller seems difficult to develop (the absolute increment of loads on the external propeller are almost doubled with respect to the internal propeller), considering also the fact that the loading of the two propellers are completely different (see Figure 7). This is particularly evident also by comparing the blade thrust in Figure 11a,b: the maximum load of the blade at for the external propeller during its rotation in the lower half of the disk is markedly higher with respect to the load of the blade of the internal propeller. Therefore, the predicted order of magnitude for the safety factor (on the external propeller) can be considered plausible (under the hypothesis and simplification of the model).
Finally, it has to be remarked that the present conclusions are valid for this specific configuration of the propulsion system, i.e., propeller inward rotating from the top; as it was shown in [29], the inversion of the sense of revolution of the propellers completely alters the behavior of the internal and external propellers.
7. Conclusions
Present work is a contribution to the understanding of the mechanisms that rule the performance of a propeller operating in off-design conditions (maneuvering). In particular, the work consisted of a synthesis of the results of free running model tests and their phenomenological assessment with numerical computations performed with a maneuvering simulations and simplified propeller model based on Blade Element Momentum Theory. The test case for the study was a twin screw model; the propulsive configuration is particularly suitable for this study, since the regime of the propellers on the leeward and windward sides is markedly different.
In fact, the propeller on the external side operates in a pure oblique flow condition and the increase of the loads is almost linear with the rudder angle. This propeller experiences the most critical condition with respect to the internal one at maximum rudder angle. In fact, the thrust and torque increases up to 80% and 60% of the value in straight ahead sailing; moreover, since the inflow is directed almost in the horizontal direction, the propeller develops only a side force that acts to stabilize the vessel and amounts to about 30% of the thrust generated in the approach phase of the maneuver. On the other hand, on the internal side, the propeller hydrodynamics is markedly affected by the evolution of the wake detached from the hull, the interaction with vortical structures convected through the propeller disk and the cross-flow induced by the motion. The dominance of one effect with respect to the other at different maneuvering conditions is the reason of the non-linear variation of the loads with rudder angle. Although the thrust and torque did not experience a large overload (10% with respect to the value during the approach phase), the behavior of the in-plane loads resulted sensitive to these flow conditions; indeed, the asymmetries and localized gradients of the inflow to the propeller was responsible to a marked imbalance of the periodic blade loads, with the consequence that the maximum magnitude of the radial force was comparable to the one developed on the external shaft. Moreover, the peak of the radial force was experienced during a weaker maneuver () and was ascribed to the interaction of propeller blades with a coherent structure developed past the appendages. These results stressed that also mild variations from the straight ahead conditions can be critical for the propulsive system, even to the same extent of heavy off-design conditions, and can possibly generate undesired noise emission, vibrations and fatigue loads on the shafting system.
Finally, a preliminary analysis on the scale effects on the propeller loads was carried out. In particular, the study considered only the scale effects for the propeller, i.e., the Reynolds number and cavitation number on propeller loads. To this aim, the propeller solver was modified to calculate the loads corrections by the ITTC method for the former problem; for the second issue, the propeller solver was enhanced with a linear, partially cavitating, hydrofoil theory, accounted in a consistent way with the solution for the self–induced velocity field. The study highlighted that viscous effects on the propeller loads are negligible with respect to cavitation; moreover, the in-plane loads are more sensitive to cavitation with respect to thrust and torque because it increases the asymmetry of blade loads during the cycle. The amplification of the loads due to cavitation is experienced on the external shaft at the maximum angle for the present propulsive configuration (propellers inward rotating from the top); therefore, a viable scaling procedure during the design phase could be to complement free running maneuvering tests with measurements or computation for the isolated propeller at the critical incidence and equivalent loading condition in cavitating and non-cavitating conditions for achieving the scaling factor. A complete analysis of the propeller performance at full scale cannot be performed without considering cavitation and its related effect; simulations with weak coupling with propeller models are feasible. More accurate analysis could be possible by a multi–phase solver (with discretized propeller); the computational burden is prohibitive for design purposes and thus far this kind of simulation has not yet been carried out.
Reynolds number effects on the modification of the nominal wake to the propeller is a very challenging issue, since scale effects the maneuvering response and, therefore, the evolution of the wake. These effects are also important to correctly predict the cavitation volume and, in particular, it dynamics in order to predict accurately propeller hull induced vibrations and acoustic emission. In this regard, can provide a valuable insight on the modification of the wake and, moreover, contribute to understand whether the development of scaling techniques similar to those applied in straight ahead motion are a plausible way to a safer extrapolation of the loads to full-scale. Obviously, measurements at full scale, despite difficult to set up, could provide useful hints to tune the extrapolation procedure; unfortunately, at present the availability of data is extremely poor or restricted by industry.
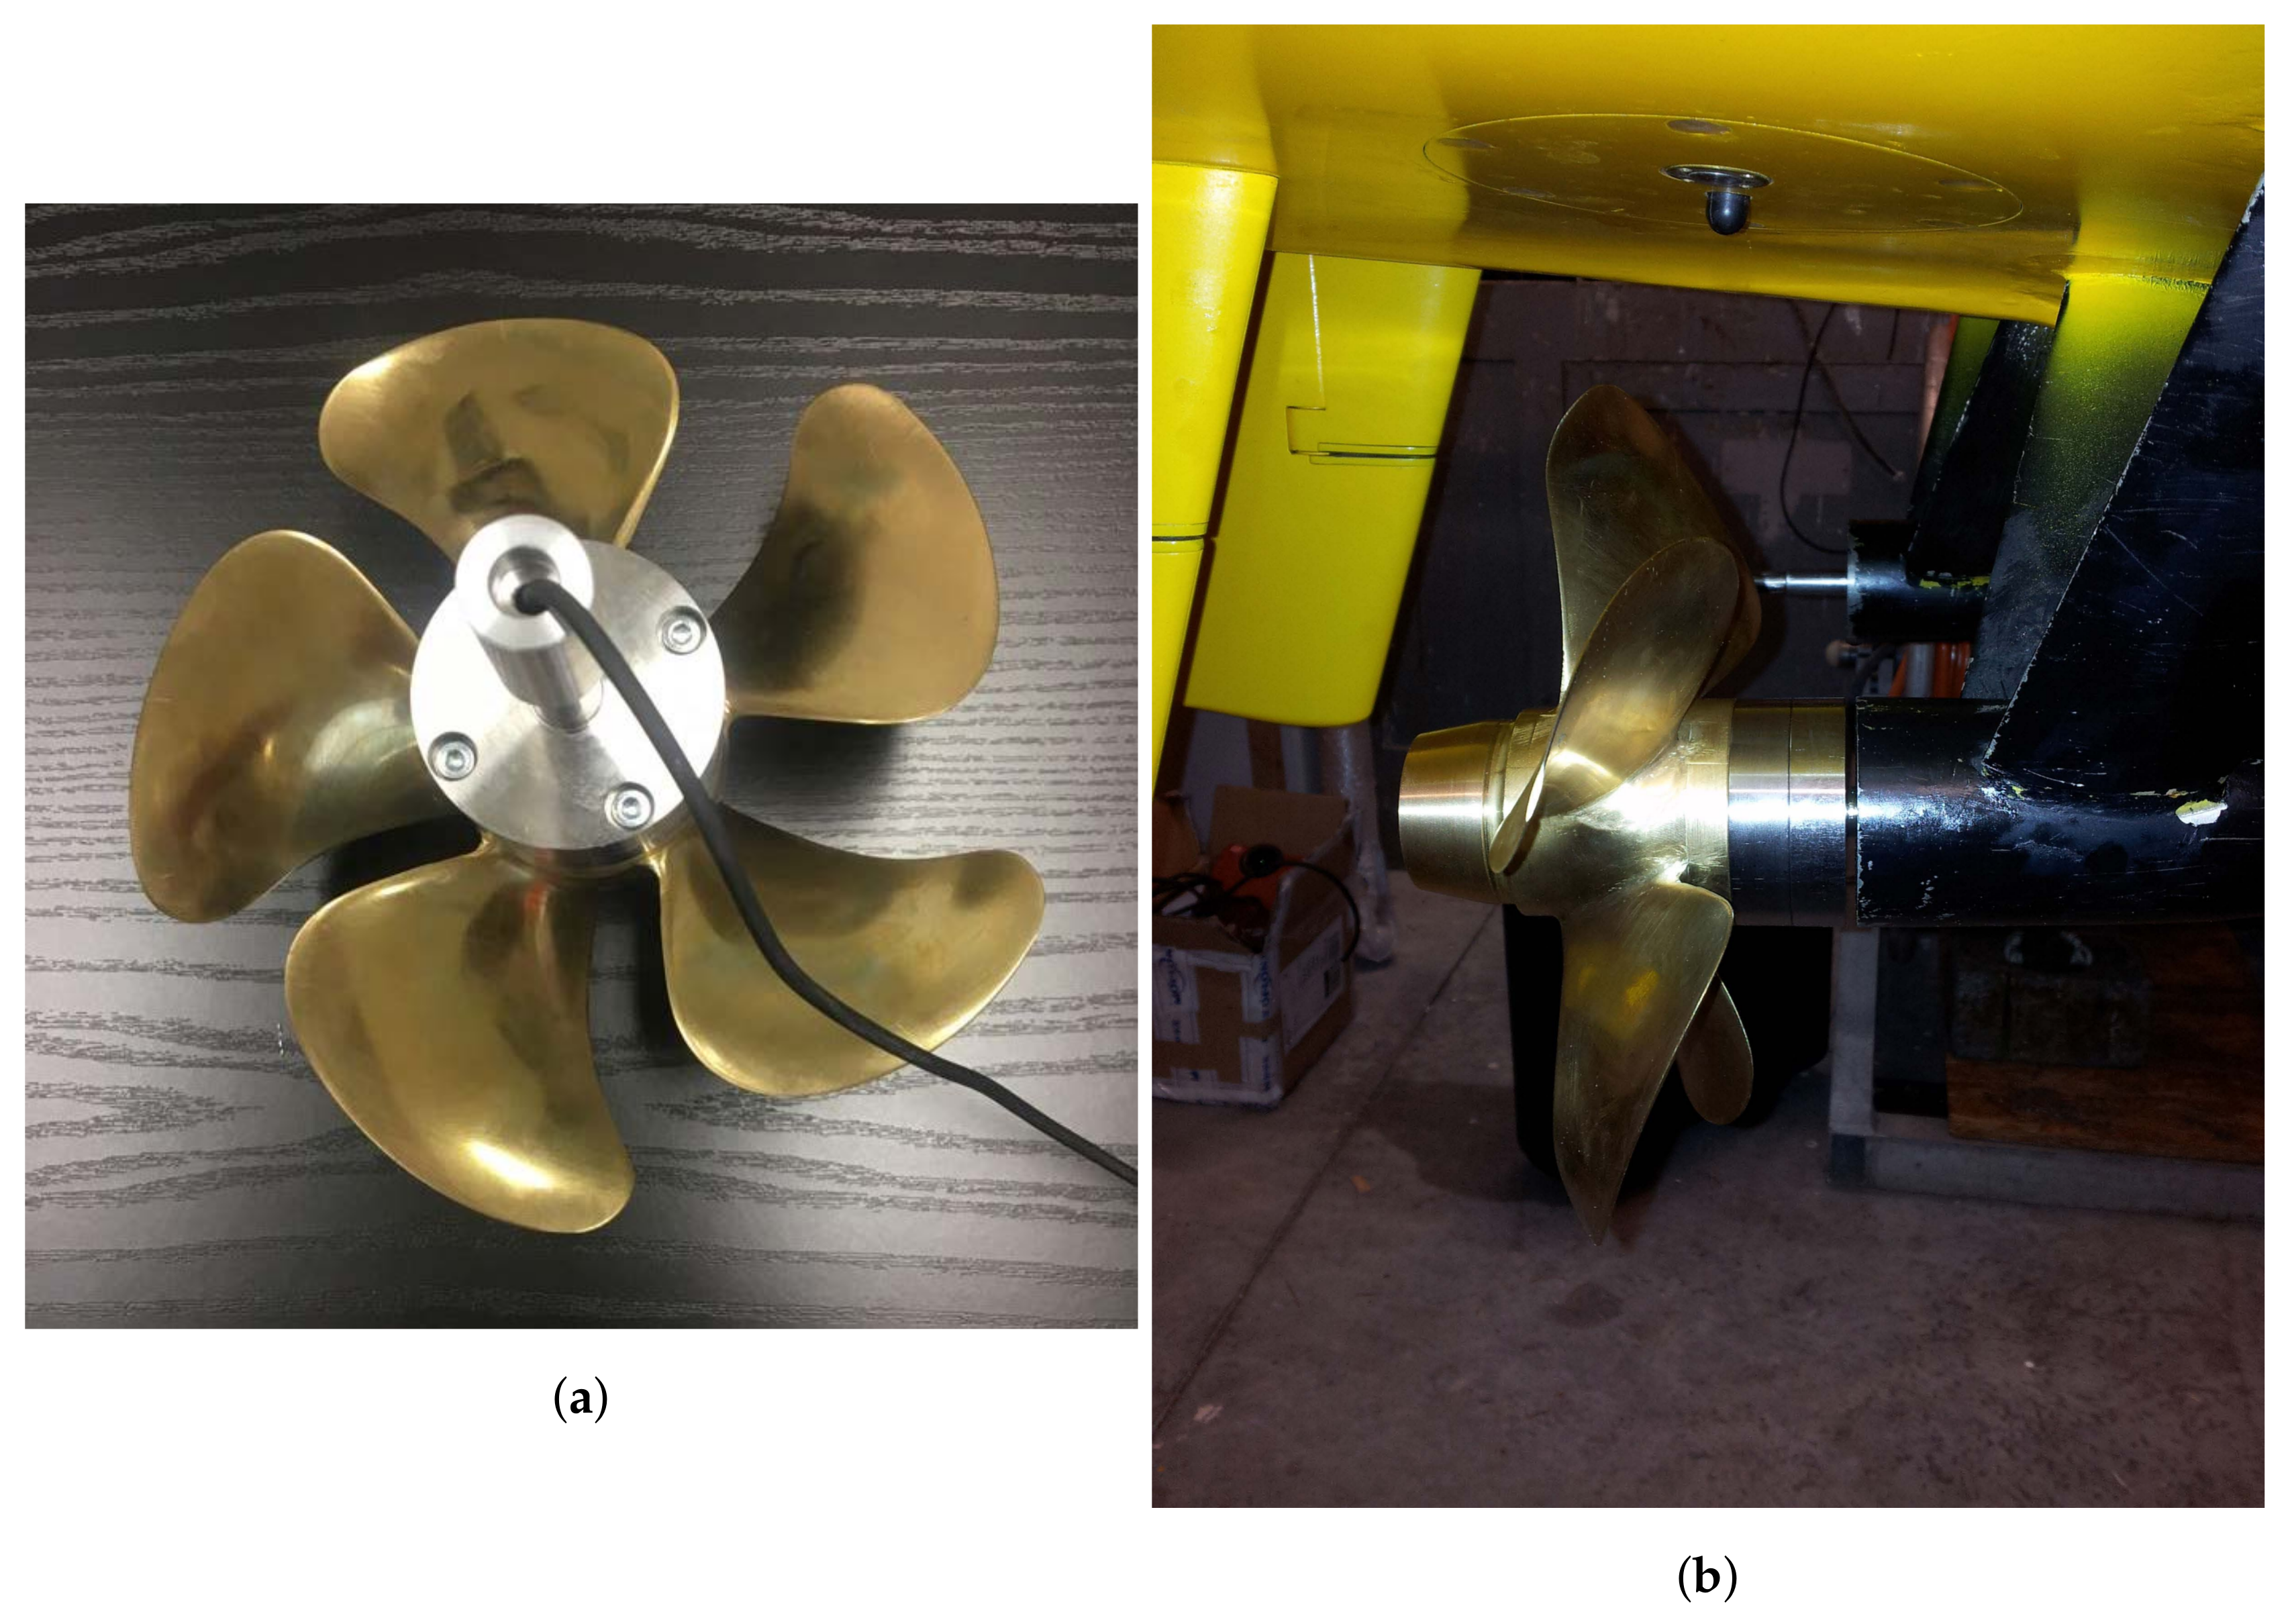
To better understand the complex phenomenology of the propeller behavior in off-design conditions, in particular to relate the loads to physic experienced at blade rate frequency, the set-up of the free running model has been recently improved for the characterization of the single blade loads. On the basis of these measurements, all the system of loads acting on the propeller can be determined and these measurements represent a basis for deeper investigation also on propeller side effects related to propeller vibration, pressure pulses and noise emission. In Figure 19a,b a partial overview of the ad–hoc design propeller to house the measurement system of the single blade and in the behind hull configurations are showed. The test case is a twin screw ships with a different stern geometry with respect the one considered in this study and the model size is smaller. The experiments will be carried out at the same experimental conditions on a free running, self propelled maneuvering model.
Acknowledgments
This research activity was funded by the Flagship Project RITMARE—The Italian Research for the Sea—coordinated by the Italian National Research Council, and by the Italian Ministry of Education, University and Research within the National Research Program 2011–2013. The authors would like to acknowledge Fabio Carta and Roberto Zagaglia for their valuable technical contribution and support for the development of the 2–component transducer, and adjustments and refinements to CAD models.
Author Contributions
F.O., G.D. and S.M. were involved in the experimental campaign; F.O. and G.D. analyzed and interpreted the experimental data; G.D., R.M. and A.D.M. carried out the numerical investigation. F.O., G.D., R.M. and A.D.M. synthesized the experimental and numerical data and equally contributed on writing the paper; all the authors contributed on the final drafting of the paper.
Conflicts of Interest
The authors declare no conflict of interest.
Abbreviations
The following abbreviations are used in this manuscript:
| ITTC | International Towing Tank Conference |
| CFD | Computational Fluid Dynamics |
| BEMT | Blade Element Momentum Theory |
| RANSE | Reynolds Averaged Navier Stokes |
References
- Vartdal, B.; Gjestland, T.; Arvidsen, T. Lateral Propeller Forces and their effects on Propeller Shafts Bearings. In Proceedings of the Symposium on Marine Propellers and Propulsion, Trondheim, Norway, 22–24 June 2009. [Google Scholar]
- Sverko, D.; Sestan, A. Experimental Determination of Stern Tube Journal Bearing Behaviour. Brodogradnja/Shipbuilding 2010, 61, 130–141. [Google Scholar]
- Broglia, R.; Dubbioso, G.; Durante, D.; Di Mascio, A. Simulation of Turning Circle by CFD: Analysis of different propeller models and their effect on manoeuvering prediction. Appl. Ocean Res. 2013, 39, 1–10. [Google Scholar] [CrossRef]
- Broglia, R.; Dubbioso, G.; Durante, D.; Di Mascio, A. Turning ability analysis of a fully appended twin screw vessel by CFD. Part I: Single rudder configuration. Ocean Eng. 2015, 105, 275–286. [Google Scholar] [CrossRef]
- Dubbioso, G.; Broglia, R.; Durante, D.; Di Mascio, A. Turning ability analysis of a fully appended twin screw vessel by CFD. Part II: Single rudder vs Twin rudder configuration. Ocean Eng. 2016, 117, 259–271. [Google Scholar] [CrossRef]
- Grigoropoulos, G.; Campana, E.; Diez, E.; Serani, A.; Goren, O.; Sarioz, K.; Danisman, D.; Visonneau, M.; Queutey, P.; Abdel-Maksoud, M.; et al. Misson–based hull form and propeller optimization of a transom stern destroyer for best performance in the sea environment. In Proceedings of the 7th VII International Congress on Computational Methods in Marine Engineering MARINE, Nantes, France, 15–17 May 2017. [Google Scholar]
- Taskar, B.; Steen, S. Effect of waves on cavitation and pressure pulses. Appl. Ocean Res. 2016, 60, 61–74. [Google Scholar] [CrossRef]
- Taskar, B.; Steen, S.; Eriksson, J. Effect of waves on cavitation and pressure pulses of a tanker with twin podded propulsion. Appl. Ocean Res. 2017, 65, 206–218. [Google Scholar] [CrossRef]
- Taskar, B. The Effects of Waves on Marine Propellers and Propulsion. Ph.D. Thesis, Norwegian University of Science and Technology, Trondheim, Norwegian, 2017. [Google Scholar]
- Amini, H.; Steen, S. Theoretical and experimental analysis of propeller shaft loads in oblique flow. J. Ship Res. 2011, 55, 268–288. [Google Scholar] [CrossRef]
- Gutsche, F. The Study of Ships’ Propellers in Oblique Flow; Technical Report; Volume 4306 DRIC Translation; Defense Research Information Centre: New Delhi, India, 1975. [Google Scholar]
- Cassella, P.; Mandarino, M.; Scamardella, A. Systematic tests with B—Wageningen screw propellers in non-axial flow: Presentation and analysis of the experimental results. In Proceedings of the 4th International Symposium on Practical Design of Ships and Floating Structures (PRADS), Varna, Bulgaria, 23–28 October 1989. [Google Scholar]
- Amini, H.; Steen, S. Theoretical and experimental investigation of propeller shaft loads in transient condition. Int. Shipbuild. Progress 2012, 59, 55–82. [Google Scholar]
- Krasilinov, V.; Zhang, Z.; Hong, F. Analysis of Unsteady Propeller Blade Forces by RANS. In Proceedings of the First International Symposium on Marine Propulsors (SMP’09), Trondheim, Norway, 22–24 June 2009. [Google Scholar]
- Liu, P.; Islam, M.; Veitch, B. Unsteady Hydrodynamics of a steering podded propeller unit. Ocean Eng. 2009, 36, 1003–1014. [Google Scholar] [CrossRef]
- Dubbioso, G.; Muscari, R.; Di Mascio, A. Performance of a marine propeller in oblique flow. Comput. And Fluids 2013, 39, 1–10. [Google Scholar]
- Dubbioso, G.; Muscari, R.; Di Mascio, A. Analysis of a marine propeller operating in oblique flow. Part 2: Very high incidence angles. Comput. Fluids 2014, 92, 56–81. [Google Scholar] [CrossRef]
- Yao, J. Investigation on hydrodynamic performance of a marine propeller in oblique flow by RANSE computations. Int. J. Naval Arch. Ocean Eng. 2015, 7, 56–69. [Google Scholar] [CrossRef]
- Muscari, R.; Felli, M.; Di Mascio, A. Analysis of the Flow Past a Fully Appended Hull with Propellers by Computational and Experimental Fluid Dynamics. J. Fluids Eng. 2011, 133, 061104. [Google Scholar] [CrossRef]
- Castro, A.M.; Carrica, P.M.; Stern, F. Full scale self-propulsion computations using discretized propeller for the KRISO container ship KCS. Comput. Fluids 2011, 51, 35–47. [Google Scholar] [CrossRef]
- Mofidi, A.; Carrica, P.M. Simulations of zigzag maneuvers for a container ship with direct moving rudder and propeller. Comput. Fluids 2014, 96, 191–203. [Google Scholar] [CrossRef]
- Carrica, P.M.; Sadat-Hosseini, H.; Stern, F. CFD analysis of broaching for a model surface combatant with explicit simulation of moving rudders and rotating propellers. Comput. Fluids 2012, 53, 117–132. [Google Scholar] [CrossRef]
- Sadat-Hosseini, H.; Carrica, P.; Stern, F.; Umeda, N.; Hashimoto, H.; Yamamura, S.; Mastuda, A. CFD, system-based and EFD study of ship dynamic instability events: Surf-riding, periodic motion, and broaching. Ocean Eng. 2011, 38, 88–110. [Google Scholar] [CrossRef]
- Coraddu, A.; Dubbioso, G.; Mauro, S.; Viviani, M. Analysis of twin screw ships’ asymmetric propeller behaviour by means of free running model tests. Ocean Eng. 2013, 68, 47–64. [Google Scholar] [CrossRef] [Green Version]
- Ortolani, F.; Mauro, S.; Dubbioso, G. Investigation of the radial bearing force developed during actual ship operations. Part 1: Straight ahead sailing and turning maneuvers. Ocean Eng. 2015, 94, 67–87. [Google Scholar] [CrossRef]
- Ortolani, F.; Mauro, S.; Dubbioso, G. Investigation of the radial bearing force developed during actual ship operations. Part 2: Unsteady maneuvers. Ocean Eng. 2015, 106, 424–445. [Google Scholar] [CrossRef]
- Dubbioso, G.; Muscari, R.; Ortolani, F.; Di Mascio, A. Analysis of propeller bearing loads by CFD. Part I: Straight ahead and steady turning maneuvers. Ocean Eng. 2017, 130, 241–259. [Google Scholar] [CrossRef]
- Muscari, R.; Dubbioso, G.; Ortolani, F.; Di Mascio, A. Analysis of propeller bearing loads by CFD. Part II: Transient maneuvers. Ocean Eng. 2017, 146, 217–233. [Google Scholar] [CrossRef]
- Muscari, R.; Dubbioso, G.; Ortolani, F.; Di Mascio, A. CFD analysis of the sensitivity of propeller bearing loads to stern appendages and propulsive configurations. Appl. Ocean Res. 2017, 65, 205–219. [Google Scholar] [CrossRef]
- Di Mascio, A.; Muscari, R.; Dubbioso, G. On the wake dynamics of a propeller wake operating in drift. J. Fluid Mech. 2014, 754, 263–307. [Google Scholar] [CrossRef]
- Muscari, R.; Di Mascio, A.; Verzicco, R. Modelling of vortex dynamics in the wake of a marine propeller. Comput. Fluids 2013, 73, 65–79. [Google Scholar] [CrossRef]
- Di Mascio, A.; Broglia, R.; Muscari, R. On the Application of the One-Phase Level Set Method for Naval Hydrodynamic Flows. Comput. Fluids 2007, 36, 868–886. [Google Scholar] [CrossRef]
- Favini, B.; Broglia, R.; Di Mascio, A. Multi-grid Acceleration of Second Order ENO Schemes from Low Subsonic to High Supersonic Flows. Int. J. Num. Meth. Fluids 1996, 23, 589–606. [Google Scholar] [CrossRef]
- Di Mascio, A.; Broglia, R.; Favini, B. A Second Order Godunov–Type Scheme for Naval Hydrodynamics. In Godunov Methods: Theory and Applications; Kluwer Academic/Plenum Publishers: Dordrecht, the Netherlands, 2001; pp. 253–261. [Google Scholar]
- Phillips, W.F.; Anderson, E.A.; Kelly, Q.J. Predicting the Contribution of Running Propellers to Aircraft Stability Derivatives. J. Aircraft 2003, 40, 1107–1114. [Google Scholar] [CrossRef]
- Amini, H.; Sileo, L.; Steen, S. Numerical calculations of propeller shaft loads on azimuth propulsors in oblique inflow. J. Mar. Sci. Technol. 2012, 17, 403–421. [Google Scholar] [CrossRef]
- Jeong, J.; Hussain, F. On the identification of a vortex. J. Fluid Mech. 1995, 285, 69–94. [Google Scholar] [CrossRef]
- Carlton, J. Marine Propellers and Propulsion, 2nd ed.; Butterworth-Heinemann: New York, NY, USA, 2006. [Google Scholar]
- Kerwin, S.; Hadler, J. Principles of Naval Architecture ‘Series’-Propulsion, 1st ed.; SNAME: New York, NY, USA, 2010. [Google Scholar]
- Krasilinov, V.; Zhang, Z.; Hong, F. Nominal vs Effective Wake Fields and their influence on Propeller Performance. In Proceedings of the First International Symposium on Marine Propulsors (SMP’09), Trondheim, Norway, 22–24 June 2009. [Google Scholar]
Figure 1.
(a) hull and appendage geometry (b) geometry considered in the computation.
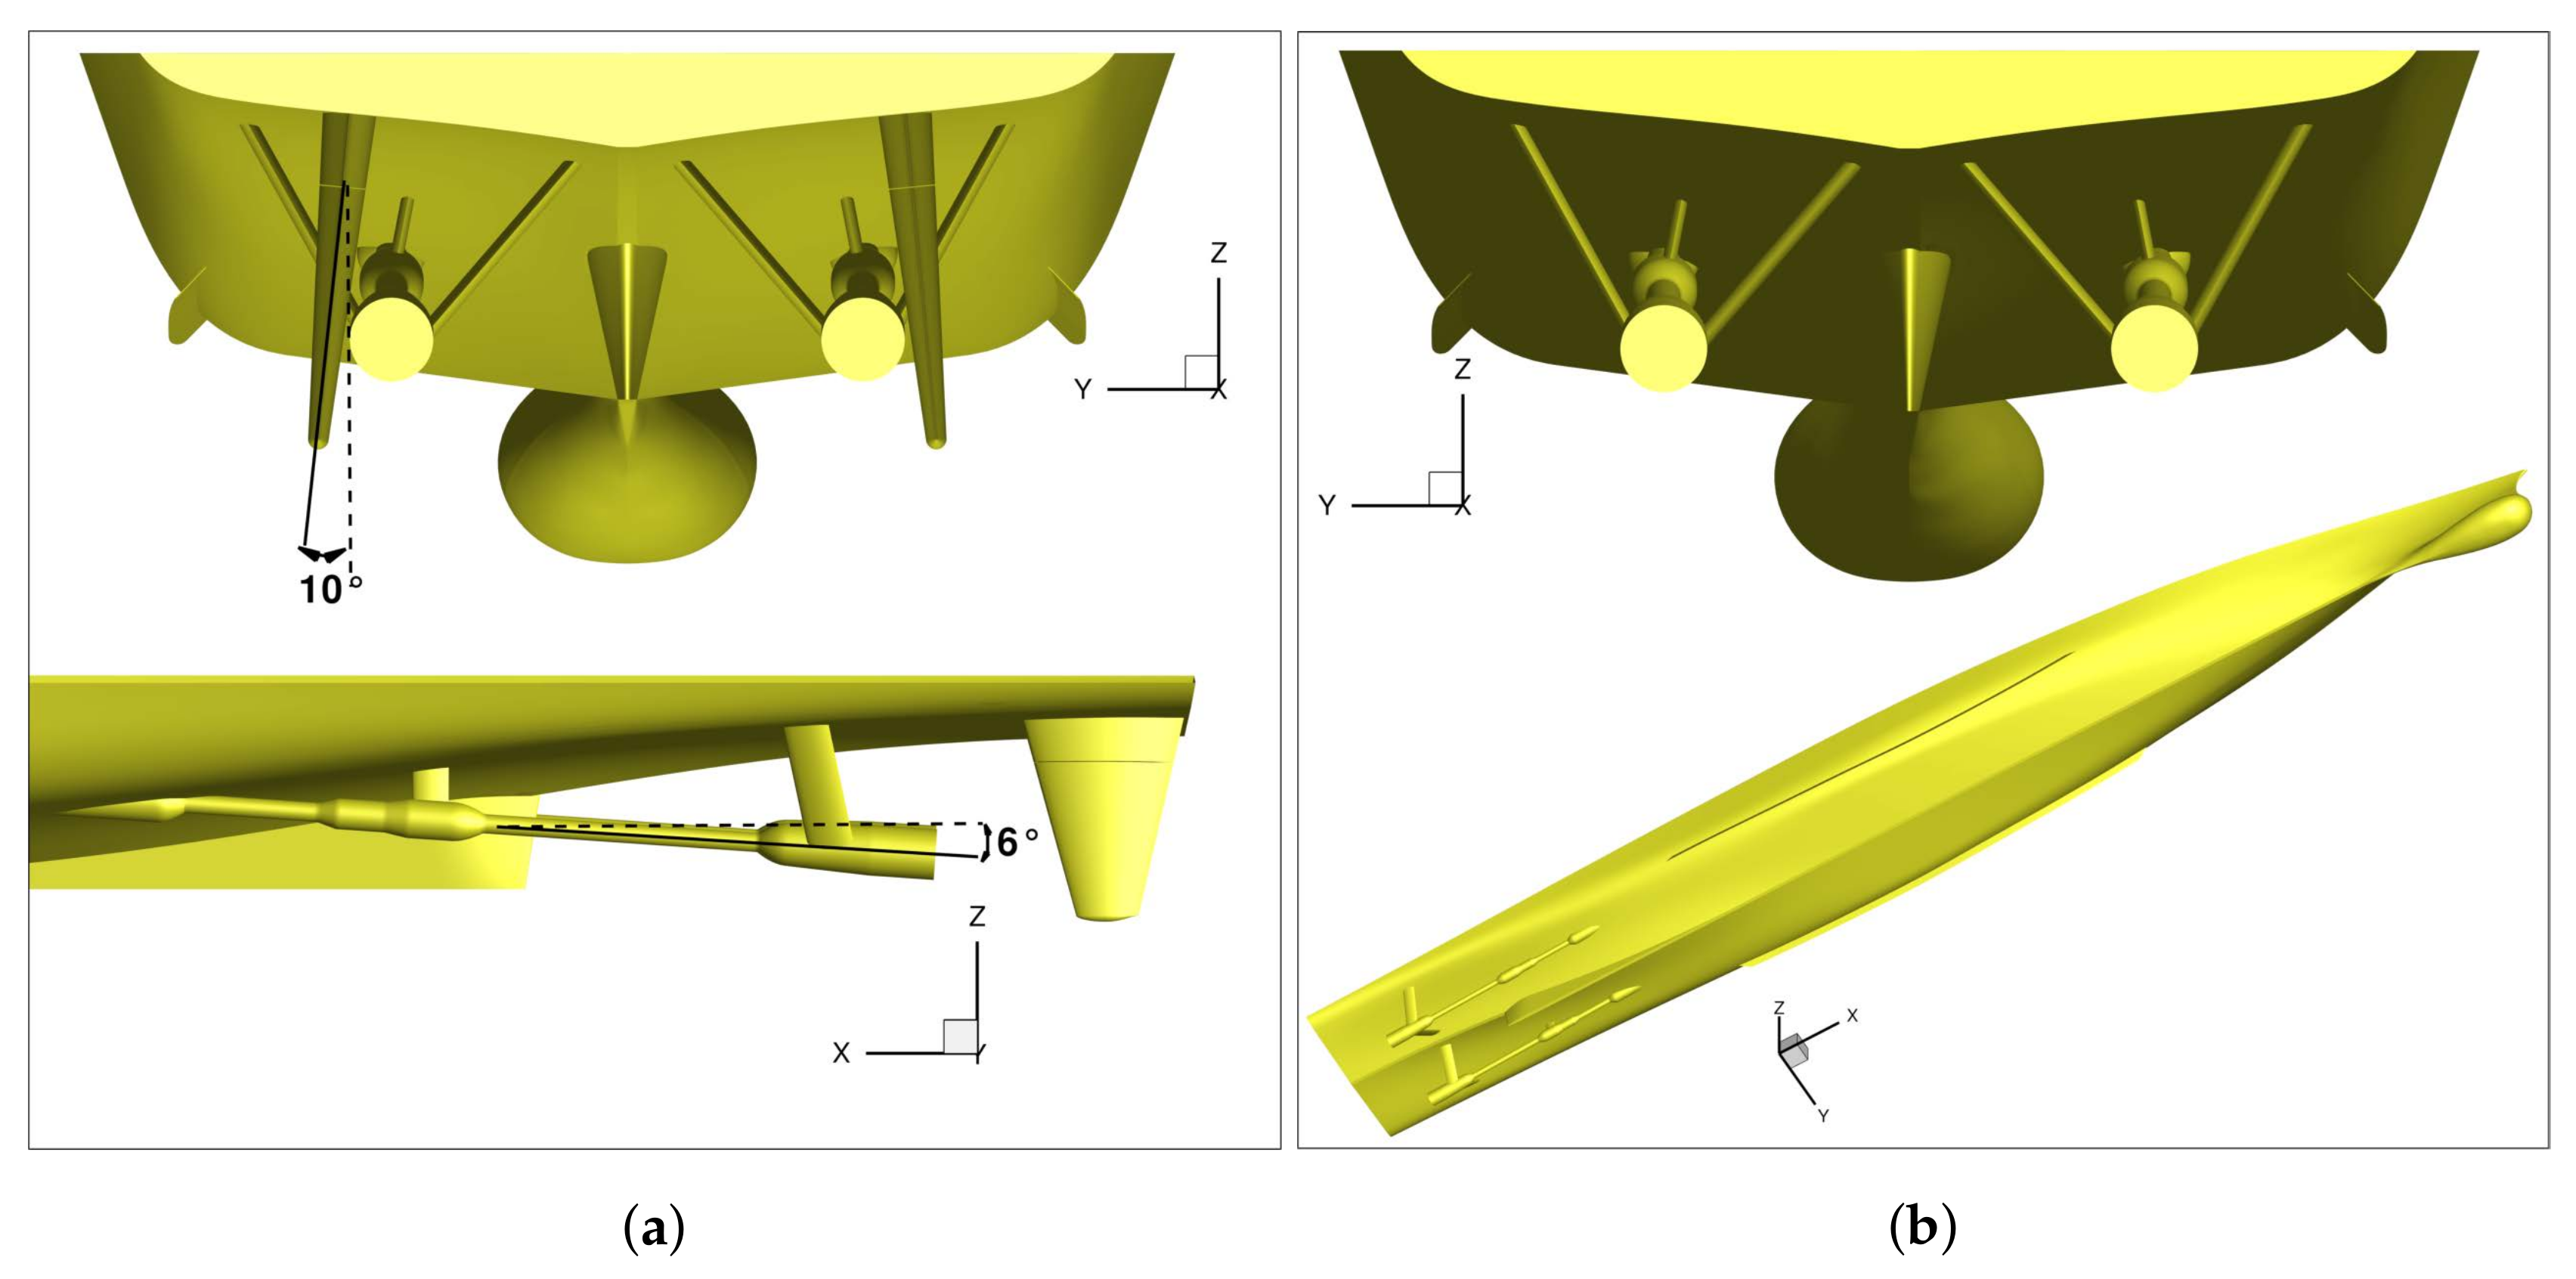
Figure 2.
(a) sketch of the instrumented model. (b) radial force transducer.

Figure 3.
(a) installation at the tail shaft (b) final configuration.
Figure 4.
(a) Topology. (b) Mesh.
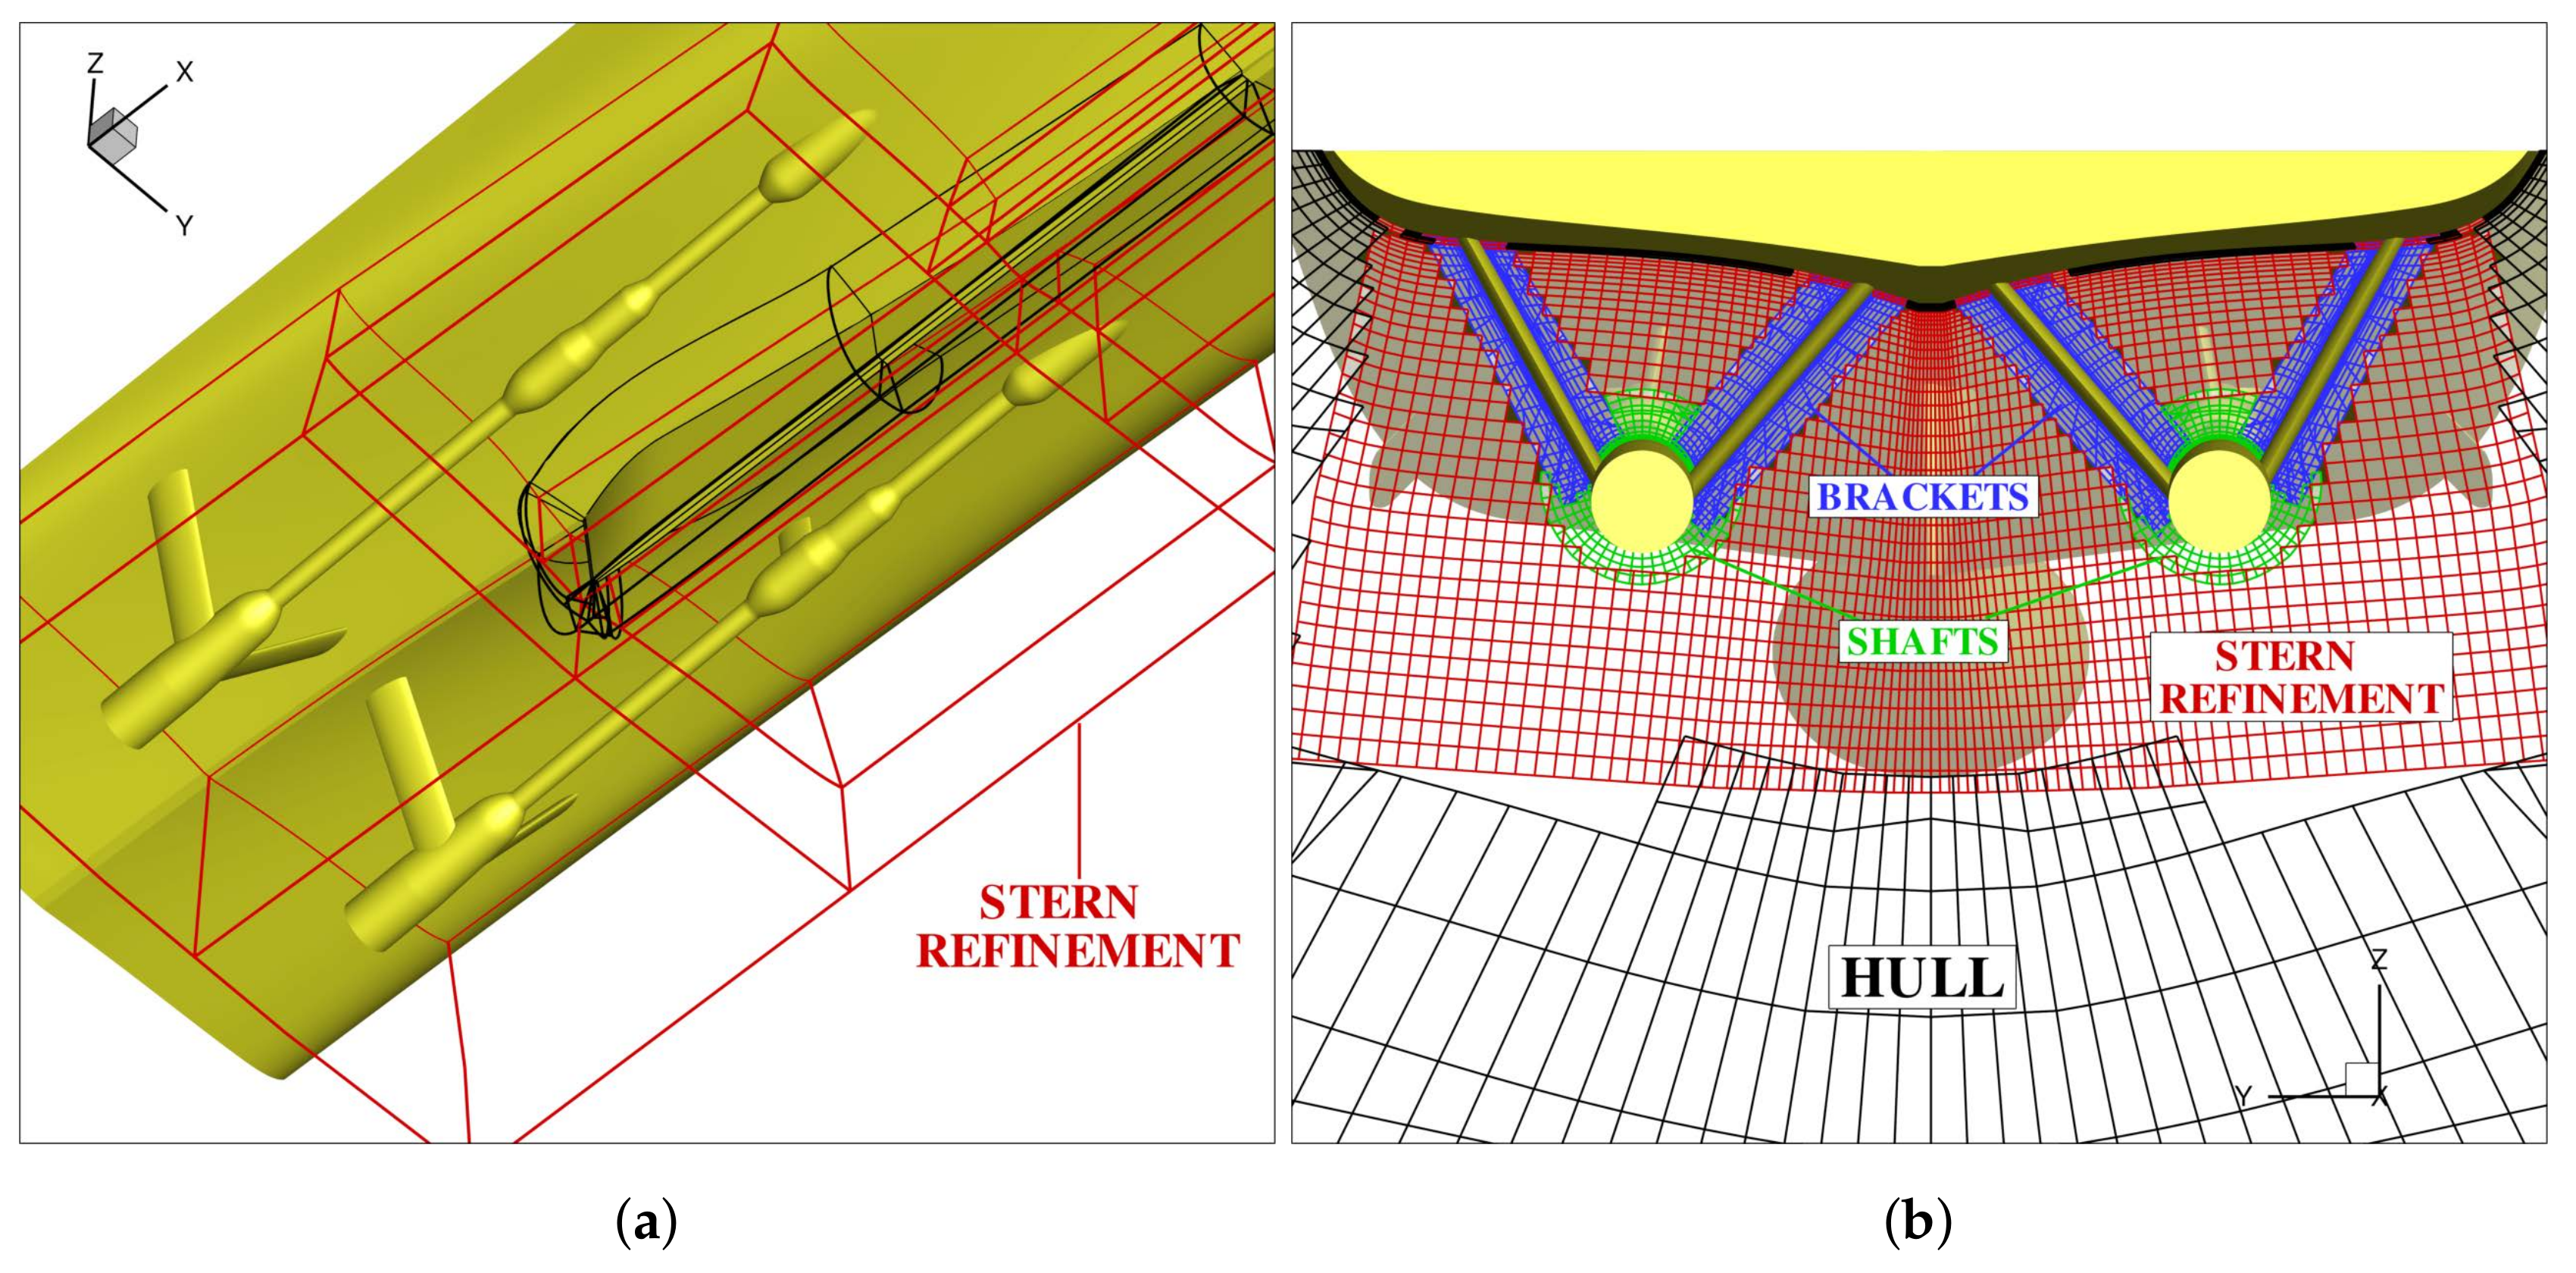
Figure 5.
(a) hub and blade reference system. (b) Inflow and forces generated on a generic blade section.
Figure 5.
(a) hub and blade reference system. (b) Inflow and forces generated on a generic blade section.
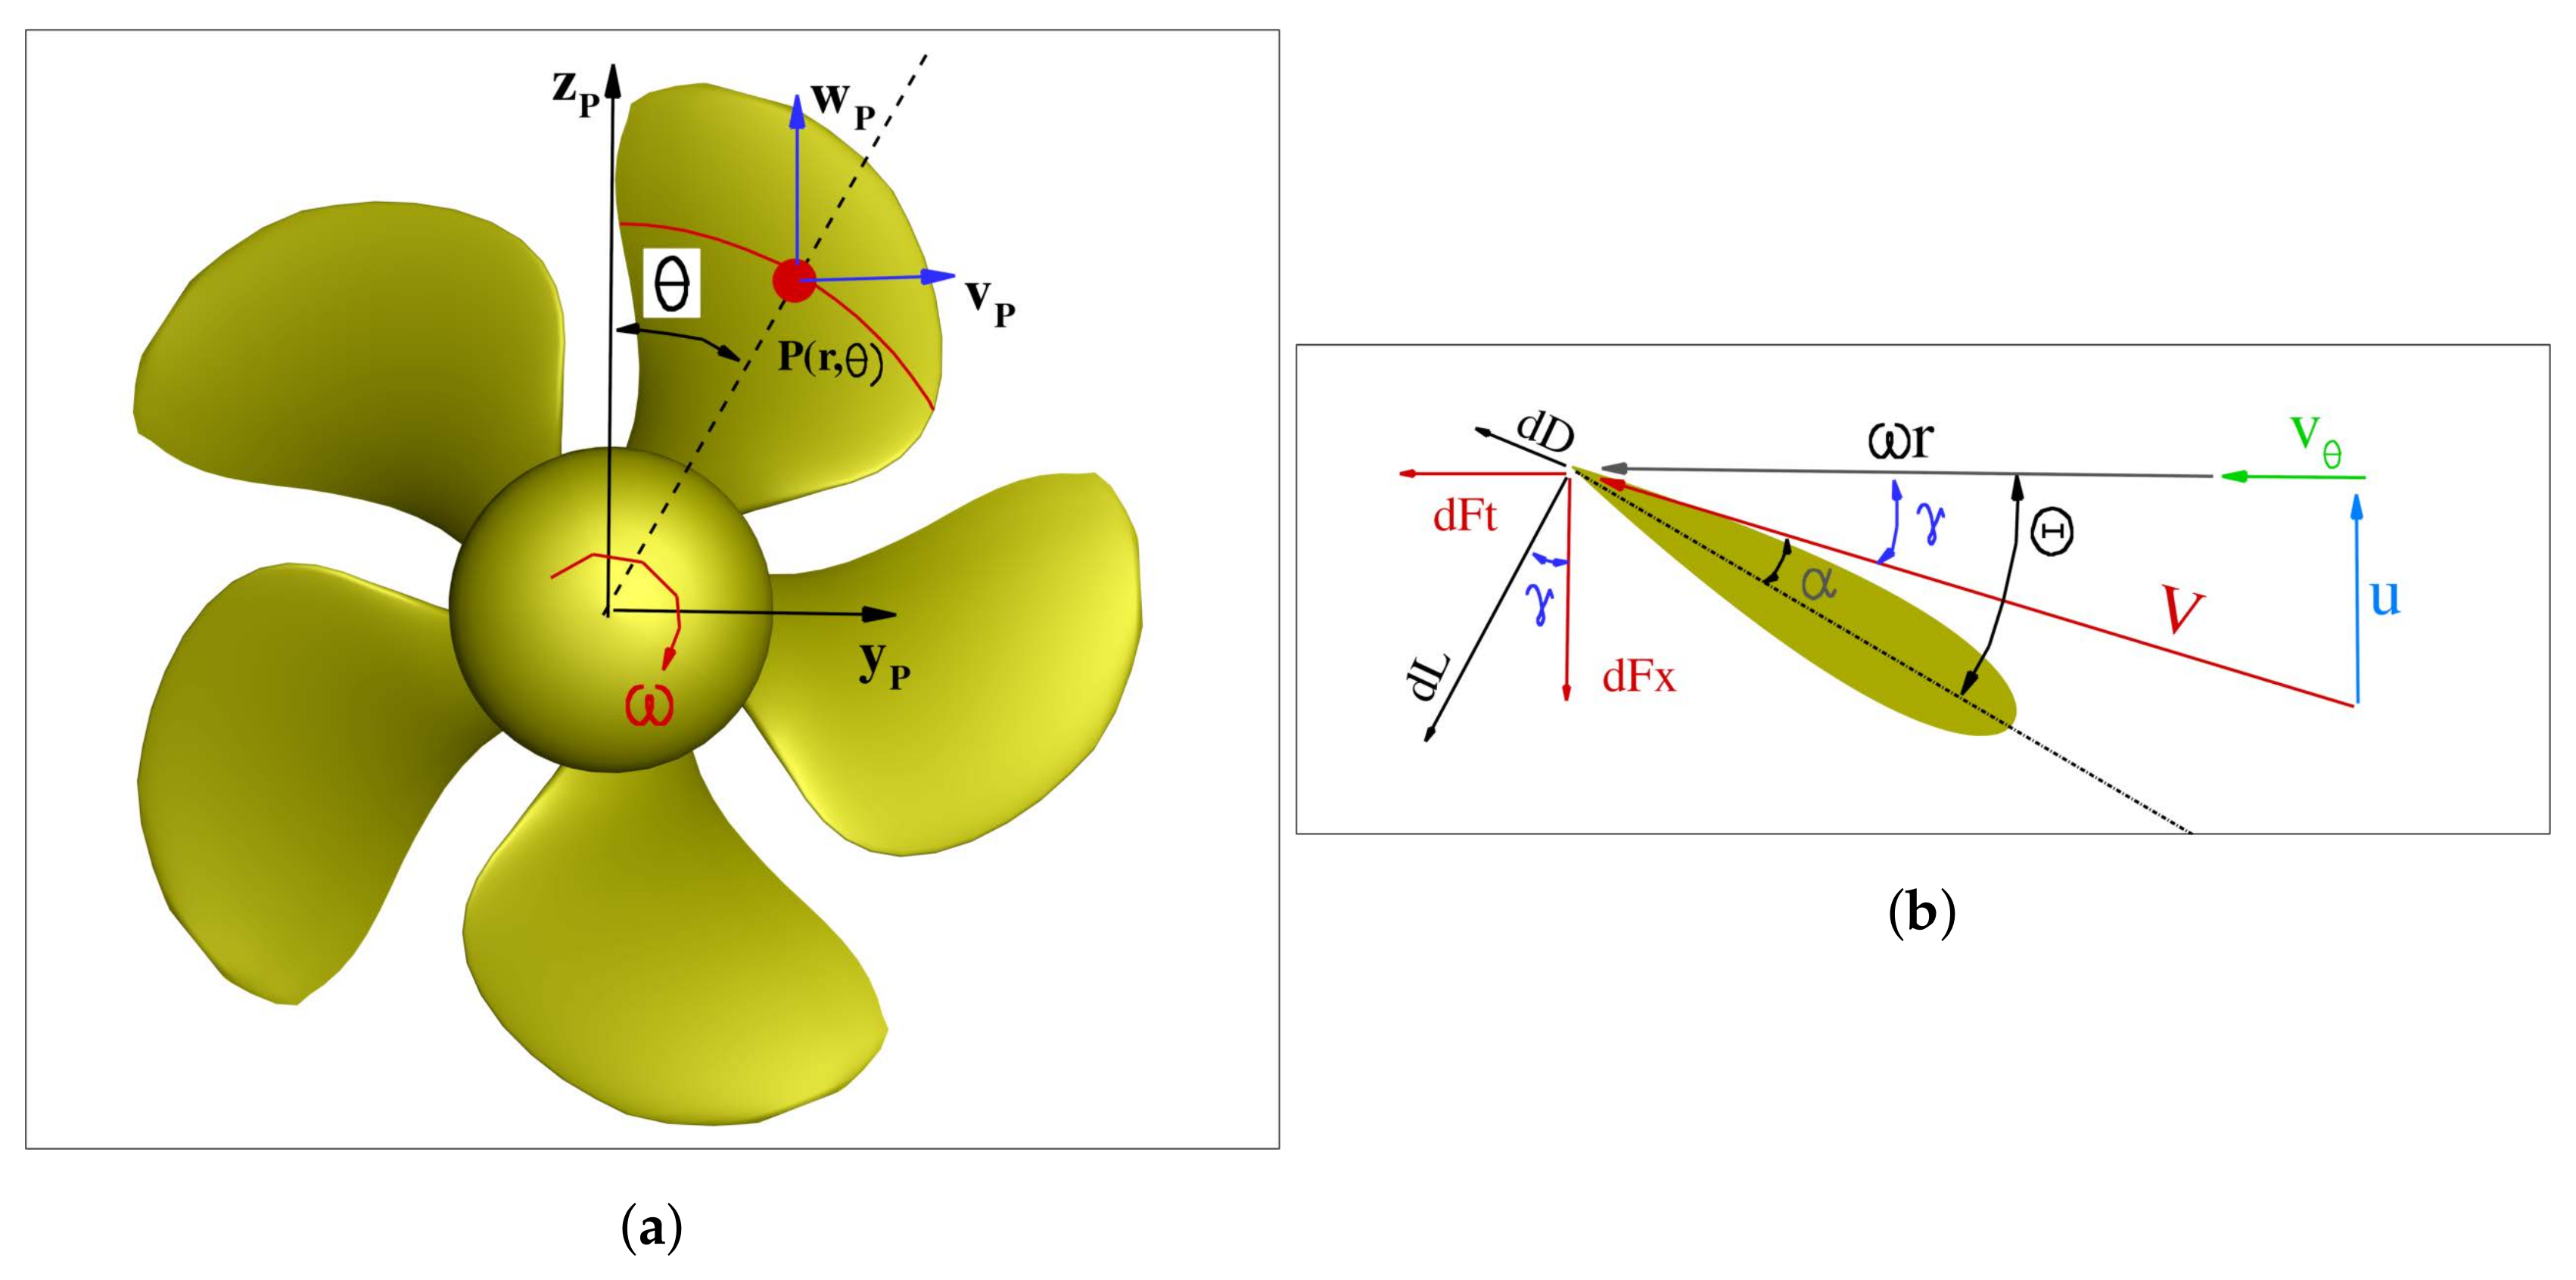
Figure 6.
Solution algorithm for the blade element solvers.

Figure 7.
(a) Thrust. (b) Torque. (c) Side force. (d) Vertical force.

Figure 8.
Nominal wake during approach (rectilinear motion).
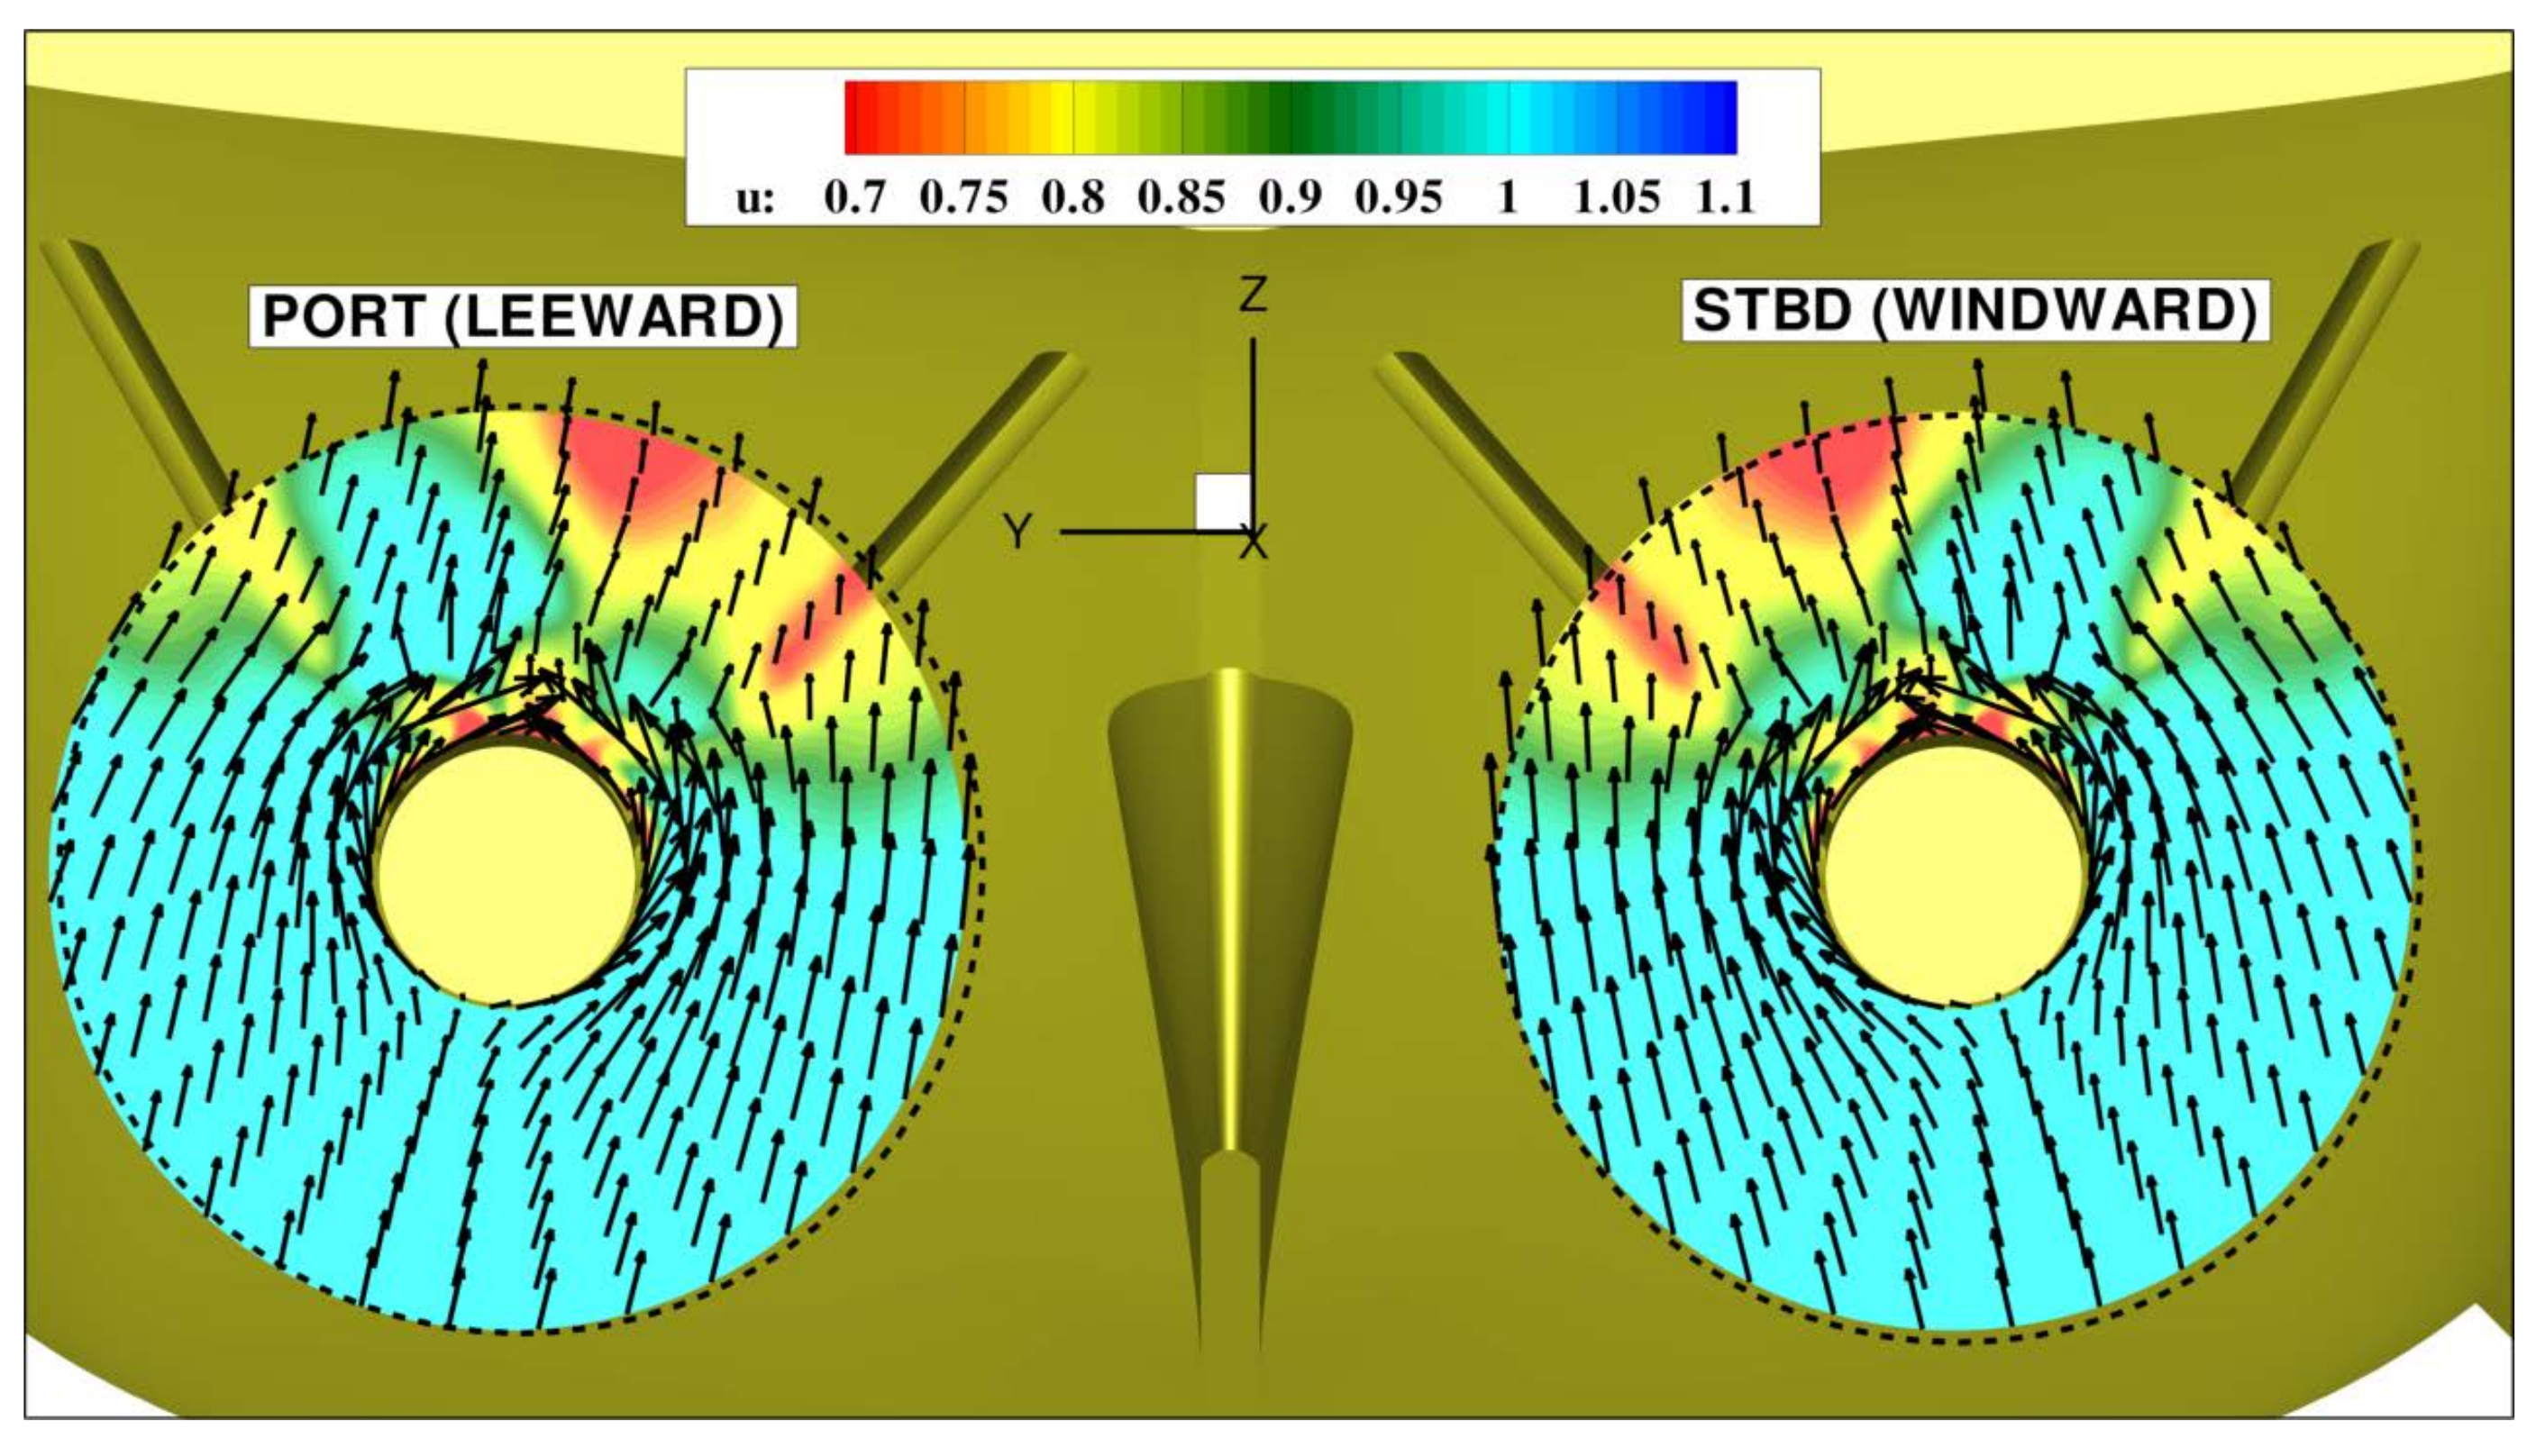
Figure 9.
(a) Nominal wake during turn at . (b) Vortex structures.

Figure 10.
(a) Nominal wake during turn at . (b) Vortex structures.
Figure 11.
Thrust (a) Internal propeller. (b) External propeller.
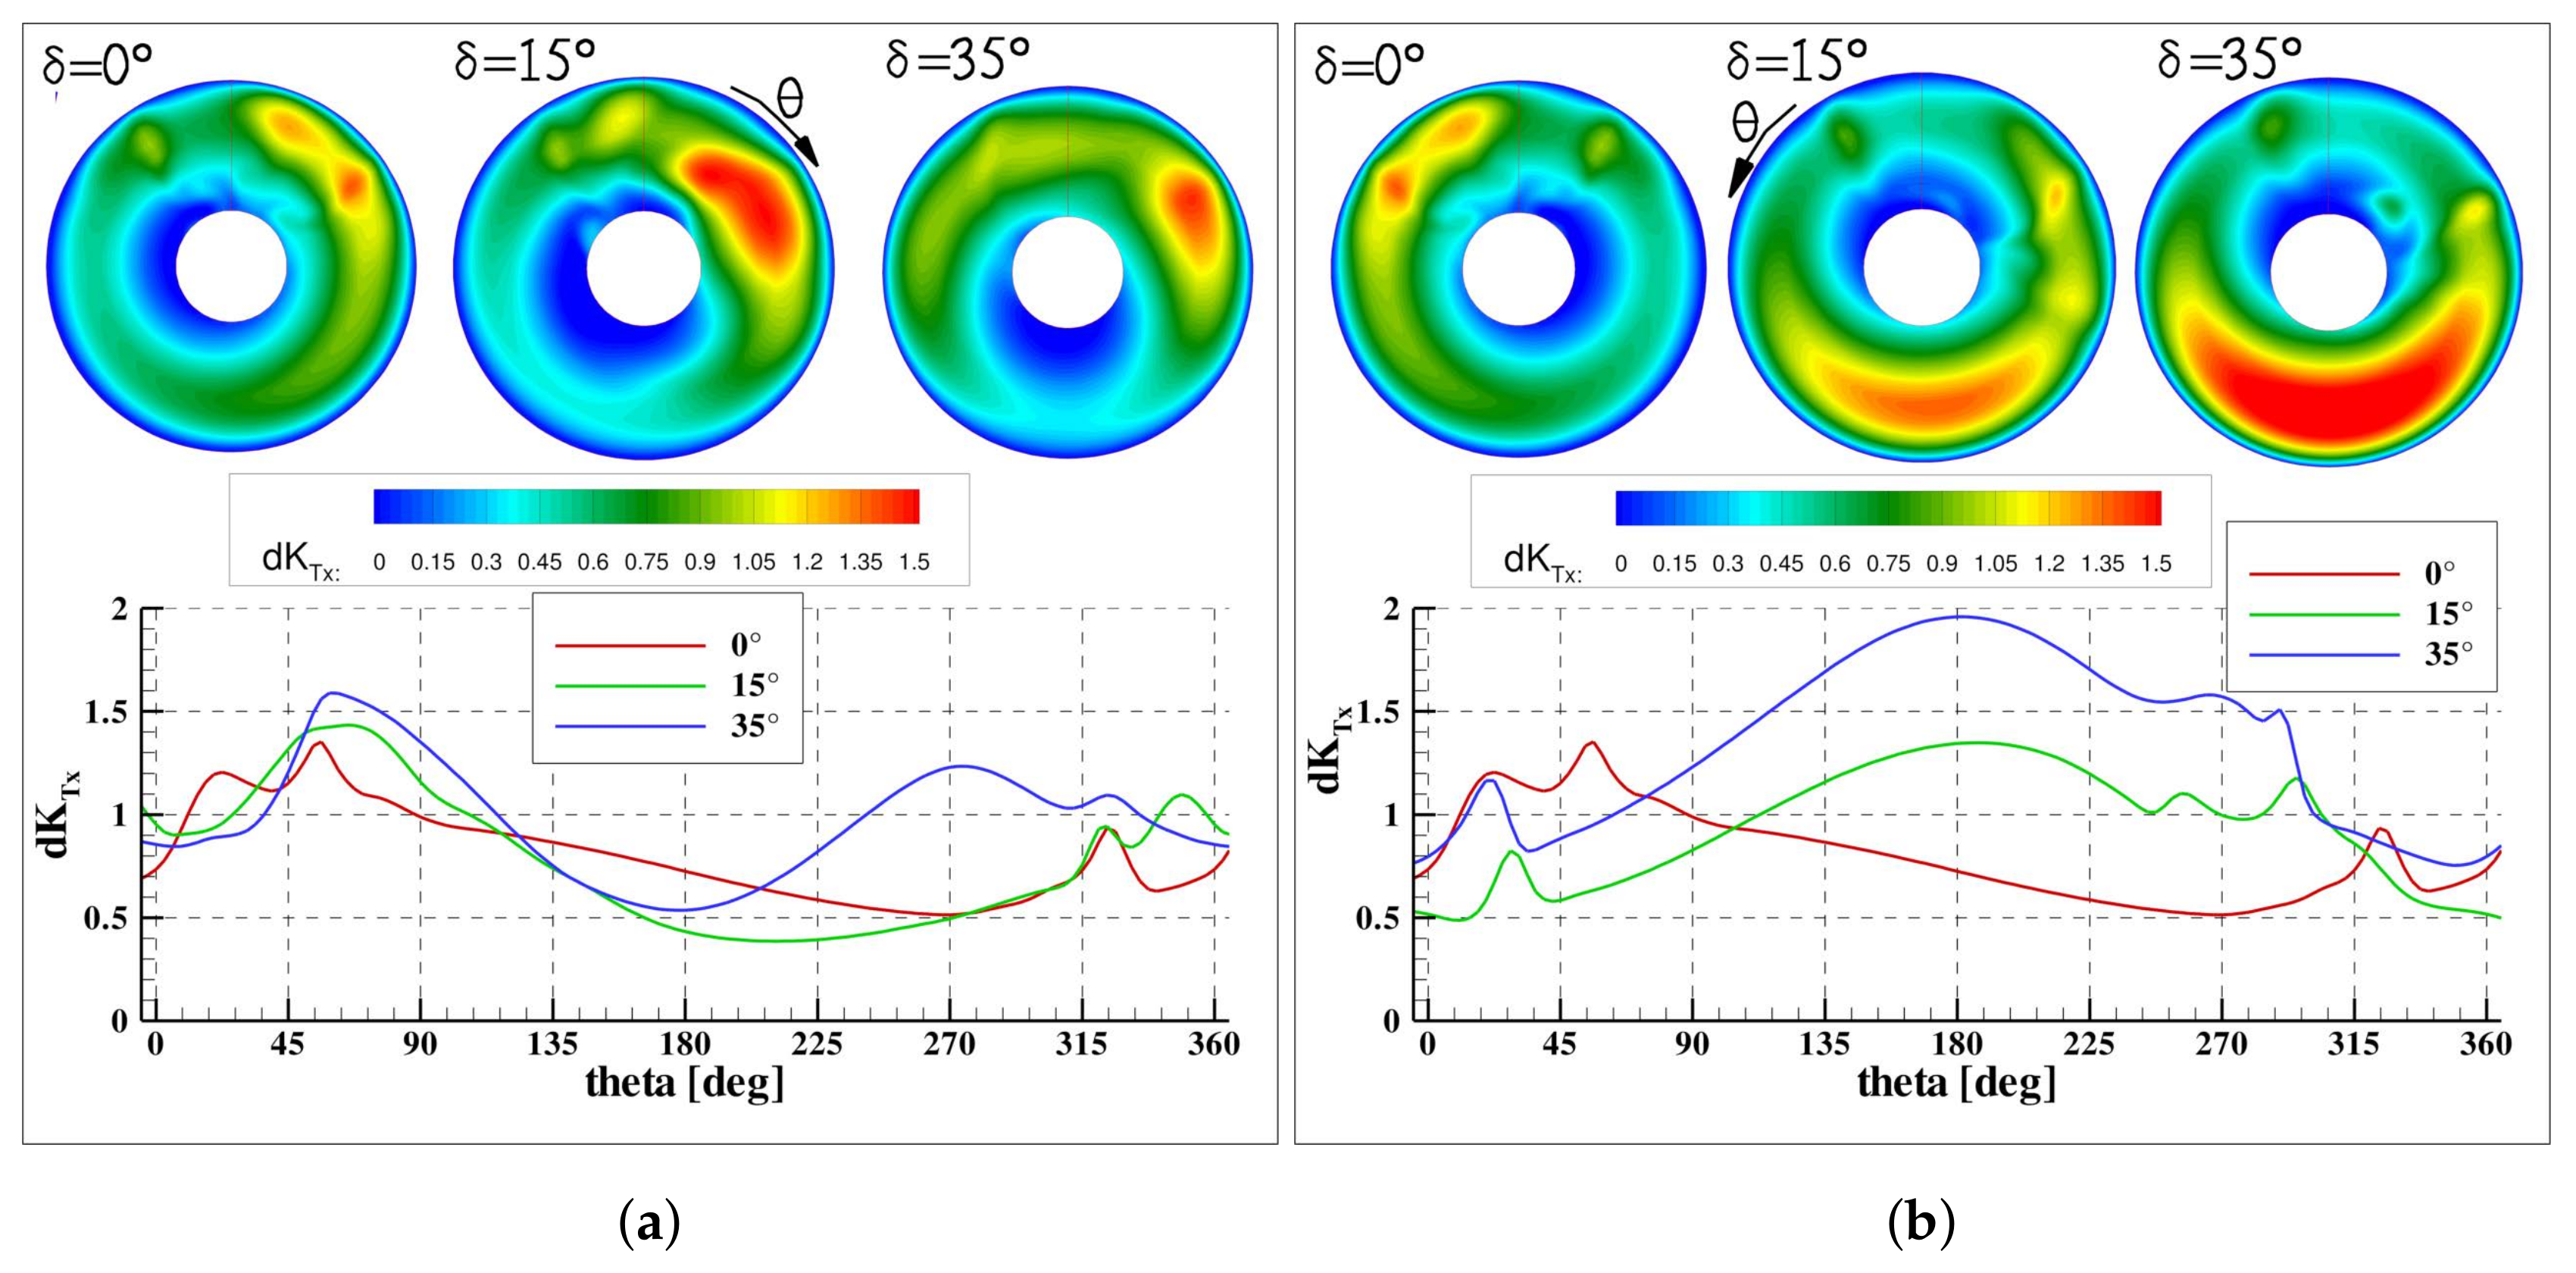
Figure 12.
Side force (a) Internal propeller. (b) External propeller.
Figure 13.
Vertical force (a) Internal propeller. (b) External propeller.
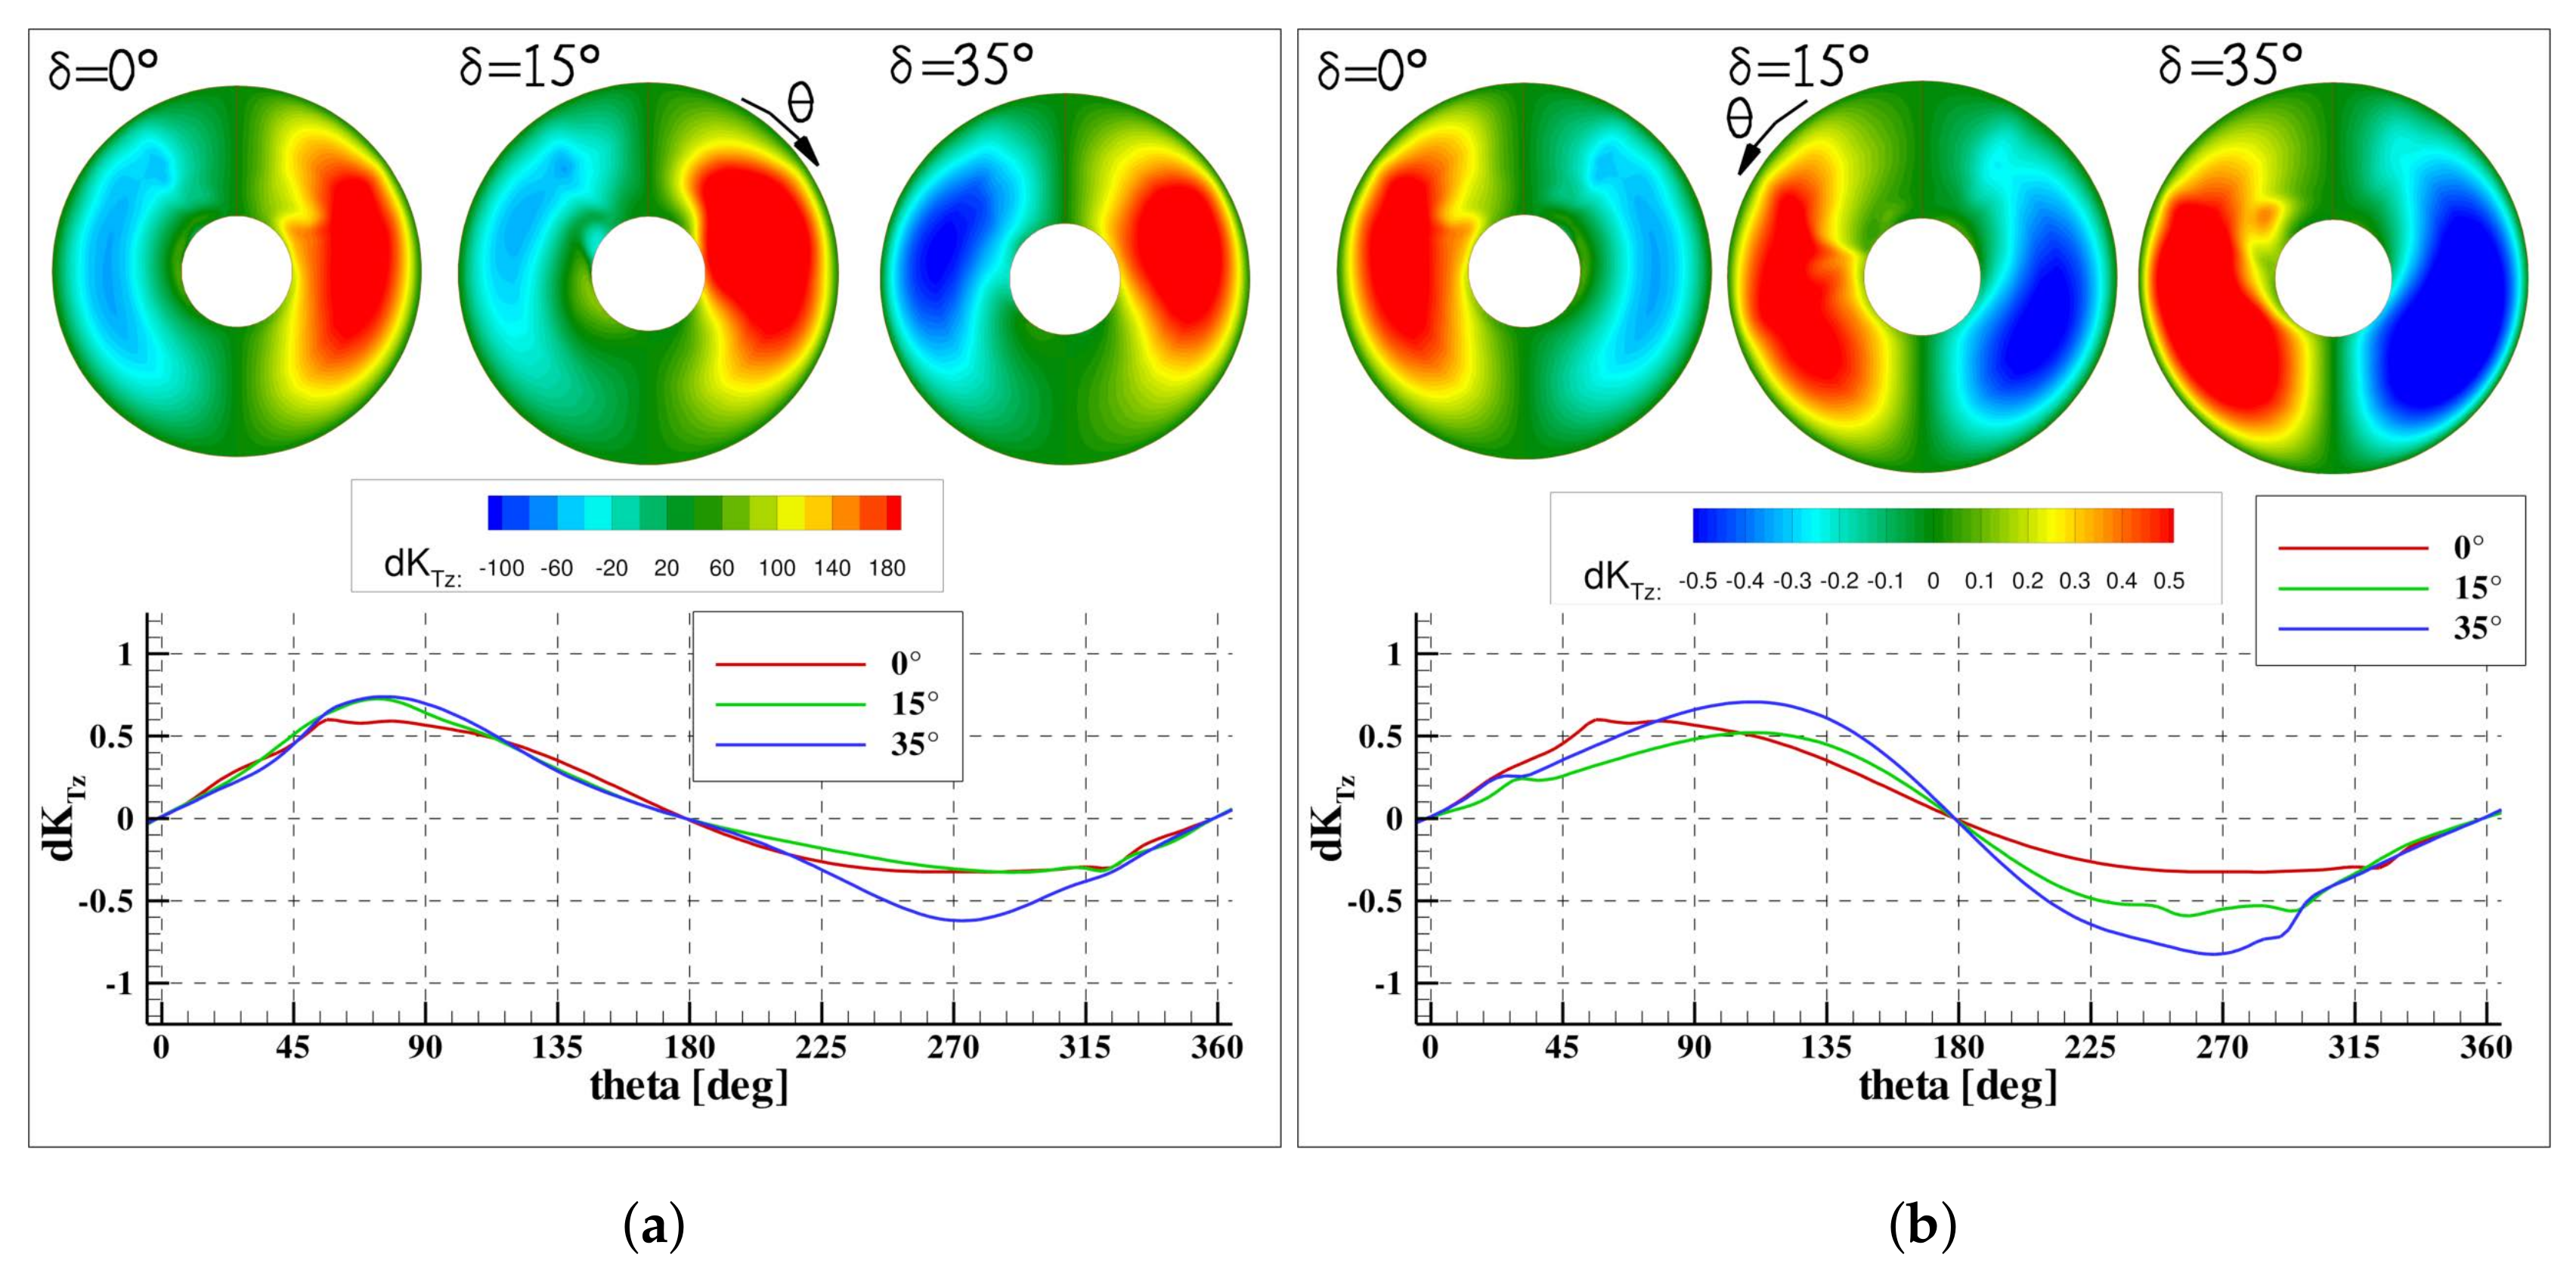
Figure 14.
(a) imbalance of thrust on the upper/lower half of the disk. (b) imbalance of thrust on the left/right half of the disk.
Figure 14.
(a) imbalance of thrust on the upper/lower half of the disk. (b) imbalance of thrust on the left/right half of the disk.
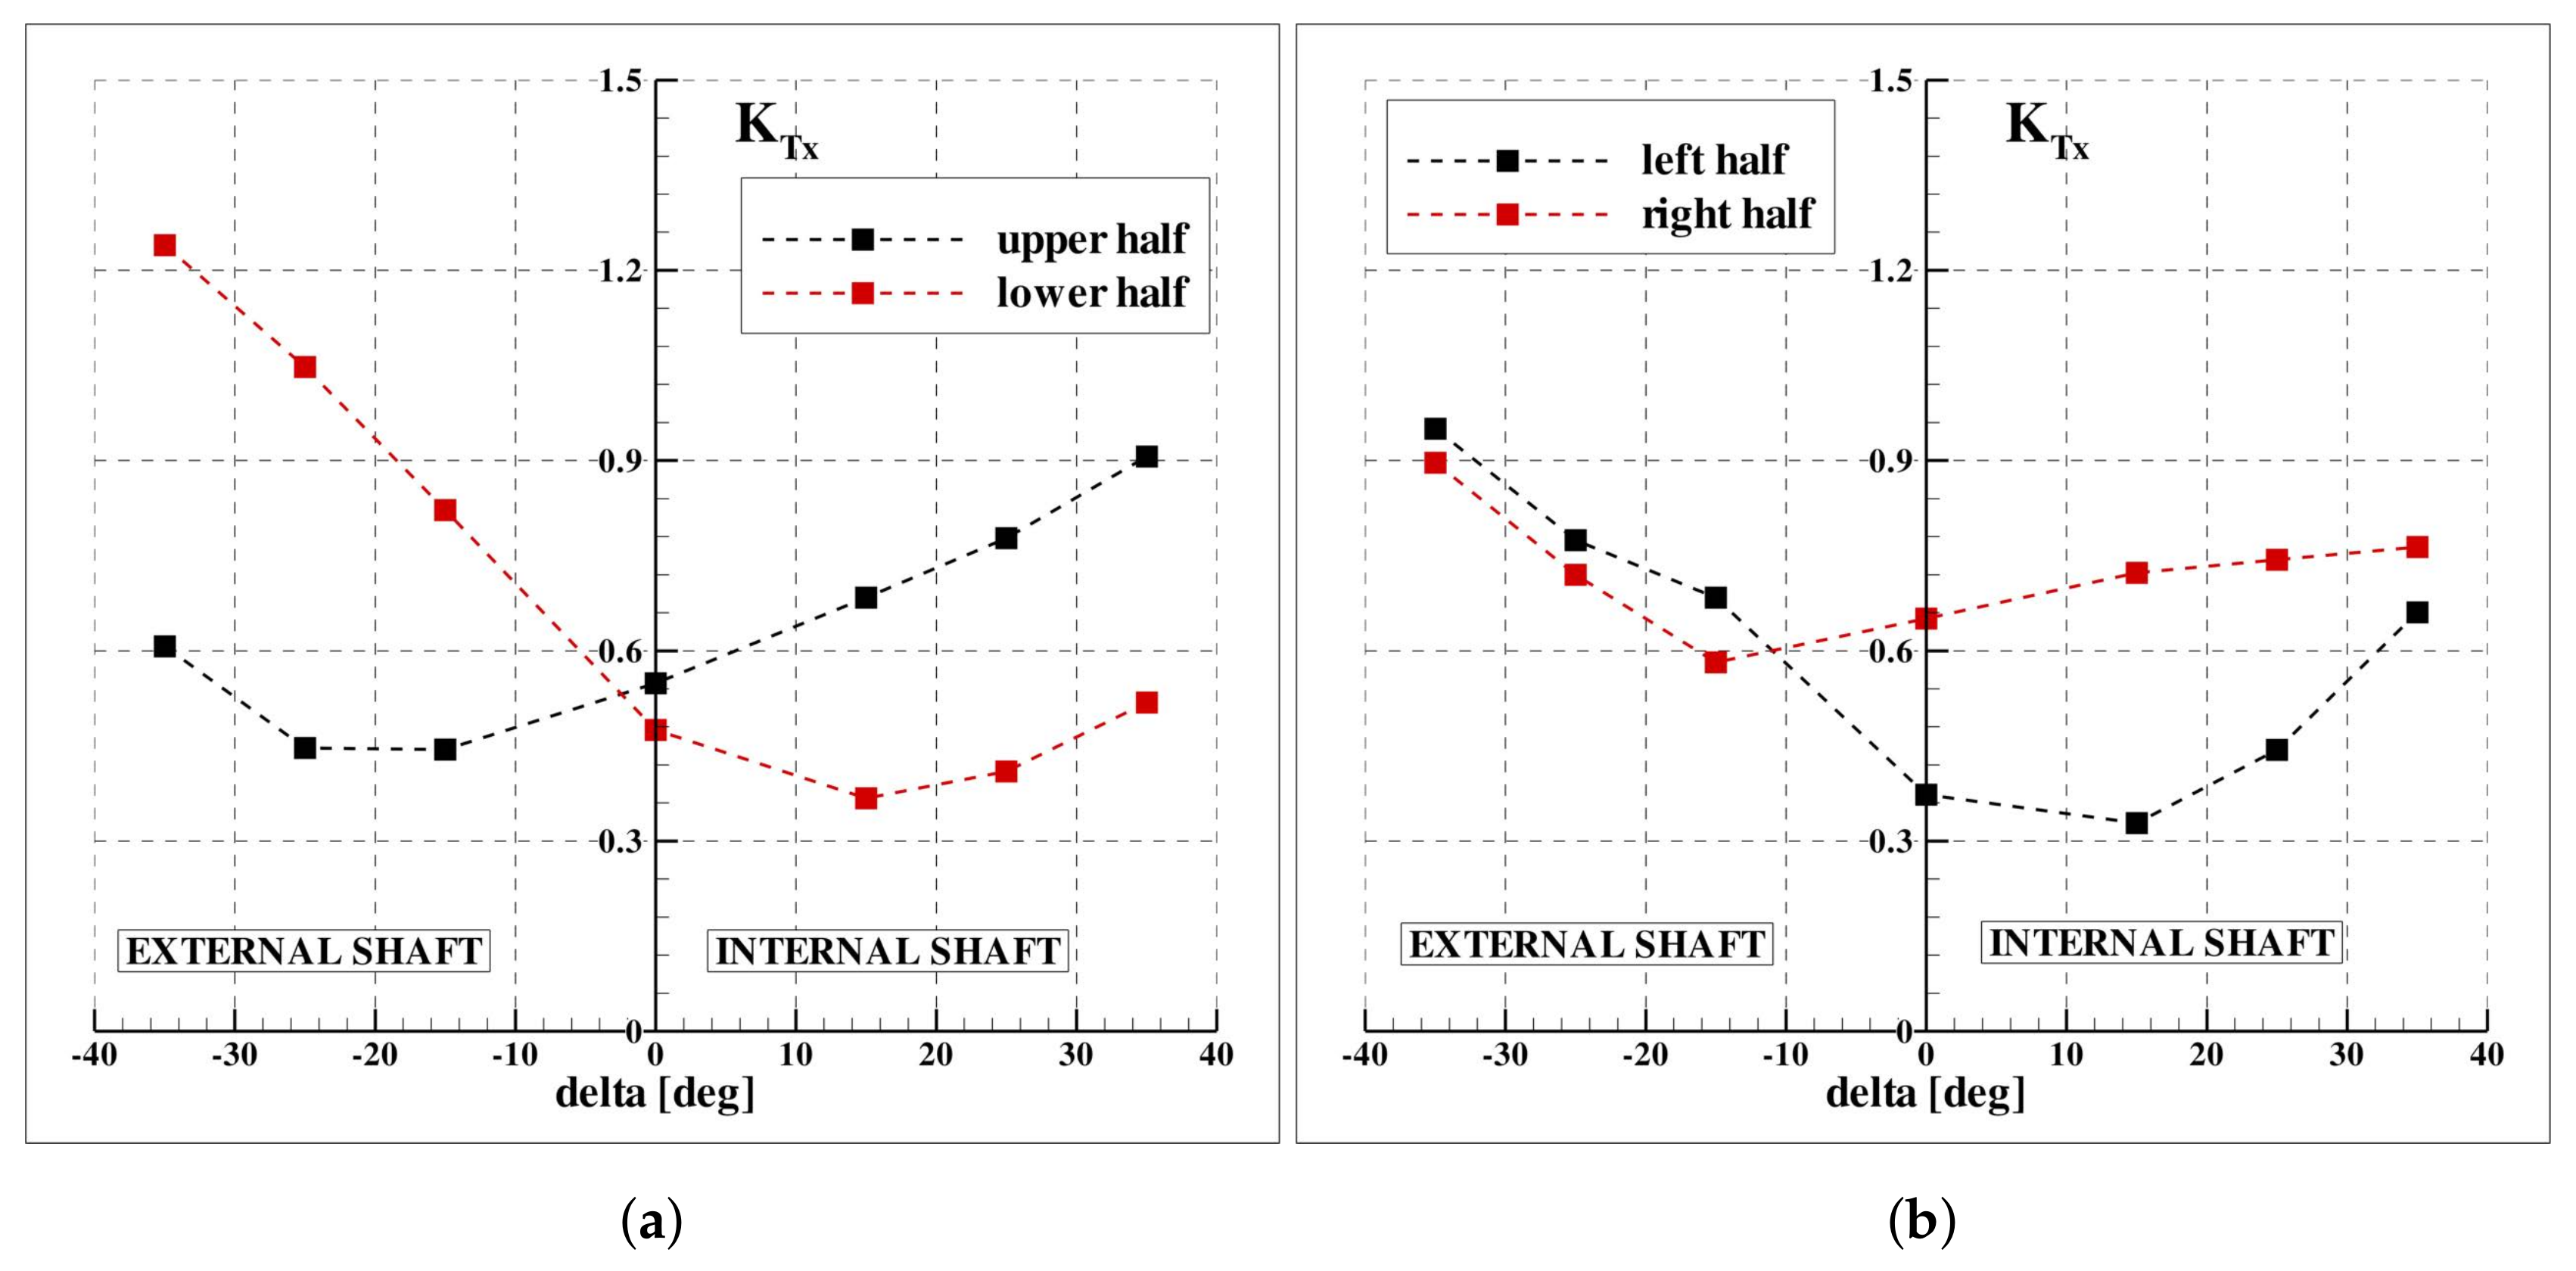
Figure 15.
(a) imbalance of side force on the upper/lower half of the disk. (b) imbalance of vertical force on the left/right half of the disk.
Figure 15.
(a) imbalance of side force on the upper/lower half of the disk. (b) imbalance of vertical force on the left/right half of the disk.
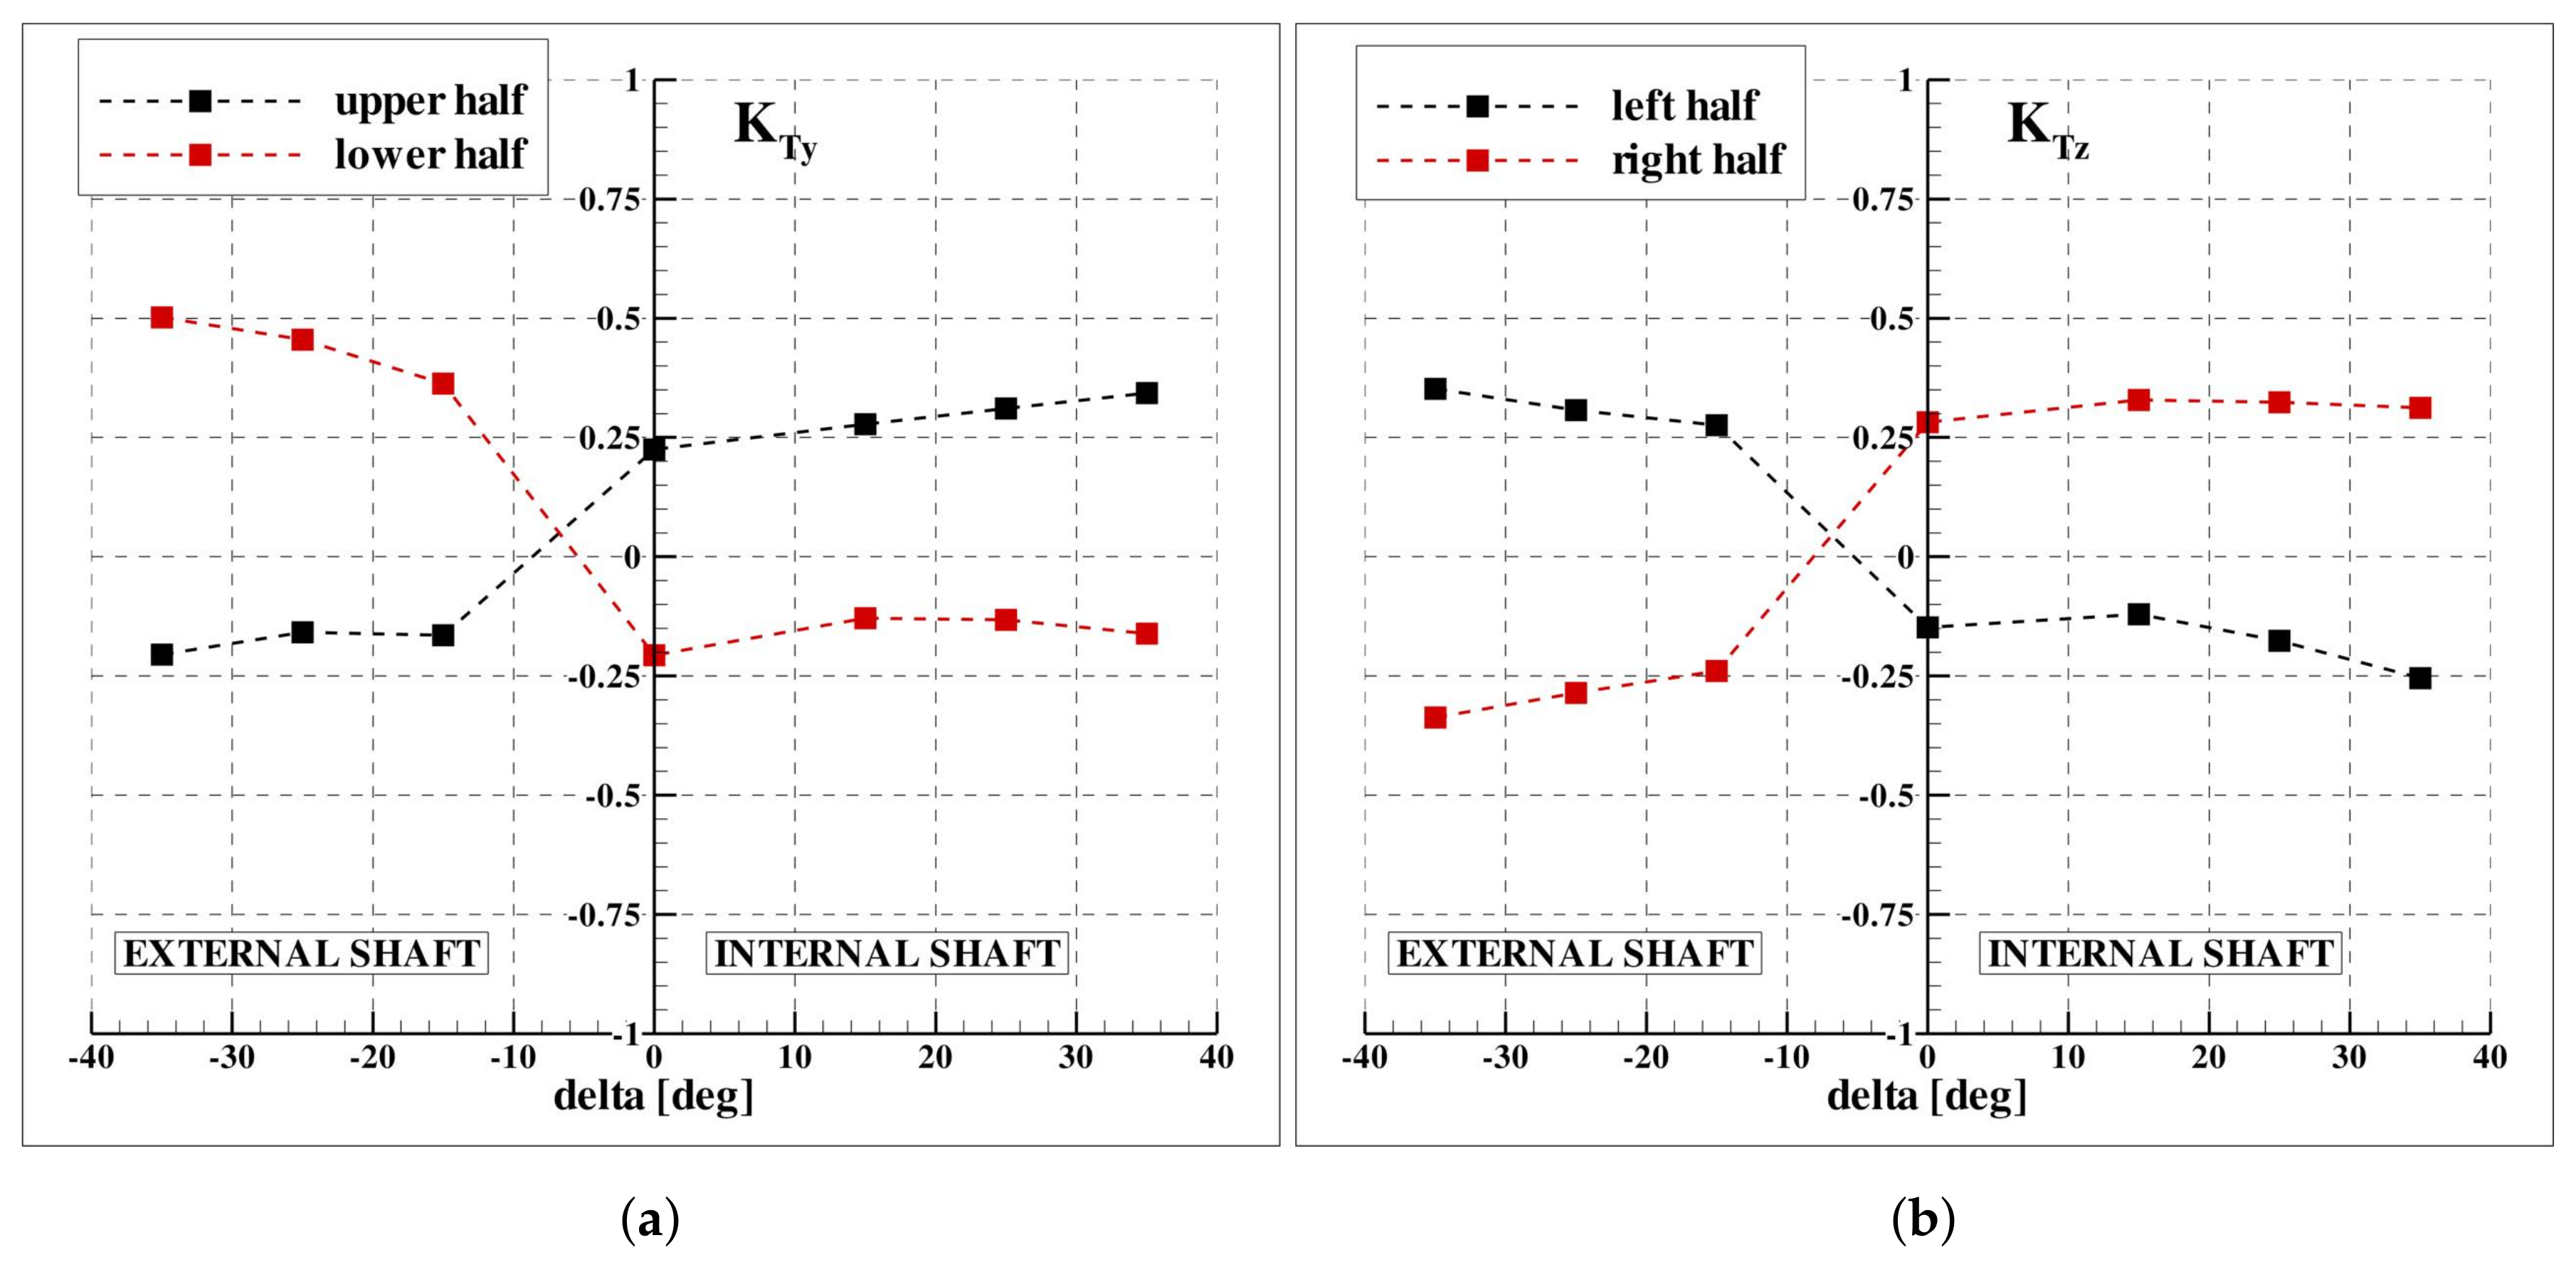
Figure 16.
Ratio between forces and moments in cavitating and non cavitating conditions. (a) forces. (b) moments.
Figure 16.
Ratio between forces and moments in cavitating and non cavitating conditions. (a) forces. (b) moments.

Figure 17.
Cavitation extent, solution via the linearized theory. (a) , internal propeller. (b) , external propeller.
Figure 17.
Cavitation extent, solution via the linearized theory. (a) , internal propeller. (b) , external propeller.

Figure 18.
Correlation between blade loads and cavitation volume. (a) , internal propeller. (b) , external propeller.
Figure 18.
Correlation between blade loads and cavitation volume. (a) , internal propeller. (b) , external propeller.

Figure 19.
(a) Propeller with hub transducer. (b) Behind–hull configuration.


Table 1.
Geometric details of the model.
| HULL | |
|---|---|
| L/B | 7.5 |
| B/T | 3.25 |
| 0.5 | |
| PROPELLER | |
| N. blades, Z | 5 |
| P/D, Pitch to diam. ratio | 1.35 |
| Expanded area ratio | 0.79 |
| Hub ratio | 0.25 |
Table 2.
Test matrix of the experiments.
| Free Running Tests | ||
|---|---|---|
| Test | Speed | Rudder Angle [deg] |
| self–propulsion | = 0 | |
| turning circle (with pull–out) | = 0.218, 0.31 | = , , |
| turning circle (with pull–out) | = 0.35 | = |
| zig–zag | = 0.218, 0.31, 0.35 | = , , |
Table 3.
Details of grid cells distribution.
| Domain | Cells | Percent |
|---|---|---|
| HULL | 2.81 M | 27.52% |
| BILGE KEELS | 1.42 M | 13.90% |
| PROP. SHAFT | 1.50 M | 14.69% |
| FORWARD BRACKETS | 0.33 M | 3.20% |
| ASTERN BRACKETS | 1.35 M | 13.20% |
| SKEG | 0.80 M | 16.70% |
| STERN REFINEMENT | 1.54 M | 7.80% |
| BACKGROUND BUFFER | 0.36 M | 3.50% |
| BACKGROUND | 0.11 M | 0.10% |
| TOTAL | 10.21 M |
Table 4.
Turning circle parameters.
| Free Running Tests | ||
|---|---|---|
| Rudder | Yaw Rate | Drift Angle [deg] |
| 0.236 | 7.5 | |
| 0.333 | 12.5 | |
| 0.363 | 13.5 | |
© 2018 by the authors. Licensee MDPI, Basel, Switzerland. This article is an open access article distributed under the terms and conditions of the Creative Commons Attribution (CC BY) license (http://creativecommons.org/licenses/by/4.0/).
Share and Cite
MDPI and ACS Style
Ortolani, F.; Dubbioso, G.; Muscari, R.; Mauro, S.; Di Mascio, A. Experimental and Numerical Investigation of Propeller Loads in Off-Design Conditions. J. Mar. Sci. Eng. 2018, 6, 45. https://doi.org/10.3390/jmse6020045
AMA Style
Ortolani F, Dubbioso G, Muscari R, Mauro S, Di Mascio A. Experimental and Numerical Investigation of Propeller Loads in Off-Design Conditions. Journal of Marine Science and Engineering. 2018; 6(2):45. https://doi.org/10.3390/jmse6020045
Chicago/Turabian StyleOrtolani, Fabrizio, Giulio Dubbioso, Roberto Muscari, Salvatore Mauro, and Andrea Di Mascio. 2018. "Experimental and Numerical Investigation of Propeller Loads in Off-Design Conditions" Journal of Marine Science and Engineering 6, no. 2: 45. https://doi.org/10.3390/jmse6020045
Note that from the first issue of 2016, this journal uses article numbers instead of page numbers. See further details here.