Article

Integrated System Design for a Large Wind Turbine Supported on a Moored Semi-Submersible Platform

1
Department of Civil, Architectural and Environmental Engineering, University of Texas at Austin, 301 E. Dean Keeton St., Austin, TX 78712, USA
2
Department of Mechanical Engineering, University of Texas at Dallas, Richardson, TX 75080, USA
3
Sandia National Laboratories, Albuquerque, NM 87185, USA
*
Author to whom correspondence should be addressed.
J. Mar. Sci. Eng. 2018, 6(1), 9; https://doi.org/10.3390/jmse6010009
Submission received: 3 September 2017 / Revised: 12 December 2017 / Accepted: 3 January 2018 / Published: 12 January 2018
(This article belongs to the Special Issue Offshore Wind Structures)

Abstract

:
Over the past few decades, wind energy has emerged as an alternative to conventional power generation that is economical, environmentally friendly and, importantly, renewable. Specifically, offshore wind energy is being considered by a number of countries to harness the stronger and more consistent wind resource compared to that over land. To meet the projected “20% energy from wind by 2030” scenario that was announced in 2006, 54 GW of added wind energy capacity need to come from offshore according to a National Renewable Energy Laboratory (NREL) study. In this study, we discuss the development of a semi-submersible floating offshore platform with a catenary mooring system to support a very large 13.2-MW wind turbine with 100-m blades. An iterative design process is applied to baseline models with Froude scaling in order to achieve preliminary static stability. Structural dynamic analyses are performed to investigate the performance of the new model using a finite element method approach for the tower and a boundary integral equation (panel) method for the platform. The steady-state response of the system under uniform wind and regular waves is first studied to evaluate the performance of the integrated system. Response amplitude operators (RAOs) are computed in the time domain using white-noise wave excitation; this serves to highlight nonlinear, as well as dynamic characteristics of the system. Finally, selected design load cases (DLCs) and the stochastic dynamic response of the system are studied to assess the global performance for sea states defined by wind fields with turbulence and long-crested irregular waves.

1. Introduction

Over the last few decades, wind has emerged as an attractive alternative to conventional power generation and established itself as a major source of environmentally-friendly and inexhaustible renewable energy. Globally, 54,642 MW of new wind power generation capacity were added in 2016, according to global wind market statistics by the Global Wind Energy Council (GWEC) [1]. According to an American Wind Energy Association (AWEA) market report [2], by the end of the third quarter of 2017, the U.S. had an installed wind energy capacity of 84,944 MW compared with an 11,575 MW capacity in 2006 when the U.S. Department of Energy’s “20% energy from wind by 2030” projection scenario was announced. A National Renewable Energy Laboratory (NREL) cost study found that, to achieve the 20% target, 54 GW of added power generation capacity would need to come from offshore wind [3].
Several offshore wind turbine concepts have been proposed and studied both in the U.S. and in Europe that have explored the feasibility of utilizing offshore wind energy. In shallow to intermediate water depths up to 60 m, conventional bottom-supported monopiles, tripods and jacket structures can be deployed. In deeper waters, however, such as is the case for many U.S. offshore wind sites, floating platforms are more feasible and economical as support structures [4]. To date, three principal floating platform configurations, as shown in Figure 1, classified in terms of how these support structures achieve stability, have been considered. They are:
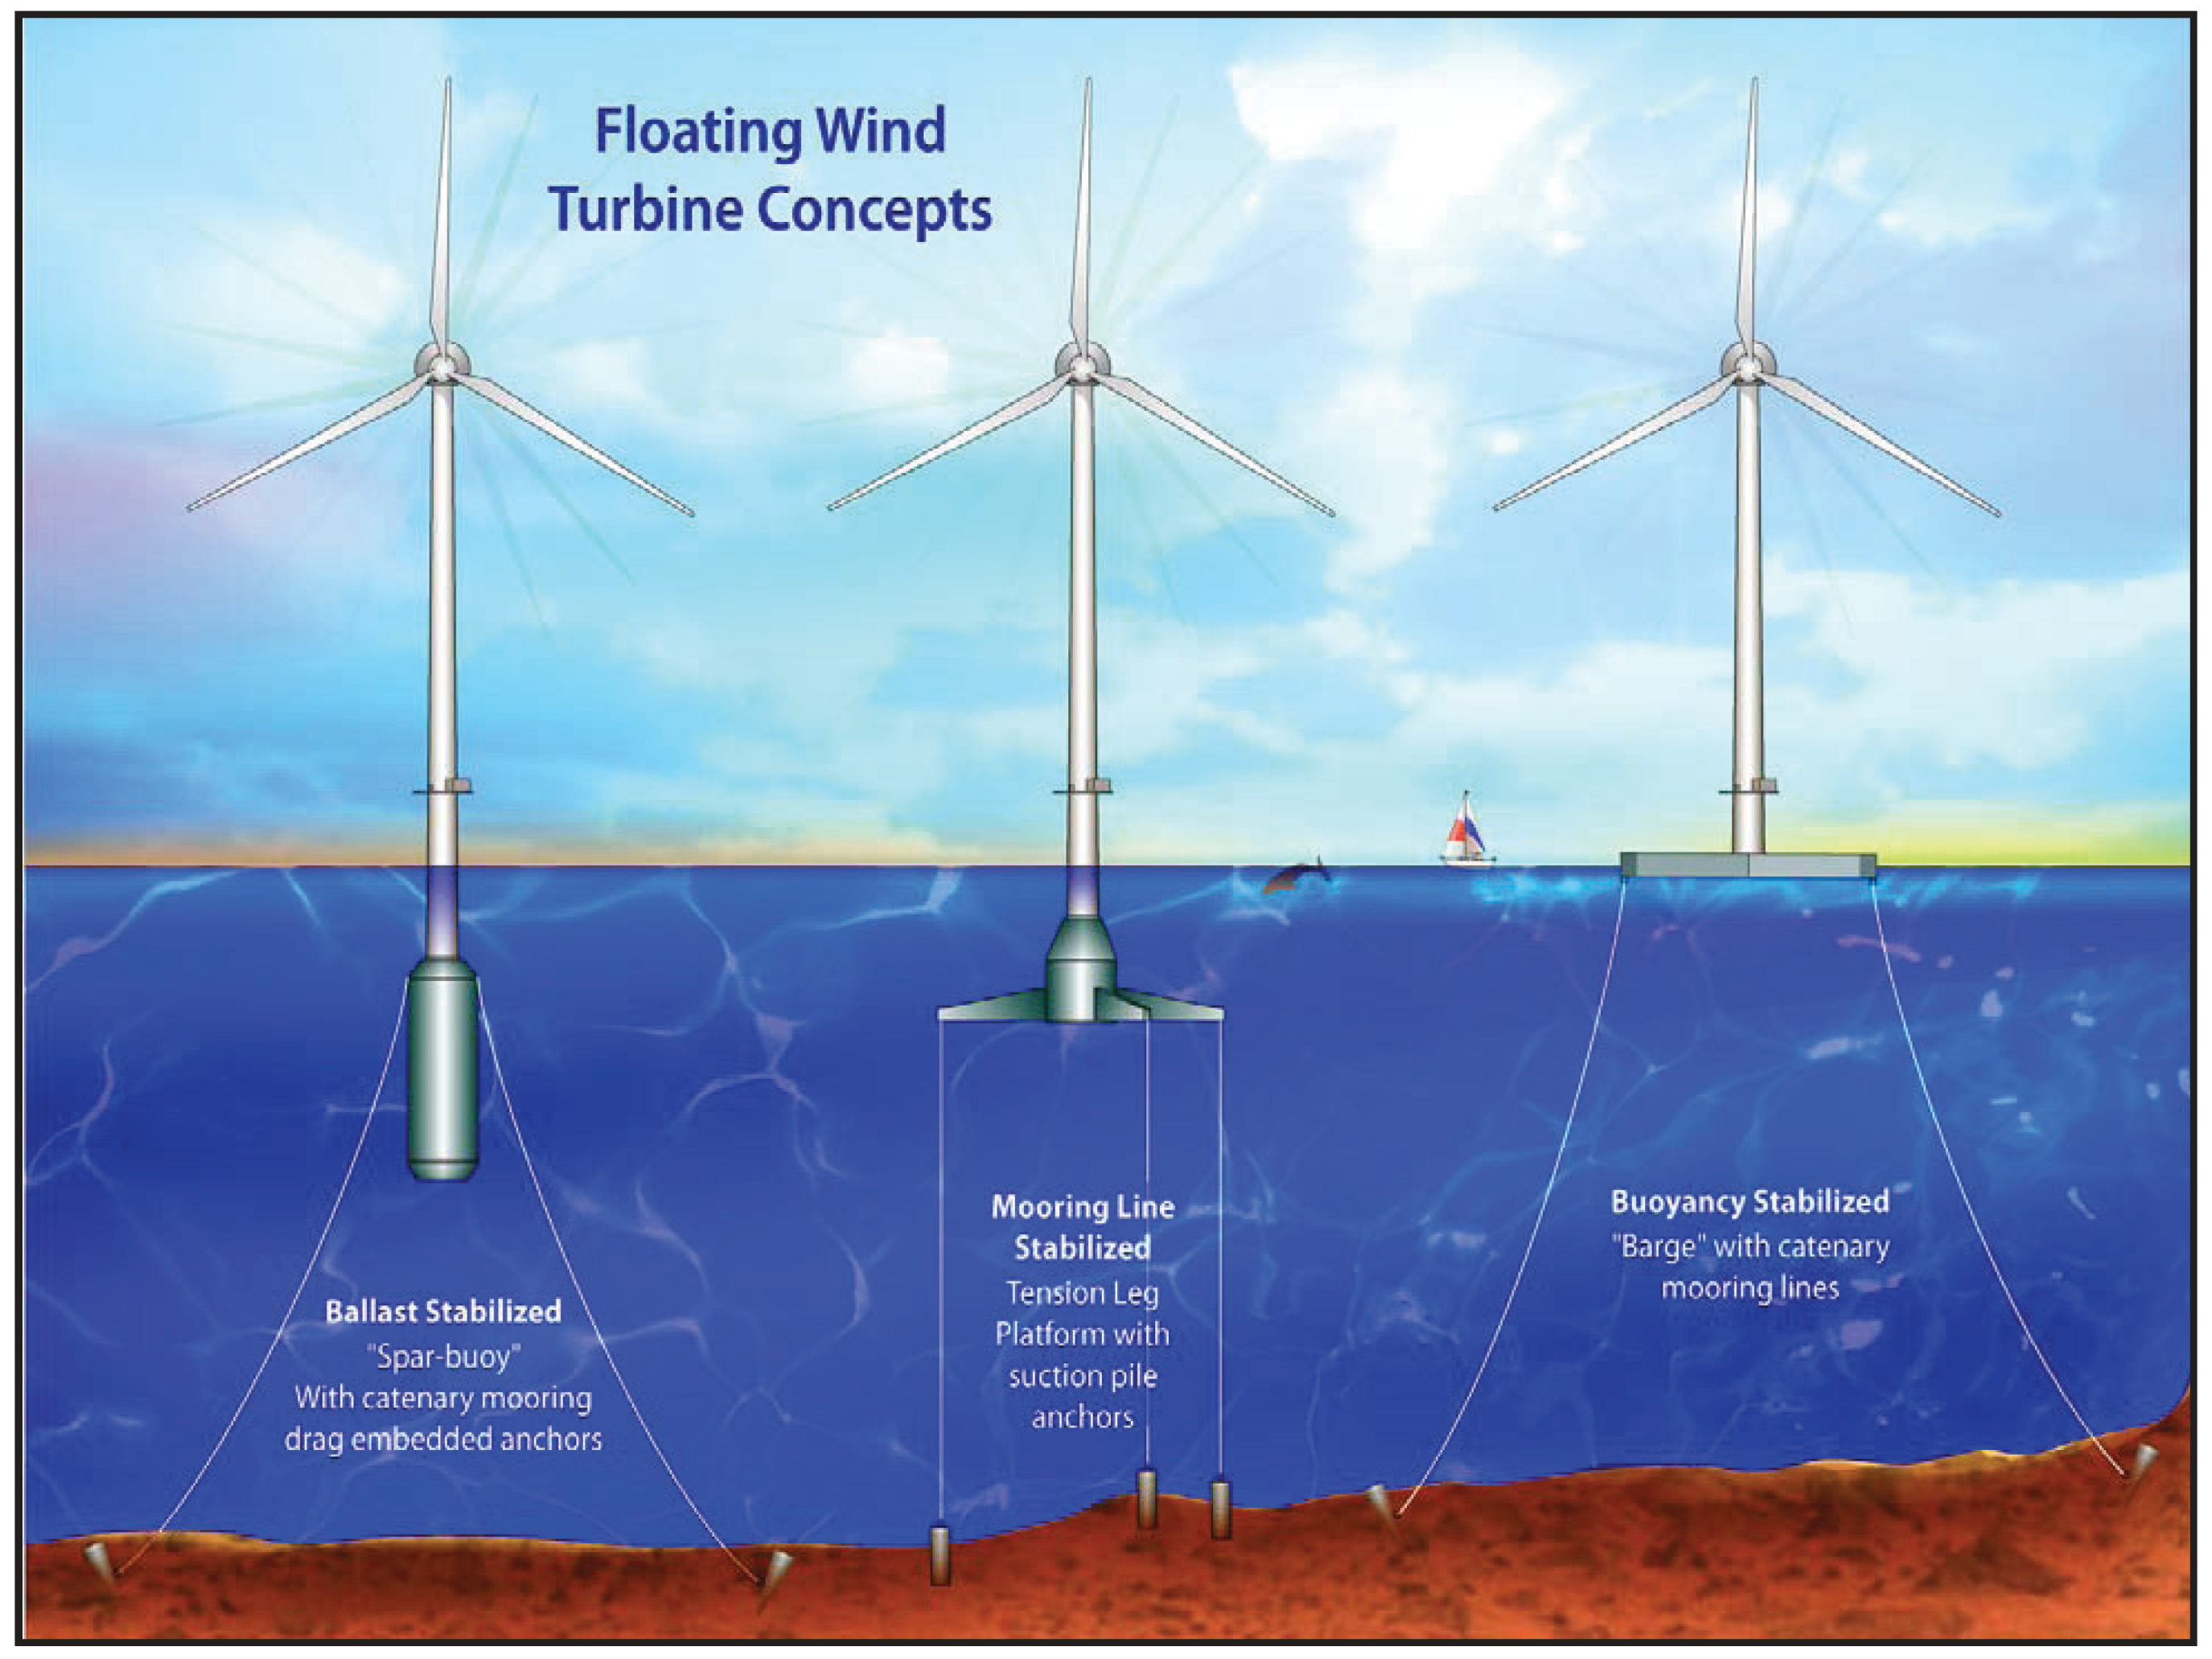
  • Shallow-draft platforms, such as barges with catenary mooring lines, that achieve stability via the extent of their water-plane area.
  • Deep-draft platforms, such as spars with moored catenary or taut lines, that achieve stability and pitch-restoring moment via ballast.
  • Buoyancy-driven platforms, such as tension-leg platforms (TLPs), that achieve stability via a series of mooring lines in tension.
Fully-integrated offshore wind turbine system models have been developed based on the floating platform configurations mentioned above. Bulder et al. [6] investigated a tri-floater design for a 5-MW turbine. Wayman [7] and Jonkman [7] analyzed various TLP and barge designs with the NREL 5-MW wind turbine model. Tracy [8] conducted a parametric study to find the optimal TLP, as well as slack and taut moored-line spar-buoy designs that had good overall performance in combination with low cost. A TLP model for a 5-MW turbine was the focus of a study by Denis [9]; its performance was compared to that of other floating platform concepts in load computations. It is worth noting that, as in the studies cited, much previous work has focused on the use of turbines with a 5-MW rating, and most often, the selected model for such studies has been the NREL 5-MW offshore baseline wind turbine [10]. To take advantage of economies of scale, the stronger and more consistent wind resource farther offshore and the reduced transportation and construction constraints associated with the use of large turbines on land, the feasibility of using very large-scale wind turbines is being increasingly studied; such as with the 10-MW turbine studied in the European Union UpWind project [11]. The present study, along similar lines, explores the use of a floating platform to support a very large 13.2-MW wind turbine with 100-m blades.
In this study, an iterative design procedure is presented, which seeks to develop a semi-submersible floating platform model to support an innovative 13.2-MW horizontal-axis wind turbine with 100 m-long blades developed at Sandia National Laboratories (SNL) [12,13]. Despite the potential scaling benefits, large-scale wind turbines are rarely studied in the offshore wind turbine community. To assess the feasibility of operating the SNL 13.2-MW wind turbine in deep water, a much larger supporting platform than the OC4semi-submersible platform that supports the 5-MW NREL wind turbine model is desired. This study seeks to provide fundamental insights into the performance of this large-scale wind turbine system and could interest other researchers, as well as an industry that is exploring the feasibility of large offshore wind turbine systems. To achieve the goal, each part of the system is designed separately with predefined constraints as described in the following, and the final model is integrated using an iterative design methodology that is outlined.
A minimum hub height above MSL of 133.5 m (representing a rotor radius of 102.5 m and an air gap of 31 m) is the starting point for the model development. With this selected starting point for the minimum tower height, then, a shorter tower is desired for the purpose of weight reduction, to limit the supporting platform size and to reduce the tower bending moment requirements particularly in platform pitching mode. A reasonable air gap, representing clearance between wave crests and the lowest sweeping point of the rotor, is needed for vessel navigation purposes. This is the basis for the minimum clearance of 31 m between the blade tip at its lowest point and the MSL. It is desired next to size the floating platform so as to be as small as possible, yet still be able to support the topside structure (tower and turbine). Additionally, the platform must have adequate stability in its unmoored state, and the integrated model must have natural frequencies that are out of the frequency range of dominant wave energy. The extreme pitch angle (also termed as trim) of the platform is limited to 10 degrees. Finally, mooring lines are assumed to be necessary for the integrated model to provide a station-keeping function.
This work is divided into three sections. First, the SNL 13.2-MW wind turbine model and the baseline OC4 semi-submersible platform model are briefly introduced. Next, the design methodology for the integrated system is presented, followed by a preliminary development for each part: the tower, platform and mooring system. Both static stability and the overall dynamic response of the final model are checked for selected sea states.

2. SNL 13.2-MW Wind Turbine and OC4 DeepCwind Platform Baseline Models

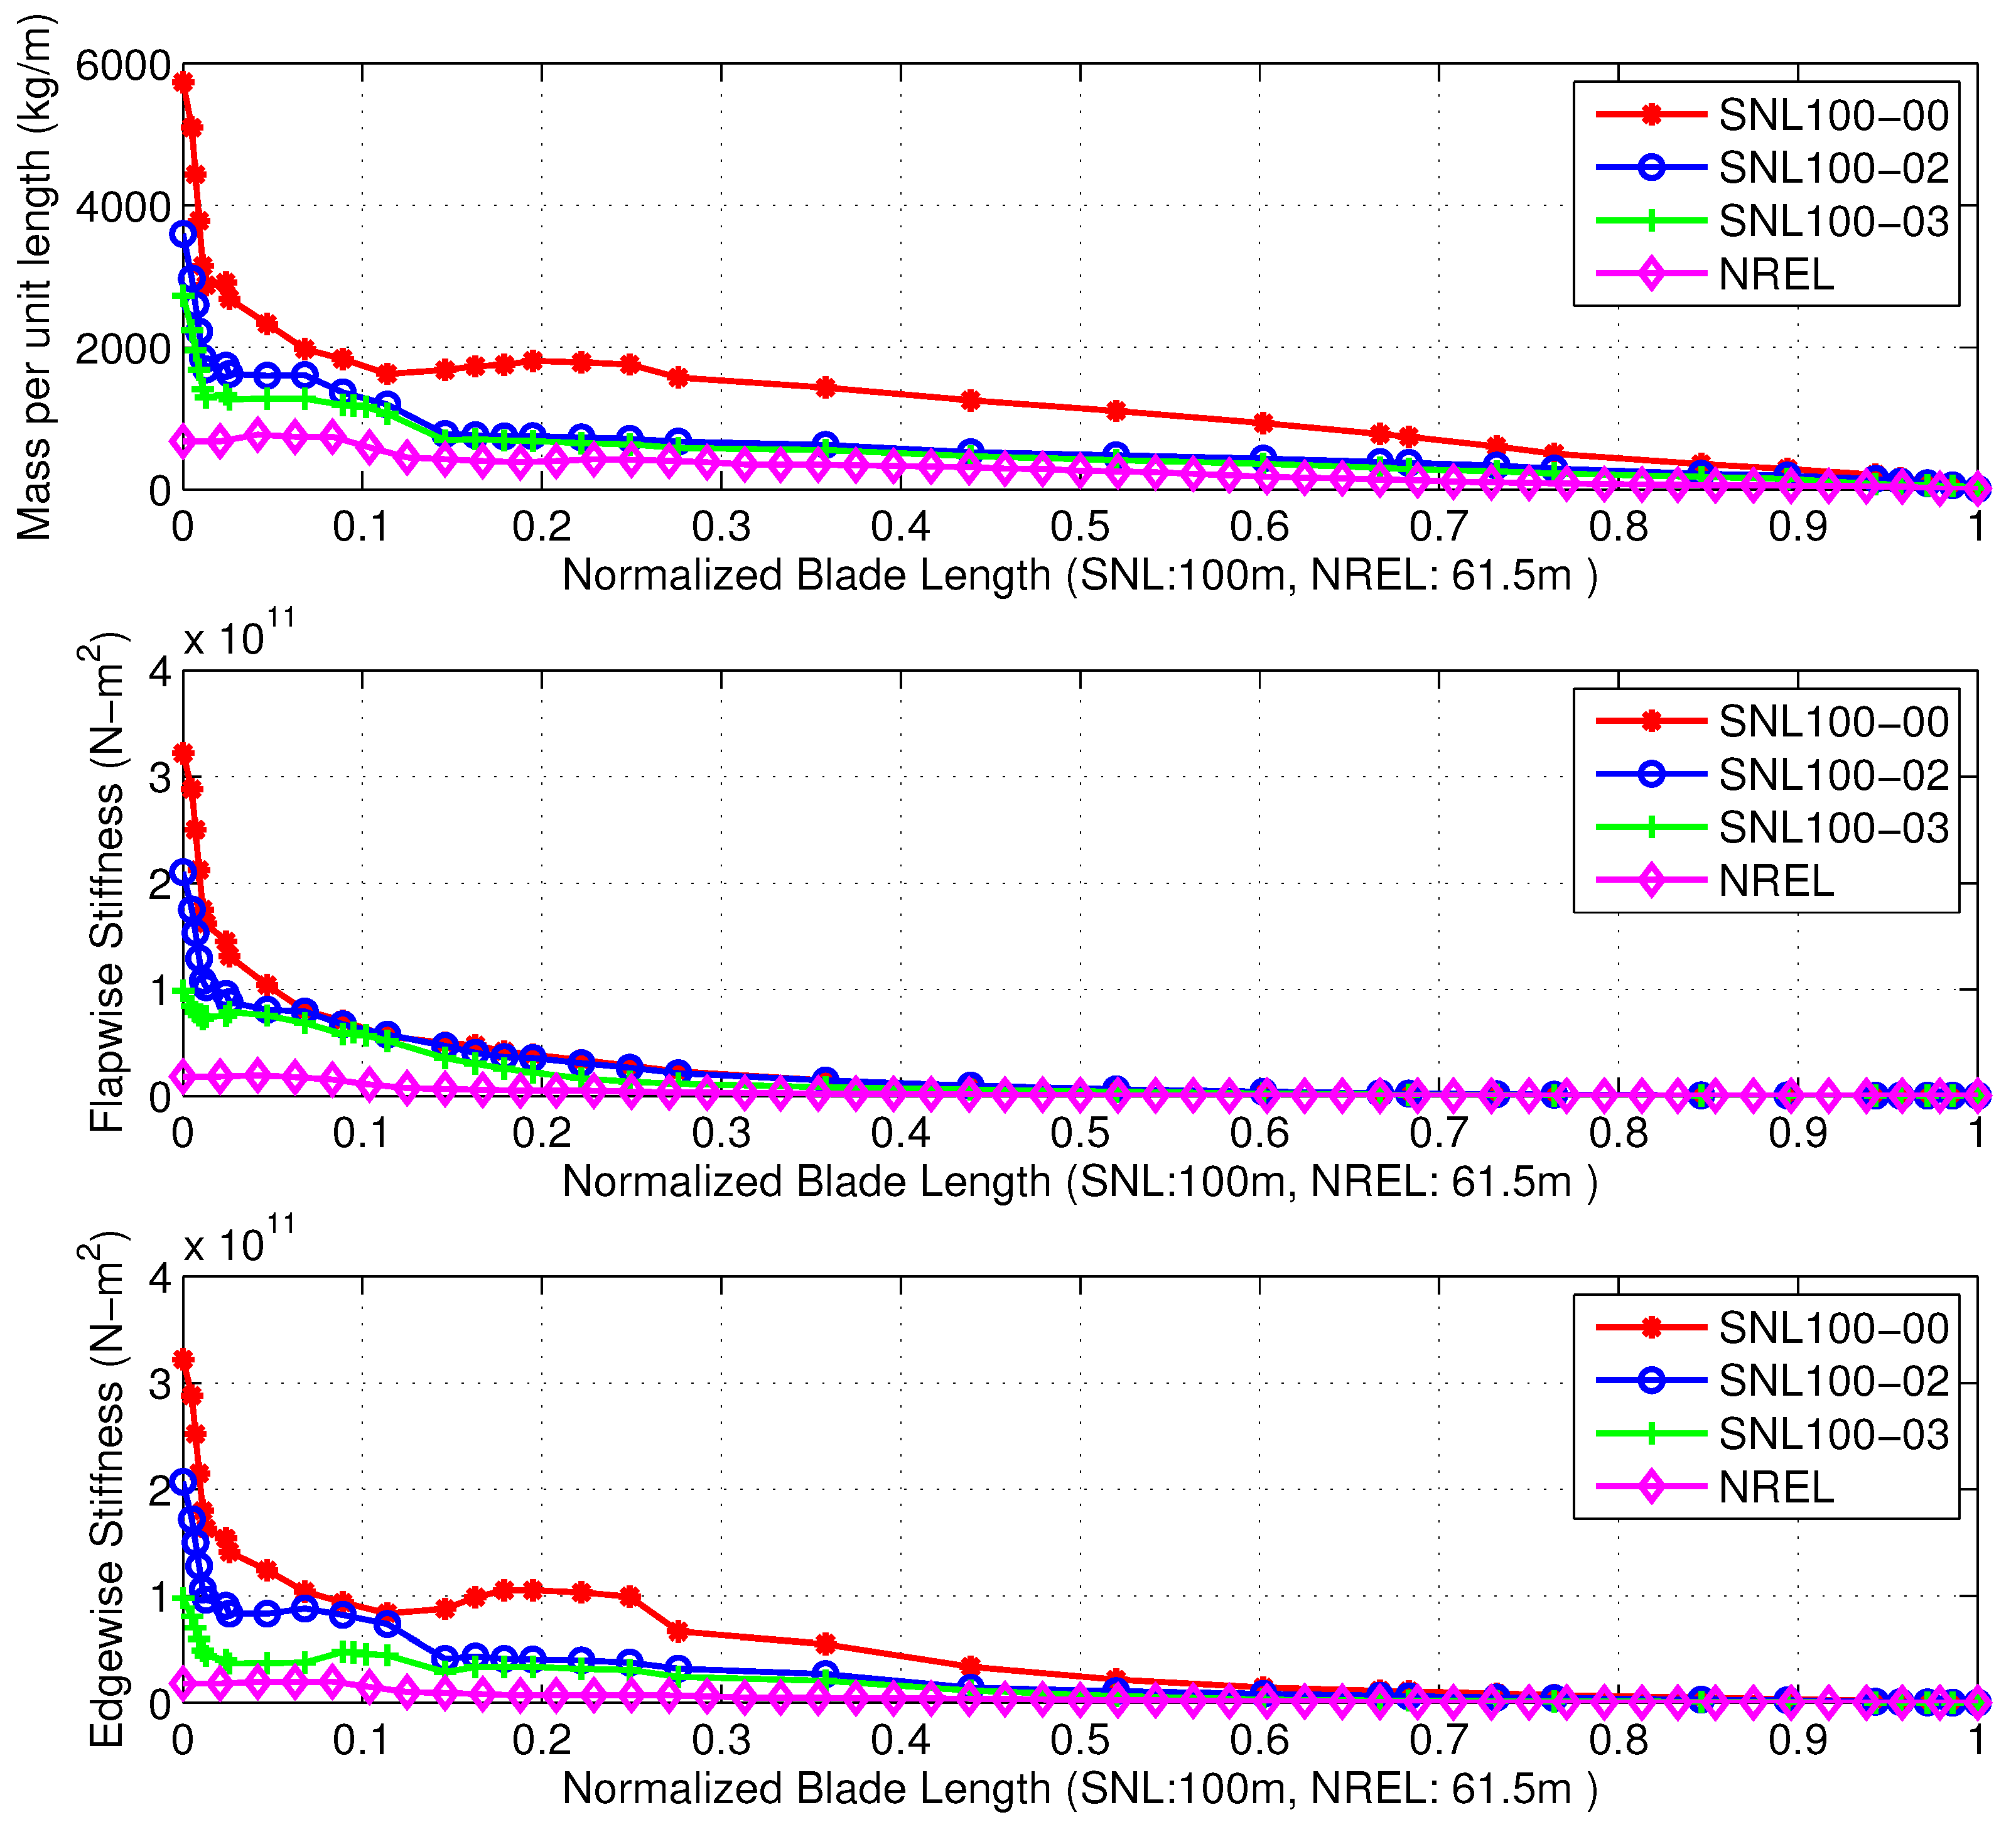
2.1. SNL 13.2-MW Baseline Turbine Properties

A series of studies have been undertaken toward the development of a 100-m blade design for a 13.2-MW horizontal-axis wind turbine by Sandia National Laboratories (SNL). Four different designs have been proposed with different materials, as well as innovations in the blade geometry. All these blade models are publicly available at the SNL Offshore Wind website [14]. To achieve performance criteria for these very large blades and to reduce overall blade weight and cost, studies leading to the first three designs were undertaken to investigate the benefits of the use of advanced materials, while the last blade design series tests sought to investigate blade geometry innovations and proposed the use of flatback airfoils. Figure 2 shows a comparison of three SNL 100-m blades and the NREL 5-MW wind turbine blade in terms of mass density, flapwise stiffness and edgewise stiffness at normalized locations along the length. Blade series SNL100-00, SNL100-02 are SNL100-03 are selected; they represent the modifications in mass density from SNL100-00 to SNL100-02 and in geometry going from SNL100-02 to SNL100-03. Improvements in the design characteristics are quite evident; the SNL100-03 design has at least a 56% reduction in weight from the original SNL100-00 baseline design as can be verified from studying Figure 2. Key differences between the different SNL 100-m blade designs are summarized in Table 1. All the blades are designed for Wind Speed Class I and Turbulence Category B. Detailed descriptions regarding the structural and geometrical characteristics of all these blade models can be found elsewhere [12,15].
The SNL100-02 blade model is used in this study along with suggested modifications to the control system for the NREL 5-MW model that address power, blade pitch and variable speed characteristics. We should note that in an earlier study [16], the same SNL100-02 blade design was used, but a taller tower was employed then. The turbine in the present study has a hub height that is 133.5 m above still water level (SWL) compared to 146 m in the earlier study. Various properties of the selected turbine for the present study are presented in Table 2.

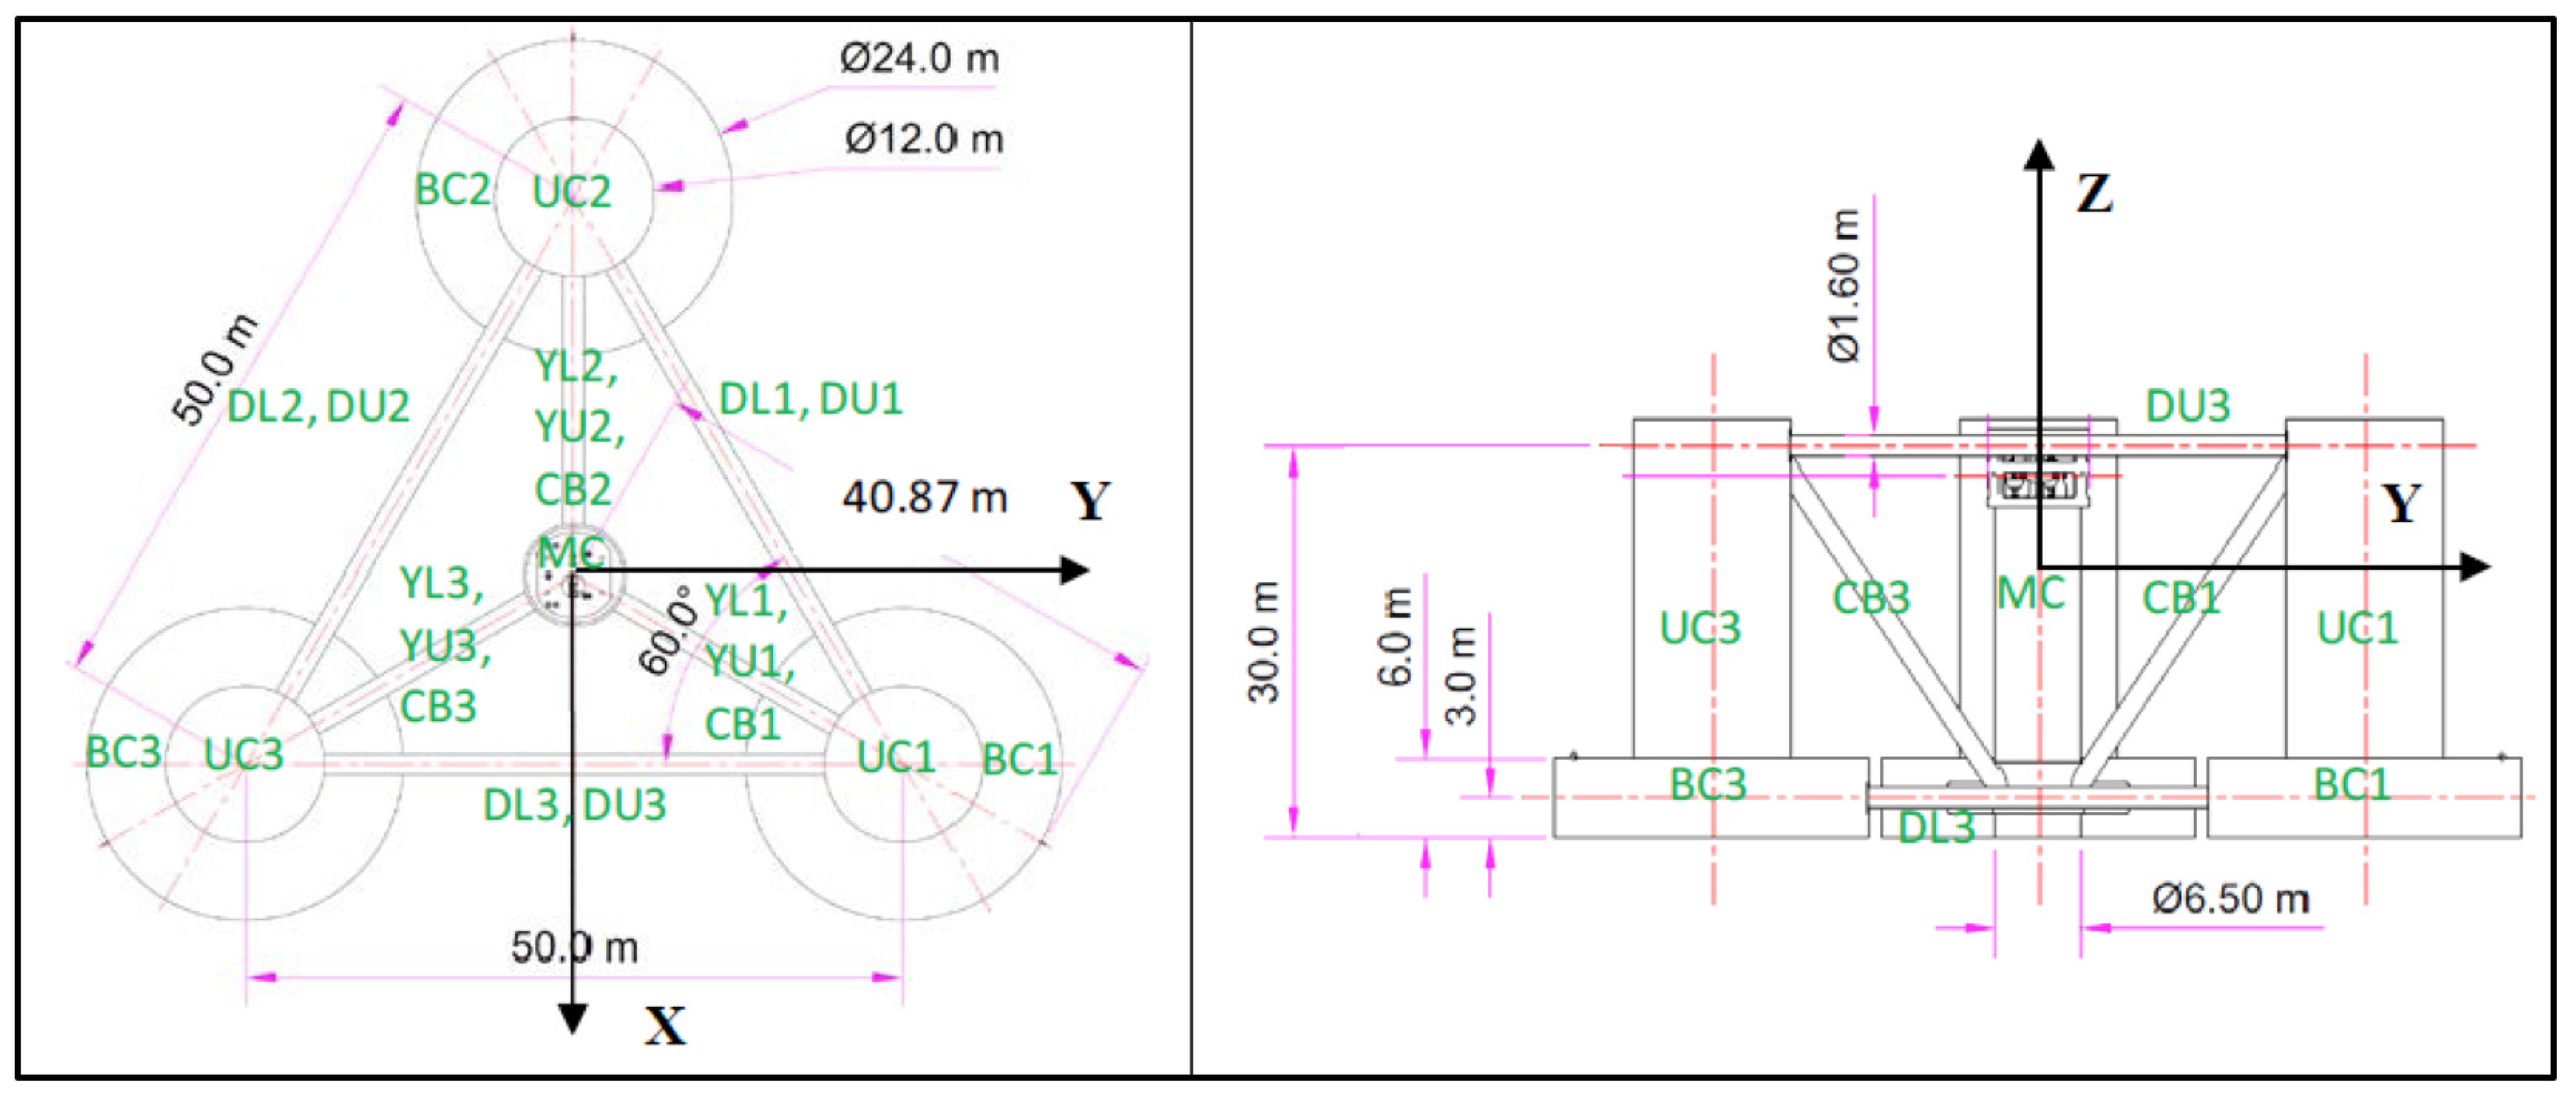
2.2. Baseline Semi-Submersible Platform and Mooring System

At the initial stage of an innovative design, such as this one involving a very large rotor, it is common to take advantage of completed studies of a similar nature. In this study, the OC4-DeepCwind semi-submersible floating platform and offshore wind turbine [17] are chosen as the baseline model to which changes are made. Froude scaling is applied to this baseline configuration of the OC4-DeepCwind model to develop the SNL 13.2-MW turbine’s semi-submersible platform model. Since the OC4-DeepCwind turbine and platform have been the subject of several major studies, the use of this OC4-DeepCwind model has the benefit that it helps to highlight the effects introduced by the use of a very large rotor.
The OC4-DeepCwind platform is designed to be deployed in a water depth of 200 m and with a design draft of 20 m. The main column of the platform is connected to the tower at a location 10 m above the SWL. Three offset columns, whose top ends are 12 m above SWL, are attached to the main column through a series of smaller diameter pontoons. A schematic representation of the OC4-DeepCwind semi-submersible platform is presented in Figure 3, and a summary of key geometric and structural properties of the platform is presented in Table 3. The multiplication factor in the last column of the table indicates the scale factor to be applied in going from the baseline OC4 model to the proposed model based on the Froude scaling law, to be discussed later. Additional details related to the baseline OC4-DeepCwind semi-submersible platform model can be found elsewhere [17].
The OC4 DeepCwind semi-submersible platform is moored by three catenary lines spread symmetrically about a vertical axis through the platform center as shown in Figure 4. Anchors for the lines are fixed at the seabed at a radius of 837.6 m from the platform center. The lines are uniformly separated 120 ° from each other.
We should note here that since the SNL 13.2 MW turbine and semi-submersible platform system are to be deployed at a water depth of 200 m, which is the same as for the OC4 DeepCwind study, Froude scaling cannot be applied directly to the dimensions of the mooring system. Given the fact that even the scaled-up platform dimensions are relatively small compared to the unstretched lengths of the baseline OC4 DeepCwind mooring lines (835.5 m), this same unstretched length of the mooring lines is used for the SNL 13.2 MW turbine and semi-submersible platform. Other mooring system properties including the radius to the anchors and the hydrodynamic added mass and drag coefficients are also unchanged; these are indicated by (−) in the Multiplication Factor column of Table 4, which summarizes key mooring system properties. Figure 4 shows the mooring line arrangement along with the co-aligned wind and long-crested waves assumed in various analyses reported in this study.

3. Preliminary Model Development of SNL 13.2-MW Semi-Submersible FOWT

In order to be able to perform a stability and load analysis using the simulation software, FAST, an integrated system consisting of a turbine, platform and mooring system must be developed. Associated wind conditions and sea state definitions must be specified for evaluating the system performance. Because there are several inter-related characteristics of this integrated system, an iterative design procedure must be carried out to achieve the model development objectives.
The steps in the overall model development for the integrated system are first presented. Each step necessary to define and develop a FAST model of the system is presented; these steps undertaken are similar to those used to develop a TLP model by Matha [9]; more details regarding the iterative process can also be found in [13] and [18].

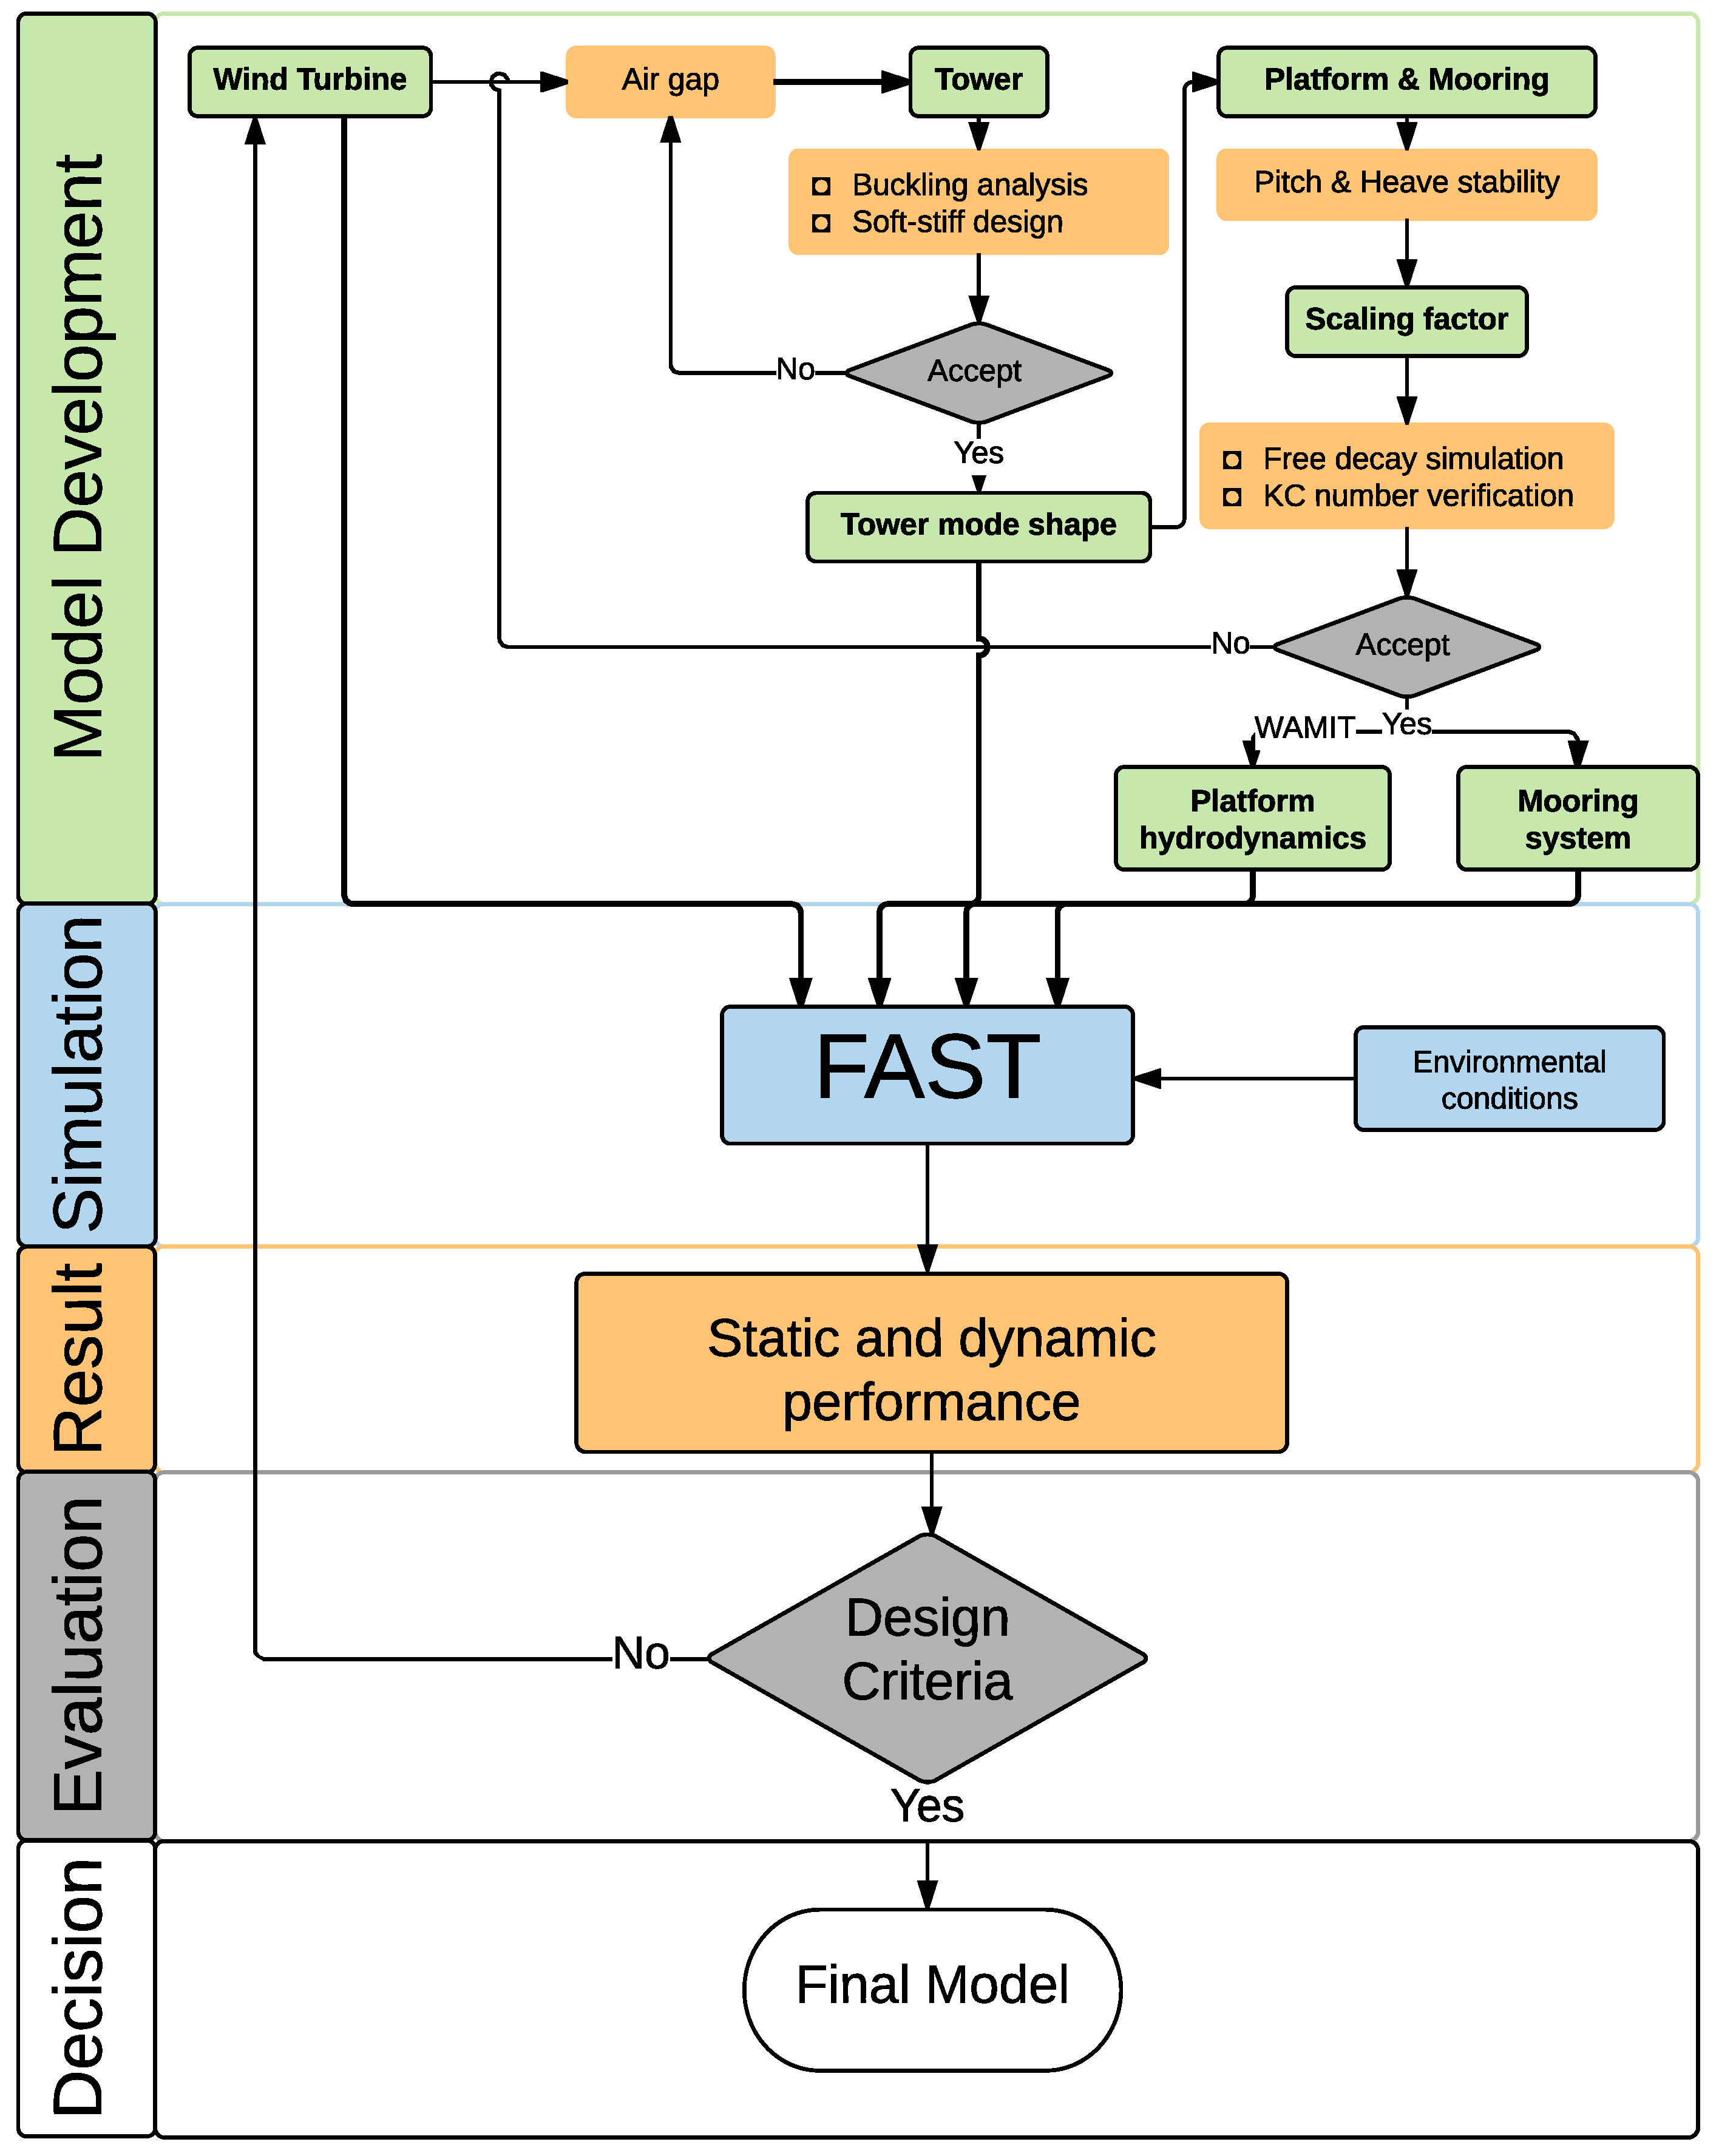
3.1. Design Methodology

The iterative process for the development of the new model begins by considering an earlier model [16] involving the SNL 13.2-MW wind turbine [12] supported on a scaled-up model of the OC4-DeepCwind semi-submersible platform. That model was analyzed in simulations under steady (non-turbulent), as well as turbulent wind fields and for both regular and irregular waves. A drawback of that earlier model [16] is that the large platform utilized therein was likely overdesigned to accommodate a taller tower, and costs are estimated to likely be 5–6-times that of the OC4-DeepCwind platform. As will be shown later, this deficiency in the system can be corrected by appropriate modifications of the tower, the platform and the mooring system. The objective of this study is to develop an integrated system model consisting of a tower, semi-submersible platform and mooring system that can support the SNL 13.2-MW wind turbine, while meeting static and dynamic performance requirements and limiting overall system costs. In the model development iterations, the goal with each candidate model is to ensure that the system is statically stable and has an adequate air gap of 31 m; subsequently, system dynamic performance is verified under different sea states with steady, as well as turbulent winds and long-crested regular, as well as irregular waves. Various performance requirements for the platform model development will be discussed; for example, one key performance parameter, related to platform pitch motion, defined for functionality, safe performance and efficiency of the turbine, is to limit the pitch motions to 10 degrees in each intermediate model in the iterations.
The iterative model development process is schematically presented in the flowchart shown in Figure 5. The iterative procedure begins with a 13.2-MW wind turbine with SNL100-02 blades as discussed before. Tower, platform and mooring system models are developed sequentially, as per the flowchart presented in Figure 5, through various system checks involving air gap requirement, tower buckling analysis, tower soft-stiff design requirement, platform motion stability and also Keulegan–Carpenter (KC) number verification. After preliminary validation in the frequency domain against global performance criteria, the system’s static and dynamic performance in normal and extreme sea states is studied in time-domain simulations. In any step of the model development, failure to meet desired performance criteria requires model changes iteratively.
Given the properties of the baseline turbine, tower and platform models, iterative scaling of these models is now considered. To all linear dimensions, the same scale factor, λ , is applied to the baseline to obtain the desired model. We note that this same scaling also applies to relevant environmental conditions related to the model, as well as to deformations and motions of the model [19]. Table 5 summarizes the scaling relationships for various physical parameters of interest.

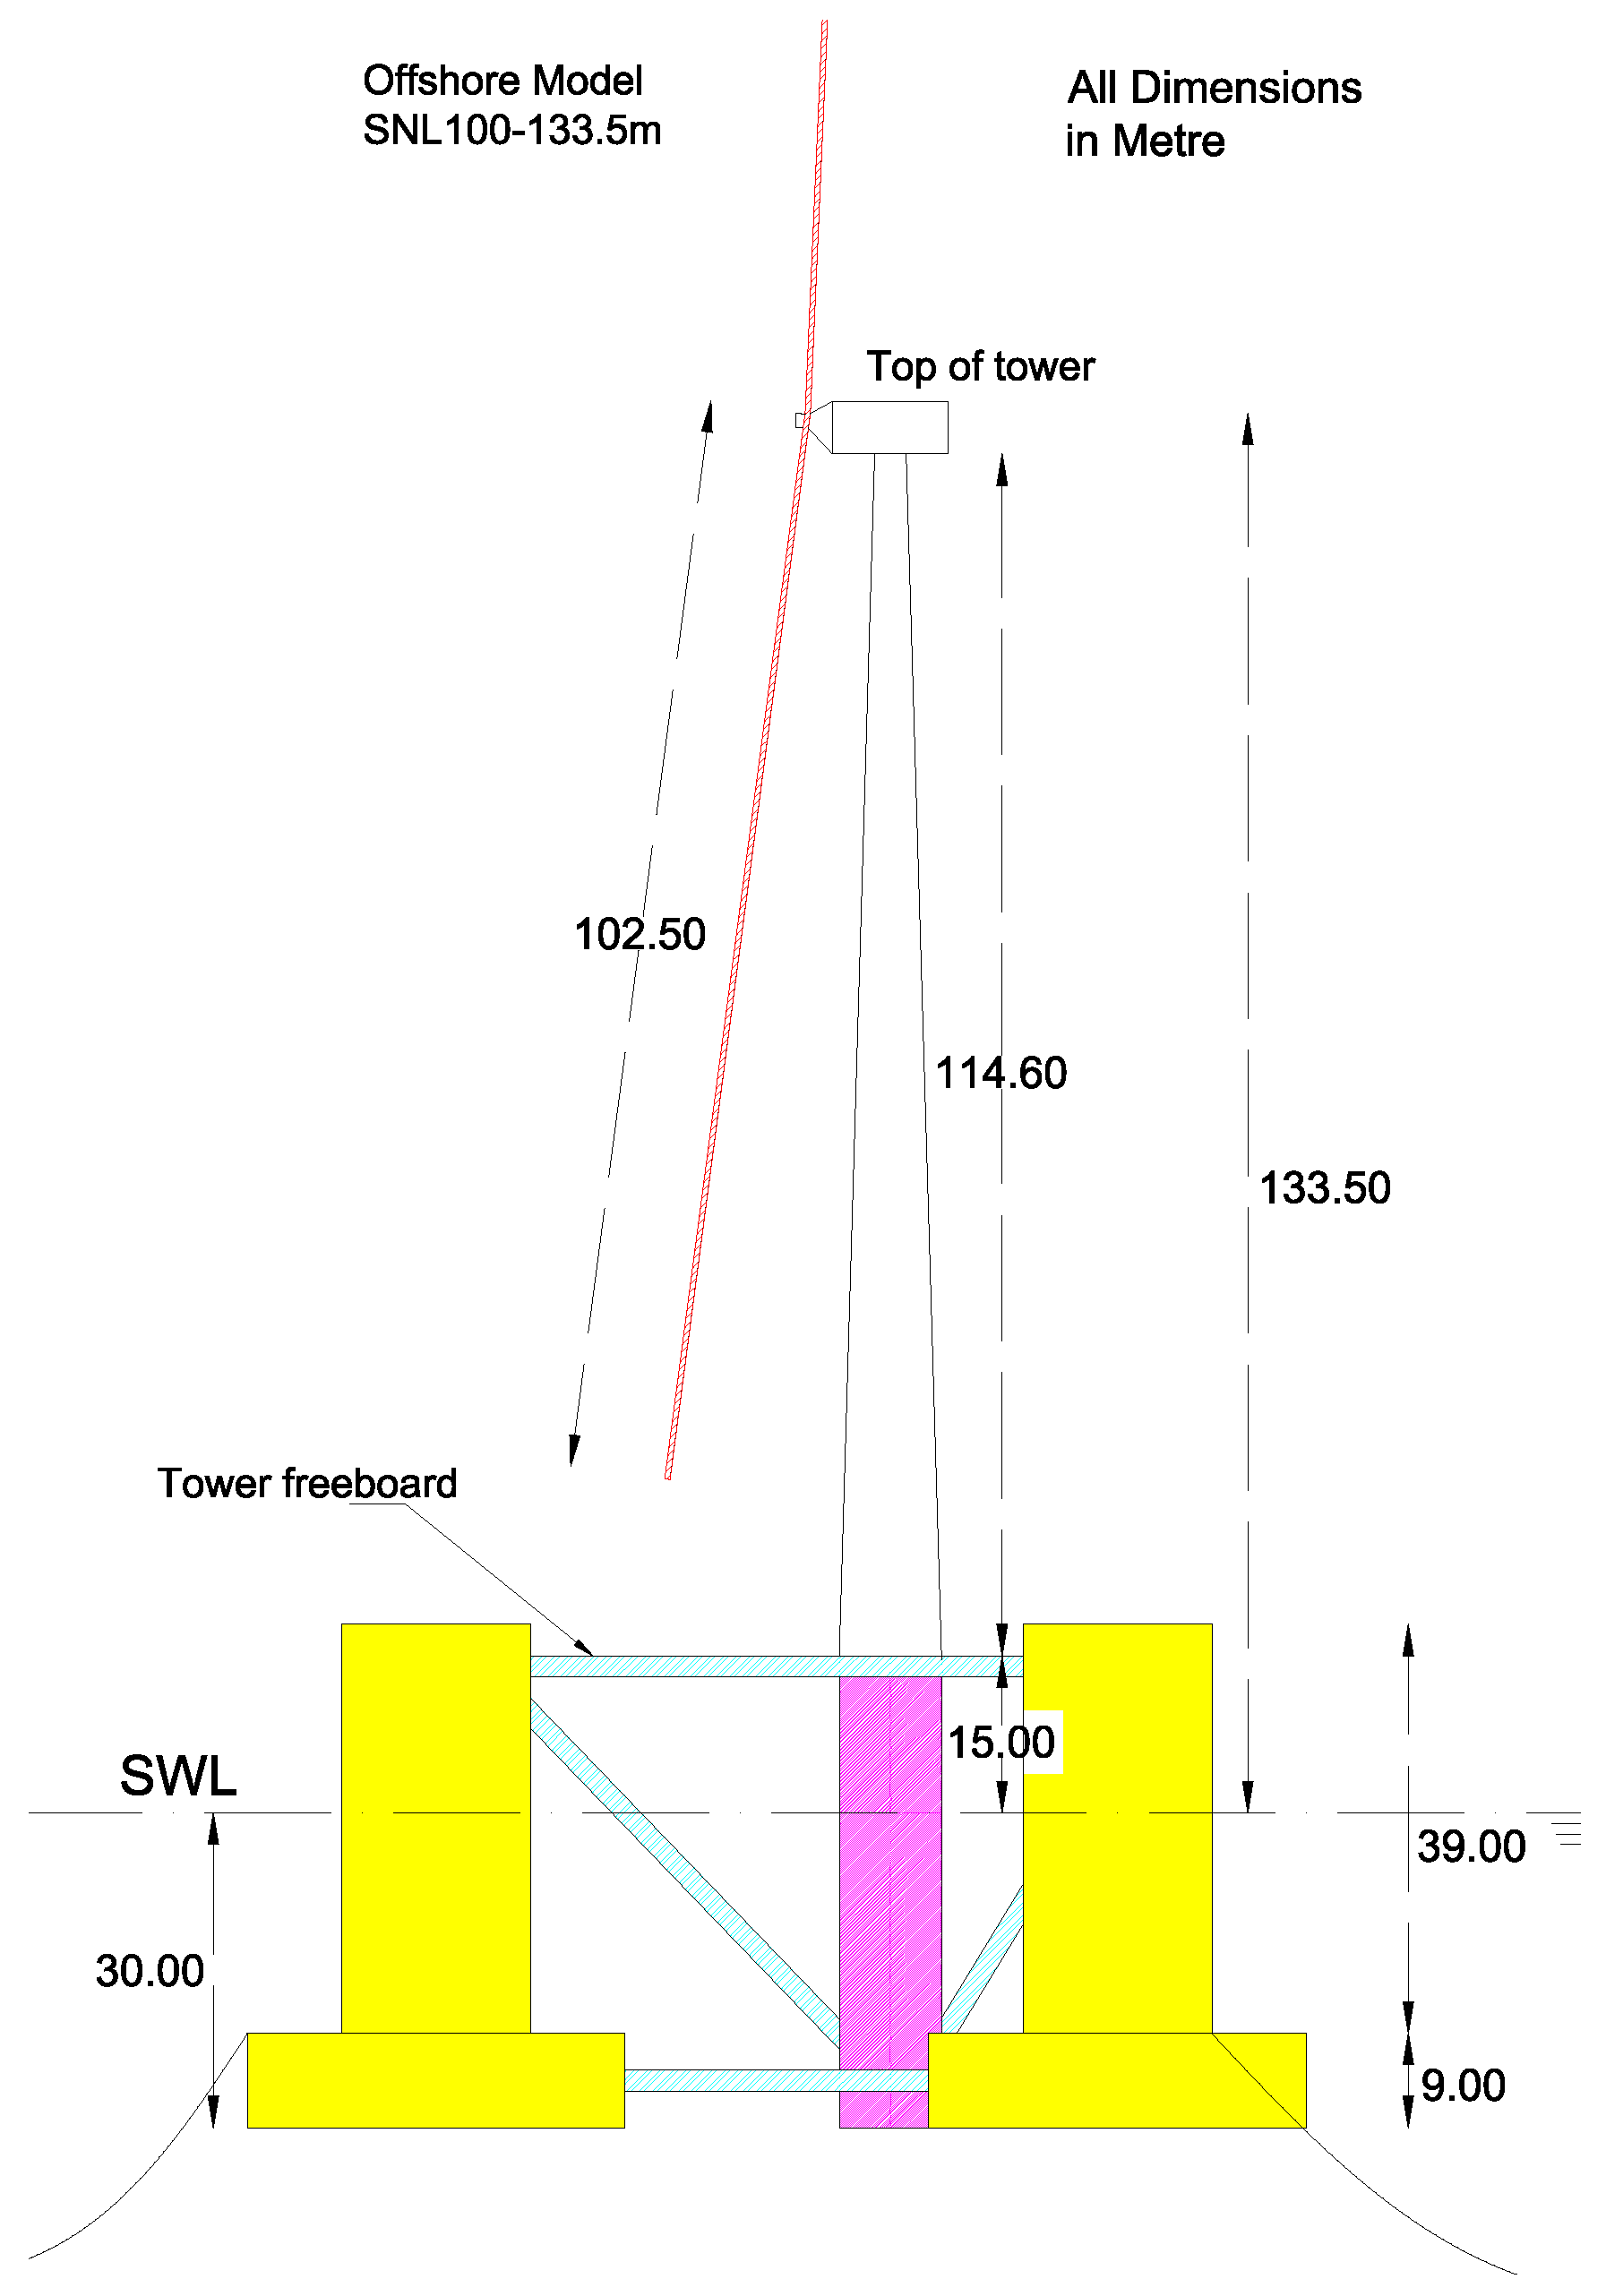
3.2. Tower Model Development

The tower used with the OC4 DeepCwind semi-submersible platform is chosen as the baseline tower for the support structure development of the larger turbine in the present study. To minimize the weight of the tower, as well as to provide the needed air gap clearance (for navigation) of 31 m, the hub height above SWL is chosen at 133.5 m [13].
As stated in [13], even though the tower diameter and height are scaled up from the baseline, the thickness of the tower from its base (0.027 m) to the top (0.019 m) is kept the same as the tower used for the OC4 DeepCwind semi-submersible platform. Doing so allowed us to minimize the weight of the tower; however, buckling analysis must be carried out on the model to meet buckling stability requirements. The tower thickness selected also helped to attain a tower natural frequency that meets the soft-stiff design requirements for resonance avoidance from the rotor rotation and blade passing frequency at all wind speeds. Steel material properties are assumed to be the same as those used for the NREL 5-MW wind turbine; the Young’s modulus is taken to be 210 GPa; the shear modulus is taken to be 80.8 GPa; and the effective density of the steel is taken to be 8500 kg/m 3 [13].
A cantilevered tower model was created in ABAQUS, and unit force and moment are applied at the top of the tower at some distance offset from the rotor plan. Linear buckling analysis gives an eigenload of 20,300,200 kg, which is much higher than the the rotor-nacelle assembly mass (1,452,131 kg) for this wind turbine model.
One of the primary considerations in the tower design is the overall tower stiffness, which also has a direct effect on its natural frequency. We seek here to meet the soft-stiff dynamic design requirement with the selected tower. Analysis of the tower model is required to ensure that no natural mode resonances are excited by any motions in the rest of the turbine. Resonance-induced loads arising as a result of rotor operation and the tower’s natural frequency are discussed here. A Campbell diagram is developed here through the linearization analysis using FAST V7.0 to identify any such undesired resonance arising from the interaction of the system natural frequencies and rotor rotation rates.
As shown in Figure 6, a number of system natural frequencies including the first and second tower fore-aft and side-side frequencies, as well as the first and second blade frequencies are plotted as a function of rotor speed. The results show that the blade natural frequencies are more sensitive than the support structure to the rotor speed at the starting range (lowest levels) from 0–4.34 rpm (cut-in rotor speed). Over a range of operating rotor speeds (4.34 rpm–7.44 rpm), most of the frequencies are able to avoid the rotor rotation frequency (1P) and the blade passing frequency (3P), except for the first drivetrain frequencies at rotor rotation rates of around 5 rpm. This is not of concern since we are dealing only with the wind turbine tower design.
A candidate tower model was created after the validation of buckling analysis and soft-stiff design requirement. Table 6 summarizes the resulting tower structural properties over its length.

3.3. Platform and Mooring System Development

An acceptable semi-submersible platform for the integrated system is expected to provide sufficient stability even in an unmoored state. Thus, a static analysis is first carried out to establish a suitable scale factor, λ P , to be applied to the baseline platform. In this study, we assume that the selected dimensions for the platform geometry will be those that limit two key displacements—namely, the steady-state heave and pitch—of the integrated system to specified threshold levels. The system must experience an acceptably low steady-state pitch angle in a critical wind loading conditions (say, around the rated wind speed) that it might experience during operation. Additionally, the design draft should be adequate to provide sufficient heave stability under static and steady-state conditions.
For any platform degree of freedom, the steady-state motion is determined by the force on the system and the system’s restoring properties (stiffness) for that corresponding motion. Thus, we have:
ζ = F C
where ζ is the displacement or rotation of interest, F is the relevant force or moment and C is the corresponding restoring property (analogous to stiffness or resistance to the motion). We note here that to limit motions ( ζ ), larger values of C will help, but these usually arise from scaling up the baseline model, which also increases the forces, F.
We first consider pitch motions and associated stability. At rated wind speed, the steady-state out-of-plane tower-base bending moments are calculated for the following three land-based models:
  • NREL 5MW: NREL 5-MW land-based reference wind turbine model, hub height 90.0 m.
  • SNL14602: SNL 13.2-MW land-based wind turbine model with SNL100-02 blades, hub height 146.0 m.
  • SNL13302: SNL 13.2-MW land-based wind turbine model with SNL100-02 blades, hub height 133.5 m.
If we assume a 10 ° limit on pitch motion for satisfactory performance, the required restoring, C 55 r , for this motion may be found using Equation (1) for any platform model and associated forcing, F, computed using the chosen scaling. The available static restoring coefficient, C 55 λ P , for any scale factor may be derived using a Froude scaling table. Coefficients for any trial model can thus be computed by applying appropriate scale factors to the corresponding restoring coefficients for the OC4 DeepCwind platform.
Table 7 summarizes pitch-related results for several platform models for the SNL 13.2 MW turbine; the NREL 5-MW turbine is also included for comparison. In this table, R is the ratio of the platform restoring capability, C 55 λ P , to the required restoring, C 55 r , i.e., R = C 55 λ P / C 55 r . Note that C 55 λ P is almost 2.5-times larger than C 55 r with an earlier model [16] developed for the SNL 13.2-MW turbine, which implies that the model with a scale factor, λ P , of 1.8 (relative to the model for the NREL 5MW turbine) is significantly over-designed from a pitch stability perspective. This ratio is even larger for the SNL13302 model with λ P = 1.8 . Among the tested scale factors to be used with the SNL13302 land-based model, scale factors of 1.4 and 1.5 lead to pitch motions that are in a reasonable range. Note that R is not chosen too close to unity to allow for some margin in pitch response when an offshore platform’s pitch motion is considered, which could enhance the moments computed using a land-based model; also, since computations are carried out for rated wind speed conditions, the margin allows for other untested cases.
The steady-state heave motion is similarly assessed to ensure that an adequate design draft is considered for the platform. To perform the heave motion evaluation, the total system mass including the tower mass and the rotor-nacelle assembly (RNA) mass are computed. The mooring system vertical drag force is also computed using the Mooring Analysis Program (MAP). The total gravity force must be balanced by the buoyancy force at the design draft. Even though the RNA mass is constant for the selected wind turbine with blades (SNL13302), any modifications made to the tower and/or mooring system will result in a change in the platform geometry, which, in turn, will require a re-design of the tower and mooring system. An iterative procedure is thus applied to arrive at a suitably converged choice for the platform, tower and mooring system geometry. Table 8 shows the evaluations for the 13.2-MW wind turbine model with SNL13302 blades supported on platforms with different Froude scale factors.
As can be seen from Table 8, a platform scale factor, λ P , of 1.4 is found to be inadequate for heave stability and does not meet the desired draft for the platform. Through an iterative process, the turbine tower height is reduced from 128 m (corresponding to a hub height of 146 m) to 118.5 m (corresponding to a hub height of 133.5 m) to achieve the heave motion stability and design draft. Finally, a scale factor, λ P , of 1.5 is chosen for the platform, and a scale factor, λ , of 2.0 chosen for the mooring line diameter proves sufficient to limit heave steady-state motion. Integrated system static stability needs to be verified through free-decay simulation and KC number.

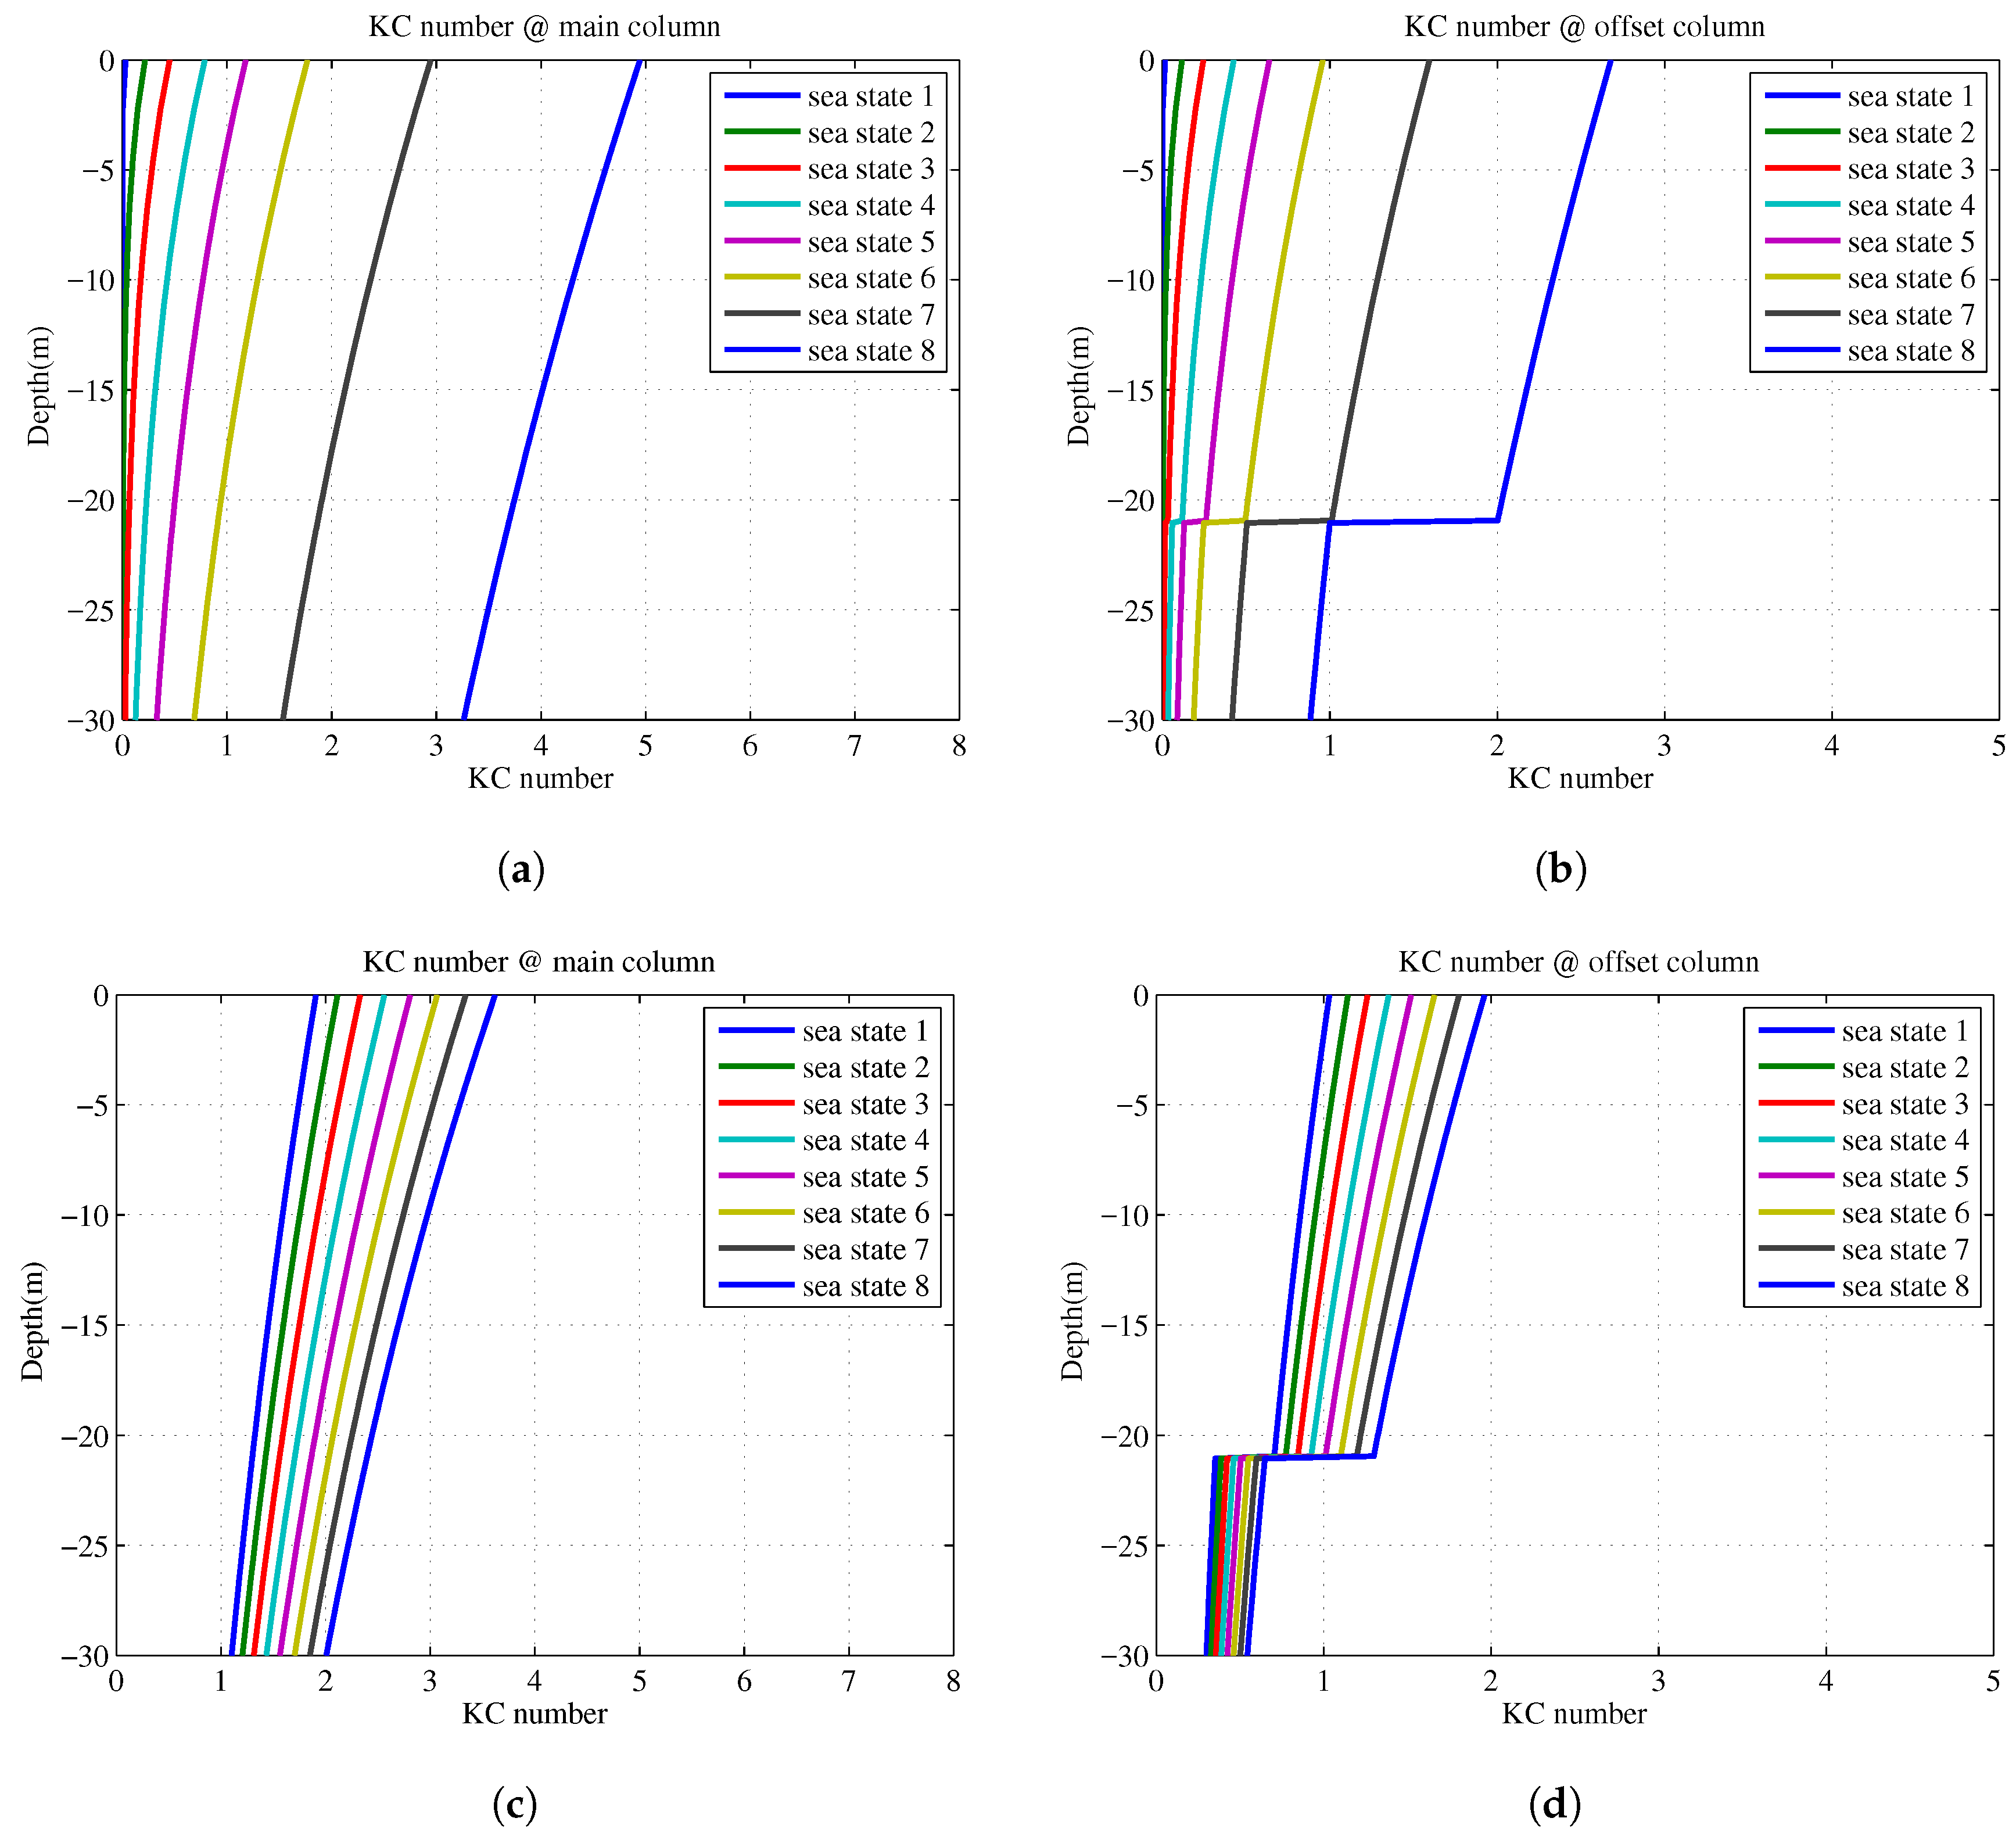
3.3.1. Keulegan–Carpenter Number: Flow-Structure Interaction

In this study, WAMIT, which is a panel method solver based on potential flow theory, is used to obtain the required linear hydrodynamic coefficients; the HydroDyn module in FAST accounts for the viscous drag forces. When potential flow theory is used to calculate diffraction forces, there is an assumption that no flow separation occurs. For cylindrical structures such as the columns of the semi-submersible platform in the present study, flow separation will occur when the KC number exceeds two. The KC number is a dimensionless parameter that describes the relative importance of the drag forces over inertia forces for an object in an oscillatory fluid flow; it is defined as follows:
K C = u T D
where D is the cylinder diameter, T is the wave period and u is the amplitude of the fluid velocity normal to the cylinder.
Generally, for a vertical cylinder with a large diameter, flow separation occurs only in: (i) the upper section of the cylinder, because of the larger fluid particle velocities closer to the surface; or (ii) in extreme sea states because of the associated longer wave period, T. As demonstrated in the OC4 study [17], the KC number is less than two for the large components of the OC4 DeepCwind semi-submersible platform for almost all sea states except for extreme wave conditions (such as the Normal Sea States 6–8 defined in Table 9). For these same sea states, we find that potential flow theory is more widely applicable for the 1.5-scaled SNL platform model than was the case for the OC4 DeepCwind platform (refer to Figure 7a,b). This is because of the increased dimensions of our scaled-up platform. In Figure 7c,d, we observe that even for very severe sea states [20] that are considered with the SNL model in a related study, the KC numbers are less than two in all the sea states for the offset columns, whereas for the main column, only two of the sea states show a KC value of greater than two. Hence, for all but the most severe sea states, the use of potential flow theory to obtain hydrodynamic coefficients can be justified. In a few extreme cases, flow separation becomes more important and, then, Morison’s equation will have to be utilized. The use of Morison’s equation permits us to include viscous drag forces that are generated due to incident wave kinematics and platform motions.

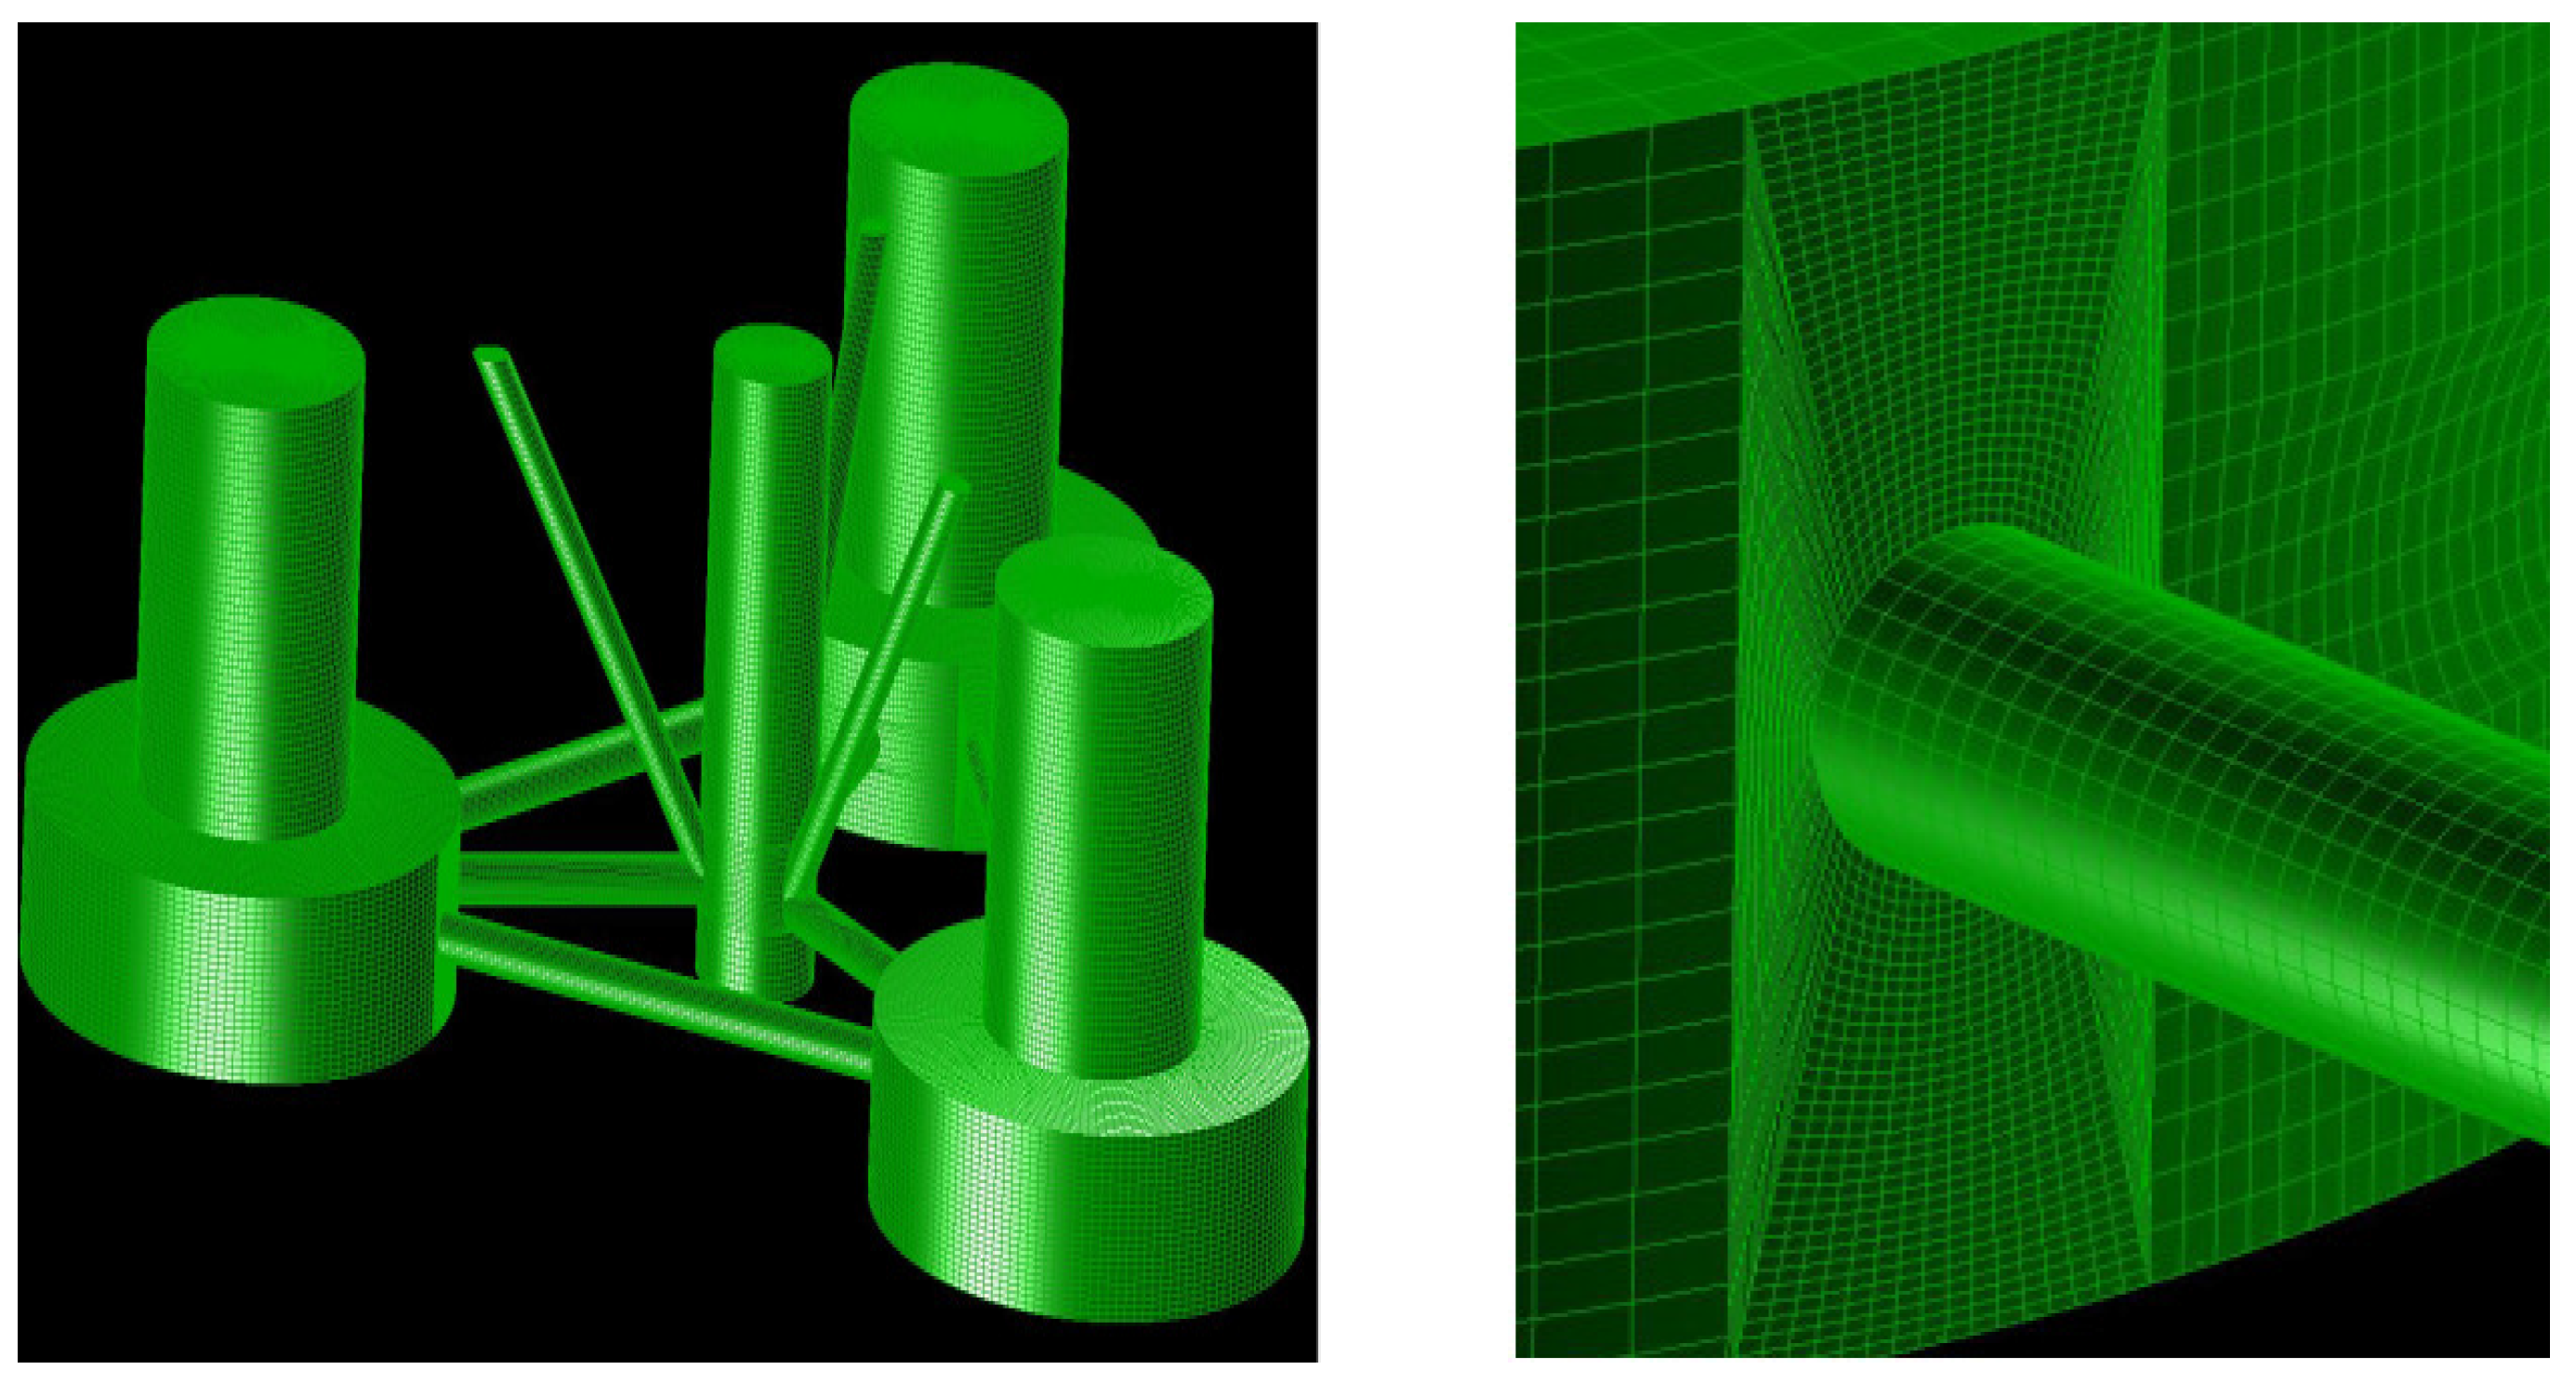
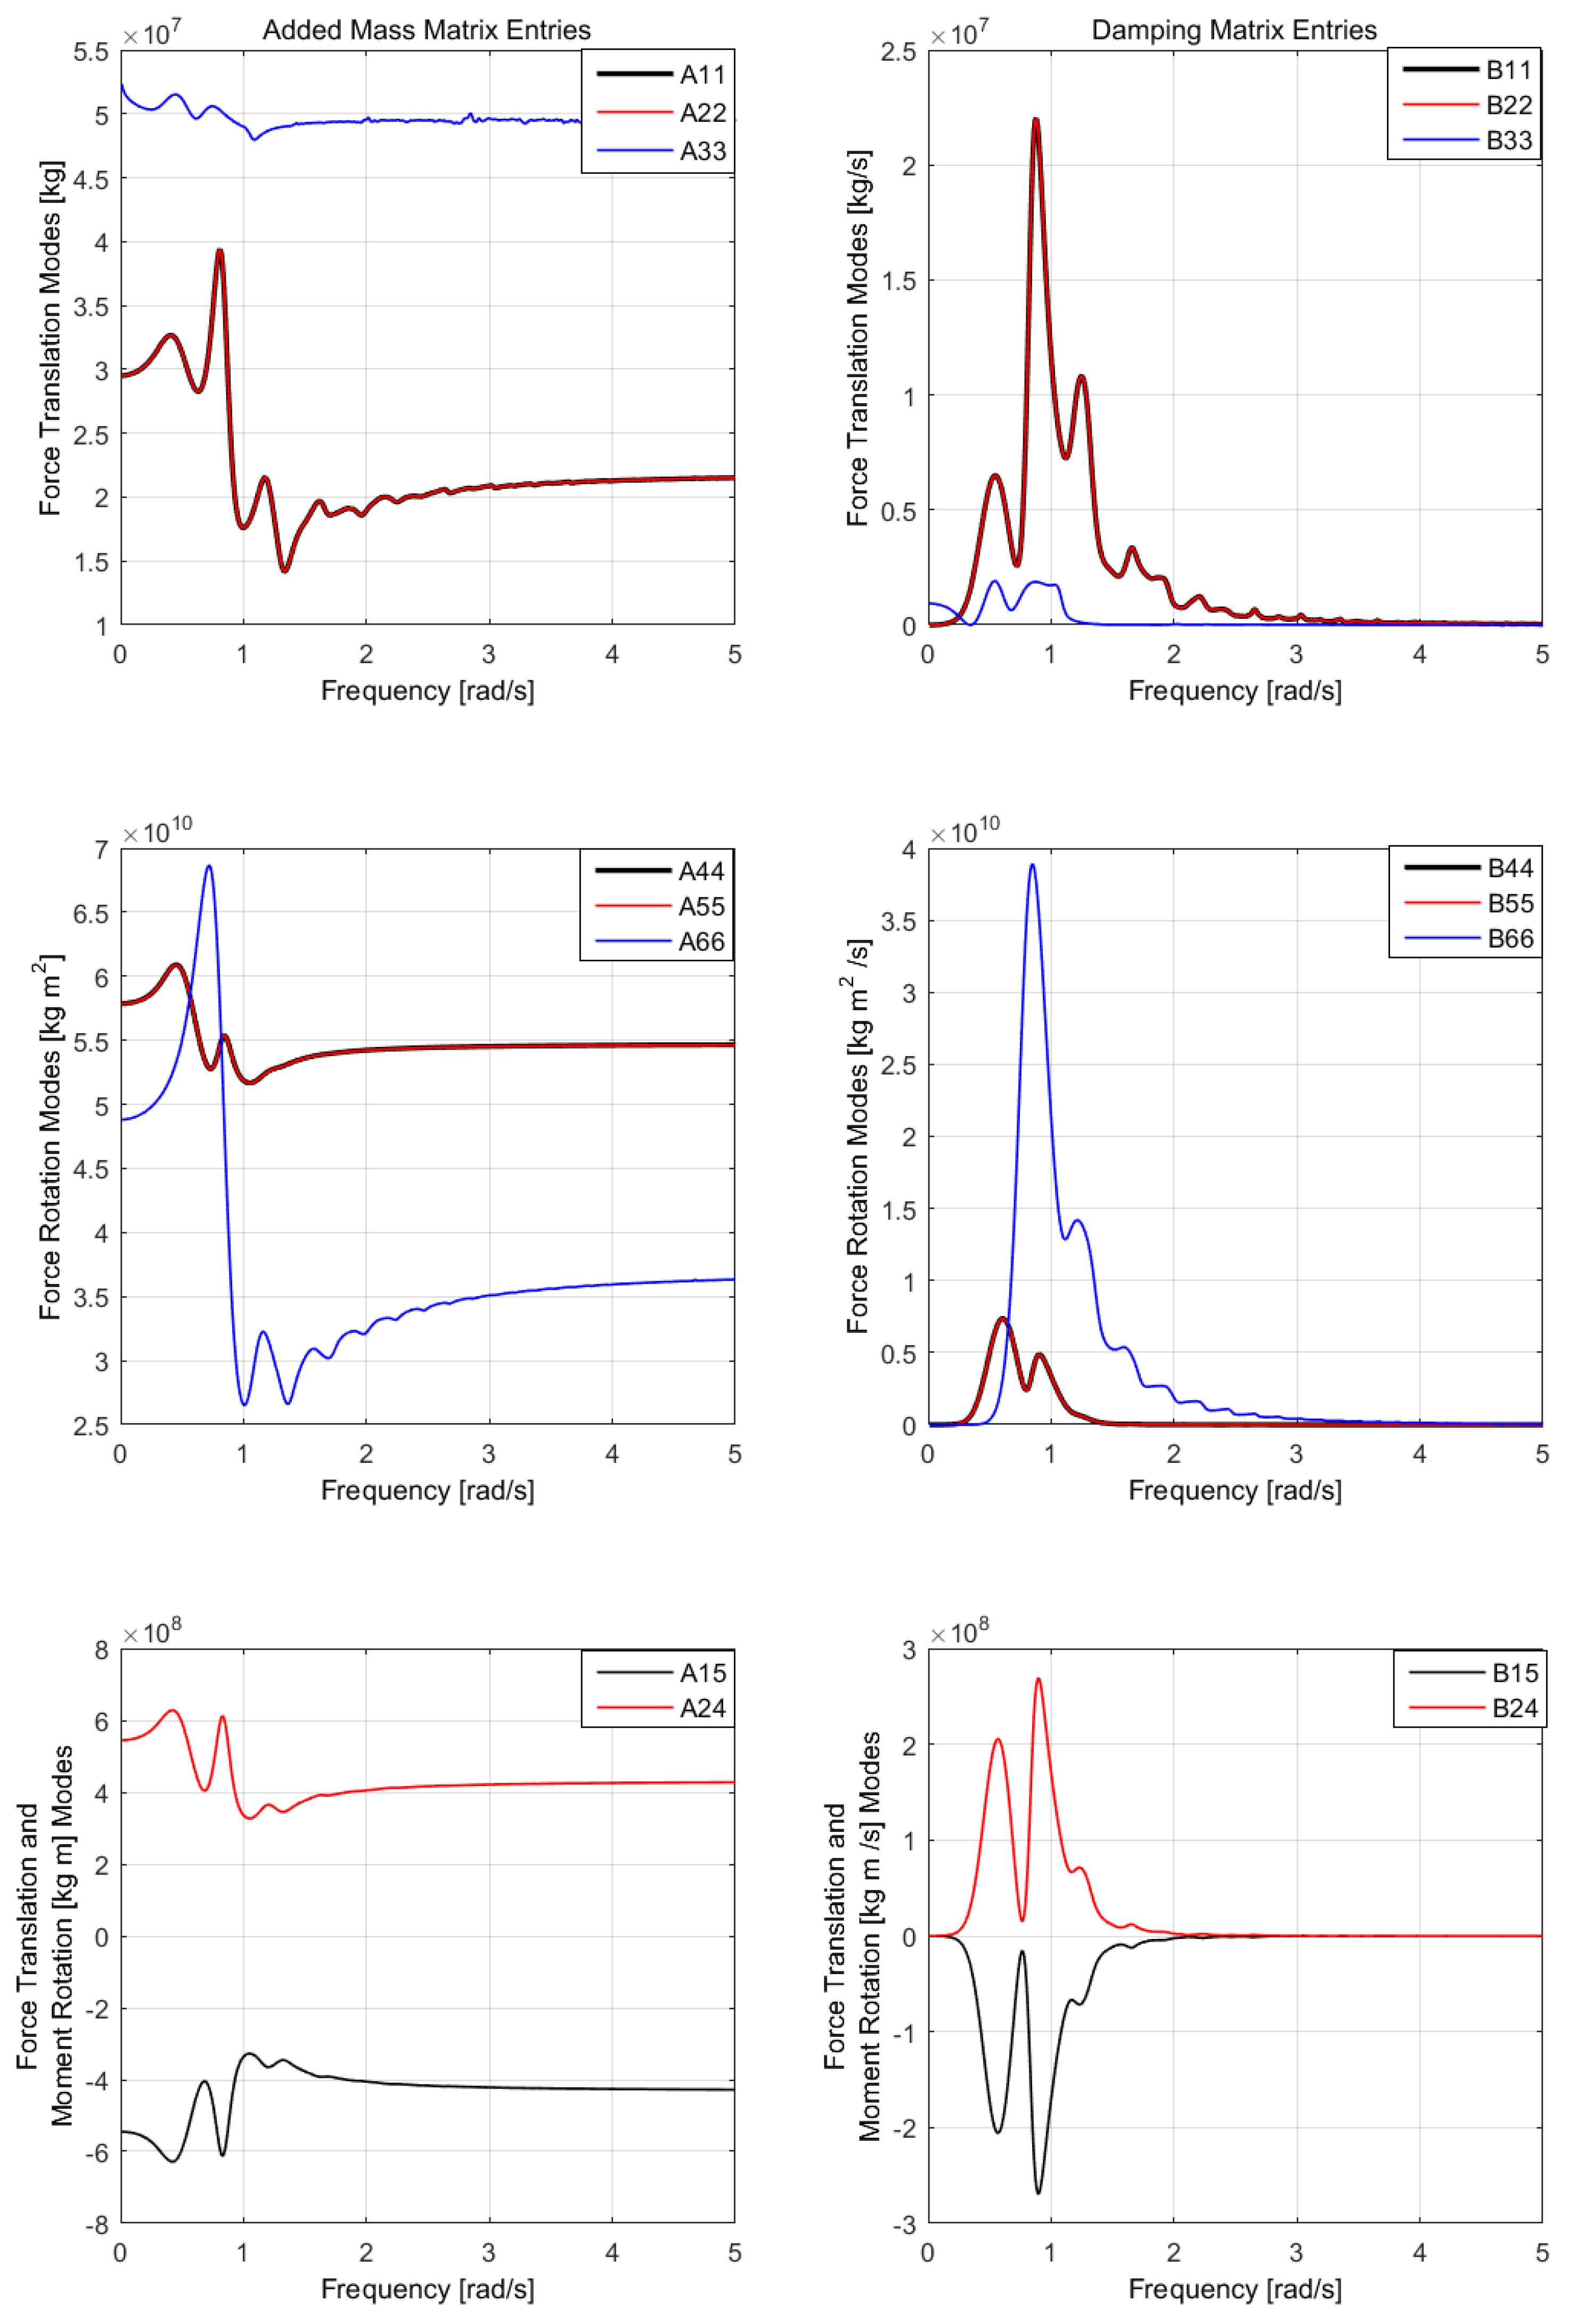
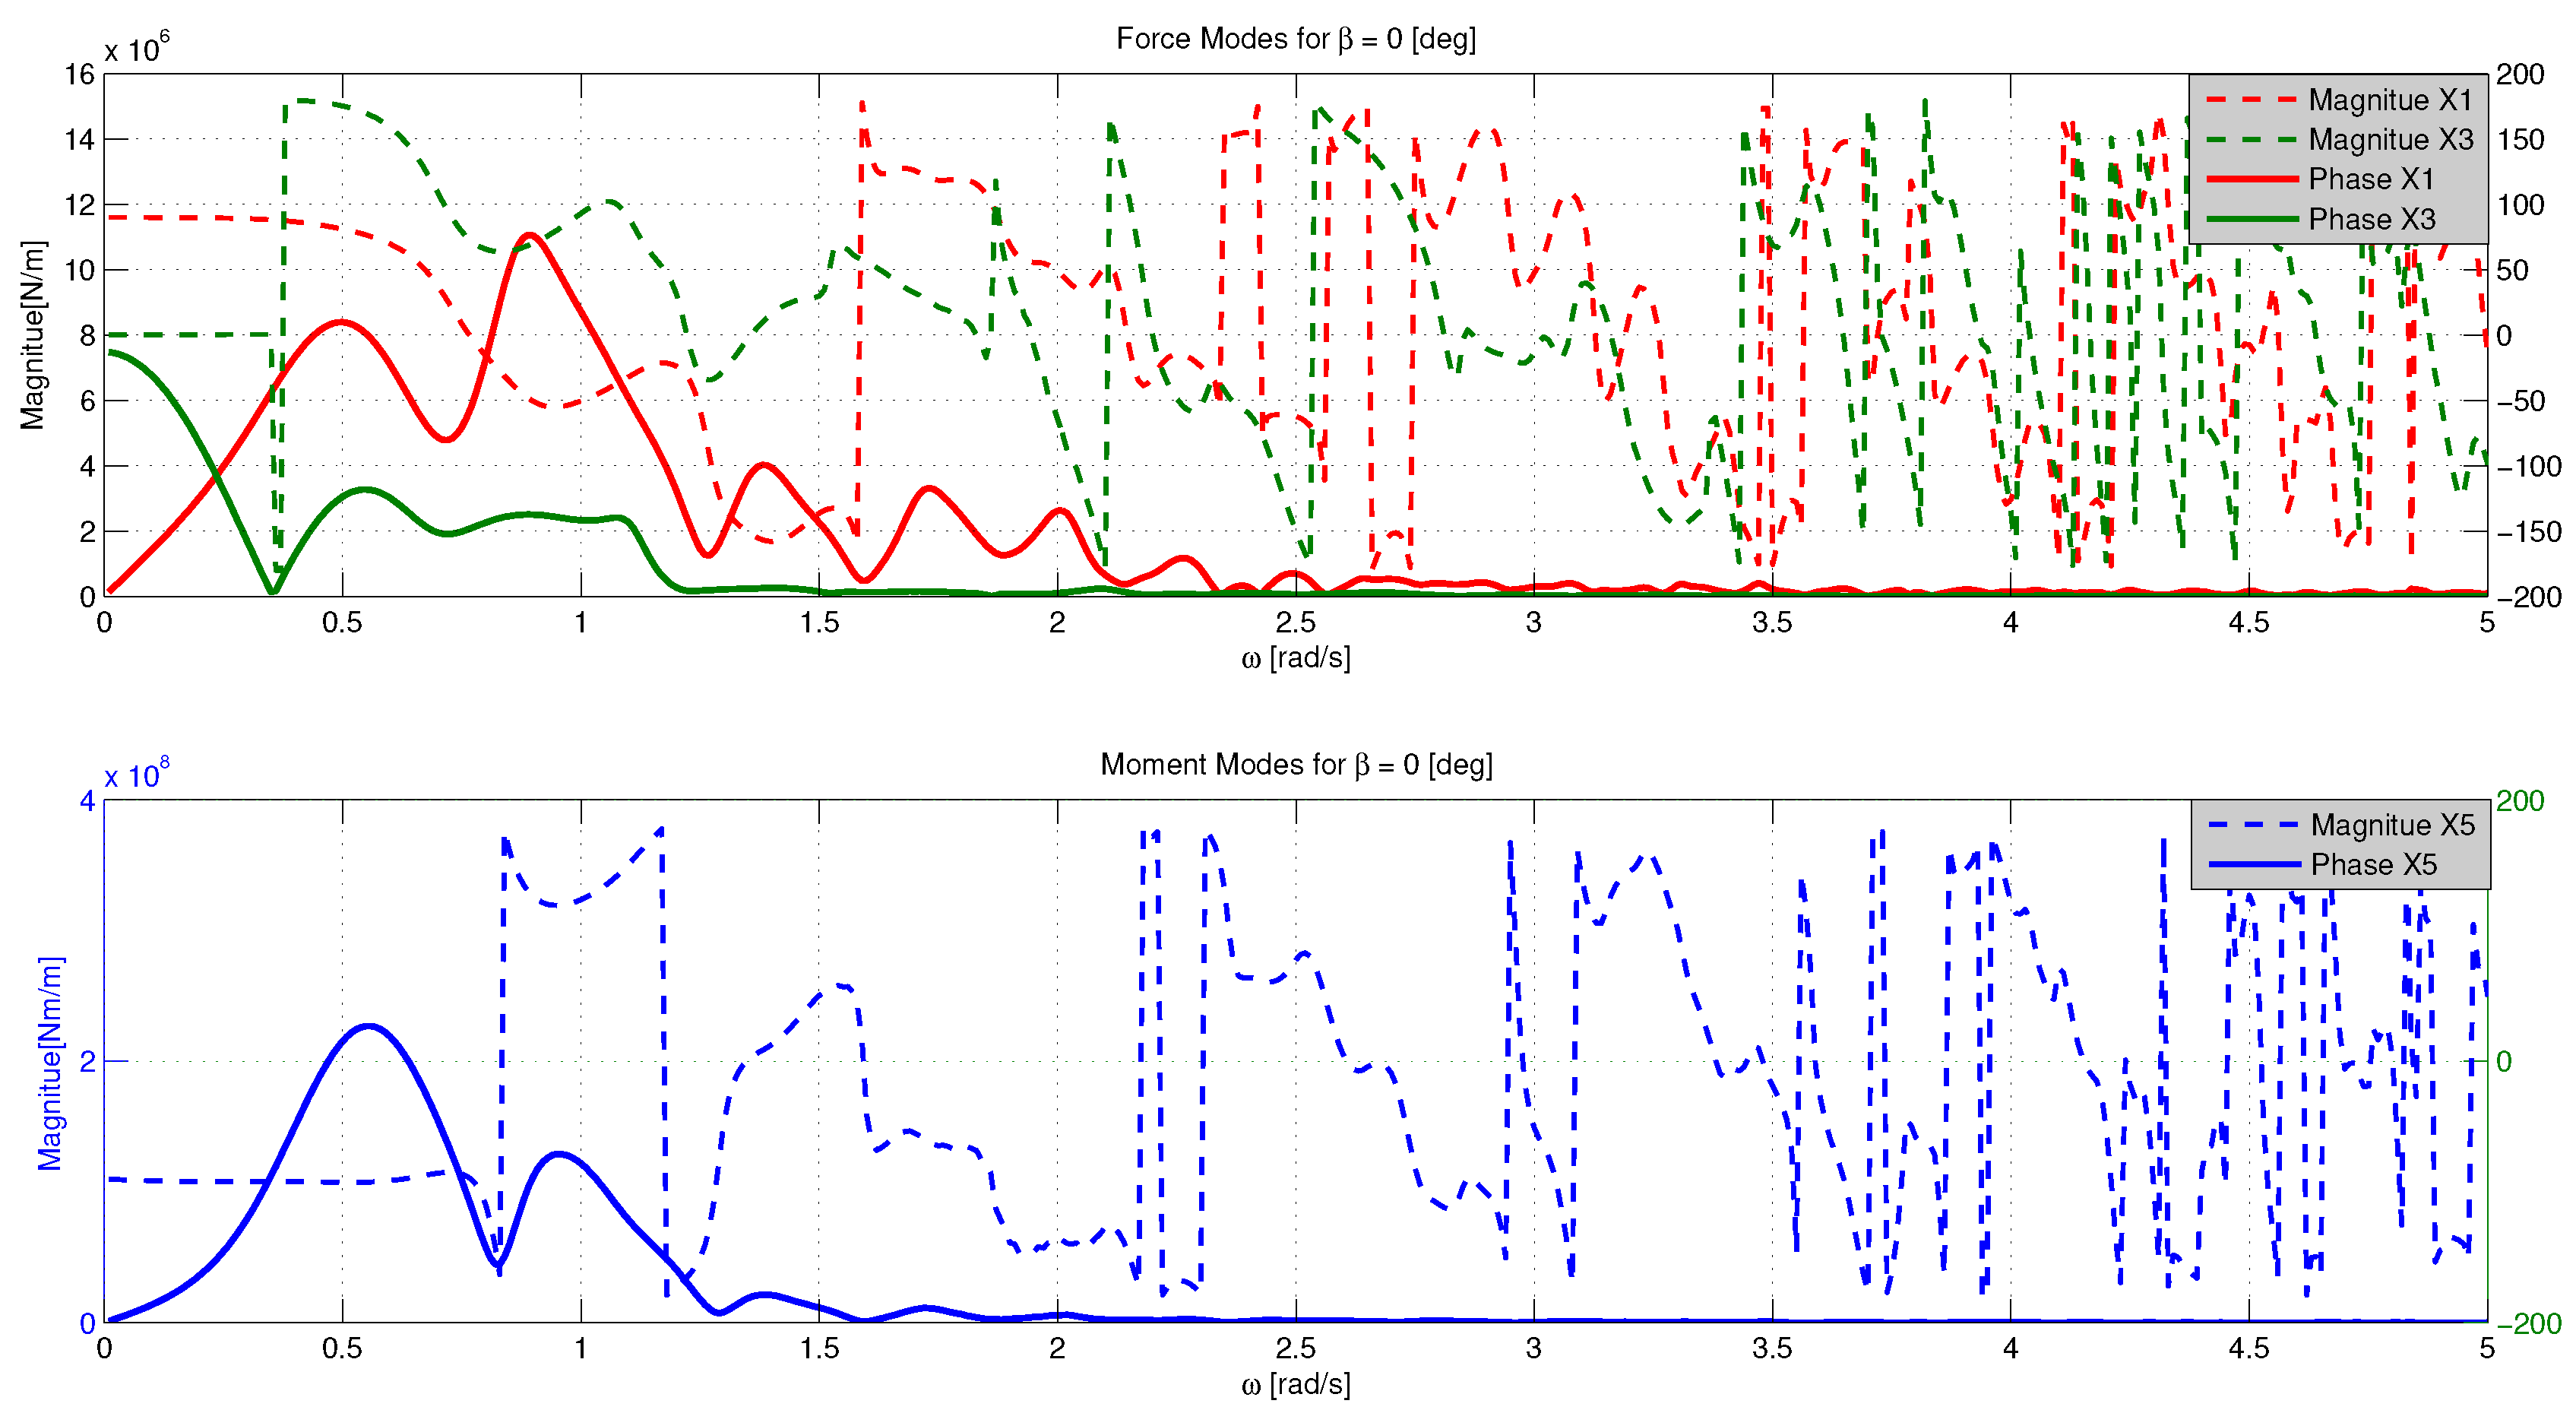
3.3.2. Platform Hydrodynamic Properties

Generally speaking, hydrodynamic loads on offshore structures include contributions from inertia (added mass), linear drag (radiation), buoyancy (restoring), incident-wave scattering (diffraction), sea currents and nonlinear effects. To the HydroDyn module within FAST, one needs to provide hydrostatic restoring, added mass and radiation damping contributions from linear wave radiation, including free-surface memory effects, incident-wave excitation from linear diffraction in regular or irregular seas and also nonlinear viscous drag from incident-wave kinematics, sea currents and platform motions. In this study, WAMIT is used to obtain the required linear hydrodynamic coefficients; the HydroDyn module in FAST accounts for the viscous drag forces. Some background related to hydrodynamics and the HydroDyn module in the context of problems such as the one in this work are discussed in other studies [5,19,21].
Since WAMIT is a code based on the panel method, the platform model is discretized into flat panels using a 3D computer-aided design (CAD) tool, MultiSurf. To improve the accuracy of the WAMIT results, a high-order representation of all geometric descriptions is desired. MultiSurf has the capability of achieving this, and models are easily exported directly to WAMIT. The advantages of a high-order analysis over a low-order analysis are that in the high-order representation, source and dipole densities over parametric surface patches are represented by B-spline distributions, while in low-order analysis, those densities are assumed to be constant. Hence, more accurate geometric models, as well as simulation results are possible with a high-order analysis. A MultiSurf model of the platform using a discretization with 53,760 panels is shown in Figure 8. A typical size of a panel element is 2 m, and meshes around connections between members are more refined. Taking advantage of symmetry about the x-axis, only half of the platform is used in developing the platform model.
As was demonstrated above, potential flow theory is generally valid with the SNL model for most sea states. The linear hydrodynamic radiation and diffraction problems are thus solved using WAMIT. Radiation-induced added mass A i j ( ω ) and radiation damping B ( i j ) ( ω ) matrices are given as a function of frequency, ω ( r a d / s ) , as shown in Figure 9. Due to the absence of forward speed, the added mass and radiation damping matrix are symmetric. In addition, A 11 and B 11 are identical to A 22 and B 22 because of the symmetric properties of the SNL semi-submersible platform; a similar relationship exists for A 44 , B 44 and A 55 , B 55 . The infinite-frequency added-mass matrix A is as follows:
A = 2.95 × 10 7 0 0 0 5.44 × 10 8 0 0 2.95 × 10 7 0 5.44 × 10 8 0 0 0 0 5.04 × 10 7 0 0 0 0 5.44 × 10 6 0 5.79 × 10 10 0 0 5.45 × 10 8 0 0 0 5.79 × 10 10 0 0 0 0 0 0 4.88 × 10 10
Figure 10 shows the amplitude and phase values of the hydrodynamic wave-excitation vector from the linear diffraction problem as a function of frequency resulting from incident waves at zero wave heading (i.e., in the surge direction). Because of the selected direction of the incident waves, loads in the direction of sway (Mode 2), roll (Mode 4) and yaw (Mode 6) DOFs are zero because the wave forces are in the X-Z plane. The infinite-frequency limit is zero for all the force coefficients.
As mentioned earlier, if the KC number exceeds two, potential flow theory is no longer valid. Flow separation becomes more important in this case and can lead to viscous drag forces on the platform. In HydroDyn, this is accounted for by including the nonlinear viscous drag term, 1 2 C d ρ D ( u q ˙ ) | u q ˙ | , in Morison’s equation (where C d is a drag coefficient, ρ is the density of water, D is the body diameter, u is the water particle velocity and q ˙ is the structural velocity). The drag coefficient, C d , is a function of Reynolds number, which could vary greatly across the flow regimes for each structural member. In the design of the OC4 platform, an average C d value was calculated for each member, with special attention given due to the heave plate. For the SNL model presented, averaged drag coefficients are also used and are assumed to be the same as those calculated for the OC4 platform; see Table 10. Other hydrodynamic properties of the platform are also included in the table.
In conclusion, after the first phase of the static design and analysis that involves an iterative process, the SNL 13.2 MW wind turbine with SNL 100-02 blades is supported by a semi-submersible platform model with a scale factor of 1.5 (relative to the OC4 baseline model), a mooring system with the line diameter scaled up by a factor of 2.0 and a tower structure with a hub height of 133.5 m above the still water level. A schematic representation of the selected integrated system is presented in Figure 11.

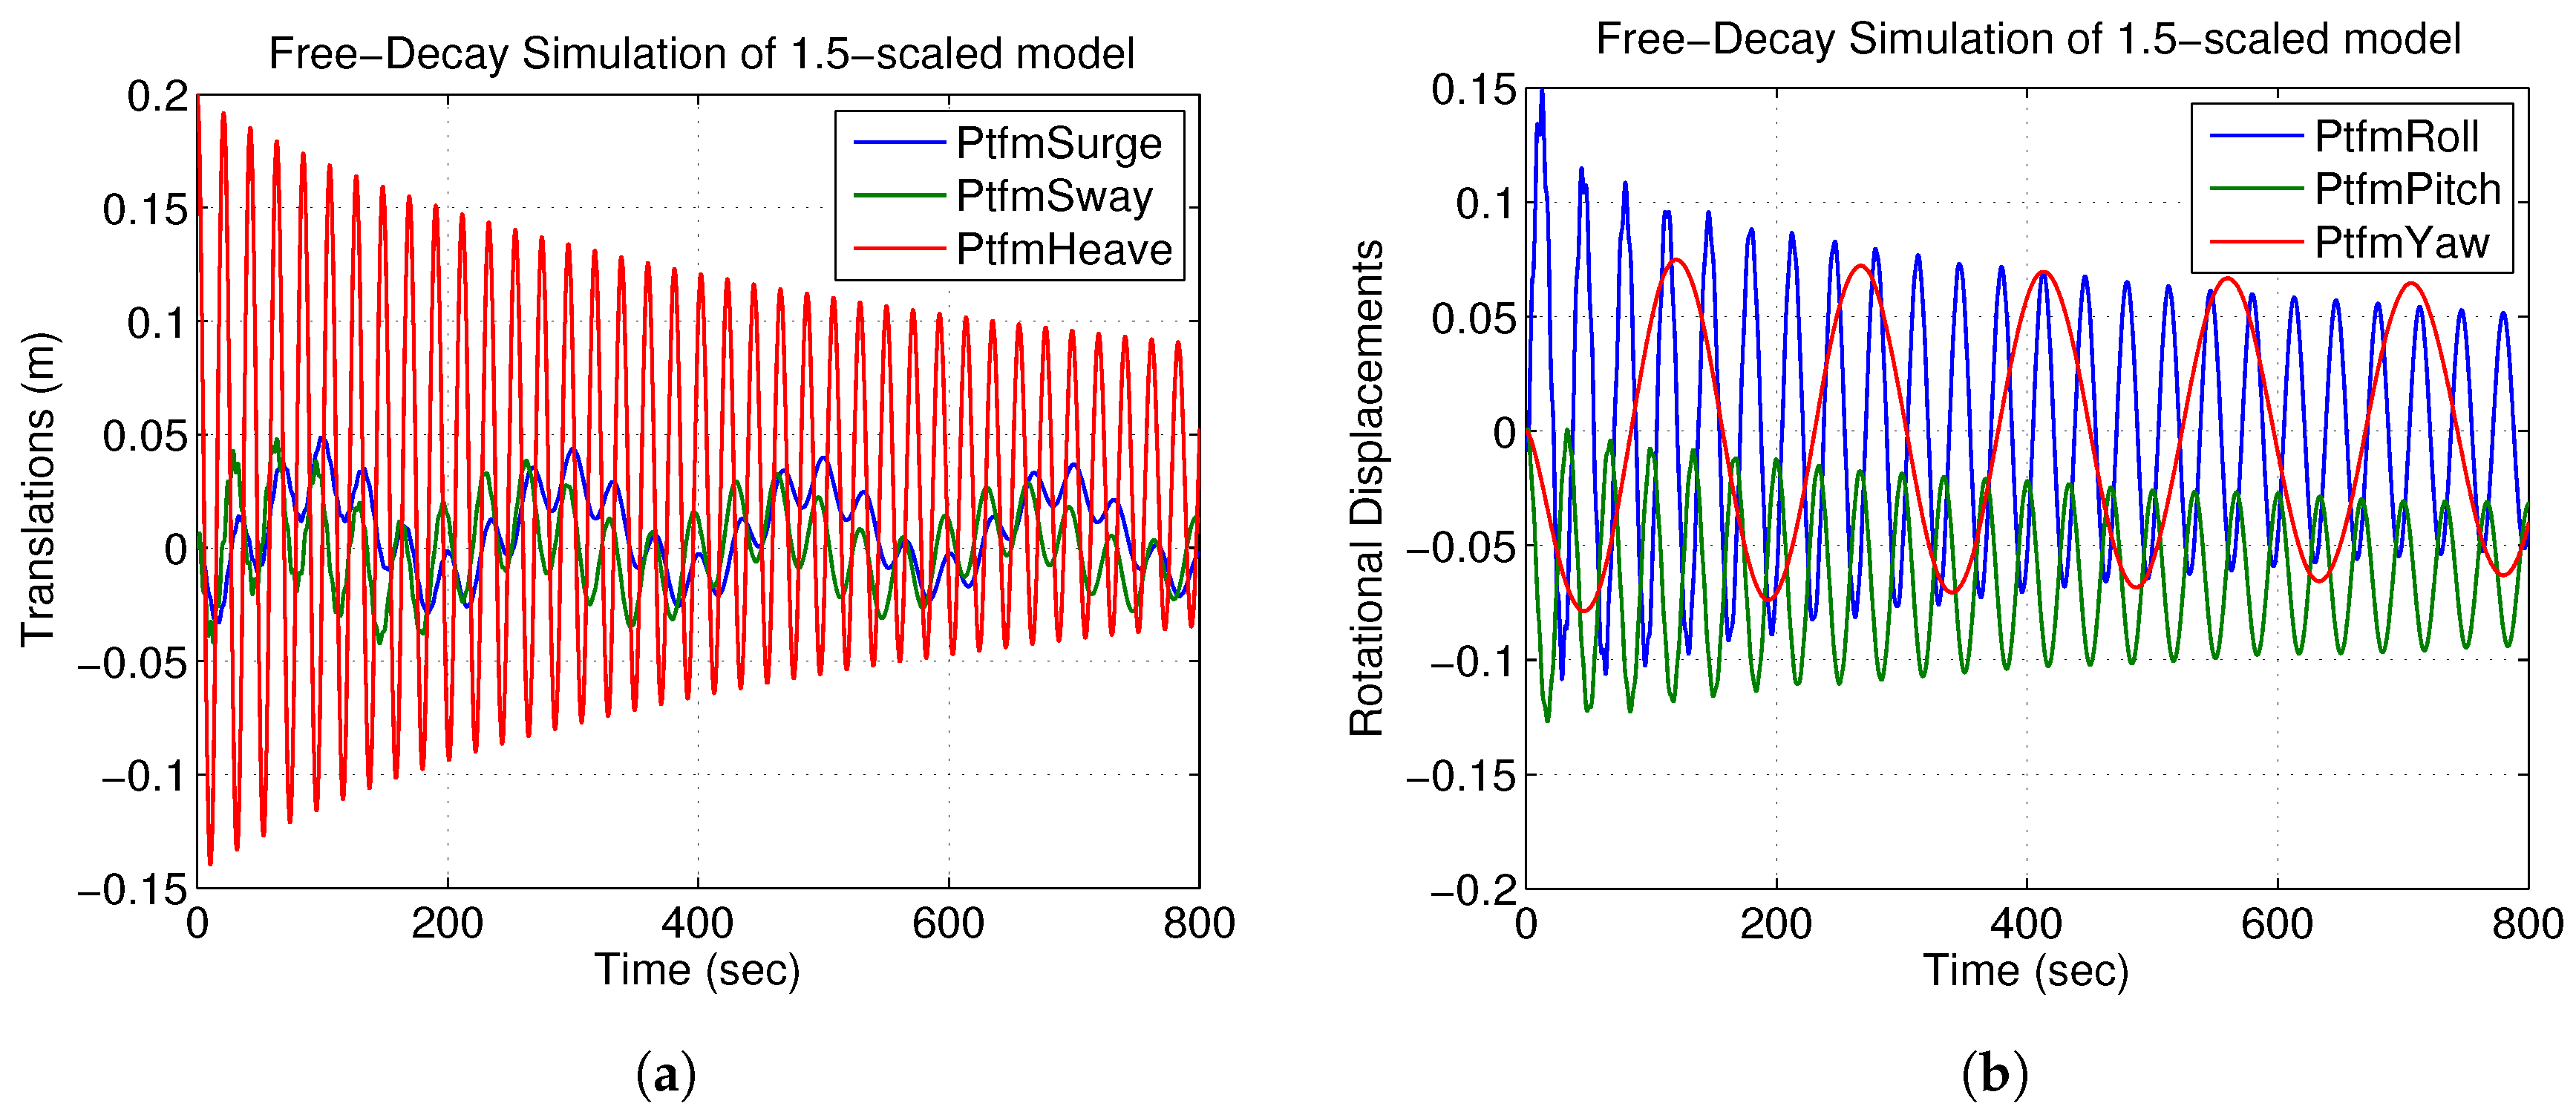
3.3.3. Free-Decay Simulation

Free-decay simulation is conducted in FAST by applying a specific initial platform displacement without the existence of wind, waves and currents. AeroDyn is disabled for this purpose, and the wave mode is chosen to be “still water” in HydroDyn. An initial heave motion of 0.2 m is applied in this study. As can be seen from Figure 12, all six modes stabilize with time. For surge, sway, roll and yaw motion, the platform oscillates around zero as expected. There is a slight offset of about 0.02 m in heave motion, which is negligible for such a large system. Pitch motions show an approximately −0.06 degree offset at steady state, which could be explained by the fact that the center of mass (CM) of the wind turbine is misaligned with the CM of the platform vertically. Coupling among these six modes is evident in the free-decay simulation results.

4. Response Analysis of Integrated SNL 13.2-MW FOWT

A final step in the iterative model development is to evaluate the static and dynamic performance of the integrated wind turbine system. Time-domain simulation is carried out for different sea states in FAST, and the system response is analyzed to help understand the behavior of the integrated system. The coupled FAST solver works as follows. Time series of three orthogonal components of the wind velocity vector are simulated using TurbSim [22] with a spectral model as opposed to physics-based models. Target power spectra for each turbulence component and spatial coherence functions are defined in the frequency domain; stationary time series are then generated using inverse Fourier transforms. The output wind velocity fields from TurbSim serve as input to AeroDyn [23], which is used to compute aerodynamic forces based on the blade-element momentum (BEM) theory. Hydrodynamic loads on the platform are calculated using potential flow theory with platform properties as defined earlier. Viscous drag forces are accounted for by including the nonlinear drag term in Morison’s equation. Loads in the mooring lines corresponding to the time-varying hydrodynamic loads on the system are evaluated using MAP++ based on a multi-segmented quasi-static mooring model [24]. The structural dynamic response of the integrated system including the rotor, drivetrain, nacelle, tower and platform are evaluated in ElastoDyn within FAST.
All the structural and dynamic properties of each subsystem that have been demonstrated will be implemented in the integrated system’s FAST model. Environment conditions are defined by specifying assumptions on wind velocity, wave height and wave period descriptions, without consideration of current. A series of time domain simulation results including steady-state responses, response amplitude operators (RAOs) and overall performance under selected DLCs and responses under turbulent wind fields and for long-crested irregular waves are discussed.

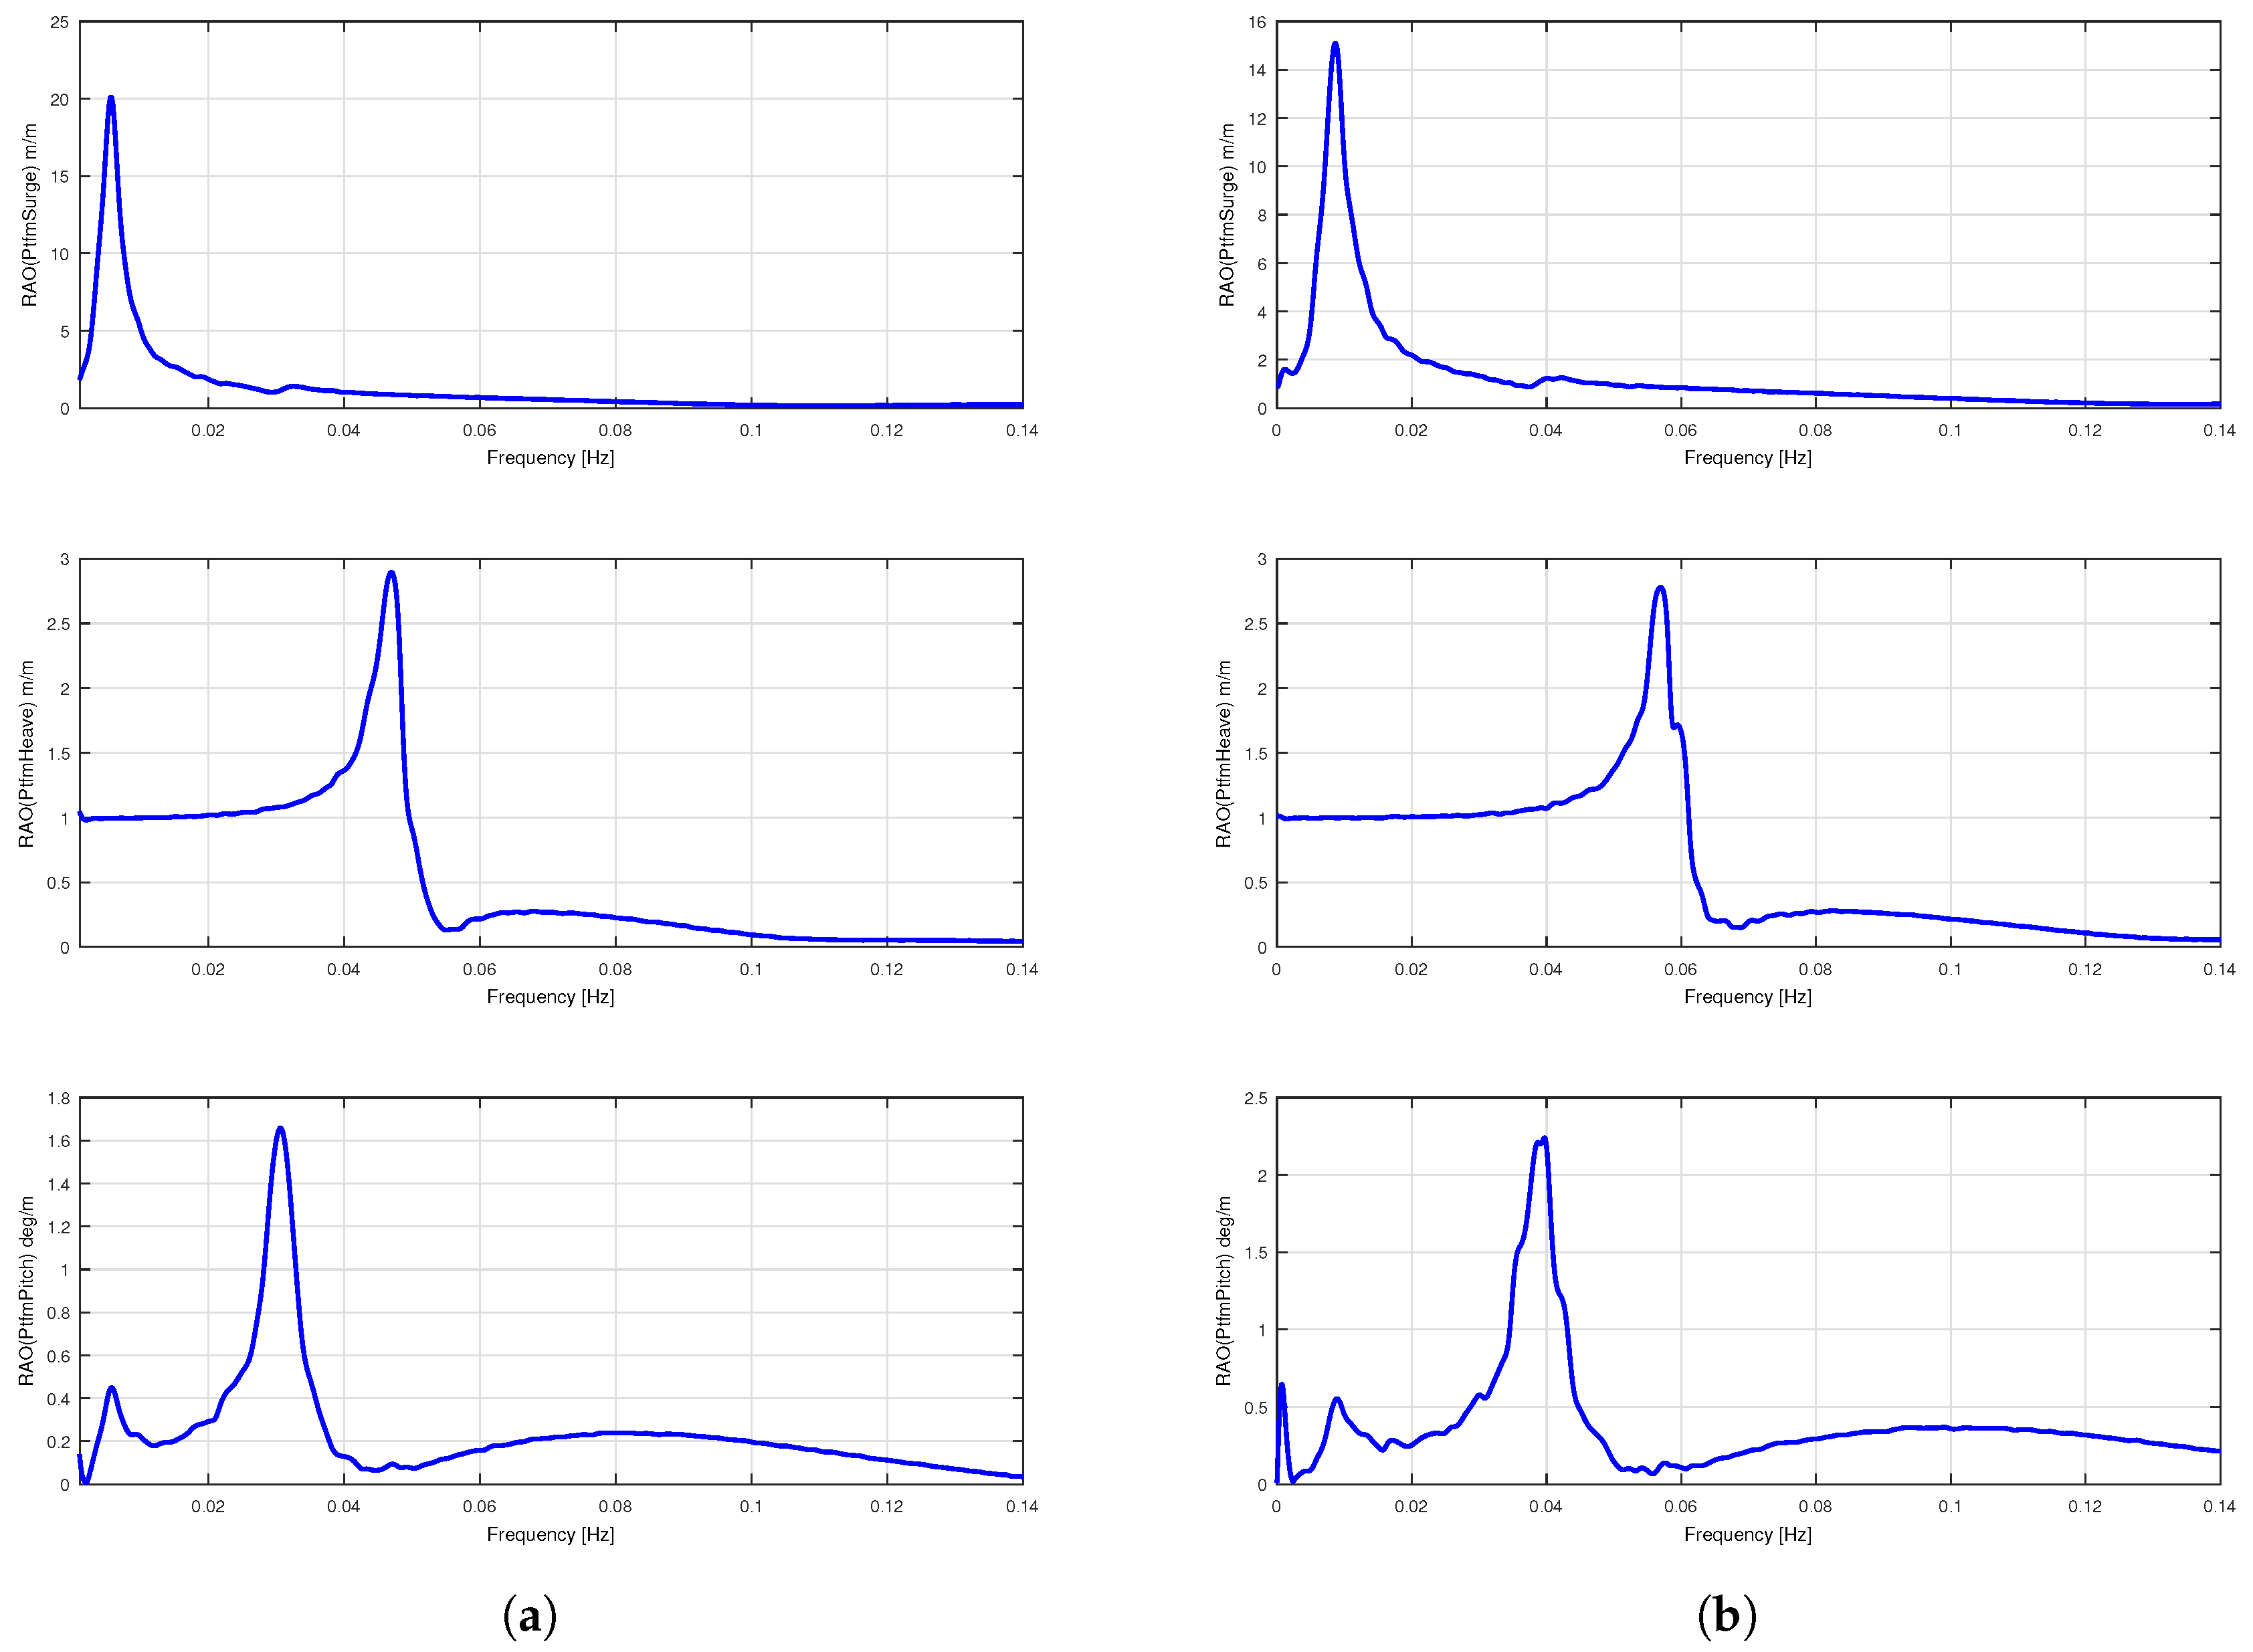
4.1. Response Amplitude Operators

Response amplitude operators (RAOs), which represent the response of a system to a unit-amplitude periodic wave from a given direction or heading, are commonly used in the design of floating structures to study their dynamic characteristics. A variety of methods can be used to establish RAOs for a specific offshore structure. Depending on the design stage and system complexity, either a frequency-domain method is used, which involves calculating added-mass, A i j , damping, B i j , and excitation forces, X i j , and solving the dynamic motion Equation 3 in the frequency domain or a time-domain method is used, which involves calculating the steady-state force directly, due to a series of regular waves with unit amplitude.
M + A ( ω ) x ¨ + B ( ω ) x ˙ + C x = F ( ω )
The consistency of these two alternative methods for floating offshore wind turbines has been discussed in other studies [9,25]. Results suggest that maximum values from time-domain analyses of the RAOs generally shift towards lower frequencies because of the nonlinear and flexible properties of the floating offshore wind turbine. Coupling of the platform motions and of the flexible tower and blades also explains some of the difference.
To account for the nonlinear characteristics of the integrated system, time-domain computations based on white-noise wave excitation using FAST are carried out in this study. Figure 13a shows RAOs for three platform motion DOFs for the SNL turbine floating platform model (with every possible DOF represented) subjected to zero wind speed. For comparison, similar RAOs for the OC4 DeepCwind platform model are shown in Figure 13b.
As can be seen from Figure 13, energy in the motions is concentrated on low wave frequencies. The coupling between surge and pitch motions is evident at frequencies around 0.01 Hz. Furthermore, response amplitudes are comparable with those for the OC4 DeepCwind platform motions. The SNL 13.2-MW turbine platform’s surge motion maximum RAO value is a little larger, around 20 m at a frequency of 0.0057 Hz, compared to that for the OC4 DeepCwind model, which is around 15 m at a frequency of 0.0089 Hz. The maximum pitch motion response amplitude for the SNL model is around 1.6 degrees at a frequency of 0.03 Hz, which is smaller than that for the OC4 model, which is around 2.2 degrees at a frequency of 0.04 Hz. The somewhat lower frequencies for peak response in the SNL model may be explained by the increased system mass compared to that for the OC4 model. In summary, the behavior of the SNL 13.2-MW turbine platform model is reasonable and in an expected range and comparable to that of the semi-submersible platform used in the OC4 study. Time-domain simulations under sea states associated with rated and cut-out wind speeds are considered next in order to assess the extreme performance of the integrated system.

4.2. Steady-State Response of Integrated System under Uniform Wind and Regular Waves

Steady-state simulations are performed using FAST under uniform wind fields without shear and for regular waves. The desired wind field can be easily generated in AeroDyn by specifying the target wind velocity; the wave height and wave period are specified in the HydroDyn module for the regular wave mode. The response of the mooring lines is captured by quasi-static analysis using the Mooring Analysis Program (MAP), which is integrated in FAST. The steady-state time-domain analyses can be helpful in understanding the overall and fundamental behavior of the integrated turbine-platform-mooring system.
The model is first studied at the rated wind speed and for a unit-amplitude wave. The wave frequency is chosen to match the natural frequency of the platform in surge (0.0057 Hz). As can be seen in Figure 14, the surge and pitch motions are the most significant compared with the other four motions. The resonance response of the platform’s surge motion is triggered because of the chosen wave frequency, which is close to the platform’s natural frequency in surge. Since both wind and waves are propagating only in the x-direction, relative small response levels in the sway and roll modes are found. Some coupling among different types of motion is evident in the time series.
The sea state studied here in a steady-state analysis, next, is based on recorded data from a site located close to Half Moon Bay, about 24 nautical miles south-southwest of San Francisco, California. Wind and wave data are available from National Data Buoy Center (NDBC) Station 46012. The geographical coordinates of this site are 27 ° 21 N, 122 ° 52 W. The selected sea states in Table 11 are for wind speeds around the rated wind speed, where extreme response levels usually occur. Simulations of 10-min duration for each case are studied, and results from these simulations presented in Table 12 are based on the steady-state response after transients die out. In the table, the response variables are TwrBsMyt (fore-aft tower-base bending moment), PtfmSurge (platform surge), PtfmHeave (platform heave), PtfmPitch (platform pitch), and TFair (tension at the fairlead); in the case of the TFair, the “[1]” refers to Line 1. Response maximum results are seen to be not excessively large for any of the sea states; this helps in further validating the selected model in terms of pitch and heave motions.

4.3. Selected Design Load Cases Analysis

For a large number of sea states identified in an associated study [26] for a site in the North Sea [27] (with a water depth of 200 m), a series of design load cases (DLCs) as defined in IEC 61400-3 [28] is considered to evaluate the integrated system’s motions and loads. Wind turbine Class I with Turbulence Category A per IEC definitions is considered. Computed values of platform surge (PtfmSurge), platform pitch (PtfmPitch), blade-root out-of-plane bending moment (RootMyc1), tower-base fore-aft bending moment (TwrBsMyt) and mooring line tension at the fairlead (TFair) for the DLC 1.1 [28] case are 24.2 m, 5 deg, 69.3 MN-m, 662.8 MN-m and 4.7 MN, respectively. In Table 13, these values are considered the “reference” (1.00) values against which the other DLCs are compared. The wind conditions considered include NTM (normal turbulence model), ETM (extreme turbulence model), ECD (extreme coherent gust with direction change), EWS (extreme wind shear), EOG (extreme operating gust) and EDC (extreme direction change) [13].
The system response (loads and motions) are highest for the EOG and EDC cases at startup. Both of these DLCs are for deterministic wind profiles and temporal variations, but the blade-pitch control action is assumed inactive at these abnormal conditions at startup. The out-of-plane blade bending moment is found to be higher for the ECD case compared to NTM and ETM; however, other system response variables for ECD are comparatively lower [13].

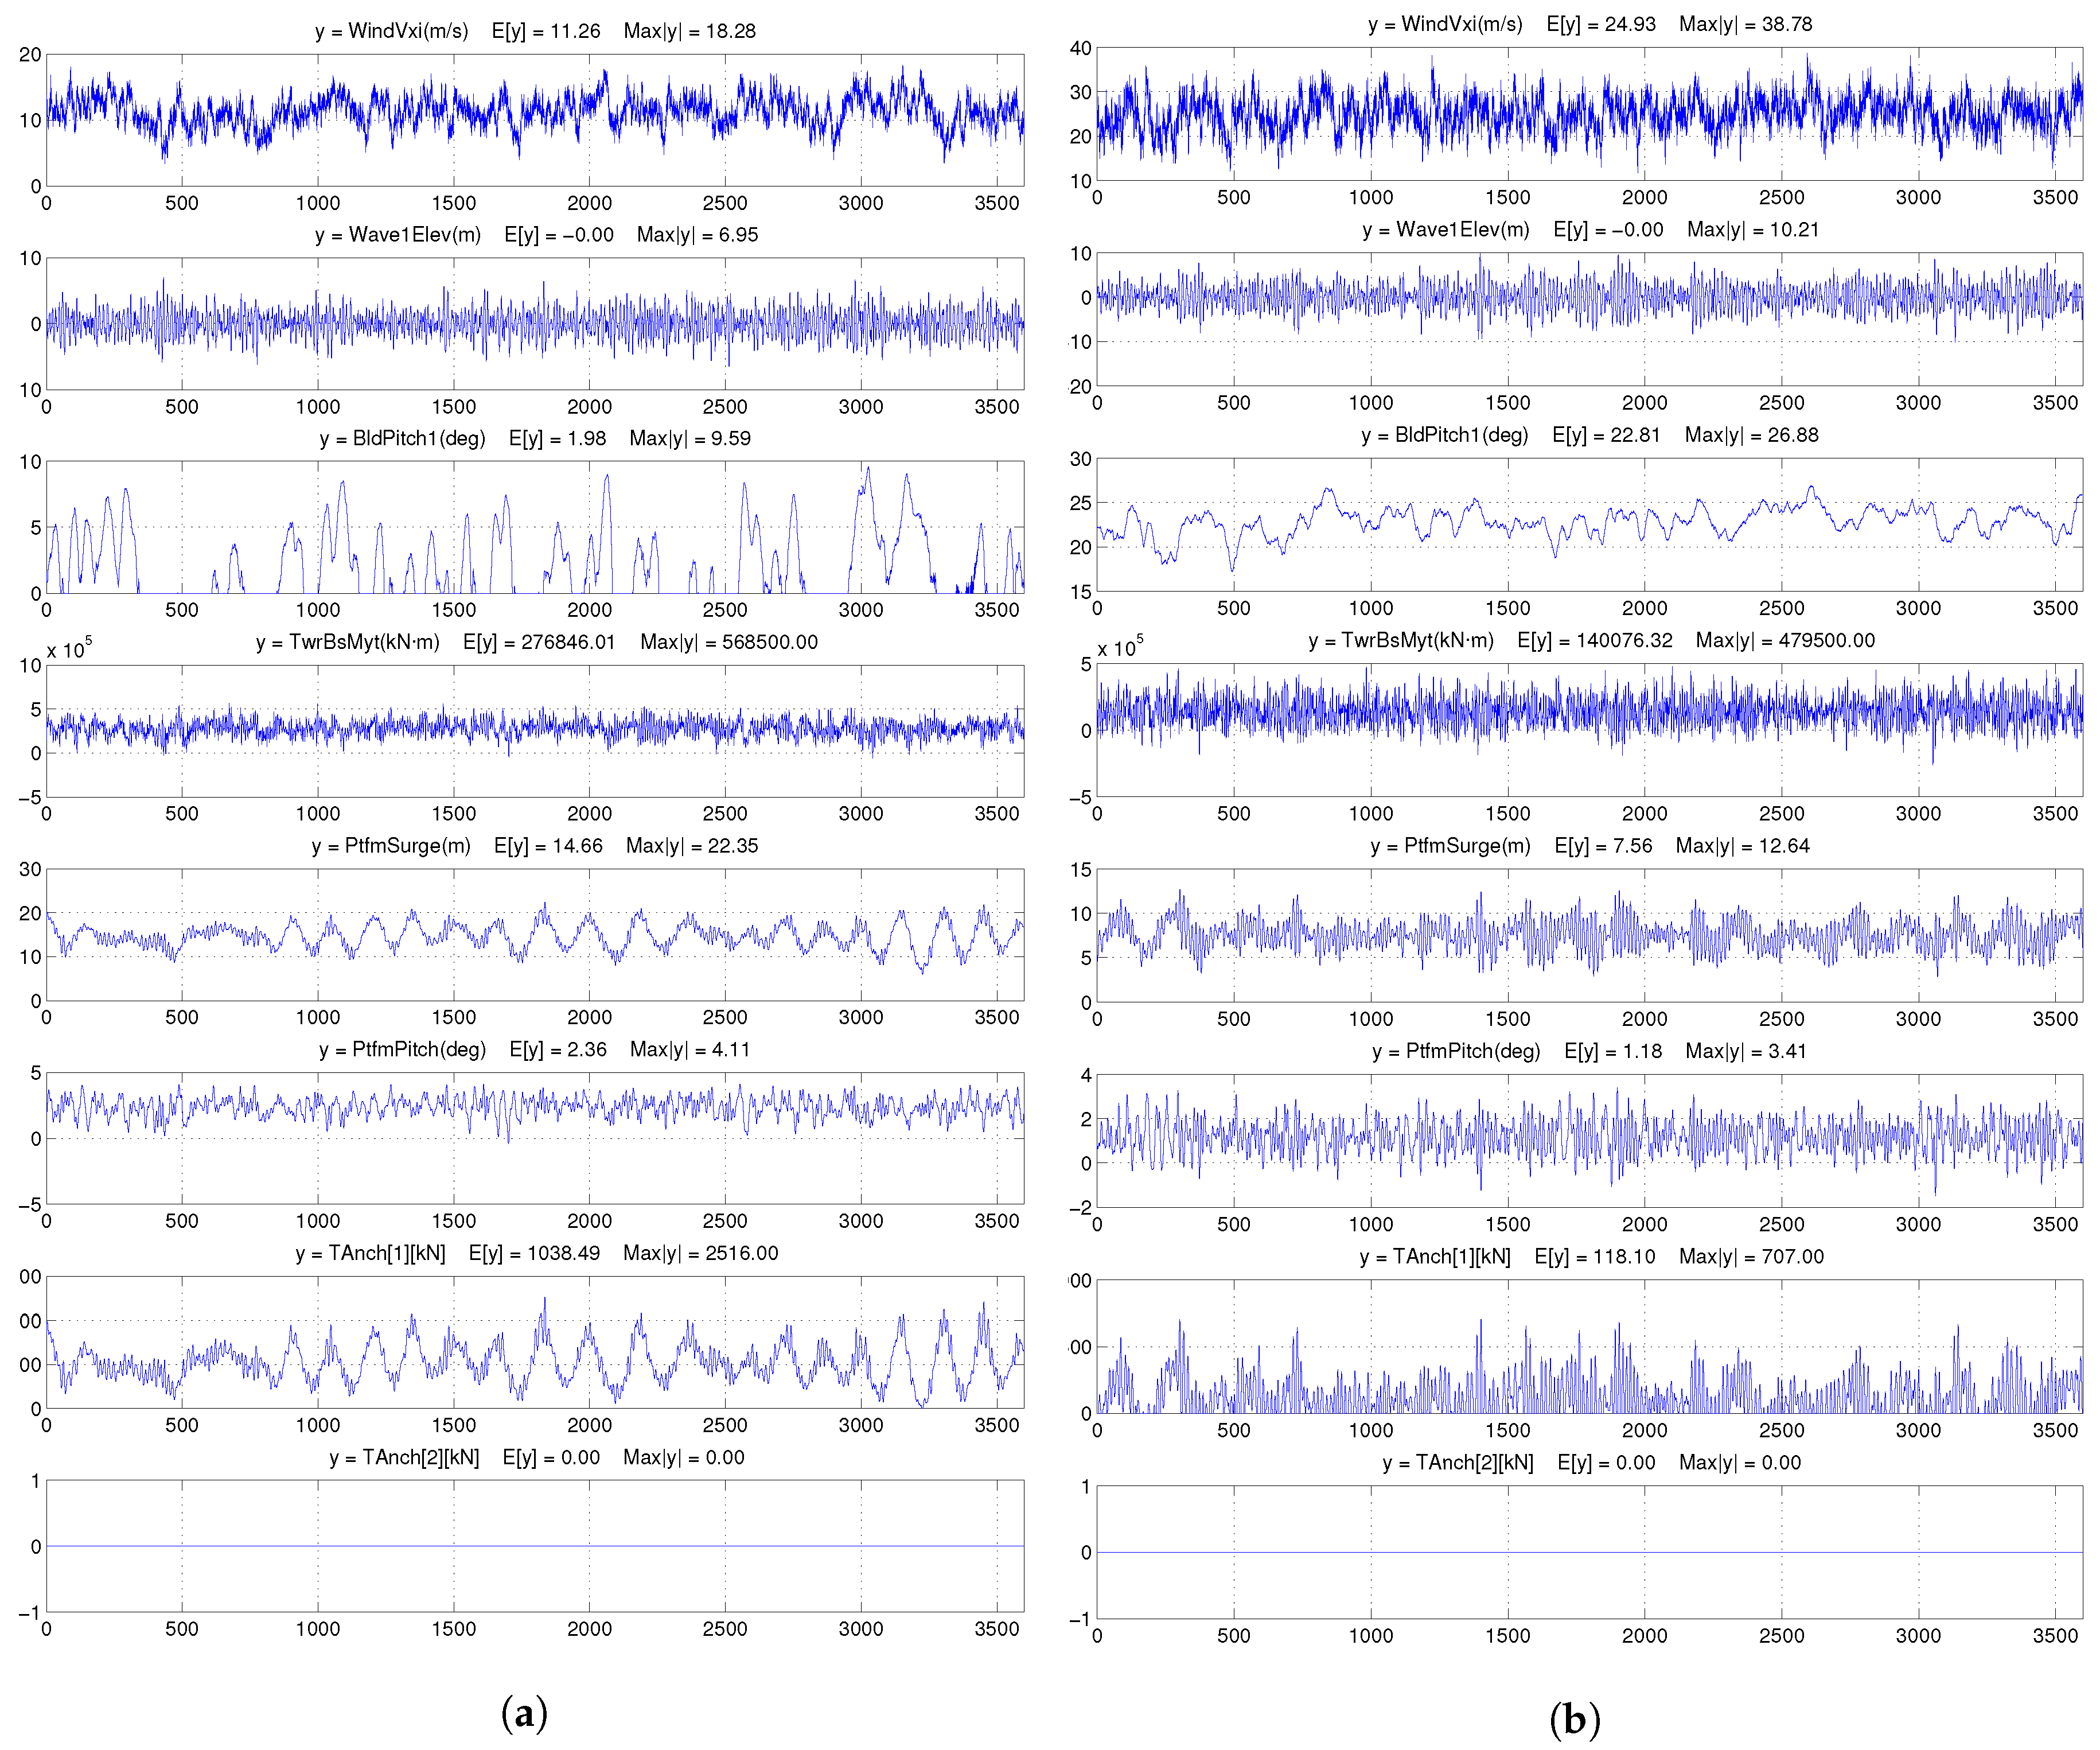
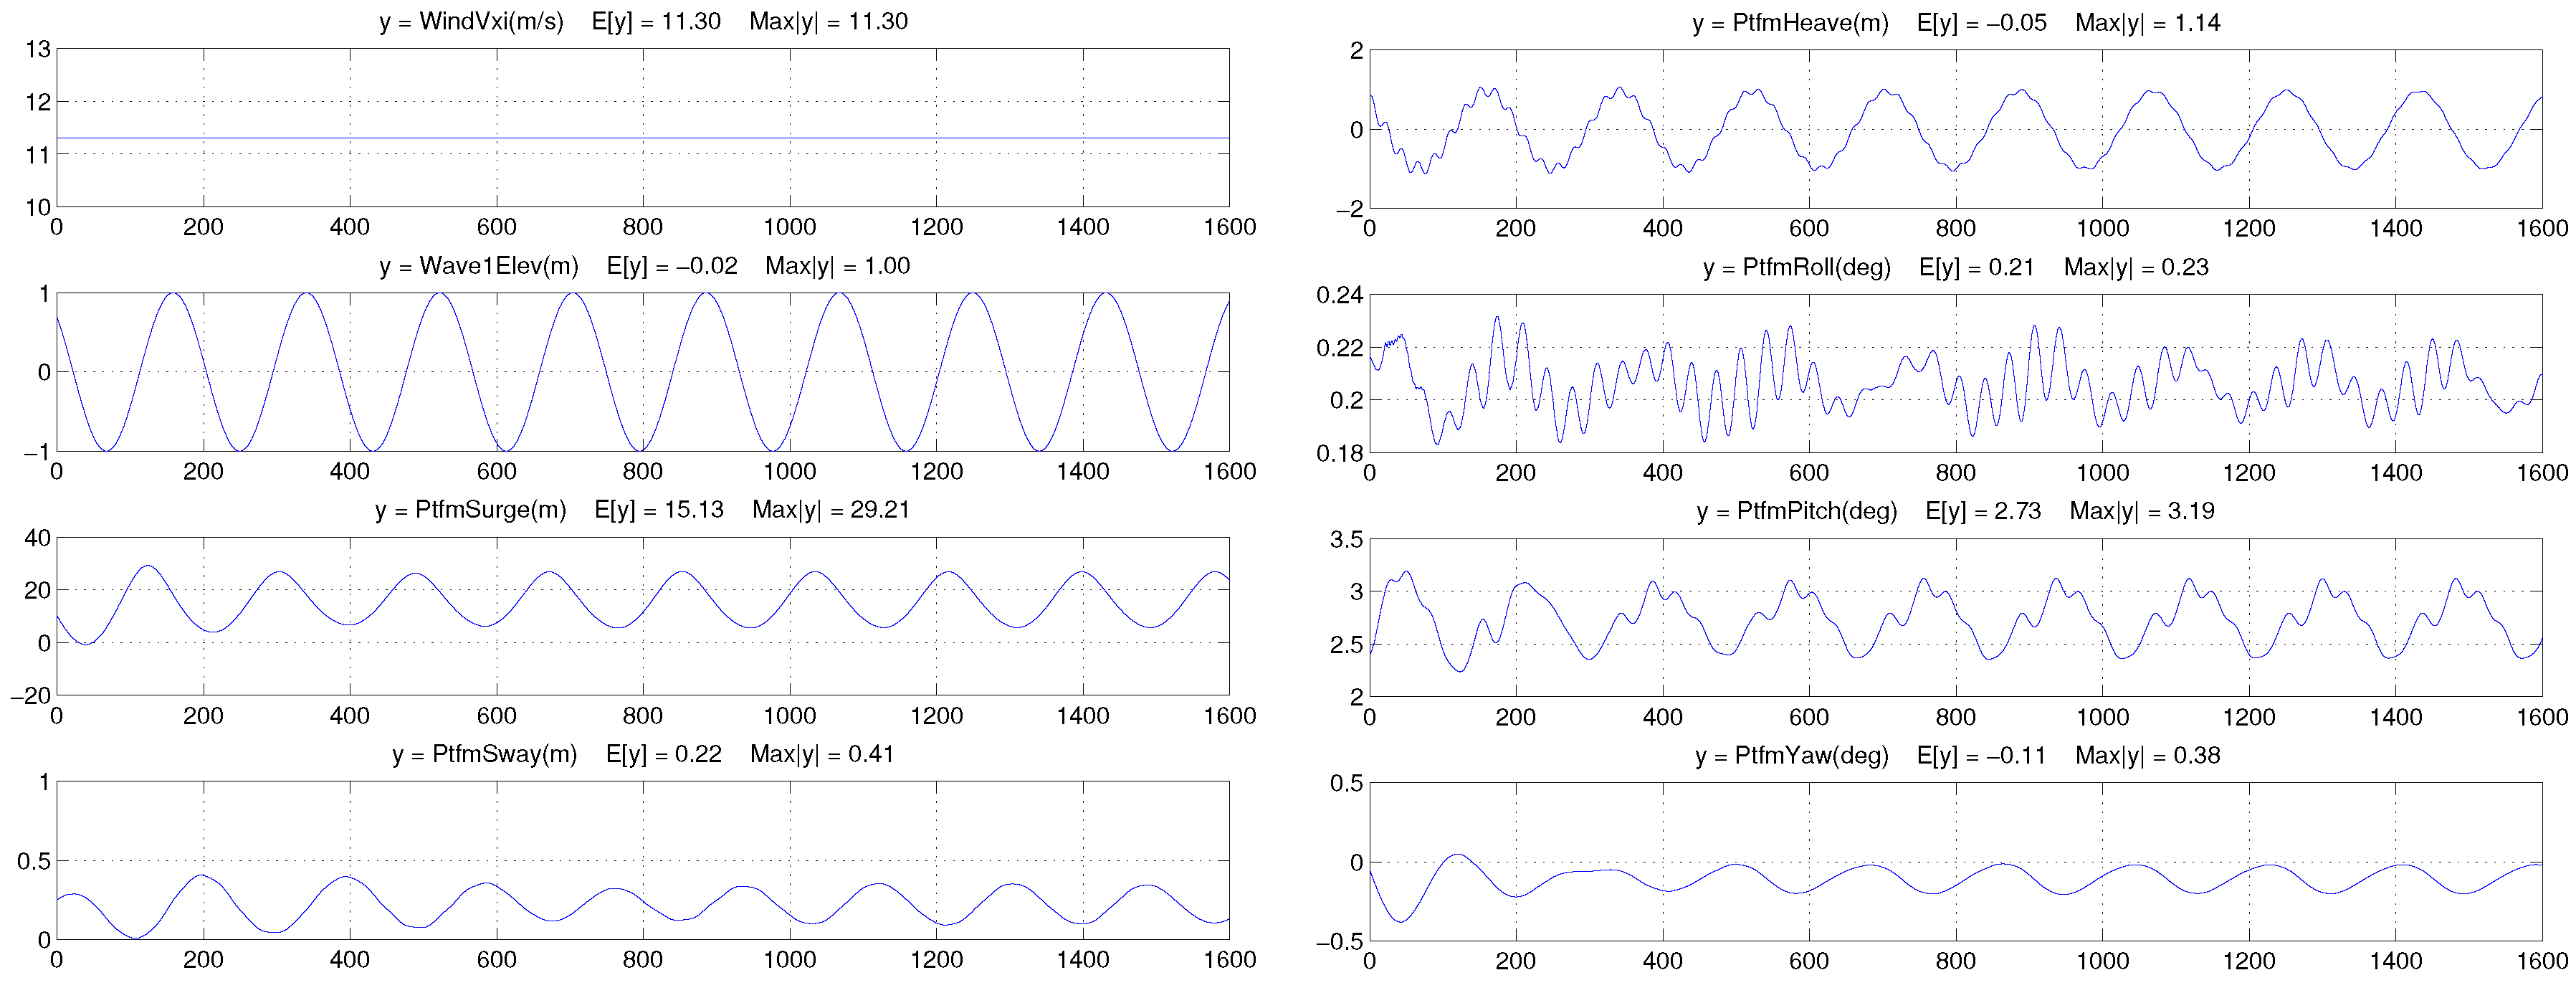
4.4. Dynamic Response Analysis under Turbulent Winds and Irregular Waves

The dynamic response analysis of the integrated system under a turbulent wind field and irregular waves is considered next. The turbulent wind field is generated using a stochastic full-field turbulence simulator, TurbSim [22], developed at NREL. The JONSWAP wave spectrum is used to simulate irregular long-crested waves. MAP is utilized to compute the response of mooring lines. Thus, a wind field over a 260 m × 260 m vertical plane centered on the rotor is generated in TurbSim using IEC Kaimal spectra using NTM conditions and Turbulence Category A. A power-law profile on the rotor disk defines the mean wind shear.
At a site of interest, sea states for this model have been identified where the hub-height wind velocity ranges from 11 m/s–18 m/s [20,26]. A total of 10 one hour-long simulations are performed under operating conditions with aligned wind and waves for each sea state. Time series following an initial transient period for two sea states—one with near rated winds and the other near cut-out—are presented in Figure 15a,b along with relevant statistics. These two sea states are selected because extreme response levels generally occur around rated winds and/or close to cut-out winds for many wind turbines. Blade pitch control influences are evident in the response time series when the hub-height wind speed is larger than the rated wind speed, V r , of 11.3 m/s. This pitch control significantly reduces the fore-aft tower-base bending moment at cut-out compared to at the rated wind speed; this is also true for platform surge motion as these two response quantities are greatly influenced by aerodynamic loads. The platform pitch motion vibrates around an offset value that is induced by the mean wind speed. Note that the pitch motion is always within the desired limit (i.e., less than 10 degrees). Two anchor tension force time series are presented: Anchor 1 is in an upwind position on the platform, and Anchor 2 is downwind. The anchor tension response suggests that, during this simulation, while there is no uplift at Anchor 2, tension forces are significant for Anchor 1. Overall, a comparison of the integrated system response between rated and cut-out wind speeds suggests that most response processes are dominated by winds around the rated wind speed.
Table 14 summarizes the statistics of selected platform responses for 50-year return period sea states [20,26]. Note that TAnch refers to the line tension at an anchor; the other response variables have been defined earlier. For each sea state, 10 one hour-long simulations are performed under operating conditions and for aligned wind and waves. A total of 240 simulations are carried out; response maxima from ten simulations for each sea state are presented; for example, the Max is the maximum value of the 10 platform pitch motion maxima from those ten simulations.
For both regular waves with no wind or steady wind, as well as for irregular waves with turbulent wind fields, response levels of the integrated 13.2-MW turbine-platform-mooring system are found to be reasonable and within the design criteria. Overall, the response of the integrated system suggests that this system meets all the typical essential design requirements. From the maximum response levels found in all the simulations, we conclude that this model could survive in fairly severe and even extreme sea states. Additionally, DLCs as defined in IEC 61400-3 need to be performed and analyzed for further validation of the model development presented in this study.

5. Conclusions

A semi-submersible floating platform model was developed to support an innovative 13.2-MW horizontal-axis wind turbine with 100 m-long blades that has been developed at Sandia National Laboratories (SNL) [12]. After an iterative model development procedure and various analyses, the following general conclusions are made:
(i)
An earlier semi-submersible platform model with a scale factor of 1.8 (on the OC4 model) for the 13.2-MW turbine was overdesigned. A more economical model with a scale factor of 1.5 for the platform and a mooring line scale factor of 2.0 was found to be adequate for the 13.2-MW wind turbine with SNL100-02 blades in stability and dynamic analyses.
(ii)
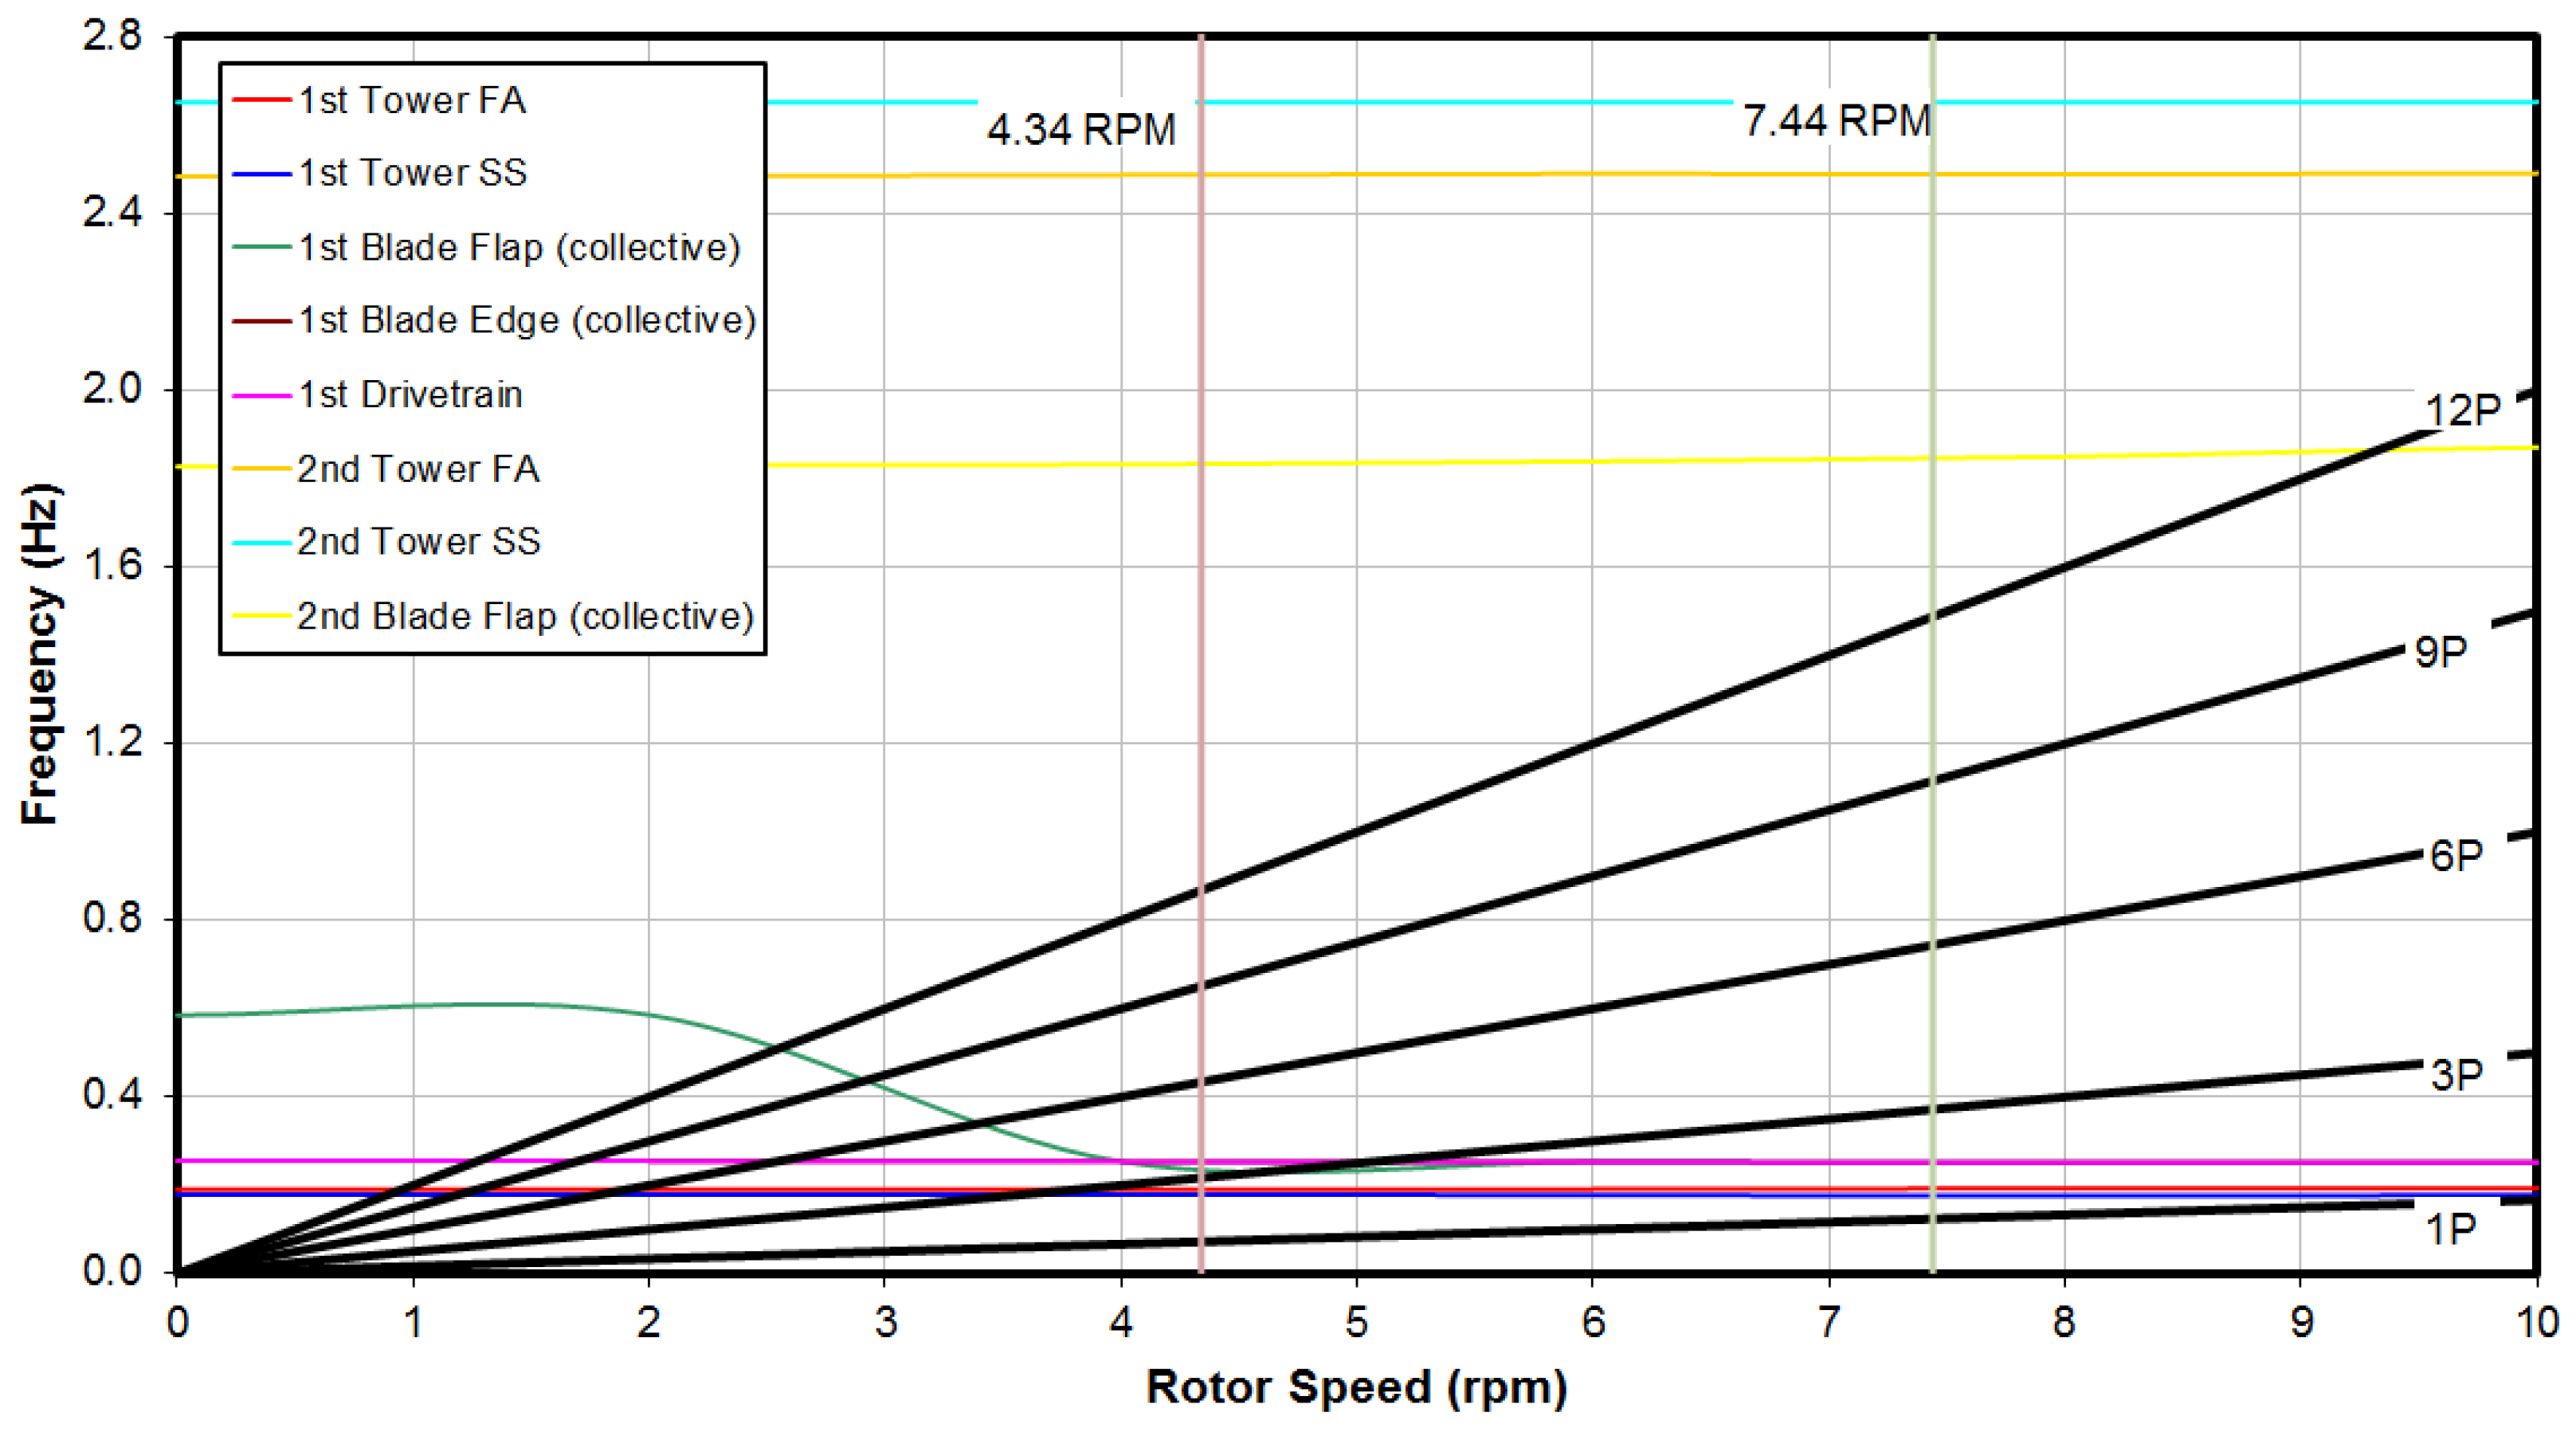
A new tower model was designed to support the wind turbine mounted on the semi-submersible platform. The tower height and thickness were chosen to meet design constraints such as an air gap or clearance requirement. A Campbell diagram analysis showed that the tower developed is in the soft-stiff design range and avoids resonance with important rotor rotation and blade-passing frequencies.
(iii)
Platform hydrodynamic properties were calculated using WAMIT, only considering linear hydrodynamic effects. KC numbers for several sea states were computed, and it was shown that the application of potential flow theory to this large-volume platform model can be justified. Computed hydrodynamic coefficients for the model developed are consistent with those for the OC4 DeepCwind model.
(iv)
The steady-state response of the integrated system showed that its behavior is satisfactory based on the design criteria. Static offsets in pitch and heave motions were in a reasonable range, and short-term maximum values were sufficiently low to help validate the model.
(v)
Response amplitude operators were generated for this integrated model in the time domain to account for nonlinear characteristics based on white-noise wave excitation using FAST. Response amplitudes are comparable with those for the OC4 DeepCwind model, but the dominant frequencies were somewhat lower, suggesting that this system is more sensitive to low-frequency forces.
(vi)
The performance of the integrated system under a turbulent wind field and irregular waves demonstrated its stability and satisfactory performance. Satisfactory pitch motion statistics including maxima, in the sea states studies, suggest that the model developed is adequate even for use in severe sea states.
Even though this model was found acceptable in performance under various design constraints, future work could be undertaken in several research areas to further improve the model.
First, the platform geometry could be further refined since this semi-submersible platform provides more adequate pitch-restoring capability compared to that for heave motions. The tower model could be redefined with a more accurate finite element tool. The mooring system could be further studies to yield a more specific mooring pattern based on the specific location and metocean conditions. From the response amplitude operators (RAOs) computed for the platform model, it is noted that various natural frequencies for this platform are lower than those for the OC4 platform. The effect of second-order slow-drift forces on semi-submersible floating platforms for offshore wind turbines has been demonstrated [29], and these effects are likely to be more significant for the model developed in this study. Additional loads analysis including evaluation of fatigue and extreme loads should be systematically evaluated, and the design load cases in IEC 61400-3 should be evaluated.

Acknowledgments

The University of Texas authors are pleased to acknowledge the financial support received from Sandia National Laboratories by way of Contract No. 1307455. They acknowledge technical assistance received from Watsamon Sahasakkul and Mohit Soni. Sandia National Laboratories is a multi-mission laboratory managed and operated by National Technology and Engineering Solutions of Sandia, LLC., a wholly-owned subsidiary of Honeywell International, Inc., for the U.S. Department of Energy’s National Nuclear Security Administration under Contract DE-NA0003525.

Author Contributions

L.M., J.L., and E.T. formulated the problem addressed in this study; D.T.G., K.M.R., and M.B. developed the baseline wind turbine rotor and provided results from associated studies that formed the basis for the integrated system design. J.L. and E.T. carried out all the modeling and numerical studies, with guidance from L.M. L.M., J.L., and E.T. together wrote the first draft of the paper; all authors contributed to the final version.

Conflicts of Interest

The authors declare no conflicts of interest.

References

  1. Growth of the Wind Power Industry around the World. Available online: http://www.gwec.net/global-figures/graphs/ (accessed on 21 November 2015).
  2. American Wind Energy Association. U.S. Wind Industry Third Quarter 2017 Market Report: Executive Summary; Technical Report; American Wind Energy Association: Washington, DC, USA, 2017. [Google Scholar]
  3. United States Department of Energy. 20% Wind Energy by 2030: Increasing Wind Energy’s Contribution to US Electricity Supply; Technical Report; Report No. DOE/GO-102008-2567; United States Department of Energy: Washington, DC, USA, 2008.
  4. Schwartz, M.; Heimiller, D.; Haymes, S.; Musial, W. Assessment of Offshore Wind Energy Resources for the United States; Technical Report; Reprot No. NREL/TP-500-45889; National Renewable Energy Laboratory (NREL): Golden, CO, USA, 2010.
  5. Jonkman, J.M. Dynamics Modeling and Loads Analysis of an Offshore Floating Wind Turbine; Technical Report; Report No. NREL/TP-500-41958; National Renewable Energy Laboratory (NREL): Golden, CO, USA, 2007.
  6. Bulder, B.H.; van Hees, M.T.; Henderson, A.; Huijsmans, R.H.M.; Pierik, J.T.G.; Snijders, E.J.B.; Wijnants, G.H.; Wolf, M.J. Study to Feasibility of and Boundary Conditions for Floating Offshore Wind Turbines; Public Report 2002-CMC-R43; ECN, MARIN, MSC, Lagerway the Windmaster, TNO, TUD: Delft, The Netherlands, December 2002. [Google Scholar]
  7. Wayman, E.N. Coupled Dynamics and Economic Analysis of Floating Wind Turbine Systems. Ph.D. Thesis, Massachusetts Institute of Technology, Cambridge, MA, USA, 2006. [Google Scholar]
  8. Tracy, C.C.H. Parametric Design of Floating Wind Turbines. Ph.D. Thesis, Massachusetts Institute of Technology, Cambridge, MA, USA, 2007. [Google Scholar]
  9. Matha, D. Model Development and Loads Analysis of an Offshore Wind Turbine on a Tension Leg Platform with a Comparison to Other Floating Turbine Concepts; Technical Report; Report No. NREL/SR-500-45891; National Renewable Energy Laboratory (NREL): Golden, CO, USA, 2010.
  10. Jonkman, J.M.; Butterfield, S.; Musial, W.; Scott, G. Definition of a 5-MW Reference Wind Turbine for Offshore System Development; Technical Report; Report No. NREL/TP-500-38060; National Renewable Energy Laboratory (NREL): Golden, CO, USA, 2009.
  11. Bossanyi, E.A. The Design of Closed Loop Controllers for Wind Turbines. Wind Energy 2000, 3, 149–163. [Google Scholar] [CrossRef]
  12. Griffith, D.T.; Resor, B.R. Description of Model Data for SNL 13.2-00-Land: A 13.2 MW Land-Based Turbine Model with SNL 100-00 Blades; Technical Report; Report No. SAND2011-9310P; Sandia National Laboratories: Albuquerque, NM, USA, 2011.
  13. Liu, J.; Thomas, E.; Manuel, L.; Griffith, D.T.; Ruehl, K.; Barone, M. On the Development of a Semi-Submersible Offshore Floating Platform and Mooring System for a 13.2 MW Wind Turbine. In Proceedings of the 34th Wind Energy Symposium, AIAA SciTech Forum, San Diego, CA, USA, 4–8 January 2016; Paper No. AIAA 2016–1994; The American Institute of Aeronautics and Astronautics: San Diego, CA, USA, January 2016. [Google Scholar]
  14. Offshore Wind RD&D: Large Offshore Rotor Development. Available online: http://energy.sandia.gov/energy/renewable-energy/wind-power/offshore-wind/offshore-wind-sandia-large-rotor-development/ (accessed on 21 November 2015).
  15. Griffith, D.T. The SNL100-01 Blade: Carbon Design Studies for the Sandia 100-m Blade; Technical Report; Report No. SAND2013-1178; Sandia National Laboratories: Albuquerque, NM, USA, 2013.
  16. Sahasakkul, W. Development of a Model for an Offshore Wind Turbine Supported by a Moored Semi-Submersible Platform. Master’s Thesis, University of Texas at Austin, Austin, TX, USA, 2014. [Google Scholar]
  17. Robertson, A.; Jonkman, J.M.; Masciola, M.; Song, H.; Goupee, A.; Coulling, A.; Luan, C. Definition of the Semisubmersible Floating System for Phase II of OC4; Technical Report; Report No. NREL/TP-5000-60601; National Renewable Energy Laboratory (NREL): Golden, CO, USA, 2012.
  18. Liu, J. On the Development of a Semi-Submersible Offshore Floating Platform and Mooring System for a 13.2 MW Wind Turbine. Master’s Thesis, University of Texas at Austin, Austin, TX, USA, 2016. [Google Scholar]
  19. Faltinsen, O. Sea Loads on Ships and Offshore Structures; Cambridge University Press: Cambridge, UK, 1993. [Google Scholar]
  20. Thomas, E. Long-Term Loads on a Large Offshore Wind Turbine Supported by a Semi-Submersible Platform. Master’s Thesis, University of Texas at Austin, Austin, TX, USA, 2016. [Google Scholar]
  21. Newman, J.N. Marine Hydrodynamics; MIT Press: Cambridge, MA, USA, 1977. [Google Scholar]
  22. Jonkman, B.J. TurbSim User’s Guide: Version 1.50; National Renewable Energy Laboratory: Golden, CO, USA, 2009.
  23. Laino, D.J.; Hansen, A.C. Aerodyn User’s Guide; National Renewable Energy Laboratory: Golden, CO, USA, 2002.
  24. Masciola, M. Instructional and Theory Guide to the Mooring Analysis Program; National Renewable Energy Laboratory: Golden, CO, USA, 2013.
  25. Ramachandran, G.K.V.; Robertson, A.; Jonkman, J.M.; Masciola, M.D. Investigation of Response Amplitude Operators for Floating Offshore Wind Turbines. In Proceedings of the 32nd International Offshore and Polar Engineering Conference, Anchorage, AK, USA, 30 June–4 July 2013. [Google Scholar]
  26. Thomas, E.; Liu, J.; Goyal, A.; Manuel, L. Long-Term Loads on a Large Offshore Wind Turbine Supported by a Semi-Submersible Platform. In Proceedings of the 34th Wind Energy Symposium, AIAA SciTech Forum, San Diego, CA, USA, 4–8 January 2016; Paper No. AIAA 2016–1994; The American Institute of Aeronautics and Astronautics: San Diego, CA, USA, January 2016. [Google Scholar]
  27. Li, L.; Gao, Z.; Moan, T. Joint environmental data at five European offshore sites for design of combined wind and wave energy devices. In Proceedings of the 32nd International Conference on Ocean, Offshore and Arctic Engineering, Nantes, France, 9–14 June 2013; Paper No. OMAE2013-10156; American Society of Mechanical Engineers: Nantes, France, 2013. [Google Scholar]
  28. International Electrotechnical Commission. IEC 61400-3: Wind Turbines Part 3: Design Requirements for Offshore Wind Turbines; International Electrotechnical Commission: Geneva, Switzerland, 2009. [Google Scholar]
  29. Bayati, I.; Jonkman, J.; Robertson, A.; Platt, A. The effects of second-order hydrodynamics on a semisubmersible floating offshore wind turbine. J. Phys. Conf. Ser. 2014, 524, 012094. [Google Scholar] [CrossRef]
Figure 1. Floating offshore wind turbine concepts [5].
Jmse 06 00009 g001
Figure 2. Variation in mass density, flapwise stiffness and edgewise stiffness along the (normalized) length for three Sandia National Laboratories (SNL) 100-m blade designs and for the NREL 5-MW wind turbine blade.
Jmse 06 00009 g002
Figure 3. The OC4-DeepCwind semi-submersible platform: plan and elevation.
Jmse 06 00009 g003
Figure 4. Mooring line arrangement.
Jmse 06 00009 g004
Figure 5. Iterations in the model development.
Jmse 06 00009 g005
Figure 6. Campbell diagram for the SNL 13.2-MW wind turbine with SNL100-02 blades and a 118.5-m tower.
Jmse 06 00009 g006
Figure 7. Keulegan–Carpenter (KC) numbers for the SNL semi-submersible platform: (a) for the main column at normal sea states; (b) for the offset column at normal sea states; (c) for the main column at 50-year return sea states; (d) for the offset column at 50-year return sea states.
Jmse 06 00009 g007
Figure 8. MultiSurf model of the SNL semi-submersible platform.
Jmse 06 00009 g008
Figure 9. SNL semi-submersible platform added mass and radiation damping coefficients for a zero wave heading.
Jmse 06 00009 g009
Figure 10. SNL semi-submersible platform excitation force coefficients for a zero wave heading.
Jmse 06 00009 g010
Figure 11. Integrated system showing the Sandia 13.2-MW wind turbine, tower, semi-submersible floating platform and mooring lines.
Jmse 06 00009 g011
Figure 12. Heave free-decay simulation of the integrated system model following an initial heave displacement of 2 m: (a) Modes 1, 2 and 3; (b) Modes 4, 5 and 6.
Jmse 06 00009 g012
Figure 13. RAOs under zero wind speed: (a) for the SNL 13.2 MW model; (b) for the OC4 DeepCwind model.
Jmse 06 00009 g013
Figure 14. Time series of the integrated system for a unit-amplitude wave at a surge natural frequency of 0.0057 Hz (for rated wind velocity, V r a t e d = 11.3 m/s).
Jmse 06 00009 g014
Figure 15. One-hour time series of the SNL 13.2-MW turbine-platform integrated system under different sea states: (a) V h u b = 11.3 m/s, H s = 7.77 m, T p = 14.43 s; (b) V h u b = 25.0 m/s, H s = 11.52 m, T p = 14.31 s.
Jmse 06 00009 g015
Table 1. Key differences between the different SNL 100-m blade designs.
Blade DesignationSNL100-00SNL100-01SNL100-02SNL100-03
Materialall-glass baseline bladecarbon designadvanced core materialadvanced geometry
Blade Weight (kg)114,17273,99559,04749,519
Span-wise CG(m)33.633.131.9531.55
Fixed-base f n (Hz)0.420.490.550.49
Table 2. Properties of wind turbine and blade model.
ParameterValueParameterValueParameterValue
Rated Power13.2 MWRotor OrientationUpwindBlade DesignationSNL100-02
Rotor Dia.205 mHub Dia.5 mBlade Length100 m
Hub Height133.5 mGenerator Eff.94.40%No. of Blades3
V i n 3 m/sCut-in Rotor Speed4.34 rpmBlade Weight59,047 kg
V r a t e d 11.3 m/sRated Rotor Speed7.44 rpmSpan-wise CGloc.31.95 m
V o u t 25 m/sRated Tip-speed80 m/sMaximum Chord7.63 m
Overhang8.16 mRotor Mass422,131 kgNatural Frequency0.55 Hz
Precone2.5 degTower Mass553,995 kgControl System:Variable-speed;
Collective-pitch
Shaft Tilt5 degTower-top Mass1,452,131 kg
Table 3. The OC4-DeepCwind floating system geometry and structural properties. SWL, still water level; CM, center of mass.
Static PropertiesValuesMultiplication Factor
Depth of platform base below SWL20 m λ
Elevation of main column above SWL10 m
Elevation of offset columns above SWL12 m
Spacing between offset columns50 m
Length of upper columns26 m
Length of base columns6 m
Depth to top of base columns below SWL14 m
Diameter of main column6.5 m
Diameter of offset (upper) columns12 m
Diameter of base columns24 m
Diameter of pontoons and cross braces1.6 m
CM location below SWL13.46 m
Platform mass, including ballast1.3473 × 10 7 kg λ 3
Platform roll inertia about CM6.827 × 10 9 kg-m 2 λ 5
Platform pitch inertia about CM6.827 × 10 9 kg-m 2
Platform yaw inertia about CM1.226 × 10 10 kg-m 2
Table 4. Mooring system properties.
ParametersValuesMultiplication Factor
Number of Mooring Lines3(−)
Angle Between Adjacent Lines120(−)
Depth to Anchors Below SWL200 m(−)
Depth to Fairleads Below SWL14 m λ P
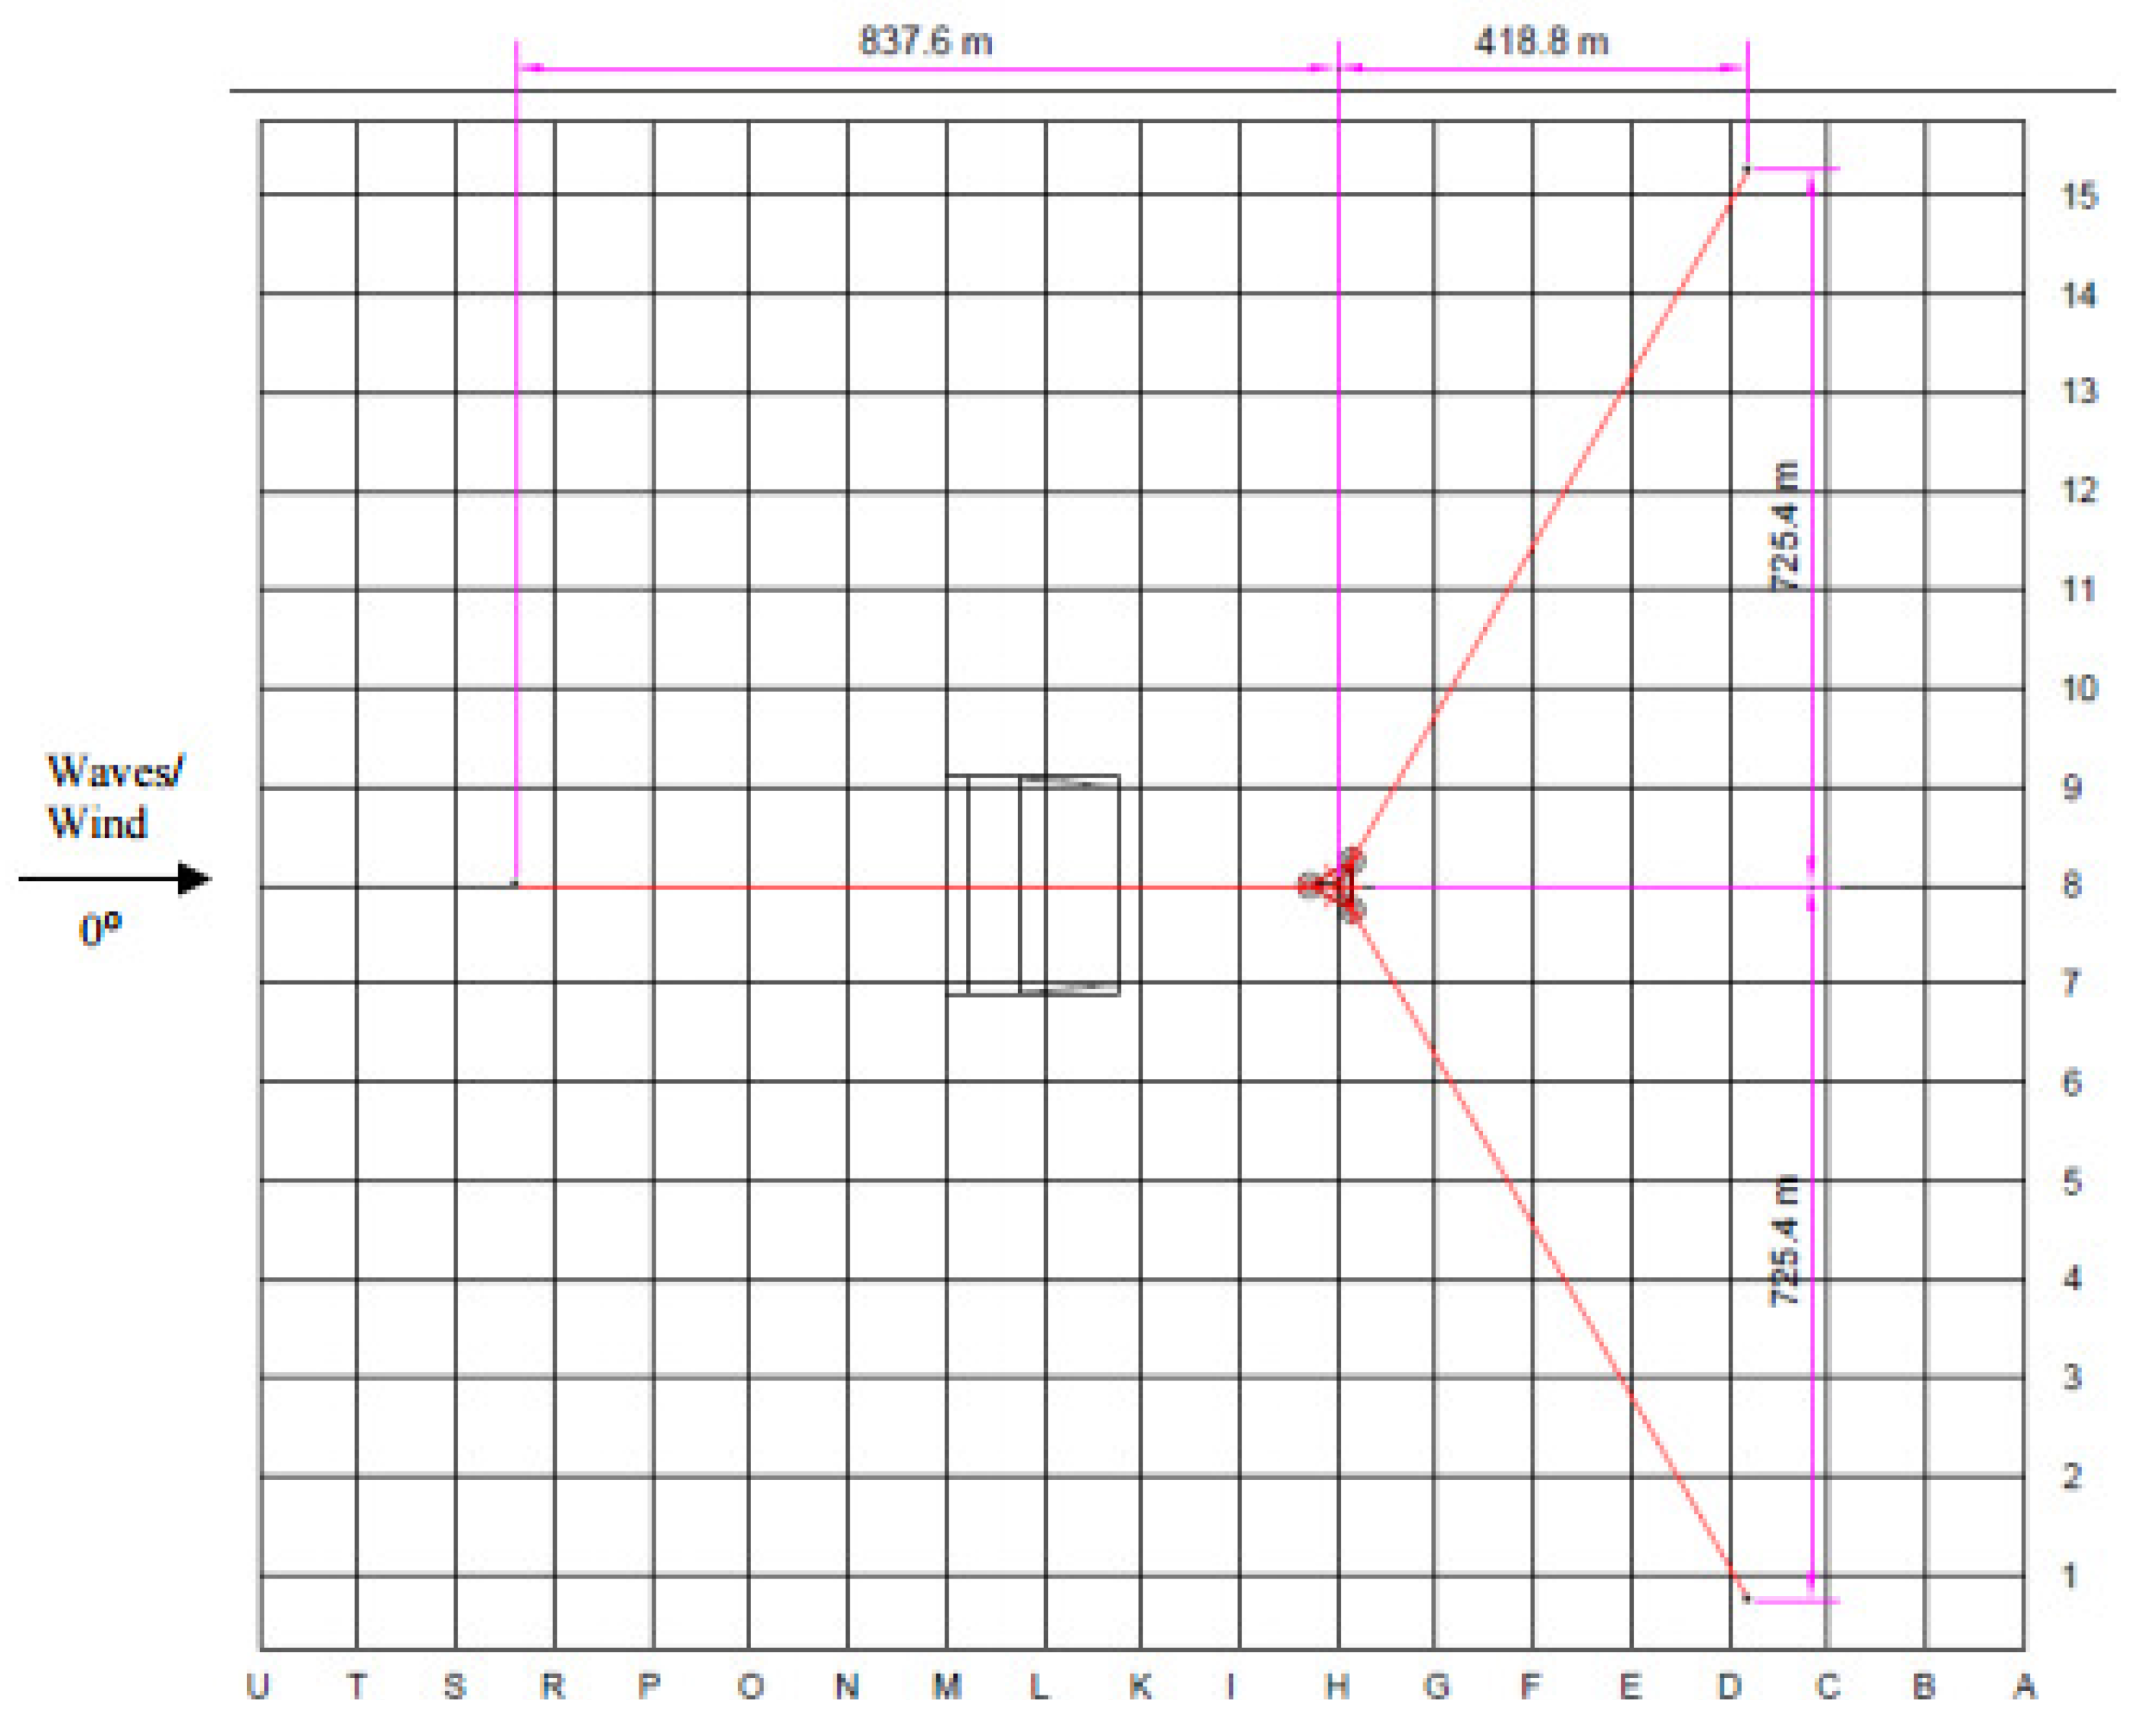
Radius to Anchors from Platform Centerline837.6 m(−)
Radius to Fairleads from Platform Centerline40.868 m λ
Unstretched Mooring Line Length835.5 m(−)
Mooring Line Diameter0.0766 m λ
Equivalent Mooring Line Mass Density113.35 kg/m λ 2
Equivalent Mooring Line Mass in Water108.63 kg/m λ 2
Equivalent Mooring Line Extensional Stiffness753.6 MN λ 2
Hydrodynamic Drag Coefficient for Mooring Lines1.1(−)
Hydrodynamic Added-Mass Coefficient for Mooring Lines1.0(−)
Seabed Drag Coefficient For Mooring Lines1.0(−)
Structural Damping of Mooring Lines2.0%(−)
(−) indicates t parameter is not changed (relative to OC4 DeepCwind).
Table 5. Froude scaling used in the model development.
Physical ParameterUnitsScale Factor
Lengthm λ
Structural masskg λ 3
ForceN λ 3
MomentN-m λ 4
Accelerationm/s 2 1
Times λ
PressurePa or N/m 2 λ
Table 6. Distributed geometric and structural properties for the 115.6-m tower for the SNL 13.2 MW wind turbine.
Elevation
(m)
HtFract
(−)
TMassDen
(kg/m)
TwFAStif
(N-m 2 )
TwSSStif
(N-m 2 )
TwGJStif
(N-m 2 )
TwEAStif
(N)
TwFAIner
(kg-m)
TwSSIner
(kg-m)
0.000.07010.242.05 × 10 12 2.05 × 10 12 1.57 × 10 12 1.73 × 10 11 82,841.382,841.3
11.460.16527.081.75 × 10 12 1.75 × 10 12 1.35 × 10 12 1.61 × 10 11 71,011.871,011.8
22.920.26060.751.49 × 10 12 1.49 × 10 12 1.15 × 10 12 1.50 × 10 11 60,490.560,490.5
34.380.35611.231.26 × 10 12 1.26 × 10 12 9.73 × 10 12 1.39 × 10 11 51,177.751,177.7
45.840.45178.541.06 × 10 12 1.06 × 10 12 8.17 × 10 12 1.28 × 10 11 42,977.842,977.8
57.300.54762.678.84 × 10 11 8.84 × 10 11 6.81 × 10 11 1.18 × 10 11 35,799.135,799.1
68.760.64363.627.30 × 10 11 7.30 × 10 11 5.62 × 10 11 1.08 × 10 11 29,553.629,553.6
80.220.73981.395.97 × 10 11 5.97 × 10 11 4.59 × 10 11 9.84 × 10 10 24,157.524,157.5
91.680.83615.984.83 × 10 11 4.83 × 10 11 3.71 × 10 11 8.93 × 10 10 19,530.819,530.8
103.140.93267.393.85 × 10 11 3.85 × 10 11 2.97 × 10 11 8.07 × 10 10 15,597.315,597.3
114.601.02935.633.04 × 10 11 3.04 × 10 11 2.34 × 10 11 7.25 × 10 10 12,284.912,284.9
Table 7. Alternative models and evaluations against pitch motion criteria.
Model F 5 (kN-m) C 55 r (kN-m/rad) C 55 λ P (kN-m/rad)R λ P Remarks
NREL 5MW5.27 × 10 4 3.02 × 10 5 3.80 × 10 5 1.261(−)
SNL146022.81 × 10 5 1.61 × 10 6 3.99 × 10 6 2.481.8Ref. [16]
1.46 × 10 6 0.911.4 R < 1 , fails
SNL133022.29 × 10 5 1.31 × 10 6 3.99 × 10 6 3.031.8 R 1 , over-designed
1.92 × 10 6 1.461.5 R > 1 , OK
1.46 × 10 6 1.111.4 R > 1 , OK
F 5 : tower-base out-of-plane bending moment;    R = C 55 λ P / C 55 r
Table 8. Alternative models and evaluations against heave motion criteria.
ModelsSNL13302
Scale Factor1.61.51.4
Total Mass (kg)2.46 × 10 6 2.02 × 10 6 1.65 × 10 6
Allowable Tower Mass, C (kg)1.00 × 10 6 5.72 × 10 5 1.94 × 10 5
Actual Tower Mass, D (kg)5.86 × 10 5 5.54 × 10 5 5.21 × 10 5
Remarks D C , over-designed C D OK D C , fails
Table 9. Sea states defined by wave spectral peak period, T, and significant wave height, H s , selected for the dynamic analyses.
Sea StatesNormal50-Year Return
T (s) H s (m)T (s) H s (m)
12.00.0914.835.91
24.80.6714.656.55
36.51.4014.517.22
48.12.4414.417.94
59.73.6614.358.71
611.35.4914.329.51
713.69.1414.310.35
817.015.2414.3111.52
Table 10. Floating platform hydrodynamic properties.
CoefficientsValue
Added-mass coefficient ( C a ) for all members0.63
Added-mass coefficient ( C a z ) for the base column in the z direction1.00
Drag coefficient ( C d ) for the main column0.56
Drag coefficient ( C d ) for the upper columns0.61
Drag coefficient ( C d ) for the base columns0.68
Drag coefficient ( C d ) for the pontoons and cross members0.63
Drag coefficient ( C d z ) for the base columns in the z direction4.80
Table 11. Selected sea states for short-term response analysis.
V (m/s)Low Wave HeightMedium Wave HeightHigh Wave Height
H s (m) T p (s) H s (m) T p (s) H s (m) T p (s)
91.07.02.58.04.09.5
121.06.02.57.04.08.5
162.08.03.58.55.010.5
Table 12. Maximum values of the steady-state response of the integrated system.
NoSea StateTwrBsMyt
(kN-m)
PtfmSurge
(m)
PtfmHeave
(m)
PtfmPitch
(Deg)
TFair [1]
(kN)
V H s , T p
191.0, 7.02.63 × 10 5 13.5−0.031.953106
22.5, 8.03.17 × 10 5 13.6−00.072.023112
34.0, 9.53.33 × 10 5 13.7−00.152.243120
4121.0, 6.03.04 × 10 5 19.3−00.052.453833
52.5, 7.03.58 × 10 5 16.0−00.072.353387
64.0, 8.54.02 × 10 5 15.4−00.122.493323
7162.0, 8.02.51 × 10 5 11.20.061.582875
83.5, 8.52.95 × 10 5 11.20.101.672878
95.0, 10.52.79 × 10 5 11.50.321.992902
Table 13. Turbine system response for selected design load cases. DLC, design load case; NTM, normal turbulence model; ETM, extreme turbulence model; ECD, extreme coherent gust with direction change; EWS, extreme wind shear; EOG, extreme operating gust; EDC, extreme direction change.
Design SituationDLCWind ConditionPtfmSurgePtfmPitchRootMyc1TwrBsMytTFair
Power production1.1NTM1.001.001.001.001.00
1.3ETM1.031.101.111.011.04
1.4ECD0.800.831.130.810.84
1.5EWS0.810.820.900.850.83
Startup3.2EOG1.131.151.151.221.18
3.3EDC1.071.141.111.171.10
Table 14. Statistics (Maxima) of the integrated SNL 13.2-MW semi-submersible floating offshore wind turbine system.
V wind
(m/s)
PtfmSurge
(m)
PtfmPitch
(deg)
RootMyc1
(MN-m)
TwrBsMyt
(MN-m)
TAnch
(KN)
411.51.927.0335.9532.70
823.03.659.2529.32719.00
11.323.64.864.1628.72817.00
1620.15.064.6607.02029.00
2016.94.356.3605.31376.00
2413.93.957.6547.5944.50

