Determination of the Potential Thermal Gradient for the Mexican Pacific Ocean
by
 ,
,
Alejandro García Huante
1,* ,
,
Yandy Rodríguez Cueto
1,
Rodolfo Silva
1,
Edgar Mendoza
1 and
Luis A. Vega
2 1
Instituto de Ingeniería, Universidad Nacional Autónoma de México, Mexico City 04510, Coyoacan, Mexico
2
Hawaii Natural Energy Institute, 1680 East West Road, POST 109, Hawaii, HI 96822, USA
*
Author to whom correspondence should be addressed.
J. Mar. Sci. Eng. 2018, 6(1), 20; https://doi.org/10.3390/jmse6010020
Submission received: 30 December 2017
/
Revised: 30 January 2018
/
Accepted: 5 February 2018
/
Published: 21 February 2018
(This article belongs to the Special Issue Ocean Thermal Energy Conversion)
Abstract
:The energy potential of the oceanic thermal gradients of the Mexican Pacific Ocean was valued theoretically, using seasonal oceanographic data on surface and 1000 m depth ocean temperatures from 1955 to 2013, taken from the World Ocean Database (WOD). The study was carried out to determine possible sites for Ocean Thermal Energy Conversion (OTEC), assuming that the minimum usable gradient is 20 °C and the maximum profitable distance from the extraction site to the shore is 10 km. Geographic Information System tools were used to compute thermal gradients and distances to shore all along the Mexican coast. Then, the optimal sites were identified. The results show that the best sites for OTEC exploitation are found in the southern Pacific coast on the littoral of the states of Guerrero and Oaxaca.
1. Introduction
The Mexican economy is still largely dependent on fossils fuels (87%), with the subsequent environmental consequences and the imminent loss of these nonrenewable resources. It is therefore imperative to harness new sources of energy. Given that the ocean surface in tropical zones receives considerable solar radiation, one feasible alternative is Ocean Thermal Energy Conversion (OTEC). OTEC plants take advantage of the difference in temperature between surface water and deep-sea water for the generation of electrical energy. For optimum generation needs, the difference should be at least 20 °C [1]. The OTEC concept was developed in the late 1880s and, since then, France, the USA, Japan and South Korea have excelled in the research and generation of energy from oceanic thermal gradients [2,3].
The beginnings of this technology began with the work of the French physicist Jacques Arsene D’Arsonval in 1881, although it was not until 1926 that the French physicist Georges Claude, of the Paris Academy of Sciences, presented a scale model, which demonstrated the means of using a thermal gradient to generate energy. He went on, in 1930, to construct a small plant that was capable of generating 22 kW in the Bay of Matanzas (Cuba).
Around the world, different OTEC projects have obtained satisfactory results in both the generation of energy and the improvement and adaptation of new technologies, lowering the construction and operational costs of such plants. Currently, Japan is the country that has developed OTEC technology the most, improving thermodynamic cycles, such as the Kalina and Uehara hybrid cycles, as well as developing components of the plants, such as the internal coatings in the plant pipes (biofouling), capacitors, evaporators and turbines.
At present, six OTEC plants are either operational or under construction. South Korea has an onshore OTEC plant in the Goseong region, which produces a net total 20 kW of electricity. As it uses a gradient of just 18 °C, it operates in the summer months only. Furthermore, Korea is manufacturing key parts of 1 MW OTEC plant to install on land of Tarawara, Kiribati in 2019 for performance test and long-term operation [3]. Japan has two plants: a small one at Saga University, where 30 kW are obtained from the Uehara cycle, and a large one on Kumejima Island, in Okinawa Prefecture, which generates 100 kW in addition to other products that are marketed, such as drinking water, air conditioning, salts, mineral for cosmetics, and water with nutrients for aquaculture [4]. The United States has the largest power generation plant in the world (105 kW) on Kailua-Kona Island, Hawaii, run by the privately owned Hawaiian company Makai Ocean Engineering Ltd., from the closed cycle, now known as OTEC-II [5]. France has a small experimental plant on Reunion Island (Indian Ocean), which generates 15 kW and is owned by the company DCNS Energies (Naval Group since 2017). Currently they are also installing an offshore OTEC plant (platform) on the island of Martinique in the Caribbean Sea, which will generate 10 MW [6,7].
The recent interest of the Mexican government in supporting alternative energy generation technologies and the creation of the Mexican Center for Innovation in Oceanic Energy (in Spanish CEMIE-O) have led to research and development in OTEC technology. Mexico has strategic oceanographic conditions that make OTEC viable as an energy source, which can reduce fossil fuel dependency and provide energy to isolated coastal populations and islands.
The present work seeks to discover the best sites for OTEC exploitation in the Mexican Pacific Ocean. The main criteria for optimal operation are that the thermal gradient is equal to or greater than 20 °C and that the site is less than 10 km offshore.
2. Materials and Methods
2.1. Study Area
The Mexican Pacific Ocean (MPO) is the area studied, as the geographic and oceanic conditions are suitable for the installation of OTEC plants according to several studies [3,8,9,10,11]. All of these authors highlight the thermal gradient potential, which can be exploited for the generation of electrical energy as well as secondary by-products such as potable water, air conditioning, aquaculture and cold-water agriculture. To better understand this, the most relevant aspects of the Mexican Pacific Ocean related to OTEC development are described, i.e., temperatures, the temperature gradients between 0 and 1000 m depths, and the seasonal variations of the sea surface temperature.
Temperature
A strong and shallow thermocline characterized the Eastern Tropical Pacific (ETP) [12,13,14]. This area is located between the subtropical zones of the North and South Pacific and both the east Pacific equatorial current system [15] and the eastern Pacific warm pool occur within it [14] (see Figure 1).
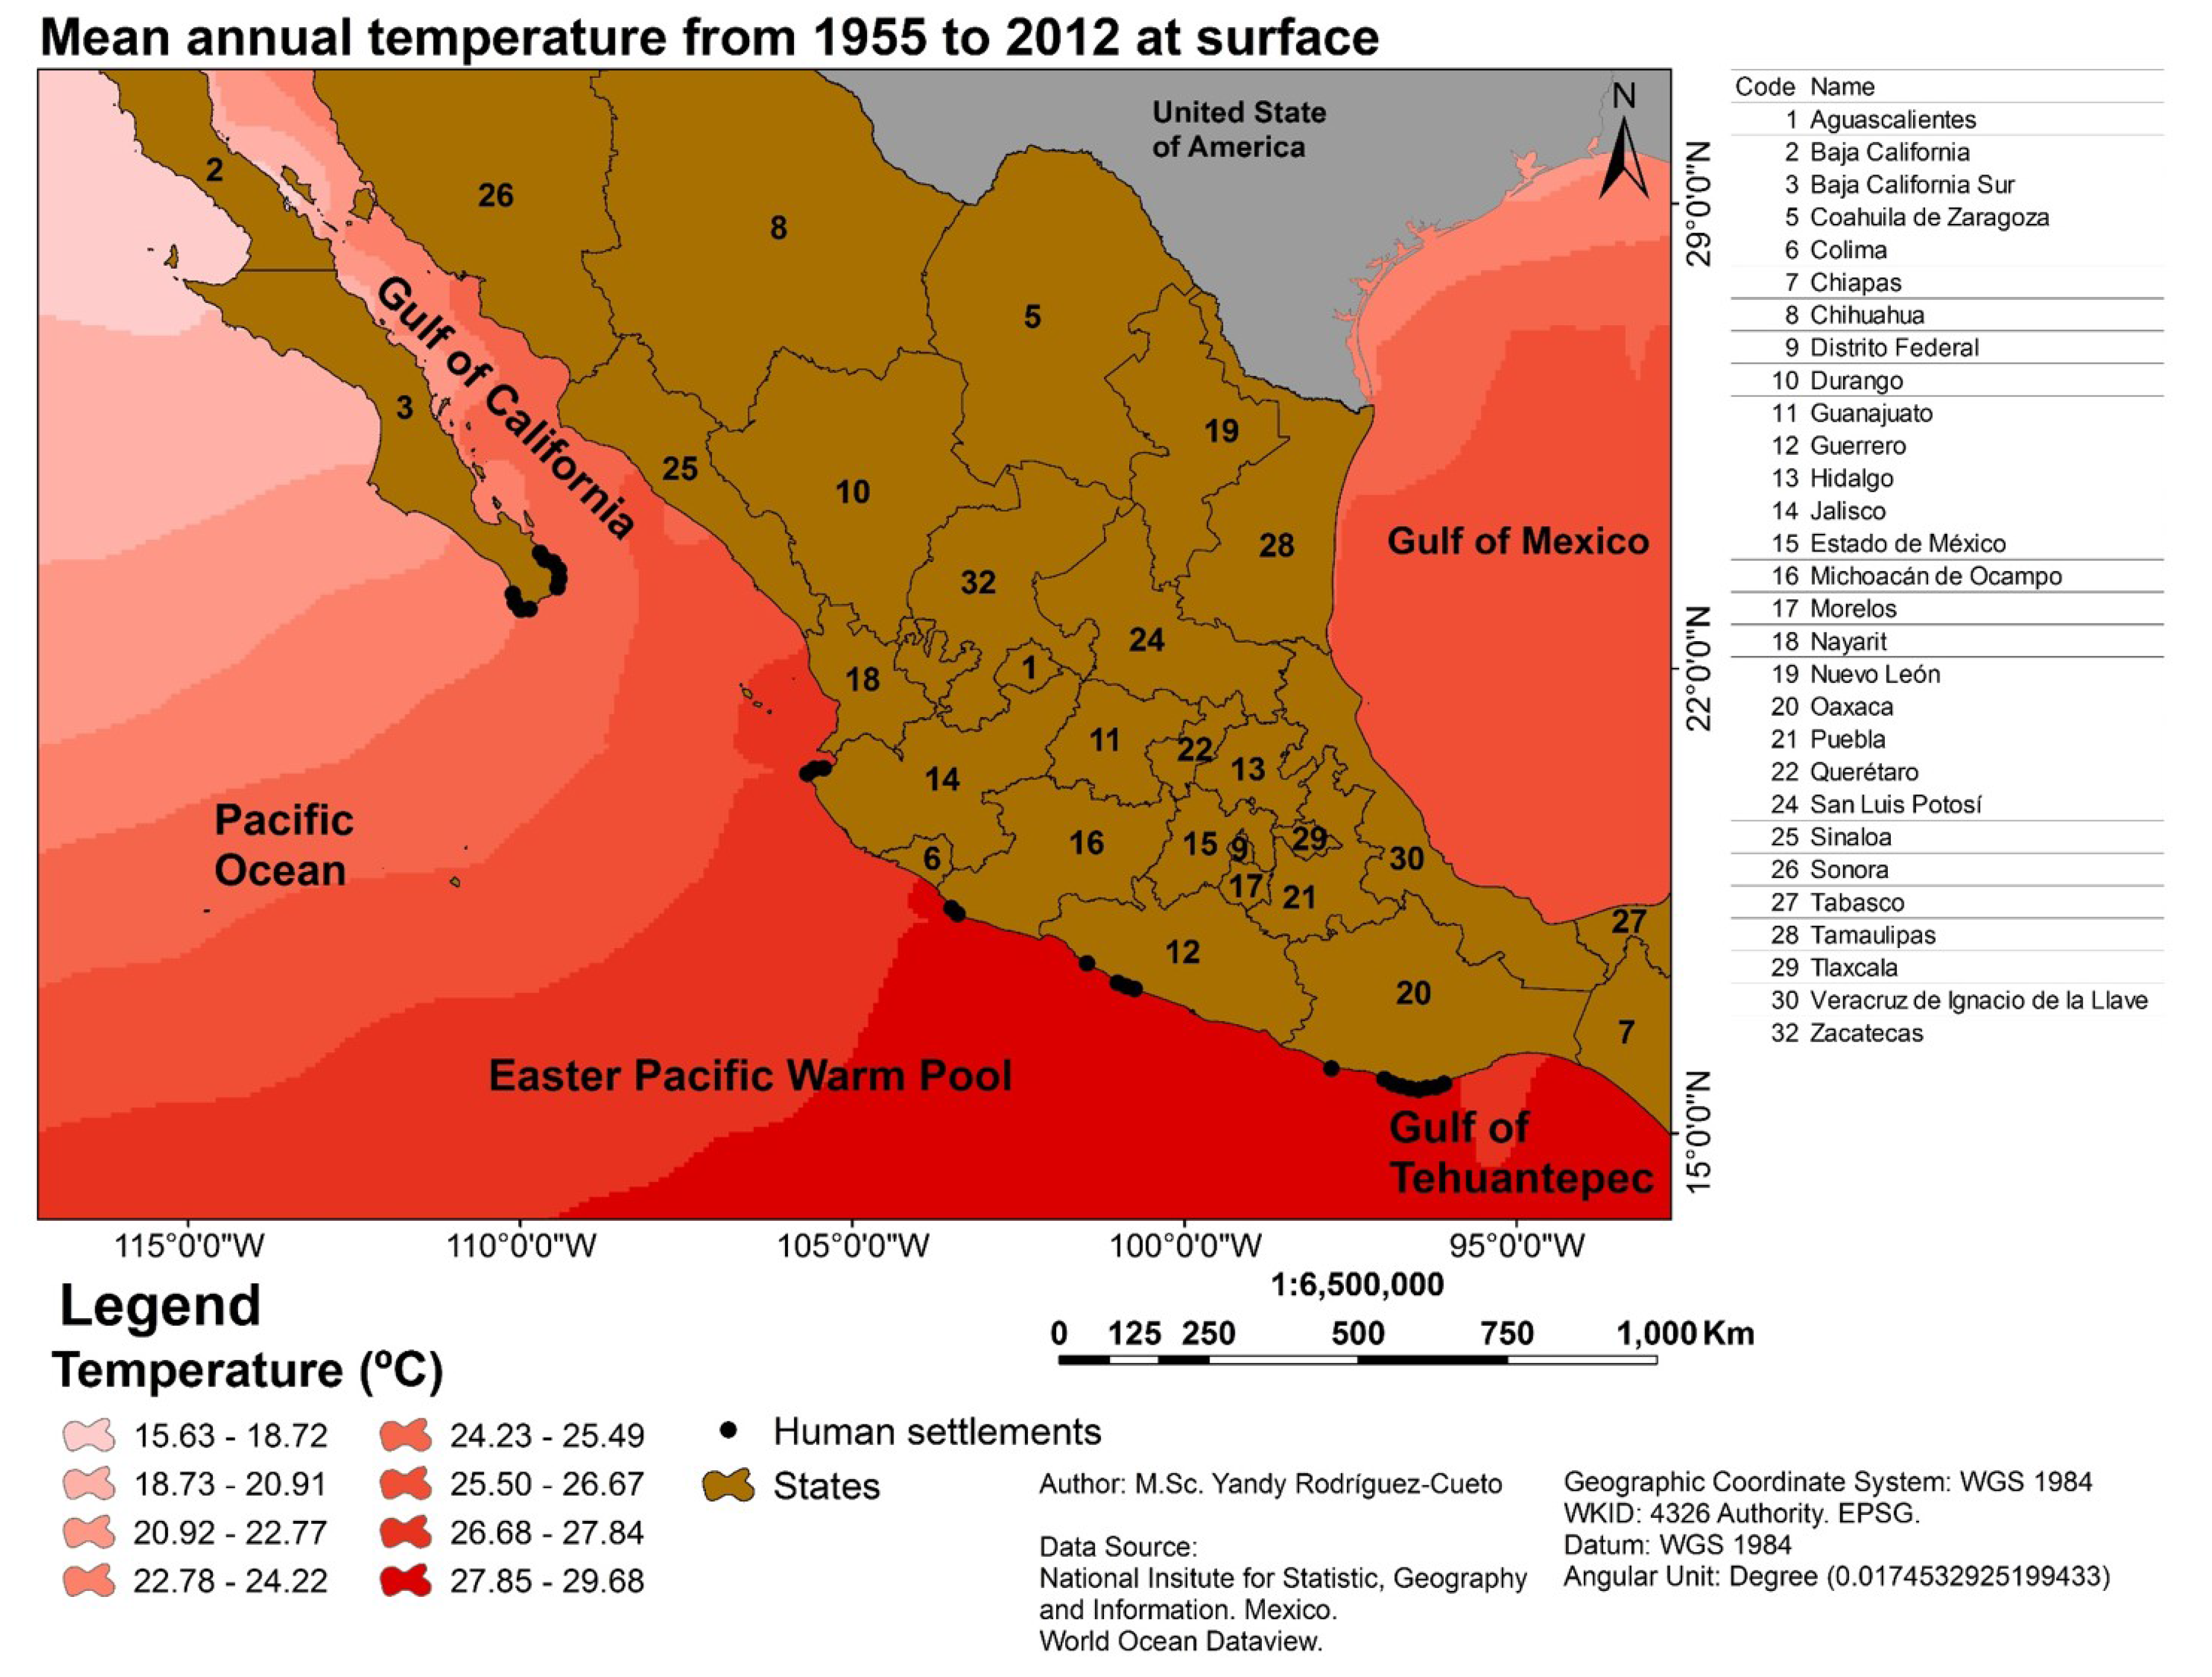
Eastern boundary currents flow in this region from the north (California Current) and from the south (Peru Current). The eastern part of the Tropical Pacific Ocean is influenced by “El Niño” (ENSO), which is important in climate variability, in fish production and in the global carbon cycle [14]. The annual variation in the sea surface temperature fluctuates between 26 and 30 °C [3,14]. The intrusion of the Costa Rica Coastal Current causes annual variations of 5 °C or more in the area near Cabo Corrientes, while, in the Gulf of Tehuantepec, the temperature varies between 3 °C and 4 °C (see Figure 2). The warm waters of the Tropical Pacific are subject to net surface heating, which generates convection currents, in a constant mixing process within a layer of 20 to 50 m. The thermocline is not in the mixed layer, but below it [3,14,16,17].
Due to the shallow depth of the Mexican Pacific coastal zone, the thermohaline structure is affected by processes such as local winds, river discharge, rainfall, and evaporation [18]. On the coasts of the Eastern Tropical Pacific Ocean, the mean sea surface temperature is 28 °C and, at 1000 m depth, it is 4 °C; in other cases, the temperatures vary from 28.5 °C at the sea surface to 3–5 °C at 1000 m [14,18,19].
Because of the small breadth of the continental shelf (12 km), the thermohaline structure of the Pacific coasts, and the eastern Pacific warm pool in particular, is similar to that of deep oceanic waters. However, the Gulf of Tehuantepec is characterized by a heterogeneous distribution of the surface temperature due to the effect of the wind. In the winter, the sea surface temperature is low (10 to 13 °C) where wind speeds are high and in the areas immediately adjacent, indicating that there is a diffusion of cold water to neighboring areas. During the summer, the winds are generally weak and blow in an easterly direction; sea surface temperature ranges between 28 and 30 °C [14,17,20,21,22]. In the winter, it is also evident that the temperature drops considerably due to the winds “Tehuanos” and the thermocline moves between 90 and 100 m.
2.2. Graphic Representation of the Thermal Gradient, According to Their Vertical Profiles (0–1000 m Depth)
Using the databases of the Mexican Navy (SEMAR), the National Oceanographic Data Center (NODC) of the United States of America and the World Ocean Database 2013 (WOD) of the National Oceanographic and Atmospheric Administration (NOAA), through the Ocean Data View (ODV), historical and seasonal data of temperatures in the Mexican Pacific Ocean was compiled in order to determine the changes of oceanic thermal gradient occurring over time. From the corresponding vertical profiles of temperature, the thermal gradient was computed and plotted.
2.3. Analysis and Interpretation of Data by Geographic Information Systems (GIS)
Temperature data, raster and vector datasets were obtained via GIS tools to calculate thermal gradient between surface and depths selected. Thermal gradients were obtained by subtracting sea surface temperature from the temperature reported for other depths. The exclusion process allows for representing those areas with thermal gradient above 20 °C.
The first raster generated was the distance from the different coastal settlements to the areas with depths of 1000 m. Those sites of less than 10 km were identified.
The second raster were the database of temperatures at surface and 1000 m depths, for different sites of the Mexican Pacific Ocean, divided into three zones: the Gulf of Tehuantepec, the eastern Pacific warm pool of the Mexican Pacific and the Gulf of California (Pacific Northwest). The thermal gradient was the result of subtracting surface temperature raster from 1000 m depth temperature raster.
The mean seasonal thermal gradient for Mexican Pacific Ocean presented in maps were the result of doing a buffer of 2000 m in a water depth of 1000 m and extracting the values corresponding to this line from thermal gradient raster. Subsequently, the areas with suitable thermal gradients for the operation of an OTEC plant were determined, which will then be plotted on different maps.
3. Results
3.1. Vertical Profiles of Historical Temperature Differences
The historical behavior of the oceanic thermal gradient in the MPO is as follows, according to the three regions of study. In Figure 3, Figure 4 and Figure 5, the points indicate the mean annual temperatures.
3.1.1. Gulf of Tehuantepec
Historical data for Gulf of Tehuantepec (see Figure 3) shows that a thermal difference of over 26 °C can be found between the sea surface and 1000 m depth. Differences of over 20 °C can be seen at 500 m. Thus, this area is therefore favourable for OTEC development, and, as other areas with similar differences for more than 80% of the time were found, it would be possible to convert energy throughout most of the year.
3.1.2. The Eastern Pacific Warm Pool of the Mexican Pacific
In this zone, the maximum difference registered is 26 °C, but, most of the time, it oscillates between 22 and 24 °C (see Figure 4). The thermal difference may be outside the minimum range for the OTEC cycle up to 55% of the time, with a few exceptions in Guerrero and Michoacan, where, for 78% of the time, the difference is over 20 °C.
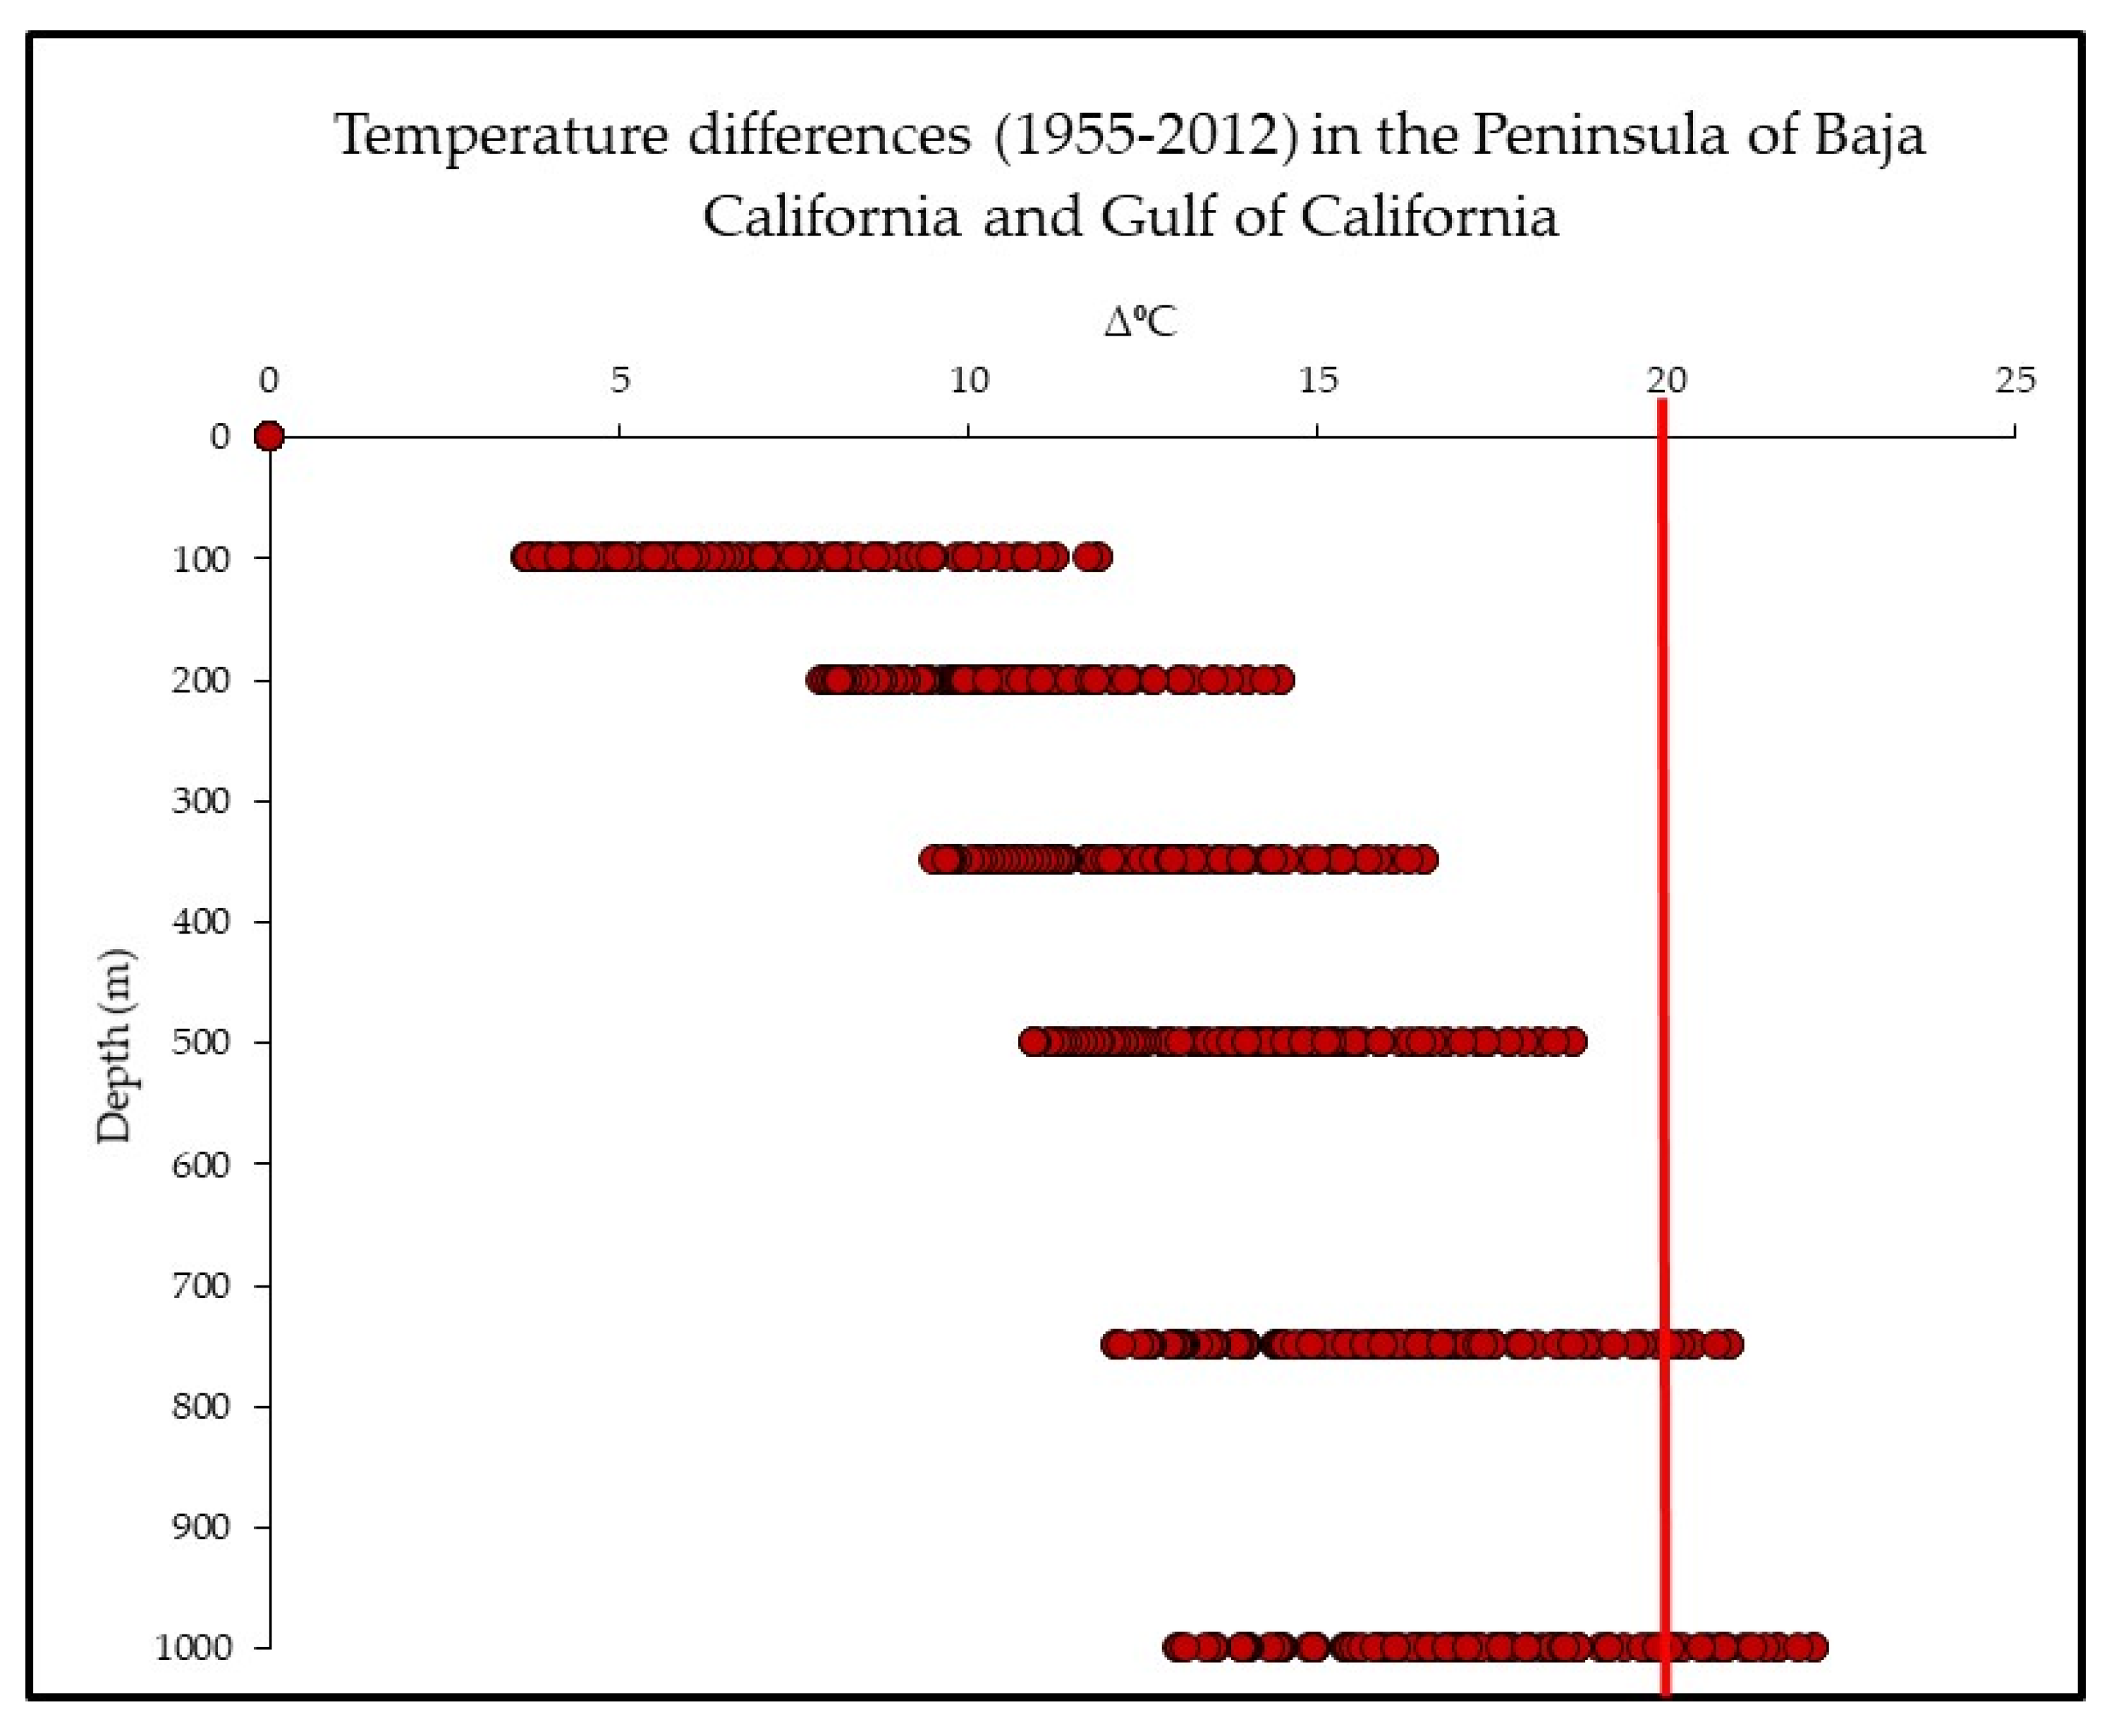
3.1.3. The Gulf of California and Mexican Northwest Pacific
In this zone, some thermal differences of 20 °C or more were found, though the most representative value is 18 °C. Under these conditions, energy could be converted via OTEC in the summer months only (see Figure 5).
3.2. Historical Seasonal Thermal Difference (TG) Maps (0 to 1000 m Depth)
3.2.1. Spring
In the spring, the TG suitable for OTEC development extends as far north as the state of Sinaloa and the lowest value is greater than 20 °C. In the south of the MPO, higher differences are found. In the area of Bahia de Banderas and Cabo Corrientes (Nayarit and Jalisco), we find thermal differences between 21 and 22 °C. Michoacan presents TGs between 23.7 and 25.3 °C with maximum values off Chiapas. The highest TG is located in Oaxaca, in the area from Puerto Angel to the Lagunas of Chacahua-Pastoria (24.7 °C) (see Figure 6).
3.2.2. Summer
At 1000 m depths, it is observed that the TG increases considerably, both in geographical space and in thermal difference. Baja California Sur has TG zones from 20 to 23 °C, which include the western part of the peninsula as well as some areas in the Gulf of California. Sonora and Sinaloa have the highest differences, up to 27 °C, but they are not suitable, as they are far from the shore. The Cabo Corrientes and Bahia de Banderas areas have differences of between 24 and 26 °C, as do Michoacan, Guerrero and Oaxaca. In Chiapas, TGs range from 23 to 26.8 °C (see Figure 7).
3.2.3. Autumn
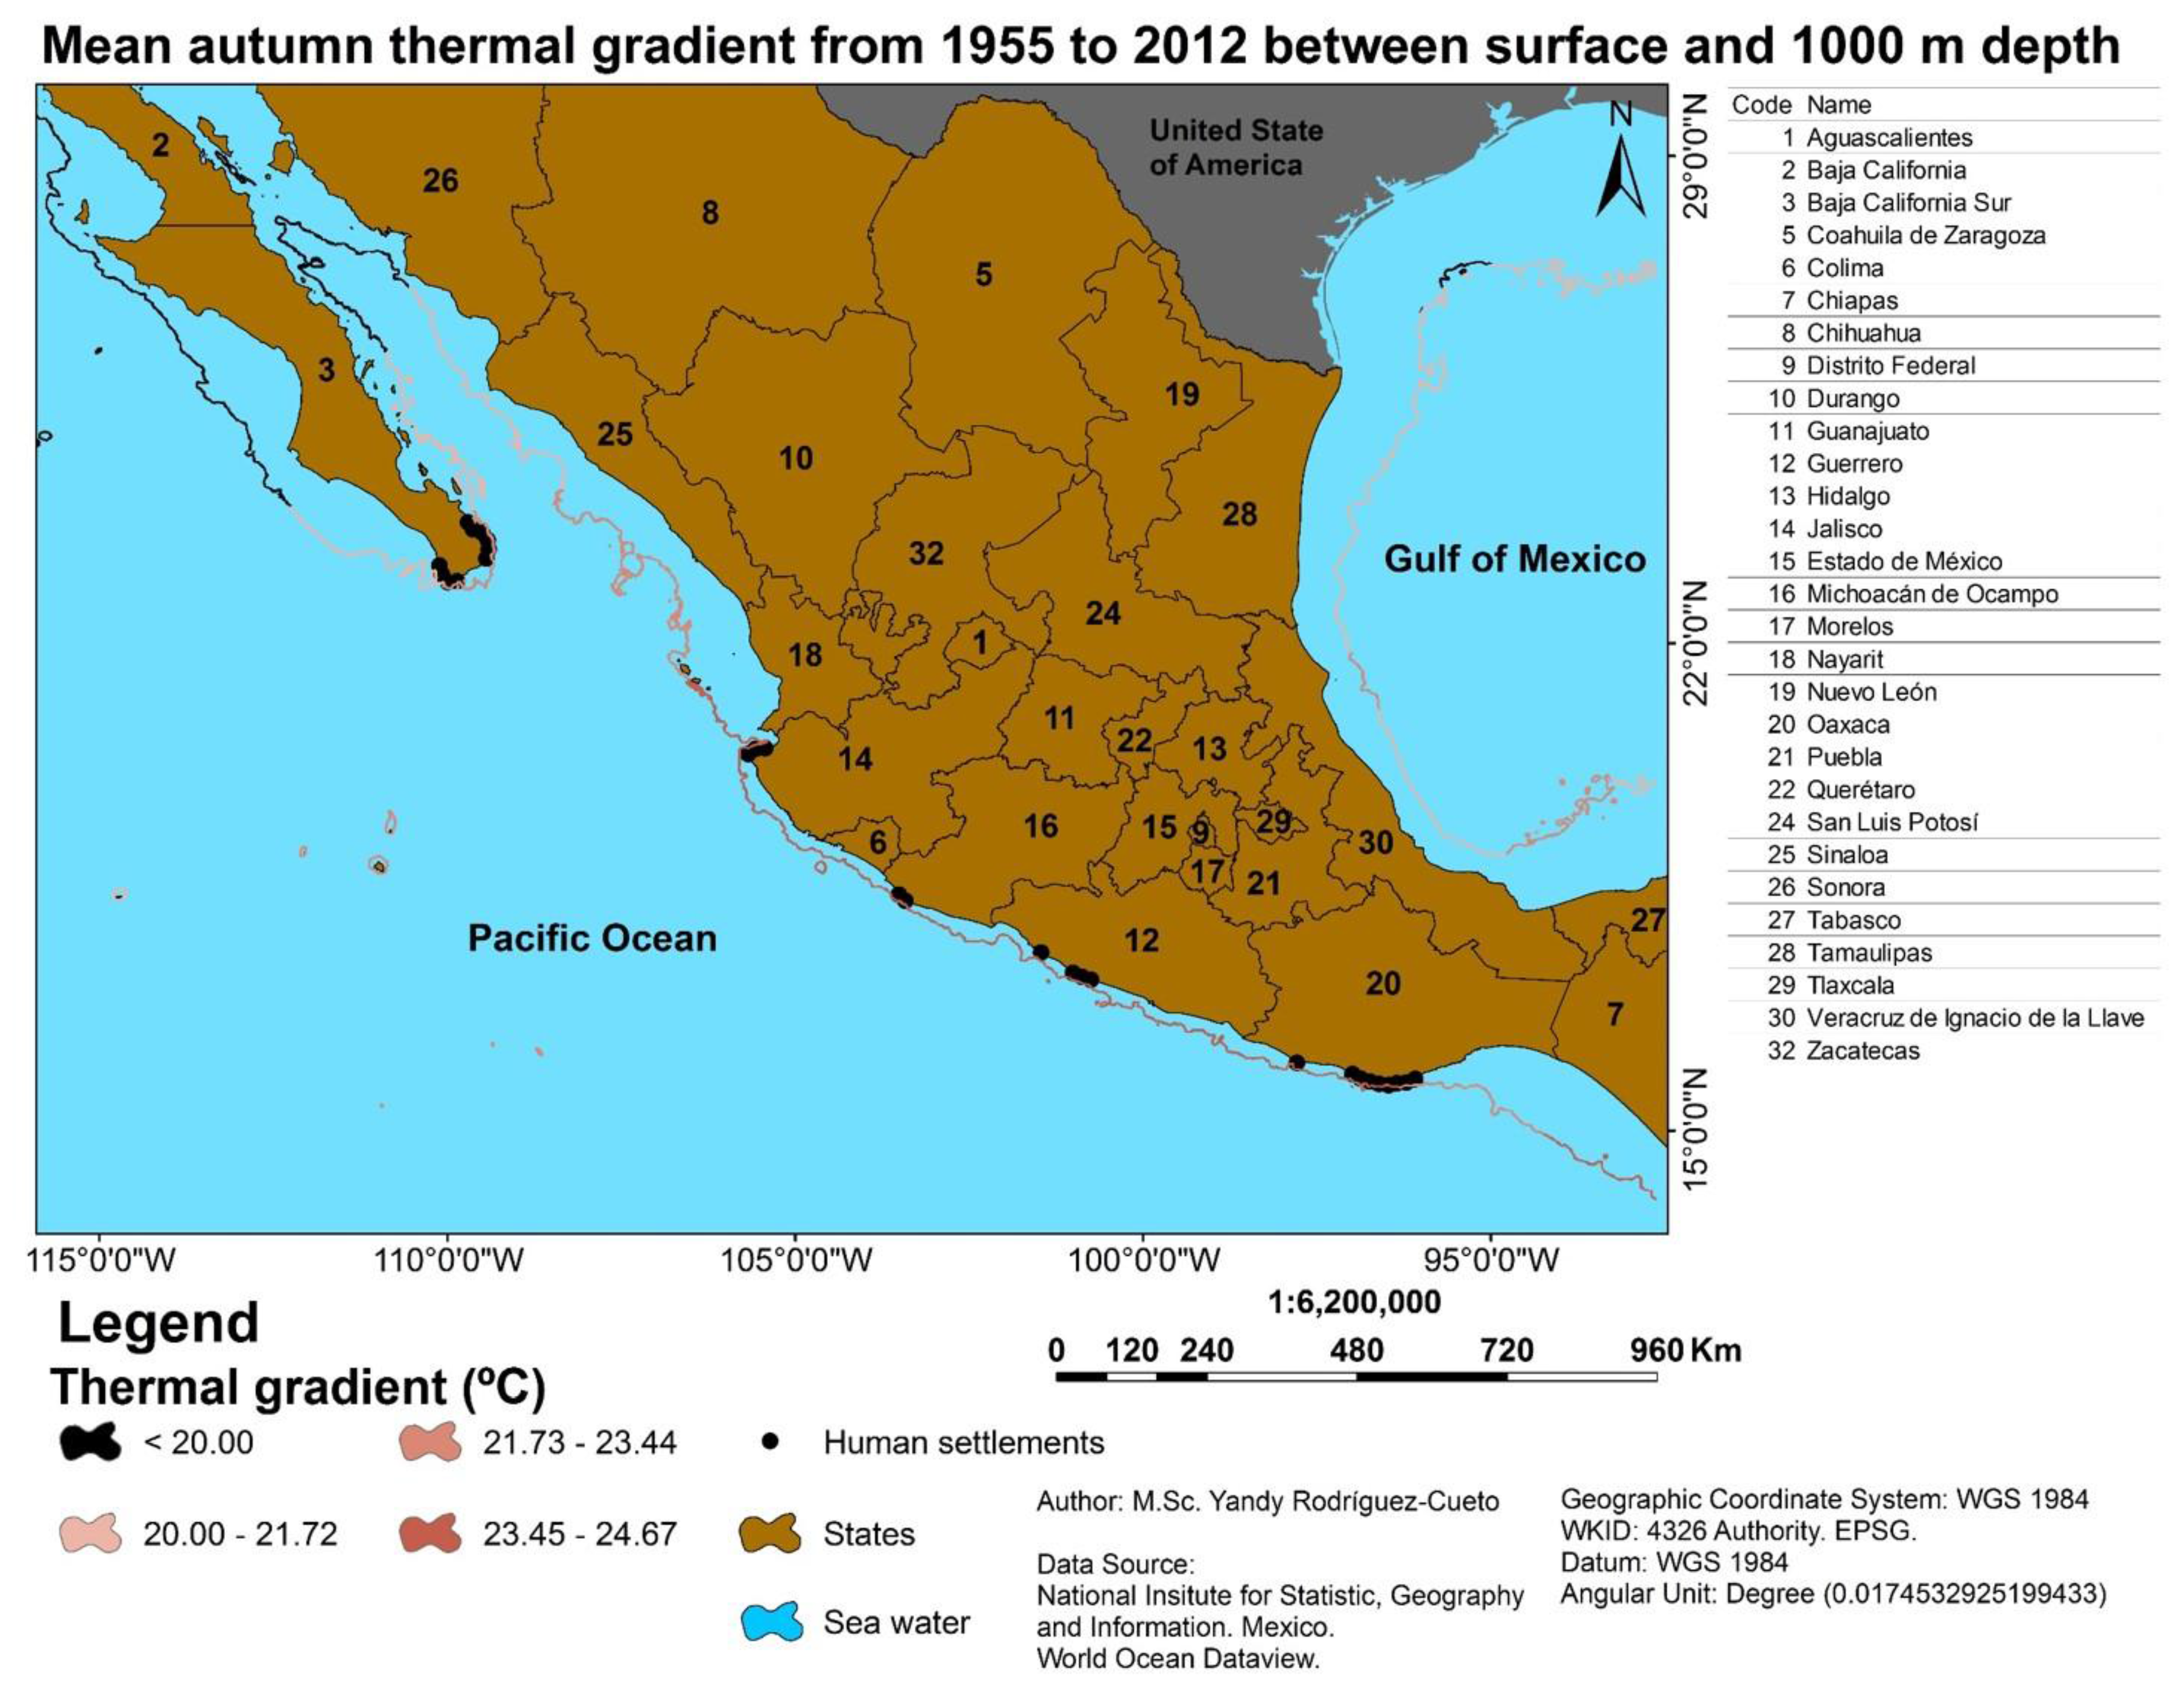
At 1000 m depths, there is a very variable TG from the southern peninsula of Baja California to the Gulf of Tehuantepec. In the southern part of BCS, there are areas with differences ranging from 20 to 22 °C, in Cerralvo Island. In the areas of Bahia de Banderas and Cabo Corrientes, there are differences ranging from 23 to 24 °C, while, for Michoacan, Guerrero, Oaxaca and Chiapas, differences are up to 25.17 °C. Of all these states, Guerrero and Oaxaca have the thermal differences most suitable for exploitation, from Barra de Potosi and Nuxco in Guerrero to Los Naranjos and Puerto Angel in Oaxaca, up to 24 °C (see Figure 8).
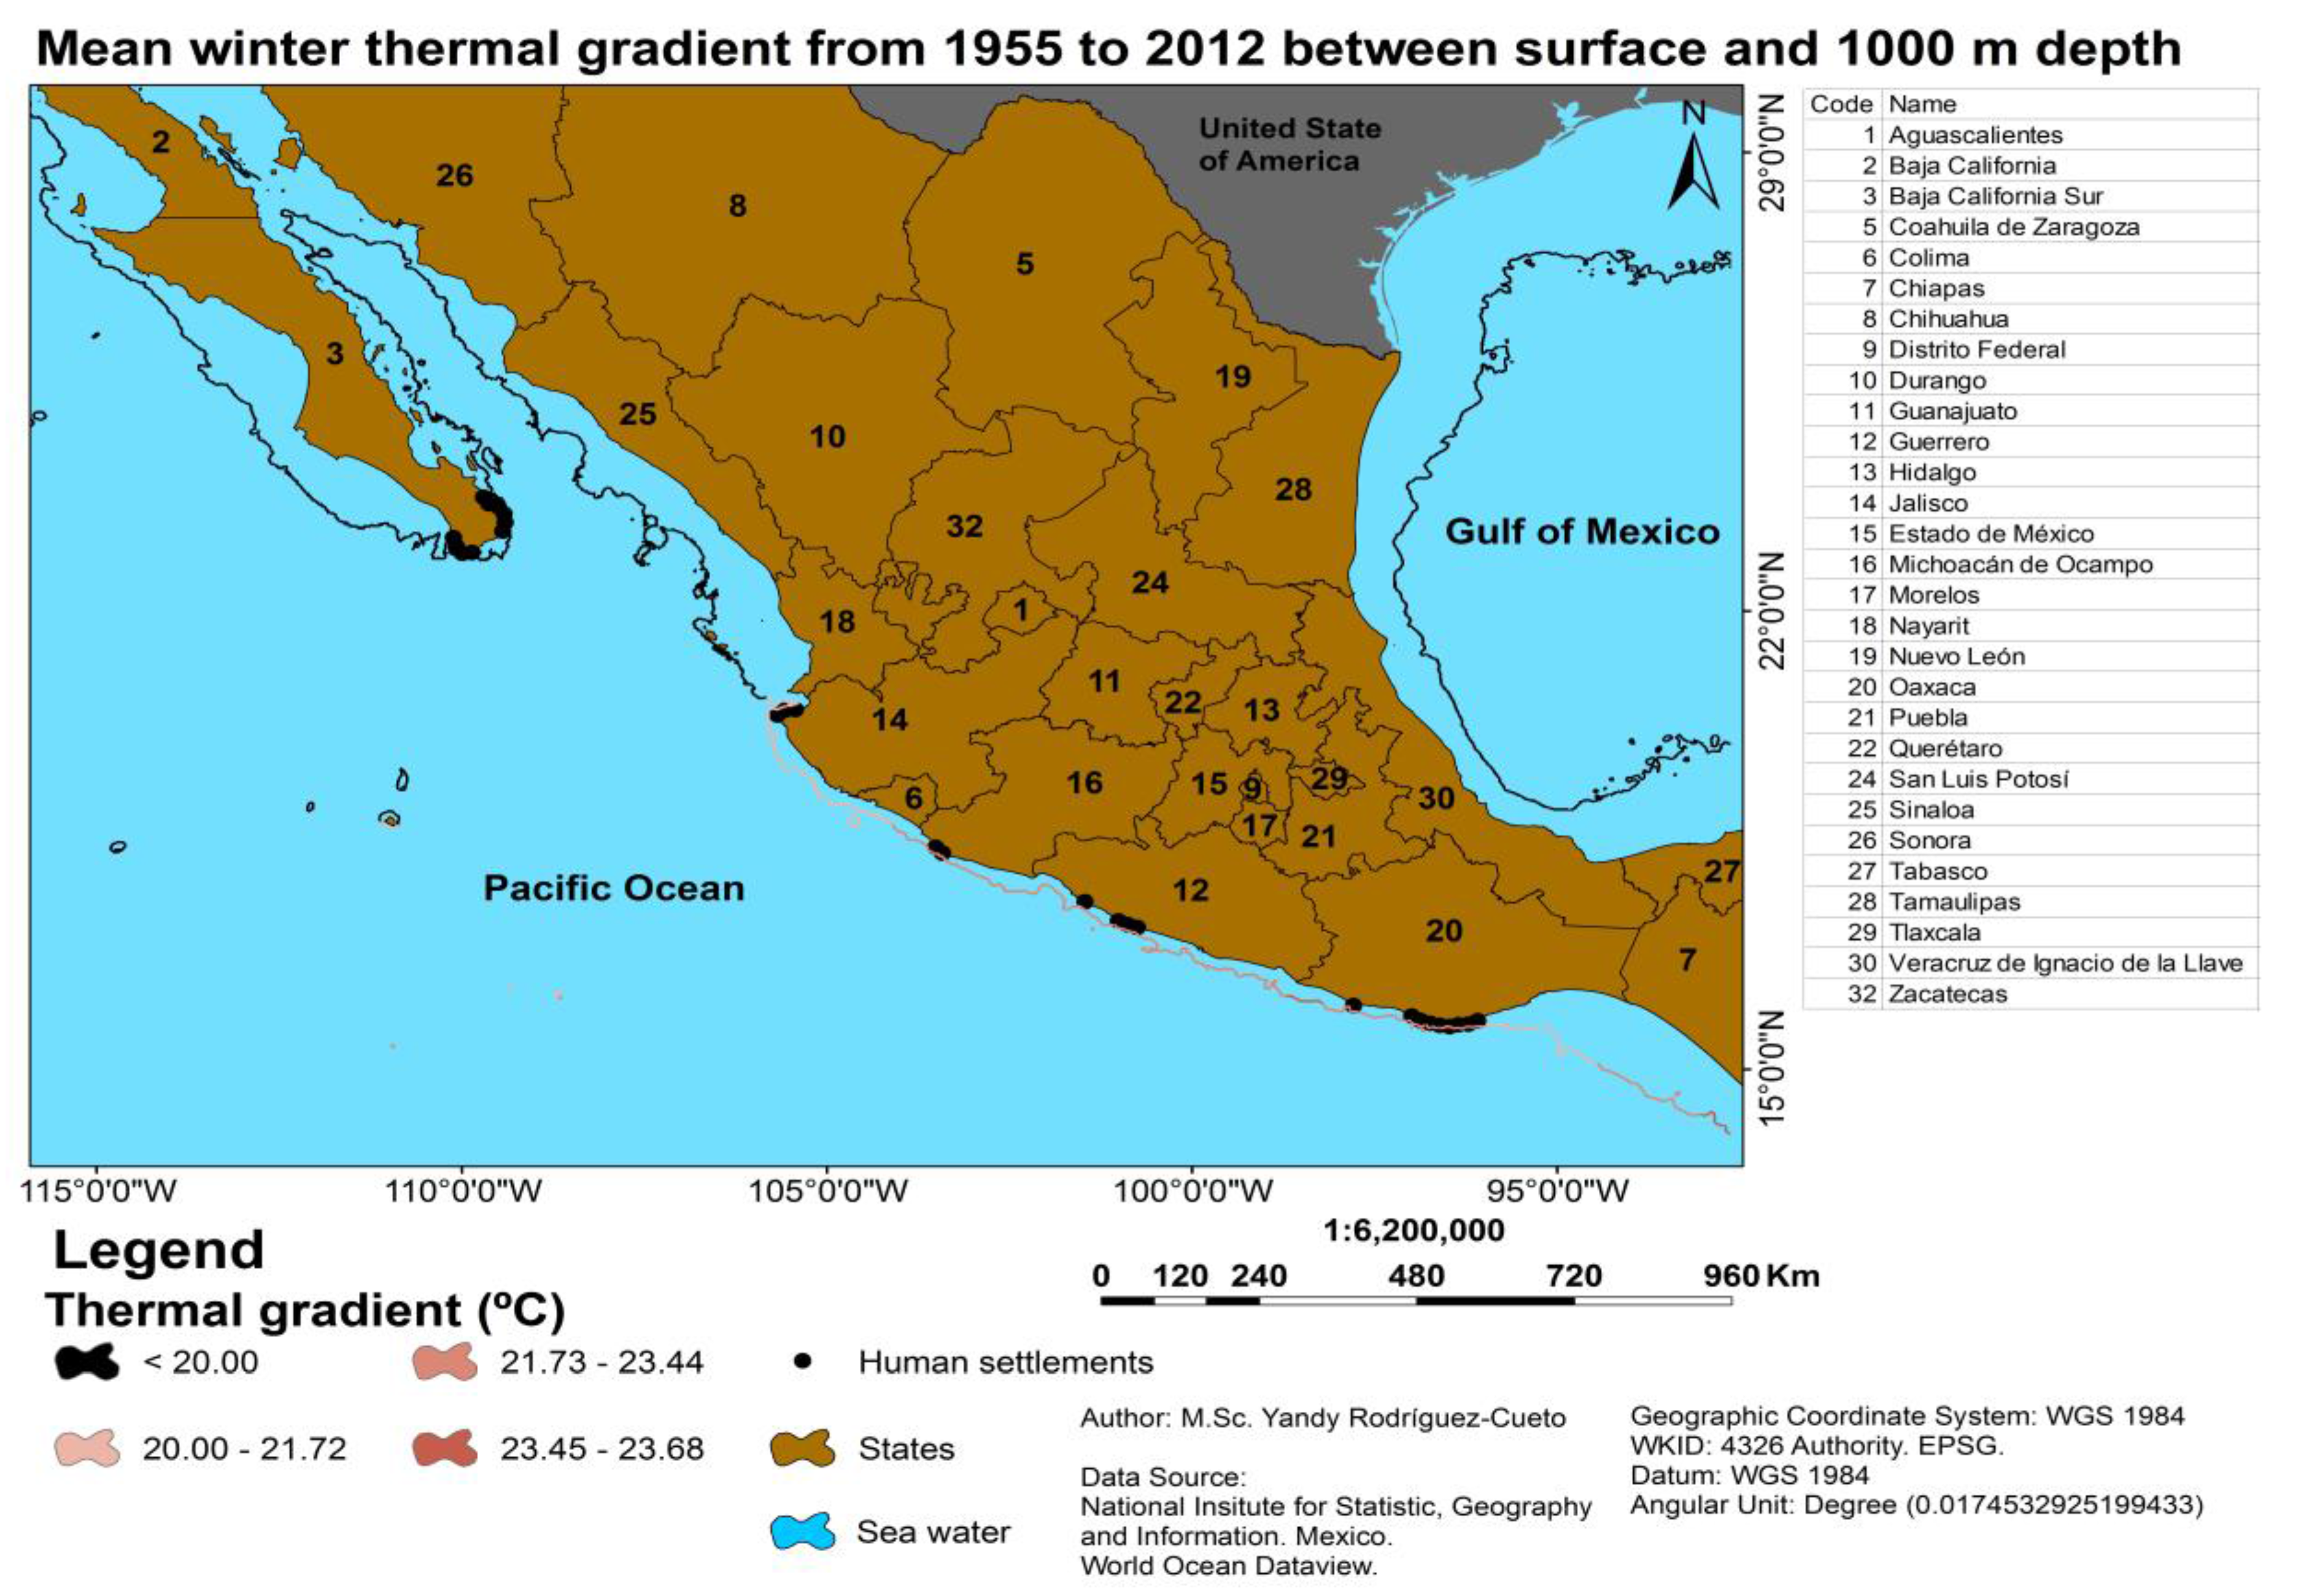
3.2.4. Winter
At 1000 m depths, the thermal difference extends north to Baja California Sur and Sinaloa but with very low values (20 to 21.8 °C). From here to Cabo Corrientes and Bahia de Banderas, there were thermal differences of between 18 and 20.8 °C. Further south, Michoacan has differences of between 21 and 22 °C, while Guerrero and Oaxaca have the highest thermal differences, 22.4 to 24.1 °C), considering that the exploitation limit would be those zones that are in regions whose difference reaches 23 °C. Chiapas also has these TGs, but they would only be exploitable considering OTEC plants (see Figure 9).
3.3. Energy Demand Sites
The coastal settlements in front of an area with a thermal difference greater than or equal to 20 °C and where the distance from the shore to the cold water extraction point is 10 km or less are listed in Table 1.
4. Discussion
Of all the places mentioned, there is no site that truly fulfills every requisite. The advantages and disadvantages of each site must be analyzed individually.
4.1. Areas That Are Deemed Unsuitable
The zones that currently are not considered adequate for OTEC exploitation (but that may possibly be included in the future) are: along the western coast of the Baja California peninsula, as the surface waters are cold due to the presence of the California Current; there is no adequate difference in any season of the year. The interior of the Gulf of California has several drawbacks; an exceptionally wide continental shelf on the eastern coast, very small towns with no access to the electrical grid dotting an otherwise inhabited west coast, waters in the northern portion of the gulf that do not reach the required depths, and a thermal difference that is only present in the summer. Although many areas in the Southern Mexican Pacific have favorable conditions, a location close to a marine protected area, or in an area vulnerable to hurricanes, or where the continental platform is extensive are not feasible for OTEC plants.
4.2. Zones That Seem Promising
The disadvantage of the southern Baja California peninsula is that the difference disappears in the winter. Advantages of this area include the proximity of large cities with a high demand for electricity, air conditioning and desalinized water, as well as sites remarkably close to the coast that boast depths greater than 1000 m (two points in particular, called Los Frailes and Cerralvo Island). However, the tourist demand for water and energy is very high.
The Mexican Central Pacific Ocean is quite extensive and has several promising places for OTEC development. The thermal difference is favorable throughout the year, there are various sites of great depth close to the coast, there is access to the electrical grid, and there are important centers of consumption. Among the unfavorable aspects, there is the possible threat of intense hurricanes and the fact that there are protected areas. Concerning hurricanes, on this side of the Pacific Ocean, they evolve from south to north in such a way that, while in the south the category is normally 1 or 2, category 5 hurricanes strike the north and even travel as far as the Baja California peninsula. Two sites are currently under more detailed study: Bahía de Banderas, Nayarit and Puerto Ángel, Oaxaca.
4.3. Islands
In the case of the Mexican Pacific islands, the areas with the best thermal differences are the Marias and Marietas islands. The main disadvantage is that both are protected areas. In addition, the Islas Marias contains a prison, which means that this type of project would require special permission from the Mexican government.
5. Conclusions
There are, in fact, several sites along the coasts of Mexico at which OTEC plants can be installed. The most adequate points are Nuxco and San Luis de la Loma, Guerrero and Puerto Ángel, Oaxaca. Other points are likely to exist within the Central Mexican Pacific zone. Los Frailes and Los Cabos have an inadequate gradient for part of the year; nevertheless, other applications such as the utilization of cold water can be of great interest.
Acknowledgments
The authors would like to thank the Mexican Consejo Nacional de Ciencia y Tecnología (CONACyT) and the Centro Mexicano de Innovación en Energías del Oceano (CEMIE-O) for supporting this research, Ricardo E. Hernández Contreras and León R. Alvarez from the Instituto de Ciencias del Mar y Limnología (ICML) for the data processing and Prof. Miguel Angel Alatorre Mendieta for his revision of the manuscript.
Author Contributions
A.G.H. helped in the cabinet research, SIG analysis and methodology, results and discussion of the manuscript. E.M. helped in the results presentation and structure, in outlining the discussion and reviewing the whole manuscript. R.S. helped in the results presentation and structure, -reviewing the whole manuscript. Y.R.C. helped in the figures and maps presentation, SIG analysis and discussion of the manuscript. L.A.V. helped in discussion and analysis of the methodology and results of the manuscript.
Conflicts of Interest
The authors declare no conflict of interest. The founding sponsors had no role in the design of the study; in the collection, analyses, or interpretation of data; in the writing of the manuscript, and in the decision to publish the results.
References
- Avery, W.H.; Wu, C. Renewable Energy from the Ocean: A Guide to OTEC; Oxford University Press: Oxford, UK; Research Triangle Institute: Durham, NC, USA, 1994. [Google Scholar]
- Vega, L.A. OTEC Environmental Impact: Historical Perspective; HINMREC-HNEI-UH & Lockheed Martin Maritime Systems & Sensors; University of Hawaii: Honolulu, HI, USA, 2009; p. 57. [Google Scholar]
- García Huante, A. Posibles Efectos Oceanográficos por la Operación de una Planta OTEC en Puerto Ángel, Oaxaca, México. Master’s Thesis, Posgrado en Ciencias del Mary Limnología, Universidad Nacional Autónoma de Mexico, Mexico City, Mexico, 2015. [Google Scholar]
- Beck, E.J. Ocean Thermal Gradient Hydraulic Power Plant. Science 1975, 189, 293–294. [Google Scholar] [CrossRef] [PubMed]
- Kim, H.-J. Current Status of OTEC around the World; A Brief Survey Report for IEA-OES; Korea Research Institute of Ships and Ocean Engineering (KRISO): Daejeon, Korea, 2017. [Google Scholar]
- Makai’s Ocean Thermal Energy Conversion (OTEC) Power Plant, Hawaii. Power Technology. 2017. Available online: http://www.power-technology.com/projects/makais-ocean-thermal-energy-conversion-otec-power-plant-hawaii/ (accessed on 17 May 2017).
- Matthieu, M.; Sinama, F.; Lucas, F. Equivalent Gibbs systems for modelling an onshore OTEC experimental plant on Reunion Island. Int. J. Energy Res. 2013, 37, 1112–1121. [Google Scholar]
- Crews, R. OTEC Sites, Aquarius Rising Maldives—An Ocean Research Centre and Eco-Tourist Facility. 1997.
- Aviña, H. Factibilidad de Instalar una Planta OTEC (Ocean Thermal Energy Conversion) en las Costas de México. Bachelor’s Thesis, Universidad Nacional Autónoma de Mexico, Mexico City, Mexico, 2007. [Google Scholar]
- Vázquez de la Cerda, R. Boletín Informativo ESIA IPN Mayo-Junio; IPN-ESIA: Mexico City, Mexico, 1984. [Google Scholar]
- Francisco, B.G.J. Evaluación del Potencial de Conversión de Energía Renovable en el Caribe Mexicano. Master’s Thesis, Posgrado en Ciencias del Mar y Limnología, Universidad Nacional Autónoma de Mexico, Mexico City, Mexico, 2011. [Google Scholar]
- De la Lanza-Espino, G. Gran Escenario de la Zona Costera y Oceánica de México. Ciencias 2004, 76, 4–13. [Google Scholar]
- Yolanda, H.C. Contaminación Biológica en la Bahía de Puerto Ángel, Oaxaca. 1997. Available online: http://www.umar.mx/revistas/2/contaminacion.pdf (accessed on 5 July 2017).
- Alatorre Mendieta, M.Á.; Hernández Contreras, R.E.; García Huante, A.; y Rodríguez Cueto, Y. Atlas de Potencial Energético del Océano en México por Gradiente Térmico; Línea Estratégica de Energía por Gradiente Térmico del Centro Mexicano en Innovación de Energías del Océano; CEMIE-Océano: Mexico City, Mexico, 2017. [Google Scholar]
- Kessler, W.S. The circulation of the eastern tropical Pacific: A review. Prog. Oceanogr. 2006, 69, 181–217. [Google Scholar] [CrossRef]
- De la Lanza, G.E. Oceanografía de Mares Mexicanos; de la Lanza, G., Ed.; AGT Editor: Mexico City, Mexico, 1991; 569p. [Google Scholar]
- Stumpf, H.G.; Legeckis, R.V. Satellite observations of mesoscale eddy dynamics in the eastern tropical Pacific Ocean. J. Phys. Oceanogr. 1977, 7, 648–658. [Google Scholar] [CrossRef]
- Stumpf, H.G. Satellite detection of upwelling in the Gulf of Tehuantepec, Mexico. J. Phys. Oceanogr. 1975, 5, 383–388. [Google Scholar] [CrossRef]
- Roden, G.I. Sobre la circulación producida por el viento en el Golfo de Tehuantepec y sus efectos sobre las temperaturas superficiales. Geophys. J. Int. 1961, 1, 55–76. [Google Scholar]
- Meave del Castillo, M.E. Diatomeas (Bacillariophyta), Dinoflagelados (Dinophyta) y Silicoflagelados (Dictyochophyceae) Marinos del Pacífico Mexicano, con Énfasis en la Porción Tropical; Informe Final; Proyecto BA008; Sistema Nacional de Información sobre Biodiversidad de México-Comisión Nacional para el Conocimiento y Uso de la Biodiversidad (CONABIO): Mexico City, Mexico, 2006; 80p. [Google Scholar]
- Lavín, M.F.; Robles, J.M.; Argote, M.L.; Barton, E.D.; Smith, R.; Brown, J.; Kosro, M.; Trasviña, A.; Vélez y, H.S.; García, J. Física del Golfo de Tehuantepec. Cienc. Desarro. 1991, 18, 97–108. [Google Scholar]
- Fiedler, P.C.; Talley, L.D. Hydrography of the eastern tropical Pacific: A review. Prog. Oceanogr. 2006, 69, 143–180. [Google Scholar] [CrossRef]
Figure 1.
Eastern Tropical Pacific Ocean. Shading represents mean sea surface temperature, darker = warmer.
Figure 1.
Eastern Tropical Pacific Ocean. Shading represents mean sea surface temperature, darker = warmer.

Figure 2.
Circulation patterns in the Eastern Tropical Pacific Ocean. Nomenclature: TB (Tehuantepec Bowl), WMC (Western Mexican Current) and CRCC (Costa Rica Coastal Current)
Figure 2.
Circulation patterns in the Eastern Tropical Pacific Ocean. Nomenclature: TB (Tehuantepec Bowl), WMC (Western Mexican Current) and CRCC (Costa Rica Coastal Current)
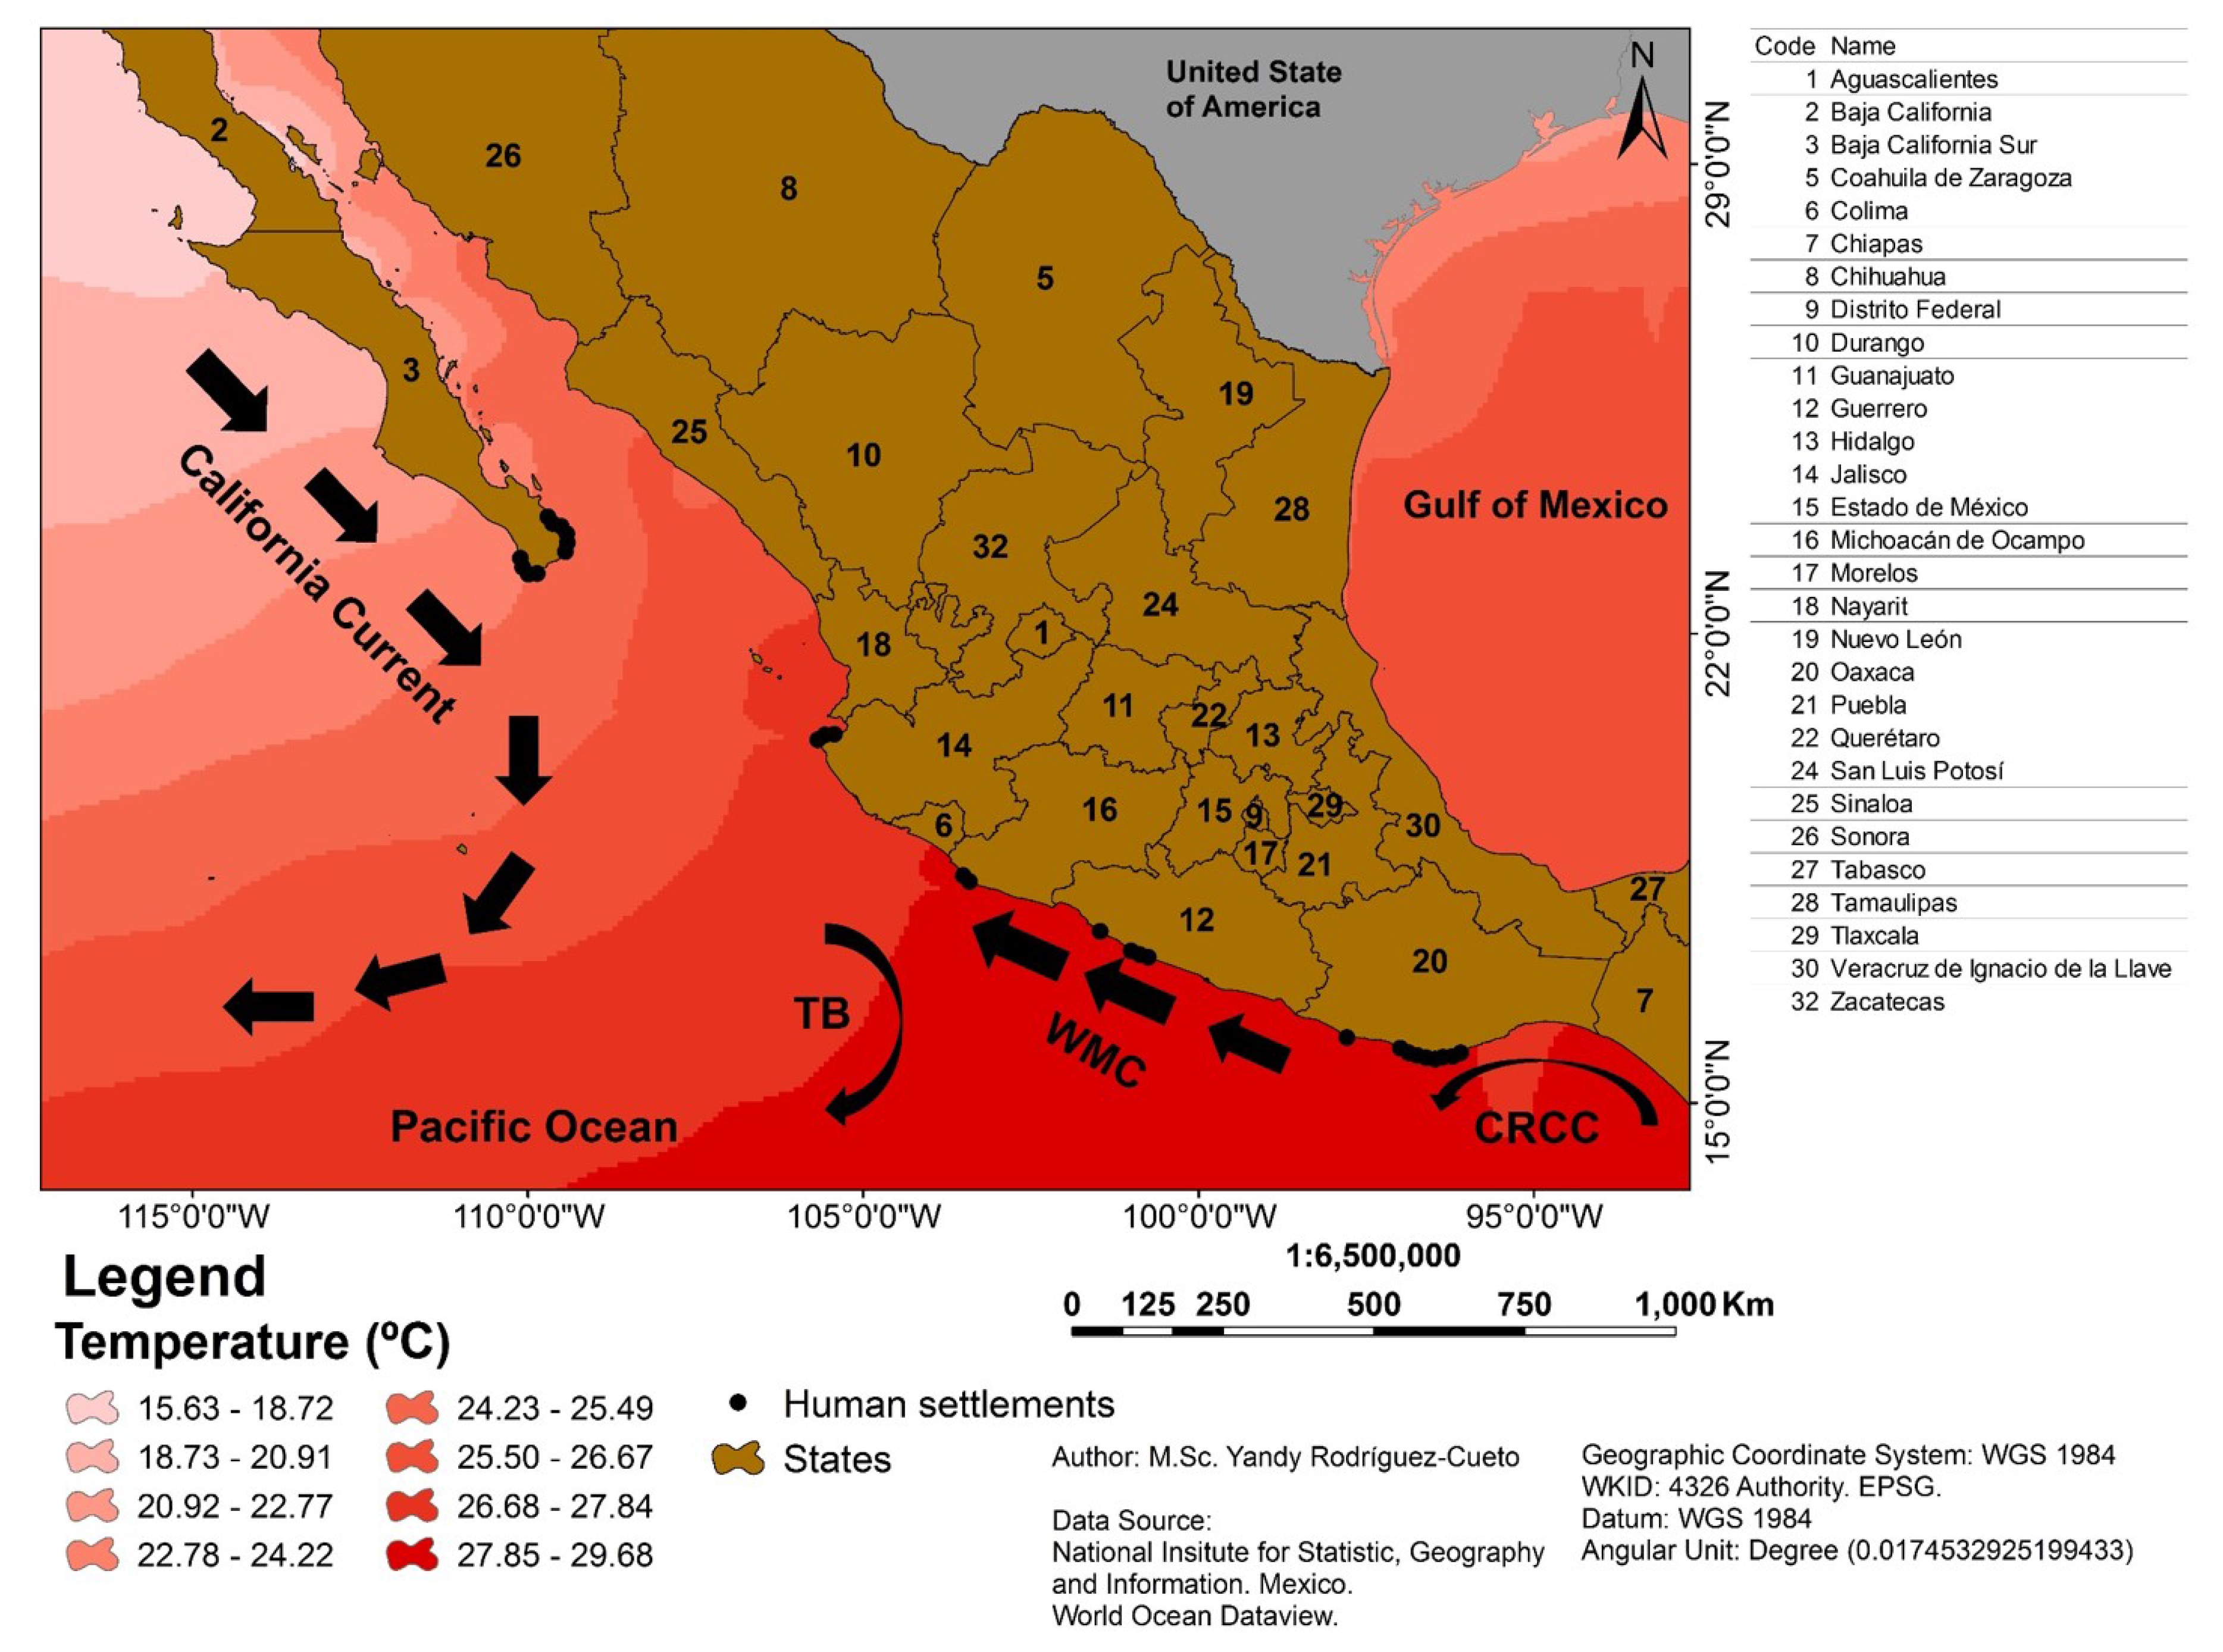
Figure 3.
Historical temperature differences between 0 and 1000 m depth at the Gulf of Tehuantepec.
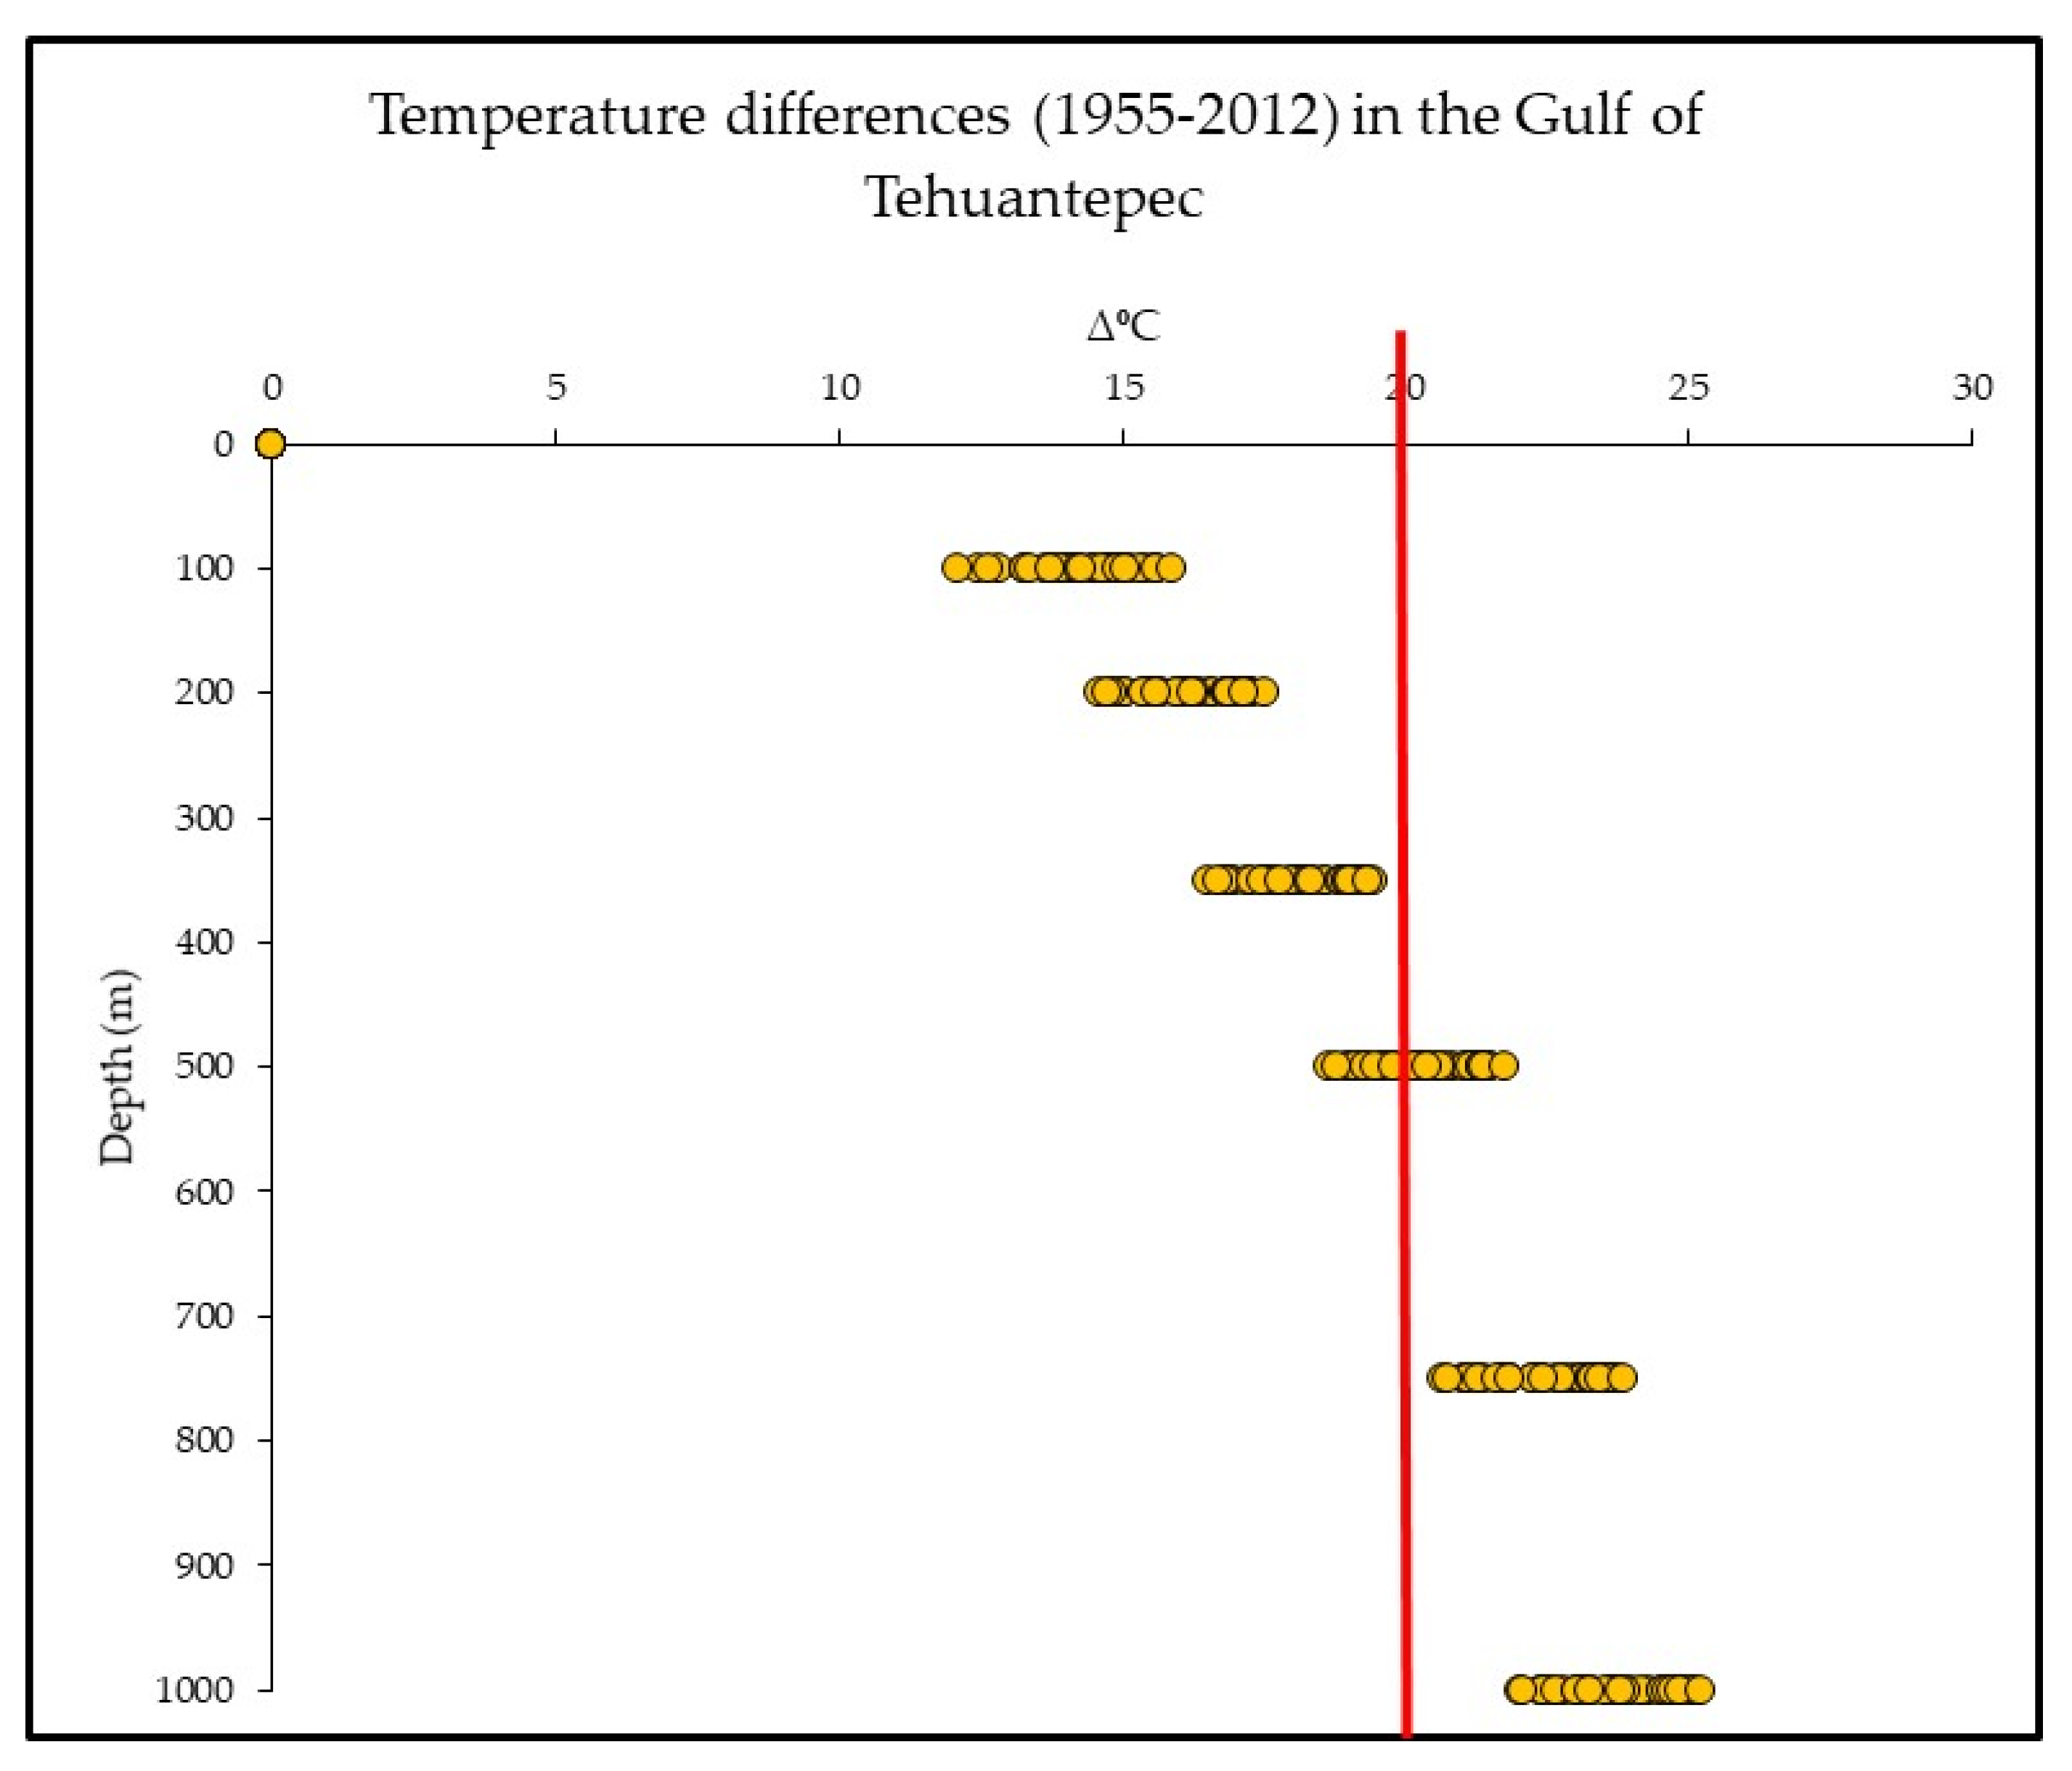
Figure 4.
Historical temperature differences in the eastern Pacific warm pool of the Mexican Pacific.
Figure 4.
Historical temperature differences in the eastern Pacific warm pool of the Mexican Pacific.
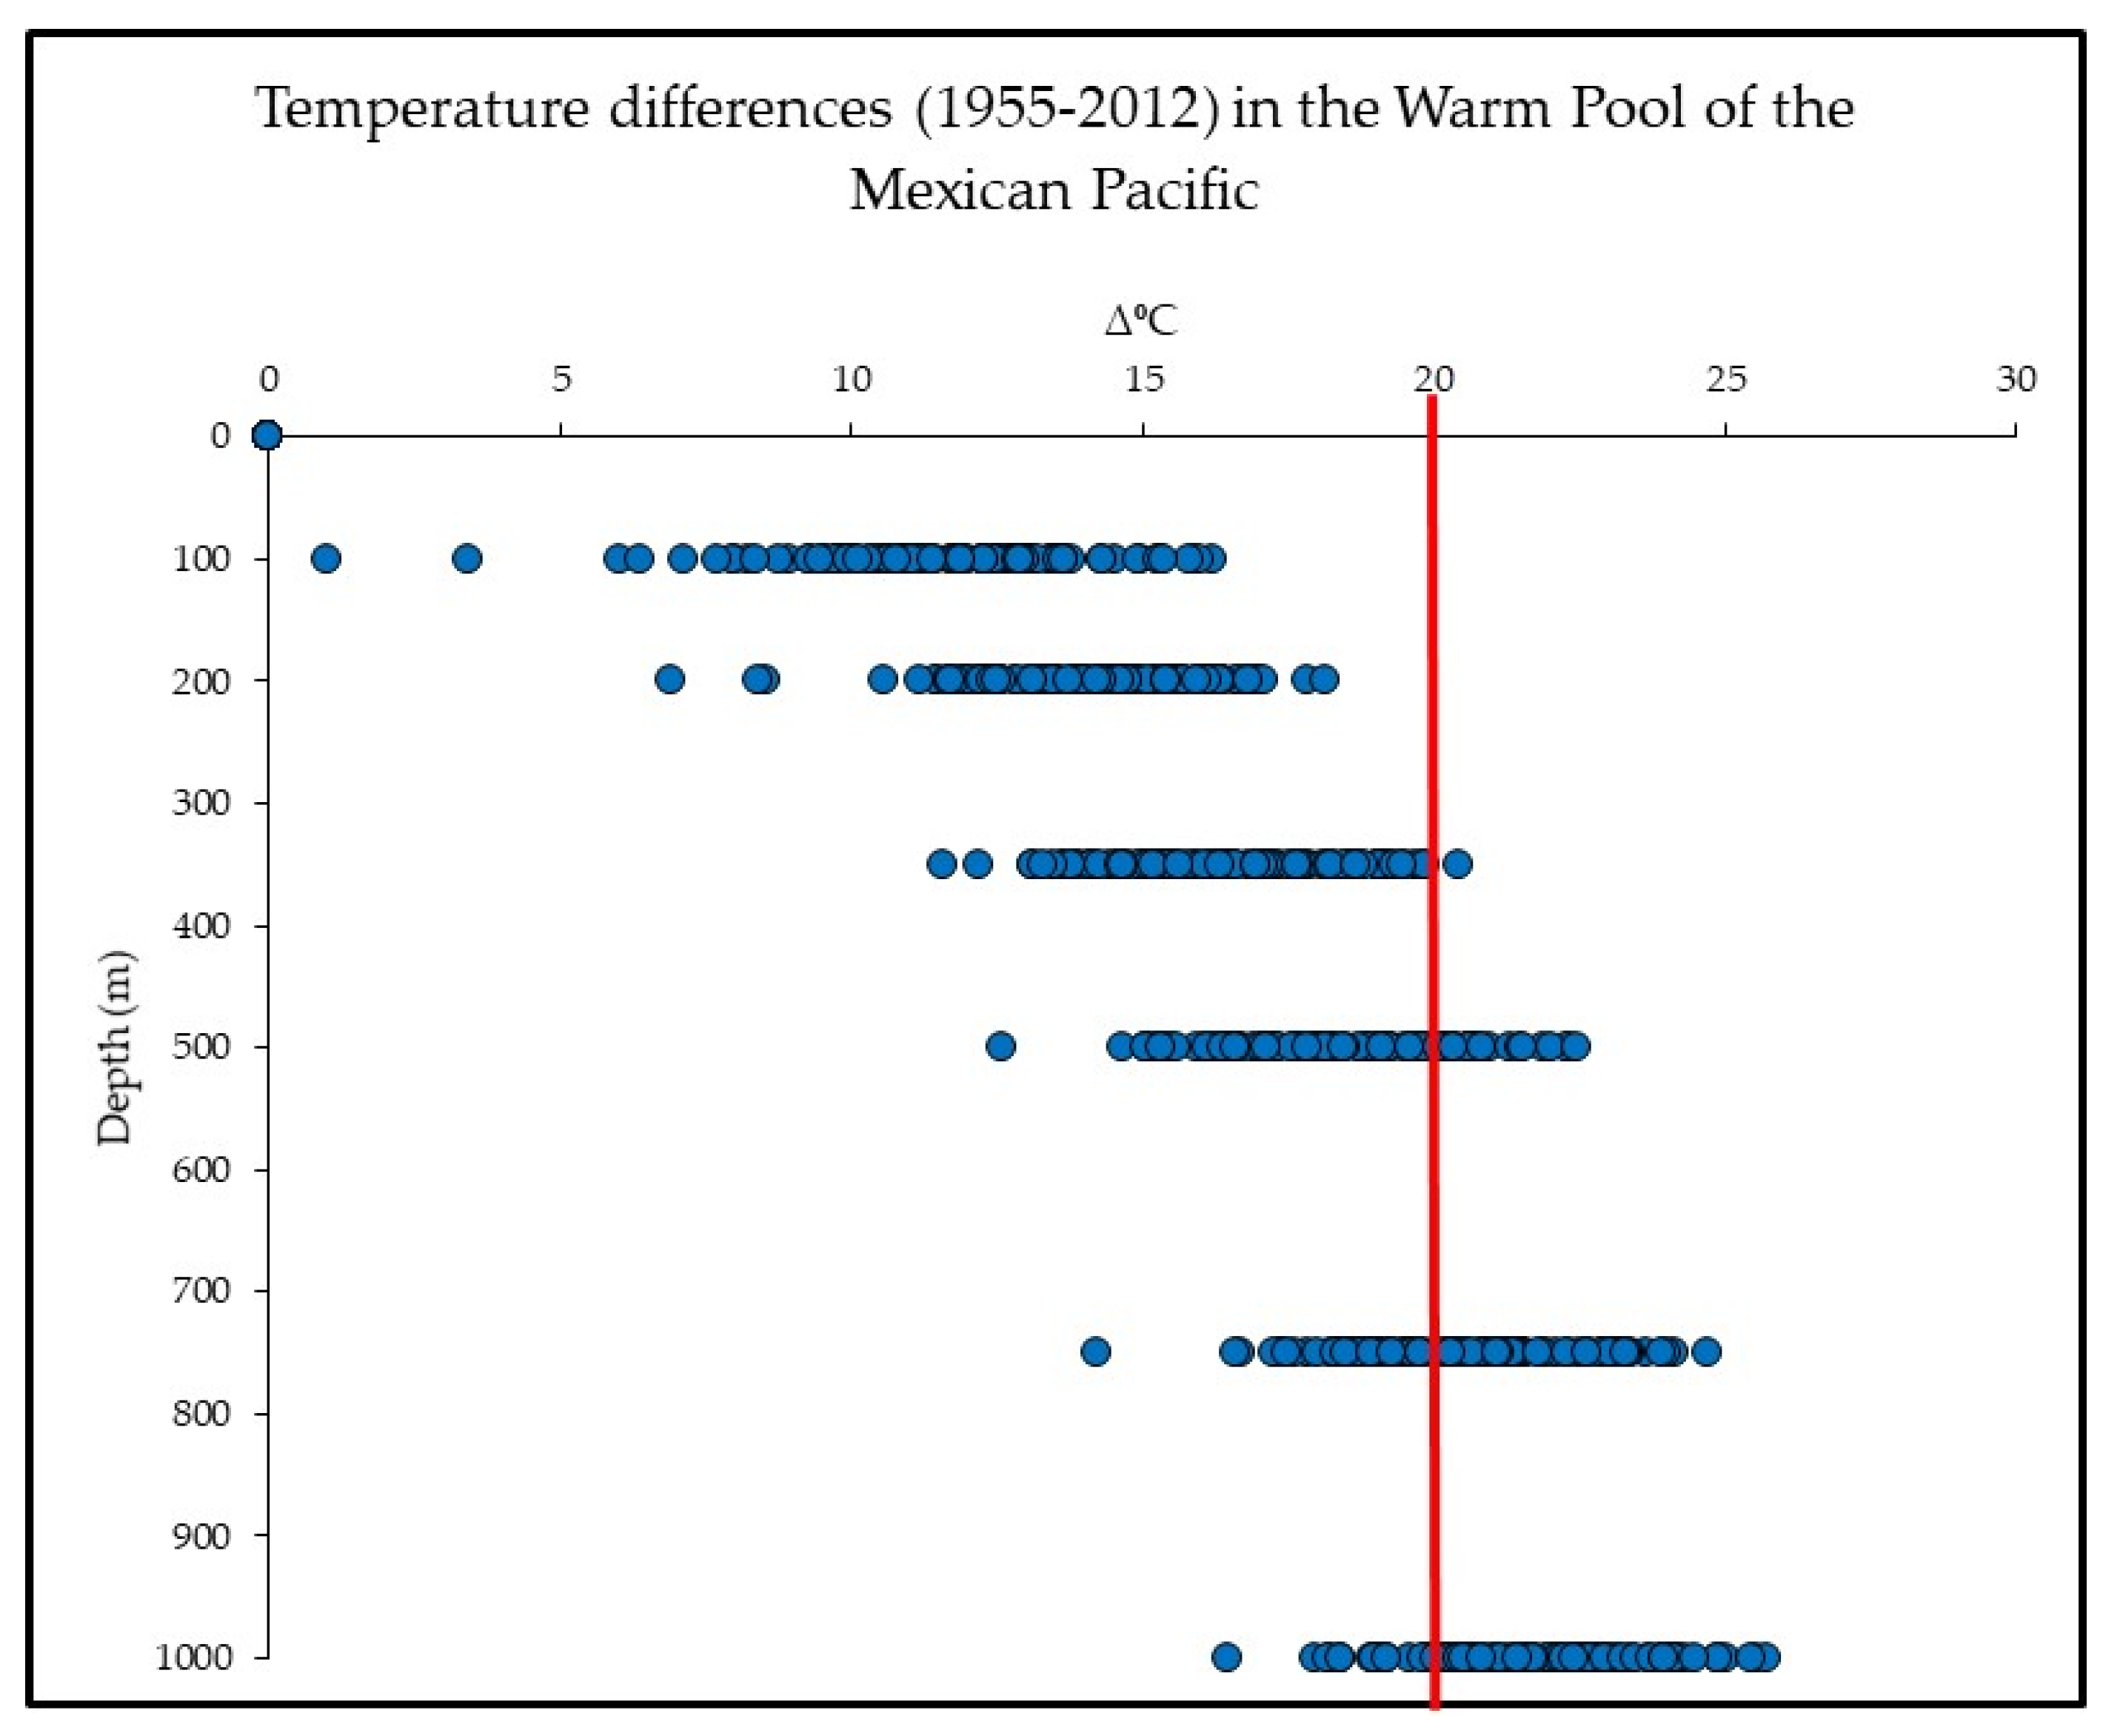
Figure 5.
Historical temperature differences betweeen 0 and 1000 m depth at Peninsula of Baja California and Gulf of California.
Figure 5.
Historical temperature differences betweeen 0 and 1000 m depth at Peninsula of Baja California and Gulf of California.

Figure 6.
Mean spring thermal difference between 0 and 1000 m depth.
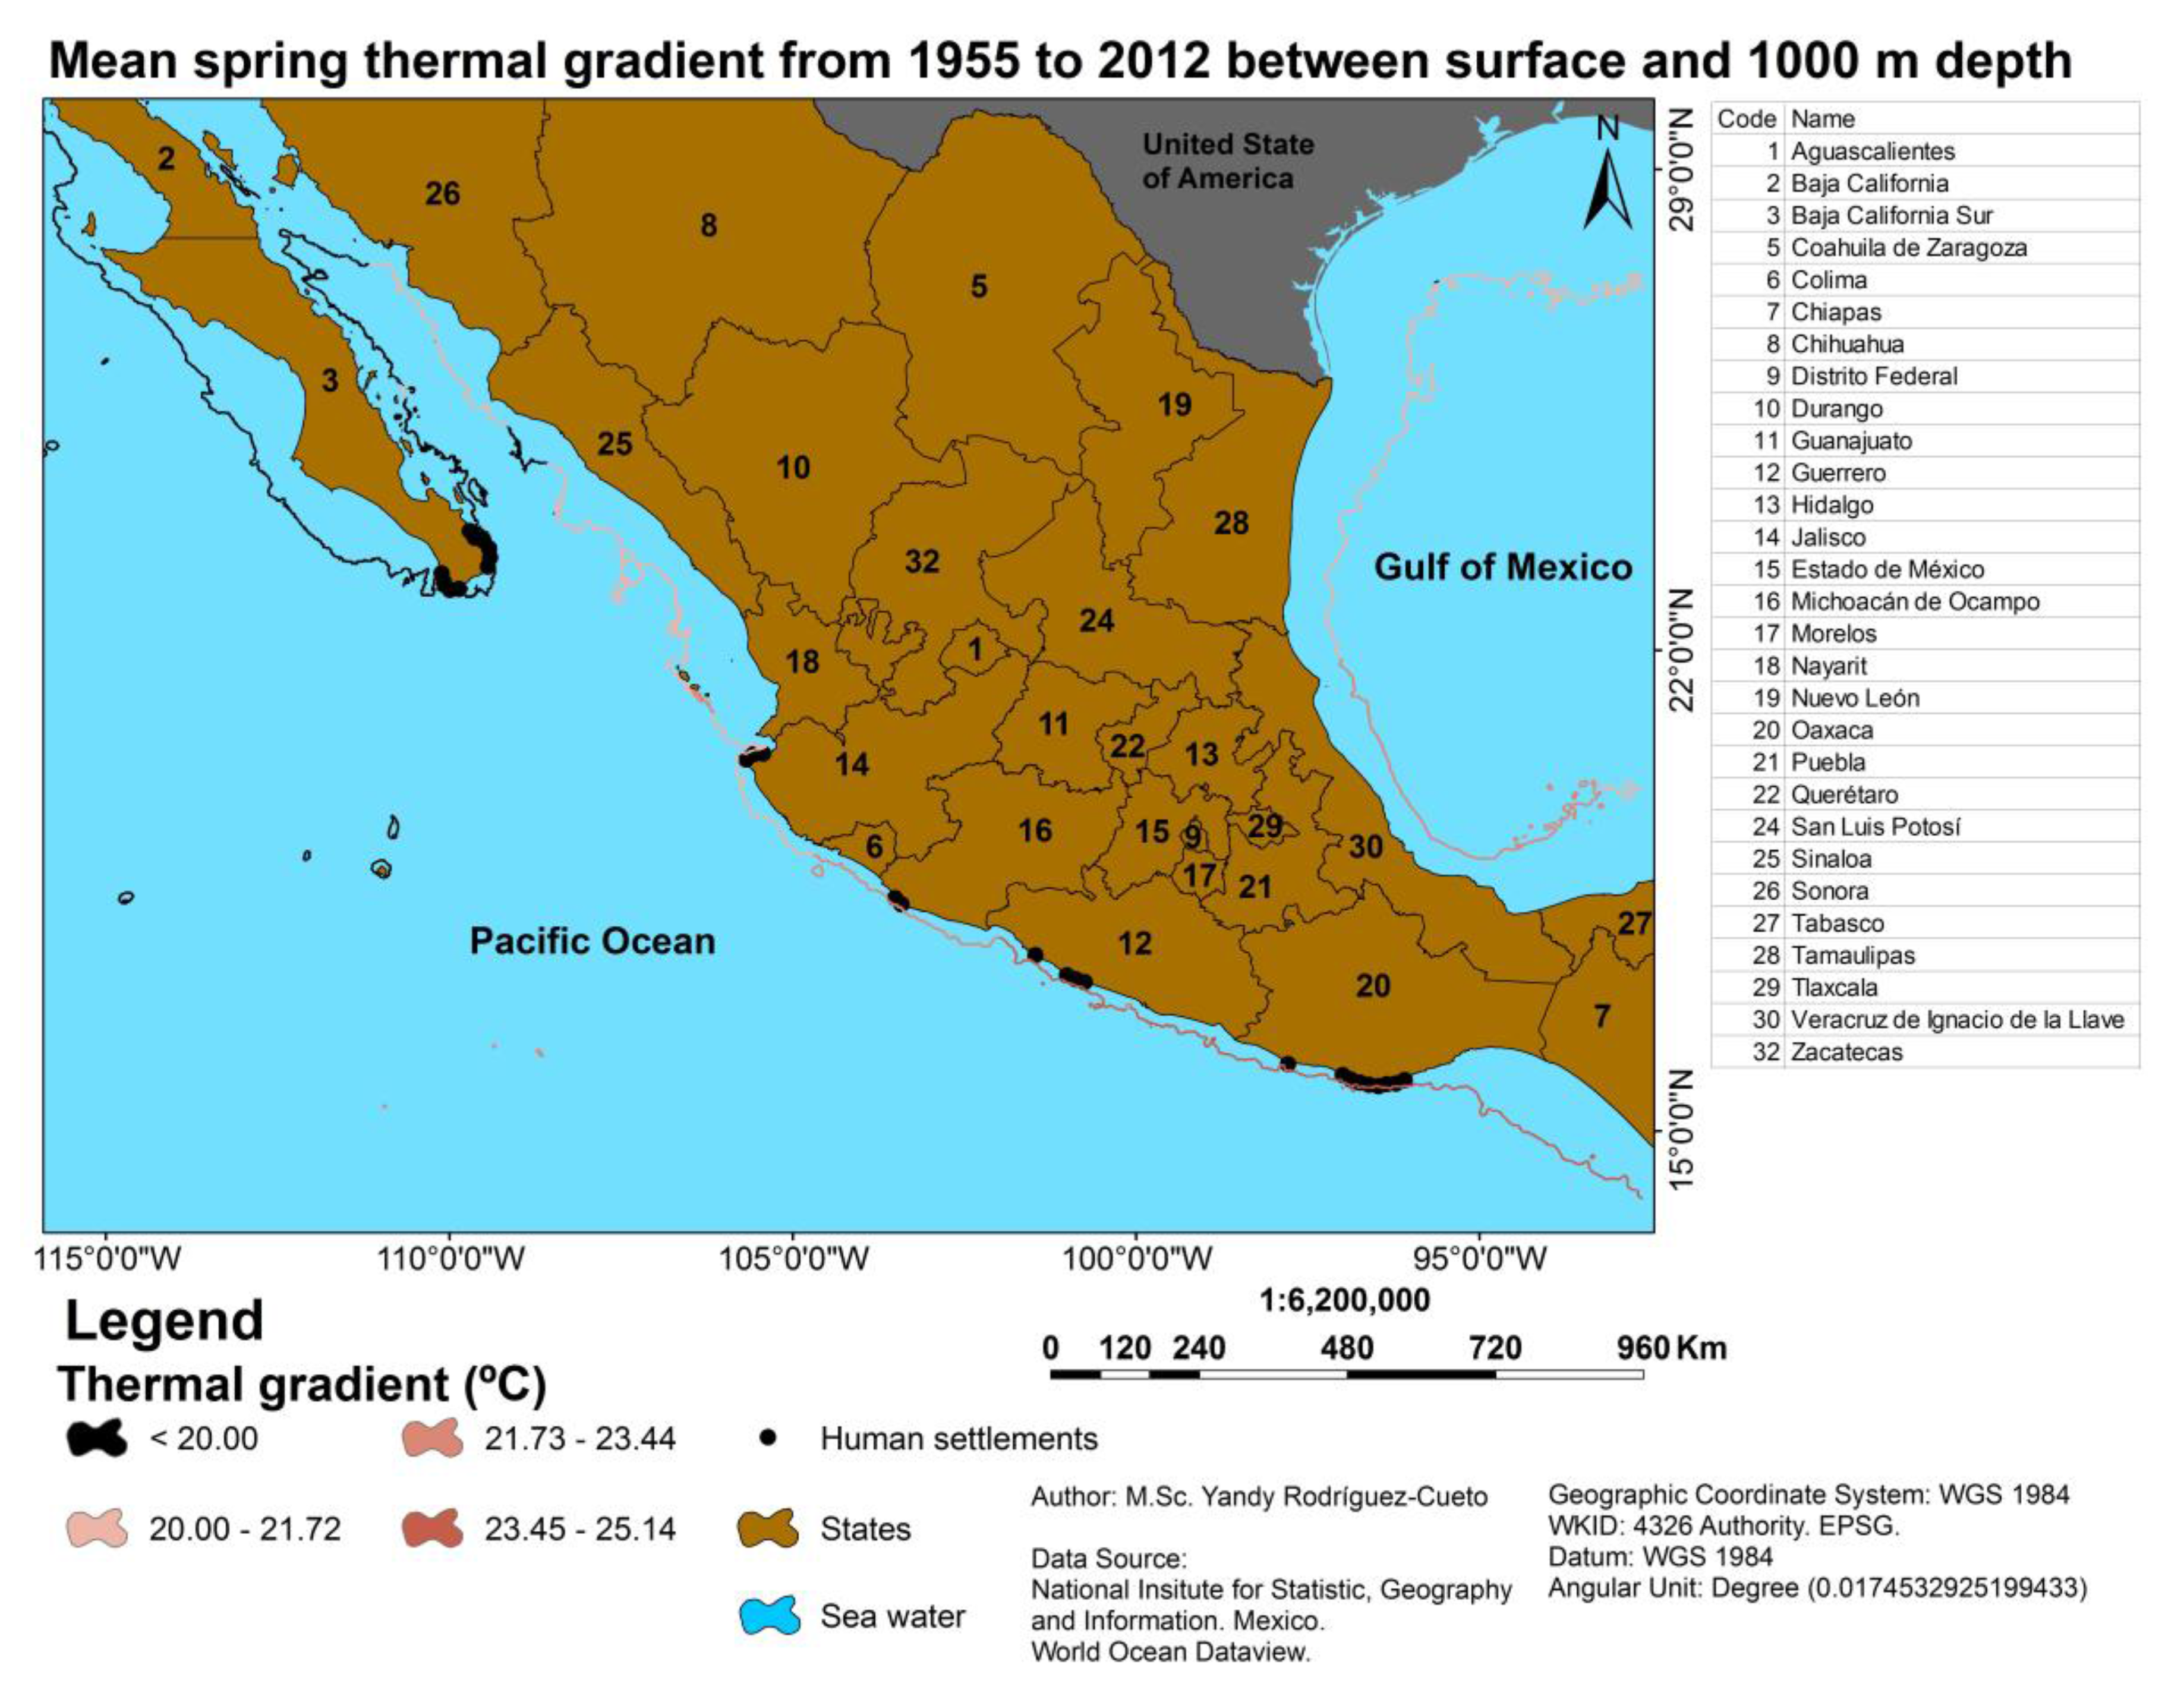
Figure 7.
Mean summer thermal difference between 0 and 1000 m depth.
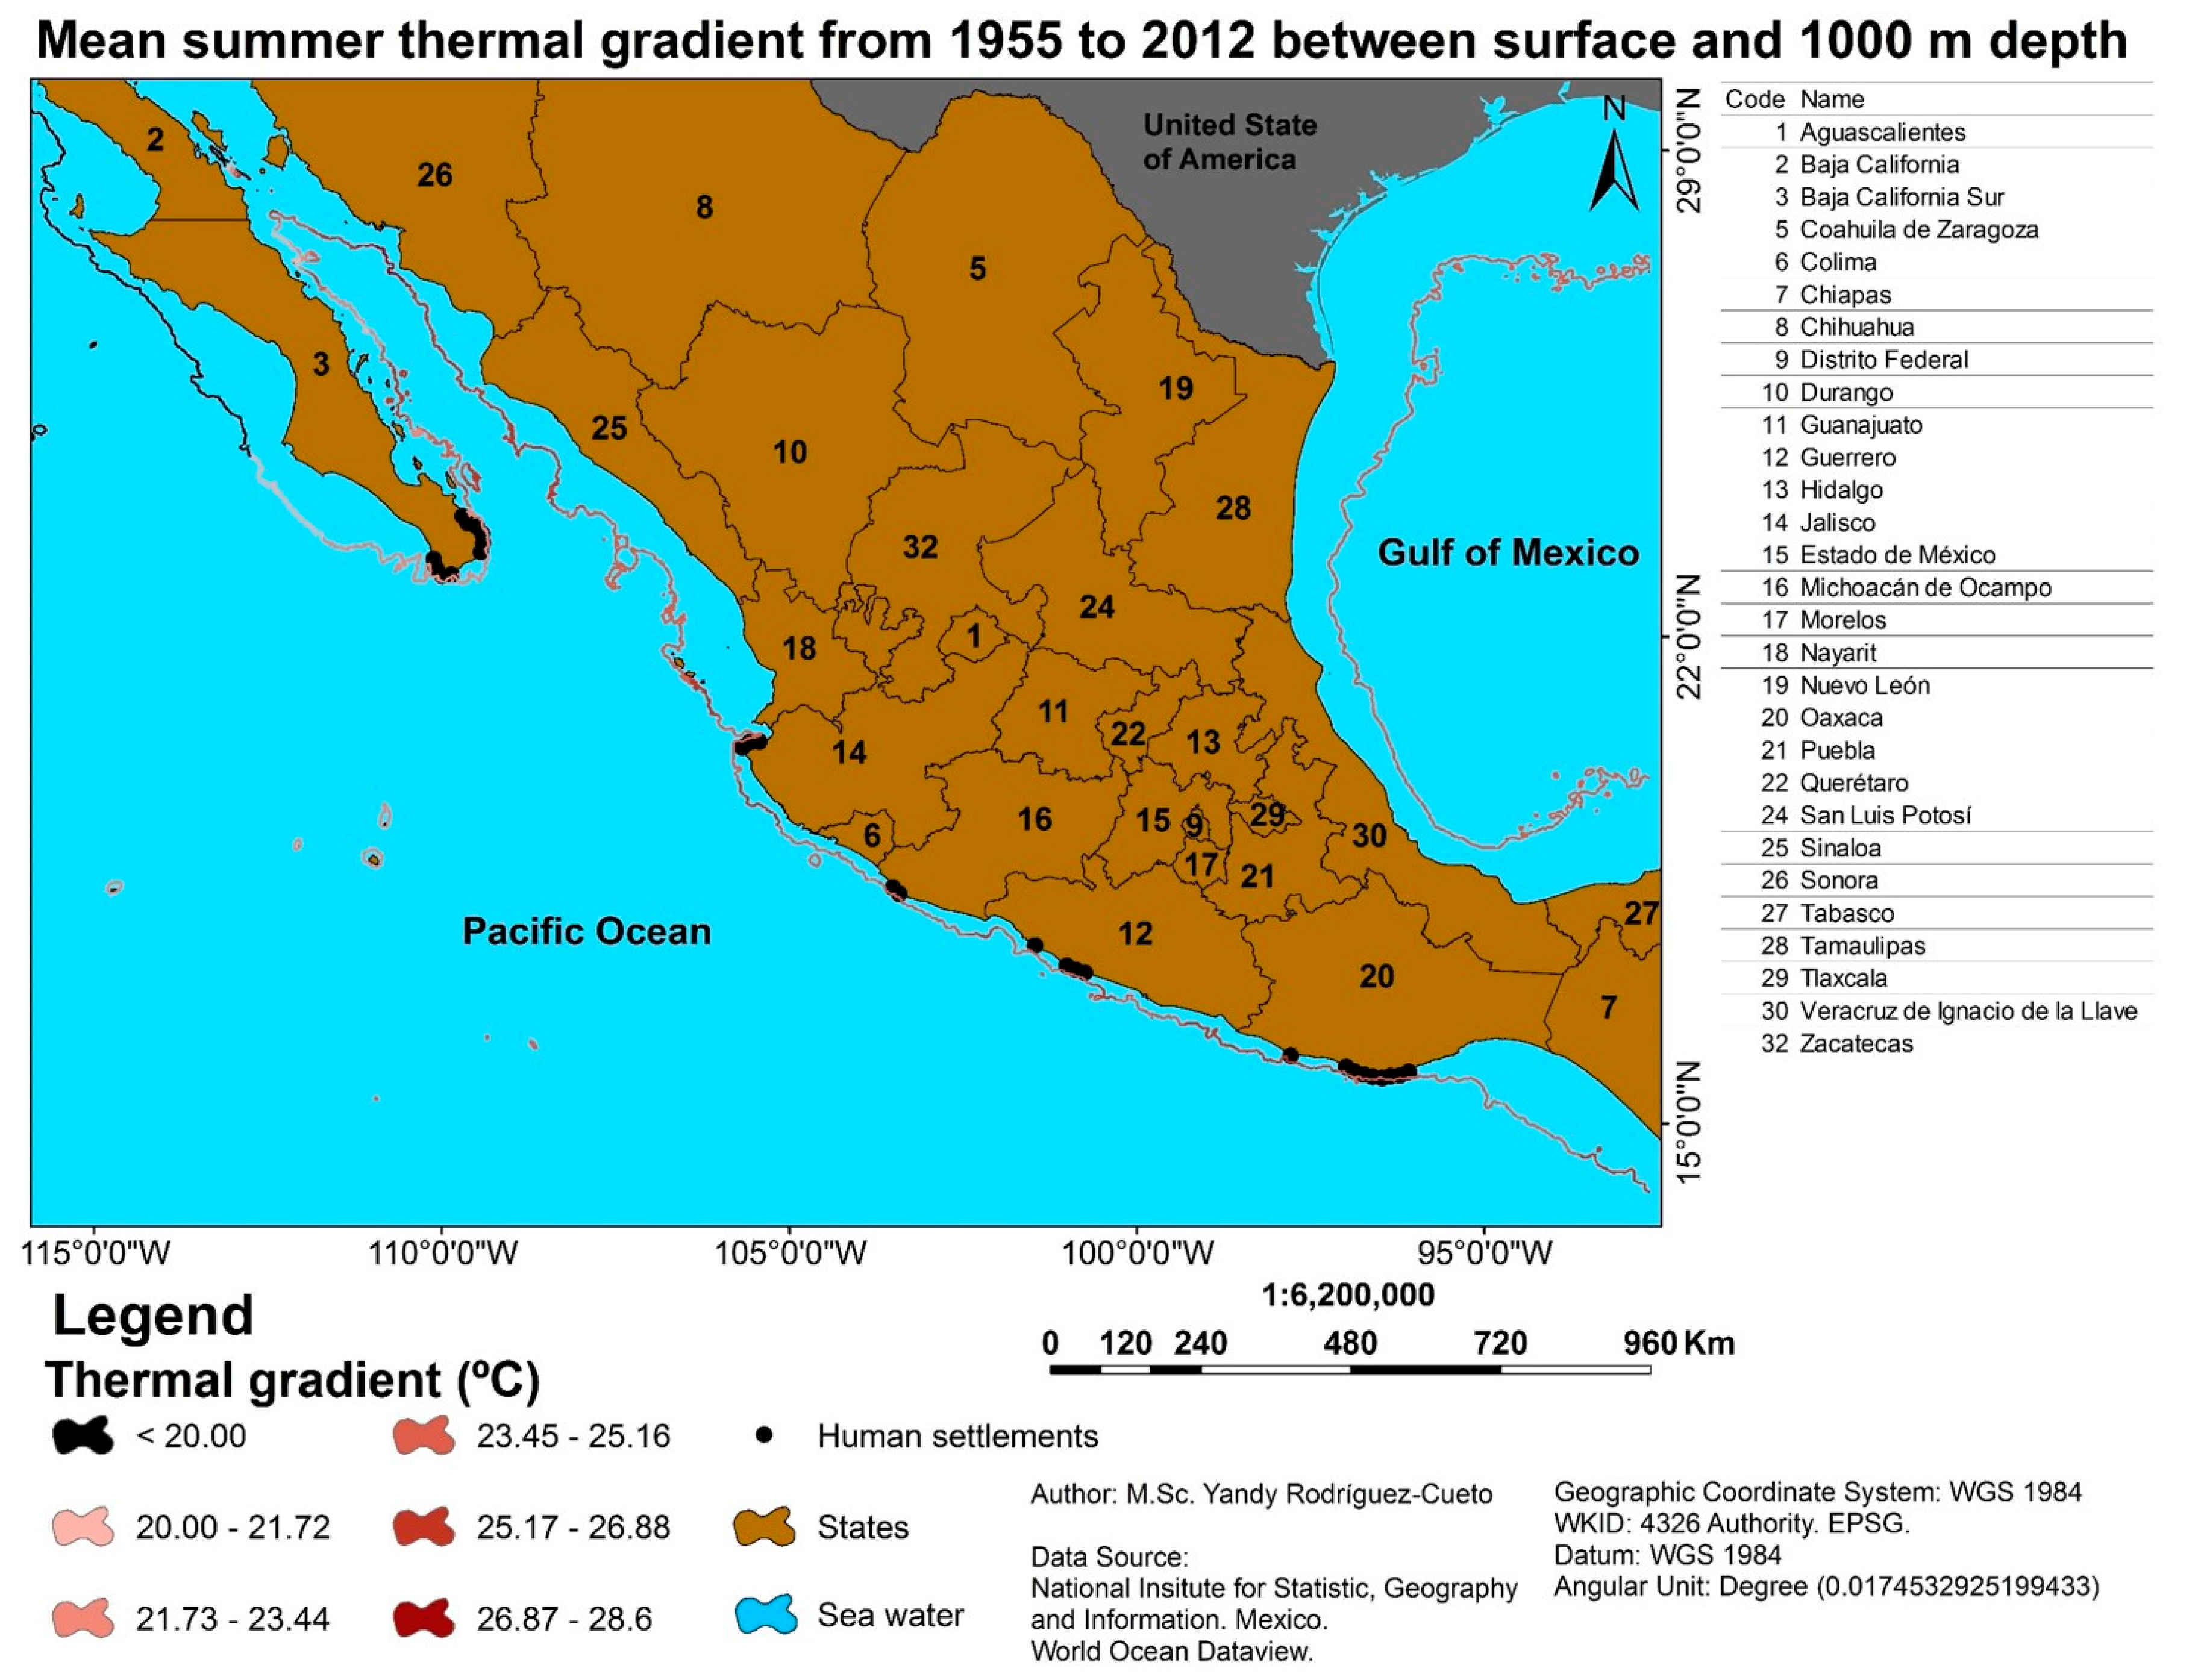
Figure 8.
Mean autumn thermal difference between 0 and 1000 m depth.

Figure 9.
Mean winter thermal difference between 0 and 1000 m depth.


Table 1.
Distances from the coastal settlements to a water depth of 1000 m on the Mexican Pacific Ocean.
Table 1.
Distances from the coastal settlements to a water depth of 1000 m on the Mexican Pacific Ocean.
| Settlement | Distance in km |
|---|---|
| Tangolunda, Oaxaca | 10.2 |
| San Agustín Huatulco, Oaxaca | 4.5 |
| Puerto Ángel, Oaxaca | 7.5 |
| El Coyote, Oaxaca | 6.3 |
| Agua Blanca, Oaxaca | 9.3 |
| Los Naranjos, Oaxaca | 8.7 |
| El Azufre, Oaxaca | 6.9 |
| Nuxco, Guerrero | 9.4 |
| San Luis de la Loma, Guerrero | 9.6 |
| El Cobano, Guerrero | 9.6 |
| Barra de Potosí, Guerrero | 10.9 |
| Colola, Michoacán | 5.5 |
| Ostula, Michoacán | 9.9 |
| Cabo Corrientes, Jalisco | 8.9 |
| Yelapa, Jalisco | 5.5 |
| Los Frailes, BCS | 2.3 |
| Cabo San Lucas, BCS | 6.1 |
| Cabo Pulmo, BCS | 6.9 |
© 2018 by the authors. Licensee MDPI, Basel, Switzerland. This article is an open access article distributed under the terms and conditions of the Creative Commons Attribution (CC BY) license (http://creativecommons.org/licenses/by/4.0/).
Share and Cite
MDPI and ACS Style
García Huante, A.; Rodríguez Cueto, Y.; Silva, R.; Mendoza, E.; Vega, L.A. Determination of the Potential Thermal Gradient for the Mexican Pacific Ocean. J. Mar. Sci. Eng. 2018, 6, 20. https://doi.org/10.3390/jmse6010020
AMA Style
García Huante A, Rodríguez Cueto Y, Silva R, Mendoza E, Vega LA. Determination of the Potential Thermal Gradient for the Mexican Pacific Ocean. Journal of Marine Science and Engineering. 2018; 6(1):20. https://doi.org/10.3390/jmse6010020
Chicago/Turabian StyleGarcía Huante, Alejandro, Yandy Rodríguez Cueto, Rodolfo Silva, Edgar Mendoza, and Luis A. Vega. 2018. "Determination of the Potential Thermal Gradient for the Mexican Pacific Ocean" Journal of Marine Science and Engineering 6, no. 1: 20. https://doi.org/10.3390/jmse6010020
Note that from the first issue of 2016, this journal uses article numbers instead of page numbers. See further details here.