Effect of Partial Use of Venice Flood Barriers


Department of Civil Engineering and Architecture, University of Catania, Via Santa Sofia, 64-95123 Catania, Italy
*
Author to whom correspondence should be addressed.
J. Mar. Sci. Eng. 2017, 5(4), 58; https://doi.org/10.3390/jmse5040058
Submission received: 9 November 2017
/
Revised: 1 December 2017
/
Accepted: 4 December 2017
/
Published: 11 December 2017
(This article belongs to the Section Ocean Engineering)
Abstract
:The Venice lagoon is one of the most important areas in Italy because of its history and its particular structure and form. In order to defend Venice and other towns within the lagoon from severe floods, the Italian Government promotes a project that includes, among other measures, the construction of the Experimental Electromechanical Module (MoSE). The MoSE is a system of mobile gates installed at the lagoon inlets that are able to temporarily isolate the Venetian lagoon from the Adriatic Sea during severe storm surge events, thus ensuring acceptable safeguarding water levels. To prevent interference between the barriers and the normal port activities, locks have been constructed at each lagoon inlet. However, the use of such locks causes a slowdown in maritime traffic. In order to evaluate a means of reducing such interference during the flooding events characterized by high but not extreme water levels, the present paper demonstrates, by means of a numerical approach, that one of the three inlets can be left open so as to ensure the transit of the vessels. The present paper also points out the meteorological conditions for which the safeguarding water levels of the lagoon are not exceeded when closing only two inlets.
1. Introduction
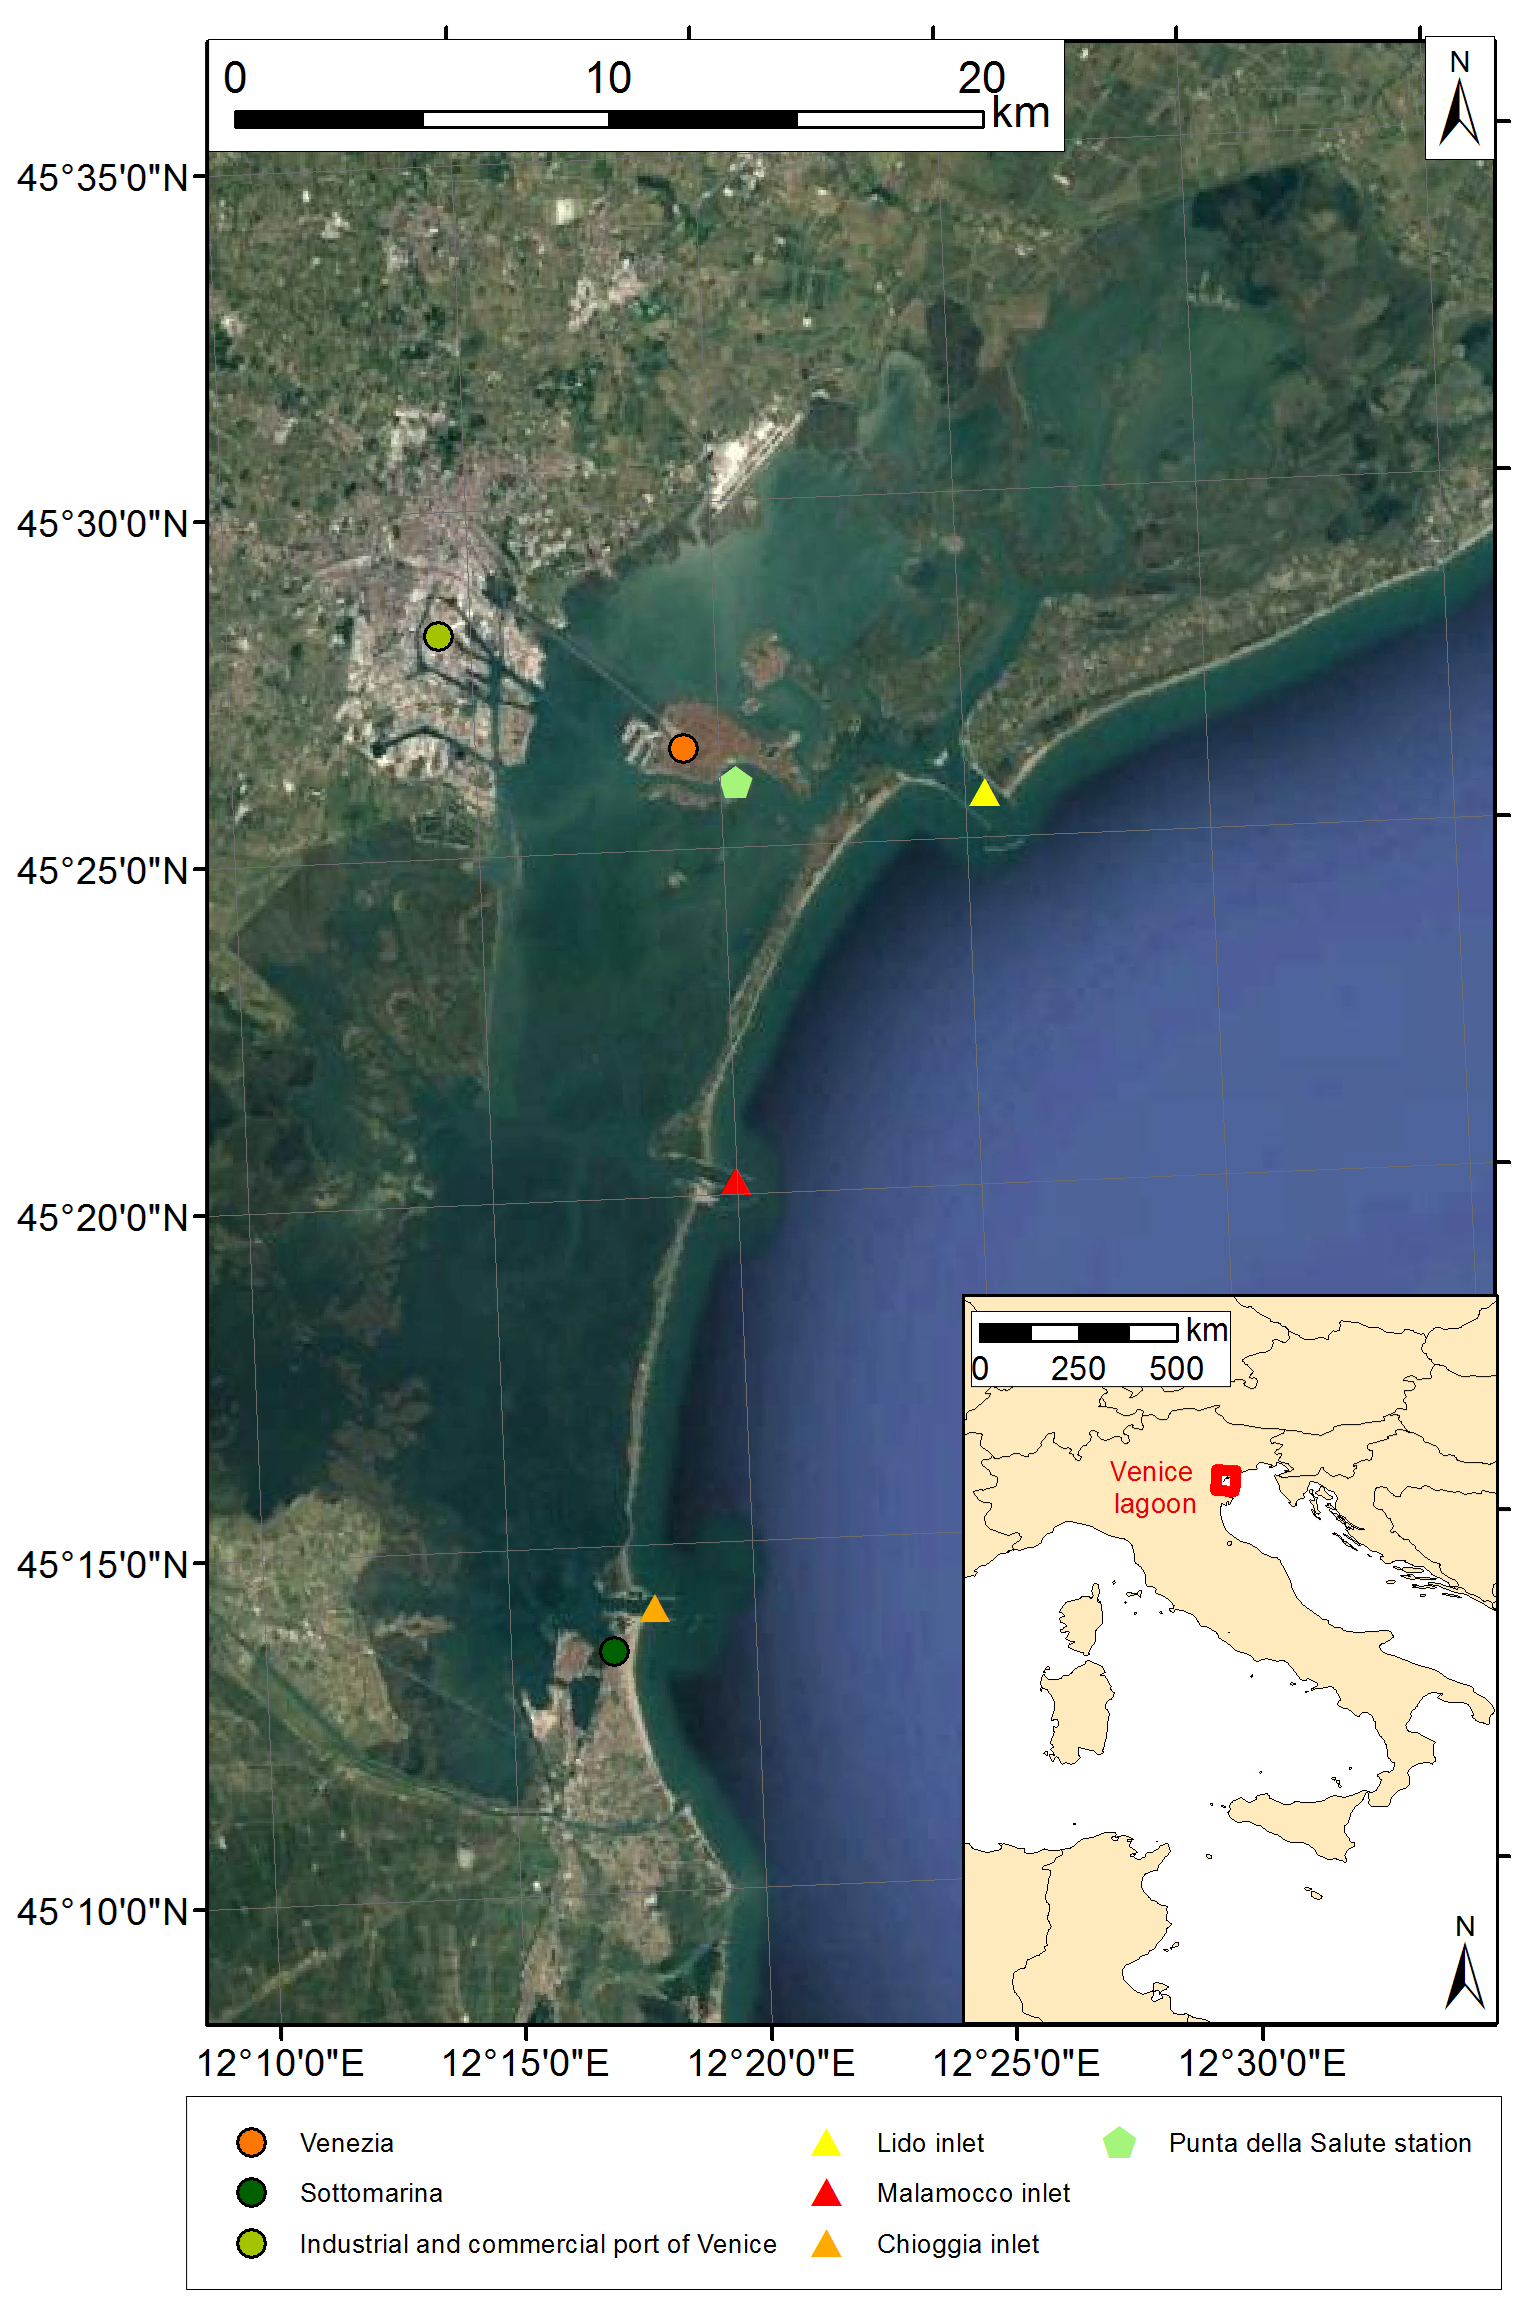
The Venice lagoon is located in the northern part of the Adriatic Sea, and it is one of the widest and most important lagoon ecosystems in both Europe and the entire Mediterranean basin [1]. It is characterized by a surface area of around 550 km, a length of about 52 km and a width ranging between 8 km and 14 km (see Figure 1).
The lagoon’s surface area is composed by 8% of land, including Venice itself and many smaller islands, and by 92% of dredged channels, mud flats and salt marshes.
The Venice lagoon is connected to the Adriatic Sea by three inlets, from north to south: Lido, Malamocco and Chioggia (see Figure 1). Such inlets are characterized by a width of between 500 m and 1000 m and by a depth in the range from 6 m to 20 m.
Situated at the end of a largely enclosed sea, the lagoon is characterized by high variations in water levels. Such variations may be the result of several concurring mechanisms: (i) the astronomical tide, (ii) the storm surge, (iii) the wave set-up, and (iv) the surge induced within the lagoon by wind directly blowing over it.
The astronomical tide ranges between +50 cm and −50 cm. The storm surge is higher than in other parts of the Mediterranean basin because of the shallow water of the northern part of the Adriatic Sea and also because of the effect of the Scirocco and Bora winds. Indeed, the Sirocco wind blows parallel to the main axis of the Adriatic Sea and the Bora wind is characterized by very high velocities. Several numerical models have been developed in the last decades in order to obtain reliable forecasts of storm surge in the Venice lagoon [2,3,4,5,6,7]. With regard to the effects of the local winds, these have been analyzed in several studies [8,9]. In particular, these studies indicate that there is a set-down area in the north of the lagoon and a set-up area in the south. In the center of the lagoon, the effect of the local wind is small. Ferla and Rusconi [8] analyzed the water level during a strong Bora event, assessing the lagoon storm surge level of +0.50 m in the south of the lagoon and of −0.30 m in the north, under a wind speed of 15 m/s. Similar values were observed in the study of Zecchetto et al. [9].
Further phenomena that contribute to the flooding of Venice are the land subsidence and the eustasy. These phenomena are primarily induced by the drawing of groundwater that has been intense in the past, particularly in the industrial area of Marghera.
During the last century, the relative lowering of Venice has totaled (23–26) cm [10,11]: (12–15) cm related to land subsidence (around (3–4) cm as the result of natural effects and around (9–11) cm as the result of anthropogenic effects) and 11 cm related to the sea-level rise [12].
Following the flood of 4 November, 1966 [13], in which the flood level reached 194 cm MZPS, the Italian Government promoted a series of activities to reduce the impact of flooding in the Venice lagoon. The acronym MZPS indicates that the water level is referred to the Mareographic Reference of Punta della Salute. This datum is generally used as a local reference, and it turns out to be 23.56 cm lower than the national vertical level datum, named IGM1942.
Among the various infrastructures, mobile barriers were planned for the three lagoon inlets. These mobile barriers are known as the Experimental Electromechanical Module (MoSE). Together with other measures, such as coastal reinforcement, the raising of quaysides, and the paving and improvement of the lagoon, the MoSE is designed to protect Venice and the lagoon from floods of up to 3.0 m MZPS. The mobile barriers in the lagoon inlets are being constructed by the Ministry of Infrastructure and Transport—Provveditorato Interregionale per le Opere Pubbliche del Triveneto. The construction of the barrier began in 2003. The total number of gates is 78:21 at the barrier of North Lido, 20 at the barrier of South Lido, 19 at the barrier of Malamocco inlet, and 18 at the barrier of Chioggia inlet.
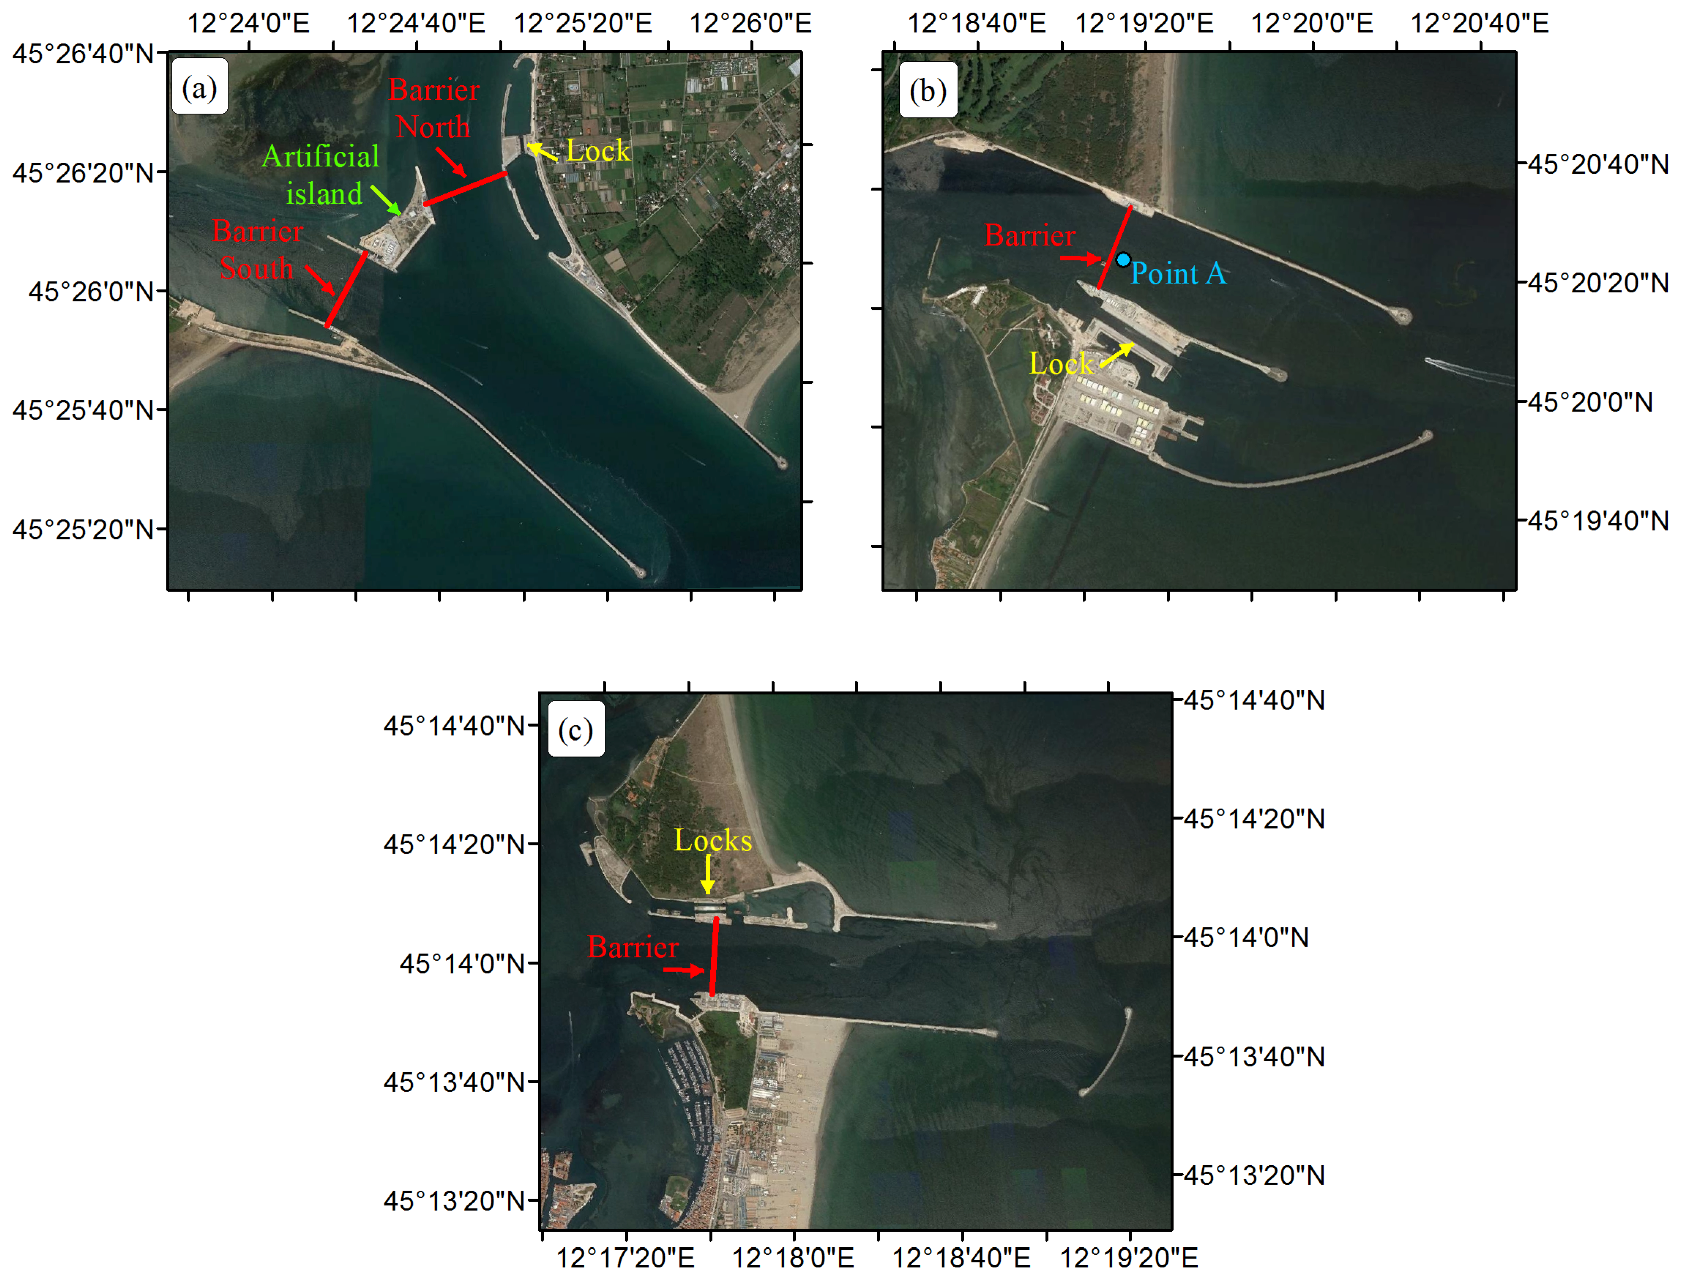
To prevent interference with normal port activities while the MoSE is in operation, locks have been constructed at each of the lagoon inlets [14] (see Figure 2). The lock at the Malamocco inlet is the most important because it allows for the transit of large vessels directed towards the commercial and industrial port of Venice (the port location is shown in Figure 1). At the Lido and Chioggia inlets, the locks are designed to allow emergency vessels, fishing boats and leisure craft to transit.
It is worth noting that the passage through the locks leads to a slowdown in maritime traffic, which may have economic repercussions. In order to reduce the interference between the water-level control system and the maritime traffic during non-extreme events, the Malamocco inlet could remain open while the barriers in other inlets could be raised up. The application of this solution results in a slowing down of the tidal flow between the Adriatic Sea and the lagoon. However, the meteorological events for which such a solution can be applied without overcoming the established safeguarding levels should be identified. In this regard, this paper presents the results of a numerical investigation that has identified the water level as well as other meteorological conditions for which partial use of the MoSE may be adopted.
This paper is organized as follows. Section 2 provides information on the barrier closure criteria. In Section 3, the analysis of water levels in Venice town are shown. Section 4 describes the numerical model used in the study. In particular, this section describes the numerical model, the computational domain, the input data, and the calibration process. In Section 5, the results of the simulation with a partial use of the MoSE are shown. In Section 6, some concluding remarks are drawn.
2. Current Barrier-Closure Criteria
The decision to raise the barriers is based on the results of several prediction numerical models, which predict various meteorological quantities such as the water level, wind velocity, wind direction, rainfall, and so forth. On the basis of the magnitude of such parameters, an event can be classified and the closure water level can be defined.
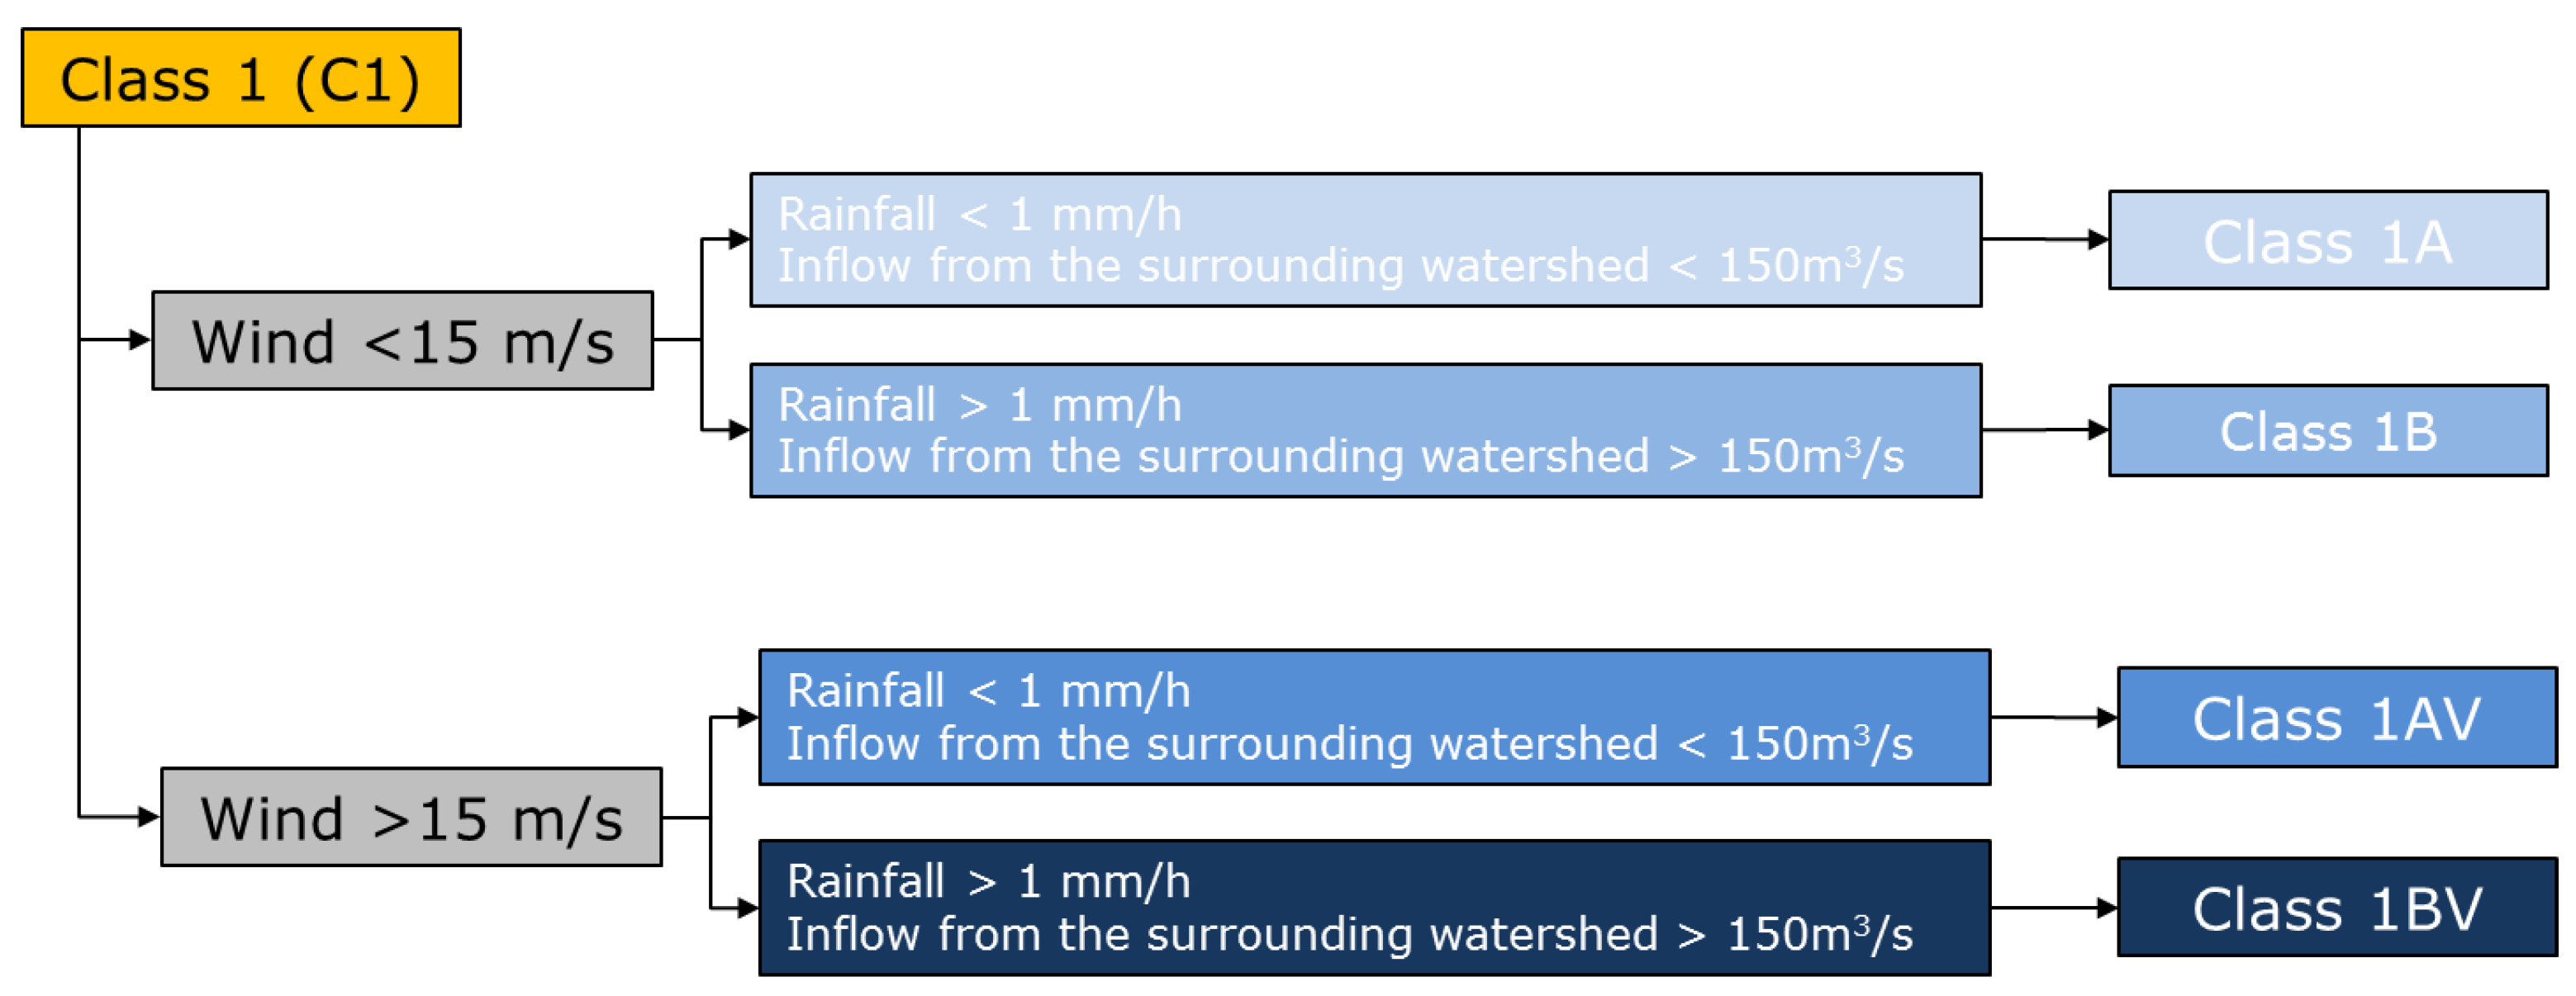
The main classification of events is based on both the maximum water level and the duration over the safeguarding level [15]. The 10 year return period event duration has been selected to define the criteria separating the two main closure classes: the first class, indicated as C1, groups all the events with a return period of less than 10 years (frequent events); the second class, indicated as C2, groups all the events with a return period greater than 10 years (extreme events). The thresholds between these two main classes are 150 cm MZPS and 11 h for the maximum water level and storm duration, respectively.
When the mobile barriers are in operation, the lagoon behaves as a closed basin and the water level may increase as a result of the following factors: (a) direct rainfall on the lagoon, (b) inflow from the surrounding watershed, (c) wind set-up in the lagoon, (d) flow through the three lagoon inlets during the closure operation, and (e) flow through the gaps between the gates that compose each barrier. To take into account the contribution to the rise in the lagoon water level caused by such factors, Class 1 (C1) is divided into four subclasses (1A, 1B, 1AV, and 1BV). These subclasses are shown in Figure 3.
The closing water levels for each class are the following:
- 1.00 m MZPS (Mareographic Reference of Punta della Salute) for the C1-1A class;
- 0.90 m MZPS for the C1-1B class;
- 0.80 m MZPS for the C1-1AV class;
- 0.75 m MZPS for the C1-1B class;
- 0.65 m MZPS for the C2 class.
3. Analysis of the Water Level in Venice
In order to provide information on the water levels observed in the lagoon, Figure 4 shows water levels as measured at Punta della Salute station during the period 1924–2015 (about 92 years). The station is localized in the southeastern part of Venice (coordinates in UTM-WGS84: 12.3367 E–45.4307 N; see Figure 1).
In order to carry out an analysis that was extended throughout the whole measurement period, the mean water level was detrended because of the variations of the zero mareographic of Punta della Salute caused by the aforementioned phenomena of subsidence and eustasy. The events characterized by a peak water level greater than 110 cm MZPS are also indicated in Figure 4. The level of 110 cm MZPS is the safeguarding level of Venice town.
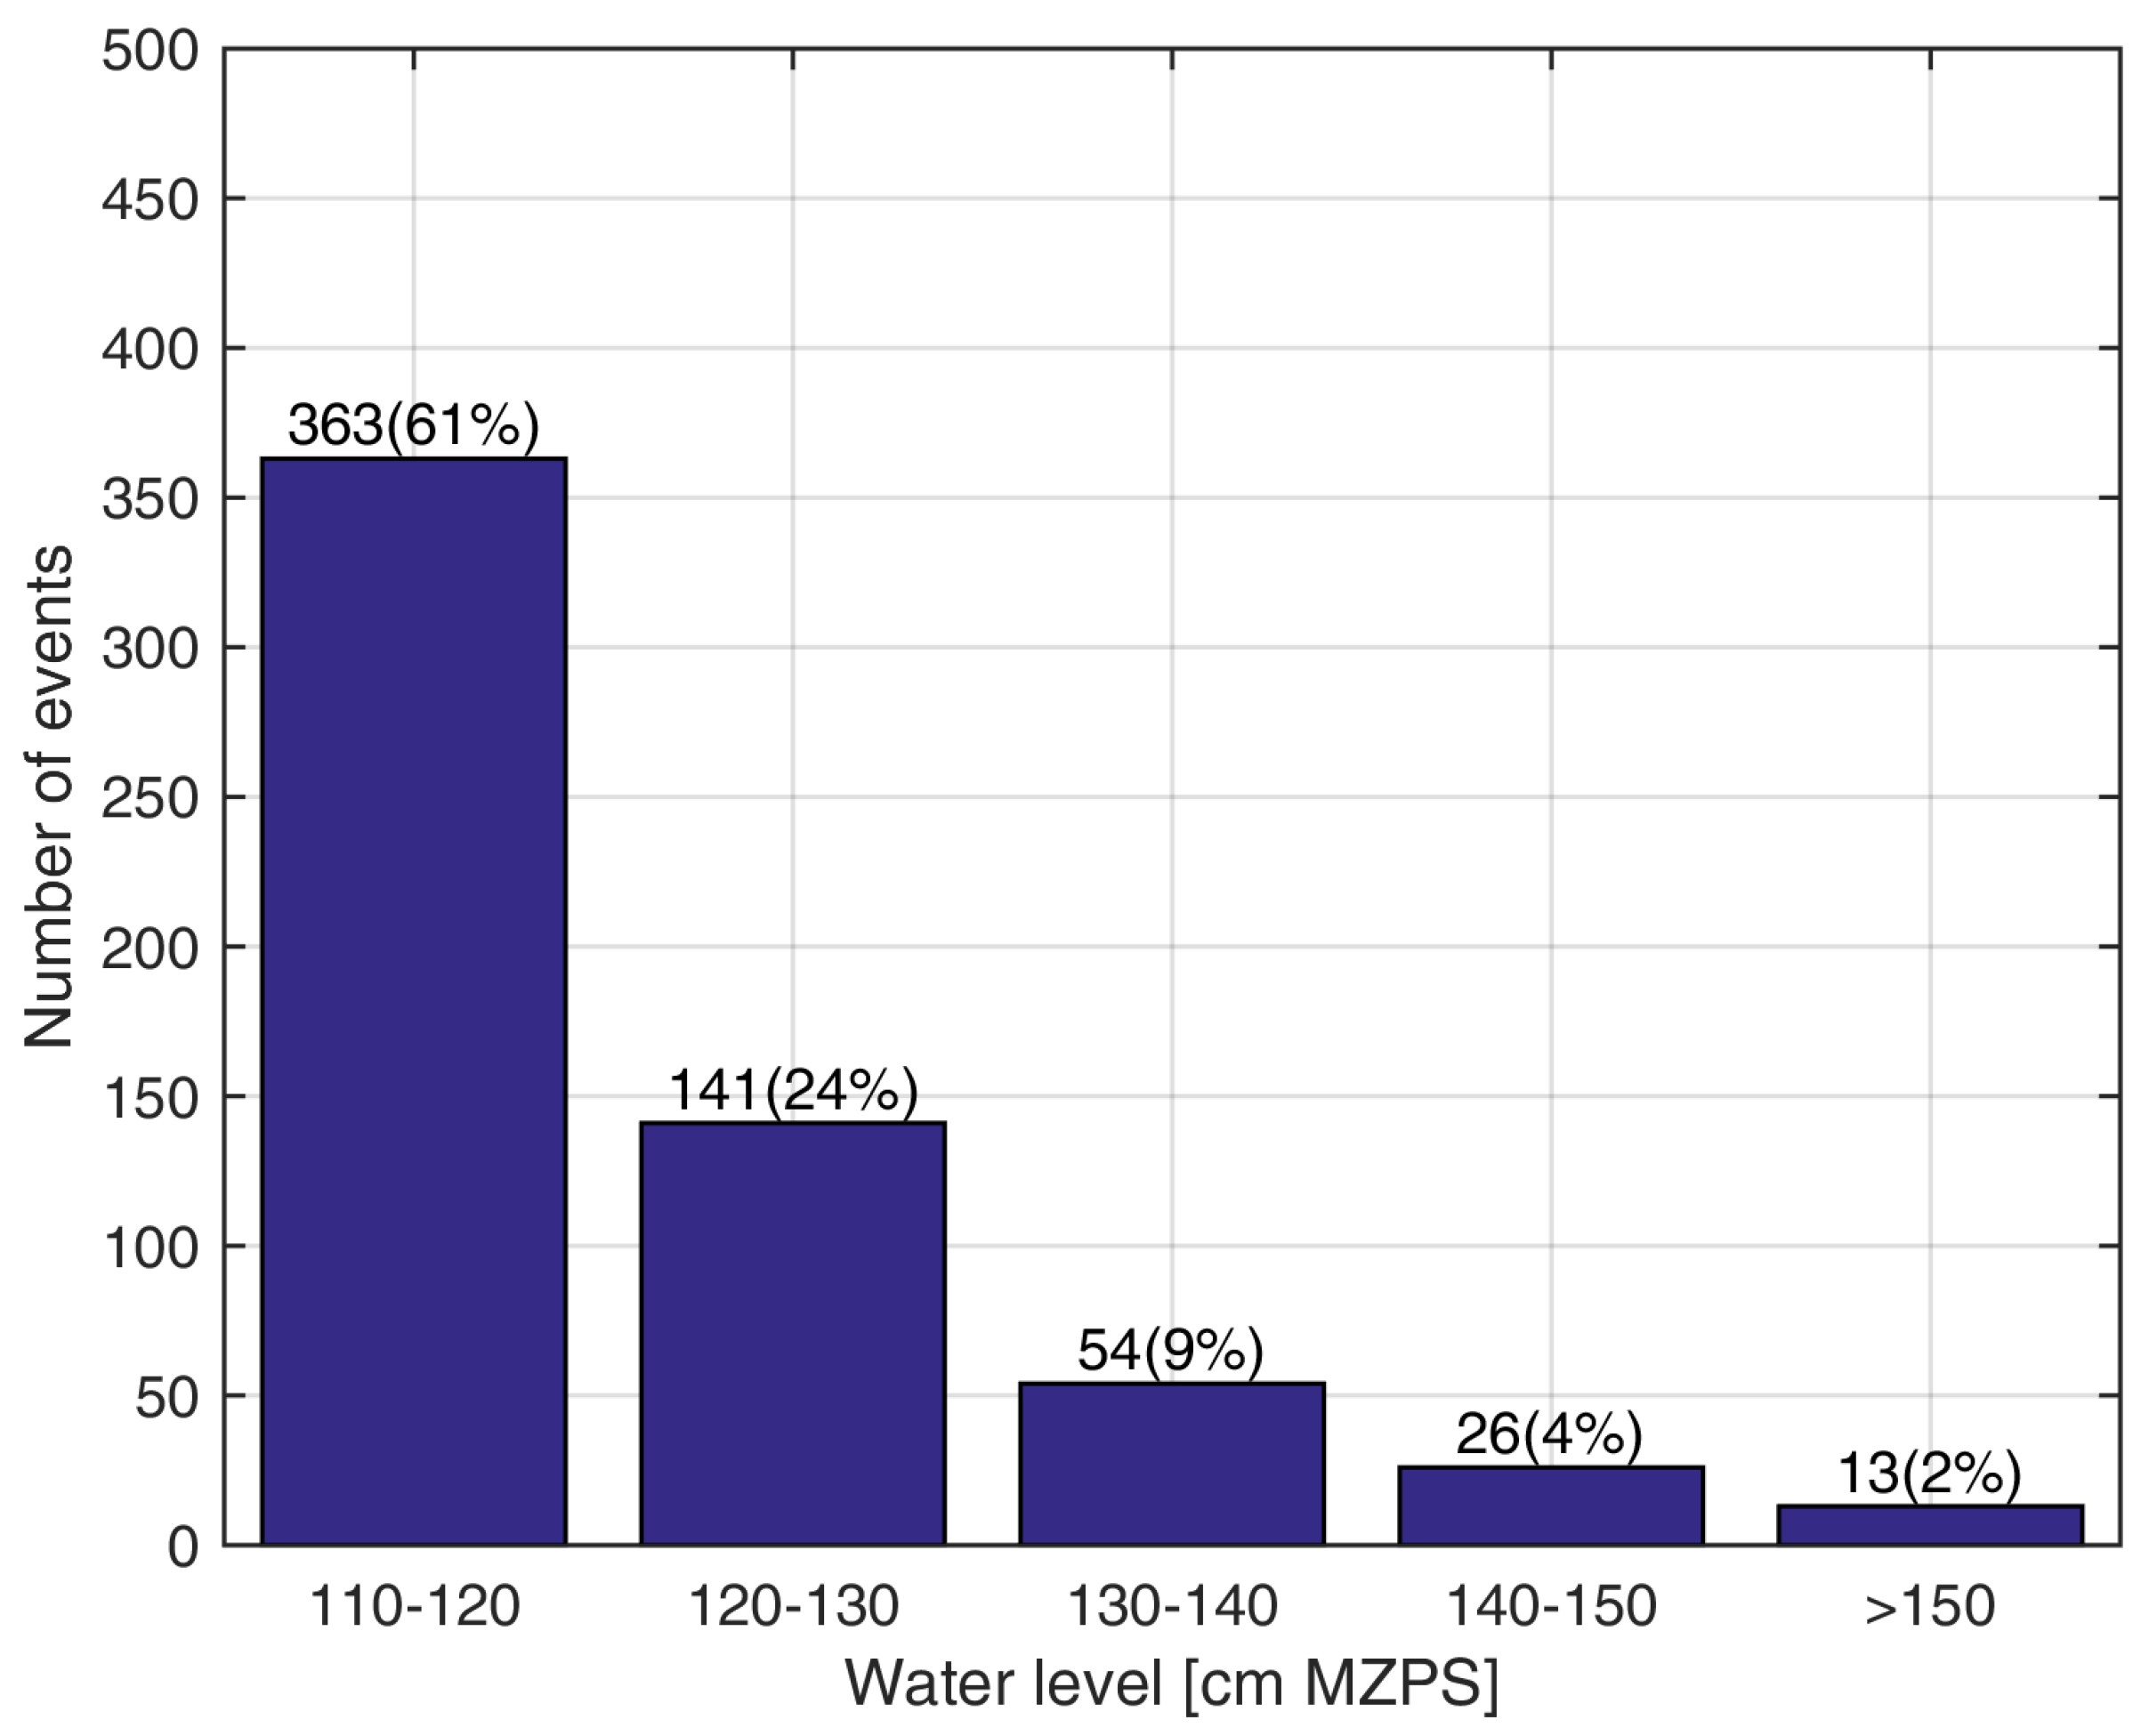
The analysis of the sea-water-level data shows that about 600 events were characterized by a water level greater than the safeguarding level of 110 cm MZPS and about 10 events were characterized by a water level greater than 150 cm MZPS. The average number of events characterized by a water level greater than 100 cm MZPS is approximately seven per year.
Among the events with a maximum water level that exceed the safeguarding level of 110 cm MZPS, the events with water levels between 110 cm and 120 cm MZPS make up approximately 62%, while the events characterized by water levels greater than 150 cm MZPS make up approximately 2% (see Figure 5).
4. Hydrodynamic Model
4.1. Numerical Model
The simulation of Venice lagoon circulation was carried out using the model advanced circulation (ADCIRC), which is a numerical model for solving time-dependent, free-surface circulation and transport problems in two and three dimensions. The development of ADCIRC was a joint effort between US Army Corps of Engineers, University of North Carolina and the University of Notre Dame [16,17,18].
ADCIRC can be run either as a two-dimensional depth-integrated (2DDI) model or as a three-eimensional (3D) model. Bajo et al. [6] and Roland et al. [7] have shown that 2DDI modelling is a suitable approach for evaluating the hydraulic variables in Venice. Therefore, for the cases analyzed here, the 2DDI version of ADCIRC was adopted. In this model, the elevation is obtained from the solution of the depth-integrated continuity equation in the generalized wave-continuity equation form. The velocity is obtained from the solution of the 2DDI momentum equations [19,20]. For additional details of the ADCIRC formulation, interested readers are referred to [17].
The simulations were carried out using finite-amplitude terms, advective terms and time-derivative terms. To take into account the effect of the bottom stress, the constant quadratic formulation was used.
4.2. Input Data and Model Set-Up
The morphology of the seabed was obtained from the charts of the Italian Navy Hydrographic Institute (NHI) and from the database of Provveditorato Interregionale per le Opere Pubbliche del Triveneto. The NHI charts were used to reconstruct the morphology outside of the lagoon (acquisition date: 1953), while the data provided by Provveditorato Interregionale per le Opere Pubbliche del Triveneto were used to reconstruct the morphology inside the lagoon and in the lagoon inlet (acquisition date: 2010–2015).
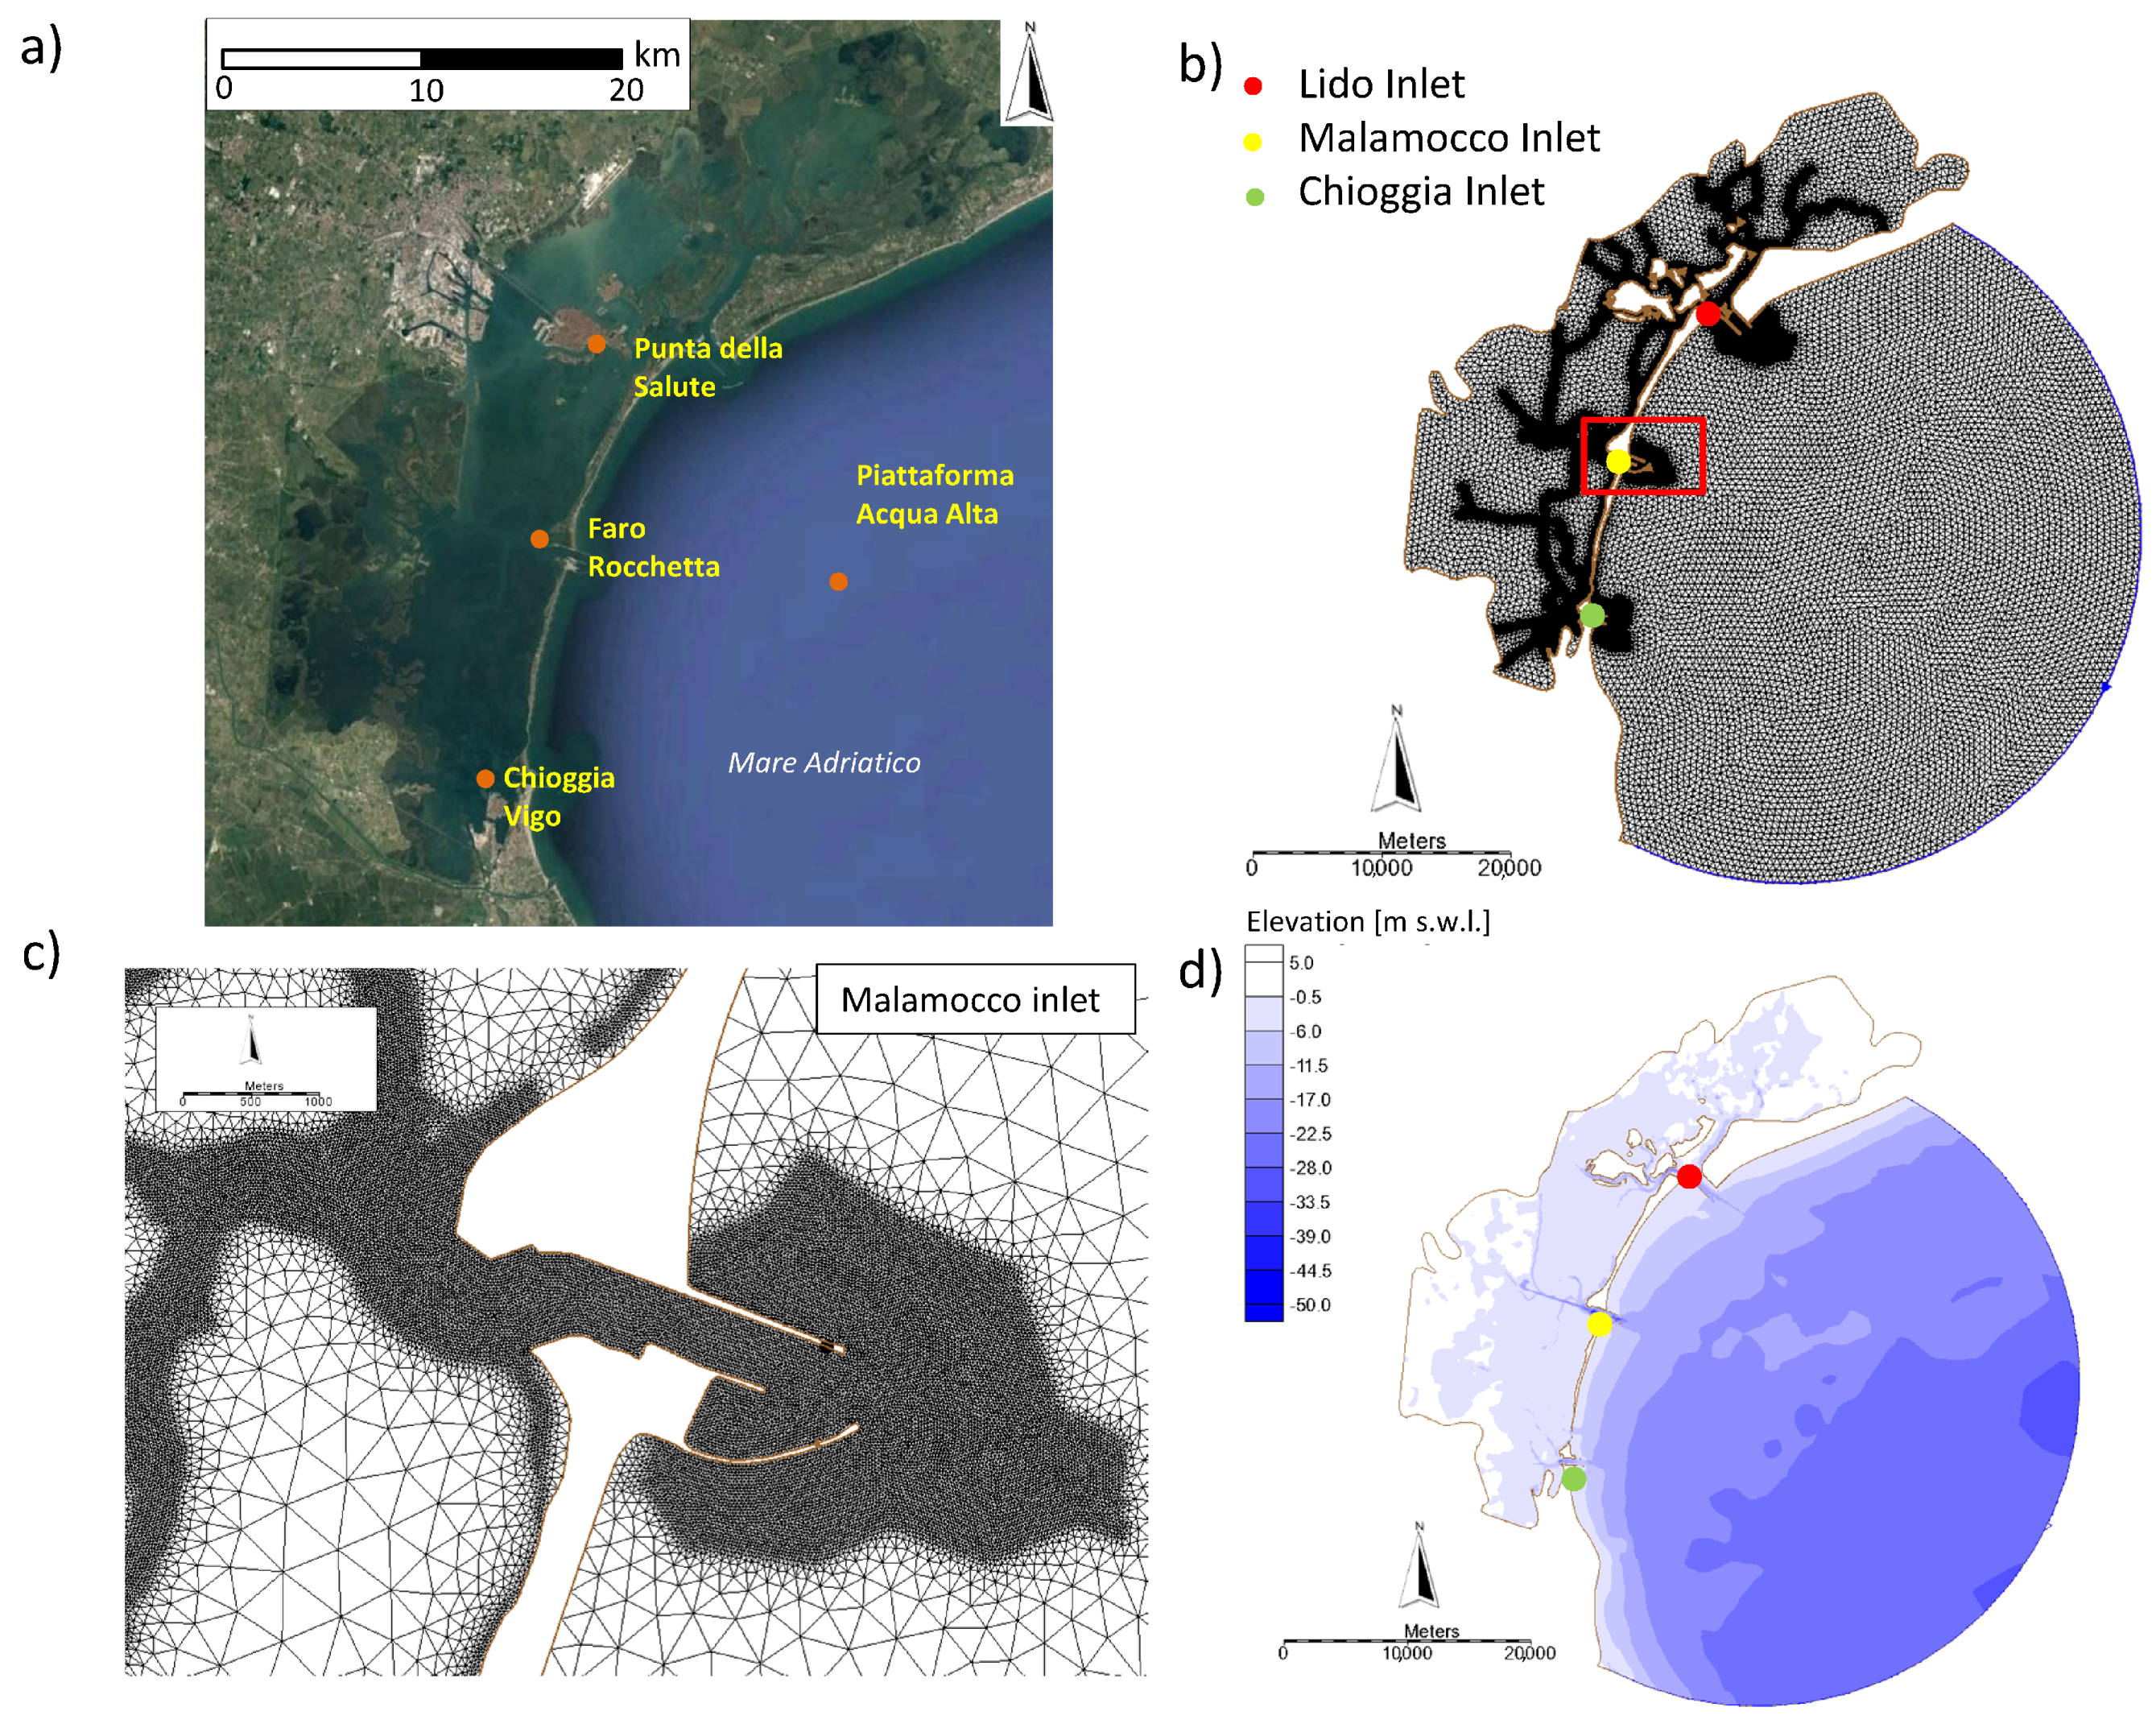
The water-level, wind and pressure data were obtained from the Institute for Environmental Protection and Research [21]. In particular, the data of the Aqua Alta oceanographic tower were adopted to define the boundary condition. The location of the station is shown in Figure 6a.
The computational domain was discretized using an unstructured grid. For the present case, the computational domain of the Venice lagoon was discretized with 141,476 nodes and 278,802 triangular elements. A grid resolution of 25 m was adopted for the lagoon inlet and the lagoon channel, while a grid resolution of 500 m was adopted for other areas (see Figure 6b,c). Figure 6d shows the bottom depth inside the numerical domain.
4.3. Boundary Conditions
The simulations were carried out by adopting the following boundary conditions. On the offshore boundary arcs, the water levels observed at Acqua Alta oceanographic tower were imposed, while along the internal coastline, the zero normal boundary fluxes were imposed. At each node of the domain, wind characteristics and atmospheric pressure observed at the Acqua Alta oceanographic tower were imposed. Such data, provided with a time interval of 10 min, was interpolated by the model for each time step.
4.4. Calibration of the Numerical Model
The numerical model was calibrated adopting the sea levels observed during two events:
- (i)
- 23 November 2007: characterized by a maximum value of the water level of 105 cm MZPS;
- (ii)
- 1 December 2008: characterized by a maximum value of the water level of 155 cm MZPS.
The water level, the wind and the pressure measured at the Aqua Alta oceanographic tower were used to define the boundary conditions of the simulations. Table 1 shows the main parameters of the two selected events.
The calibration was carried out by changing the friction coefficient (), which is used by the model to estimate the bottom stress. Three values of the bottom friction coefficient were considered: 0.005, 0.01 and 0.015.
The water levels as estimated by the model were compared with the data observed at three stations [21]: Punta della Salute, Faro Rocchetta and Chioggia Vigo (the locations of the three stations are shown in Figure 6a).
The numerical model performance was estimated adopting the following parameters:
- Bias ():
- Root-mean-square error ():
- Scatter index ():
- Coefficient of determination ():
Here, indicates the values estimated by the model, indicates the observed value, N indicates the number of values, and indicates the average values of the observed values.
The comparison between the observed values and the water level estimated by ADCIRC adopting three values of is shown in Figure 7 and Figure 8 for the event of 23 November 2007 and the event of 1 December 2008, respectively.
Table 2 shows the values of the parameters , , and for the two selected events.
The numerical model better reproduced the event of 23 November 2007, which was characterized by fairly frequent weather conditions. For this event, the was less than 1 cm, the was at most equal to 10% of the mean value of estimated data, and the coefficient of determination was close to 1.
The synthetic performance parameters suffered a slight worsening for the extreme event of 1 December 2008 (return period greater than 10 years). Such behavior could be determined by the fact that the simulation of lagoon circulation is more complicated in the case of extreme events. However, no significant changes of synthetic performance parameters were observed with respect to the previous event.
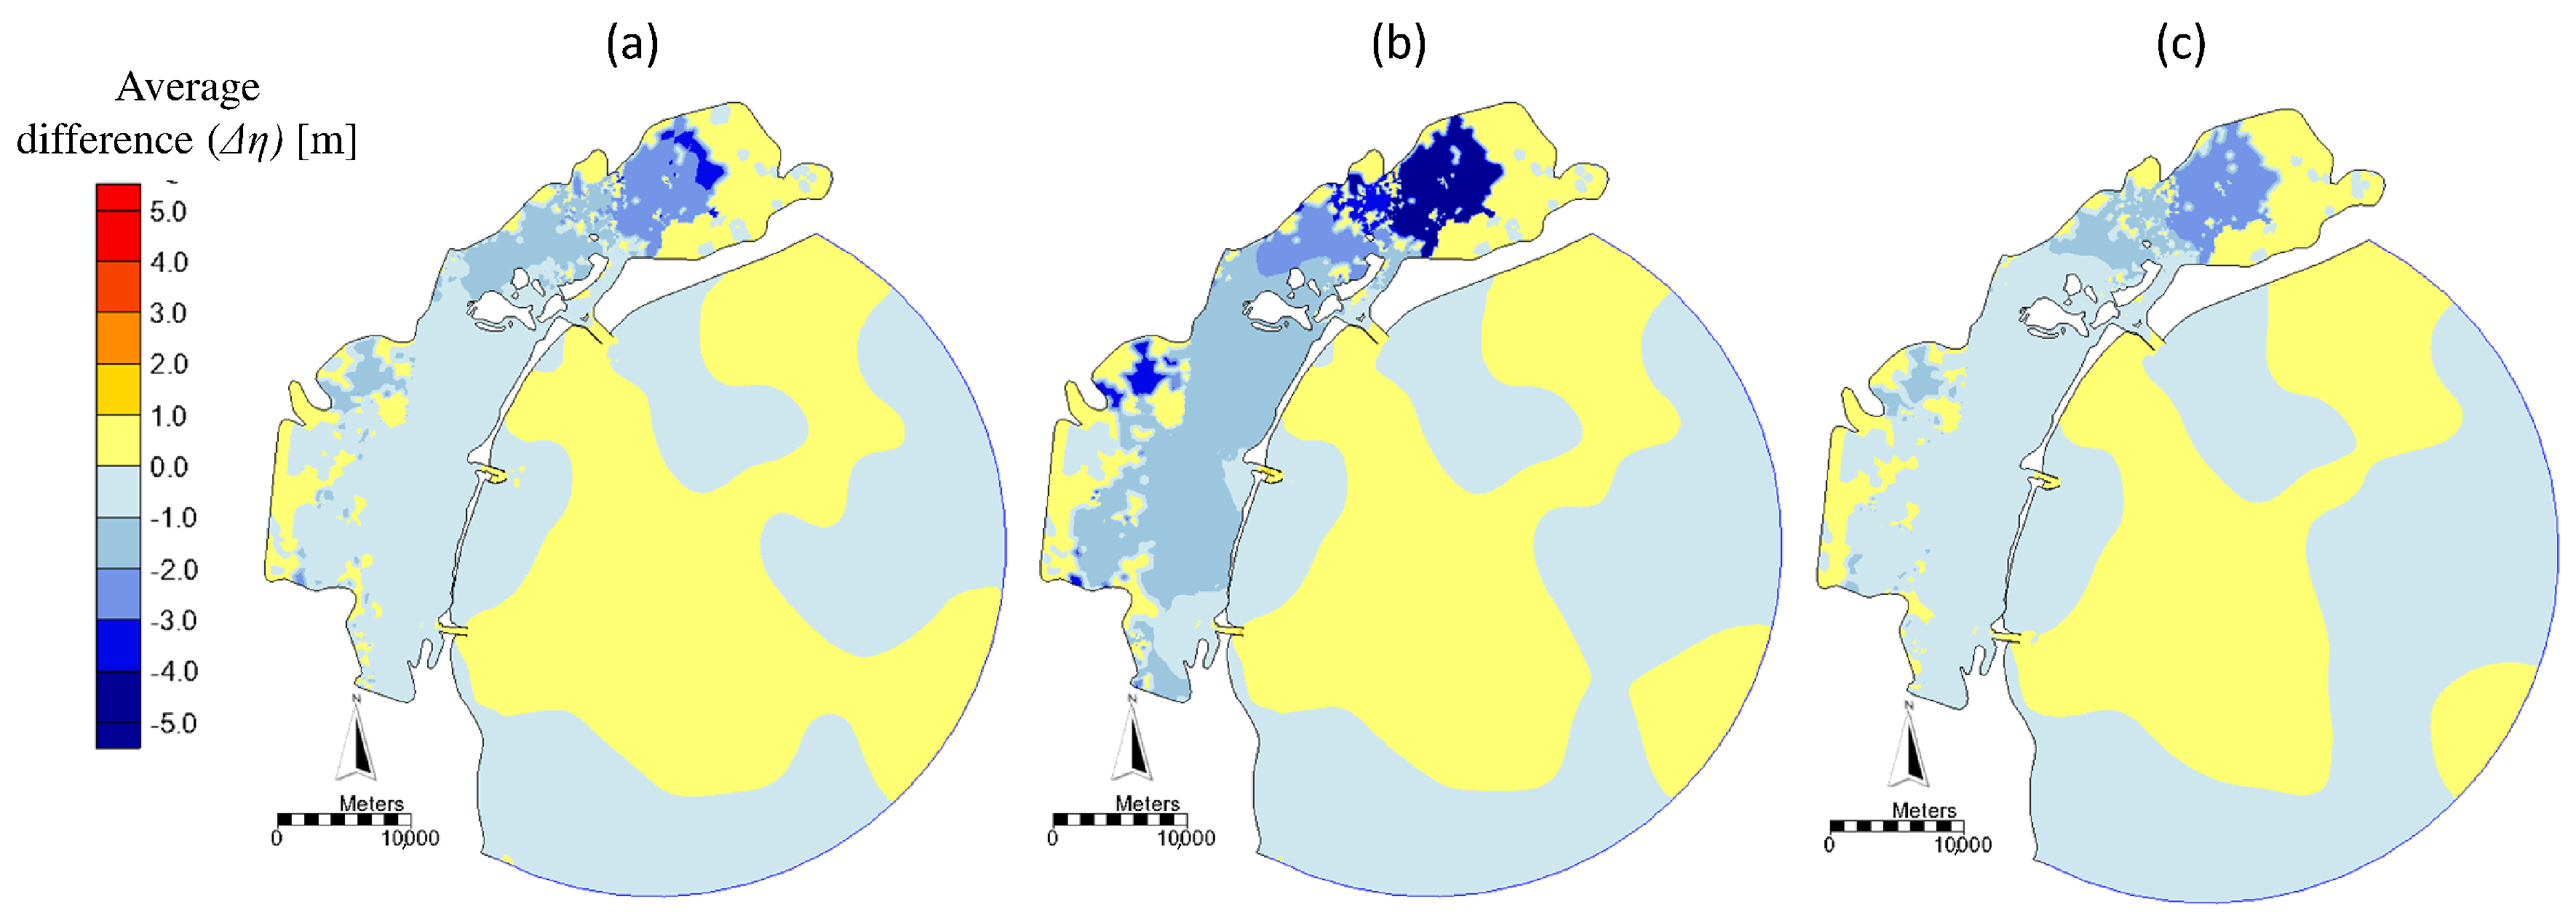
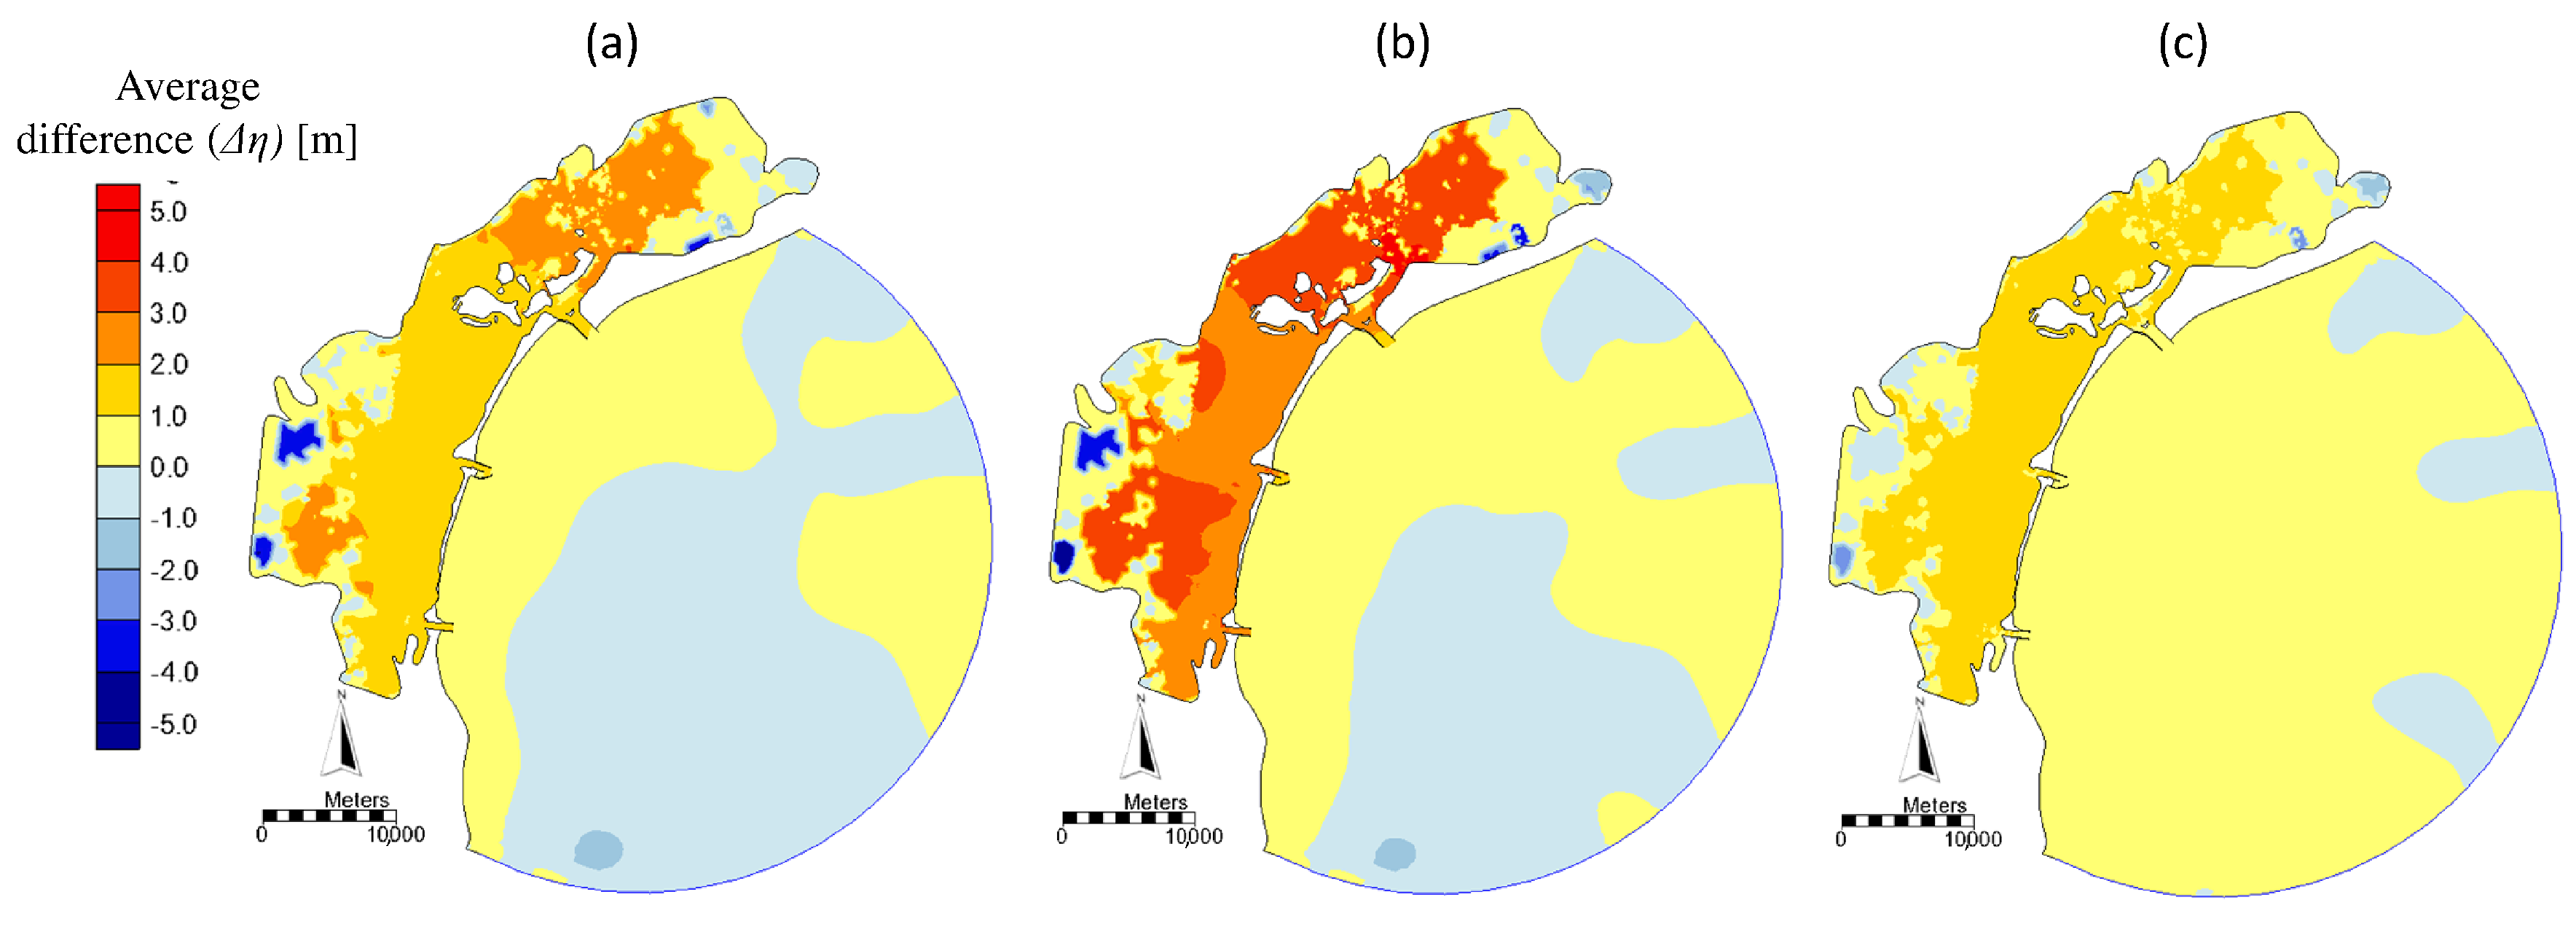
In order to evaluate the effect of the friction coefficient, Figure 9 and Figure 10 show the average difference of the water levels observed for the different values of during the two selected events. In each grid point, the average difference was estimated as
where indicates the water level, indicates the number of time steps and i indicates the ith time step. In Figure 9a and Figure 10a, and indicate the water level estimated using = 0.01 and = 0.005, respectively; in Figure 9b and Figure 10b, and indicate the water level estimated using = 0.015 and = 0.005, respectively; in Figure 9c and Figure 10c, and indicate the water level estimated using = 0.015 and = 0.01, respectively.
With regard to the event of 23 November 2007, an average difference of between −1 cm and +1 cm was observed over most of the domain. In the northern part of the lagoon, the average difference was slightly larger. In particular, the average difference was between −4 cm and −2 cm when comparing = 0.01 and = 0.005, close to −5 cm when comparing = 0.015 and = 0.005, and between −3 cm and −1 cm when comparing = 0.015 and = 0.01. With regard to the event of 1 December 2008, the average difference was greater than for the previous event. In the lagoon, the average difference was predominantly between 1 cm and 3 cm when comparing = 0.01 and = 0.005, between 3 cm and 5 cm when comparing = 0.015 and = 0.005, and between 1 cm and 2 cm when comparing = 0.015 and = 0.01.
The analysis reported above showed that the model reproduces the hydrodynamics within the lagoon relatively well, although a unique value of was adopted for the whole domain. Furthermore, the simulation carried out with the three different values of showed negligible differences compared to measured data and to each other. Such results suggest that with the aim to evaluate the maximum flood level within the lagoon, a single value of can be adopted, although a more accurate flow circulation should be obtained with a spatially variable friction coefficient in order to take into account the bottom roughness more appropriately. Consequently, the simulations analyzed in the next section were carried out adopting a unique value of equal to 0.01.
5. Case Studies
5.1. Meteorological Conditions
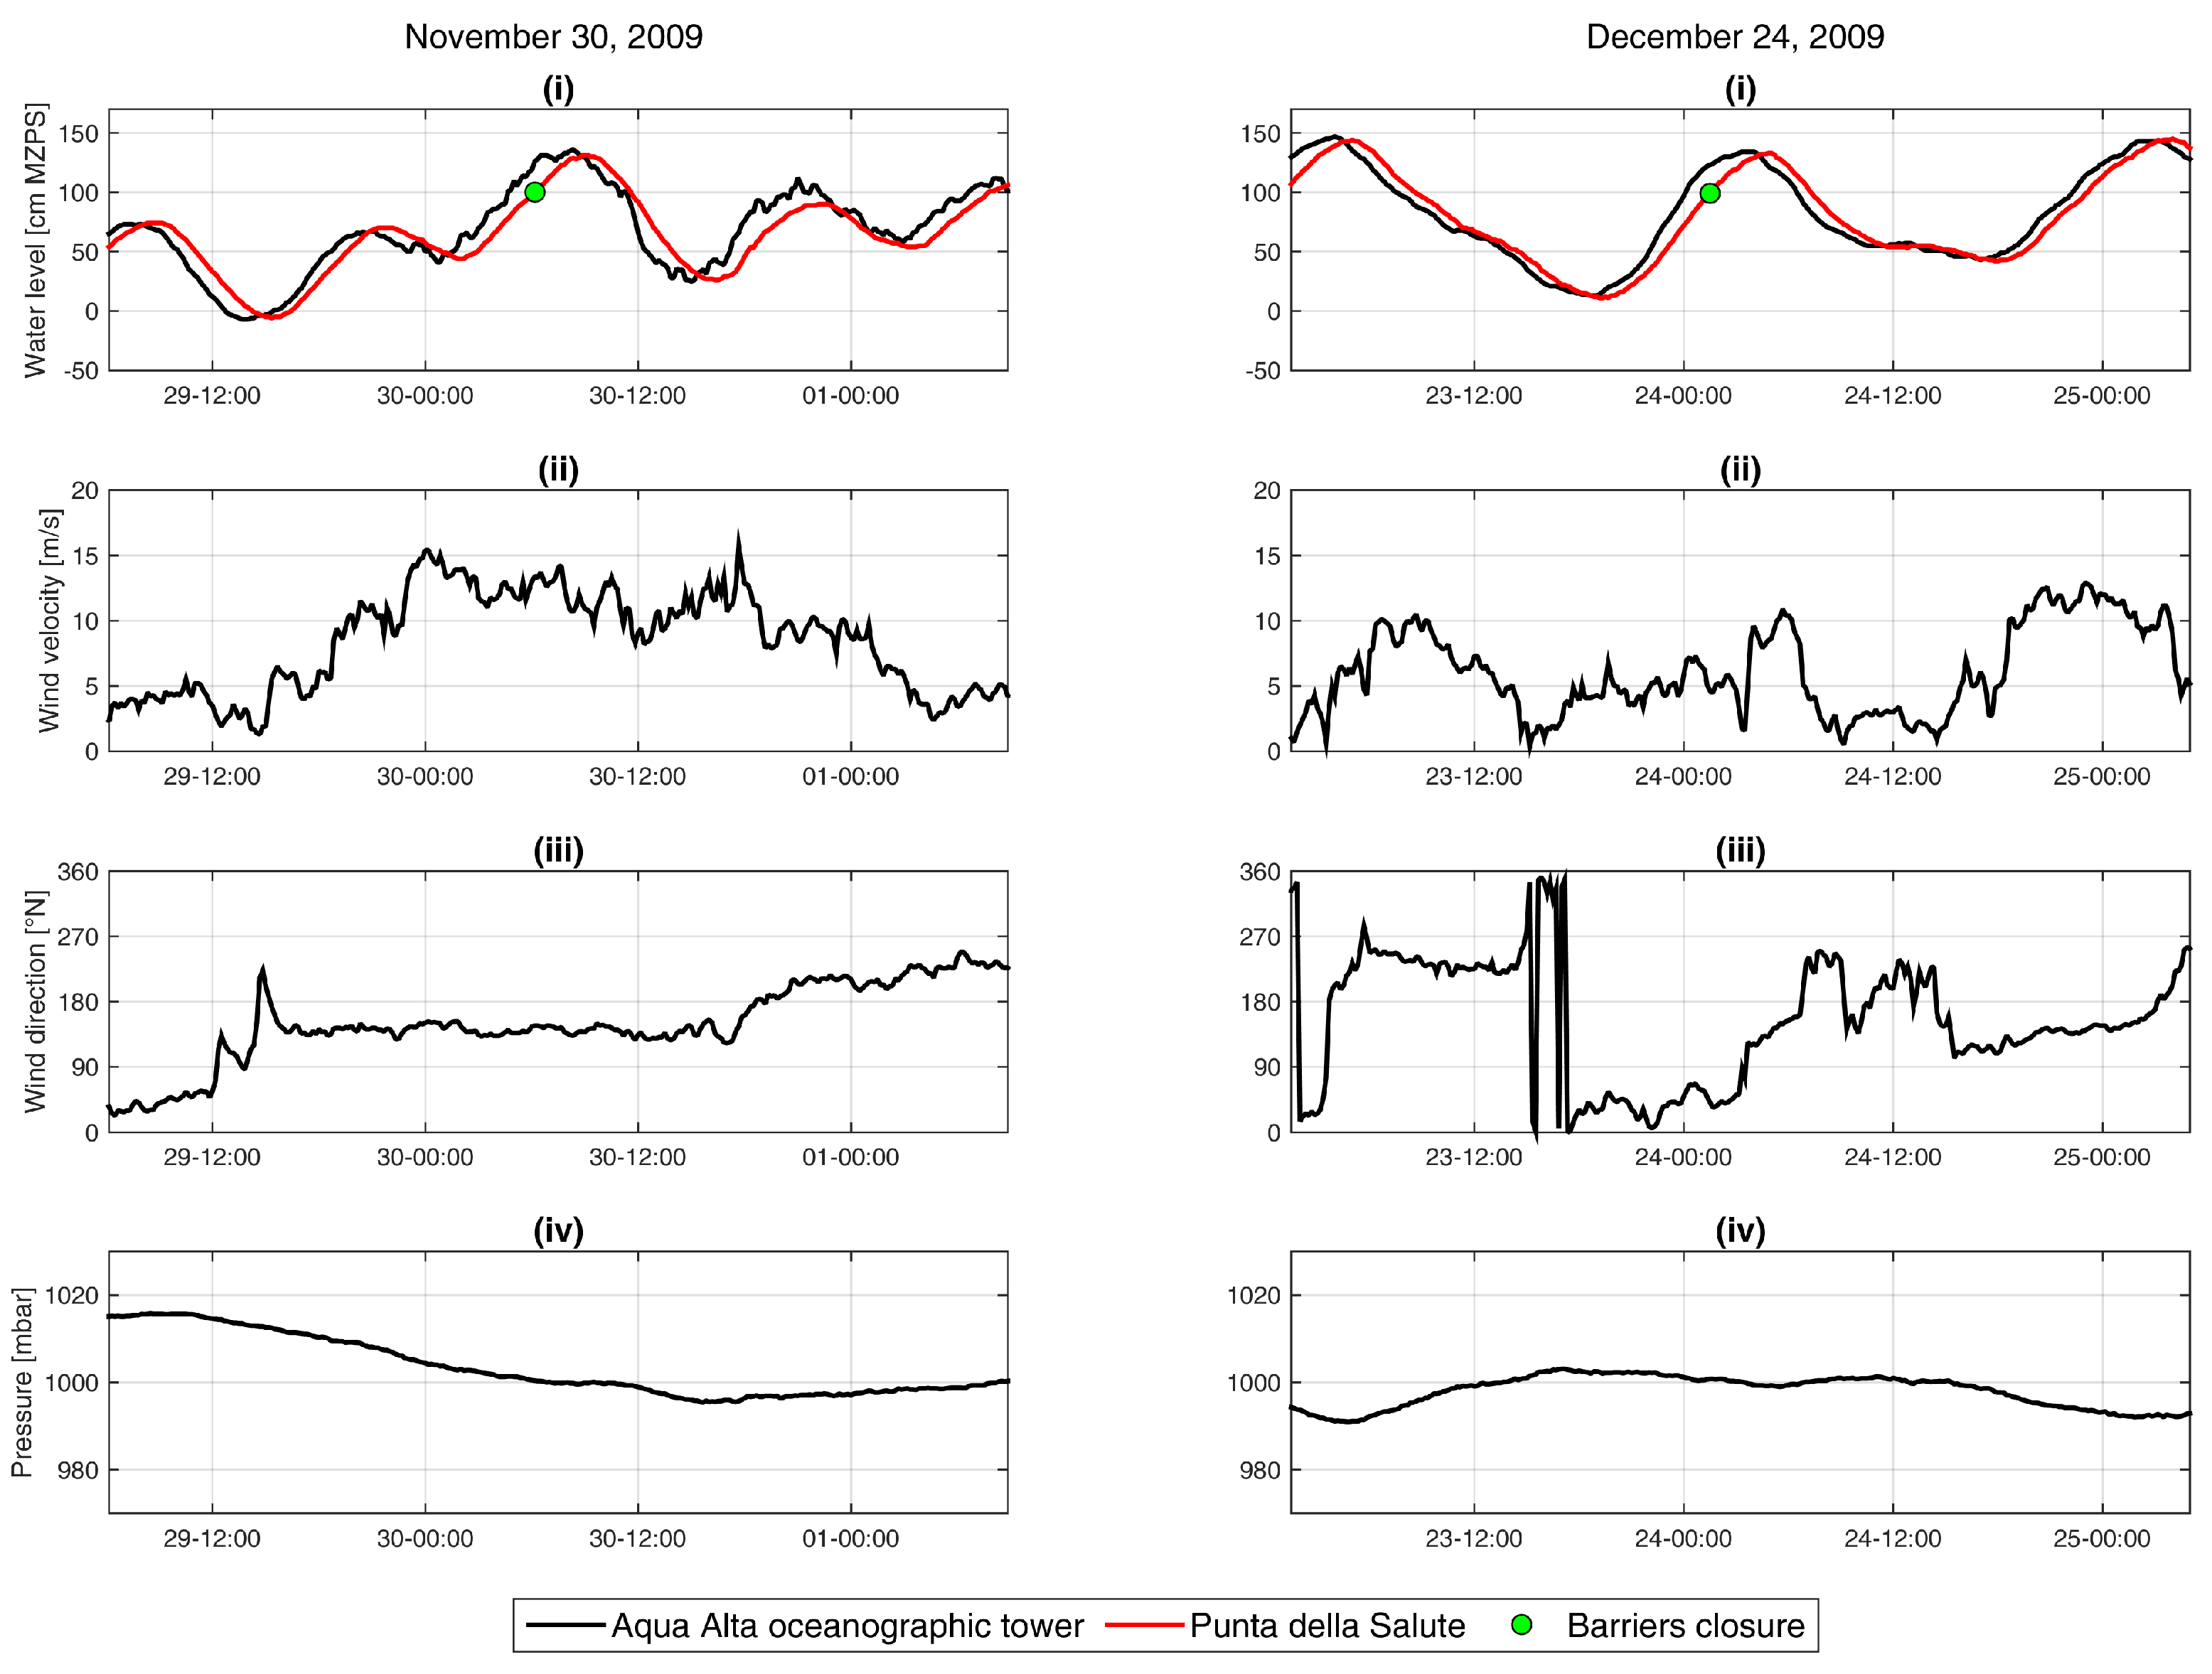
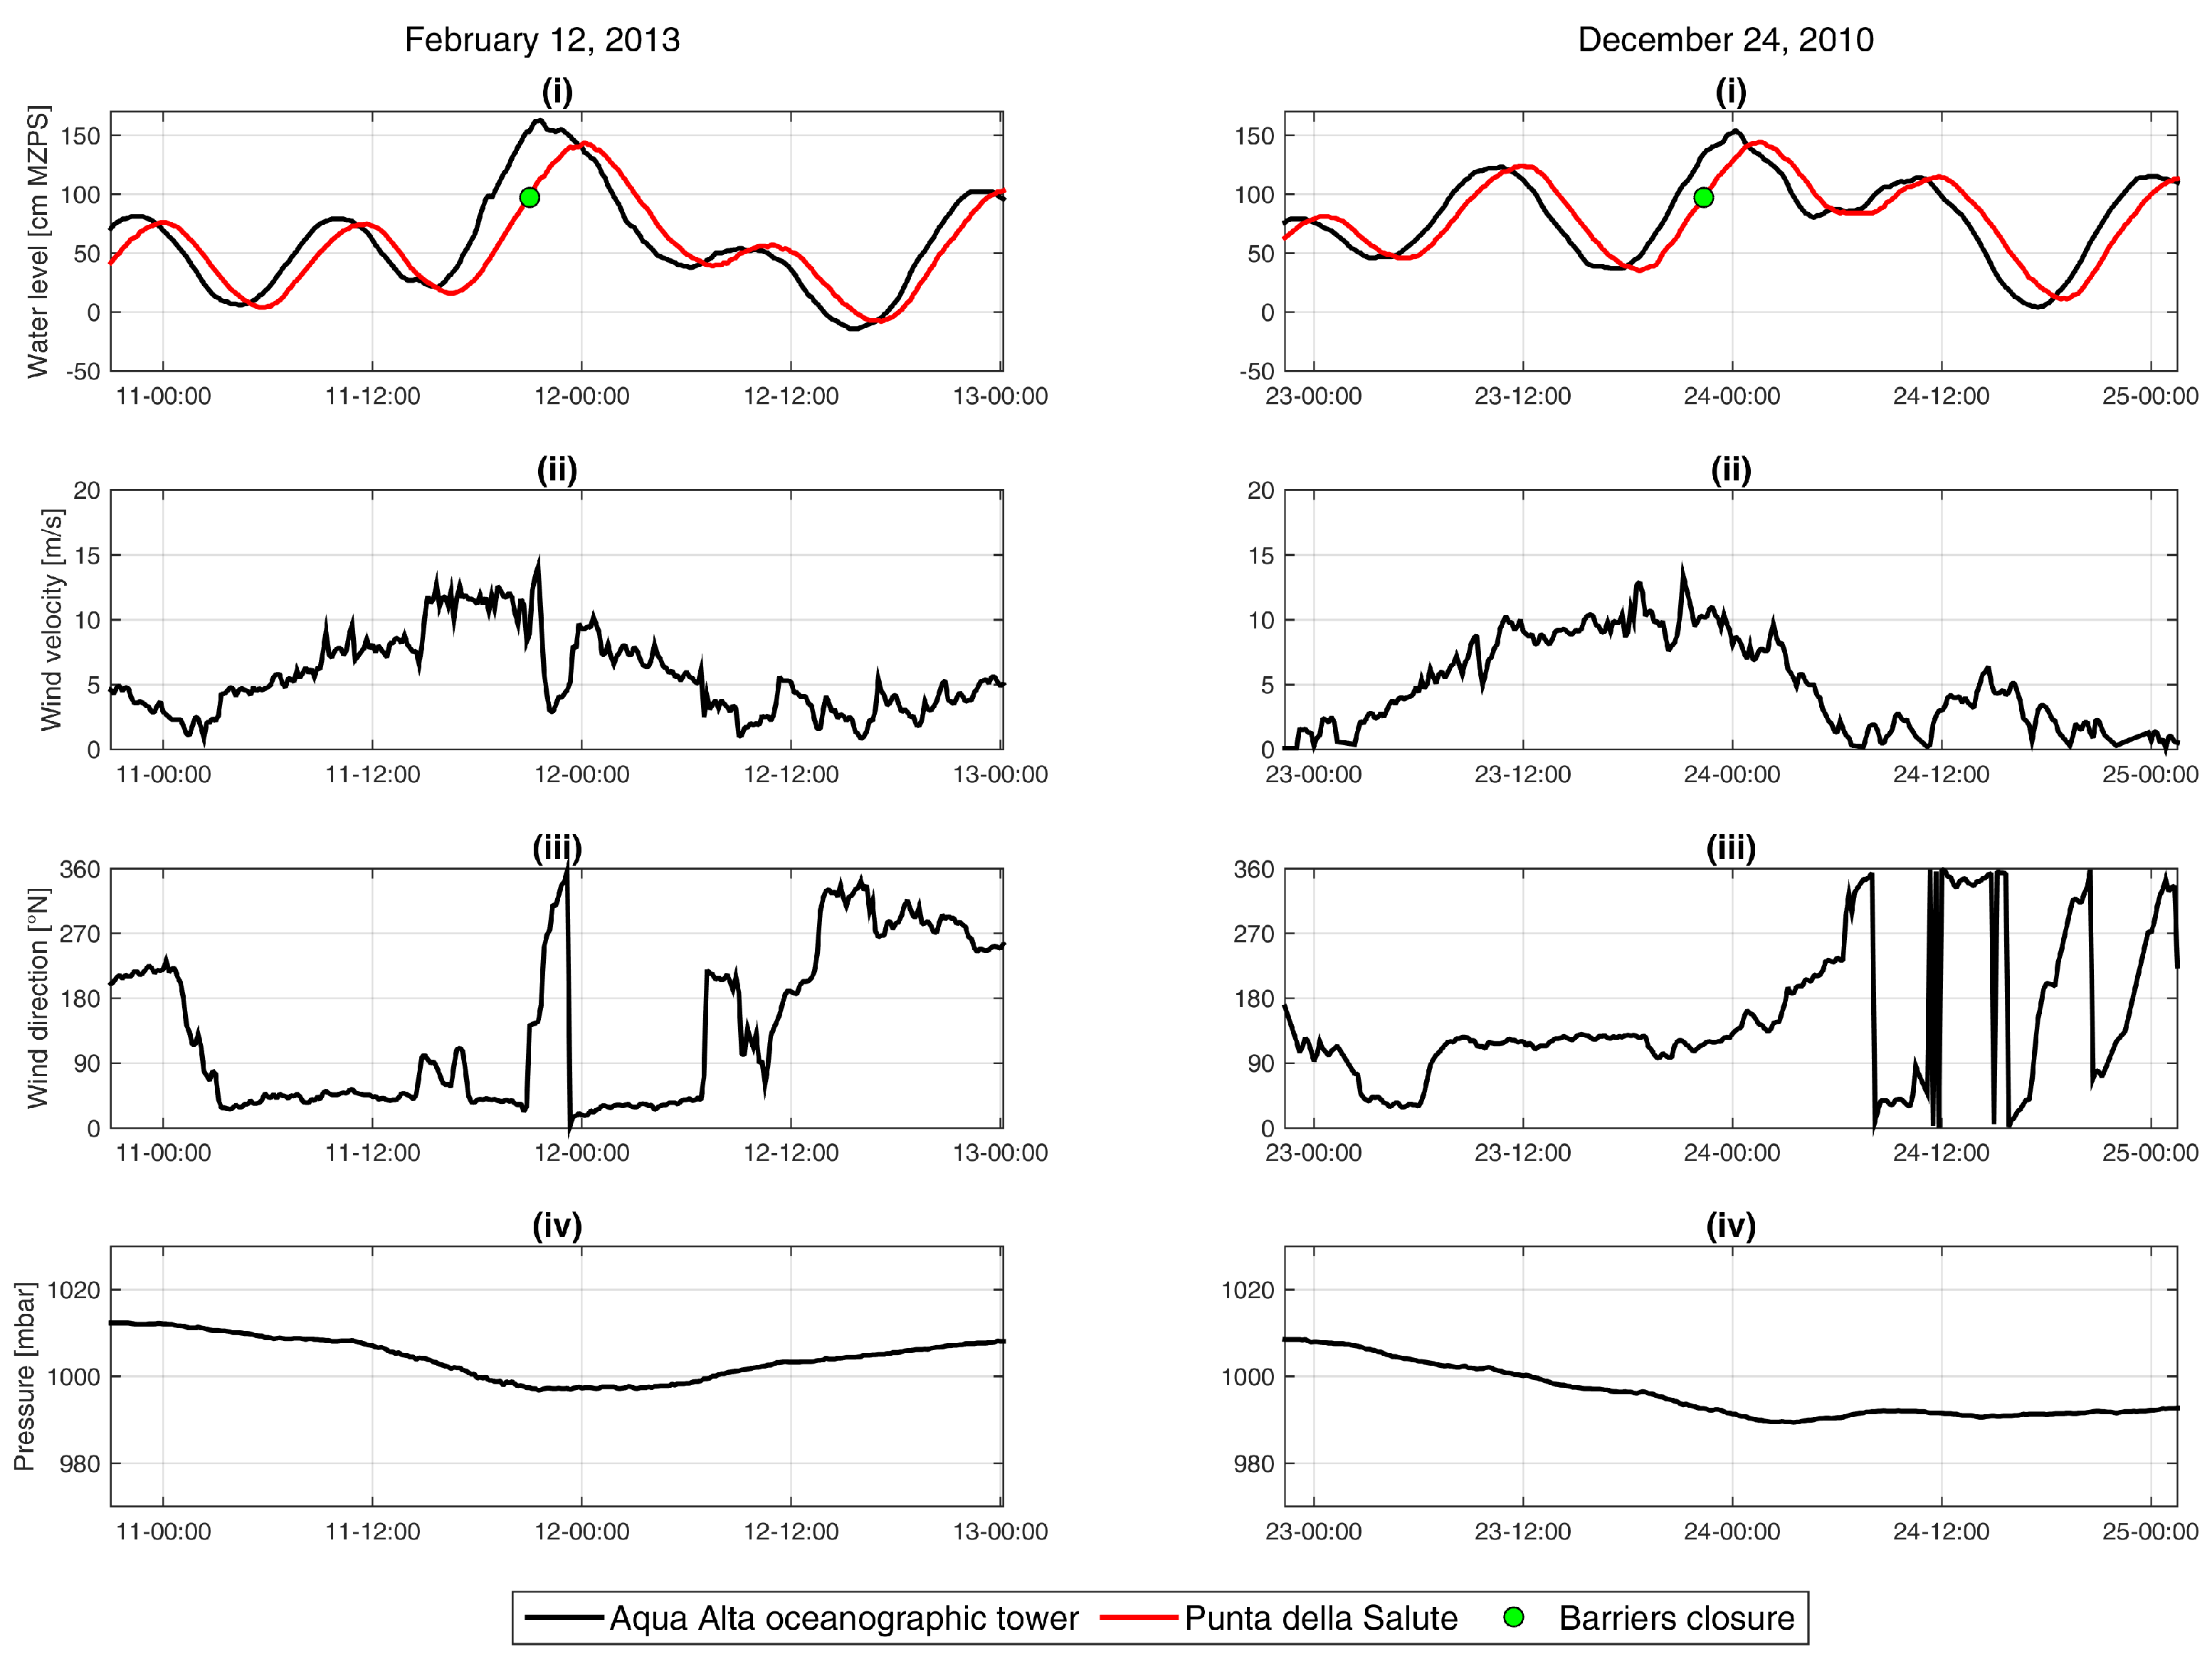
The simulations were performed considering eight events characterized by different maximum water levels. These events were selected as they were characterized by a different maximum sea level value. In particular, for these events, the maximum sea level value was in the range between 110 cm and 120 cm MZPS for the events of 19 November 2010 and 26 December 2013; in the range between 120 cm and 130 cm MZPS for the events of 22 November 2010 and 8 February 2009; in the range between 130 cm and 140 cm MZPS for the events of 30 November 2009 and 24 December 2009; and in the range between 140 cm and 150 cm MZPS for the events of 12 February 2013 and 24 December 2010.
Table 3 shows the main meteorological characteristics of the select events. The minimum water level was the relative minimum before the maximum sea level. The mean sea-level-rise velocity was estimated in the period between the minimum water level and the maximum sea level. The wind and the pressure characteristic were estimated for the period in which the sea level was greater than 110 cm MZPS.
Figure 11, Figure 12, Figure 13 and Figure 14 show the boundary conditions adopted for the selected events.
On the basis of the MoSE closure criteria, it was assumed that all the select events fell into the C1-1A class. The effect of the rainfall was neglected at this stage. Indeed, a total level rise of less than 0.8 cm was expected if we assumed that the contribution of the rainfall was 1 mm h and the contribution of the inflow from the surrounding watershed was 150 m s.
5.2. Results
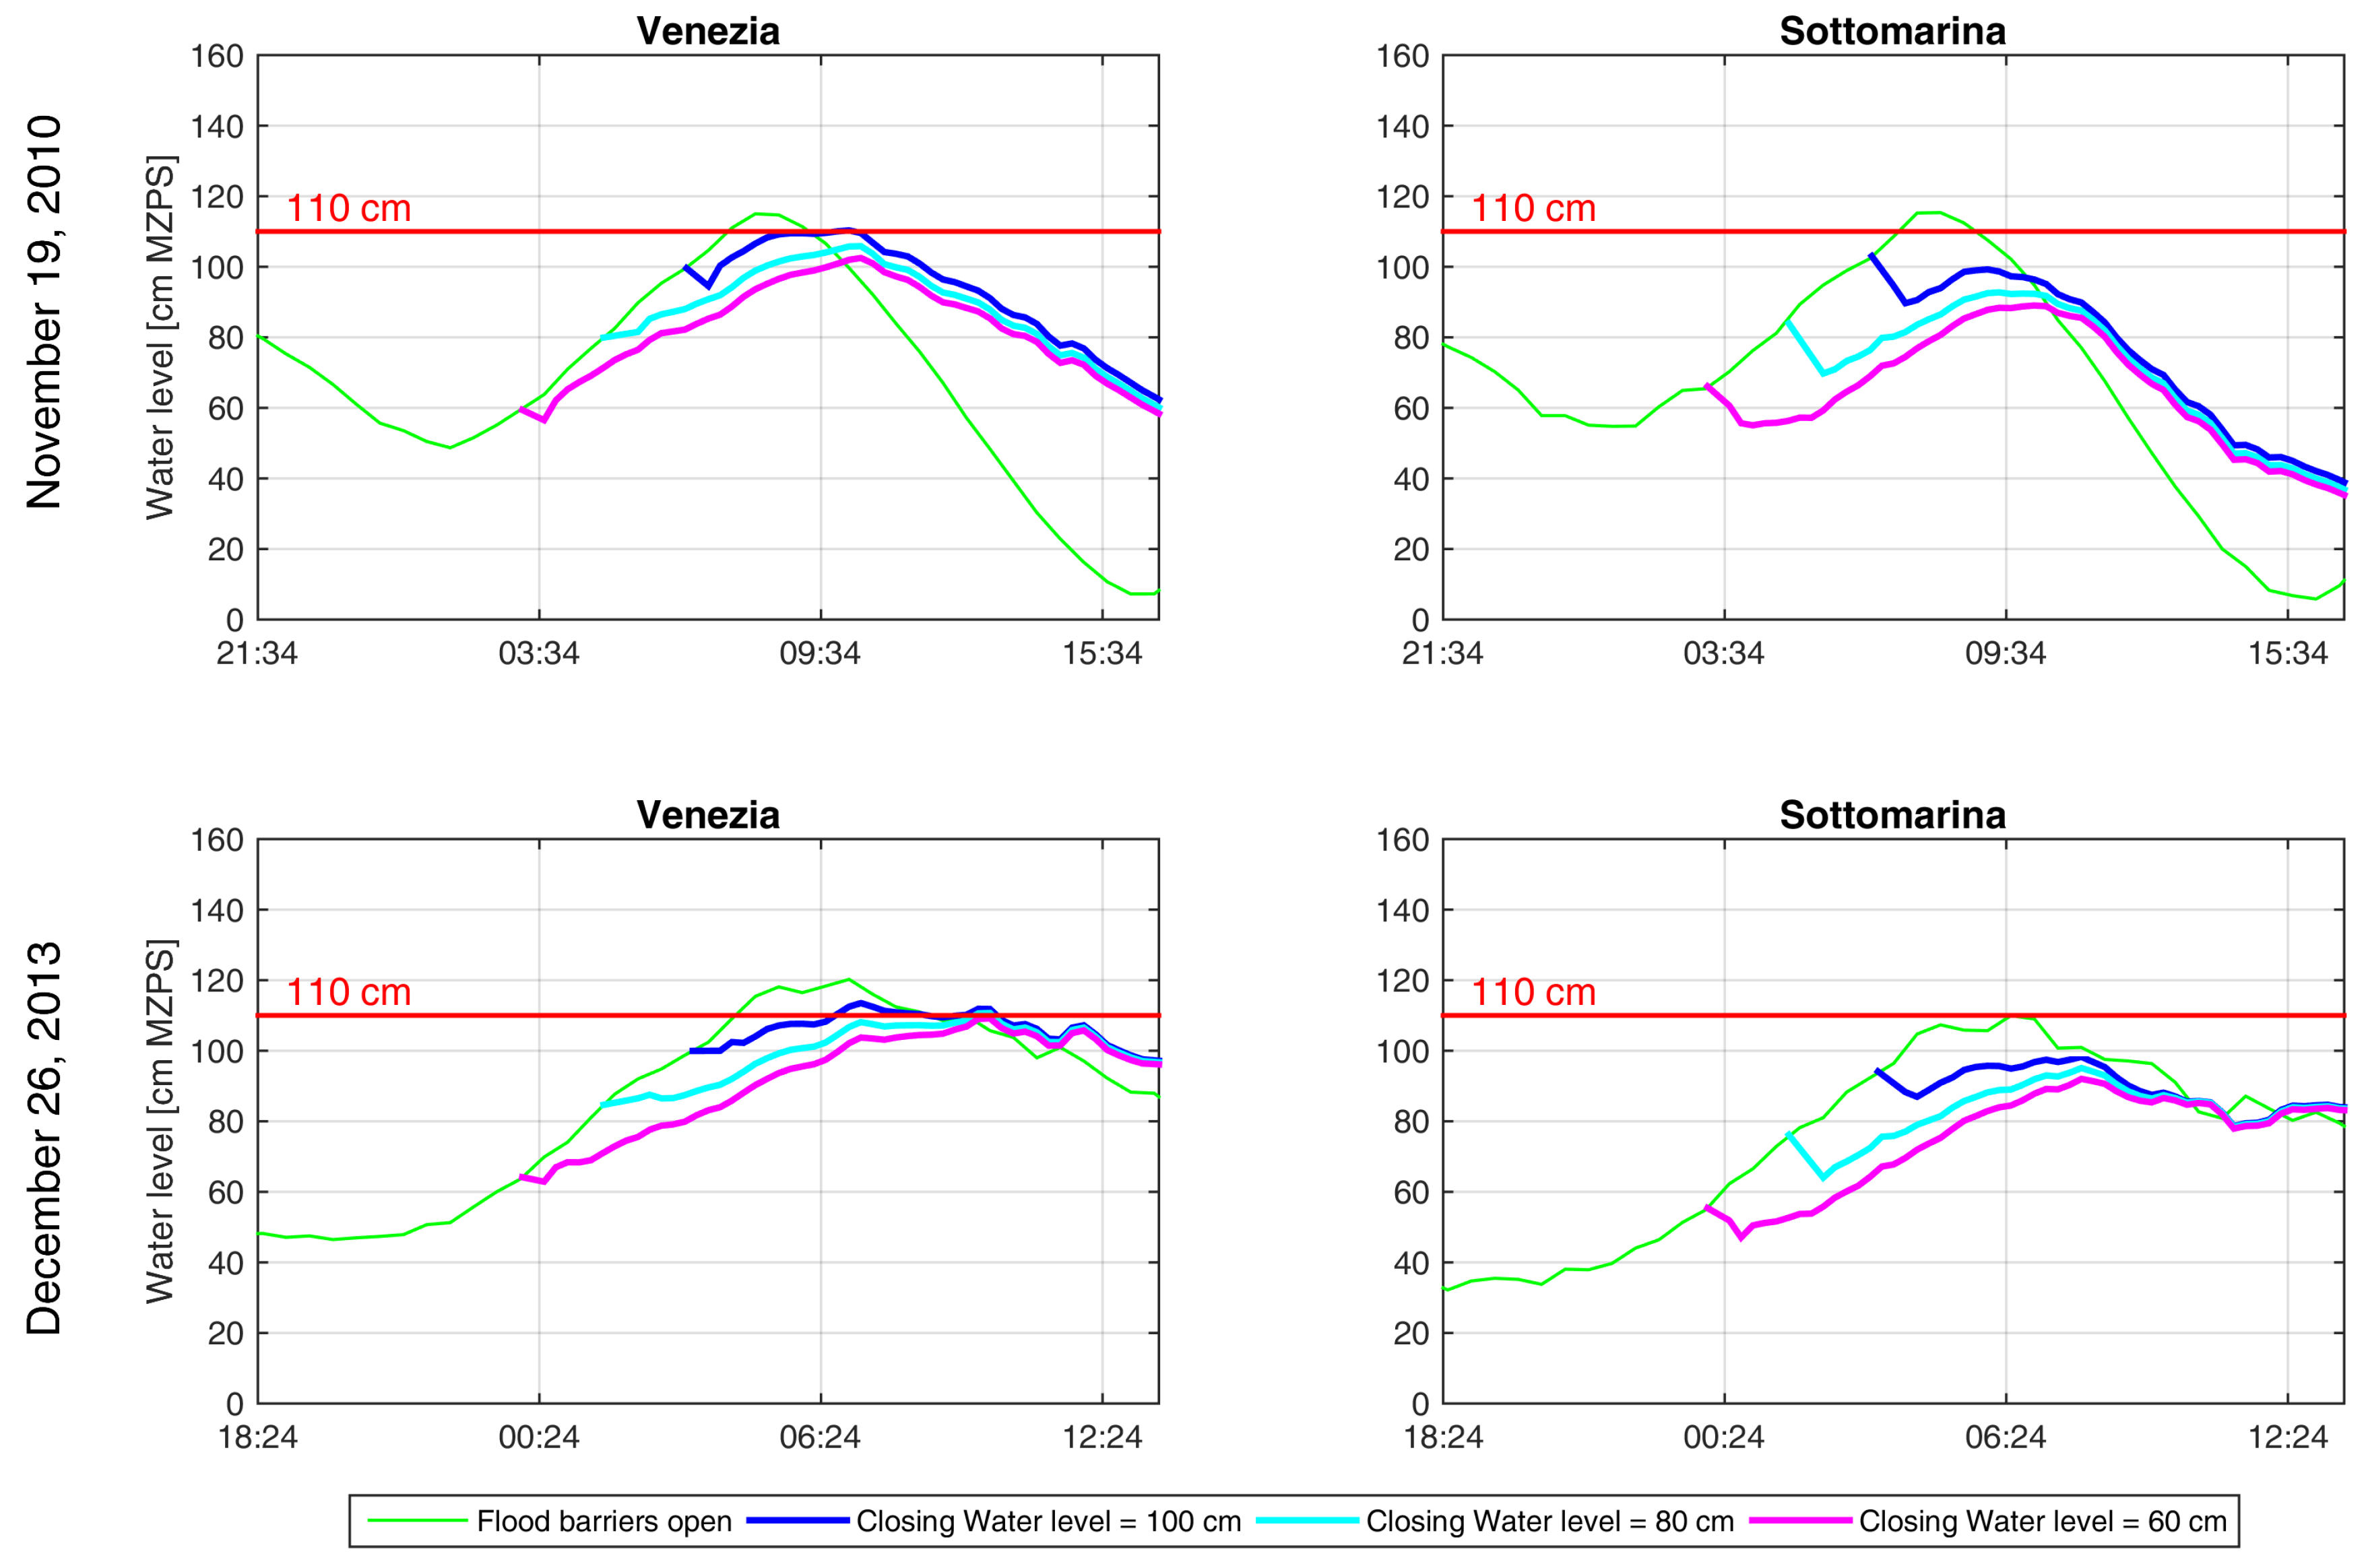
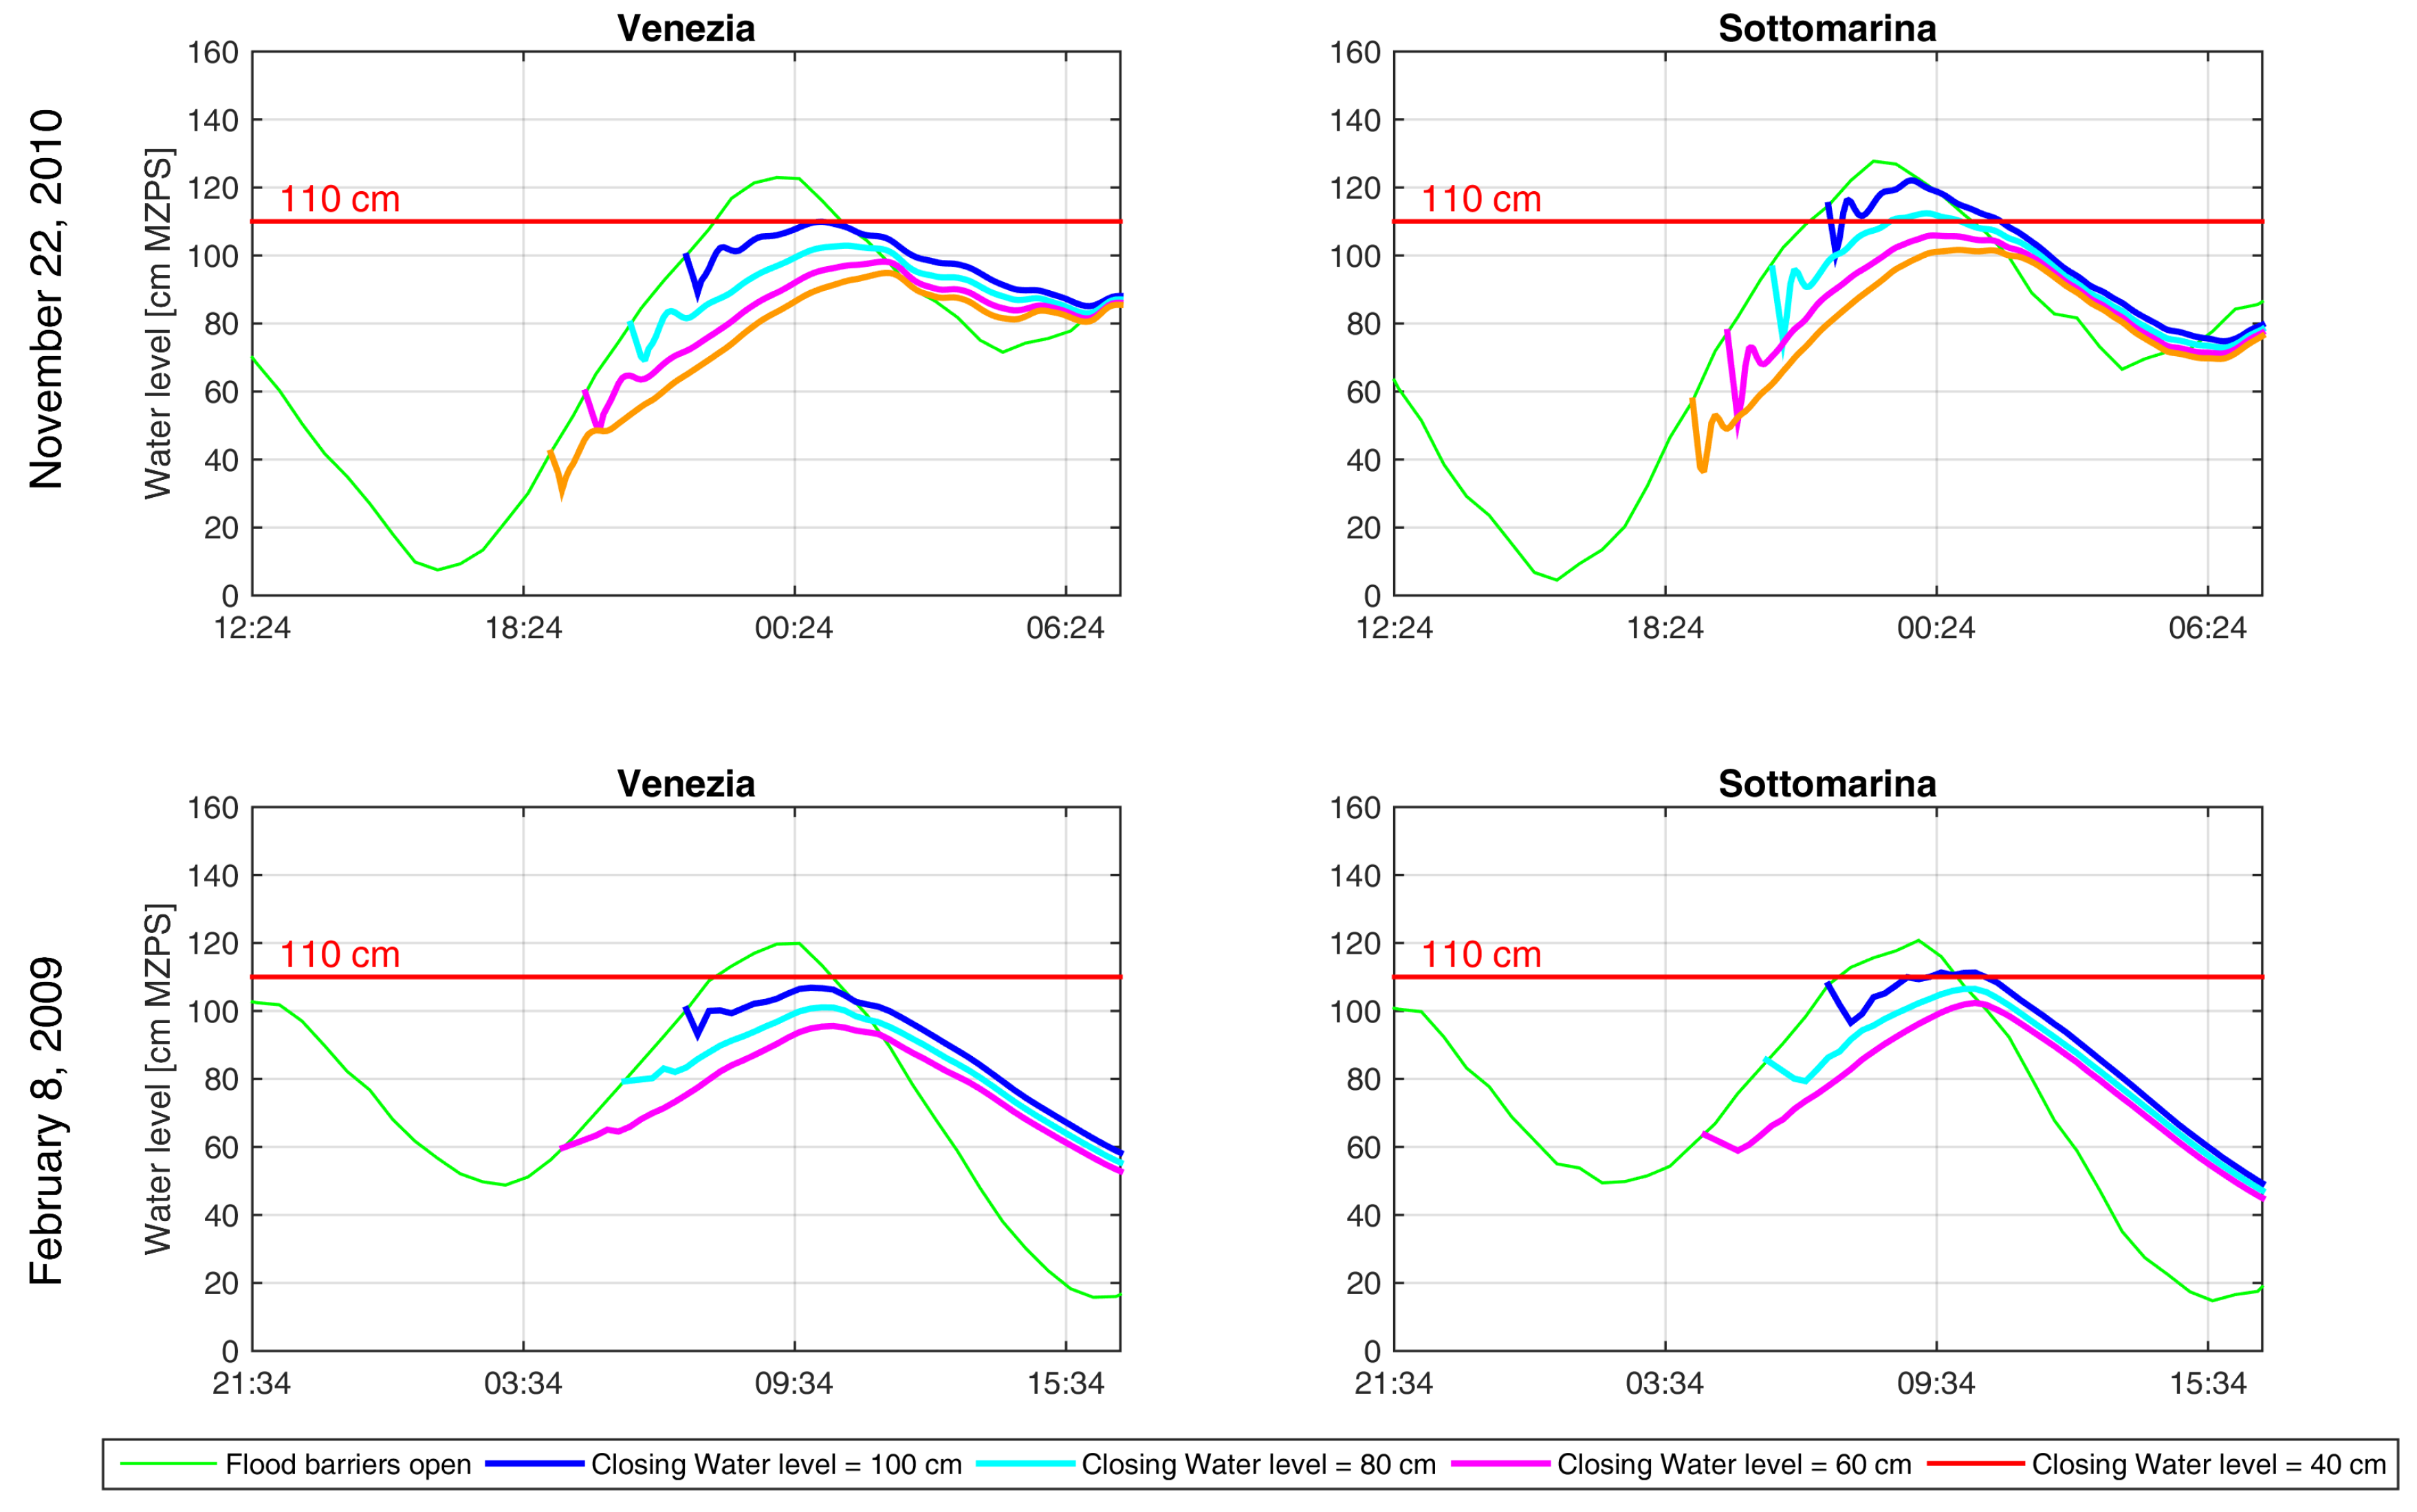
For the simulated events, Figure 13, Figure 14, Figure 15 and Figure 16 show the comparison between the configuration with only the flood barriers open and the configuration with flood barriers of Lido and Chioggia closed. The comparison was carried out using the water-level data measured close to the towns of Venice, Sottomarina and Chioggia. The safeguarding level was 110 cm for the towns of Venice and Sottomarina and 130 cm for the town of Chioggia.
Although the flood barriers of Malamocco inlet have not been activated, the maximum water level estimated for the events of 19 November 2010 was not greater than the safeguarding levels of 110 cm MZPS. However, in other simulated cases, the safeguarding level was exceeded or the security margin between the maximum level and the safeguarding level was very low.
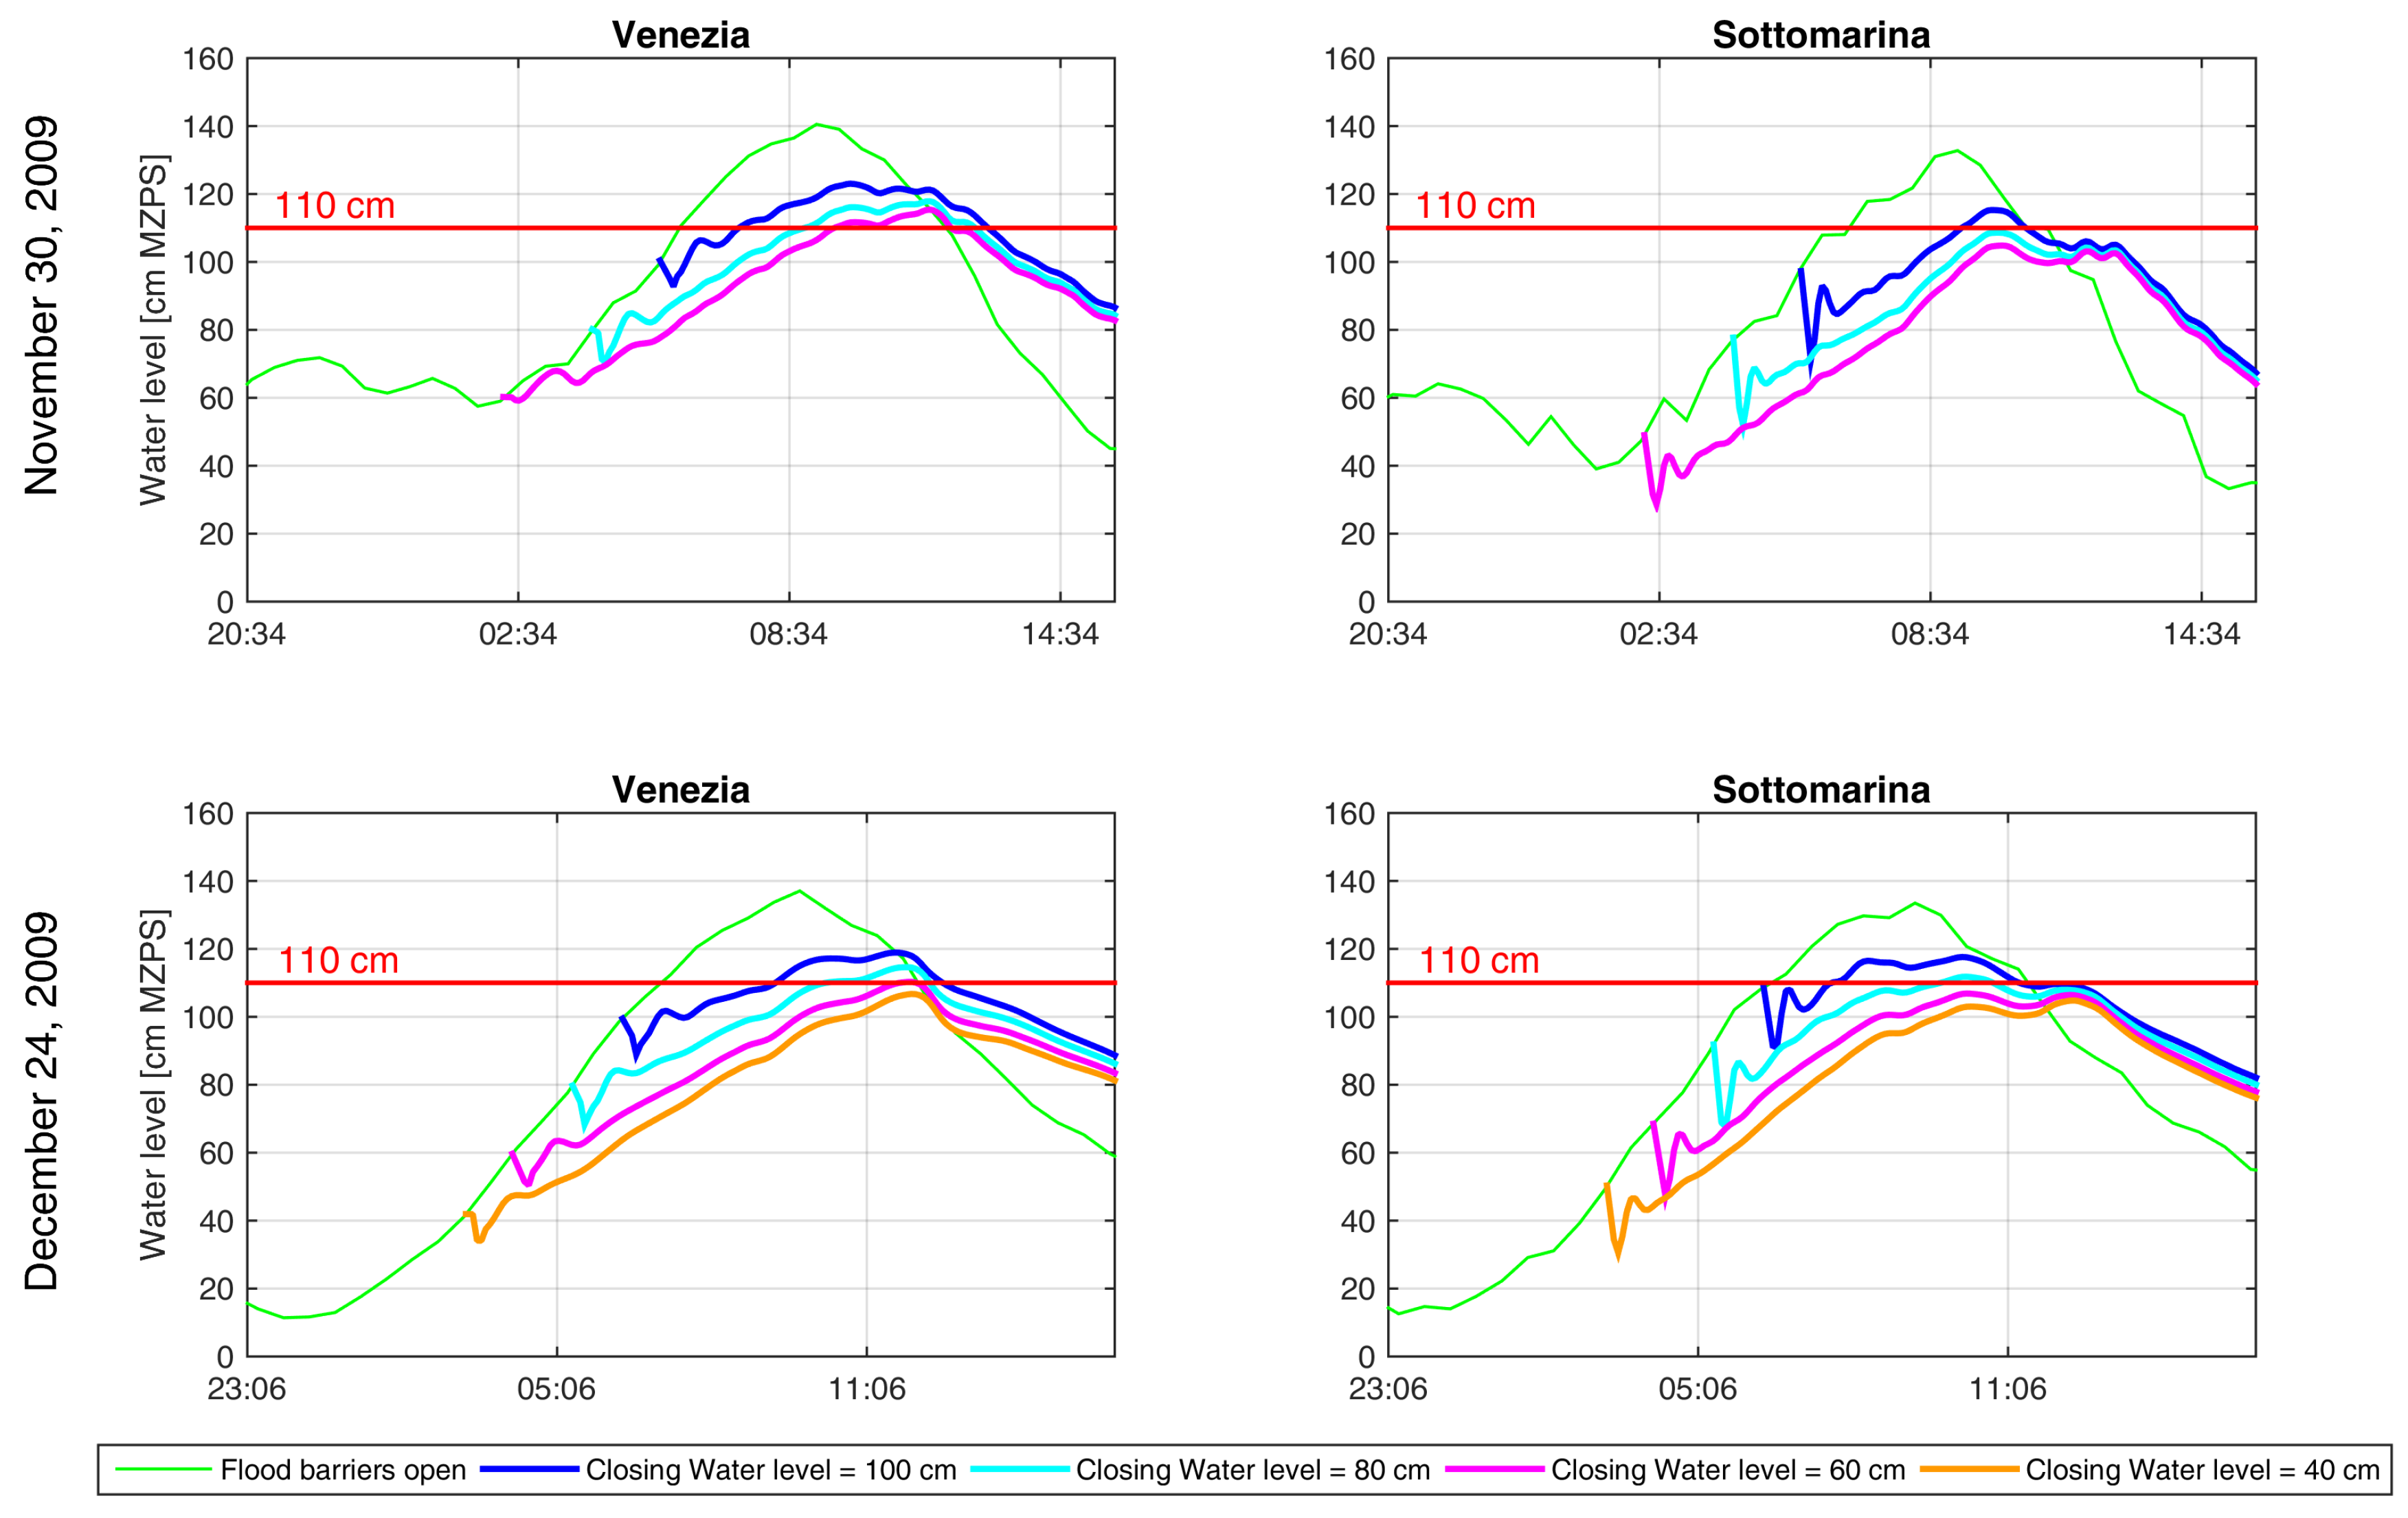
One possible solution to avoid overcoming the safeguarding threshold by keeping only the barriers of Lido and Chioggia closed is the variation of the MoSE closing criteria. In more detail, if the water levels expected inside the lagoon overcome the safety levels (i.e., 110 cm MZPS in Venice or 130 cm MZPS in Chioggia), the raising of the barrier could start at a water level lower then that indicated by the true barrier closure criteria. For this purpose, additional levels of closure were considered: 80 and 60 cm MZPS. Moreover, the level of closure of 40 cm MZPS was considered for events for which this was possible.
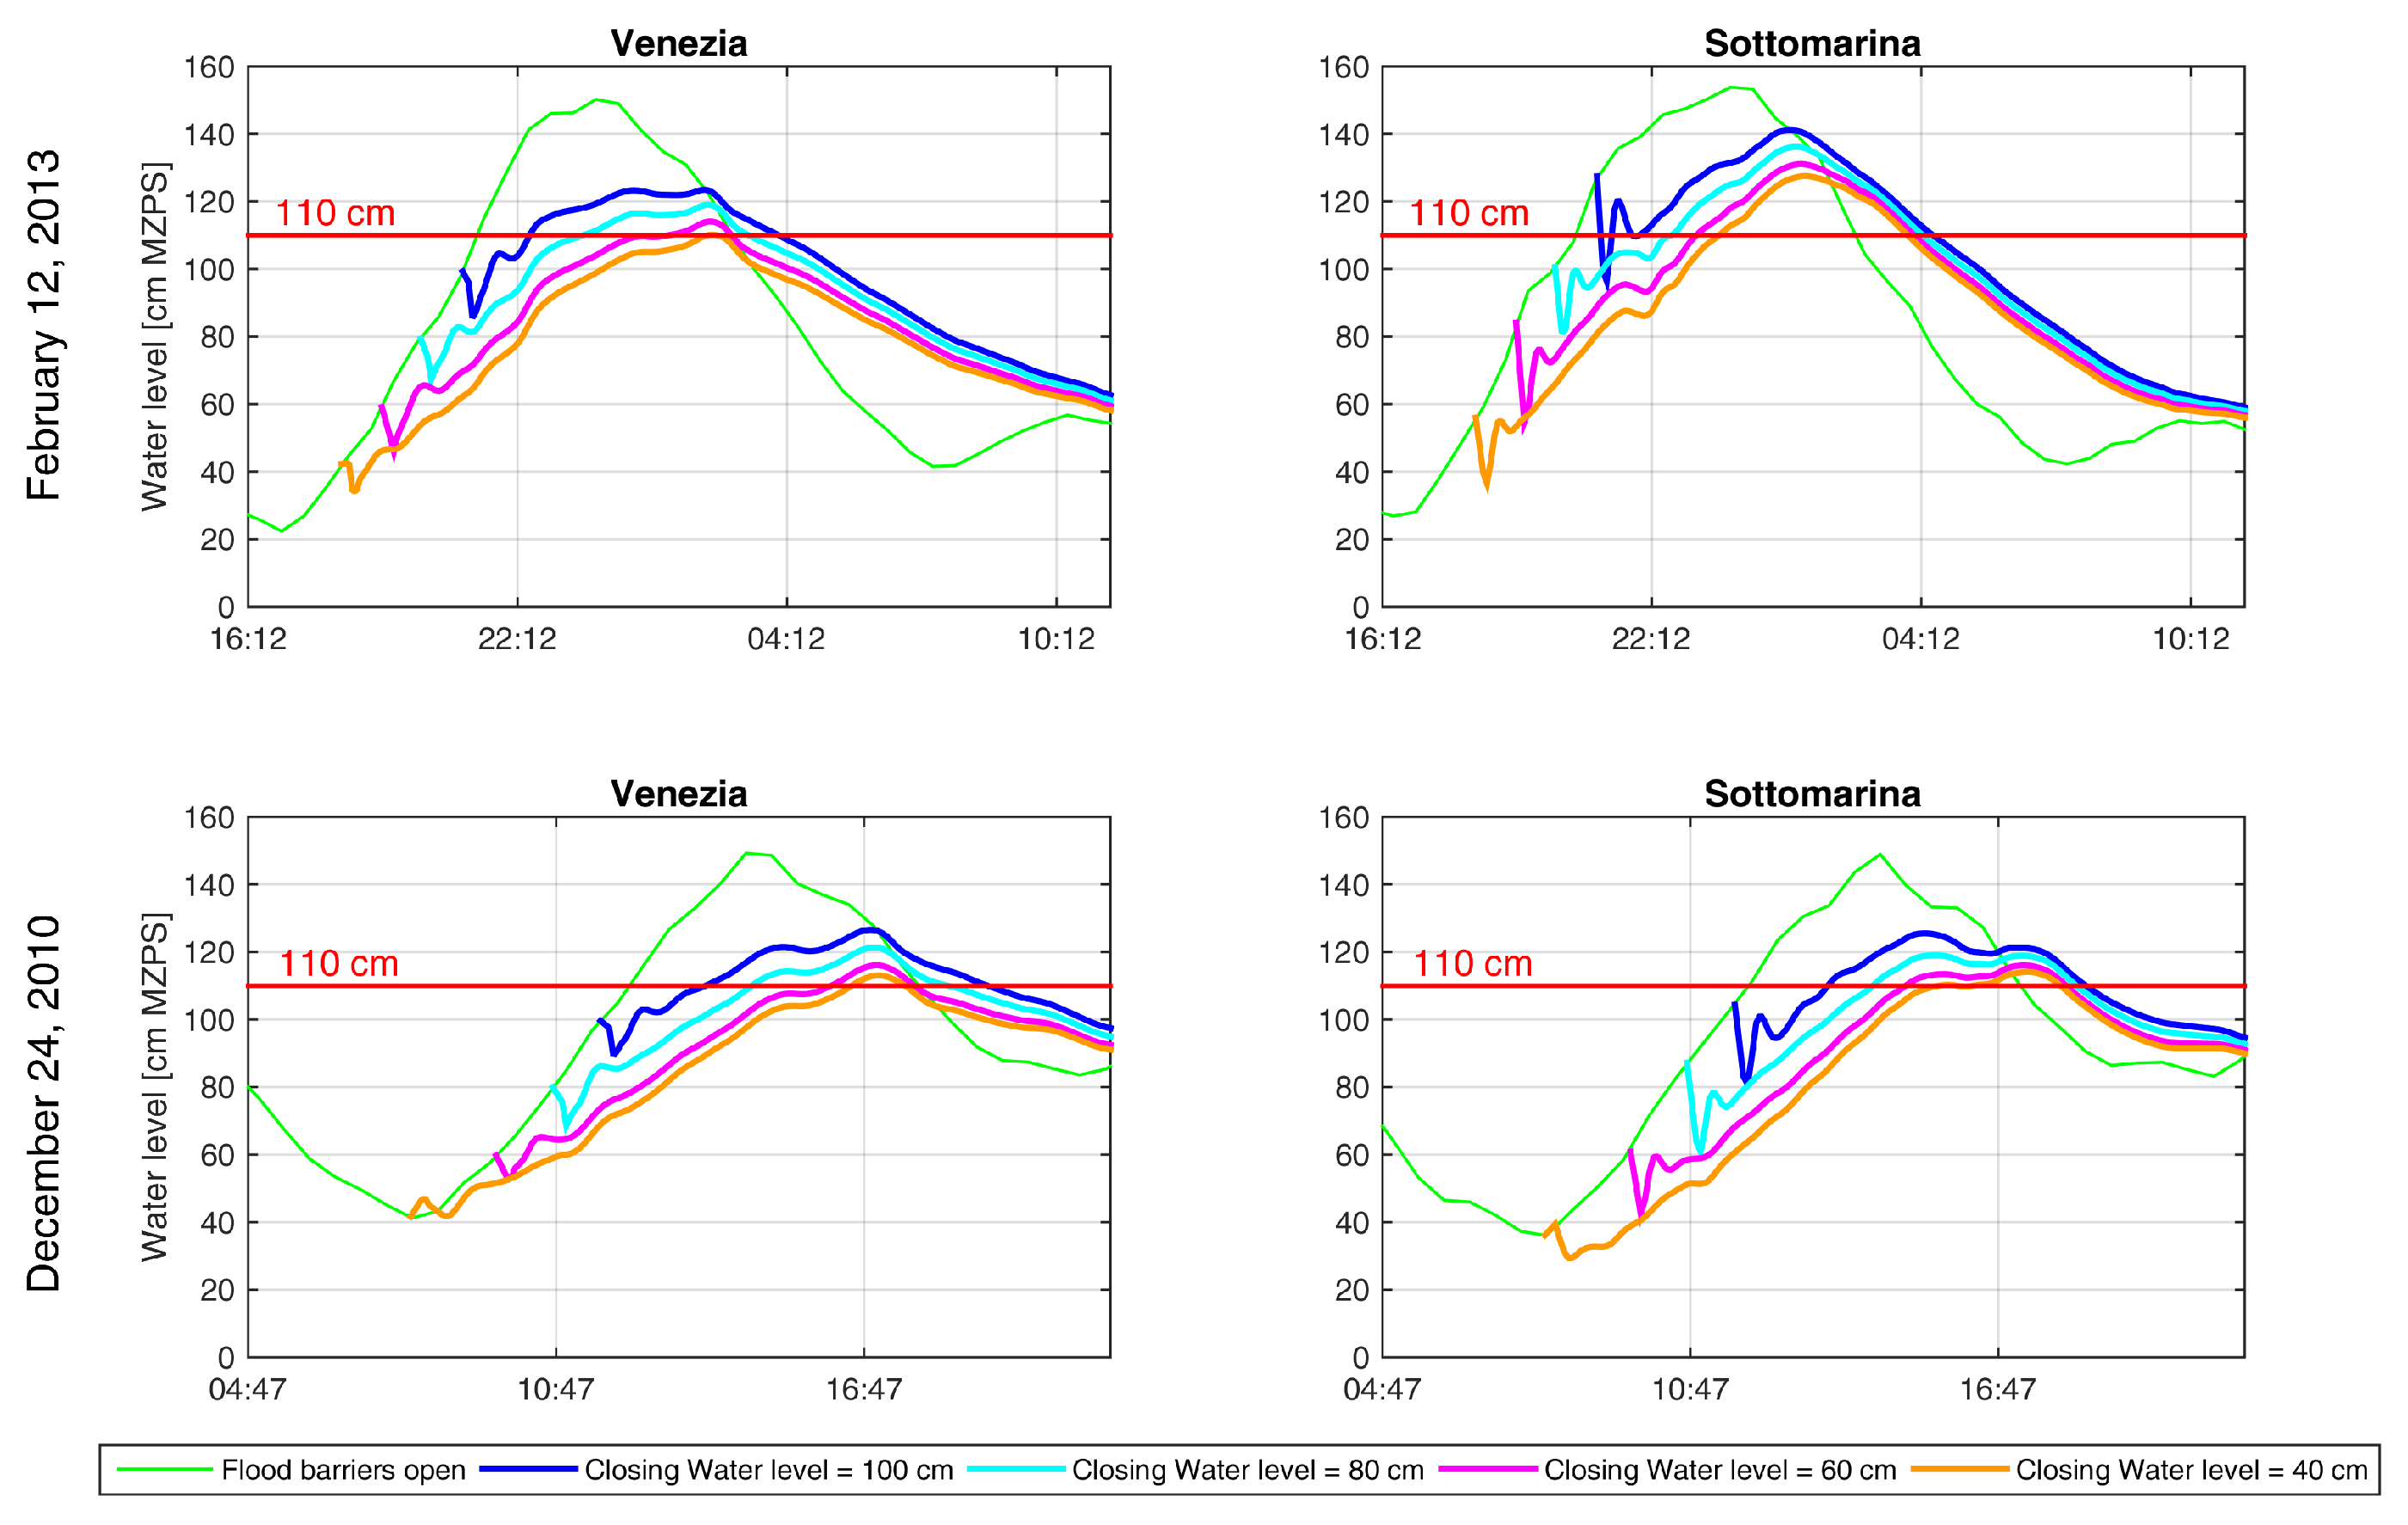
Figure 15, Figure 16, Figure 17 and Figure 18 show the comparison of the water level estimated using different values of the closing water levels at which the barriers of Lido and Chioggia were raised.
The results of the numerical simulations are summarized in Table 4. For each event, the table shows the maximum water level if the flood barriers were closed and the maximum water level reached for the considered level closures.
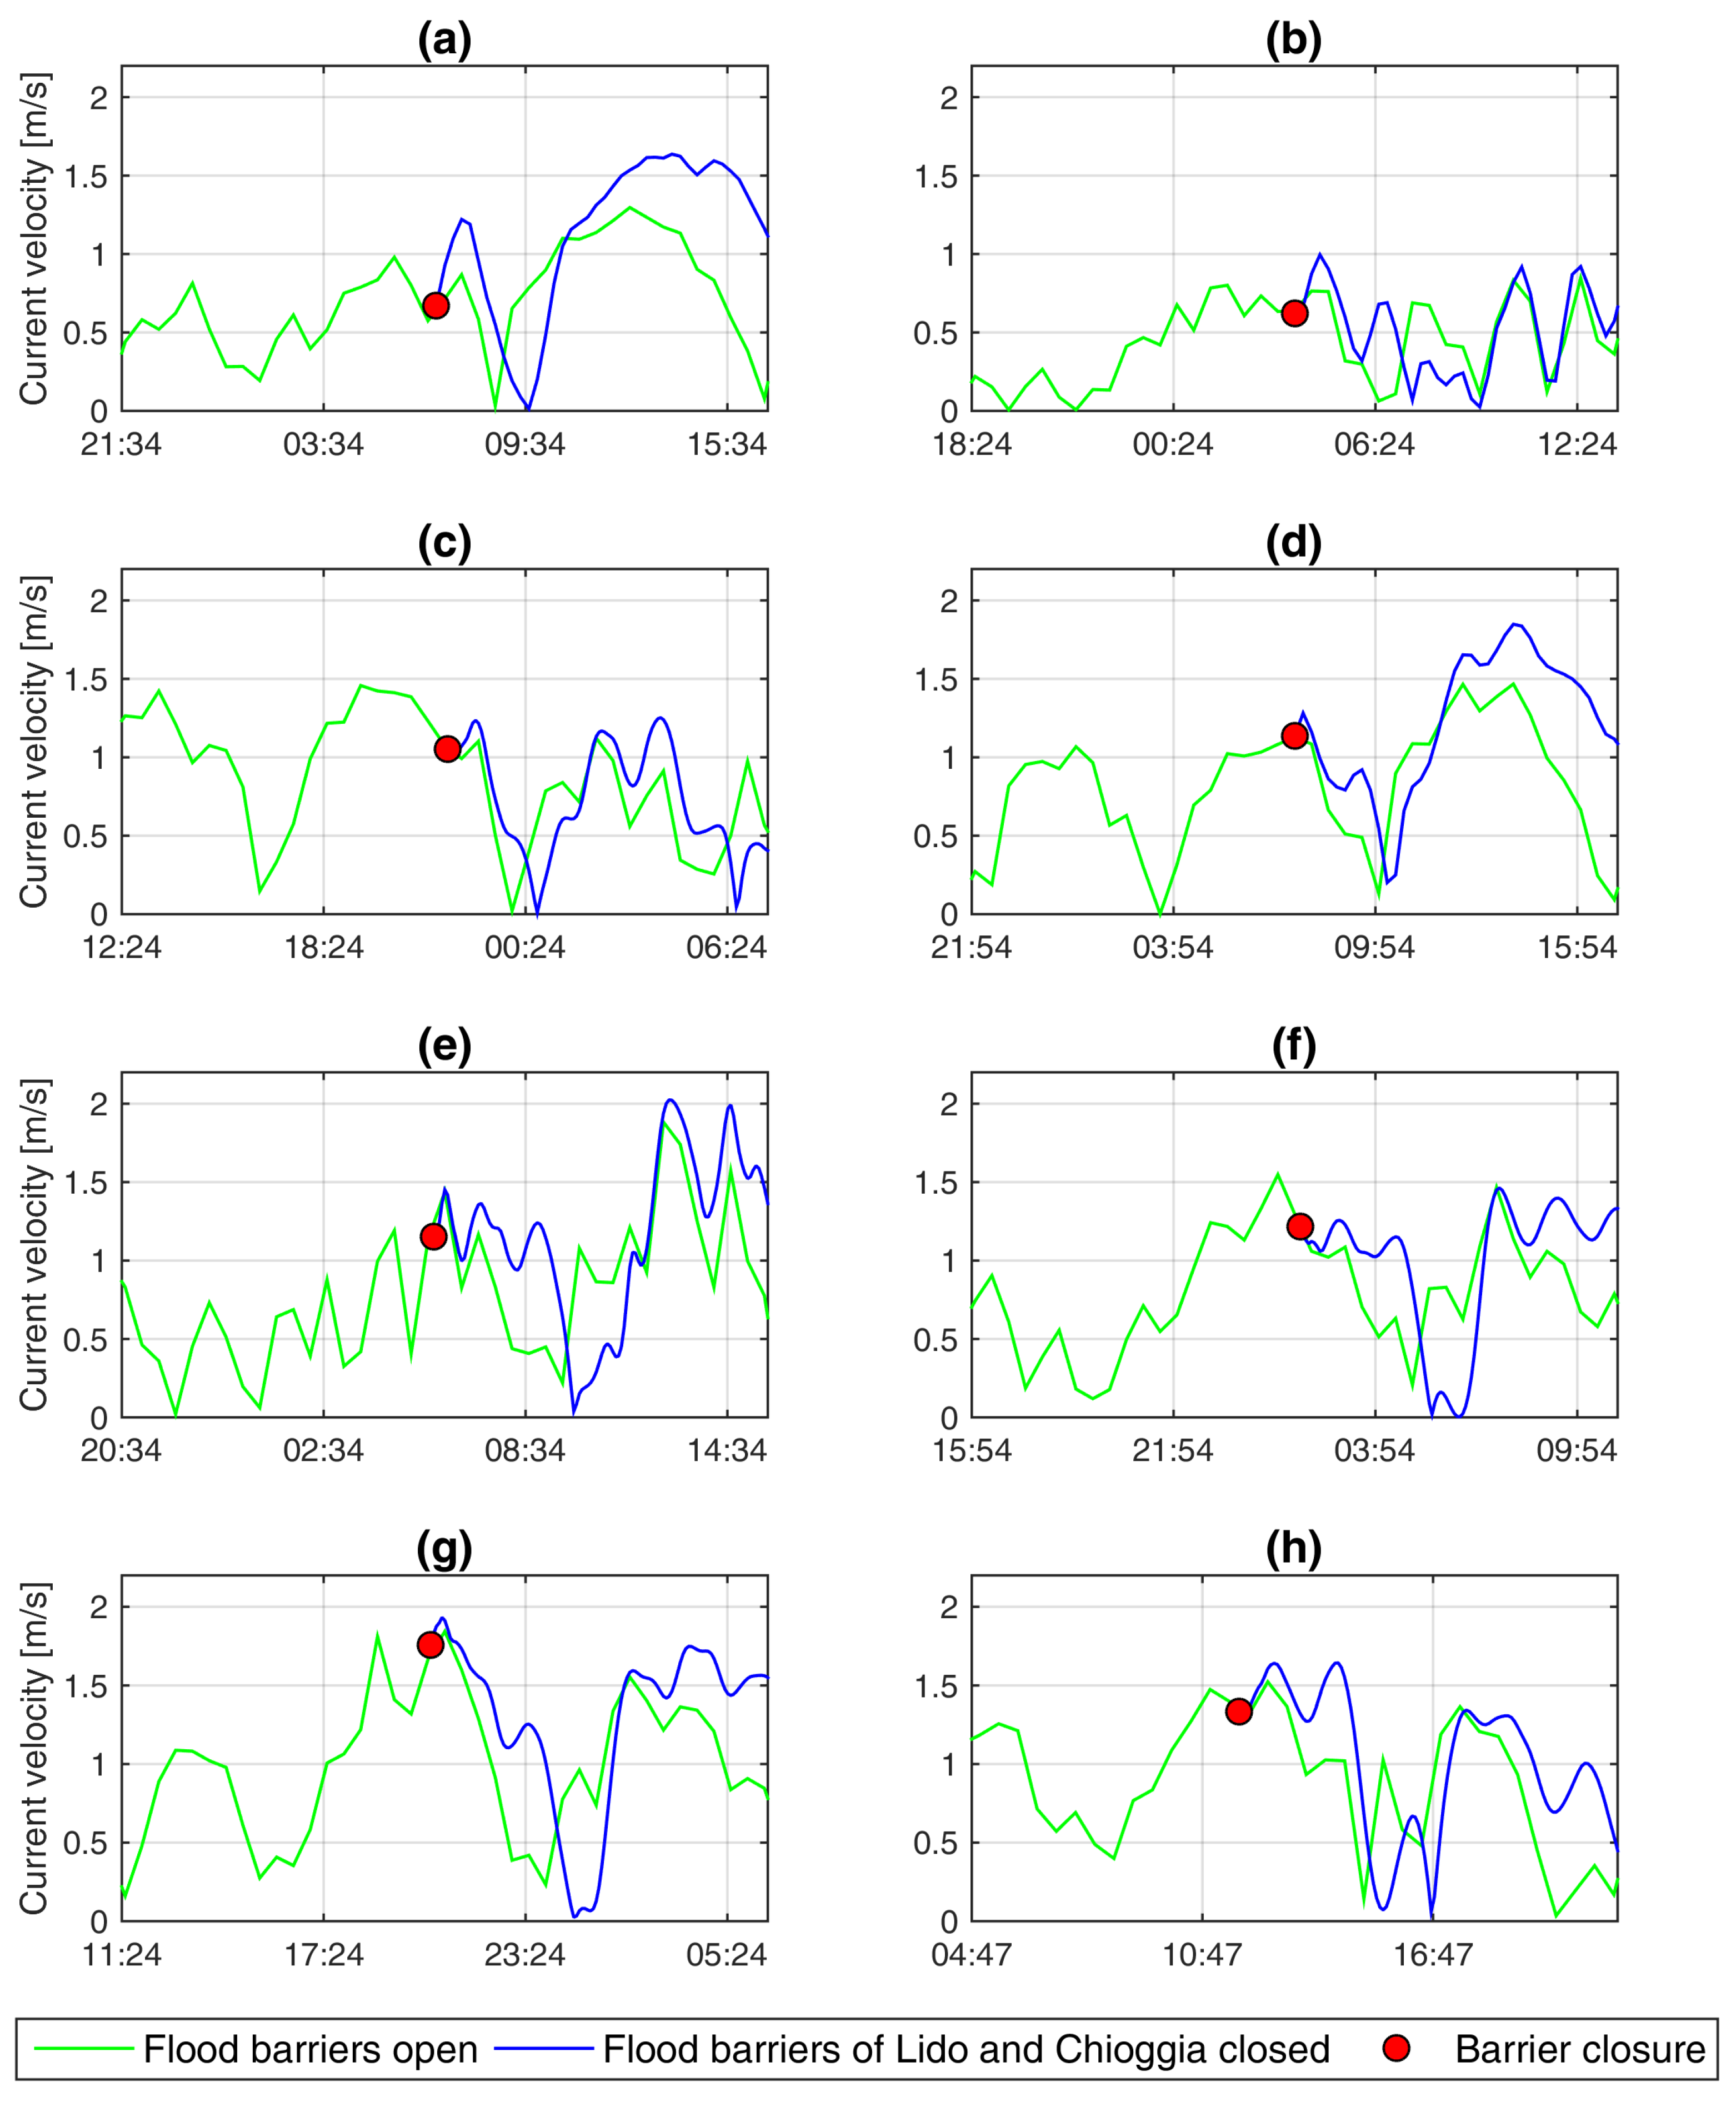
Another important issue to consider is the current velocity in the Malamocco inlet during the partial use of the MoSE. For all the analyzed events, Figure 19 shows the current velocity in Malamocco inlet in the case of the partial closure of the MoSE adopting the current barrier closure criteria. The velocity data were extracted at Point A shown in Figure 2 and located in the middle of Malamocco channel. The comparison showed that a difference of (20–25)% was detected between the maximum velocities evaluated for the case with all the flood barriers open and the case with the Lido and Chioggia barriers closed.
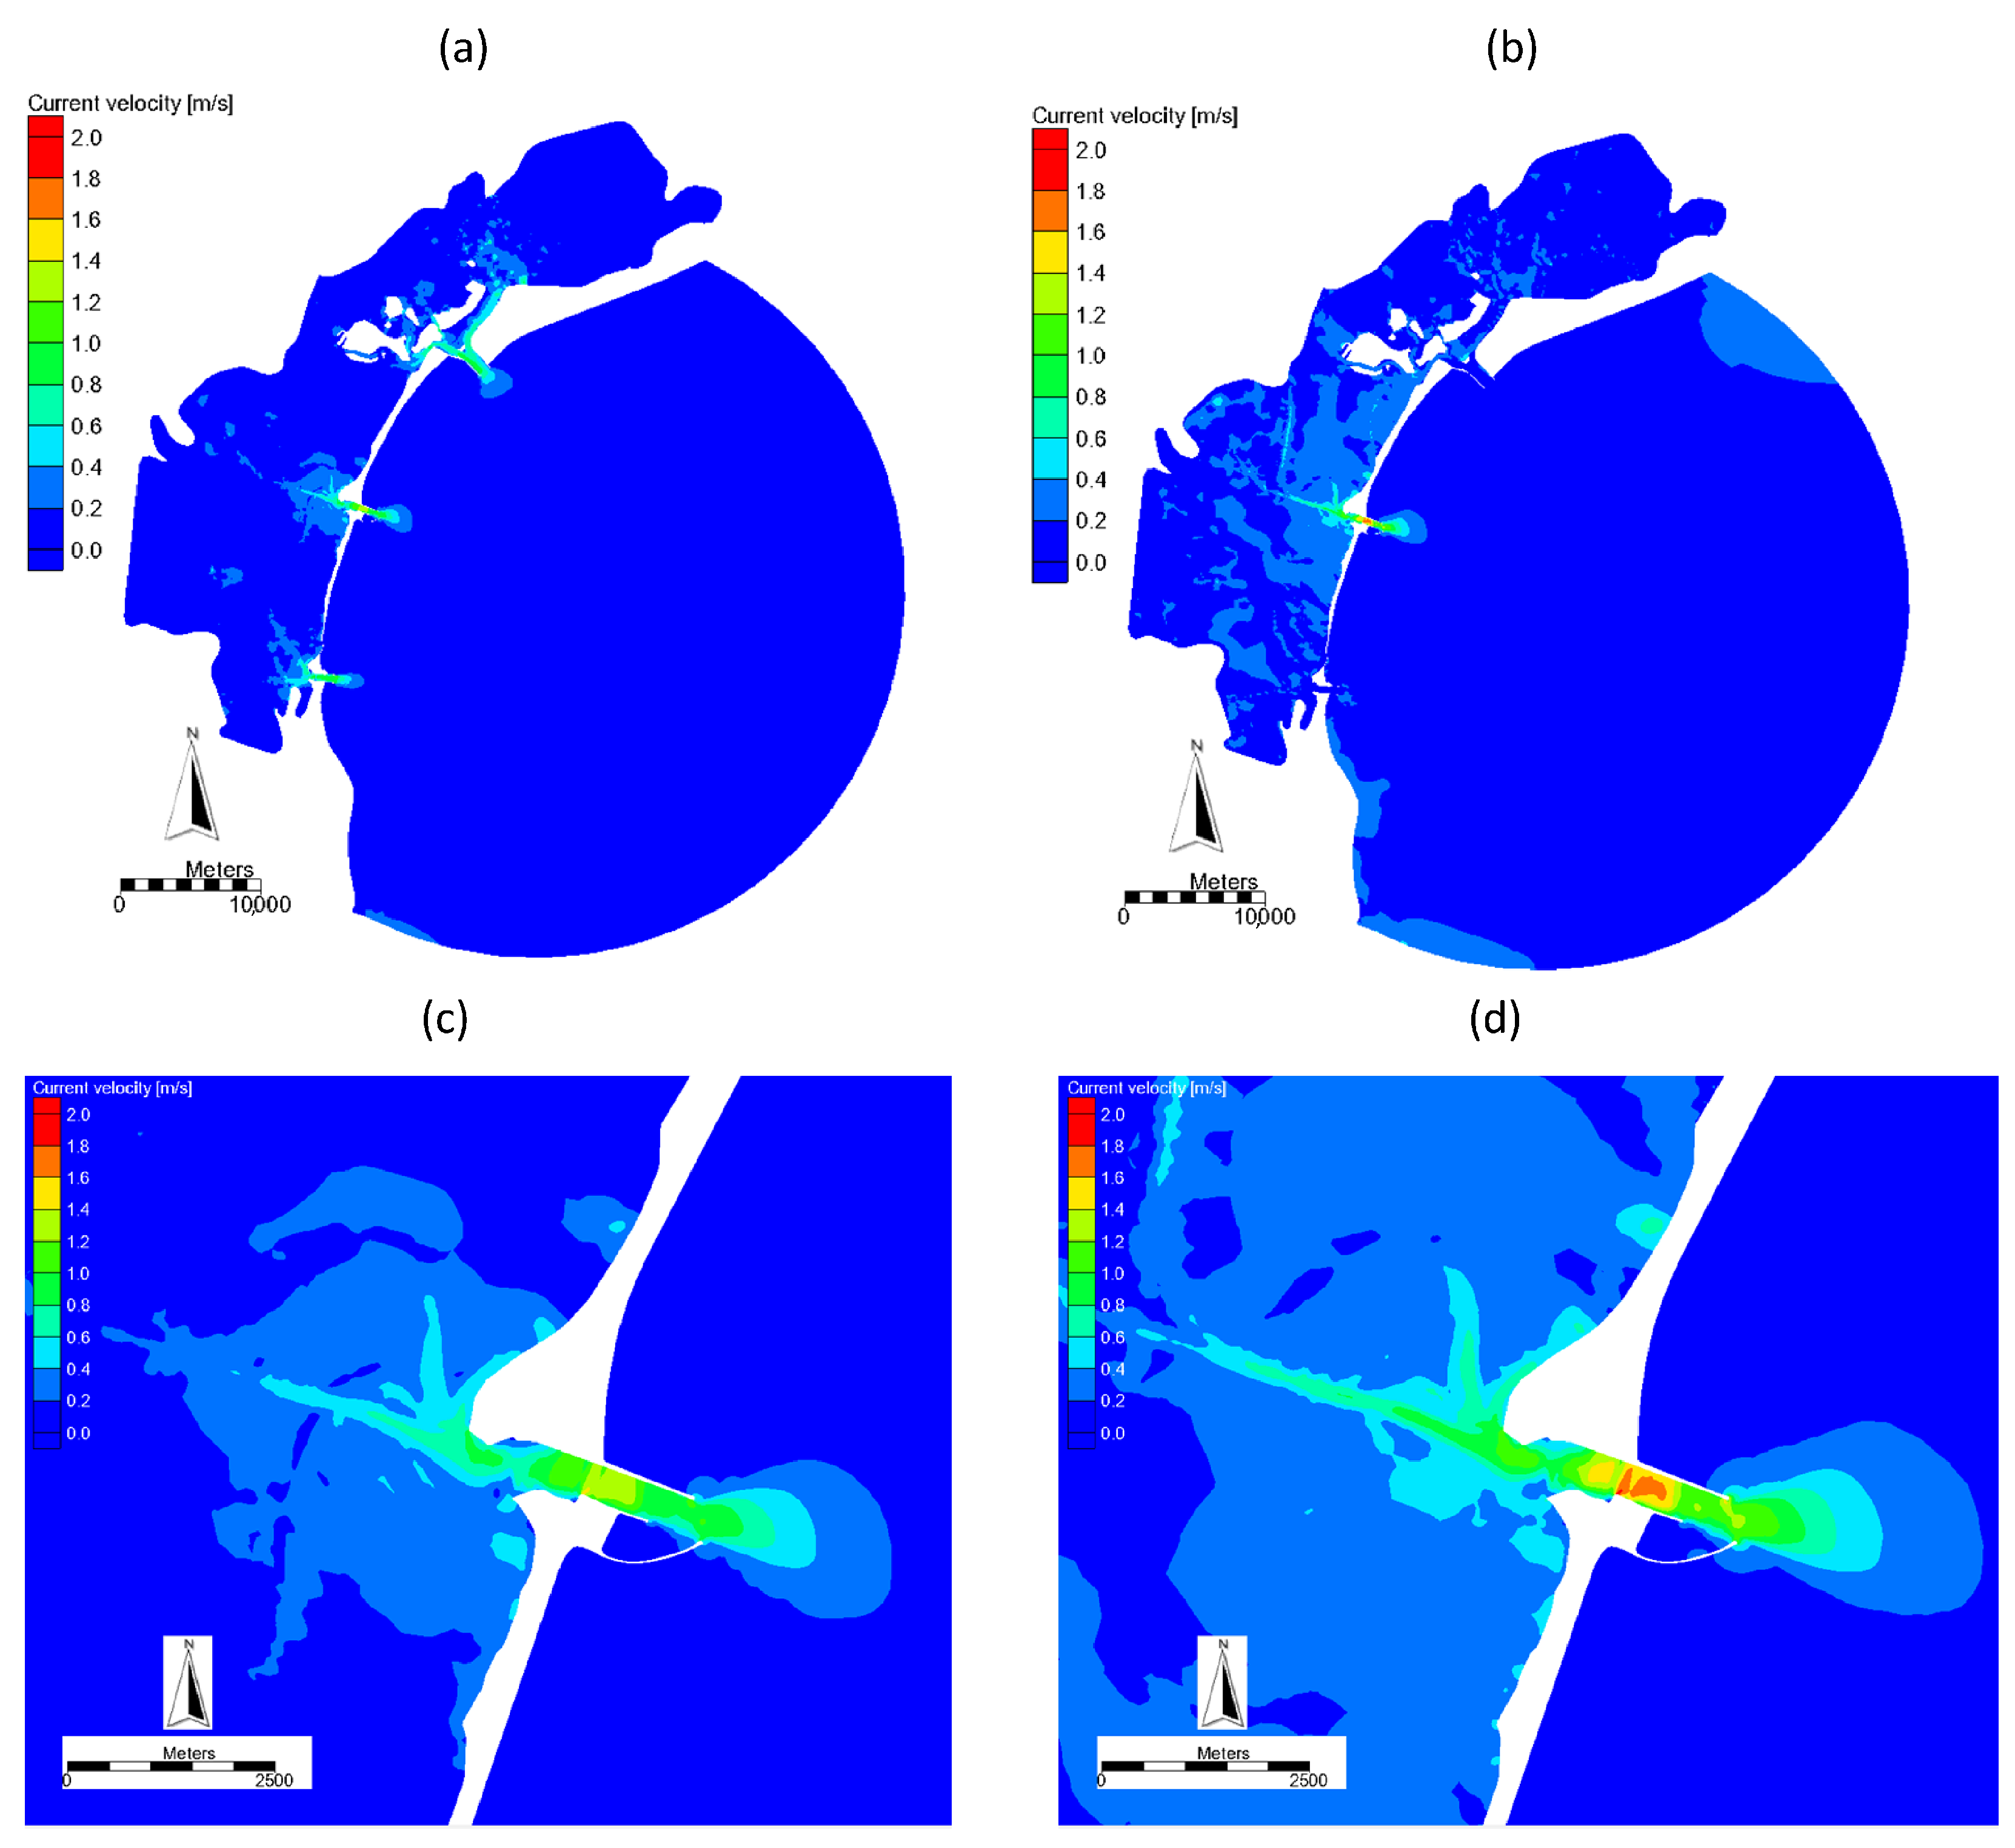
For the event of 19 November 2010, Figure 20 shows the maximum current velocity estimated both for the case with flood barriers open and for the case with the barriers of Lido and Chioggia closed. In the Malamocco channel, the comparison showed that the difference between the maximum velocity in the two cases was about 0.2 m s.
6. Discussion and Conclusions
In order to reduce the interference between the MoSE system and the maritime traffic in the Venice lagoon during the flooding events characterized by a non-extreme water level, one of the three inlets can be left open so as to ensure the transit of vessels.
Such solutions require a change of the current barrier closure criteria. In this regard, this paper has presented the results of a numerical investigation in which the partial use of the MoSE is simulated. Several events characterized by different meteorological conditions were simulated.
The partial closure of the MoSE can be adopted for all the events with a maximum water level of less than 130 cm MZPS, which represents about 85% of the total events. However, a variation of the current MoSE closing criteria is required. In particular, for the event of 19 November 2010, characterized by a low wind velocity (less than 2 m/s), an acceptable safety margin between the safeguarding level and the maximum water level was reached with a closing level of between 80 cm and 60 cm MZPS. For the event of 26 December 2013, characterized by a wind velocity of 13 m/s blowing from the direction 128N, a low safety margin was observed, adopting a closing water level of 60 cm MZPS. For the event of 22 November 2010, an acceptable safety margin was reached adopting a closing level in the range between 40 cm and 60 cm MZPS. This event was characterized by a wind velocity decreasing from 10.9 m/s to 2.4 m/s and a wind direction close to 41N. An acceptable safety margin for the event of 8 February 2009, characterized by a wind velocity of less than 5 m/s blowing from the land to the sea (direction in the range 255 and 330°N), was reached adopting a closing level between 80 cm and 60 cm MZPS.
The partial closure of the MoSE for the events with a maximum water level greater than 130 cm MZPS would not seem feasible. For such events, the safeguarding level is always exceeded, except for the event of 24 December 2009. However, a low safety margin was observed for this case.
On the basis of the results analyzed here, for the events characterized by a maximum water level of less than 130 cm MZPS and a low wind velocity of less than 5 m/s, the partial closure of the MoSE can be adopted. However, it would seem that the appropriate closure level is not easy to define, and more complex rules have to be adopted. In more detail, as a result of the forecasting data and the long periods of computational time available today, the decision to rise the gates could be taken by analyzing the results of numerical simulations carried out considering several closure thresholds.
With regard to the current velocity in the Malamocco channel, the partial closure of the MoSE seems to have no significant effects compared to the case in which the flood barriers are open. For the simulated events, a maximum difference of 20–25% between the case with the flood barriers open and the case with the barriers of Lido and Chioggia closed was estimated.
The results presented here have demonstrated that the partial closure of the MoSE can be adopted under specific meteorological conditions, although this must be confirmed by means of field tests. Given the high variability of meteorological events, powerful forecasting numerical models are required to determine whether the partial closure of the MoSE is possible and to define a suitable closure level of the flood barriers. The same method could be applied in other coastal areas vulnerable to marine flooding, such as the lagoons located in New Jersey, Santa Rosa Island, and in the Gulf of Aigues-Mortes [22].
Acknowledgments
The authors gratefully acknowledge the Ministero delle Infrastrutture e dei Trasporti–Provveditorato Interregionale alle OO. PP del Veneto–Trentino Alto Adige–Friuli Venezia Giulia for providing the bathymetric data of the Venetian lagoon.
Author Contributions
Luca Cavallaro and Claudio Iuppa contributed to the work described in this paper by carrying out the numerical simulations and analyzing the estimated data. Enrico Foti contributed with knowledgeable discussions and suggestions. All of the co-authors participated in the writing of the paper.
Conflicts of Interest
The authors declare no conflict of interest.
References
- Fletcher, C.A.; Spencer, T. Flooding and Environmental Challenges for Venice and Its Lagoon: State of Knowledge; Cambridge University Press: Cambridge, UK, 2005. [Google Scholar]
- Umgiesser, G.; Canu, D.M.; Cucco, A.; Solidoro, C. A finite element model for the Venice Lagoon. Development, set up, calibration and validation. J. Mar. Syst. 2004, 51, 123–145. [Google Scholar] [CrossRef]
- Carniello, L.; Defina, A.; Fagherazzi, S.; D’alpaos, L. A combined wind wave-tidal model for the Venice lagoon, Italy. J. Geophys. Res. Earth Surf. 2005, 110. [Google Scholar] [CrossRef]
- D’Alpaos, L.; Defina, A. Mathematical modeling of tidal hydrodynamics in shallow lagoons: A review of open issues and applications to the Venice lagoon. Comput. Geosci. 2007, 33, 476–496. [Google Scholar] [CrossRef]
- Lovato, T.; Androsov, A.; Romanenkov, D.; Rubino, A. The tidal and wind induced hydrodynamics of the composite system Adriatic Sea/Lagoon of Venice. Cont. Shelf Res. 2010, 30, 692–706. [Google Scholar] [CrossRef]
- Bajo, M.; Zampato, L.; Umgiesser, G.; Cucco, A.; Canestrelli, P. A finite element operational model for storm surge prediction in Venice. Estuar. Coast. Shelf Sci. 2007, 75, 236–249. [Google Scholar] [CrossRef]
- Roland, A.; Cucco, A.; Ferrarin, C.; Hsu, T.; Liau, J.; Ou, S.; Umgiesser, G.; Zanke, U. On the development and verification of a 2-D coupled wave-current model on unstructured meshes. J. Mar. Syst. 2009, 78, S244–S254. [Google Scholar] [CrossRef]
- Ferla, M.; Rusconi, A. The storm surge event 921208 in the Venice lagoon. In Proceedings of the Atti del XXIV Convegno di Idraulica e Costruzioni Idrauliche, Naples, Italy, 20–22 September 1994; pp. 20–22. [Google Scholar]
- Zecchetto, S.; Umgiesser, G.; Brocchini, M. Hindcast of a storm surge induced by local real wind fields in the Venice Lagoon. Cont. Shelf Res. 1997, 17, 1513–1538. [Google Scholar] [CrossRef]
- Brambati, A.; Carbognin, L.; Quaia, T.; Teatini, P.; Tosi, L. The Lagoon of Venice: Geological setting, evolution and land subsidence. Episodes 2003, 26, 264–268. [Google Scholar]
- Carbognin, L.; Teatini, P.; Tosi, L. Eustacy and land subsidence in the Venice Lagoon at the beginning of the new millennium. J. Marine Syst. 2004, 51, 345–353. [Google Scholar] [CrossRef]
- Gatto, P.; Carbognin, L. The Lagoon of Venice: Natural environmental trend and man-induced modification/La Lagune de Venise: L’évolution naturelle et les modifications humaines. Hydrol. Sci. J. 1981, 26, 379–391. [Google Scholar] [CrossRef]
- Trincardi, F.; Barbanti, A.; Bastianini, M.; Benetazzo, A.; Cavaleri, L.; Chiggiato, J.; Papa, A.; Pomaro, A.; Sclavo, M.; Tosi, L.; et al. The 1966 flooding of Venice: What time taught us for the future. Oceanography 2016, 29, 178–186. [Google Scholar] [CrossRef]
- Commission, I.N.; Secretariat, P.G.; Association, I.N. Innovations in Navigation Lock Design; The World Association for Waterborne Transport Infrastructure (PIANC): Brussels, Belgium, 2009; Volume 106. [Google Scholar]
- Eprim, Y.; Donato, M.D.; Cecconi, G. Gates strategies and storm surge forecasting system developed for the Venice flood management. In Flooding and Environmental Challenges for Venice and Its Lagoon: State of Knowledge; Cambridge University Press: Cambridge, UK, 2005; pp. 267–277. [Google Scholar]
- Luettich, R.A.; Westerink, J.J. A solution for the vertical variation of stress, rather than velocity, in a three-dimensional circulation model. Int. J. Numer. Methods Fluids 1991, 12, 911–928. [Google Scholar] [CrossRef]
- Luettich, R.A., Jr.; Westerink, J.J.; Scheffner, N.W. ADCIRC: An Advanced Three-Dimensional Circulation Model for Shelves, Coasts, and Estuaries; Report 1. Theory and Methodology of ADCIRC-2DDI and ADCIRC-3DL; Technical Report; Coastal Engineering Research Center: Vicksburg, MS, USA, 1992. [Google Scholar]
- Westerink, J.J.; Luettich, R., Jr.; Scheffner, N. ADCIRC: An Advanced Three-Dimensional Circulation Model for Shelves, Coasts, and Estuaries; Report 3. Development of a Tidal Constituent DataBase for the Western North Atlantic and Gulf of Mexico; Technical Report; Coastal Engineering Research Center: Vicksburg, MS, USA, 1993. [Google Scholar]
- Kolar, R.; Gray, W.; Westerink, J.; Luettich, R., Jr. Shallow water modeling in spherical coordinates: Equation formulation, numerical implementation, and application. J. Hydraul. Res. 1994, 32, 3–24. [Google Scholar] [CrossRef]
- Kolar, R.; Westerink, J.; Cantekin, M.; Blain, C. Aspects of nonlinear simulations using shallow-water models based on the wave continuity equation. Comput. Fluids 1994, 23, 523–538. [Google Scholar] [CrossRef]
- Institute for Environmental Protection and Research Website. 2017. Available online: http://www.venezia.isprambiente.it (accessed on 2 October 2017).
- Chaumillon, E.; Bertin, X.; Fortunato, A.B.; Bajo, M.; Schneider, J.; Dezileau, L.; Walsh, J.P.; Michelot, A.; Chauveau, E.; Créach, A.; et al. Storm-induced marine flooding: Lessons from a multidisciplinary approach. Earth-Sci. Rev. 2017, 165, 151–184. [Google Scholar] [CrossRef]
Figure 1.
Venice lagoon: localization of the main lagoon town, of the industrial and commercial port of Venice, of the three lagoon inlets and of the Punta Salute water-level station (figure processed from Google Earth, 2017).
Figure 1.
Venice lagoon: localization of the main lagoon town, of the industrial and commercial port of Venice, of the three lagoon inlets and of the Punta Salute water-level station (figure processed from Google Earth, 2017).

Figure 2.
Locks at the lagoon inlets: (a) Lido, (b) Malamocco, and (c) Chioggia. Point A is used for the analysis described in the following sections (figures processed from Google Earth, 2017).
Figure 2.
Locks at the lagoon inlets: (a) Lido, (b) Malamocco, and (c) Chioggia. Point A is used for the analysis described in the following sections (figures processed from Google Earth, 2017).

Figure 3.
The four subclasses of Class 1 (C1).

Figure 4.
Detrended water level measured at Punta della Salute station. The acronym MZPS indicates that the water level is referred to the Mareographic Reference of Punta della Salute.
Figure 4.
Detrended water level measured at Punta della Salute station. The acronym MZPS indicates that the water level is referred to the Mareographic Reference of Punta della Salute.
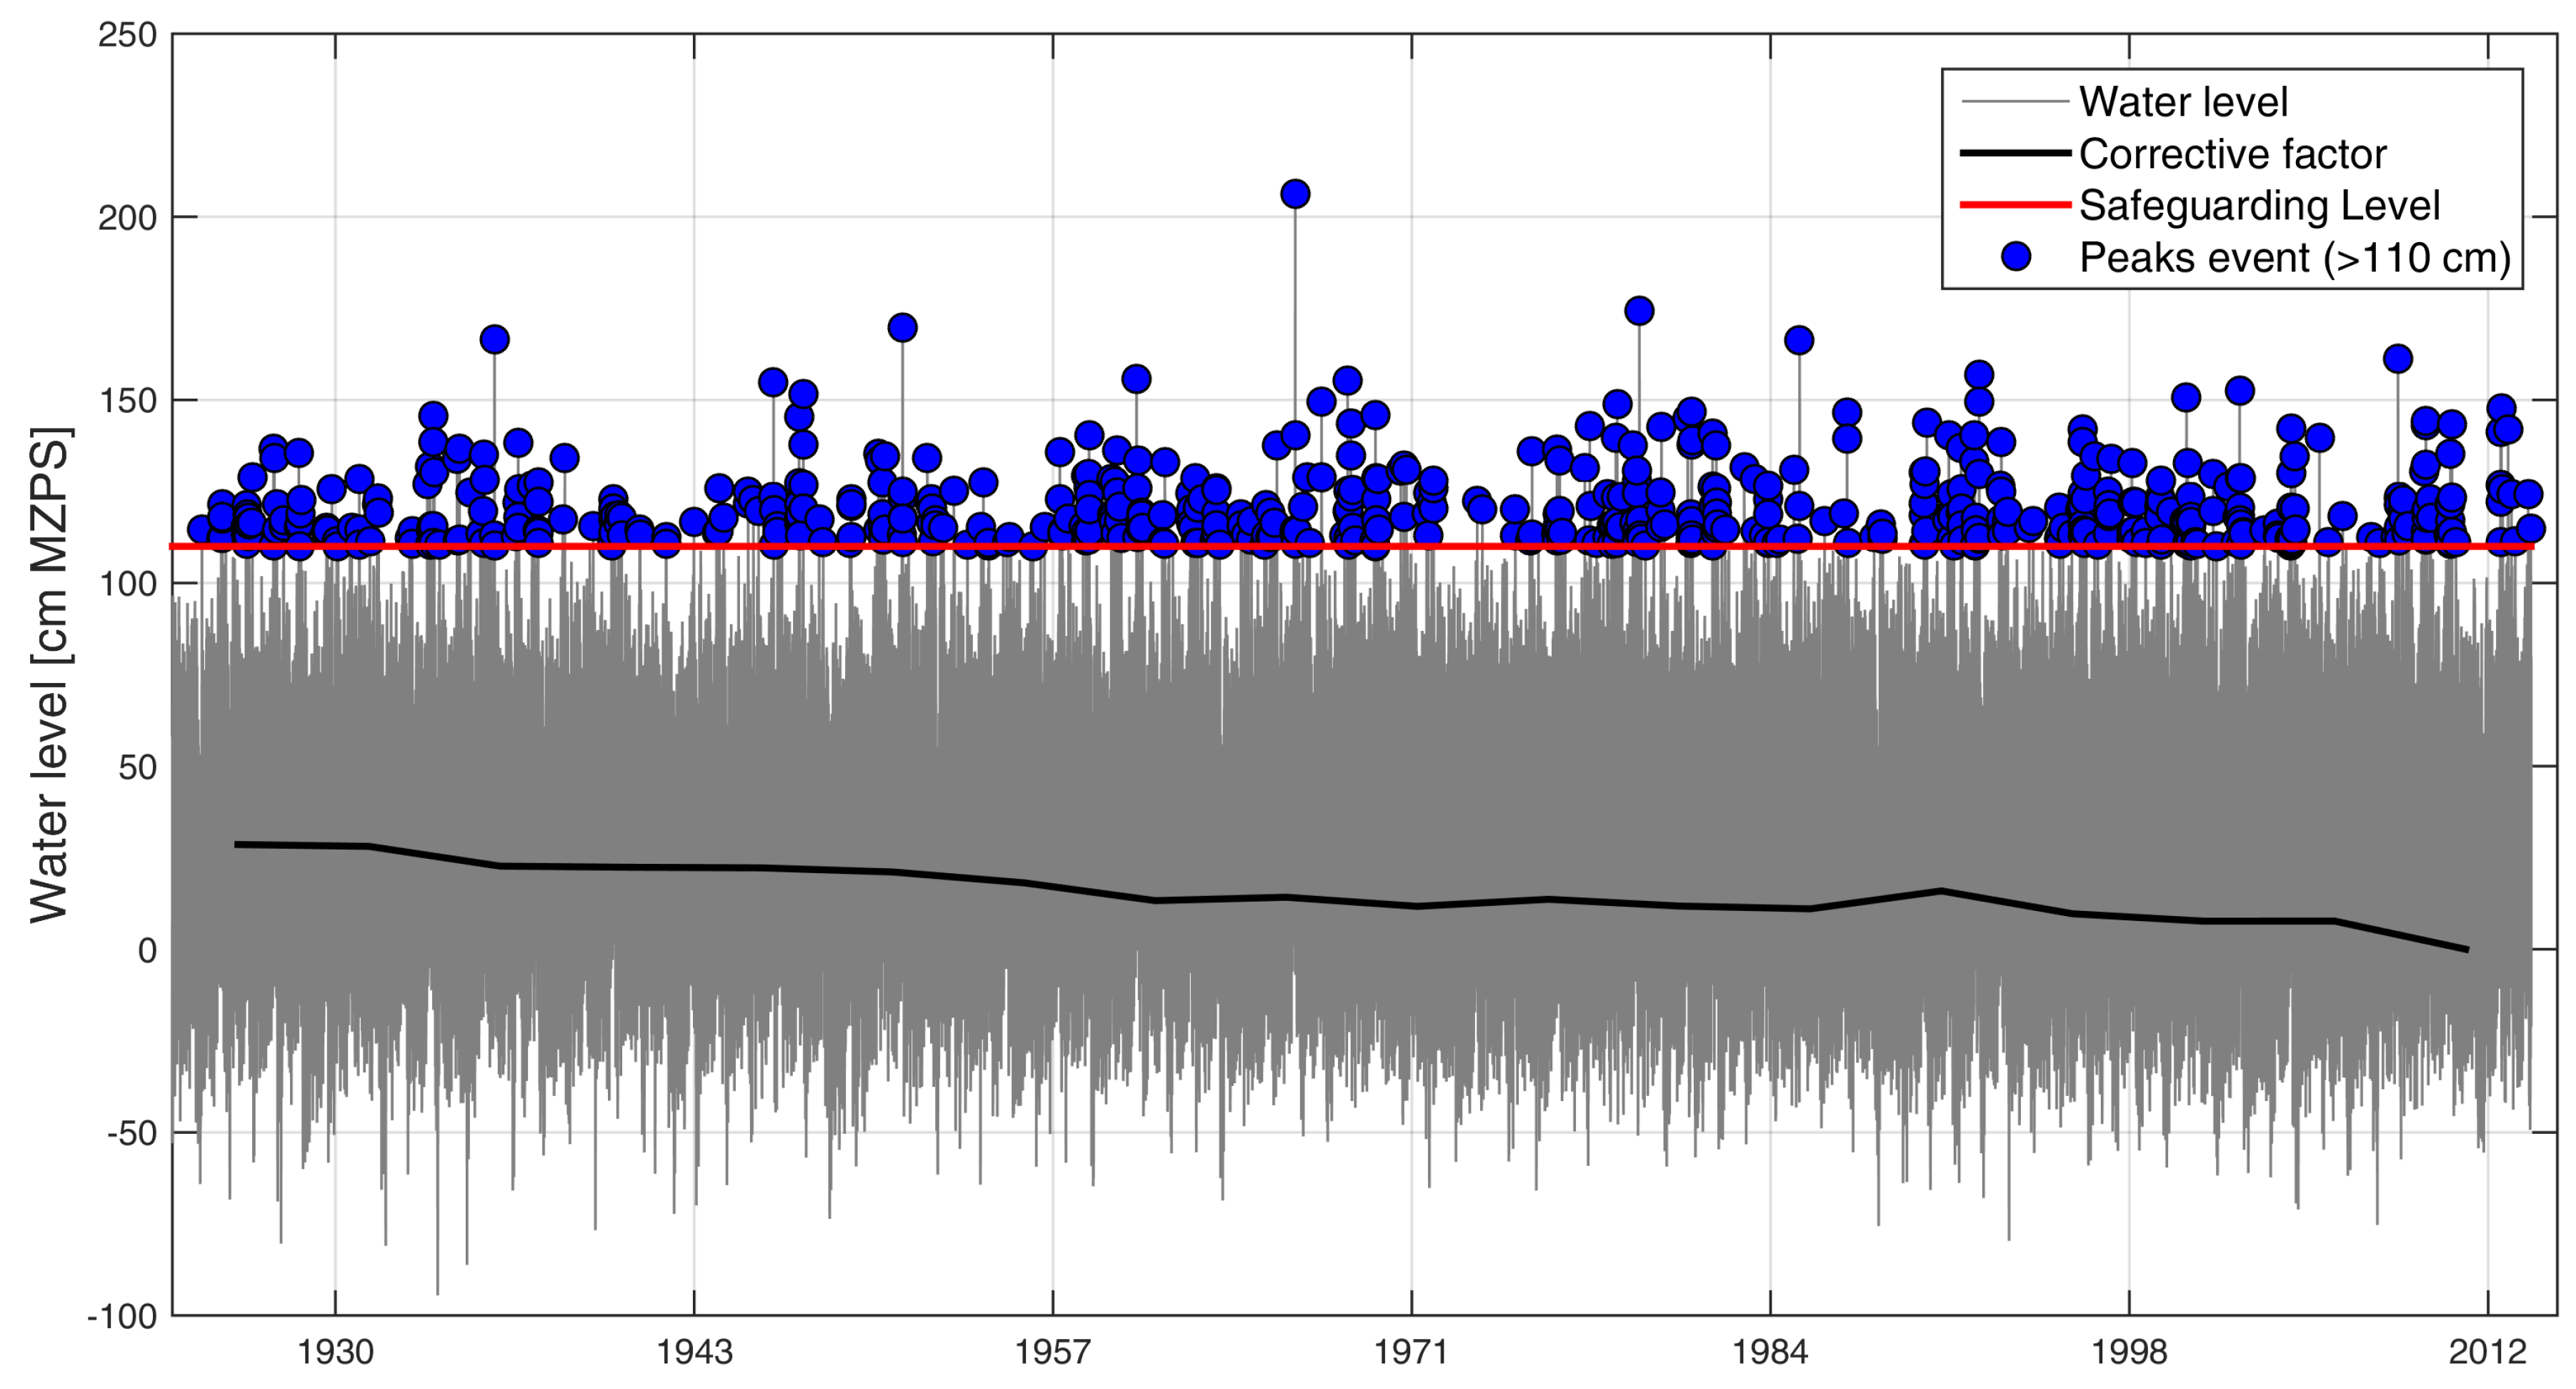
Figure 5.
Water levels as measured at Punta della Salute station: distribution of the number of events characterized by a peak value of >110 cm MZPS (Mareographic Reference of Punta della Salute).
Figure 5.
Water levels as measured at Punta della Salute station: distribution of the number of events characterized by a peak value of >110 cm MZPS (Mareographic Reference of Punta della Salute).

Figure 6.
Numerical model set-up: (a) Locations of the sea level stations: Aqua Alta oceanographic tower, Punta della Salute, Faro Rocchetta, and Chioggia Vigo; (b) adopted numerical grid; (c) details of the numerical grid in the Malamocco inlet; (d) bottom depth inside the numerical domain.
Figure 6.
Numerical model set-up: (a) Locations of the sea level stations: Aqua Alta oceanographic tower, Punta della Salute, Faro Rocchetta, and Chioggia Vigo; (b) adopted numerical grid; (c) details of the numerical grid in the Malamocco inlet; (d) bottom depth inside the numerical domain.

Figure 7.
Event of November 23, 2007. Comparison between the observed values and the water level estimated by advanced circulation (ADCIRC) adopting three values of : (a) Punta della Salute; (b) Faro Rocchetta; (c) Chioggia Vigo. The acronym MZPS indicates that the water level is referred to the Mareographic Reference of Punta della Salute.
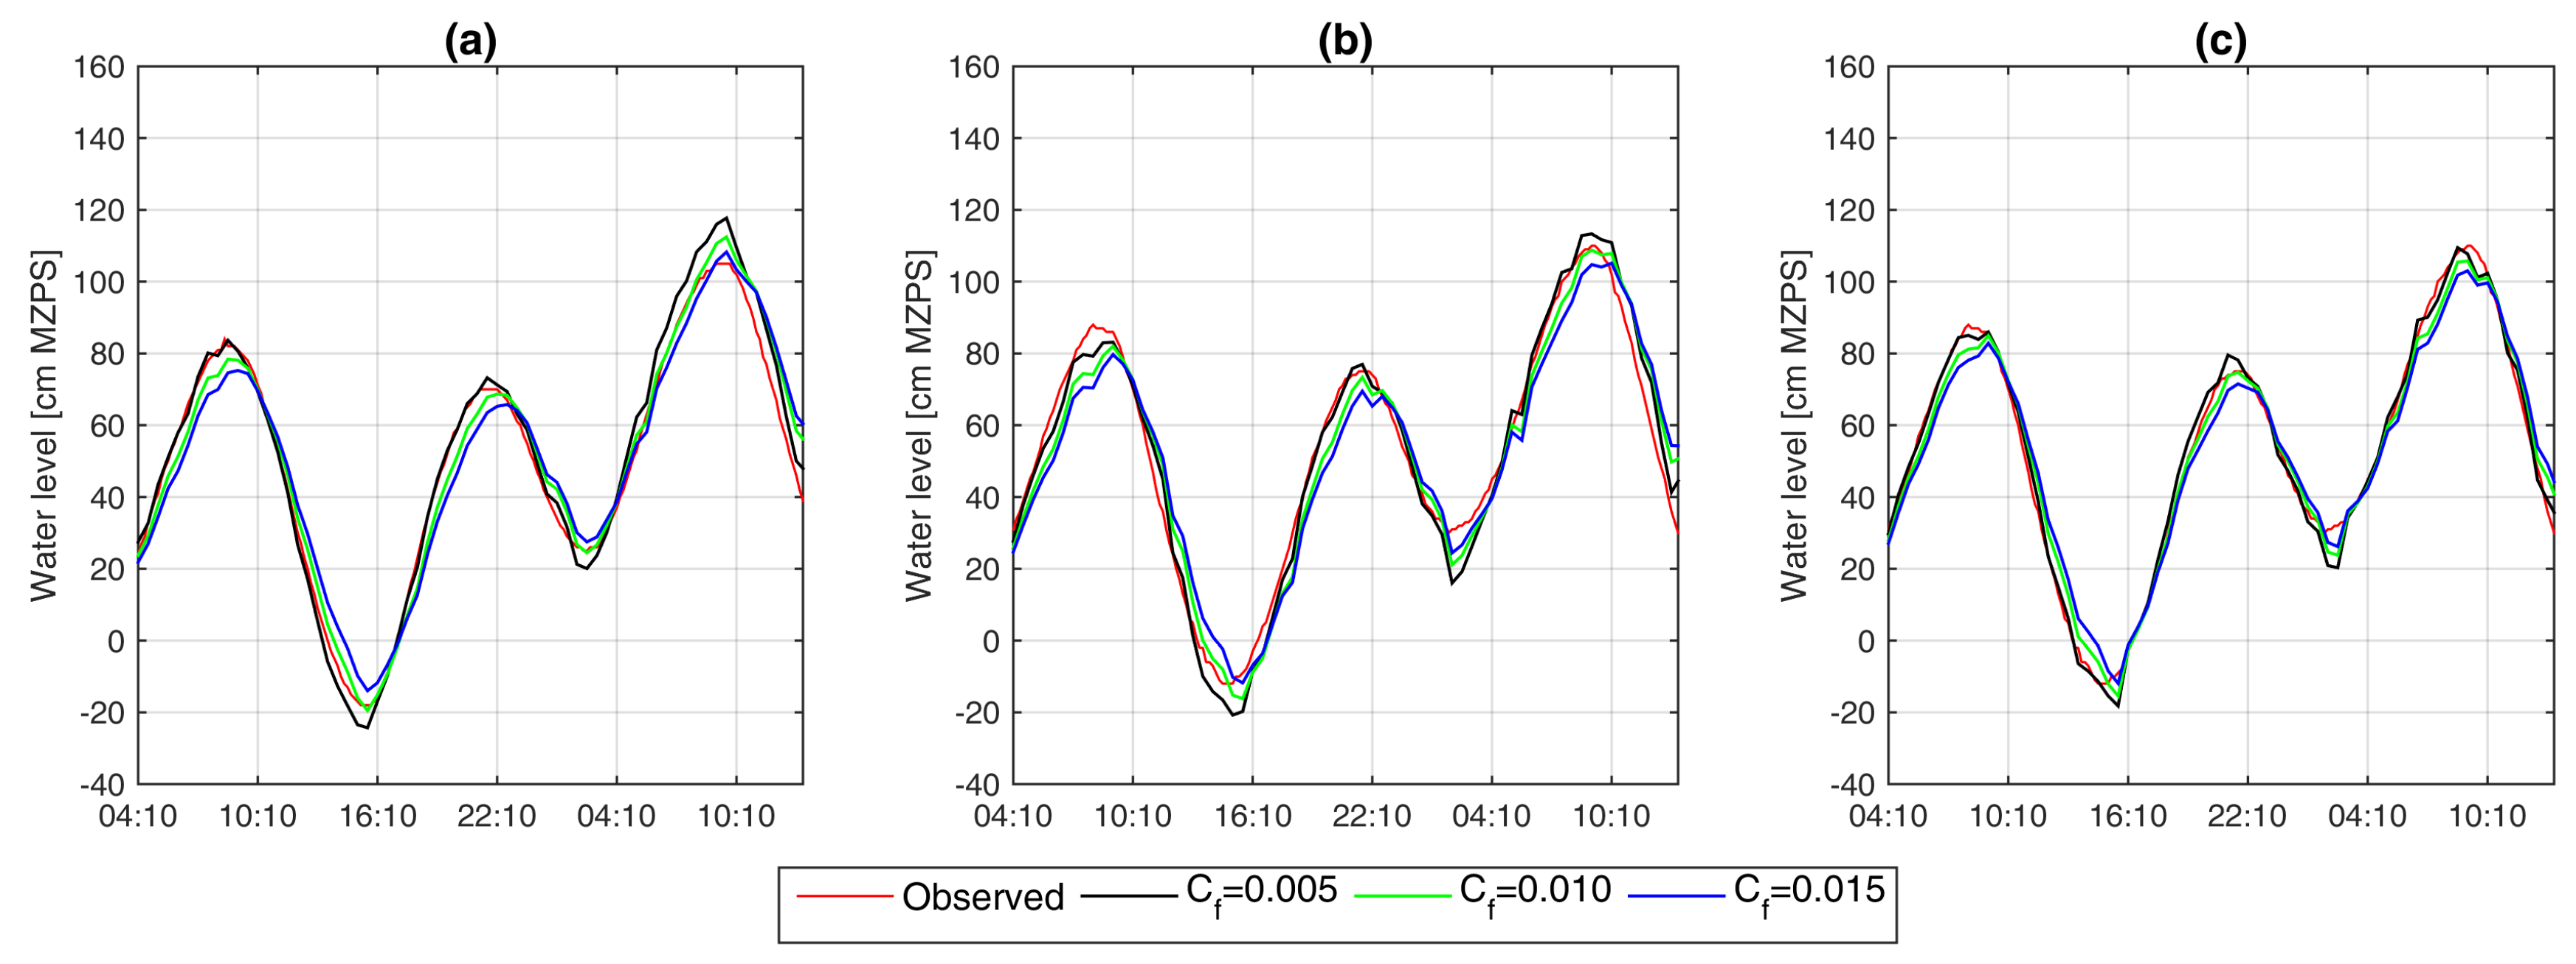
Figure 8.
Event of December 1, 2008. Comparison between the observed values and the water level estimated by advanced circulation (ADCIRC) adopting three values of : (a) Punta della Salute; (b) Faro Rocchetta; (c) Chioggia Vigo. The acronym MZPS indicates that the water level is referred to the Mareographic Reference of Punta della Salute.
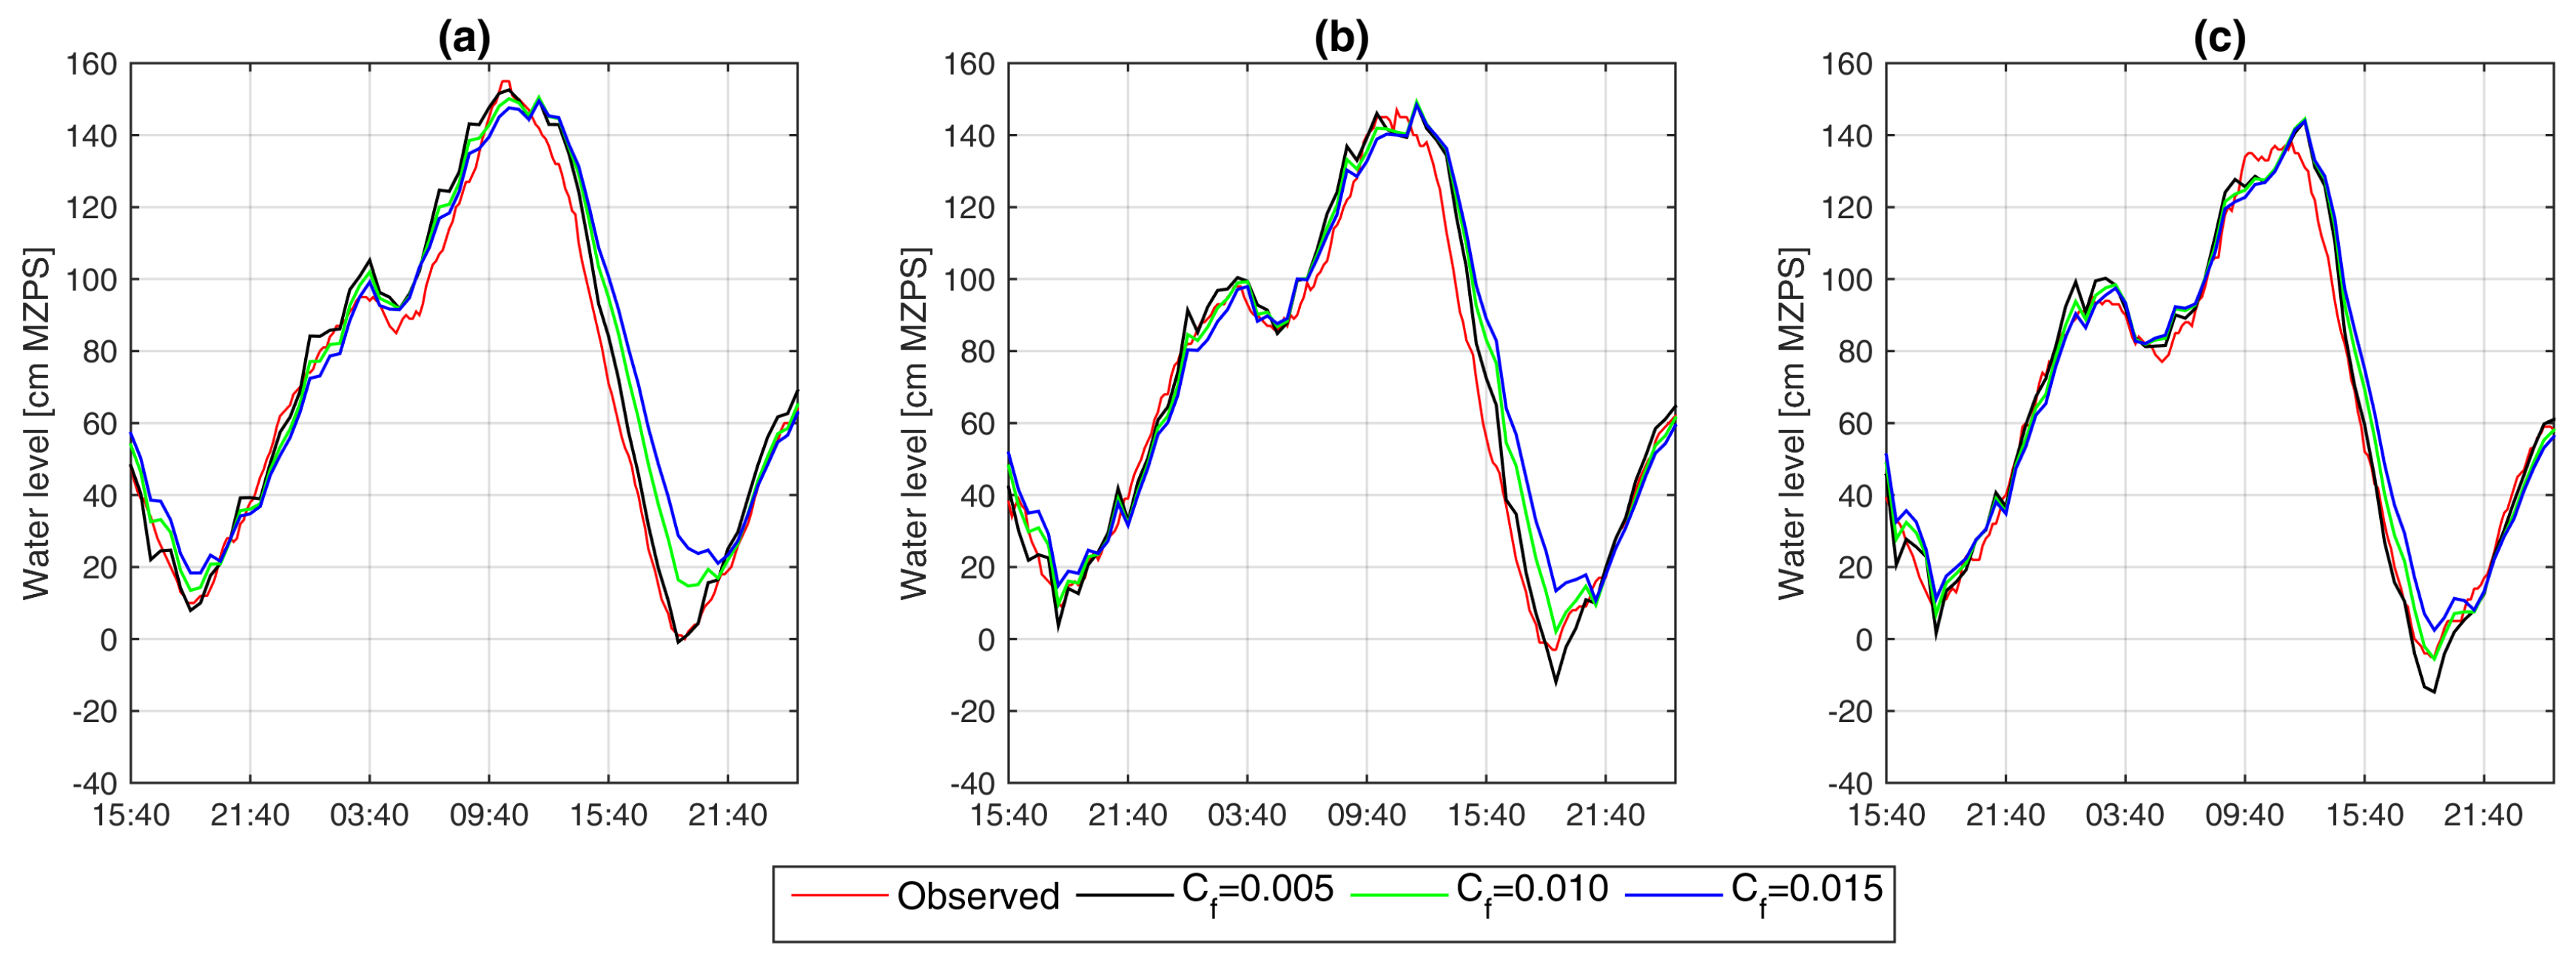
Figure 9.
Average difference () of the water levels observed for different values of during the event of November 23, 2007: (a) comparison between = 0.01 and = 0.005; (b) comparison between = 0.015 and = 0.005; (c) comparison between = 0.015 and = 0.01.
Figure 9.
Average difference () of the water levels observed for different values of during the event of November 23, 2007: (a) comparison between = 0.01 and = 0.005; (b) comparison between = 0.015 and = 0.005; (c) comparison between = 0.015 and = 0.01.

Figure 10.
Average difference () of the water levels observed for different values of during the event of December 1, 2008: (a) comparison between = 0.01 and = 0.005; (b) comparison between = 0.015 and = 0.005; (c) comparison between = 0.015 and = 0.01.
Figure 10.
Average difference () of the water levels observed for different values of during the event of December 1, 2008: (a) comparison between = 0.01 and = 0.005; (b) comparison between = 0.015 and = 0.005; (c) comparison between = 0.015 and = 0.01.

Figure 11.
Boundary conditions for the events of 19 November 2010 and 26 December 2013: (i) water level; (ii) wind velocity; (iii) wind direction; (iv) pressure. The acronym MZPS indicates that the water level is referred to the Mareographic Reference of Punta della Salute.
Figure 11.
Boundary conditions for the events of 19 November 2010 and 26 December 2013: (i) water level; (ii) wind velocity; (iii) wind direction; (iv) pressure. The acronym MZPS indicates that the water level is referred to the Mareographic Reference of Punta della Salute.
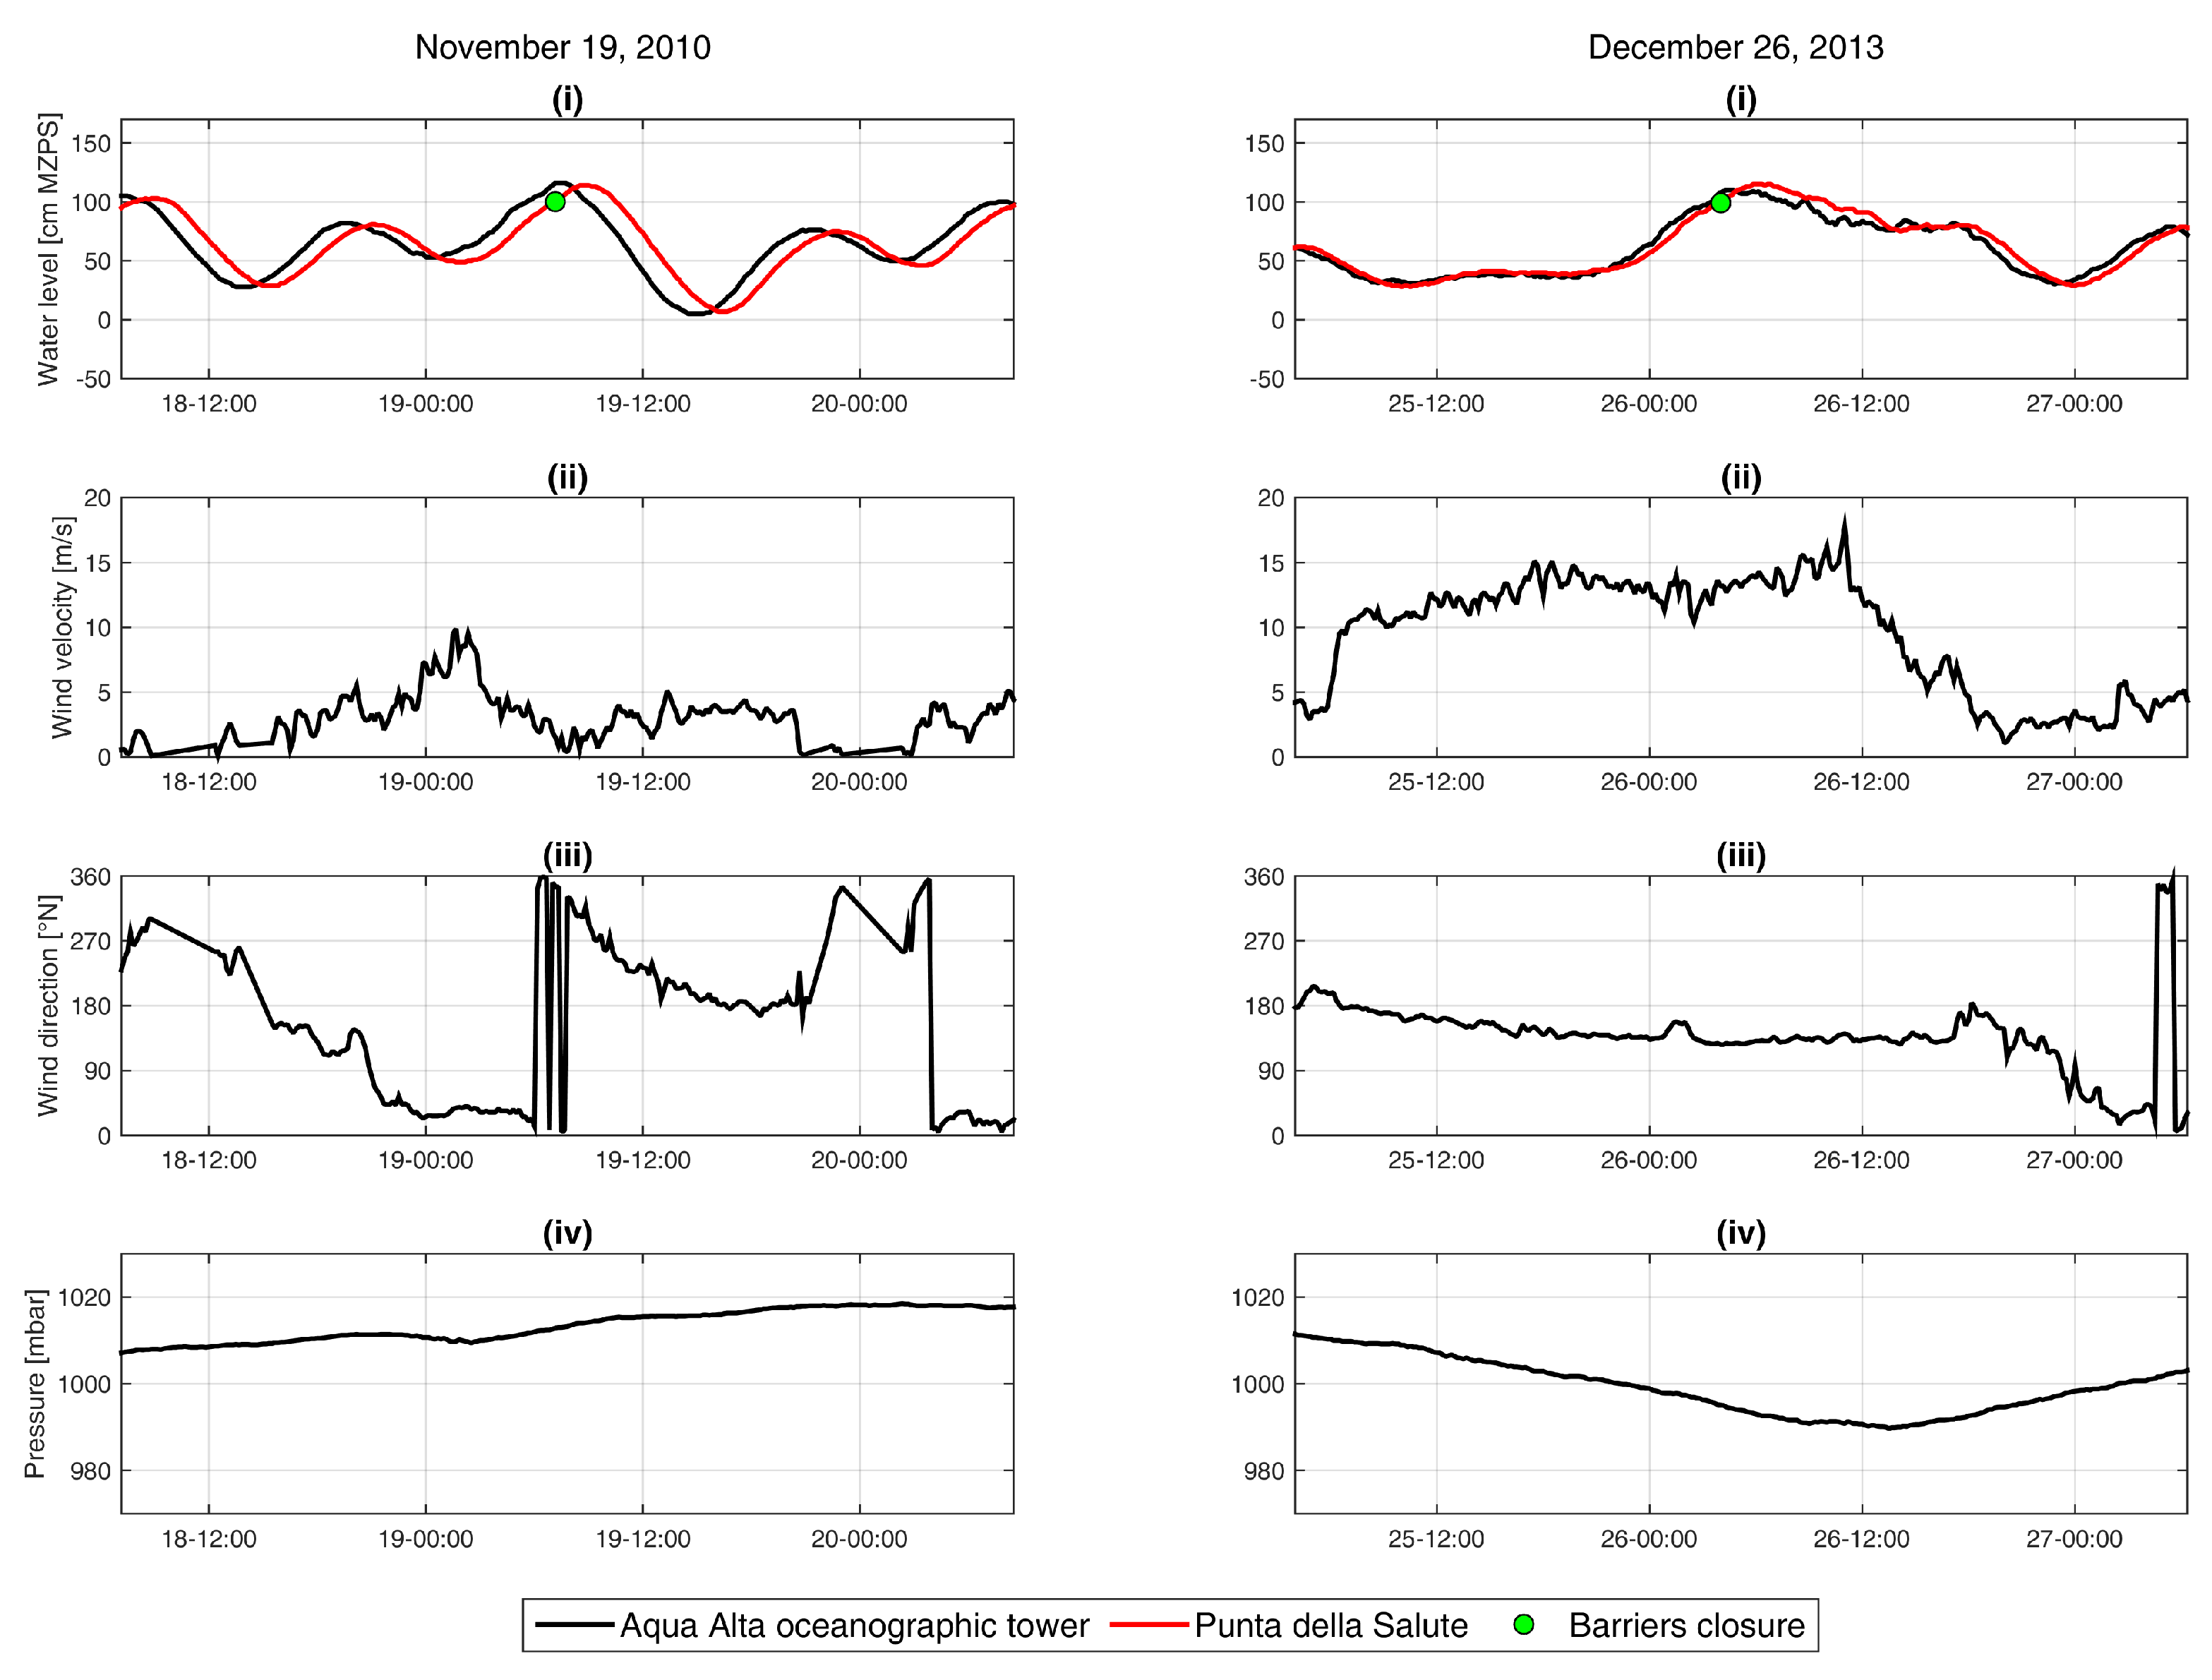
Figure 12.
Boundary conditions for the events of 22 November 2010 and 8 February 2009: (i) water level; (ii) wind velocity; (iii) wind direction; (iv) pressure. The acronym MZPS indicates that the water level is referred to the Mareographic Reference of Punta della Salute.
Figure 12.
Boundary conditions for the events of 22 November 2010 and 8 February 2009: (i) water level; (ii) wind velocity; (iii) wind direction; (iv) pressure. The acronym MZPS indicates that the water level is referred to the Mareographic Reference of Punta della Salute.
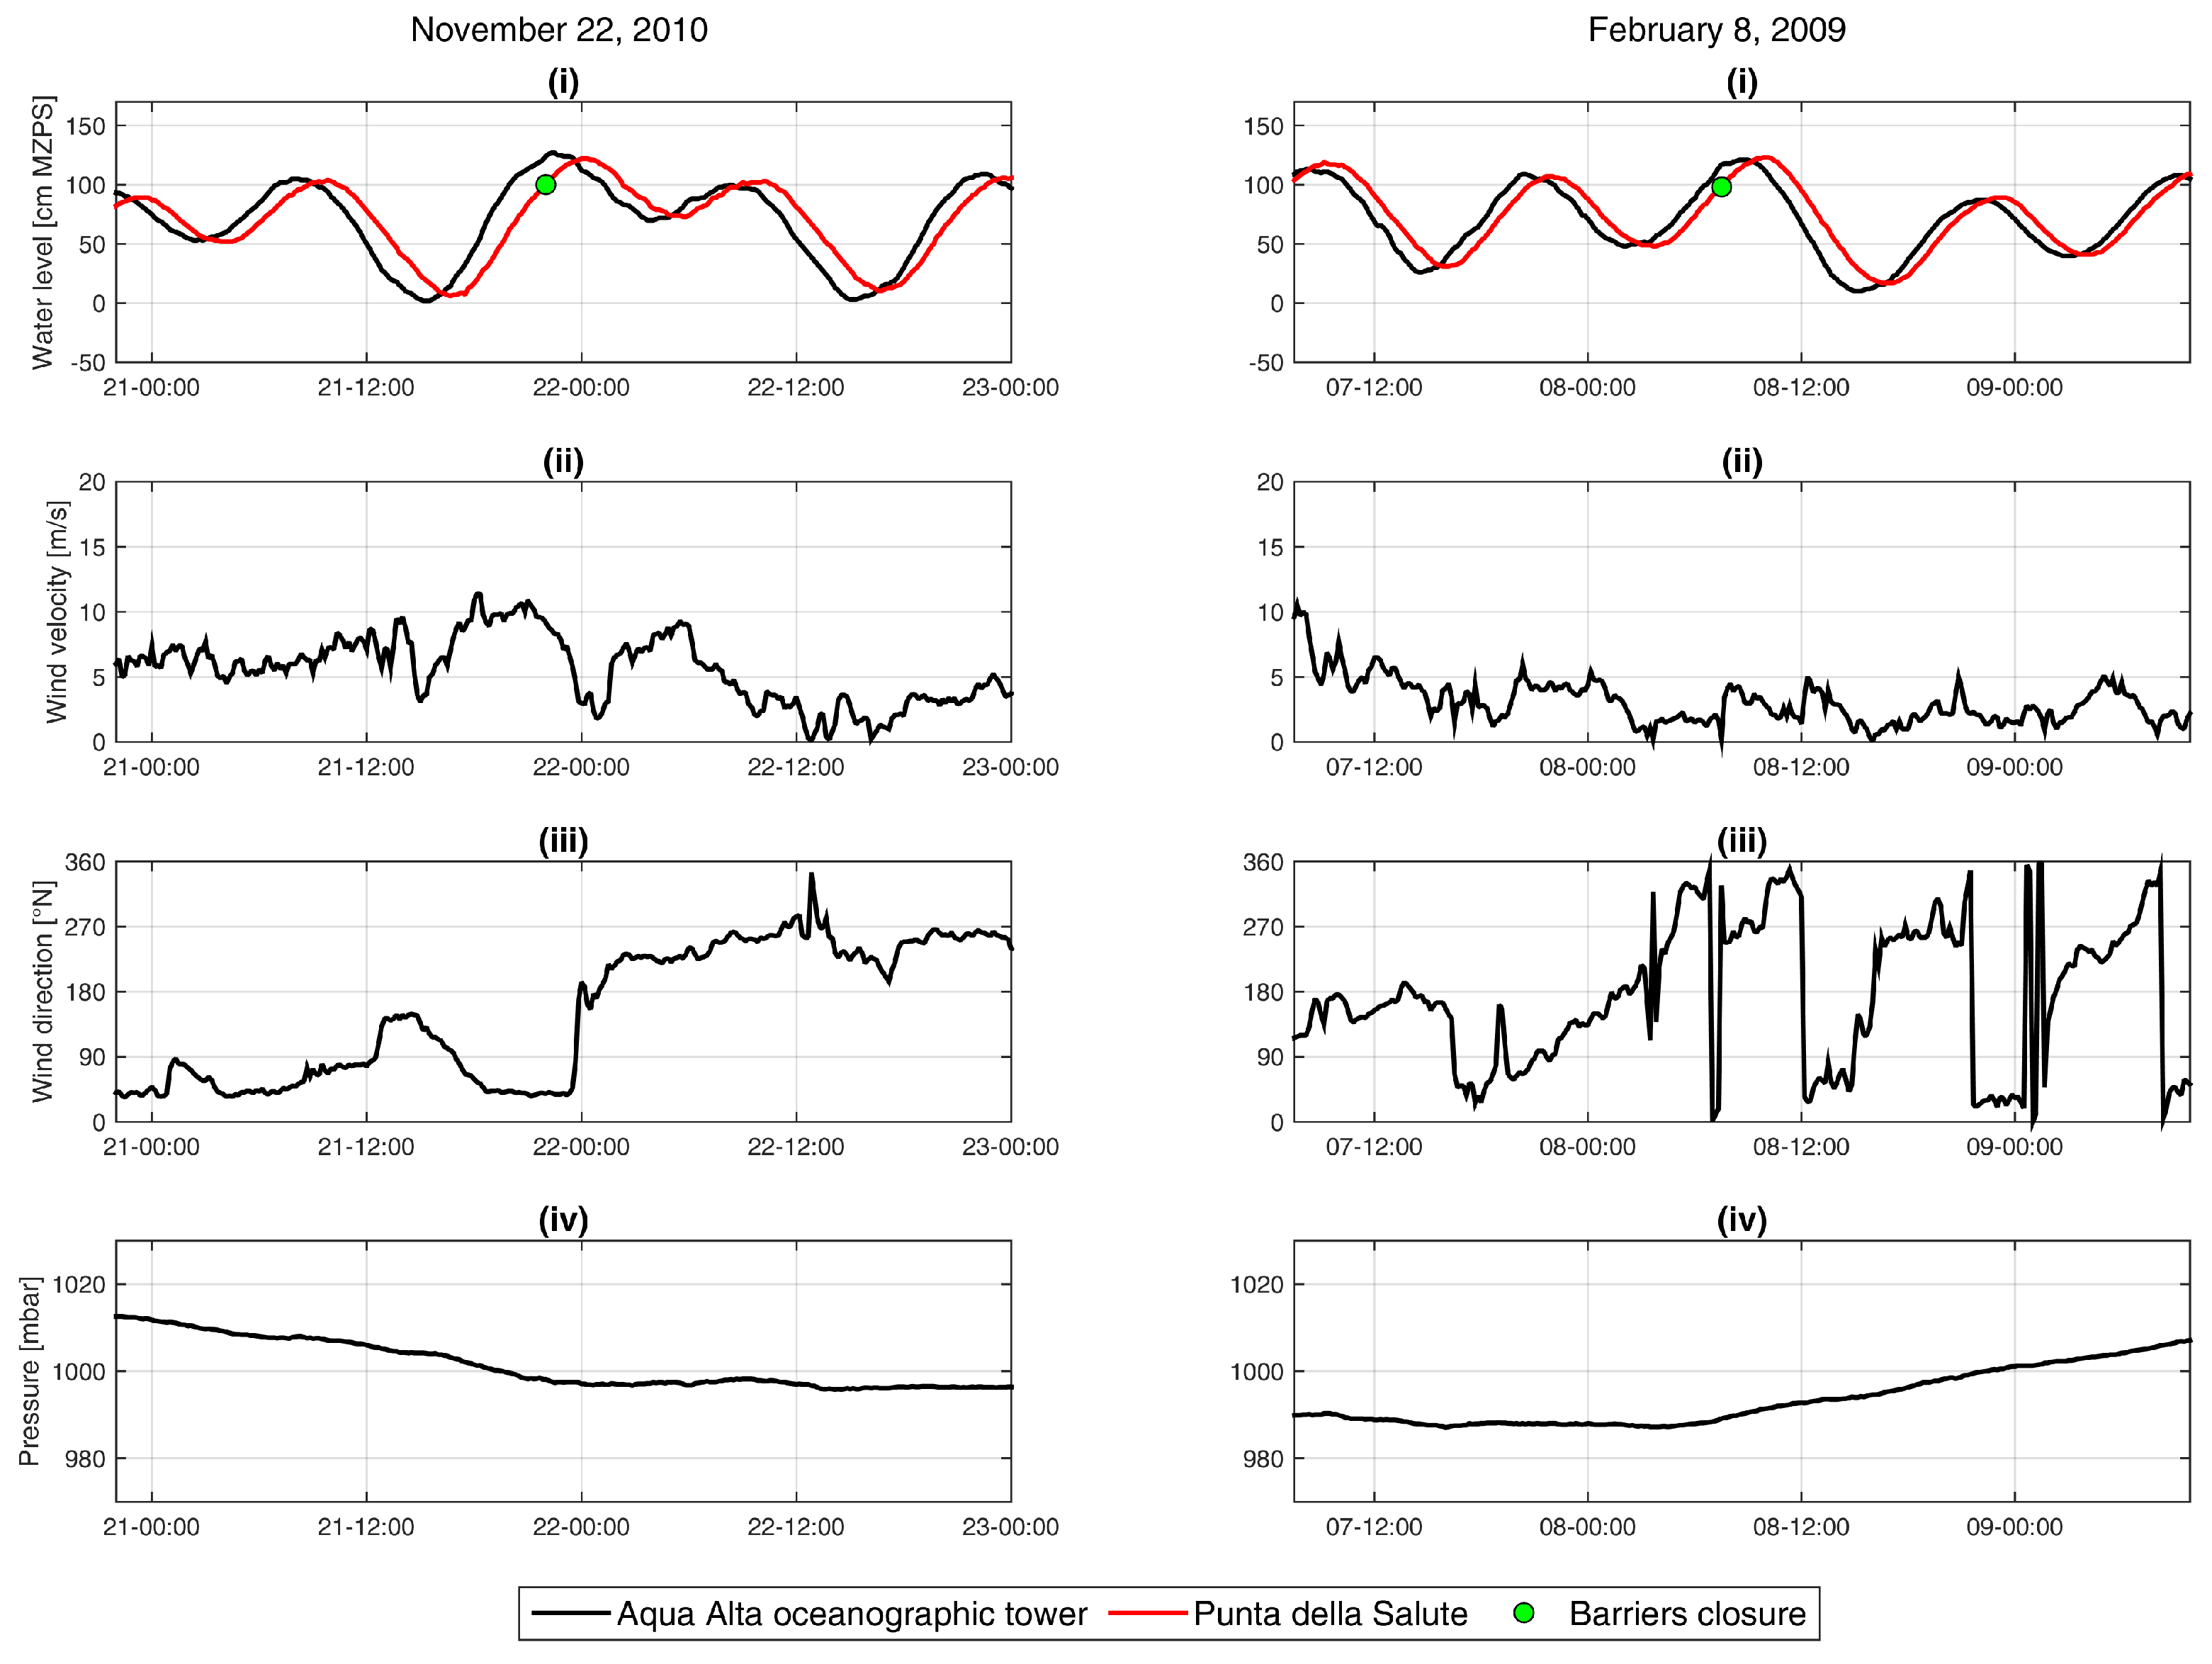
Figure 13.
Boundary conditions for the events of 30 November 2009 and 24 December 2009: (i) water level; (ii) wind velocity; (iii) wind direction; (iv) pressure. The acronym MZPS indicates that the water level is referred to the Mareographic Reference of Punta della Salute.
Figure 13.
Boundary conditions for the events of 30 November 2009 and 24 December 2009: (i) water level; (ii) wind velocity; (iii) wind direction; (iv) pressure. The acronym MZPS indicates that the water level is referred to the Mareographic Reference of Punta della Salute.

Figure 14.
Boundary conditions for the events of 12 February 2013 and 24 December 2010: (i) water level; (ii) wind velocity; (iii) wind direction; (iv) pressure. The acronym MZPS indicates that the water level is referred to the Mareographic Reference of Punta della Salute.
Figure 14.
Boundary conditions for the events of 12 February 2013 and 24 December 2010: (i) water level; (ii) wind velocity; (iii) wind direction; (iv) pressure. The acronym MZPS indicates that the water level is referred to the Mareographic Reference of Punta della Salute.

Figure 15.
Events with maximum water level between 110 cm and 120 cm MZPS (Mareographic Reference of Punta della Salute). Effect of partial closure of barriers for the events of 19 November 2010 and 26 December 2013, changing the Experimental Electromechanical Module (MoSE) closing criteria.
Figure 15.
Events with maximum water level between 110 cm and 120 cm MZPS (Mareographic Reference of Punta della Salute). Effect of partial closure of barriers for the events of 19 November 2010 and 26 December 2013, changing the Experimental Electromechanical Module (MoSE) closing criteria.

Figure 16.
Events with maximum water level between 120 cm and 130 cm MZPS (Mareographic Reference of Punta della Salute). Effect of partial closure of barriers for the events of 22 November 2010 and 8 February 2009, changing the Experimental Electromechanical Module (MoSE) closing criteria.
Figure 16.
Events with maximum water level between 120 cm and 130 cm MZPS (Mareographic Reference of Punta della Salute). Effect of partial closure of barriers for the events of 22 November 2010 and 8 February 2009, changing the Experimental Electromechanical Module (MoSE) closing criteria.

Figure 17.
Events with maximum water level between 130 cm and 140 cm MZPS (Mareographic Reference of Punta della Salute). Effect of partial closure of barriers for the events of 12 February 2013 and 24 December 2010, changing the Experimental Electromechanical Module (MoSE) closing criteria.
Figure 17.
Events with maximum water level between 130 cm and 140 cm MZPS (Mareographic Reference of Punta della Salute). Effect of partial closure of barriers for the events of 12 February 2013 and 24 December 2010, changing the Experimental Electromechanical Module (MoSE) closing criteria.

Figure 18.
Events with maximum water level between 140 cm and 150 cm MZPS (Mareographic Reference of Punta della Salute). Effect of partial closure of barriers for the events of 12 February 2013 and 24 December 2010, changing the Experimental Electromechanical Module (MoSE) closing criteria.
Figure 18.
Events with maximum water level between 140 cm and 150 cm MZPS (Mareographic Reference of Punta della Salute). Effect of partial closure of barriers for the events of 12 February 2013 and 24 December 2010, changing the Experimental Electromechanical Module (MoSE) closing criteria.

Figure 19.
Velocity in Malamocco channel in the case of partial closure of Experimental Electromechanical Module (MoSE; Point A; see Figure 4): (a) 19 November 2010; (b) 26 December 2013; (c) 22 November 2010; (d) 8 February 2009; (e) 30 November 2009; (f) 24 December 2009; (g) 12 February 2013; (h) 24 December 2010.

Figure 20.
Maximum current velocity in each node of the computational domain for the 19 November 2010 event: (a) case with flood barriers open; (b) case with the barriers of Lido and Chioggia closed; (c) detail in the area around the Malamocco inlet for the case with flood barriers open; (d) detail in the area around the Malamocco inlet for the case with the barriers of Lido and Chioggia closed.


Table 1.
Meteorological characteristic of the select events. The acronym MZPS indicates that the water level is referred to the Mareographic Reference of Punta della Salute.
Table 1.
Meteorological characteristic of the select events. The acronym MZPS indicates that the water level is referred to the Mareographic Reference of Punta della Salute.
| Event | Maximum Water Level (cm MZPS) | Maximum Wind Velocity (m/s) | Mean Wind Direction (°N) | Mean Pressure (mbar) |
|---|---|---|---|---|
| 23 November 2007 | 105 | 10.1 | 139 | 1014 |
| 1 December 2008 | 155 | 16.5 | 197 | 998 |
Table 2.
Comparison between the observed values and the water level estimated by advanced circulation (ADCIRC) adopting three values of . The bold numbers indicate the best parameter value.
Table 2.
Comparison between the observed values and the water level estimated by advanced circulation (ADCIRC) adopting three values of . The bold numbers indicate the best parameter value.
| 23 November 2007 | 1 December 2008 | ||||||
|---|---|---|---|---|---|---|---|
| Cf | 0.005 | 0.01 | 0.015 | 0.005 | 0.01 | 0.015 | |
| Punta della Salute | (cm) | 1.74 | 0.87 | 0.19 | 4.38 | 6.01 | 7.14 |
| (cm) | 5.06 | 5.55 | 7.83 | 7.24 | 10.47 | 14.02 | |
| 0.10 | 0.11 | 0.16 | 0.10 | 0.14 | 0.19 | ||
| 0.98 | 0.97 | 0.94 | 0.97 | 0.95 | 0.9 | ||
| Faro Rocchetta | (cm) | 2.19 | 1.57 | 1.08 | 0.26 | 1.9 | 2.99 |
| (cm) | 5.15 | 3.78 | 5.61 | 6.46 | 6.46 | 9.08 | |
| 0.1 | 0.07 | 0.11 | 0.09 | 0.09 | 0.13 | ||
| 0.97 | 0.99 | 0.97 | 0.98 | 0.98 | 0.96 | ||
| Chioggia Vigo | (cm) | 3.02 | 2.73 | 2.46 | −4.46 | −2.93 | −1.92 |
| (cm) | 6.38 | 4.44 | 5.01 | 11.27 | 8.75 | 8.6 | |
| 0.12 | 0.08 | 0.1 | 0.18 | 0.13 | 0.13 | ||
| 0.96 | 0.98 | 0.98 | 0.94 | 0.96 | 0.96 | ||
Table 3.
Meteorological characteristics of the select events. The acronym MZPS indicates that the water level is referred to the Mareographic Reference of Punta della Salute.
Table 3.
Meteorological characteristics of the select events. The acronym MZPS indicates that the water level is referred to the Mareographic Reference of Punta della Salute.
| (110–120) cm MZPS | (120–130) cm MZPS | (130–140) cm MZPS | (140–150) cm MZPS | |||||
|---|---|---|---|---|---|---|---|---|
| 19 November 2010 | 26 December 2013 | 22 November 2010 | 8 February 2009 | 30 November 2009 | 24 December 2009 | 12 February 2013 | 24 December 2010 | |
| Maximum water level (cm) | 114 | 115 | 122 | 123 | 131 | 133 | 144 | 144 |
| Minimum water level (cm) | 49 | 38 | 6 | 48 | 44 | 11 | 16 | 35 |
| Period between the maximum and minimum water level (h) | 6.81 | 11.00 | 7.33 | 6.18 | 7.00 | 9.65 | 7.83 | 6.85 |
| Mean sea level rise velocity (cm/h) | 9.53 | 7.00 | 15.82 | 12.13 | 12.43 | 12.64 | 16.34 | 15.91 |
| Duration over the level of 110 cm MZPS (h) | 1.72 | 2.63 | 3.20 | 2.97 | 3.98 | 3.93 | 4.20 | 4.03 |
| Maximum wind velocity (m/s) | 2.30 | 14.60 | 8.30 | 4.30 | 14.20 | 10.90 | 14.10 | 10.40 |
| Mean wind velocity (m/s) | 1.50 | 13.72 | 4.45 | 2.93 | 12.00 | 7.33 | 7.22 | 8.46 |
| Mean wind direction (N) | 294.50 | 130.67 | 133.68 | 295.89 | 142.04 | 107.74 | 15.02 | 139.96 |
| Mean pressure (mbar) | 1014.18 | 992.86 | 997.19 | 991.13 | 999.83 | 999.63 | 997.29 | 990.63 |
Table 4.
Maximum water level observed in the towns of Venice and Sottomarina for different water-level closure. The acronym MZPS indicates that the water level is referred to the Mareographic Reference of Punta della Salute.
Table 4.
Maximum water level observed in the towns of Venice and Sottomarina for different water-level closure. The acronym MZPS indicates that the water level is referred to the Mareographic Reference of Punta della Salute.
| Event | Maximum Water Level at Punta Salute (cm MZPS) | Site | Maximum Water Level for Different Level Closure (cm MZPS) | |||
|---|---|---|---|---|---|---|
| 100 | 80 | 60 | 40 | |||
| 19 November 2010 | 114 | Venice | 110 | 106 | 102 | — |
| Sottomarina | 99 | 93 | 89 | — | ||
| 26 December 2013 | 115 | Venice | 113 | 111 | 109 | — |
| Sottomarina | 98 | 95 | 92 | — | ||
| 22 November 2010 | 122 | Venice | 110 | 103 | 98 | 95 |
| Sottomarina | 122 | 112 | 106 | 102 | ||
| 8 February 2009 | 123 | Venice | 107 | 101 | 96 | — |
| Sottomarina | 111 | 106 | 102 | — | ||
| 30 November 2009 | 131 | Venice | 123 | 118 | 115 | — |
| Sottomarina | 115 | 109 | 105 | — | ||
| 24 December 2009 | 133 | Venice | 119 | 115 | 110 | 107 |
| Sottomarina | 118 | 112 | 107 | 105 | ||
| 12 February 2013 | 144 | Venice | 123 | 119 | 114 | 110 |
| Sottomarina | 141 | 136 | 131 | 128 | ||
| 24 December 2010 | 144 | Venice | 127 | 121 | 116 | 113 |
| Sottomarina | 126 | 119 | 116 | 114 | ||
© 2017 by the authors. Licensee MDPI, Basel, Switzerland. This article is an open access article distributed under the terms and conditions of the Creative Commons Attribution (CC BY) license (http://creativecommons.org/licenses/by/4.0/).
Share and Cite
MDPI and ACS Style
Cavallaro, L.; Iuppa, C.; Foti, E. Effect of Partial Use of Venice Flood Barriers. J. Mar. Sci. Eng. 2017, 5, 58. https://doi.org/10.3390/jmse5040058
AMA Style
Cavallaro L, Iuppa C, Foti E. Effect of Partial Use of Venice Flood Barriers. Journal of Marine Science and Engineering. 2017; 5(4):58. https://doi.org/10.3390/jmse5040058
Chicago/Turabian StyleCavallaro, Luca, Claudio Iuppa, and Enrico Foti. 2017. "Effect of Partial Use of Venice Flood Barriers" Journal of Marine Science and Engineering 5, no. 4: 58. https://doi.org/10.3390/jmse5040058
Note that from the first issue of 2016, this journal uses article numbers instead of page numbers. See further details here.