
Offshore Deployments of Wave Energy Converters by Seabased Industry AB


Deparment of Engineering Sciences, Uppsala University, 751 05 Uppsala, Sweden
*
Author to whom correspondence should be addressed.
J. Mar. Sci. Eng. 2017, 5(2), 15; https://doi.org/10.3390/jmse5020015
Submission received: 22 December 2016
/
Revised: 21 February 2017
/
Accepted: 21 March 2017
/
Published: 25 March 2017
(This article belongs to the Section Ocean Engineering)
Abstract
:Since 2008, Seabased Industry AB (SIAB) has manufactured and deployed several units of wave energy converters (WECs) of different design. The WECs are linear generators with point absorber buoy systems that are placed on the seabed, mounted on a gravitation concrete foundation. These deployments have taken place in different areas, using different deployment vessels. Offshore deployments of WECs and underwater substations have so far been complicated procedures, that were both expensive and time-consuming. The focus of this paper is to discuss these deployments in terms of economy and time efficiency, as well as safety. Because seven vessels have been used to facilitate the deployments, an evaluation on the above basis is carried out for them. The main conclusions and certain solutions are presented for the various problems encountered during these deployments and the vessel choice is discussed. It is found that the offshore deployment process can be optimized in terms of cost, time efficiency and safety with a careful vessel choice, use of the latest available technologies and detailed planning and organizing.
1. Introduction
Electricity from ocean energy has become increasingly popular in recent years. A variety of wave energy conversion technologies can be classified according to location, size/type and wave energy utilization approach/mode of operation [1,2]. The wave energy conversion technology discussed in this paper is an offshore device of a point absorbing type, operating primarily in heave with a linear generator power take off (PTO).
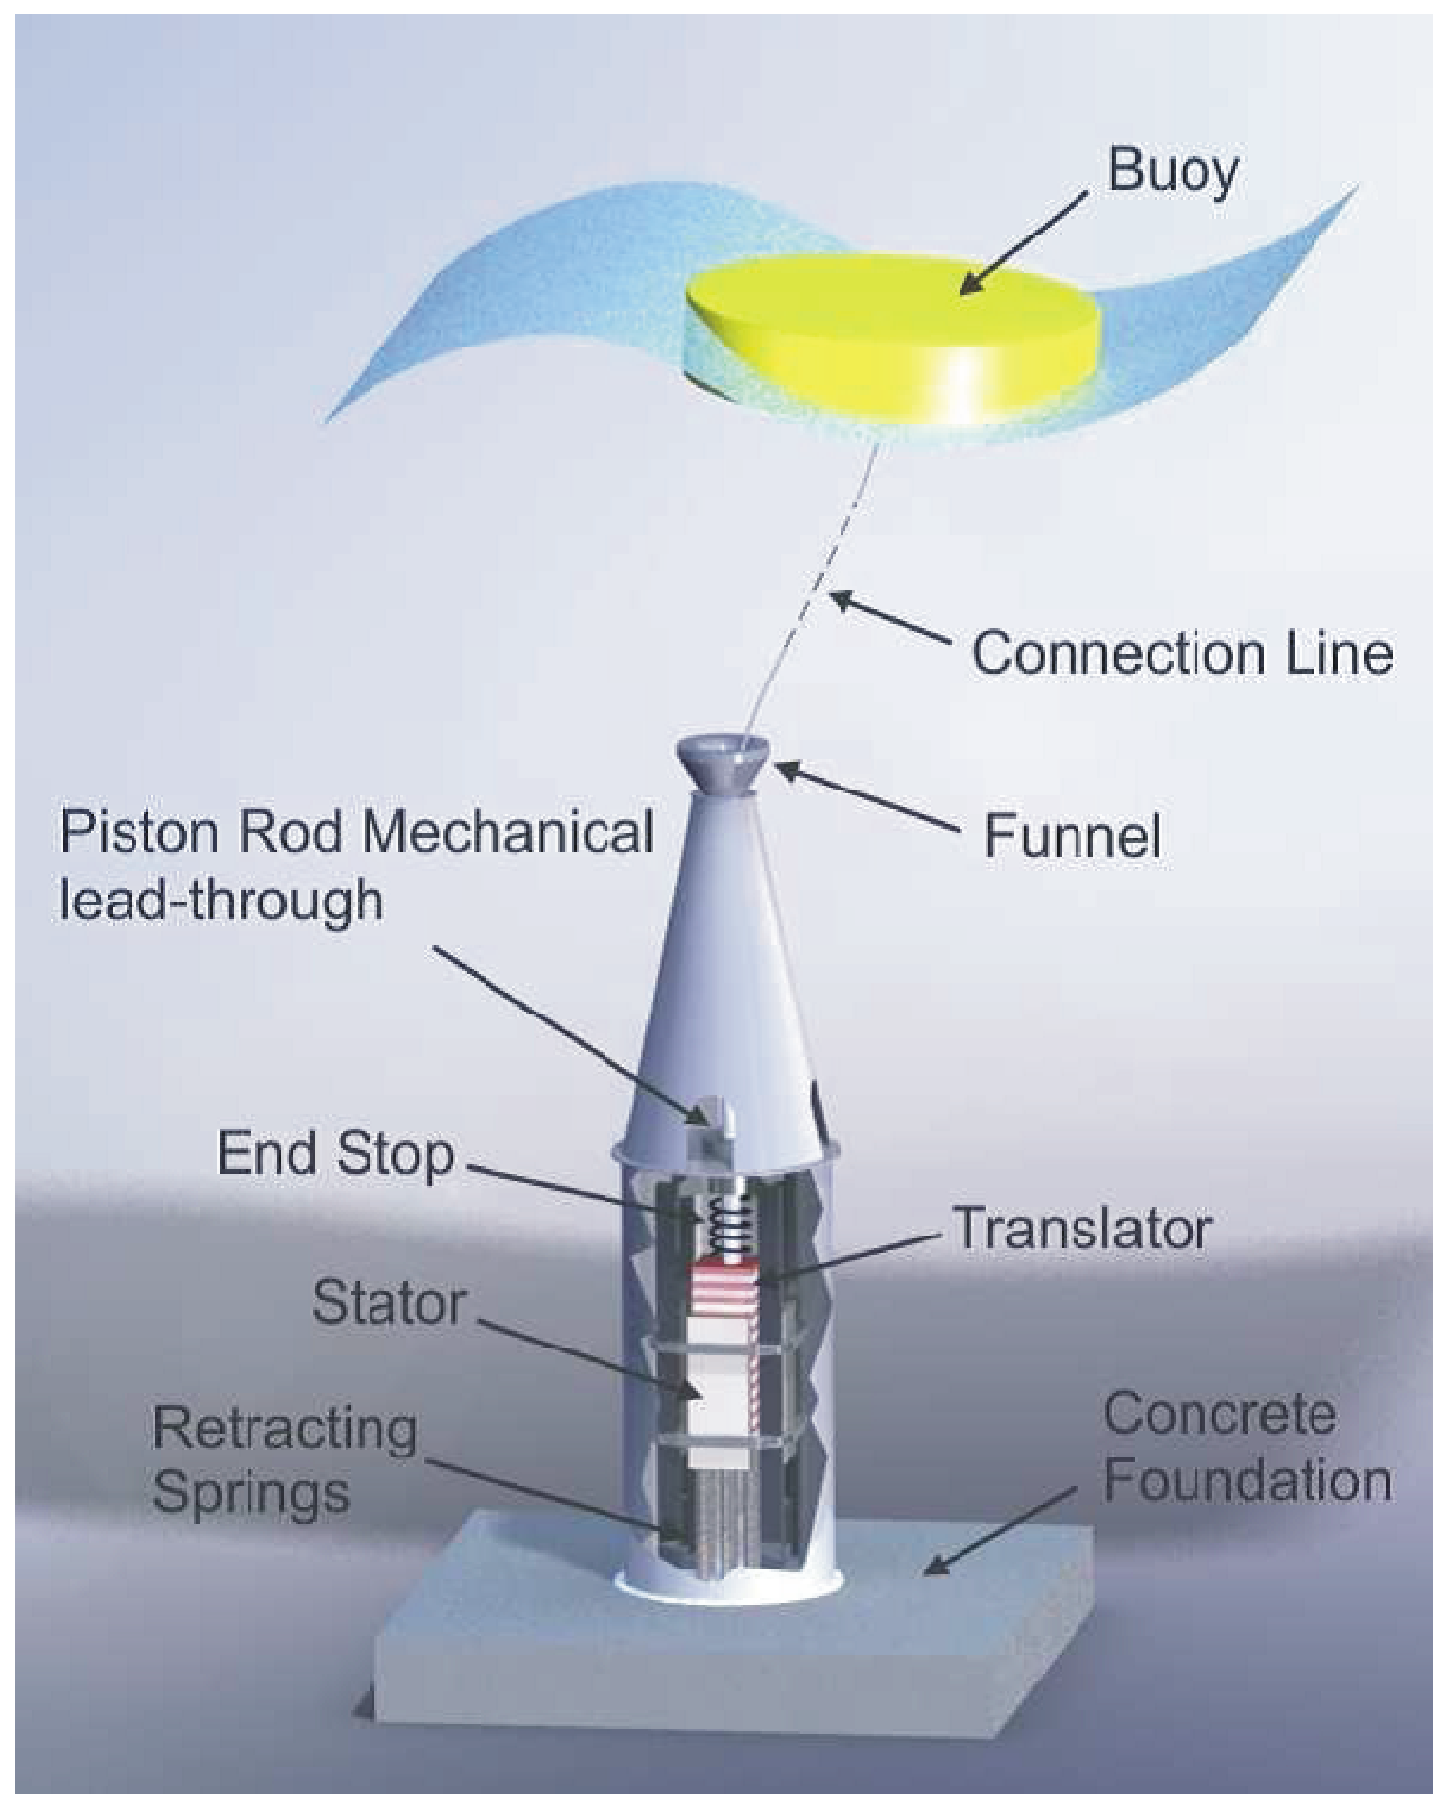
A schematic of the wave energy converter (WEC) is shown in Figure 1. The WEC consists of a buoy, placed on the water surface, and a generator enclosed by a water-tight pressurized hull. A stator with windings and a translator with permanent magnets constitute the two main parts of the generator. The translator is connected to the buoy via a steel wire. Driven by waves, the buoy drags the translator inside the generator, and voltage is induced in the stator windings. The device is placed on the seabed, anchored with a gravity based concrete foundation. One unit can deliver a limited amount of power. Therefore, several units need to be deployed to achieve a required installed capacity [3]. The WECs can be connected to either an underwater substation or to a common connection point of the power cable. The initial concept of the WEC has been developed at the Division of Electricity of Uppsala University (UU) [4], and now is commercialized by the Swedish spin-off company Seabased Industry AB (SIAB)1. At present, UU and SIAB are collaborating in several research projects.
More than 1000 different ideas regarding wave power have been patented all over the world [5], however, only very few wave power projects have reached a commercial pilot demonstration stage [6]. Challenges hindering development of wave energy conversion technologies were discussed in the literature [6,7], e.g., extensive cost of installation, operation and maintenance of WECs.
Installation of marine energy converters is poorly addressed in earlier publications. Deployment of the first WEC within the Lysekil wave power project performed by UU was presented in [4]. General procedure, associated costs and issues regarding offshore deployments of UU’s WECs and underwater substations were discussed in [8,9]. A number of papers address installation of tidal stream turbines. For example, Fraenkel described a procedure of deployment of the tidal stream turbine Seaflow [10]. A novel vessel design for a tidal stream energy converter was presented in [11]. Morandeau et al. discussed two complementary solutions for a tidal current energy converter installation focusing on optimization of the procedure and capital expenditure reduction [12].
This paper reviews and evaluates three cases of WECs and underwater substation deployments by SIAB. The evaluation parameters are economy and time efficiency, as well as safety of each deployment procedure. Seven vessels used in these operations are assessed to conclude which type of vessel is optimal. The vessel types used were barges, tug boats and large specialized vessels.
The design of the WECs deployed in Norway differs from the design of later WECs (Sotenäs and Ghana deployments). The main characteristics of the WECs are given in Table 1, where the rated power is determined for a translator speed of 0.7 m/s. For more information on the generator design, the reader is referred to [4,13,14].
The rest of the paper is organized as follows. Section 2 shortly presents the three case studies analysed in the paper. Section 3 describes the cases in details. Section 4 identifies the problems of each deployment and suggests solutions and ways to optimize the offshore operations. The last section formulates the main conclusions.
2. Materials and Methods
Three case studies of WECs offshore deployments are based on: (a) information obtained from personal communication with Robert Leandersson, Boel Ekergård, Daniel Käller and Björn Bolund and (b) some published studies. A specific information of the Norway operation is from personal communication with Björn Bolund on October 19, 2016. Information on other deployments is provided by Robert Leandersson and by Daniel Käller in personal communications on July 29, 2016, and November 1, 2016, respectively. Essential comments on the Sotenäs operation are made by Boel Ekergård.
A number of the problems the personnel faced can be solved easily, while others caused time delays and loss of money. As it has been shown in [8,9], the common denominator is the type of operation, i.e., offshore deployment of a WEC/WECs and/or marine substation, and the cases are compared with regards to time, place, vessel and equipment used. The precise deployment costs of these deployments are not presented here, as being considered a confidential information due to commercial interests.
The first case is the first deployment by SIAB of 2 WECs and a substation at the Maren Test Site, Norway, in 2009. The second deployment is an ongoing project, not yet completed, at Sotenäs, Sweden. So far, 36 WECs and a substation were deployed at different occasions and using various vessels. The third deployment is a SIAB project for a customer in Ghana, Africa, deploying six WECs at a depth of 16 m.
The basic offshore deployment methodology described in [8] consists of four steps:
- Preparation, which includes the assembly of the WEC, performing all necessary tests and connecting the WEC to lifting slings and shackles
- The transfer stage, meaning transferring the WEC from the manufacturer to the port and afterwards to the deployment spot
- The actual deployment procedure that most commonly includes the WEC’s pressurizing, lifting and lowering to the sea bottom
- The final processing, when divers or remotely operated underwater vehicles (ROVs) make all necessary cable connections and disconnect slings and shackles
In Section 3.1, Section 3.2 and Section 3.3 the three case studies are presented and analysed within this frame.
3. Results
3.1. Norway, September 2009
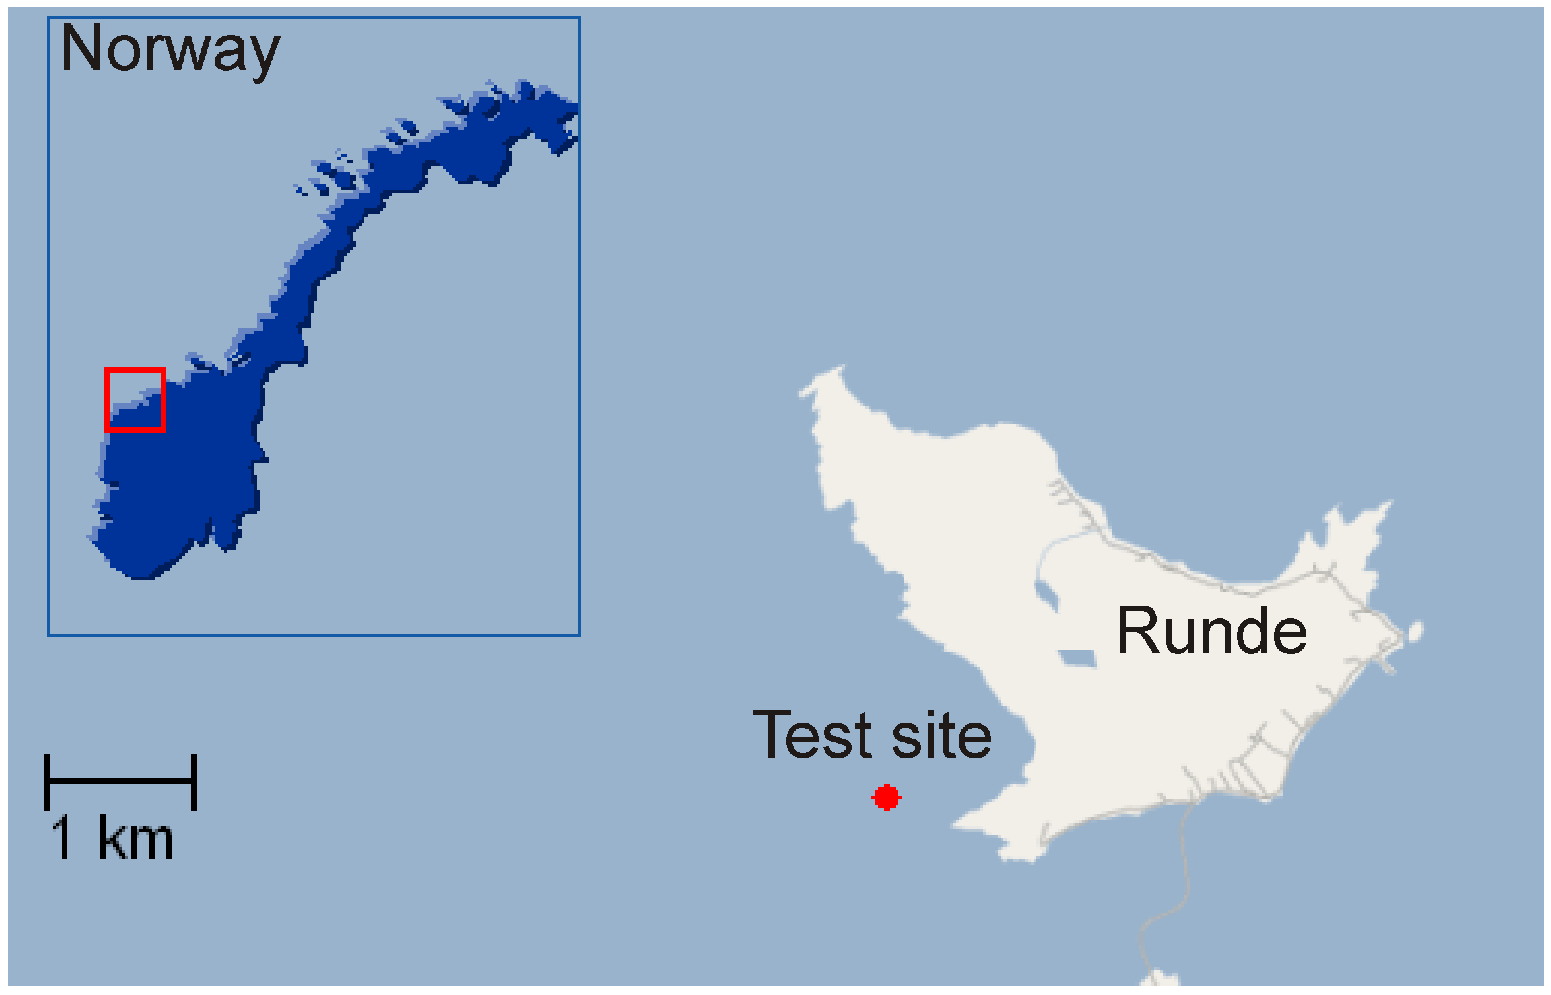
The first SIAB deployment took place in Norway, at the Maren Test Site (Figure 2), which is located 400 m off the Island of Runde, in September 2009. The project was a cooperation between Runde Environmental Centre (REC) ltd, Vattenfall AB and the Norwegian electricity producer and distributor Tussa Kraft AS.
During this project, two WECs, an underwater substation and a subsea cable were deployed. The WECs were deployed with their buoys (Figure 3 and Figure 4). The underwater cable was laid on the sea bottom at the same time. The substation in a pressurized chamber was rather small, with a diameter of 2.0 m, a height of 3.0 m and a weight of 10 tonnes, mounted on a concrete gravity foundation to keep it on the seabed. The cost of the Norway deployment was about 30% of the Sotenäs total deployment cost, because it was the first deep water deployment experience.
3.1.1. Vessels, Crew, Cranes, Equipment
All devices and equipment were transported from Lysekil, Sweden, and put on the quay in Runde, where the final device adjustments were made. The deployment spot was about 15 km from the shore.
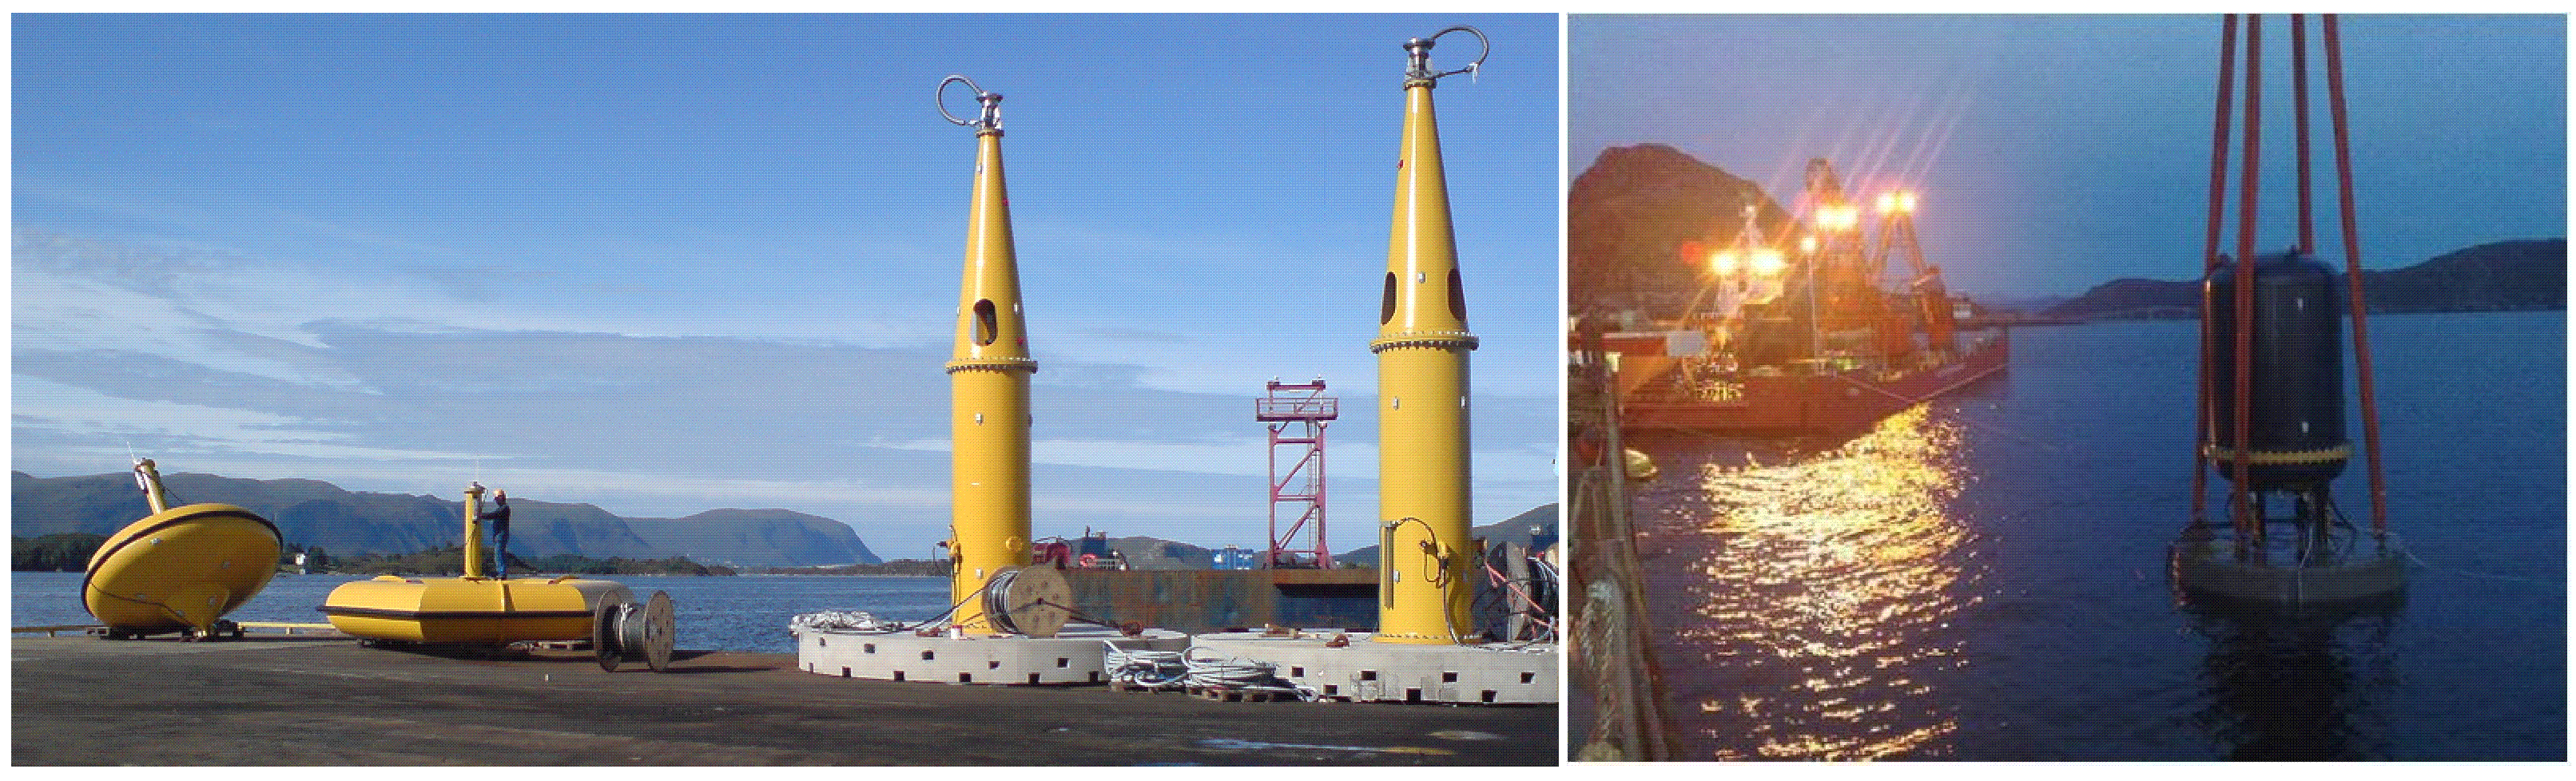
For this deployment two vessels were used: a big barge from Ulstein2 towed by a tugboat and equipped with a high capacity mobile crane, and the Nautilus Maxi from Seloy3. The deployment crew totalled 20 people.
On the Ulstein barge, there was a crew of six people from SIAB, and four from the Ulstein, two of whom could operate the crane. This vessel carried the two WECs mounted on concrete foundations (71 tonnes each) attached to their buoys (about 3 tonnes each) and the electrical cables. The cables from the WECs were rolled up on cable drums next to them. The mobile crane gave a lot of freedom to operate both onshore and offshore. The Nautilus Maxi was equipped with a cable winch and high capacity deck cranes and had a crew of ten people, including four divers. The vessel carried the substation (25 tonnes), the electrical cable and the electrical cable drum (23 tonnes).
A crew of four divers was hired to release the shackles attached to the gravity foundation and release the slings when all the devices were on the sea bottom. Furthermore, the divers kept track of the cables, having visual contact throughout the deployment procedure.
The specialized equipment included a pressurized chamber for the divers (for their progressive recovery from the considerable depth they dived at) welded onto the smaller boat, the electrical cables drums and custom-made slings and shackles.
3.1.2. Preparation, Mooring, Deployment
The pressurizing was conducted with nitrogen gas to prevent the devices from imploding and oxidizing inside. The WECs were pressurised before loading during two hours up to about six to seven bars. The hull of the WECs was designed to withstand higher pressure inside. However, the substation was built differently and could keep only about one bar above the outside pressure. The loading took a few hours to complete, because one had to avoid the many wires and cables getting tangled.
The barge was positioned carefully and was moored in four places. Four anchoring points were required to keep the barge stable enough while operating the crane. The mooring chains were about 180 m and set up by the barge crew.
The substation and the WECs were lowered down to the sea bottom, one after the other. The electric cables were connected to the substation when it was lifted up. These connections were done in a way that no cables crossed the anchoring wire or themselves. Then the substation was lowered in the correct place, afterwards all of the cables fell into place. Although there were no major or unexpected deployment problems, keeping track of the cable and wires network, so they did not get tangled, was a difficult task.
3.1.3. Time, Cost, Safety
The entire task took about 12 h. The amount of time for the completion of the deployment was as follows: 4 h to transport from the port to the site, 0.5 h for positioning and mooring the vessel, 1 h to prepare the WECs for lifting and once the first WEC was lifted, it took 1 h per WEC. The whole installation at the deployment spot took about 4 h. Then the small boat started heading to the shore laying the cable at the same time. Transport from the site took about 1.5 h. The onshore connection was completed later by the grid operator.
For this deployment, the cost was significant. The main cost was hiring the barge (including the mobile crane, tugboat and the cost for the crew) for two days. The second substantial cost was the cable laying vessel and the diver crew. In addition, there were several costs associated with the rent of the quay and special equipment, the electrical cable drums, shackles and slings. Another cost was the pressure chamber for the divers that needed to be welded and placed on the Nautilus Maxi, a task that took almost two working days.
This procedure went smoothly: all the devices were lowered slowly at a pace of 1–2 m per minute and all safety regulations were followed. There was no danger of capsizing at any point. The smaller vessel was safer, while the problem with the barge was that a person could easily fall off, since there were no safety gunwales.
3.1.4. Multiple Deployments
A barge like the Ulstein may also work in a multiple deployment up to 10 WECs. Problems arise with connecting the electric cables from the WEC to the substation. The more WECs are to be deployed, the more spider-web-like the cabling will be. Furthermore, since the vessels and their crew work around the clock, deploying 10 WECs in a day could be easily accomplished but without cables.
3.2. Sotenäs, 2014—Present
In Sotenäs, northwest of Smögen on the Swedish west coast (Figure 5), the SIAB deployment project started in 2014. During the first phase 36 WECs mounted on square concrete gravity foundations and a substation of 120 tonnes were deployed at approximately 50 m depth. The WECs and the substation were deployed on different occasions and using a variety of vessels. This project is ongoing. The individual deployments are described below, according to the vessel used.
3.2.1. Samson A-Frame
The Samson A-Frame4 (Figure 6) is a fixed A-frame crane barge that deployed the first 10 generators of the Sotenäs project in June 2014. The Samson had a fixed crane with a very high capacity of more than 300 tonnes, which was more than was required for this operation. The generators were held with wires from the two crane hooks during transportation to the deployment spot. The deployment process was conducted in two days: four WECs were deployed on the first day and six—on the second. The crew consisted of ten people, working 12 h shift. The Samson was pulled by a tugboat and then, in place, positioned itself with the dynamic positioning (DP) system. No divers participated, but ROVs were used extensively. The SIAB personnel were responsible for the pressurizing, and all the other tasks were handled by the crew of the Samson. The cost for this deployment was approximately 15% of the total Sotenäs operation cost. The installation was smooth, with no problems or safety risks. However, the Samson proved to be inefficient and, therefore, is not suggested unless 4 generators at most need to be deployed.
3.2.2. Dina Star
The Dina star (Figure 6) deployed 25 WECs in 48 h in April 2015. The Dina star had a crew of twenty people, including the ROVs’ crew of four people, two of whom were driving the ROVs in 12 h shift. The ROVs were used for disconnecting the lifting shackles, closing the air valves etc. Seven employees from SIAB were on the boat to help with pressurizing, with two people working in 8 h shift. The crew stayed on-board for three days to complete the deployment. The deployment method was the same as explained above.
A challenge for SIAB was to minimize the starting time. When using a big ship like the Dina star, a pilot is needed to take the boat into and out of the harbour. The pilot should be booked six hours before the scheduled time of the vessel departure from the harbour. The Dina star crew missed to book the pilot at the right time so they had to wait four hours for the pilot in Lysekil before starting the operation. Once the operation had begun, one generator per half an hour was deployed. The Dina star proved to be the fastest vessel for mass deployment of the generators. It was an expensive operation amounted to 50% of the total Sotenäs operation cost.
3.2.3. Pharaoh Barge
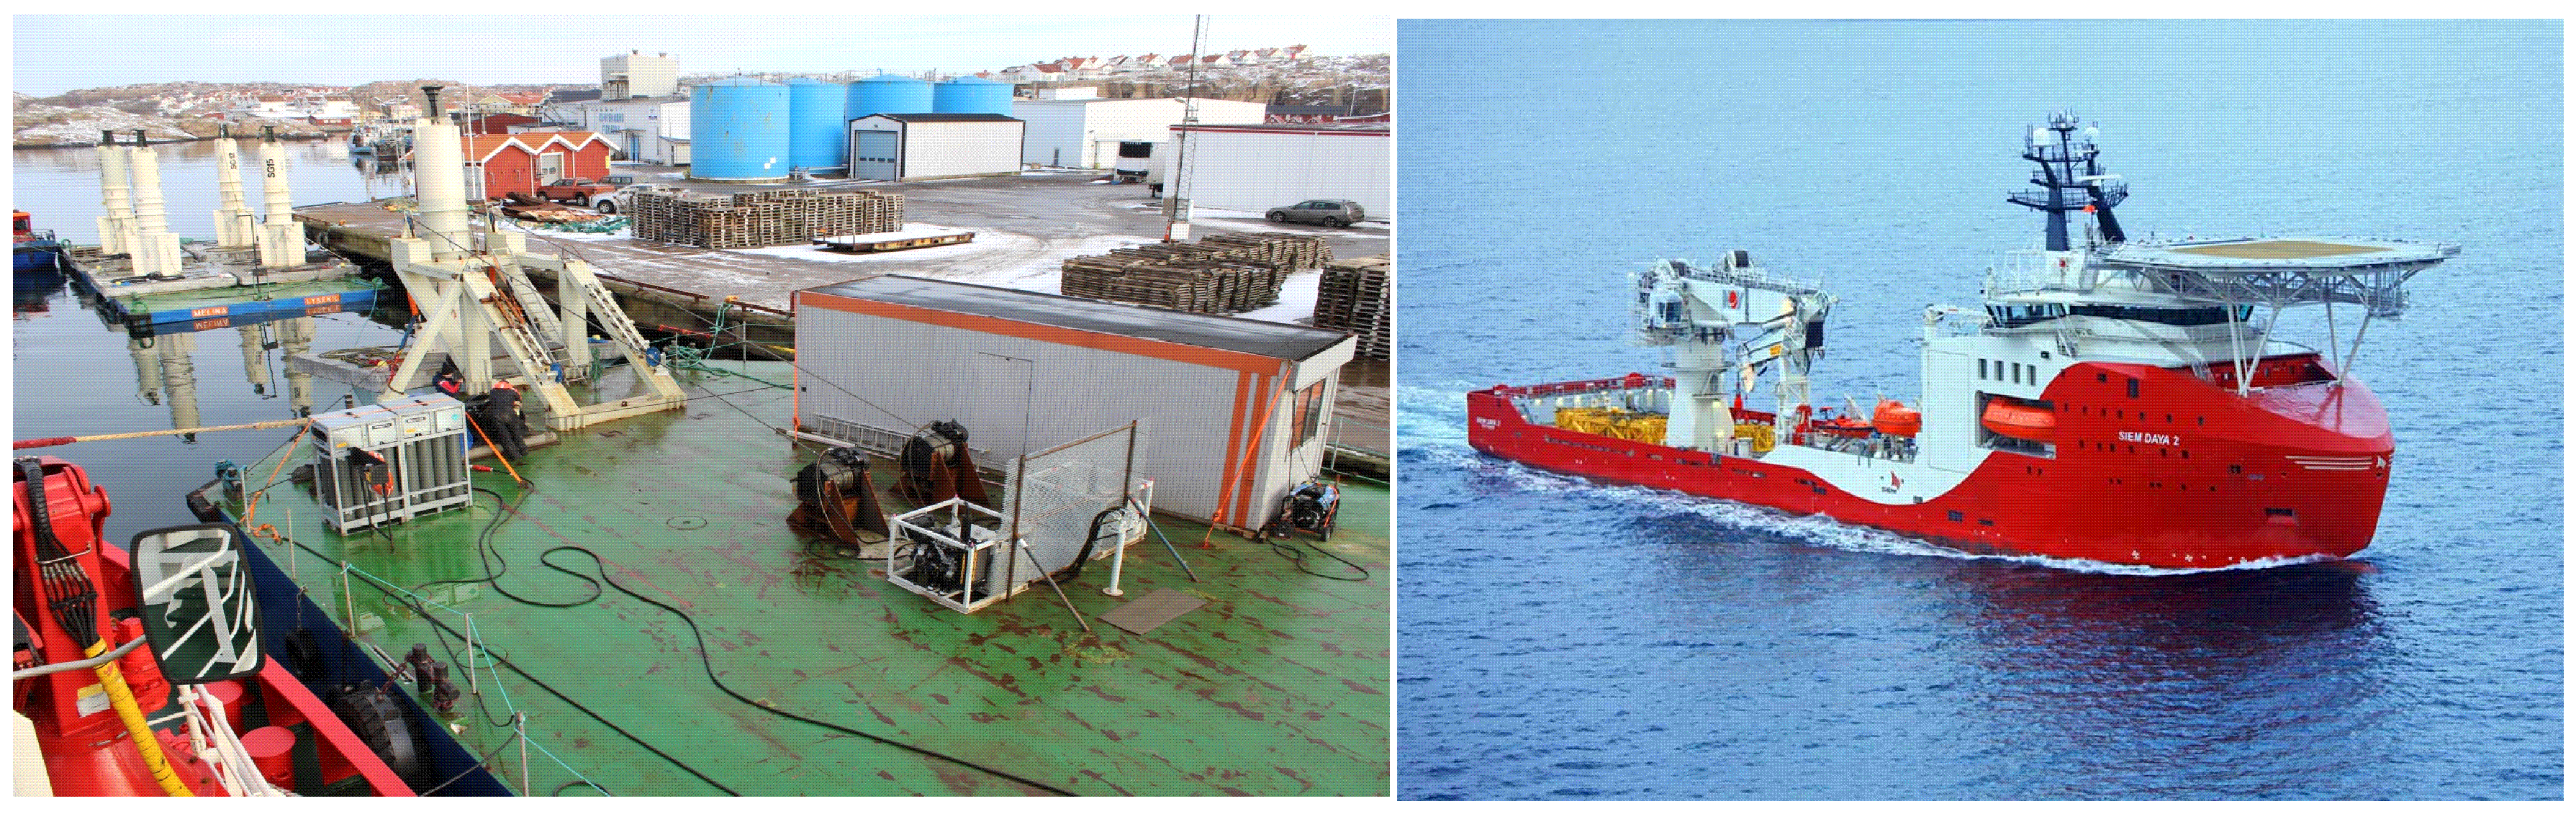
The Pharaoh barge (Figure 7) was used to deploy the substation. The attempt to also deploy WECs did not work.
The Pharaoh was a simple flat barge, and SIAB employees built their own 80 tonnes capacity crane on it. This crane had two winches from which the substation was hanging with steel wires into the water. That way the substation, weighted 115 tonnes in the air but 20 tonnes in water, was towed to the deployment spot. The Pharaoh barge had no DP system, and the vessel had to be anchored. The barge was positioned in place with the tugboat GPS system. Four anchoring points were used with chains at 200 m from the barge locked with anchors. Connection of the power cable and WECs’ cables to the substation took a few extra days, increasing the total deployment time to about five days. On the barge, there were six people from SIAB. The crew was working in 12 h shift.
The day rate for renting the barge was low. However, since extra time was required to mount and demount the crane, in addition to the actual deployment days, the total cost added up. Overall, it costed about 11% of the total Sotenäs operation.
3.2.4. Siem Daya 2
The Siem Daya 2 (Figure 7) is a multi-purpose offshore vessel (MPOV) with a good DP system and two ROVs. The crew consisted of ten people experienced in such operations and ten more for ROV driving and crane manoeuvring. This vessel deployed the substation and connected the buoys to WECs and the cables to the substation. The procedure took four hours in total and was according to the offshore safety rules. The cost, including the daily rent for the vessel and the diesel payments, was about 24% of the total Sotenäs deployment cost.
3.2.5. General Remarks
No divers were employed at any point, therefore, the diver crew cost was avoided. ROVs were used extensively, but their operation can be complicated. For example, locking the valve in the pressurizing valvelet is an easy for a diver, but a ROV may damage the valve badly. Special equipment used in the Sotenäs deployment was the ROV shackles that were needed to release the lifting shackles. The latter shall also be of a special type which the ROV can handle.
Considering the number of WECs deployed, the significant depth of the test site and the specialized, large capacity vessels employed for the operations, this is the most costly deployment of all three cases.
3.3. Ghana, 2015—Present
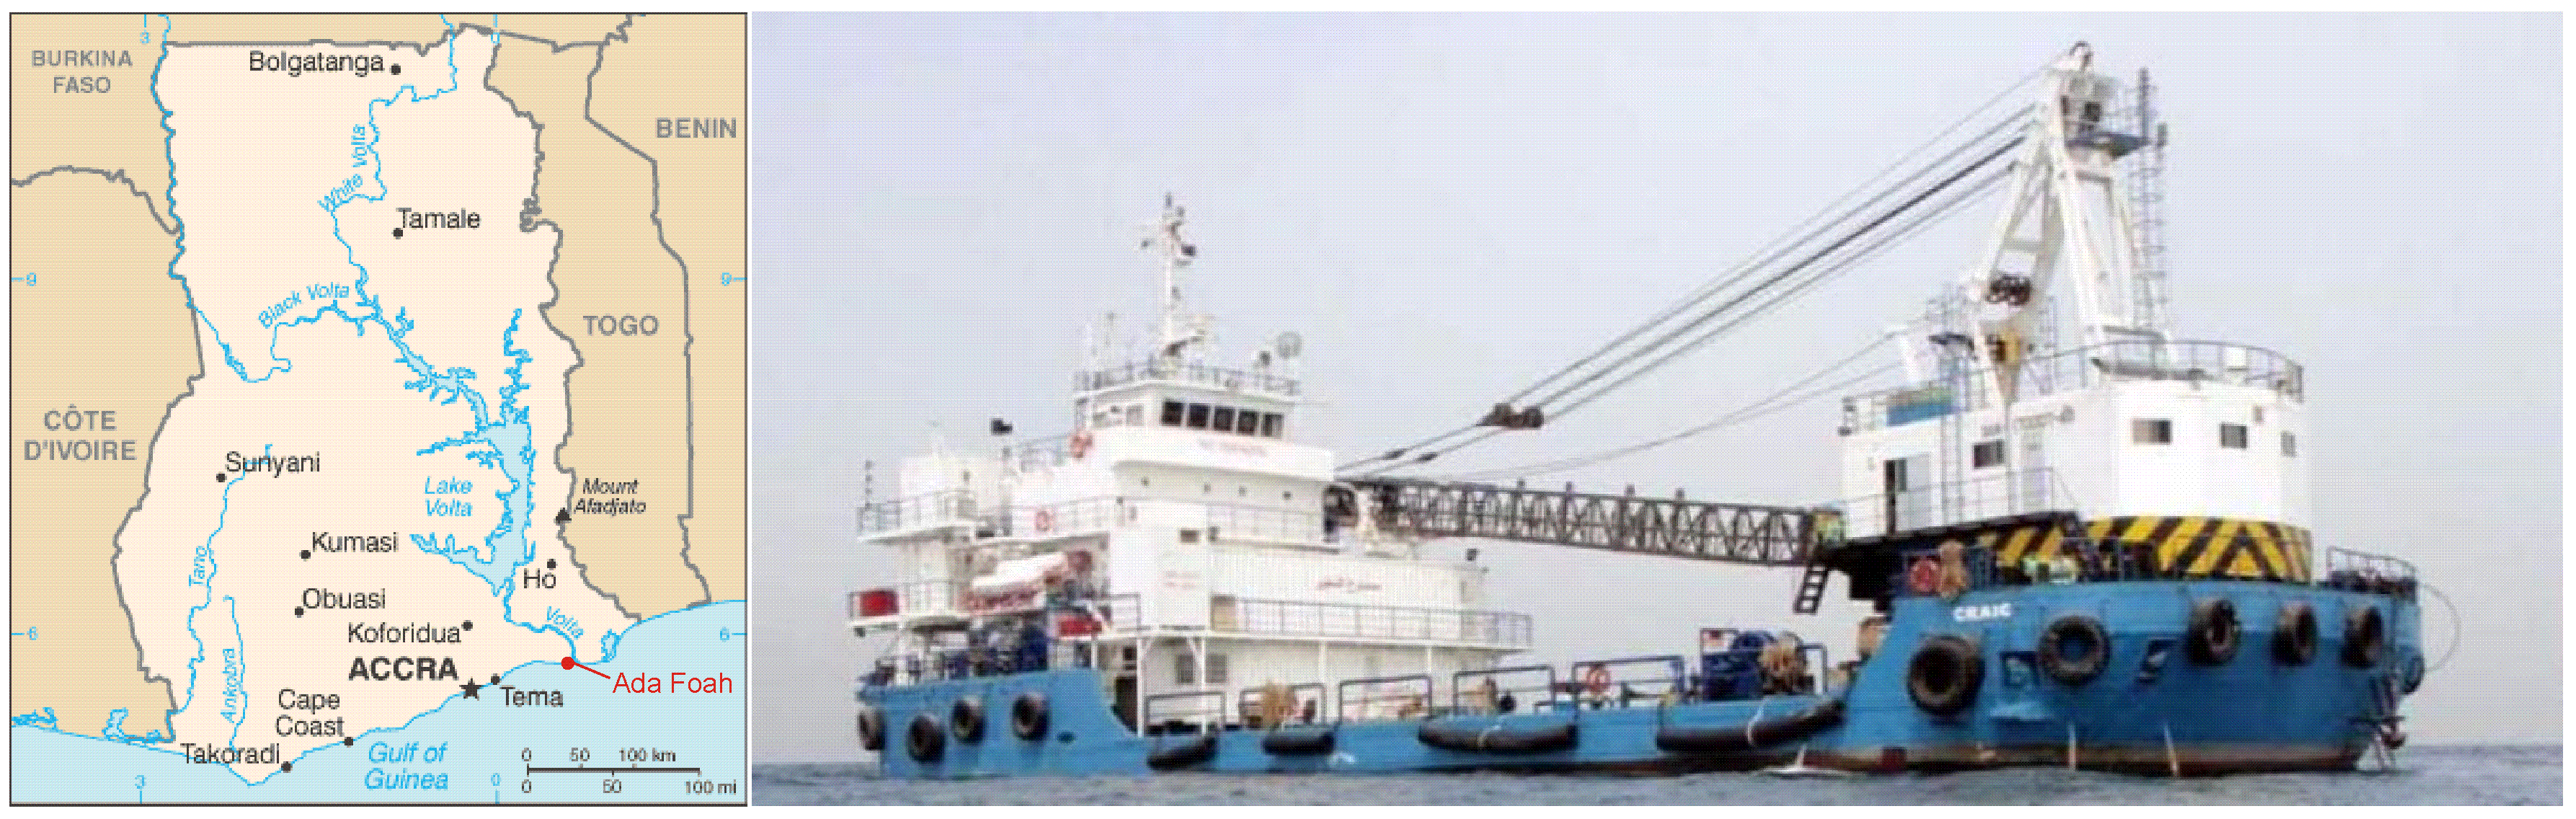
The deployment started in April 2015. The SIAB customer from Ghana rented the motor vessel (MV) Craic5 (Figure 8) from Siraj Marine. The MV Craic is a large specialized vessel with a fixed crane of a lifting capacity of 120 tonnes.
The deployment took place about 3 km offshore in the sea outside the estuary of the Volta River, near Ada Foah, a coastal town in the Greater Accra Region of Ghana (Figure 8). The depth at the deployment site is 16 m, which is comparably shallow, facilitating the use of divers. Further information on the site of the Ada Foah wave power park can be found in [16].
The deployment crew consisted of two people from SIAB and 15 people from the vessel. A group of three divers from Ghana was hired to disconnect slings and shackles. The boat equipment included divers’ equipment such as two diving compressors.
The WECs were connected to their buoys and deployed simultaneously (Figure 9). The low voltage switchgear was on land, so there was just a connection point under the water. A week after the installation of the generators, the vessel completed the connection. Six WECs were deployed in two days, three at a time. No special equipment or ROVs were used during this deployment.
Due to its large deck and the high capacity fixed crane, this vessel is suitable for mass deployment of WECs. The vessel had no DP system, and the mooring was complicated due to a current coming from west. Therefore, the ship was anchored at two points at the west direction. With the current anchoring method the vessel had to manoeuvre between the WECs about 25–30 m to get to the right position. The total expenses of the Ghana deployment were less than 20% of the Sotenäs operation.
Special Issues Regarding the Ghana Deployment
The WECs were placed on the coast near the estuary of the Volta River which is shallow. This was the reason to choose the MV Craic that has a draft of 2.5 m when loaded.
In Ghana, use of manpower exceeded the use of machinery, e.g., the deployment of the cable from the shore to the sea was a hard task to accomplish. A steel pipe of a length of 84 m was used to weight the cable down on the shore and concrete bags were used to keep the cable down. It was heavy and had to be carried all the way out in the water (Figure 9).
4. Discussion
In the Norway deployment, specific vessels were chosen because of their convenient location and cost. In the Sotenäs project, the Pharaoh barge had the lowest cost, however, its use was complicated by additional installation work. The choice of the Samson vessel depended on the budget and, at that case, was cost-efficient. The Dina star and the Siem Daya 2 are similar vessels. They performed fast and were suitable for multiple WECs deployment and substation installation. Although it is daunting to use the big ships because their cost rate is high, it can be cheaper than renting a barge with a mobile crane and a tugboat. Renting a barge and a mobile crane costs less, but delays due to the limited weather windows can cause delays and increase the total cost.
A large crew specialized in offshore operations is crucial. It is important for all the crew members to go through the procedure plan well beforehand.
A mobile crane type is more versatile and can be used to load the WECs and the substation on to the vessel in the dock and to carry out the actual deployment. Bigger capacity cranes are preferred over the smaller ones since they can accomplish heavier tasks as required. Extra precautions should be taken during deployments since there is heavy lifting above and around people.
The factors that are affecting the deployment cost are the weather, the depth, the number of crew members and the divers crew. The time efficiency is affected by the following factors:
- Deploying WECs and buoys separately
- Use of specialized vessels with high capacity cranes
- Mooring and DP system
All cases are summarized in Table 2. The cost of each vessel is presented in percent of the total Sotenäs operation cost.
5. Conclusions
All of the above deployments conducted by SIAB were successful. During the review of these operations, common and unexpected problems were mooring and positioning of a vessel, cables tangling during deployment, delays rising deployment expenses. It was concluded that
- A large crew, specialized in such operations is necessary
- A good DP system is essential in facilitating the optimal positioning of the vessel
- The deeper the deployment depth, the higher the costs, especially when a divers crew is hired
- Large specialized vessels are optimal for multiple deployments
- Use of ROVs can lower the cost significantly
- A deployment log should be kept so the same mistakes will not be repeated
To optimize the deployment marine energy converters, a new specialized type of vessel for exactly that kind of operation may be necessary.
Acknowledgments
The authors would like to thank the Swedish Energy Agency, Uppsala University, Seabased Industry AB, STandUP for Energy for their support of the project. The authors would also like to thank Robert Leandersson, Boel Ekergård, Daniel Käller and Bjorn Bolund for the valuable information they offered during interviews, and Marcus Berg and Serdar Temiz for their comments on the manuscript.
Author Contributions
M.A.C. and I.D. planned interview and wrote the paper; M.A.C. performed and transcribed interviews; M.L. contributed with important comments and advices in the development of the paper.
Conflicts of Interest
The authors declare no conflict of interest. The founding sponsors had no role in the design of the study; in the collection, analyses, or interpretation of data; in the writing of the manuscript, and in the decision to publish the results.
References
- Falcão, A.F.D.O. Wave energy utilization: A review of the technologies. Renew. Sustain. Energy Rev. 2010, 14, 899–918. [Google Scholar] [CrossRef]
- Drew, B.; Plummer, A.; Sahinkaya, M.N. A review of wave energy converter technology. J. Power Energy 2009, 223, 887–902. [Google Scholar] [CrossRef]
- Boström, C.; Svensson, O.; Rahm, M.; Lejerskog, E.; Savin, A.; Strömstedt, E.; Engström, J.; Gravråkmo, H.; Haikonen, K.; Waters, R.; et al. Design proposal of electrical system for linear generator wave power plants. In Proceedings of the IECON Proceedings (Industrial Electronics Conference), Porto, Portugal, 3–5 November 2009; pp. 4393–4398. [Google Scholar]
- Leijon, M.; Boström, C.; Danielsson, O.; Gustafsson, S.; Haikonen, K.; Langhamer, O.; Strömstedt, E.; Stålberg, M.; Sundberg, J.; Svensson, O.; et al. Wave energy from the north sea: Experiences from the lysekil research site. Surv. Geophys. 2008, 29, 221–240. [Google Scholar] [CrossRef]
- Clément, A.; McCullen, P.; Falcão, A.; Fiorentino, A.; Gardner, F.; Hammarlund, K.; Lemonis, G.; Lewis, T.; Nielsen, K.; Petroncini, S.; et al. Wave energy in Europe: Current status and perspectives. Renew. Sustain. Energy Rev. 2002, 6, 405–431. [Google Scholar] [CrossRef]
- Bahaj, A.S. Generating electricity from the oceans. Renew. Sustain. Energy Rev. 2011, 15, 3399–3416. [Google Scholar] [CrossRef]
- Mueller, M.; Wallace, R. Enabling science and technology for marine renewable energy. Energy Policy 2008, 36, 4376–4382. [Google Scholar] [CrossRef]
- Chatzigiannakou, M.A.; Dolguntseva, I.; Leijon, M. Offshore deployment of point absorbing wave energy converters with a direct driven linear generator power take-off at the Lysekil test site. In Proceedings of the ASME 2014 33rd International Conference on Ocean, Offshore and Arctic Engineering (OMAE 2014), San Francisco, CA, USA, 8–13 June 2014; Volume 9A. [Google Scholar]
- Chatzigiannakou, M.A.; Dolguntseva, I.; Ekström, R.L.; Leijon, M. Offshore Deployment of Marine Substation in the Lysekil Research Site. In Proceedings of the 25th International Ocean and Polar Engineering Conference (ISOPE 2015), Kona, Big Island, HI, USA, 21–26 June 2015. [Google Scholar]
- Fraenkel, P.L. Marine current turbines: Pioneering the development of marine kinetic energy converters. Inst. Mech. Eng. Part A J. Power Energy 2007, 221, 159–169. [Google Scholar] [CrossRef]
- Nicholls-Lee, R.; Hindley, S.; Parkinson, R. Development of an Economic and Efficient Installation Vessel for Tidal Stream Energy Converter Arrays. In Proceedings of the ASME 2013 32nd International Conference on Ocean, Offshore and Arctic Engineering (OMAE2013), Nantes, France, 9–14 June 2013. [Google Scholar]
- Morandeau, M.; Walker, R.T.; Argall, R.; Nicholls-Lee, R.F. Optimisation of marine energy installation operations. Int. J. Mar. Energy 2013, 3–4, 14–26. [Google Scholar] [CrossRef]
- Leijon, M.; Waters, R.; Rahm, M.; Svensson, O.; Bostrom, C.; Stromstedt, E.; Engstrom, J.; Tyrberg, S.; Savin, A.; Gravrakmo, H.; et al. Catch the wave to electricity. IEEE Power Energy Mag. 2009, 7, 50–54. [Google Scholar] [CrossRef]
- Hultman, E.; Ekergård, B.; Kamf, T.; Salar, D.; Leijon, M. Preparing the Uppsala University Wave Energy Converter Generator for Large-Scale Production. In Proceedings of the 5th International Conference on Ocean Energy, Halifax, NS, Canada, 4–6 November 2014; pp. 4–6. [Google Scholar]
- Andersen, K.; Chapman, A.; Hareide, N.R.; Folkestad, A.O.; Sparrevik, E.; Langhamer, O. Environmental Monitoring at the Maren Wave Power Test Site off the Island of Runde, Western Norway: Planning and Design. In Proceedings of the 8th European Wave and Tidal Energy Conference, Uppsala, Sweden, 7–10 September 2009; pp. 1029–1038. [Google Scholar]
- Francisco, F.; Sundberg, J.; Ekergård, B.; Leijon, M. An estimation of wave energy flux and variability in the Ada Foah region: Towards commissioning of the first commercial wave power farm in Africa—Ghana. J. Mar. Sci. Eng. 2016. submitted. [Google Scholar]
| 1. | |
| 2. | |
| 3. | |
| 4. | |
| 5. |
Figure 1.
The wave energy converters (WEC) design concept, as found and developed by Uppsala University (UU) [9].
Figure 1.
The wave energy converters (WEC) design concept, as found and developed by Uppsala University (UU) [9].

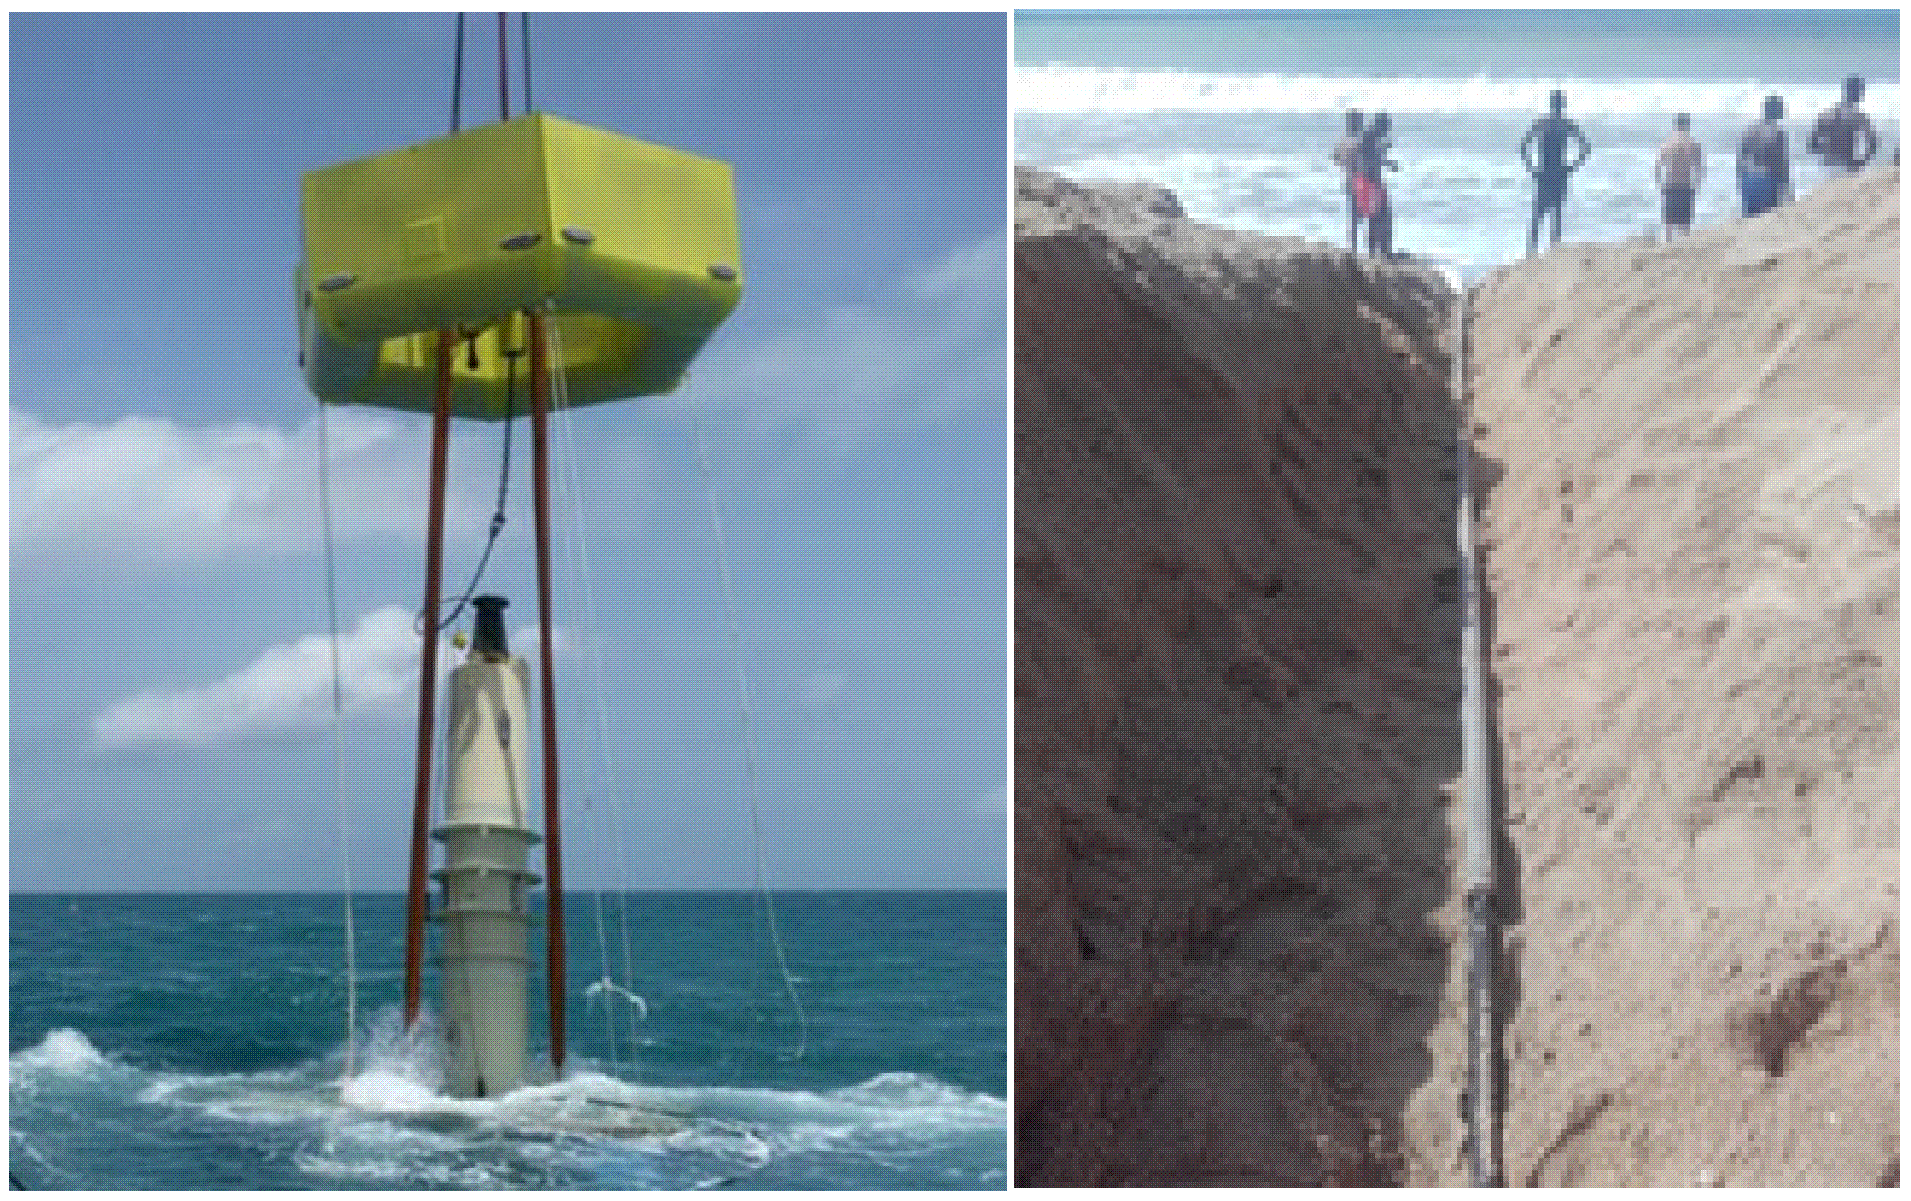
Figure 2.
The Maren test site off the Island of Runde, Norway [15].
Figure 2.
The Maren test site off the Island of Runde, Norway [15].

Figure 3.
The WECs on the barge in Maren Test Site (left) and a schematic of the deployment (right): a towing boat dragging the barge with the two WECs and their buoys on top. The smaller boat is carrying the substation connected with the wires and the cable drum. Both boats have cranes.
Figure 3.
The WECs on the barge in Maren Test Site (left) and a schematic of the deployment (right): a towing boat dragging the barge with the two WECs and their buoys on top. The smaller boat is carrying the substation connected with the wires and the cable drum. Both boats have cranes.
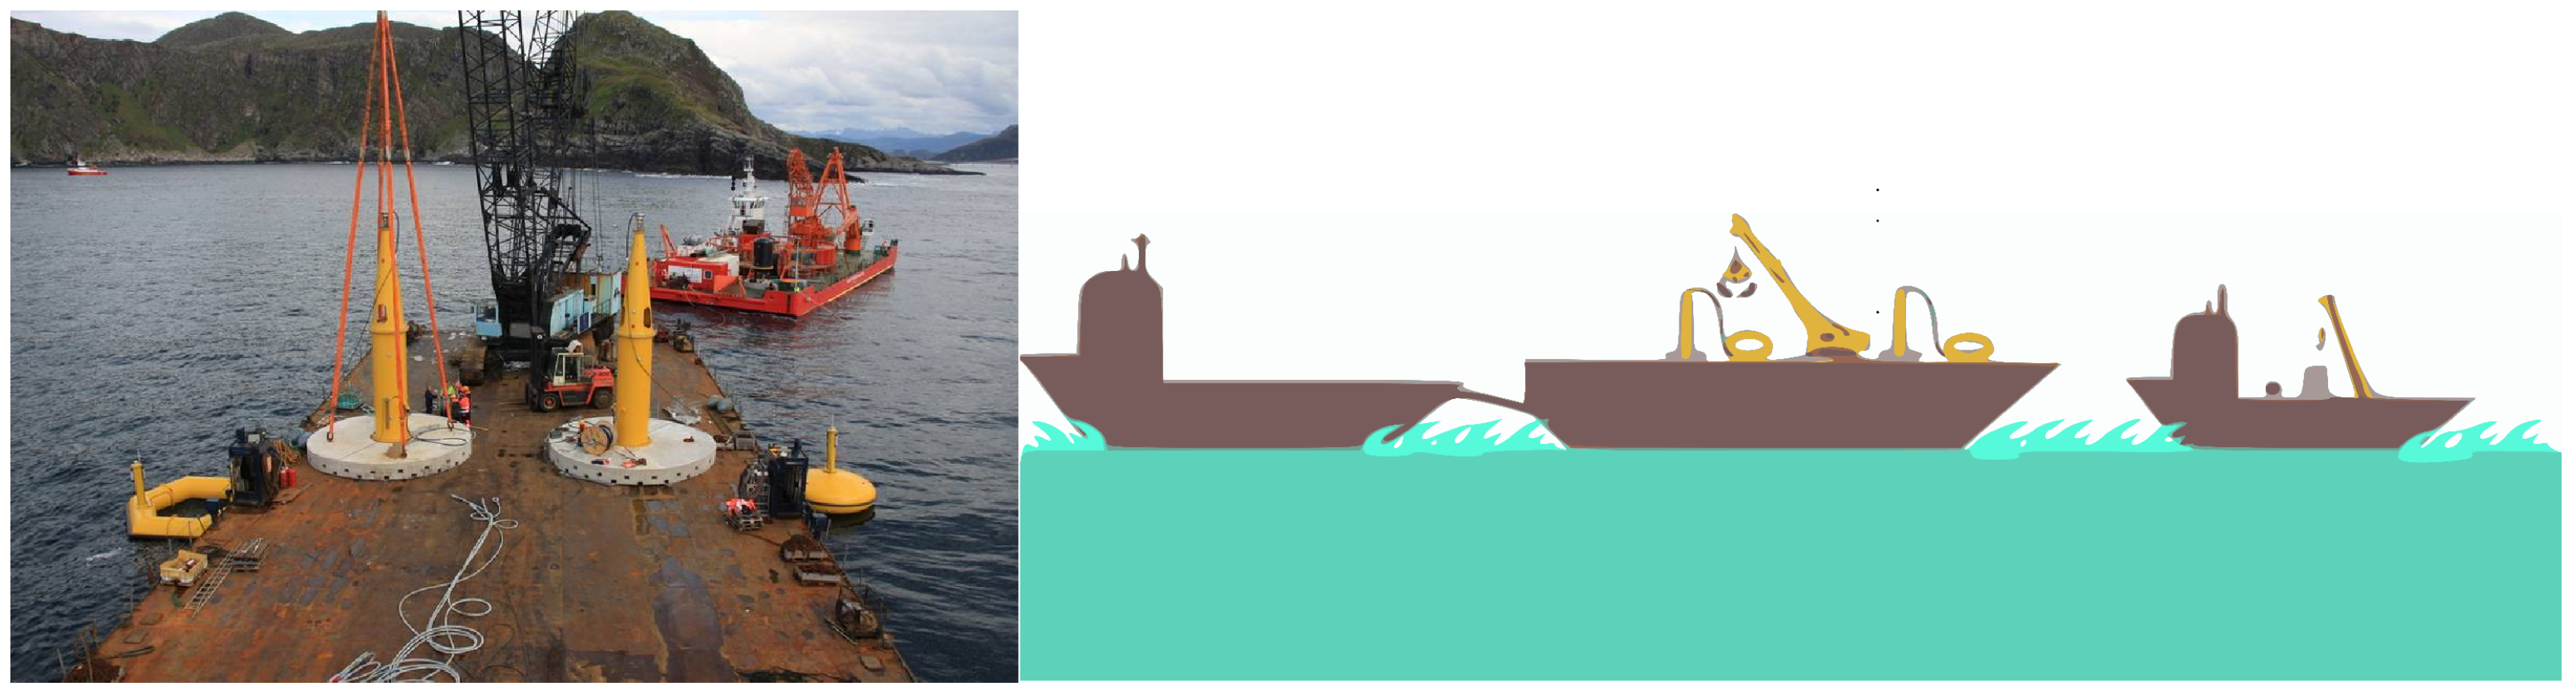
Figure 4.
Final adjustments on the quay in Runde (left) and the substation before submersion (right).
Figure 4.
Final adjustments on the quay in Runde (left) and the substation before submersion (right).

Figure 5.
The deployment site in Sotenäs, Sweden.
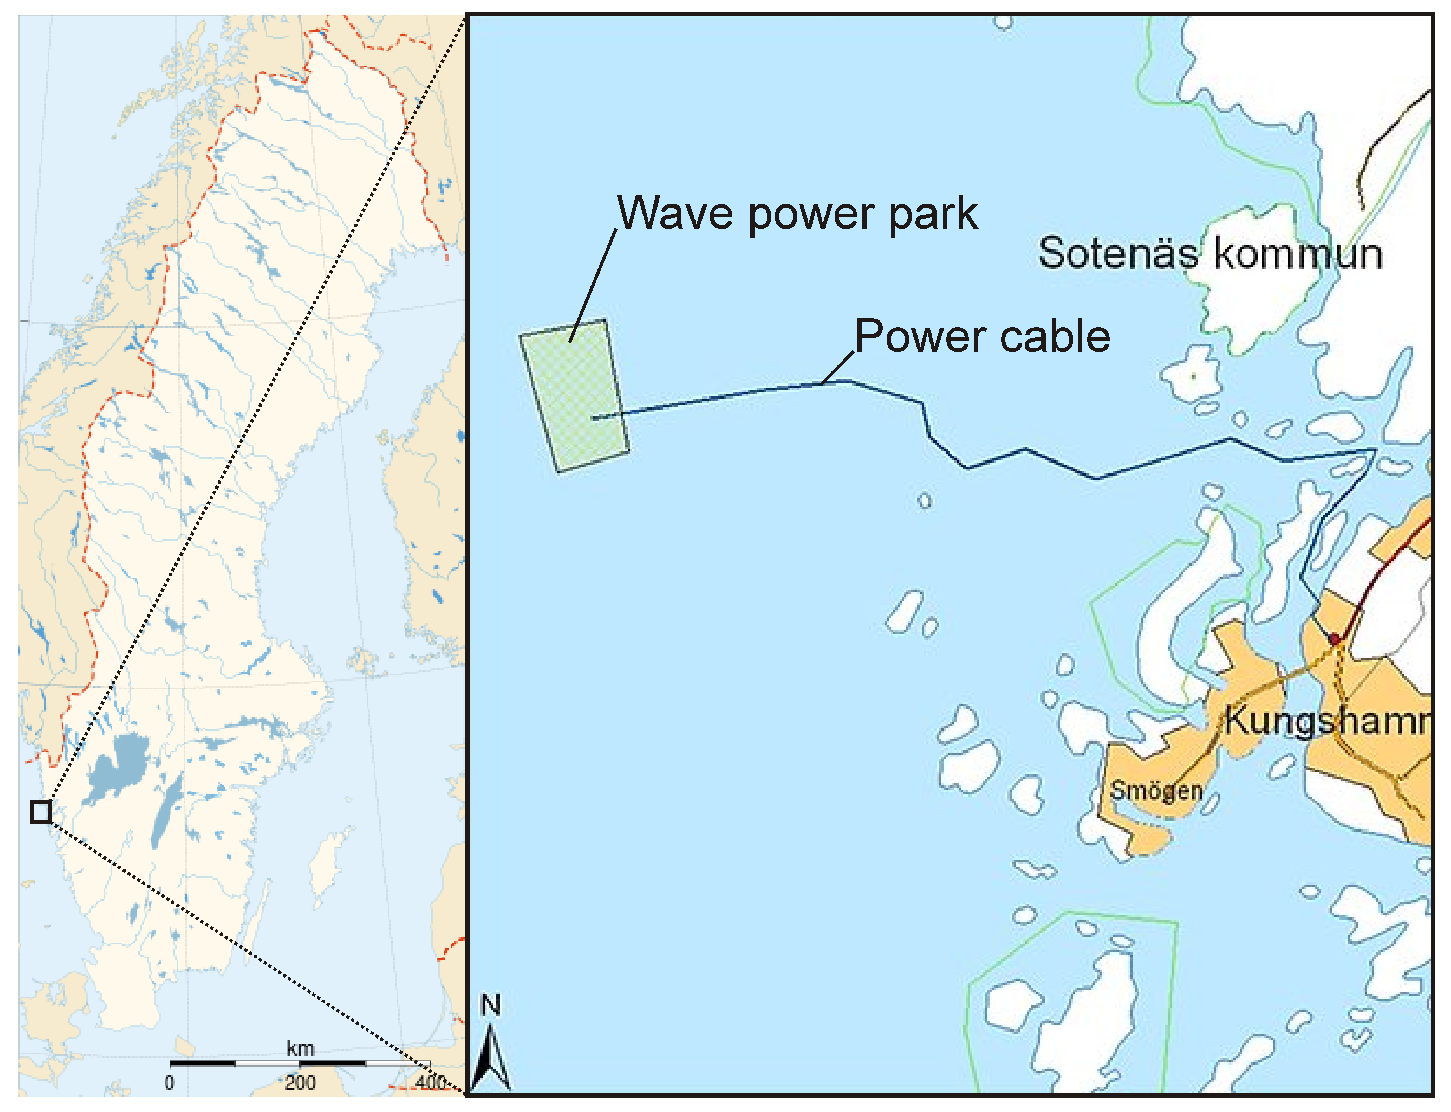
Figure 6.
Sotenäs deployments using the Samson A-Frame barge (left) and the Dina star (right).
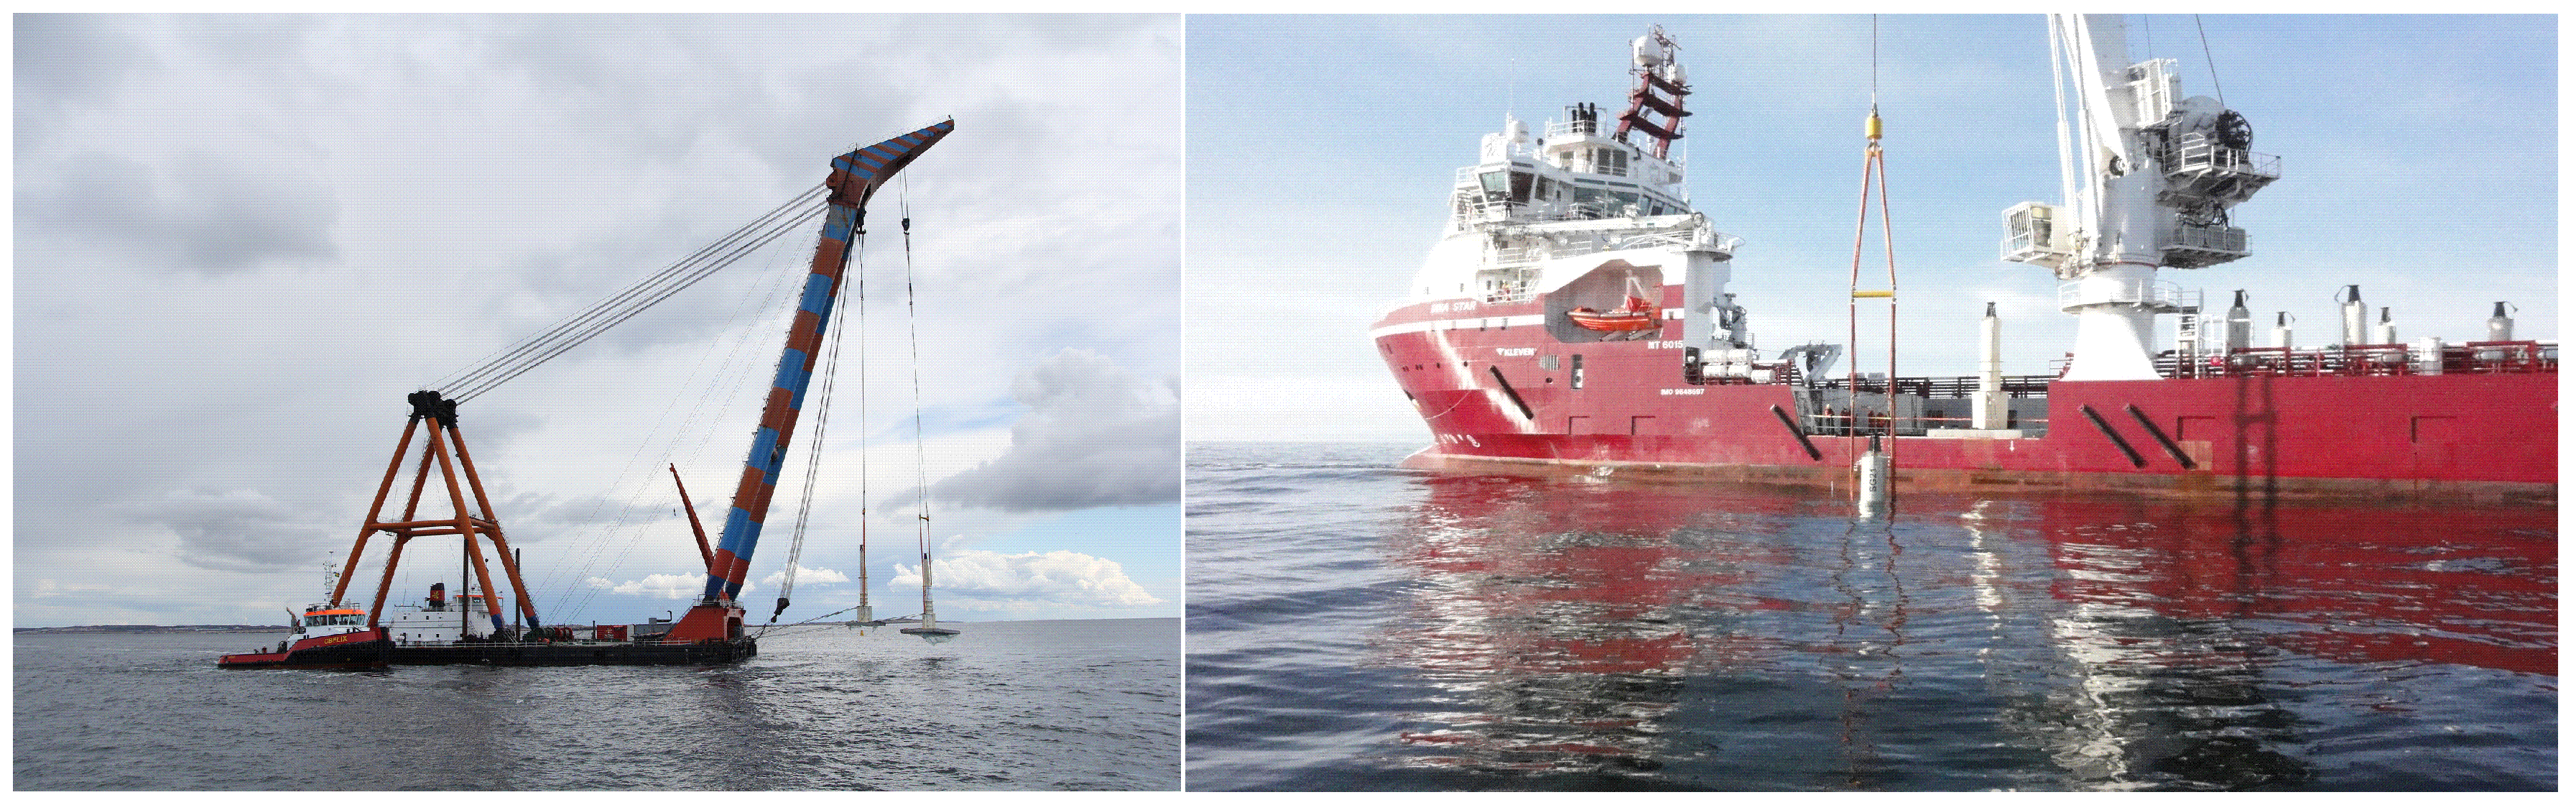
Figure 7.
The Pharaoh barge with the built crane and a WEC on it (left) and the Siem Daya 2 (right).
Figure 7.
The Pharaoh barge with the built crane and a WEC on it (left) and the Siem Daya 2 (right).

Figure 8.
The Ghana deployment site located 3 km offshore Ada Foah (left) and MV Craic (right).

Figure 9.
A WEC deployed together with the buoy (left) and the connection pipe (right).


Table 1.
Main characteristics of deployed generators.
| Location | Generator | Translator Mass | Magnet Type | Hull Height | Rated Power |
|---|---|---|---|---|---|
| Norway | 3 phase 4-sided | 1.2 tonnes | 8650 mm | 10 kW | |
| Sotenäs | 3 phase 9-sided | 9.8 tonnes | Ferrite | 6000 mm | 30 kW |
| Ghana | 3 phase 9-sided | 9.8 tonnes | Ferrite | 6000 mm | 30 kW |
Table 2.
Summary of the projects.
| Project | Vessels | Advantages | Disadvantages | Accomplishments | Crew | Time | Cost |
|---|---|---|---|---|---|---|---|
| Norway | Ulstein | Crane capacity | Depth and divers | 2 WECs w/buoys | 10 p. | 6 h/WEC | 30% |
| Seloy | Substation w/cable | ||||||
| Sotenäs | Samson | DPsystem, ROVs | 2 WECs at a time | 10 WECs | 10 p. | 2.4 h/WEC | 15% |
| Crane capacity | Very slow | ||||||
| Dina star | Vessel capacity | Availability | 25 WECs | 31 p. | 1.92 h/WEC | 50% | |
| Crane capacity | Cost | ||||||
| ROVs, mooring | Pilot | ||||||
| GPS, DP system | |||||||
| Operating 24 h. | |||||||
| Pharaoh | Low cost rate | Positioning | Substation | 6 p. | 36 h/subst. | 11% | |
| Versatile | Mooring | ||||||
| No DP system | |||||||
| Siem Daya 2 | Vessel capacity | — | Substation | 30 p. | 4 h/subst. | 24% | |
| Crane capacity | |||||||
| ROVs | |||||||
| GPS, DP system | |||||||
| Mooring | |||||||
| Operating 24 h. | |||||||
| Ghana | MV Craic | Crane capacity | No DP system | 6 WECs | 20 p. | 2.7 h/WEC | >20% |
| Small draft |
© 2017 by the authors. Licensee MDPI, Basel, Switzerland. This article is an open access article distributed under the terms and conditions of the Creative Commons Attribution (CC BY) license (http://creativecommons.org/licenses/by/4.0/).
Share and Cite
MDPI and ACS Style
Chatzigiannakou, M.A.; Dolguntseva, I.; Leijon, M. Offshore Deployments of Wave Energy Converters by Seabased Industry AB. J. Mar. Sci. Eng. 2017, 5, 15. https://doi.org/10.3390/jmse5020015
AMA Style
Chatzigiannakou MA, Dolguntseva I, Leijon M. Offshore Deployments of Wave Energy Converters by Seabased Industry AB. Journal of Marine Science and Engineering. 2017; 5(2):15. https://doi.org/10.3390/jmse5020015
Chicago/Turabian StyleChatzigiannakou, Maria Angeliki, Irina Dolguntseva, and Mats Leijon. 2017. "Offshore Deployments of Wave Energy Converters by Seabased Industry AB" Journal of Marine Science and Engineering 5, no. 2: 15. https://doi.org/10.3390/jmse5020015
Note that from the first issue of 2016, this journal uses article numbers instead of page numbers. See further details here.