Article

STORMTOOLS: Coastal Environmental Risk Index (CERI)

1
Ocean Engineering, University of Rhode Island, Narragansett, RI 02882, USA
2
Environmental Data Center, University of Rhode Island, Kingston, RI 02881, USA
3
Coastal Resources Center, University of Rhode Island, Narragansett, RI 02882, USA
4
Coastal Resources Management Council, Wakefield, RI 02879, USA
5
Environmental Earth Sciences, Eastern Connecticut State University, Willimantic, CT 06226, USA
6
Department of Marine Affairs, University of Rhode Island, Kingston, RI 02881, USA
*
Author to whom correspondence should be addressed.
J. Mar. Sci. Eng. 2016, 4(3), 54; https://doi.org/10.3390/jmse4030054
Submission received: 15 July 2016 / Revised: 22 August 2016 / Accepted: 22 August 2016 / Published: 31 August 2016
(This article belongs to the Section Ocean Engineering)

Abstract

:
One of the challenges facing coastal zone managers and municipal planners is the development of an objective, quantitative assessment of the risk to structures, infrastructure, and public safety that coastal communities face from storm surge in the presence of changing climatic conditions, particularly sea level rise and coastal erosion. Here we use state of the art modeling tool (ADCIRC and STWAVE) to predict storm surge and wave, combined with shoreline change maps (erosion), and damage functions to construct a Coastal Environmental Risk Index (CERI). Access to the state emergency data base (E-911) provides information on structure characteristics and the ability to perform analyses for individual structures. CERI has been designed as an on line Geographic Information System (GIS) based tool, and hence is fully compatible with current flooding maps, including those from FEMA. The basic framework and associated GIS methods can be readily applied to any coastal area. The approach can be used by local and state planners to objectively evaluate different policy options for effectiveness and cost/benefit. In this study, CERI is applied to RI two communities; Charlestown representing a typical coastal barrier system directly exposed to ocean waves and high erosion rates, with predominantly low density single family residences and Warwick located within Narragansett Bay, with more limited wave exposure, lower erosion rates, and higher residential housing density. Results of these applications are highlighted herein.

Graphical Abstract

1. Introduction

To assist state and local municipalities in planning for coastal areas, an assessment of the environmental conditions that the areas are subjected to, or might experience in the future, are often made. These might include flooding and inundation maps for given categories of storms (category of hurricanes) such as those available from National Oceanic and Atmospheric Administration (NOAA) Sea, Lake, and Overland Surges from Hurricanes (SLOSH) model predictions [1] or for various water level return periods (once in 100 years being the most typical). It is common to review maps that show the impact of sea level rise (SLR) covering the range and uncertainty over a selected time horizon (50 or 100 years). Estimates of the wave conditions (maximums or by return period) along the coast would be useful but are rarely available at sufficiently high resolution. Estimates of wave conditions in areas inundated by floods are also important but also not typically available. Federal Emergency Management Agency (FEMA), Flood Insurance Rate Maps (FIRM) combine flooding and wave conditions for a 100 year return period and are readily available, but use very primitive wave modeling for flood inundated areas and exclude any consideration for SLR. The uncertainty in these maps is typically not documented and they generally are not as conservative as desired for planning purposes since SLR considerations are not addressed. Finally shorelines can show substantial spatial and temporal variability in erosion/deposition rates dependent on both environmental forcing and coastal geomorphology.
In order to provide an overall assessment of risk or vulnerability, the various data sets can be summarized in terms of relative vulnerability. As an example, a coastal vulnerability index has been prepared by [2] for the Cape Cod National Seashore (CCNS). The index is based on coastal geomorphology, shoreline change, coastal slope, SLR, significant wave height, and tidal range. The vulnerability is given for each parameter in the index and then weighted to provide an overall vulnerability. Surprisingly the index has no parameter to represent storm induced flooding or the wave conditions associated with storms. It provides a clear overview of the broad scale of vulnerability along the shoreline but does not provide sufficient resolution to address vulnerability at spatial scales of interest for local vulnerability or planning. Hapke et al. (2010) [3] provide a detailed assessment of shoreline change based on historical observations that are used to help inform coastal management decision making. While useful for regional scale analysis the discretization is typically too coarse to meet local planning needs.
The challenge in supporting municipal and state planning and management agencies is the availability of an objective, quantitative assessment of the risk, to both structures and infrastructure, that coastal communities face from storm surge in the presence of changing climatic conditions, particularly sea level rise and coastal erosion. Ideally the assessment tool or index would also allow planners and managers to evaluate a variety of regulatory and nature and engineered based options to mitigate the risk.
The goal of the present effort is to develop and apply a Coastal Environmental Risk Index (CERI) to assess the risk that structures and infrastructure face from storm surges, including flooding and the associated wave environment, in the presence of sea level rise (SLR), and shoreline erosion/accretion.
Section 2 provides an overview of the design of CERI and its associated building blocks. The results of the application of CERI to two communities; Charlestown, RI representing a typical barrier system directly exposed to ocean waves and high erosion rates, with predominantly single family residences and Warwick, RI located within Narragansett Bay, with limited wave exposure, low erosion rates and a higher residential housing density are provided in Section 3. Discussion of the results are integrated into Section 3 and conclusions provided in Section 4.

2. Methods

An overview of the approach used in CERI is shown in the flow chart in Figure 1. The study area selected for application is typically defined by the region that might be flooded during 100 (1%) to 500 year (0.02%) return period events, with or without sea level rise (SLR), for the location of interest. The method requires input of storm water levels and associated wave conditions for the scenarios of interest (storm return period, sea level rise scenario, shoreline erosion and dune failure). Locations of the structures and infrastructure, including the structure type and its attributes, are necessary to determine those at risk of flooding, and finally the inundation and wave damage functions by structure type. Estimates are then made for inundation, wave, and erosion damage to individual structures/infrastructure, and structure content. CERI predictions are provided in the form of damages to structures/infrastructure typically shown on a GIS map, with inundation or total water (inundation and waves) depth as an overlay to help put the damage in context of the flooding. To quantify the impact the probability distribution and cumulative probability distributions of the number of structures damaged by percent damage are provided. Each of the building blocks in the analysis are given below to provide additional detail about how they are obtained.
The user first needs to select the study area for the analysis and the scenarios of interest. The study area should be restricted to the region that might be impacted by flooding for the case that results in the largest flooding footprint (e.g., 100 year and 2 m SLR). A digital elevation model (DEM) is typically used to describe the study area and set the horizontal and vertical reference frame on which the analysis is performed and results presented. The DEM should seamlessly cover the bathymetry and topography of the area with specified horizontal (e.g., latitude/longitude, state plane coordinates, NAD83) and vertical referencing (e.g., NAVD88). Ideally, the topographic data is available from recent Light Detection And Ranging (LIDAR) or similar high resolution (numbers of meters) surveys.

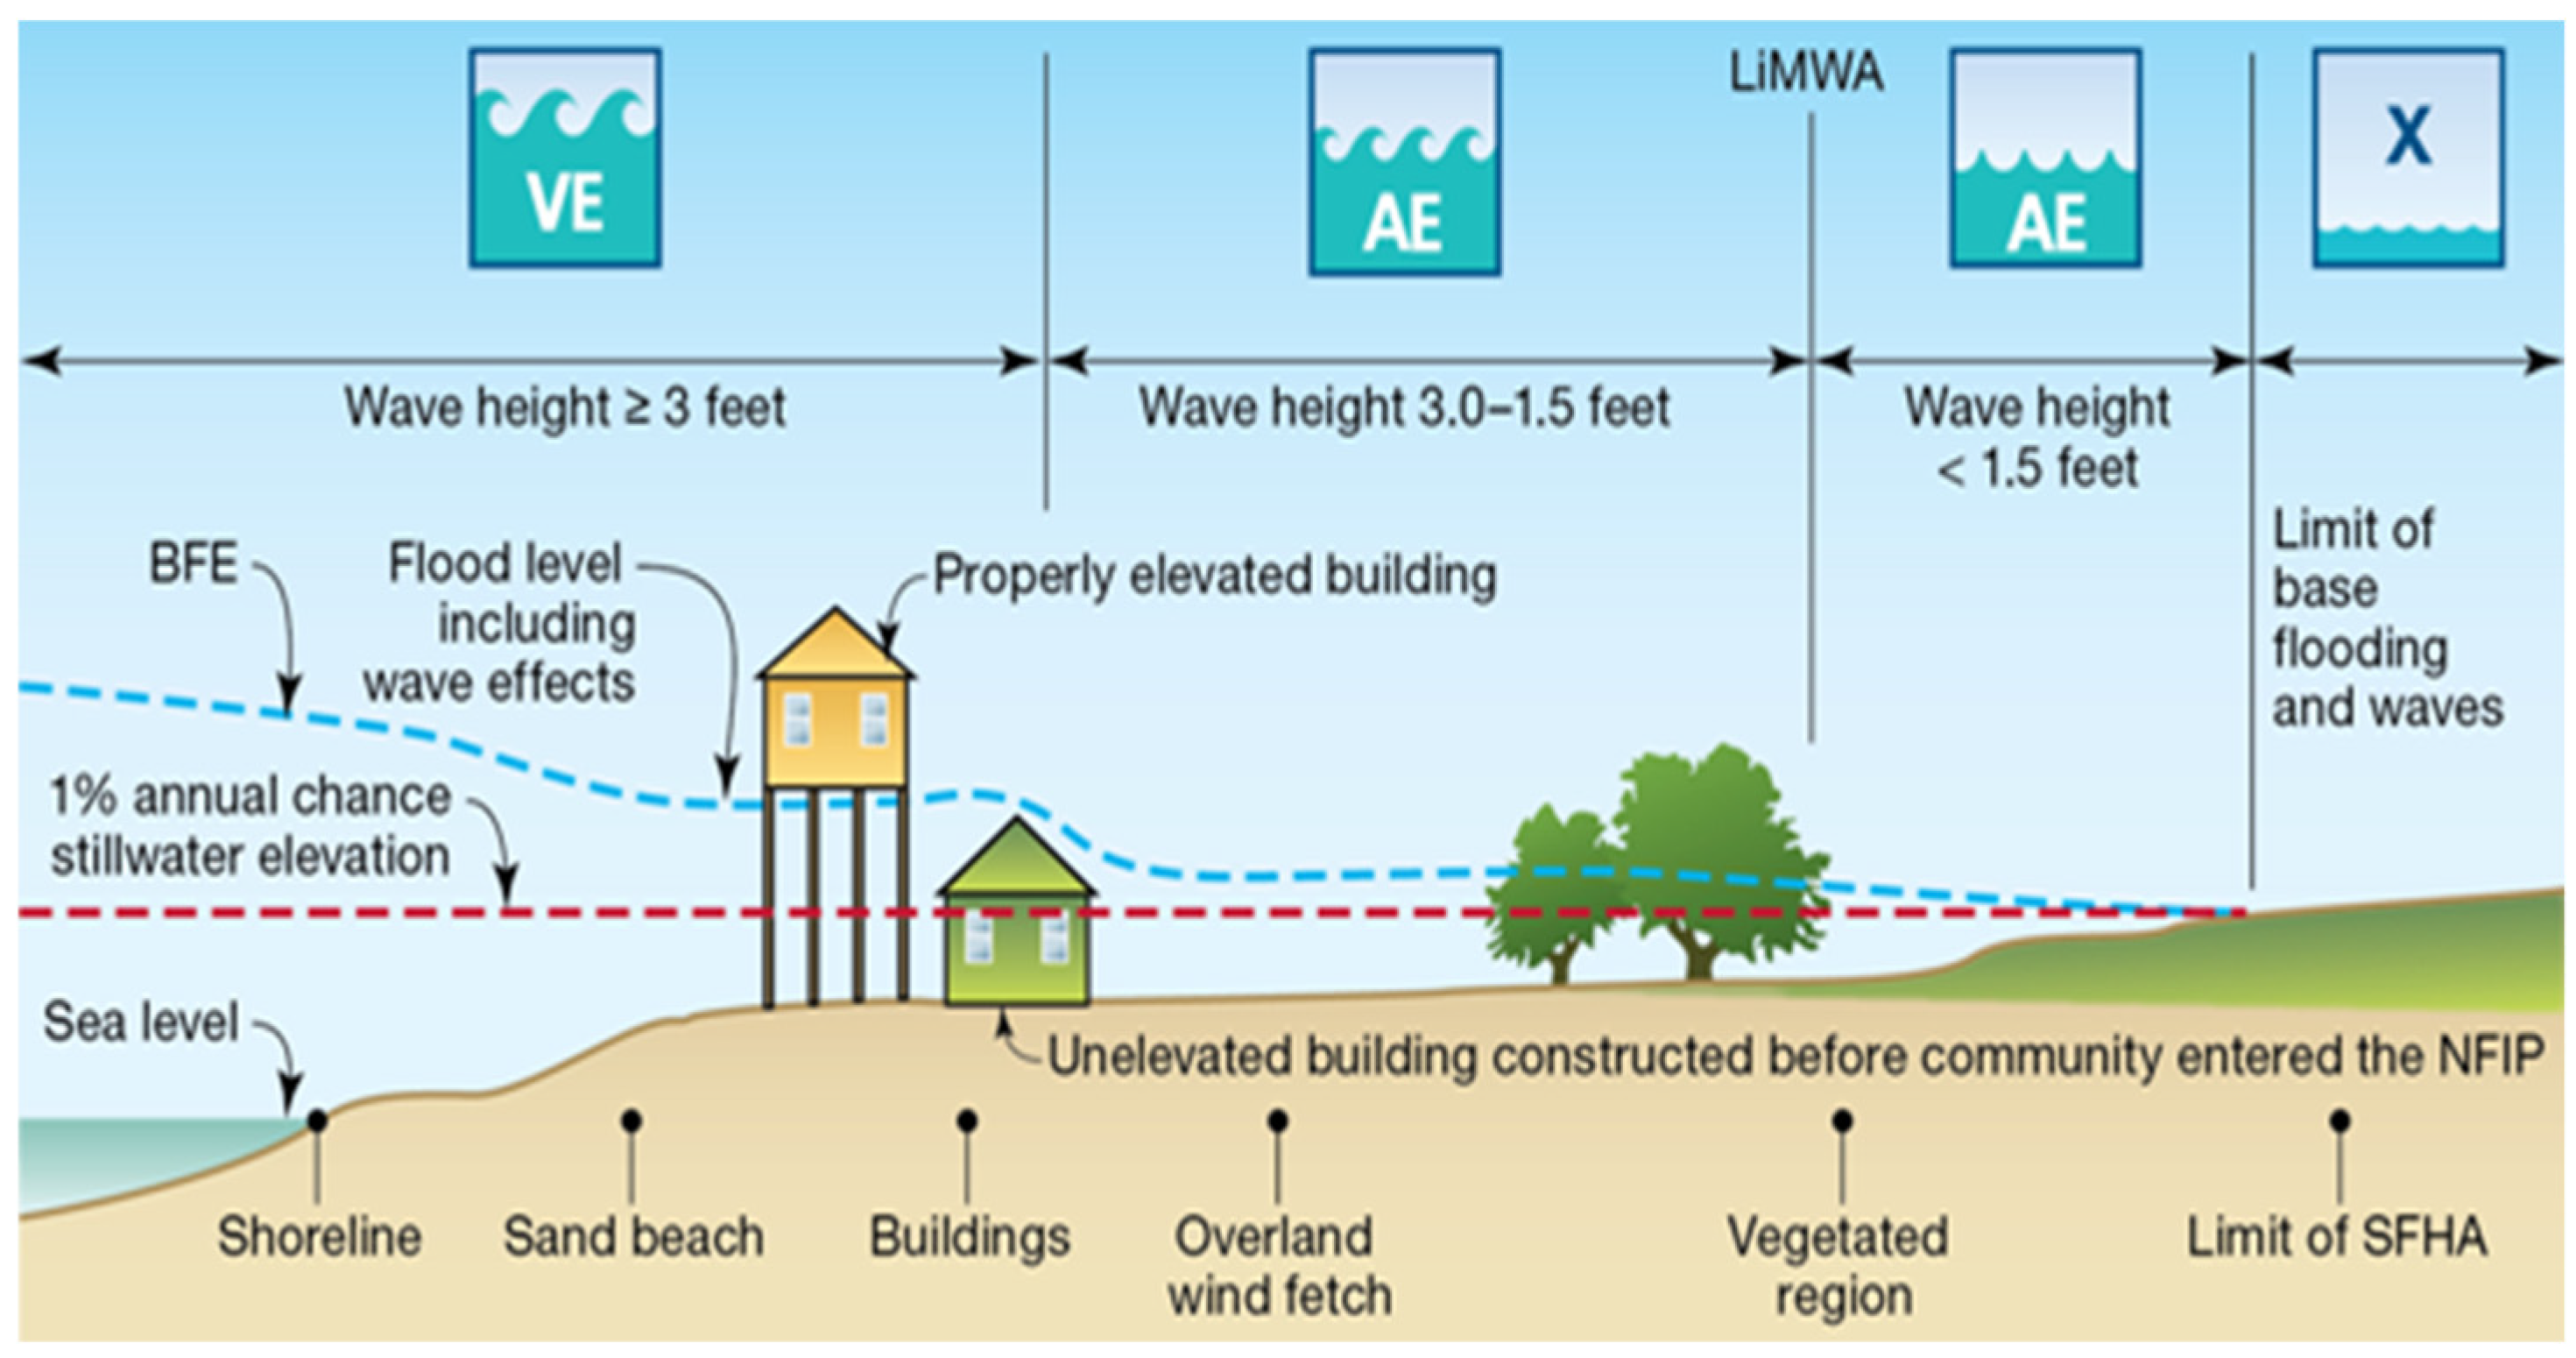
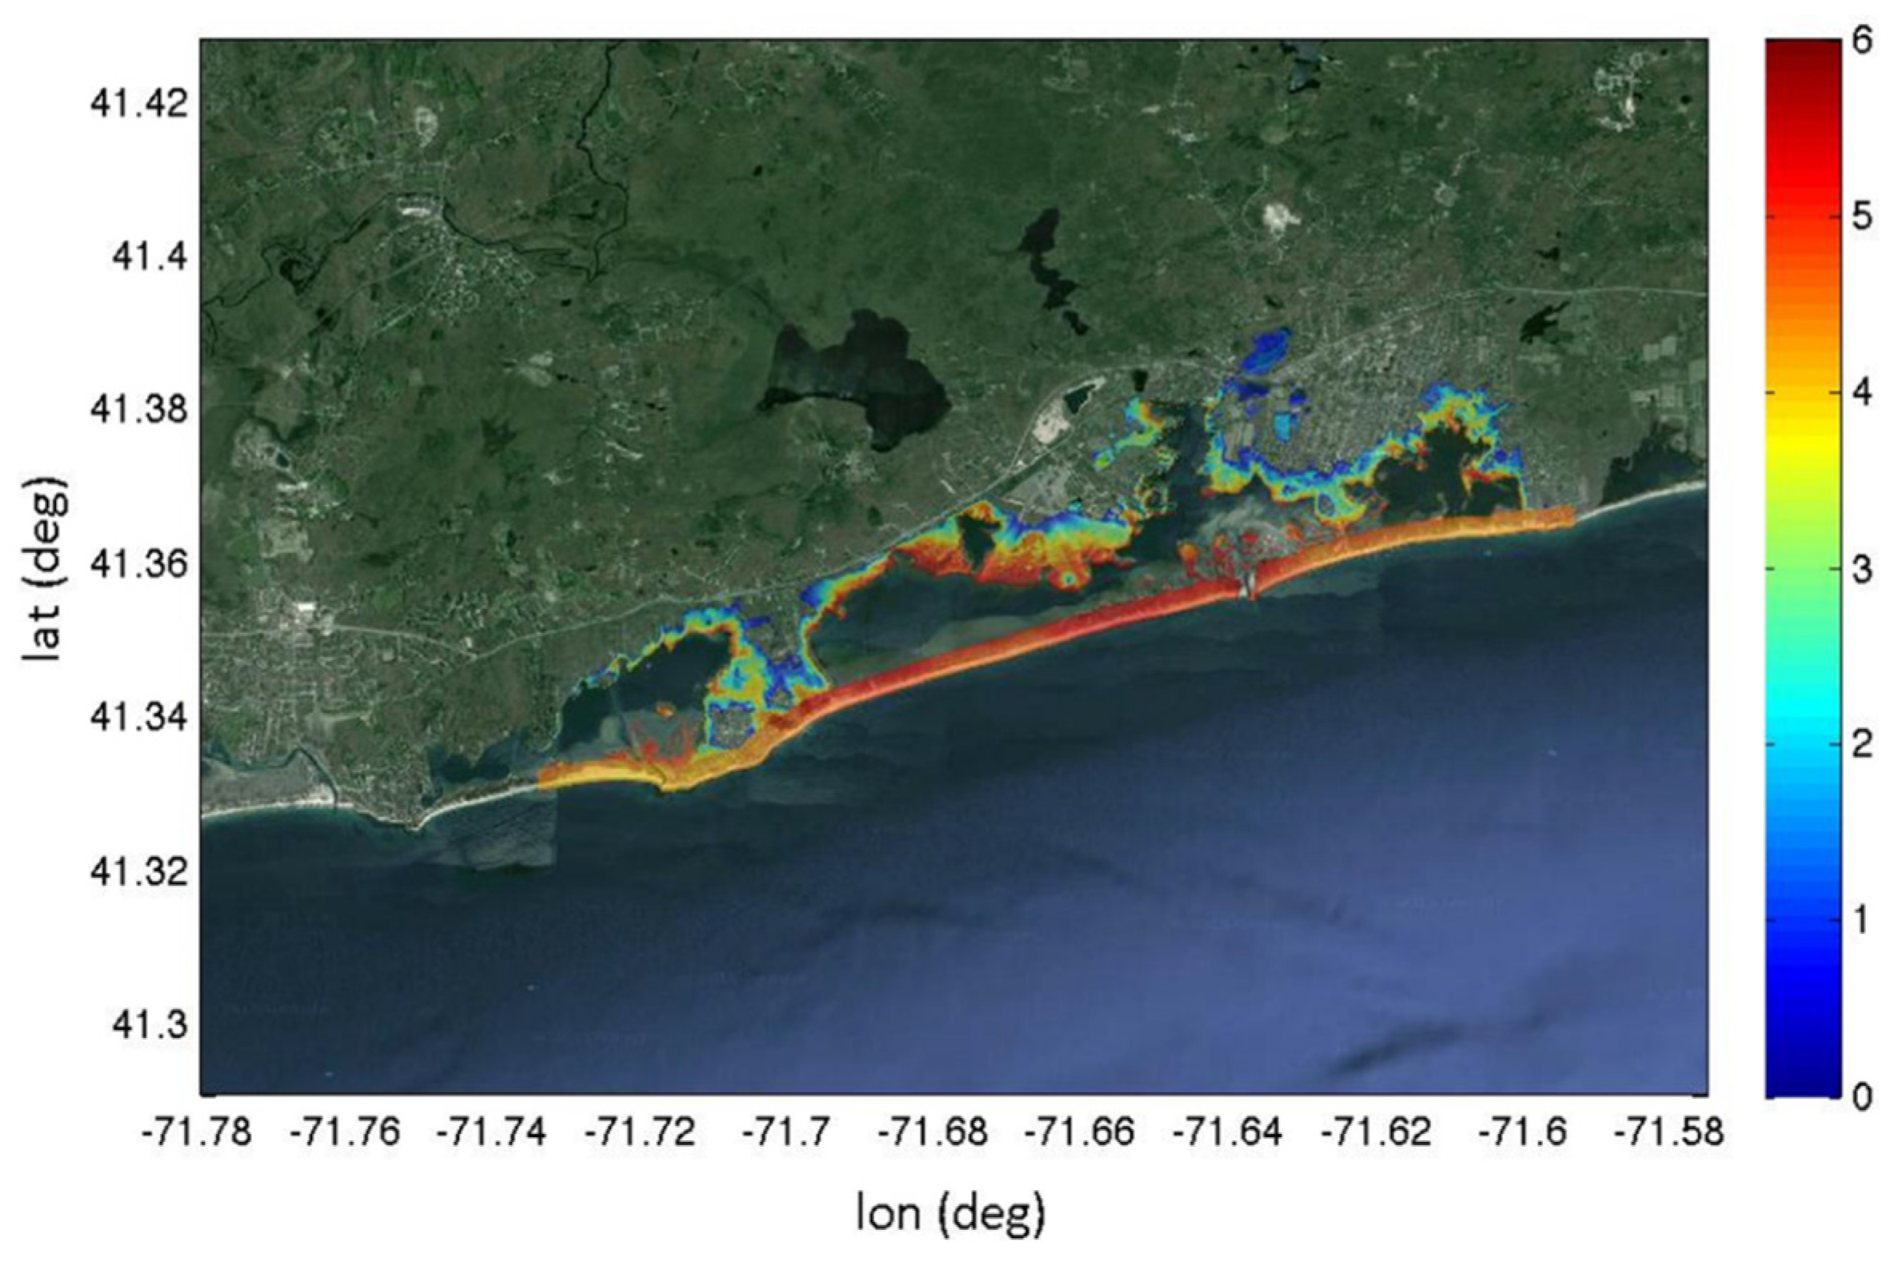
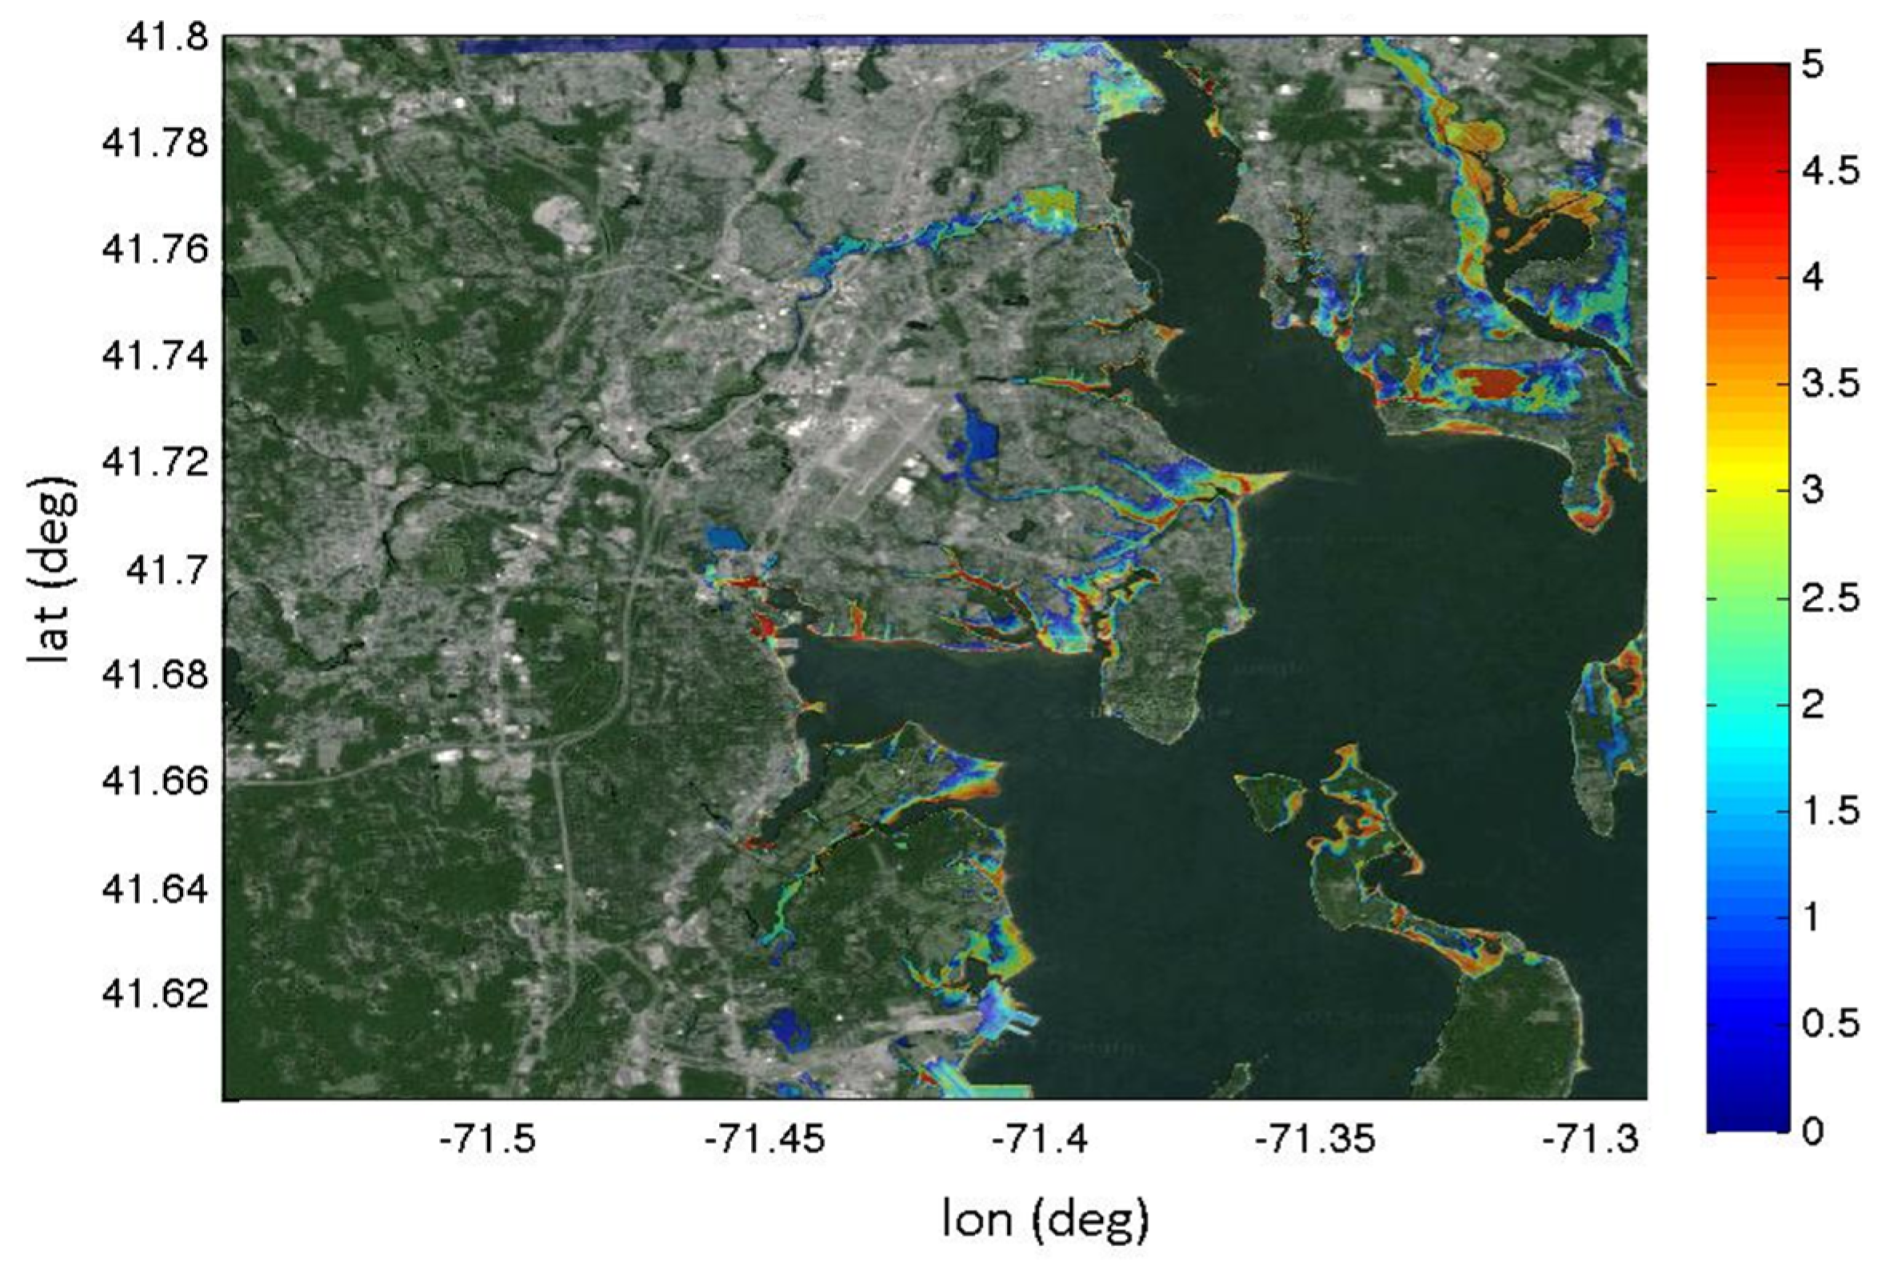
2.1. Inundation and Waves

Estimates of the storm inundation extent and depths and wave heights in the flooded area need to be provided for the scenario of interest. The study domain can include areas subject to coastal, riverine, or both coastal and riverine flooding. It is critically important that the wave estimates are consistent with the storm inundation scenario and cover the flood impacted areas. These fields are typically generated by application of state of the art, coupled, hydrodynamic and wave models (e.g., ADCIRC- SWAN or ADCIRC-STWAVE) for the study area. Simulations are performed using the coupled models for the offshore region to predict the level of flooding for the inundated area and to generate boundary conditions for models used to predict the wave environment in this region. The end result of this process are inundation depths and wave heights for each grid in the model domain for the scenario selected. Output of the wave models needs to processed to generate the controlling wave heights, as defined by FEMA (2007) [4], to be consistent with the damage functions used in the analysis. In practice, the resolution of the underlying DEM is ideally about 1 m (on to which the flooding is mapped) with the wave heights being provided on a grid with a resolution of 10–50 m. As an alternative, the inundation and wave heights can be obtained from FEMA Flood Insurance Rate Maps (FIRM) for the area of interest. These maps provide data for both SWEL (still water elevation) (inundation depth) and BFE (Base Flood Elevation) (inundation plus waves). The BFE minus SWEL provides an estimate of the controlling wave height. It is noted that simulations based on STWAVE do not include wave run-up, while FEMA FIRMS maps do. The ACOE damage assessment methodology used in the present analysis (Section 2.3) explicitly excludes wave run-up. If run-up is critical in the area it needs to added to estimate the wave conditions. This will require modification of the damage estimation methodology as well.
In the event that the shoreline erodes from its current location this needs to considered and appropriately linked to the inundation and wave estimates. This adjustment might include migration of the shoreline (landward: erosion or seaward: accretion) or modification of the cross shore profile and associated impact on any dunes present. The erosion rates can be based on historical rates projected into the future or adjusted rates that consider the impacts of SLR on erosion.

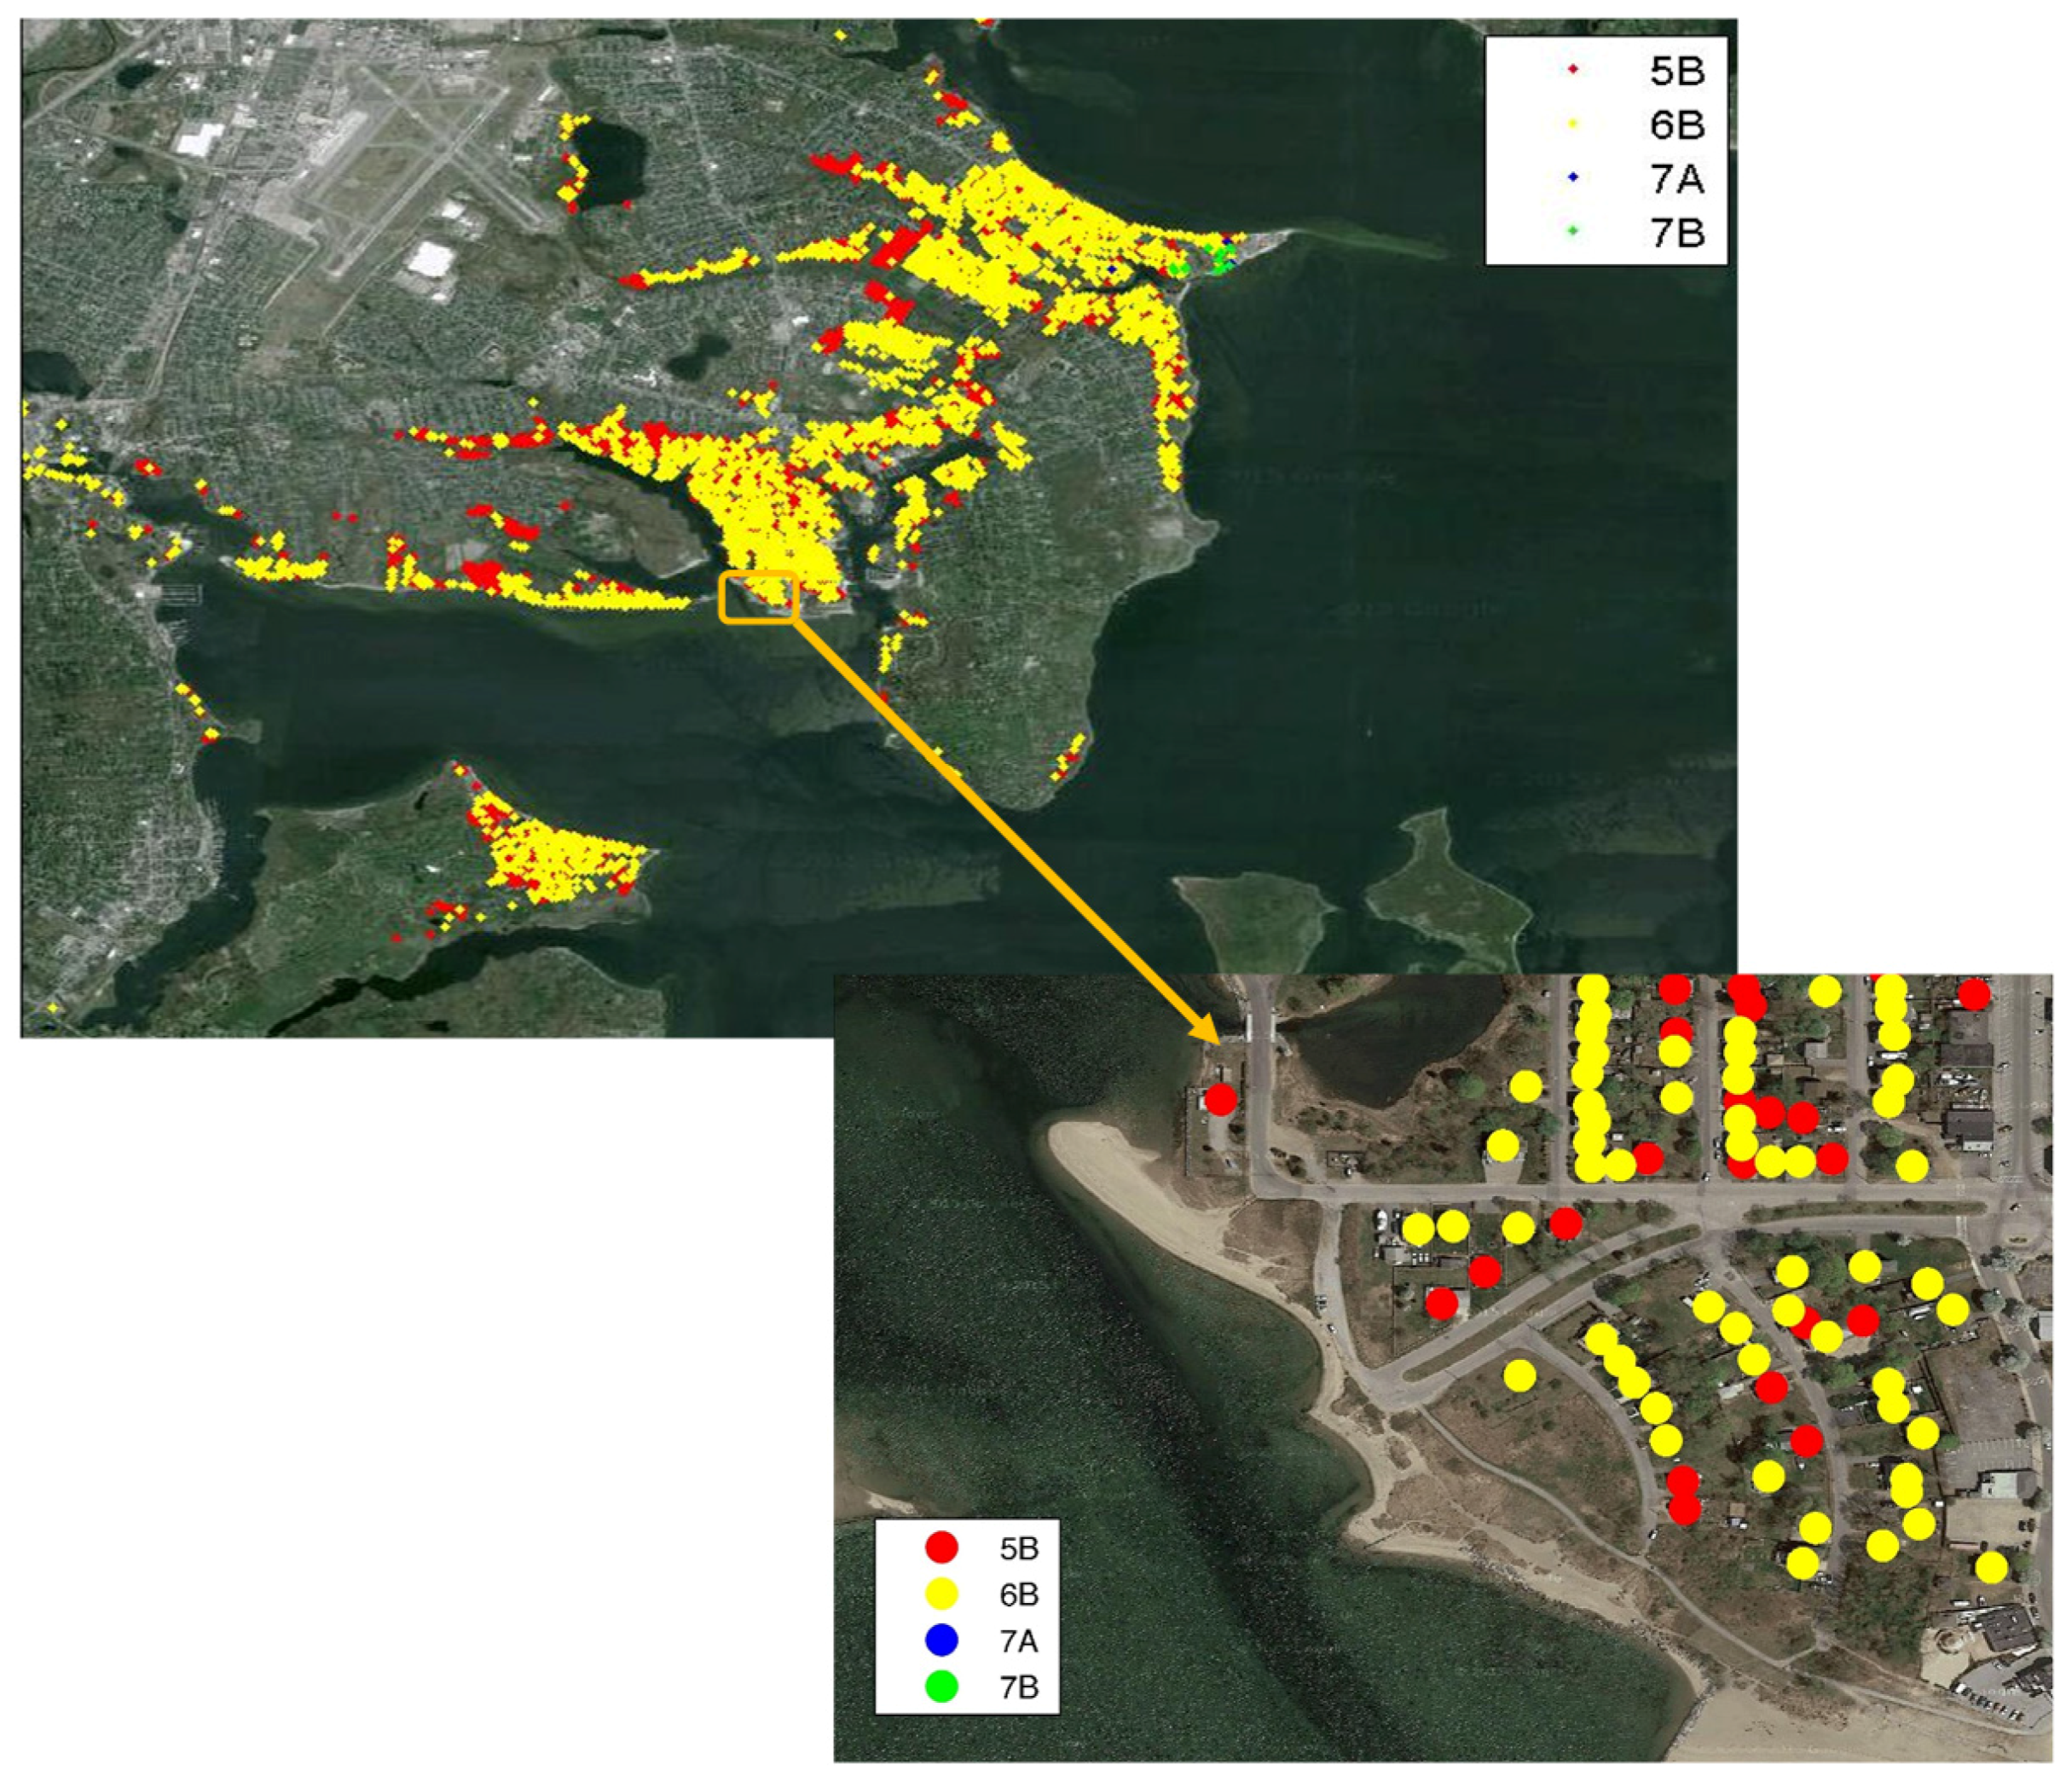
2.2. Structures and Infrastructure

The user needs to provide a comprehensive map of the location and characteristics of the structures and infrastructure located in the area potentially impacted by flooding. This characterization needs to be internally consistent with the damage functions that are used. In the present work the US Army Corp of Engineers damage functions, as updated from Hurricane Sandy as part of the North Atlantic Comprehensive Coastal Study (NACCS), have been used for the structures that are typically found in the coastal zone [5]. These are summarized in Table 1. Subcategories are included to denote without (A) and with (B) basements. This is an important distinction as damage to structures with basements occurs before flooding reaches the elevation of the structure.
In addition to this information, the first finished floor elevation (FFE) has to be provided for each structure. This is integral to the formulation and implementation of the damage functions. FFEs are typically in the range of 0.3 to 0.6 m for Prototypes 5 and 6, and nominally 3 m for structures on piles (Prototype 7). The value can vary substantially for pile based structures and normally requires verification from permit applications or ideally field validation.
The location of infrastructure (waste water treatment facilities, electrical transformers, bridges, etc.) and its type also needs to be mapped. The level of mapping of infrastructure is guided by damage categories typically used by FEMA (2011) HAZUS [6].
In practical applications, the locations of structures and infrastructure can be provided by parcel data at the town, county, or state level for the areas of application. As an alternate, the emergency call data base (E911) has information on structure type and location. The FFEs can be obtained by noting the structure type and reviewing photographs in the database. Field validation of the resulting maps is recommended, particularly for pile supported structures whose FFEs might vary substantially.

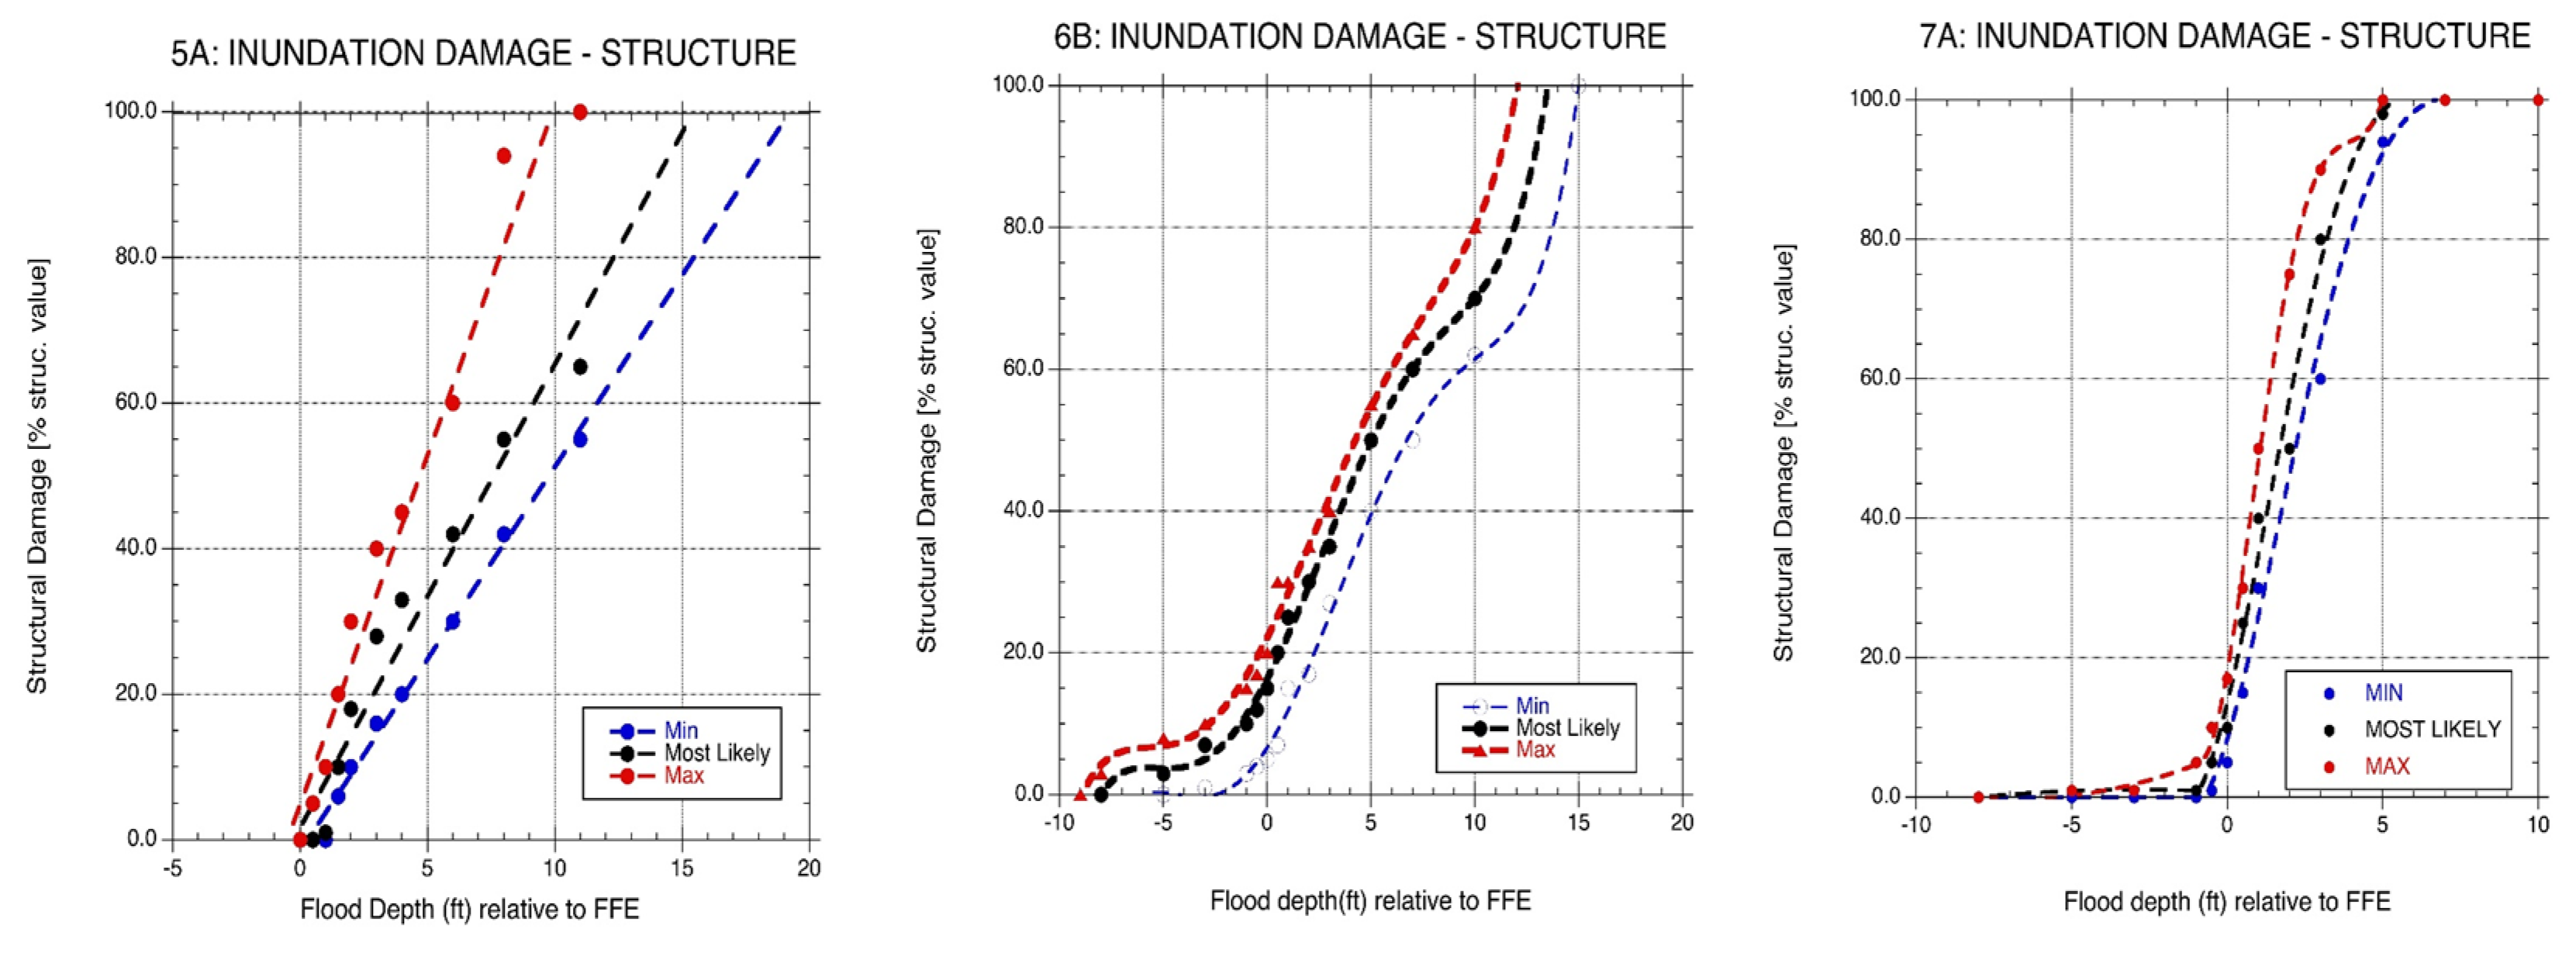
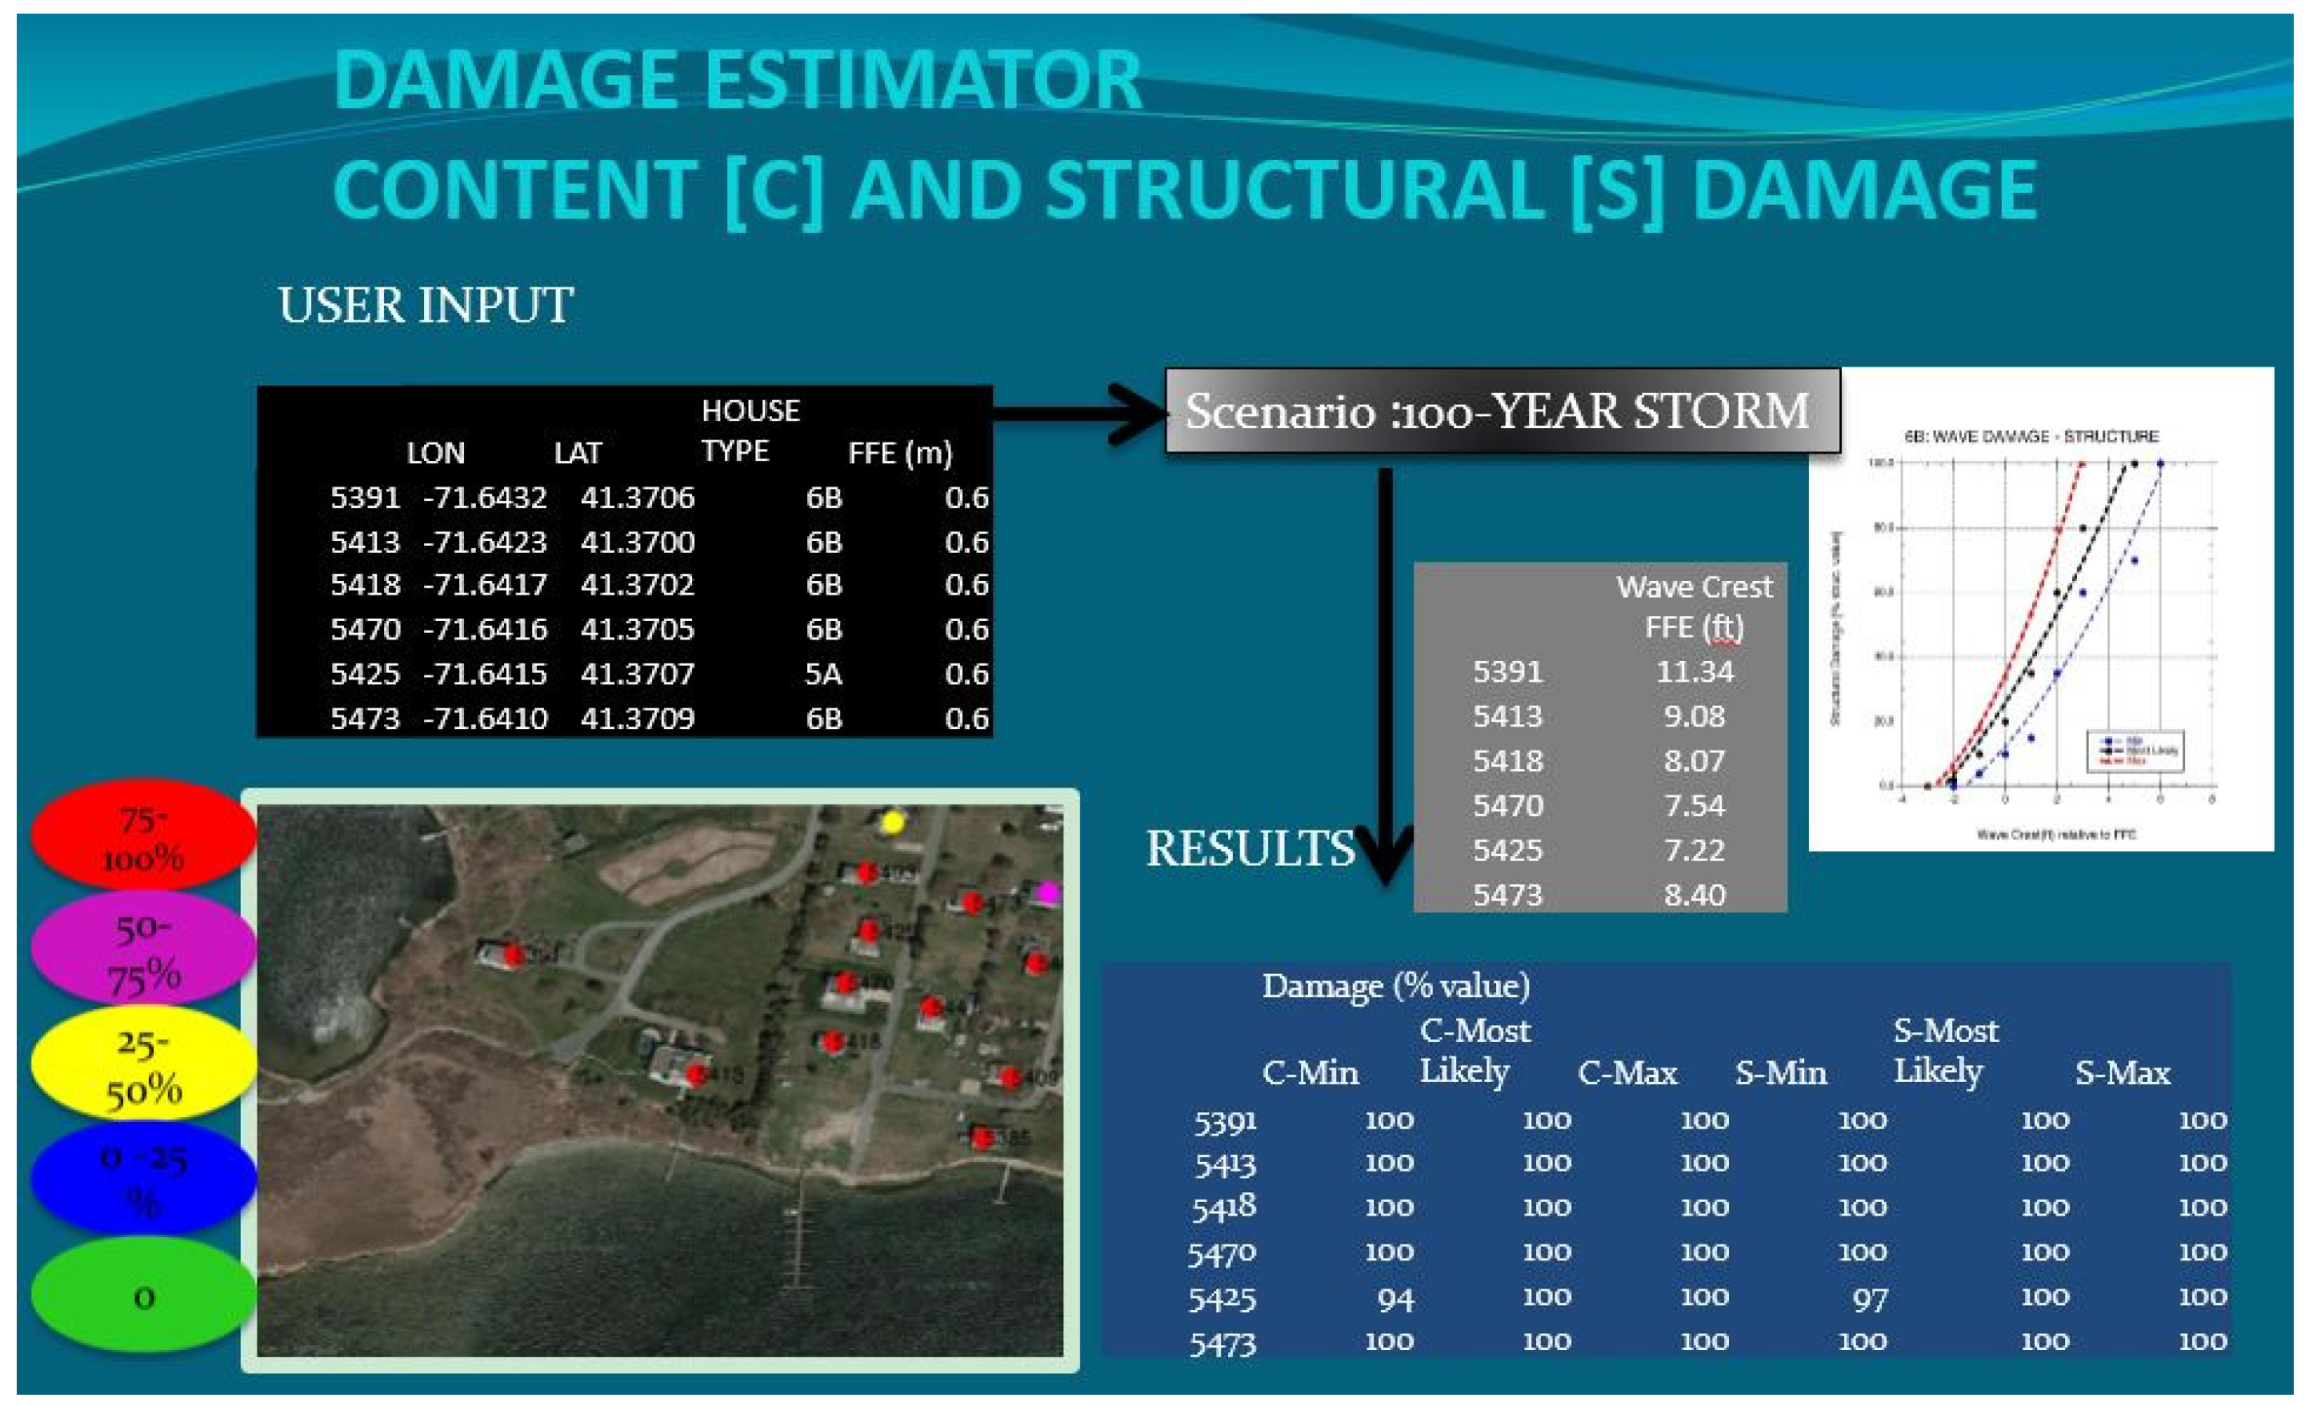
2.3. Structure and Content Damage Functions

The damages for a given level of inundation with associated waves, specified prototype, and FFE are estimated for each structure in the study area based on damage function curves (damage vs. depth of inundation/waves). For the present application the damage functions are based on the ACOE NACCS (2015) [5] study. Estimates are made of the damage to the structure and content from inundation and waves for each prototype class. Damages are estimated separately for inundation and waves and the largest of the two is used following the ACOE (2015) [5] protocol. Figure 2 shows the set of damage functions for Prototype 5A (Table 1). Minimum, most likely, and maximum damage curves are provided. The dots in the plot represent points selected by the NACCS to represent the data and dashed lines are curve fits to the data.
One important finding is the role that presence or absence of a basement plays in developing damage curves. Figure 3 shows the damage vs. elevation relative to the FFE for Prototype 5A (single story home, without basement) and Prototype 6B (single story, with basement) (left and center panels). Figure 4 provides the FEMA definitions of SWEL and BFE and shows the relationship of on grade and elevated structures to these flood references. It is observed that damage for the house with a basement (6B) occurs when the depth relative to FFE is negative because of flooding of the basement. The right hand panel of Figure 3 shows the case of elevating the structure on piles (7). The damage curve moves to the right lowering the damage and reflecting the impact of elevating the structure on the damage.
As currently structured, CERI provides statistical details on the damage on a structure by structure basis for the various scenarios. These can readily be converted to cost by assigning values to each structure. This is most readily done by using parcel data available from the towns that serve as the basis for local property taxes. The individual damage estimates can be aggregated across the study area to develop estimates of total risk or risk by structure class. The framework allows planners to evaluate the implications of various policy options both in the near and far term. The risk in CERI is parameterized in terms of percent damage to structure and infrastructure. This can be converted to a risk index if desired by establishing a suitable protocol. As an example, take the mean damage to each structure class multiply by the number of structures in that class, sum over all structure classes and divide by the total number of structures. This results in an index varying from one to 100, the higher the value the greater the risk.

3. Results

CERI, as outlined in Section 2, was applied to the eastern end of Matunuck Beach, RI along the southern RI coast line. The results are reported in [7]. In the present study CERI was applied to two towns in RI to evaluate its performance in different environmental exposure and coastal residential regimes: Charlestown, RI along the southern coast and directly exposed to surge, waves, and coastal erosion from Block Island Sound and the adjacent ocean and Warwick, RI located well inside Narragansett Bay and generally protected from wave exposure and coastal erosion but with greater housing density. The locations are shown in Appendix A (Figure A1) The application of CERI to each of these areas is provided below.

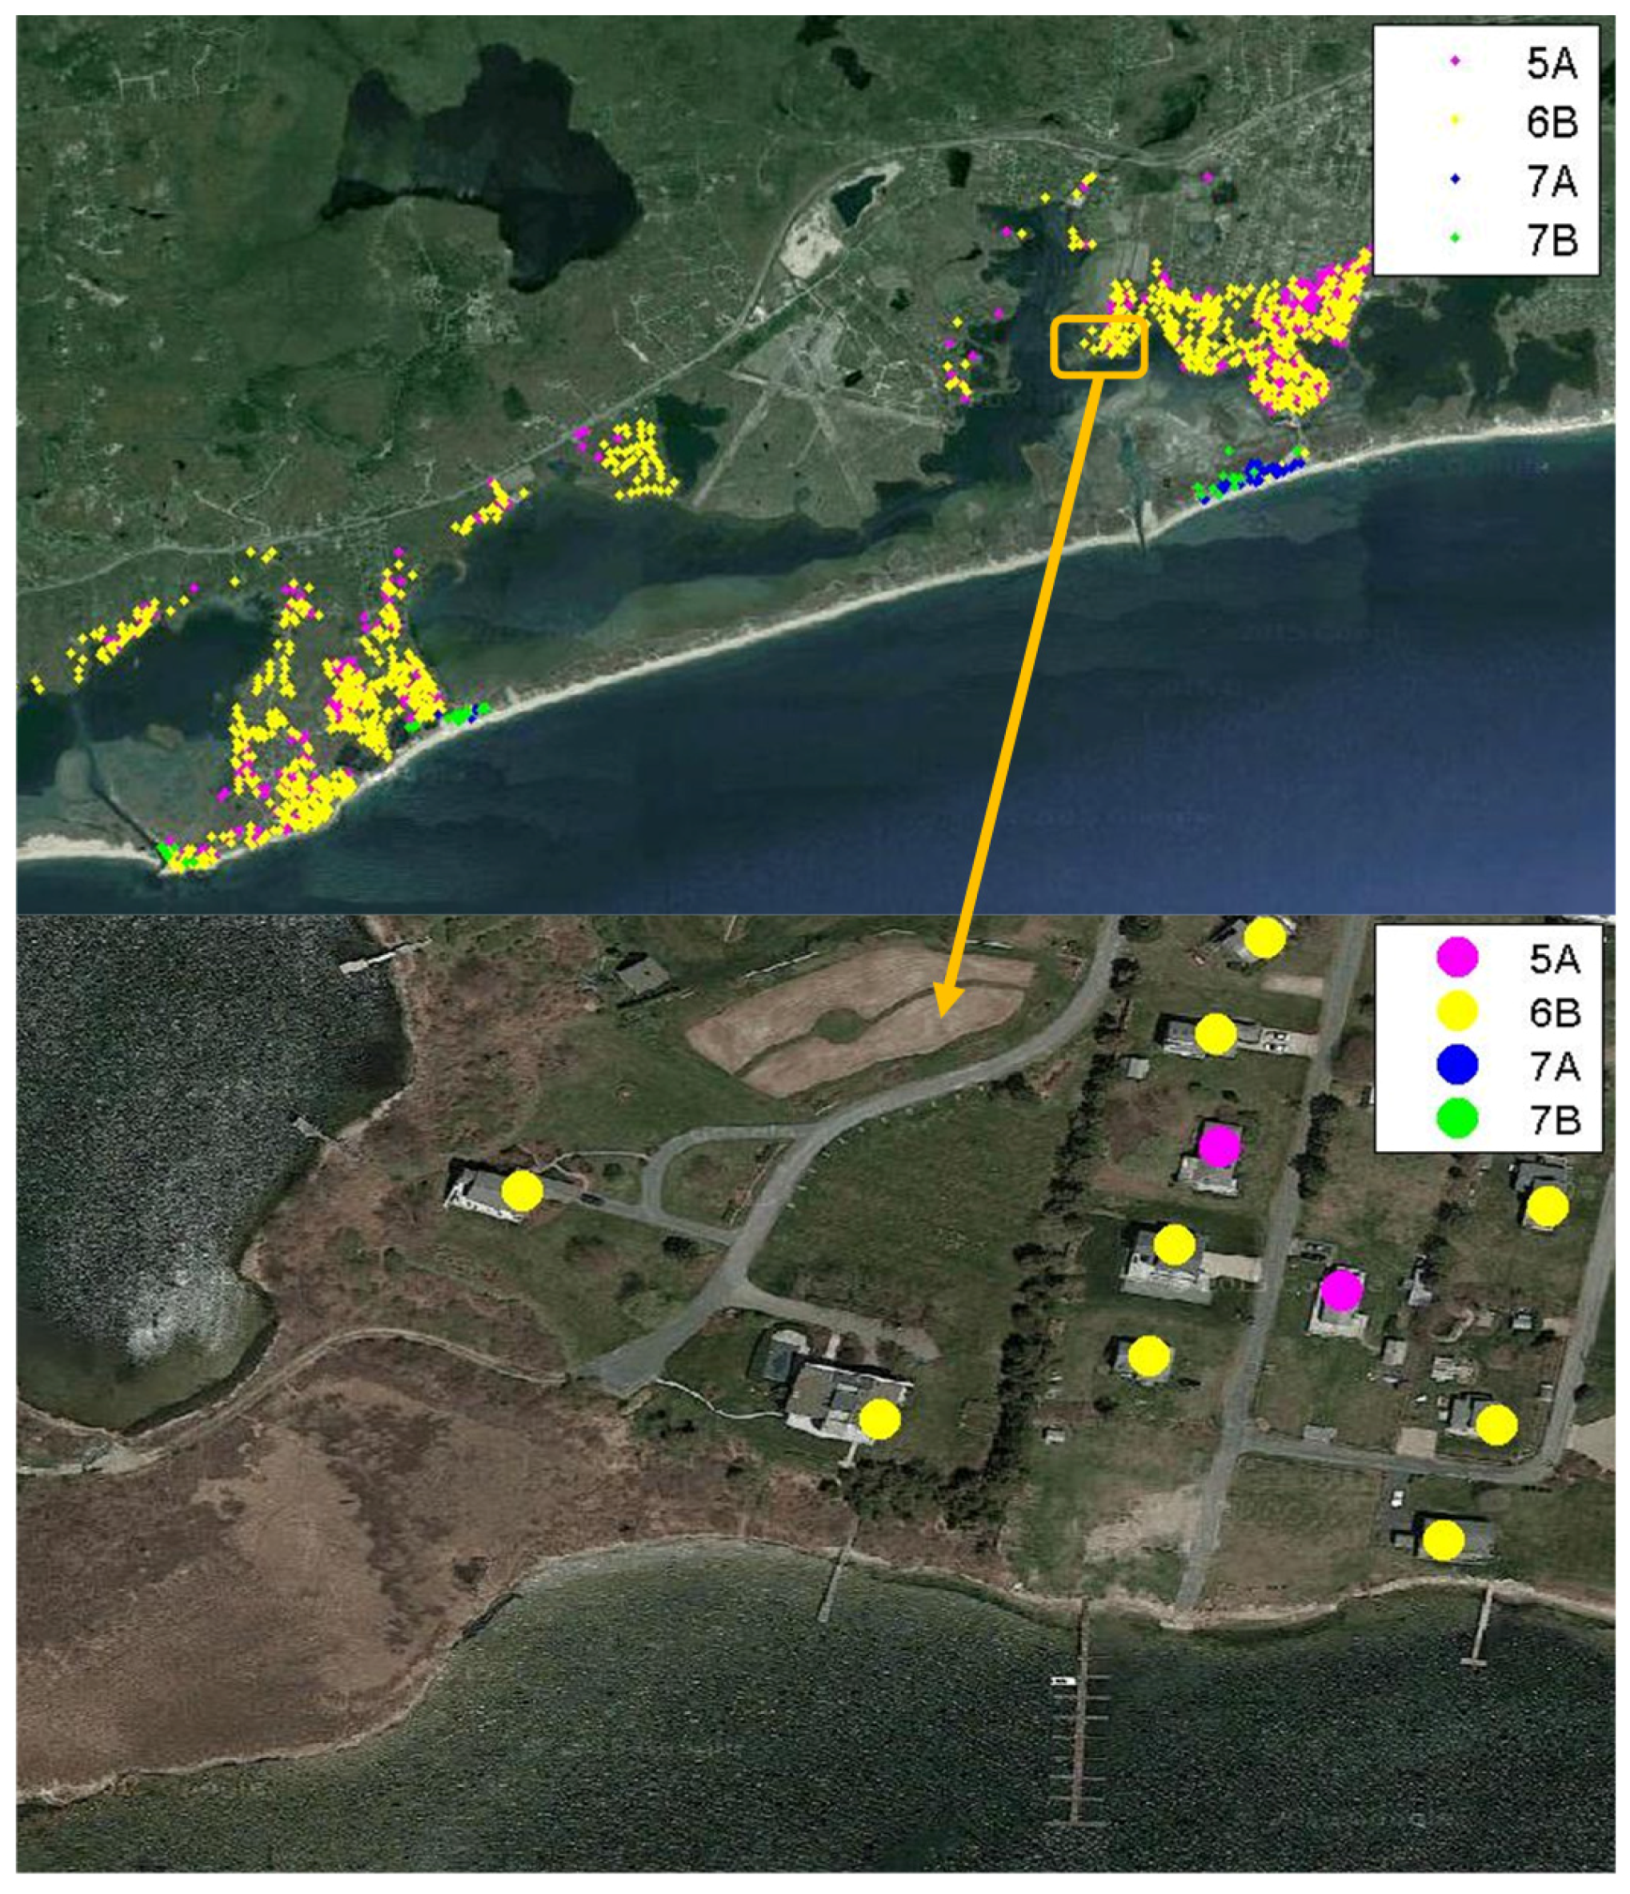
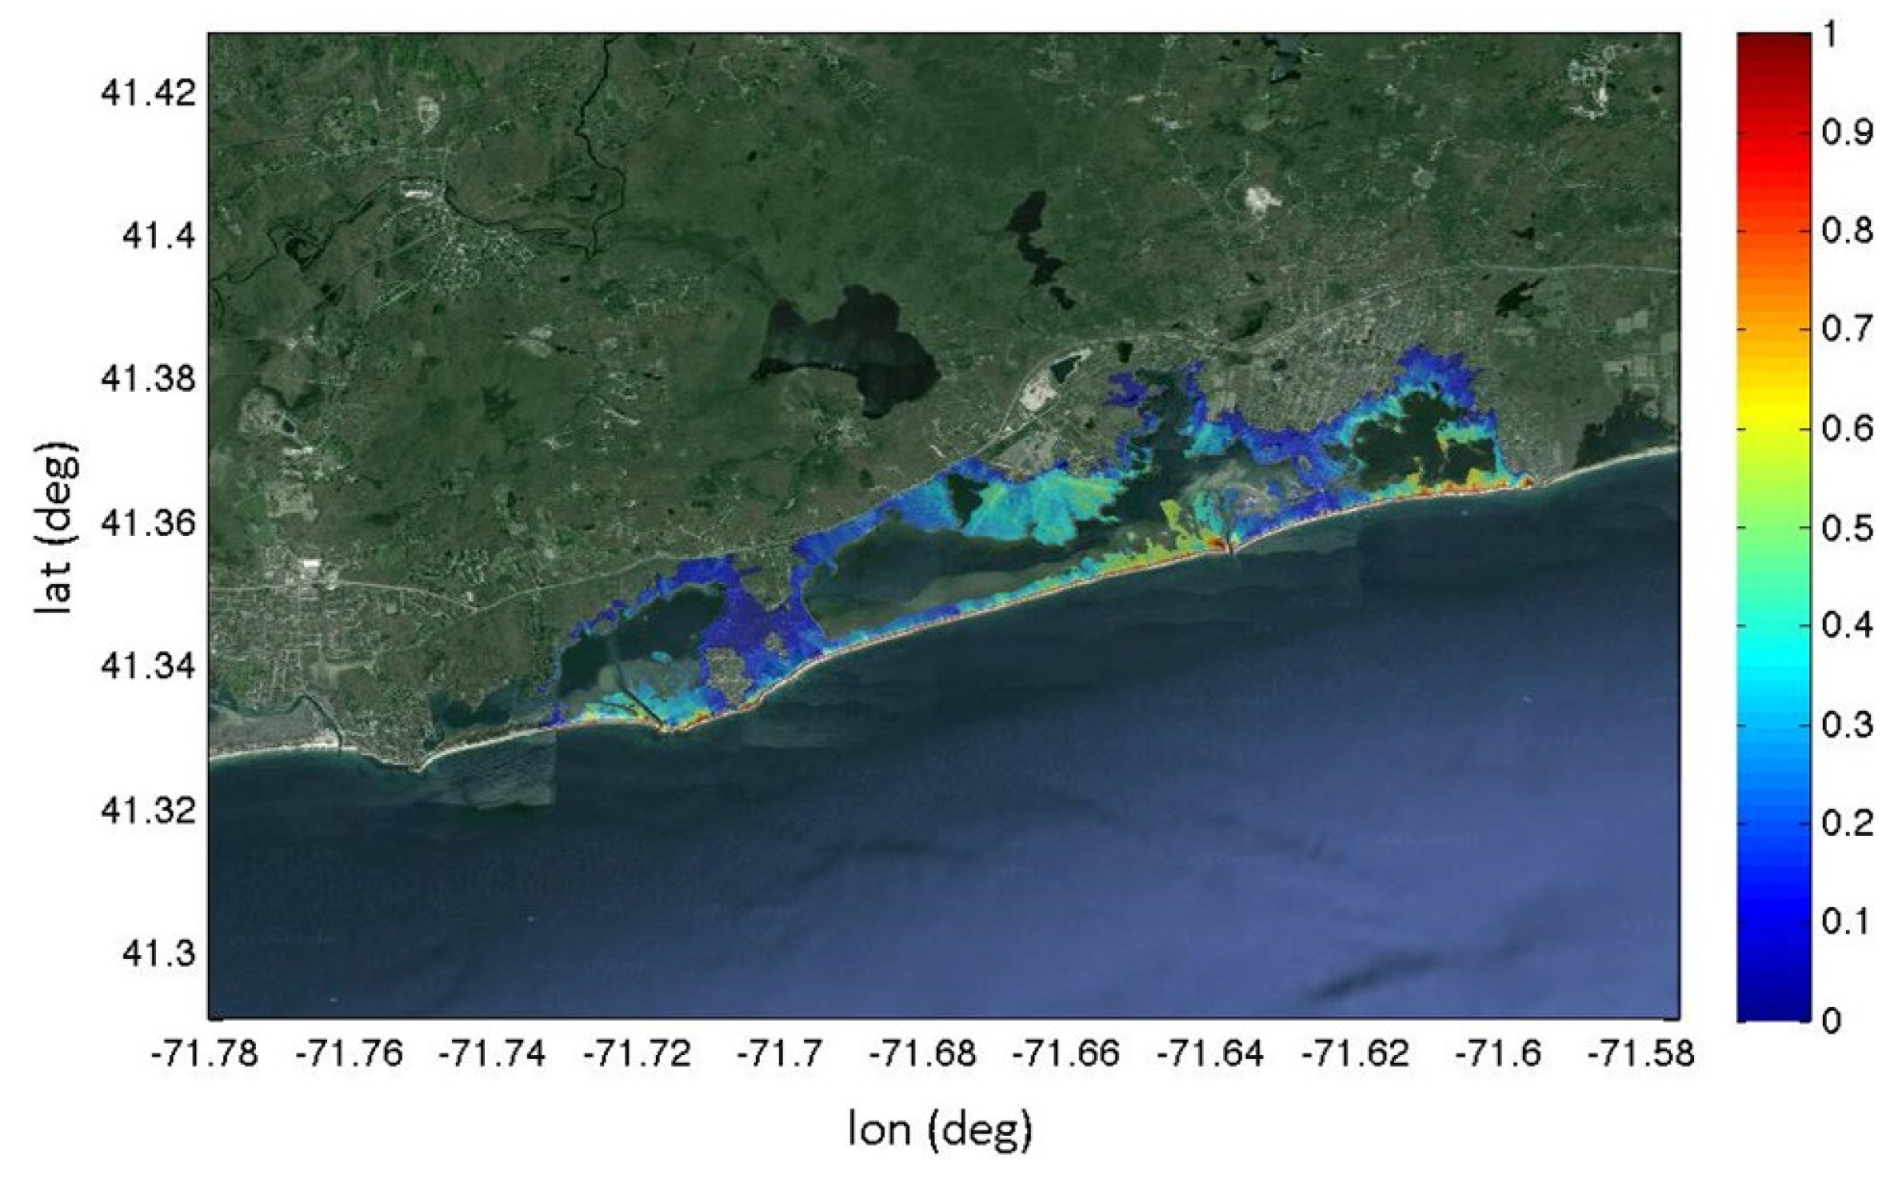
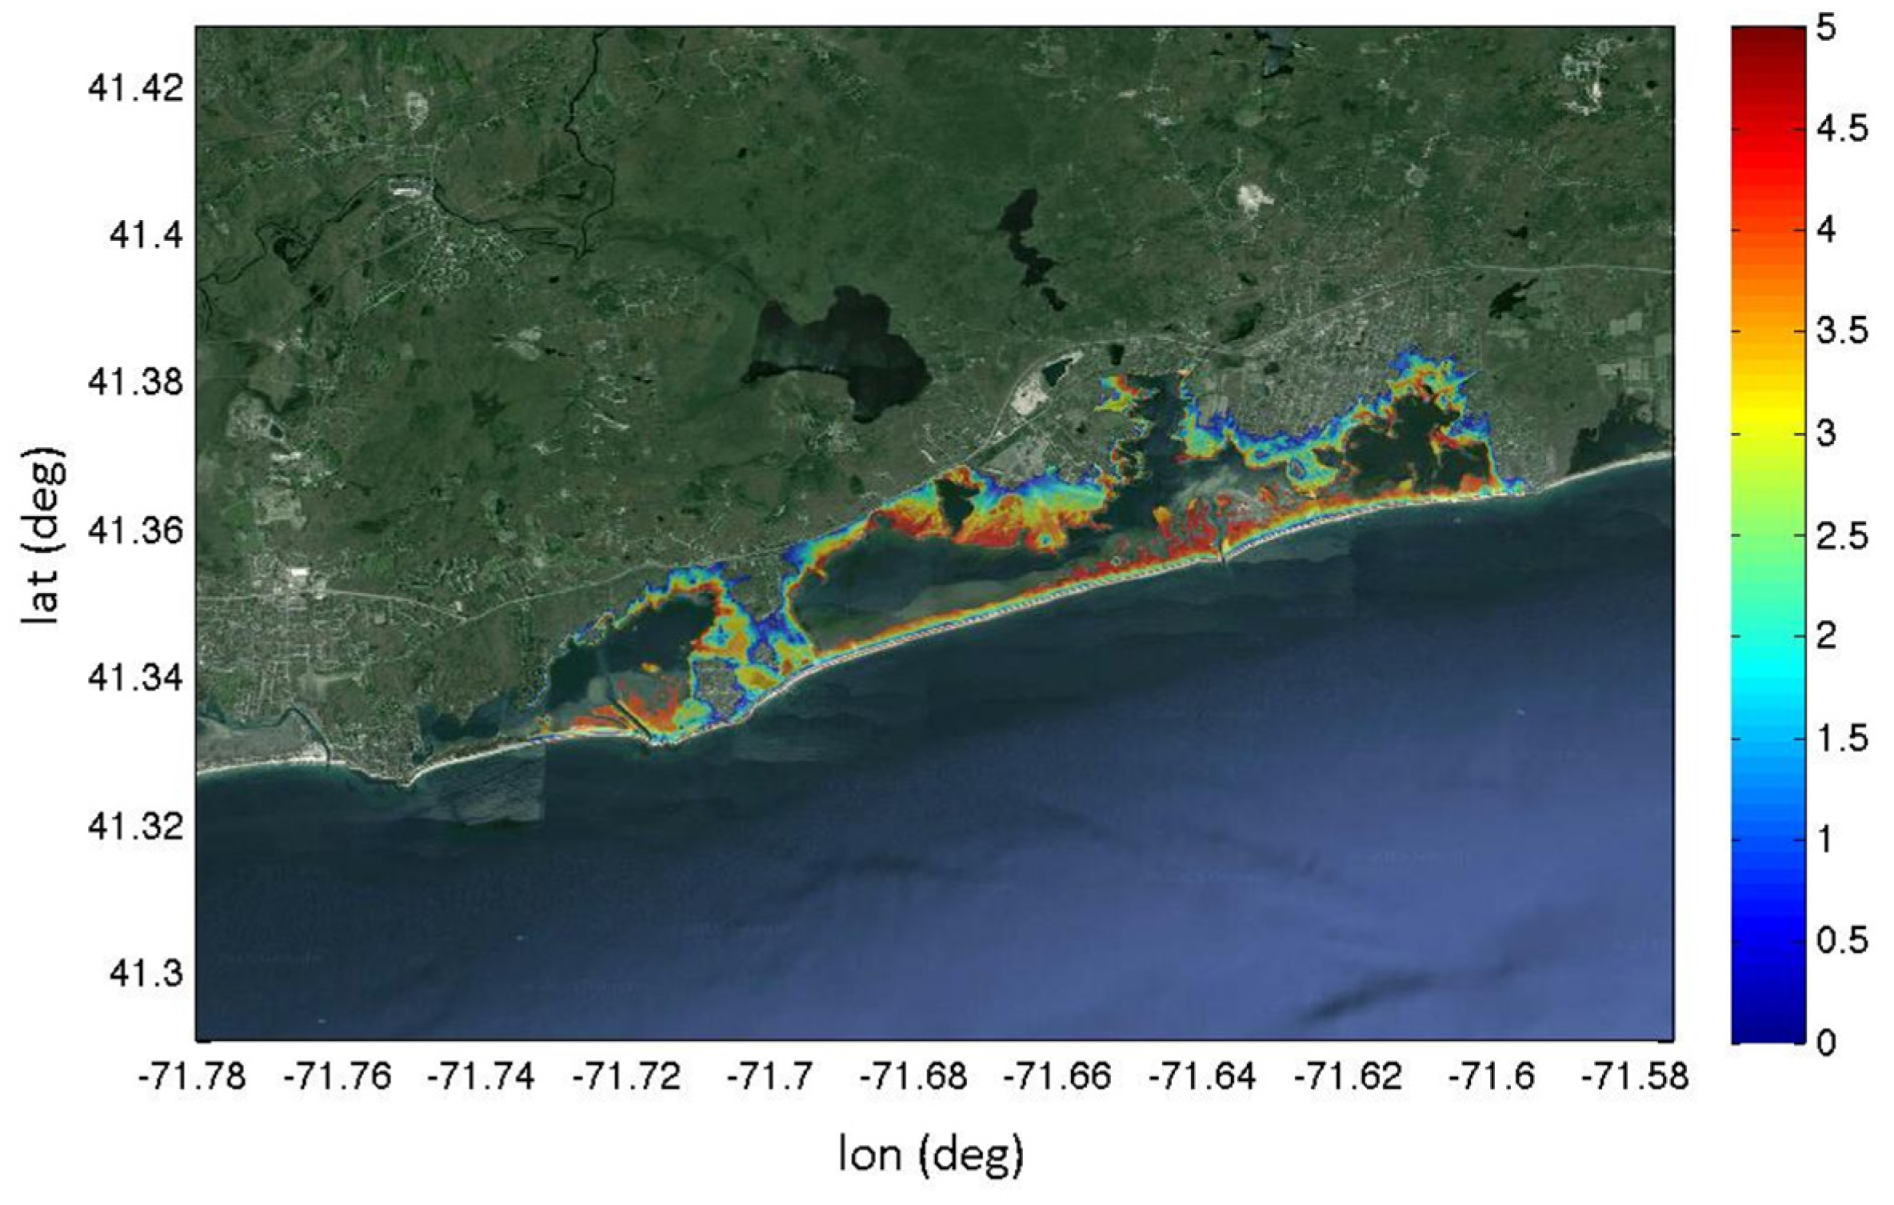
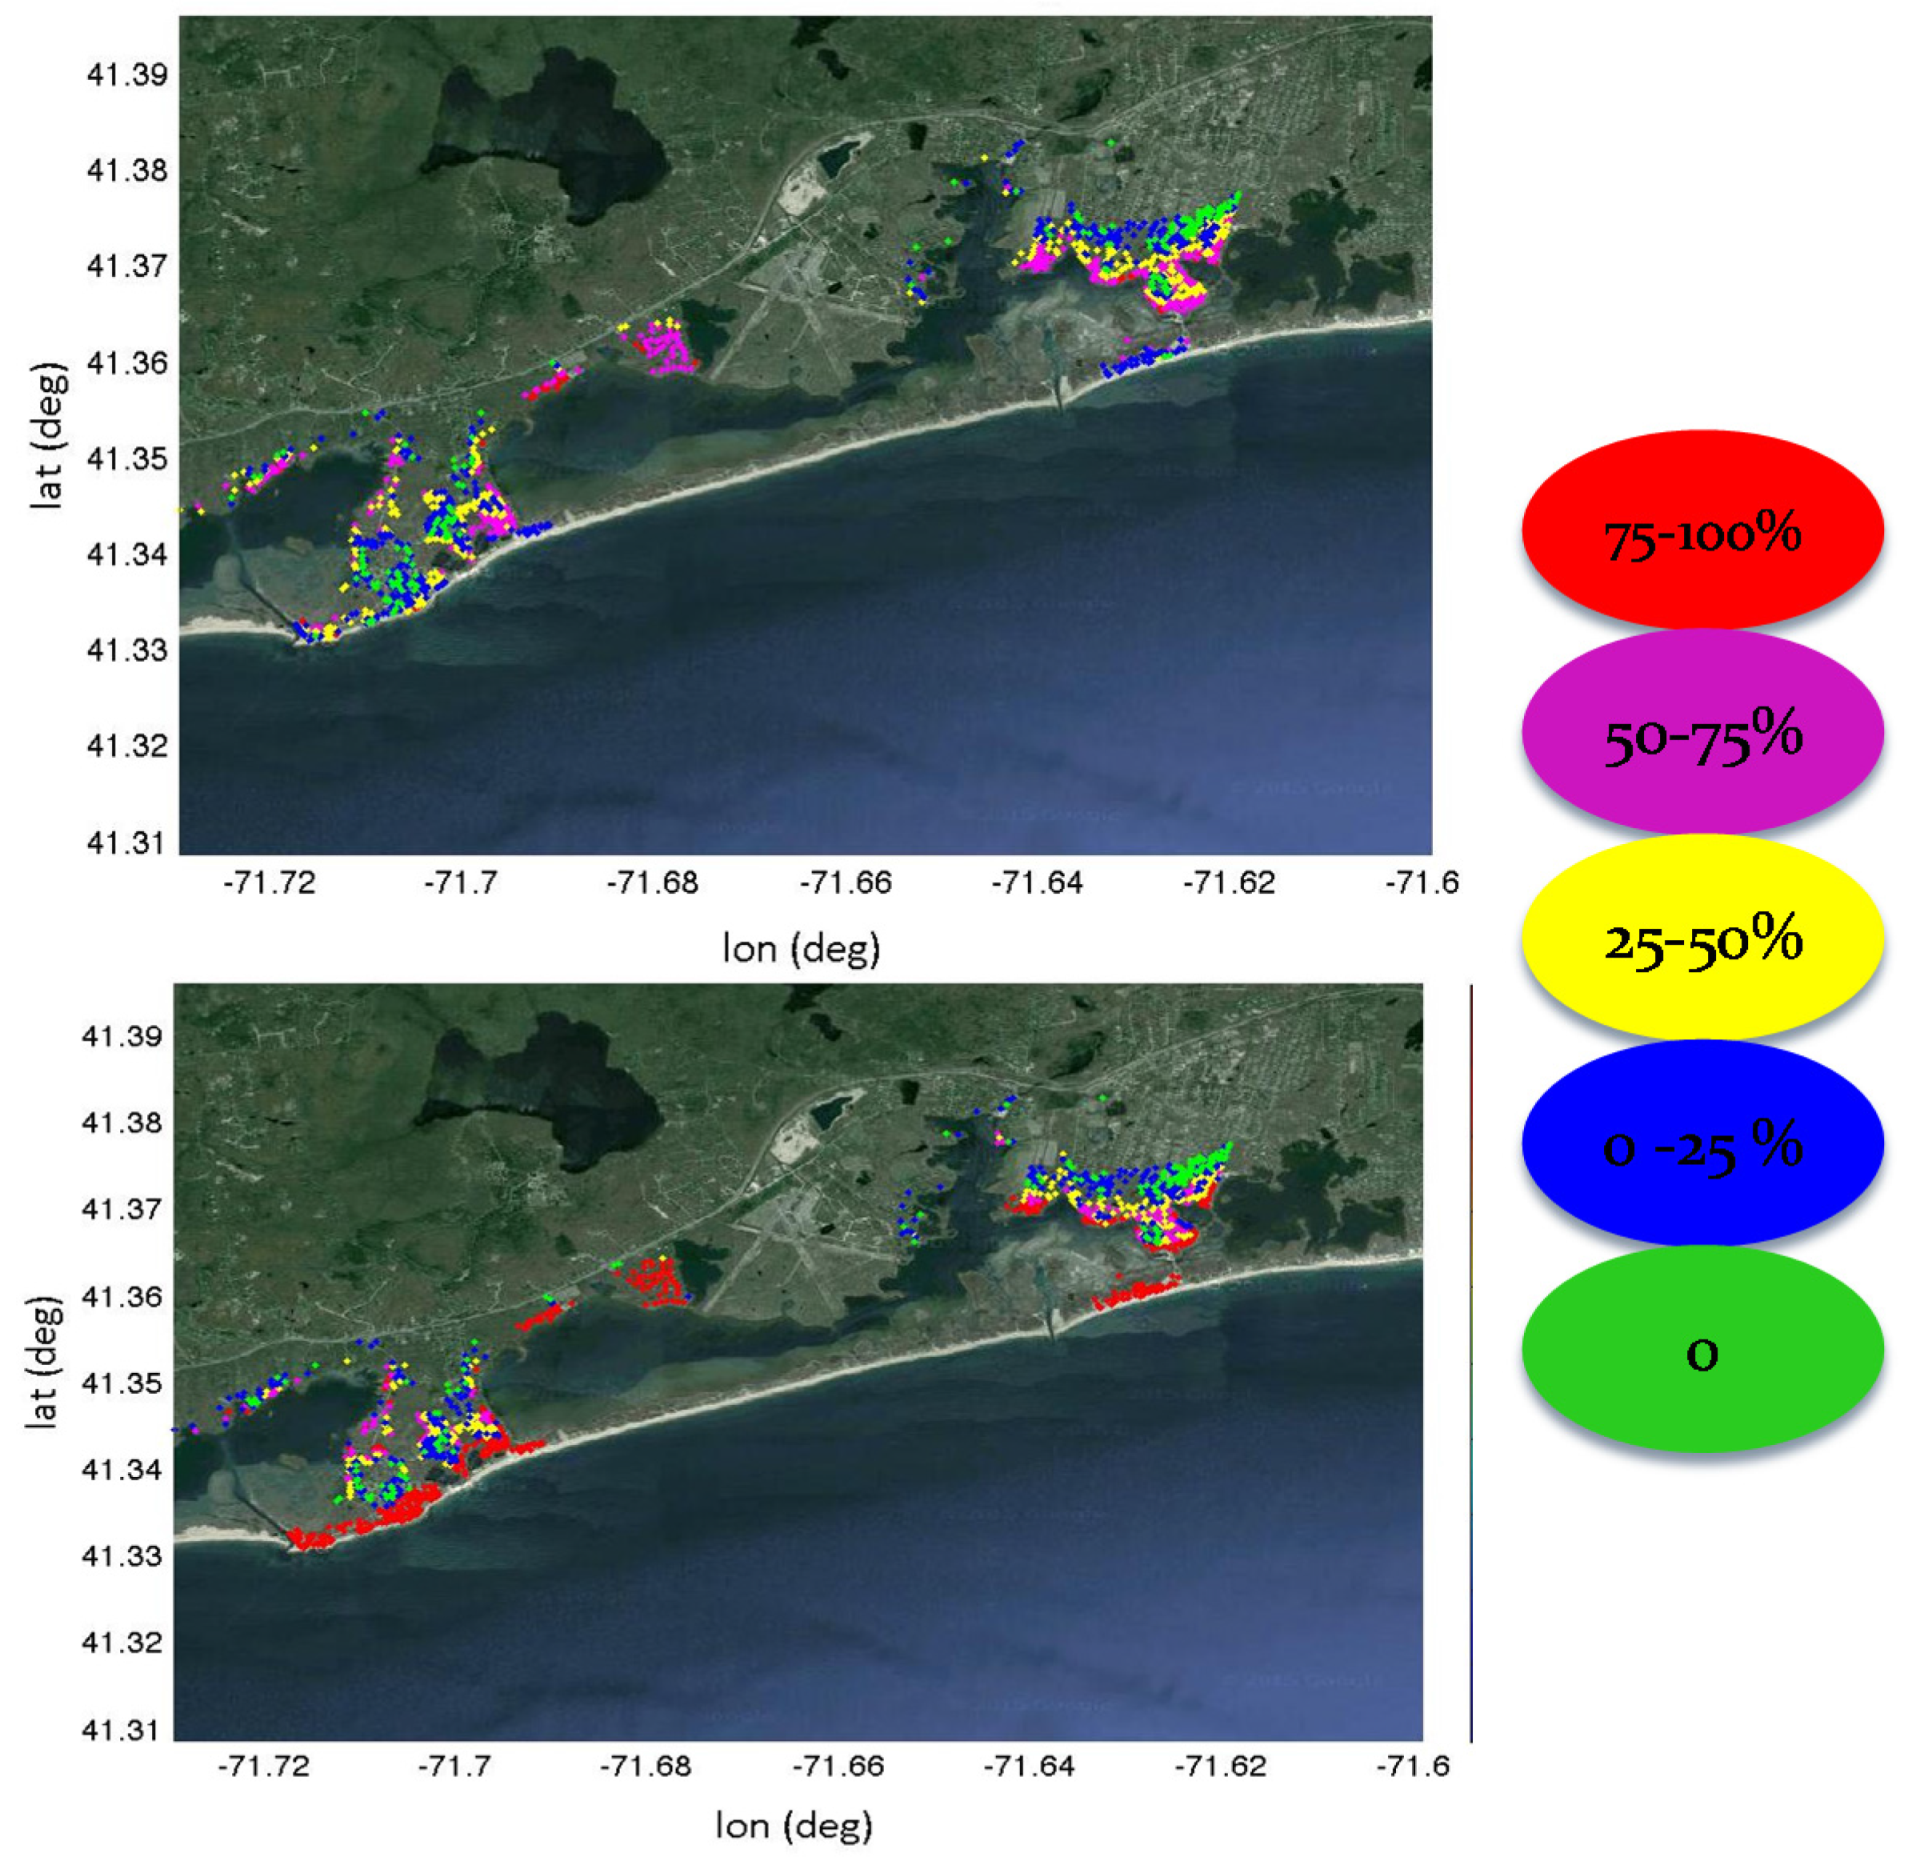
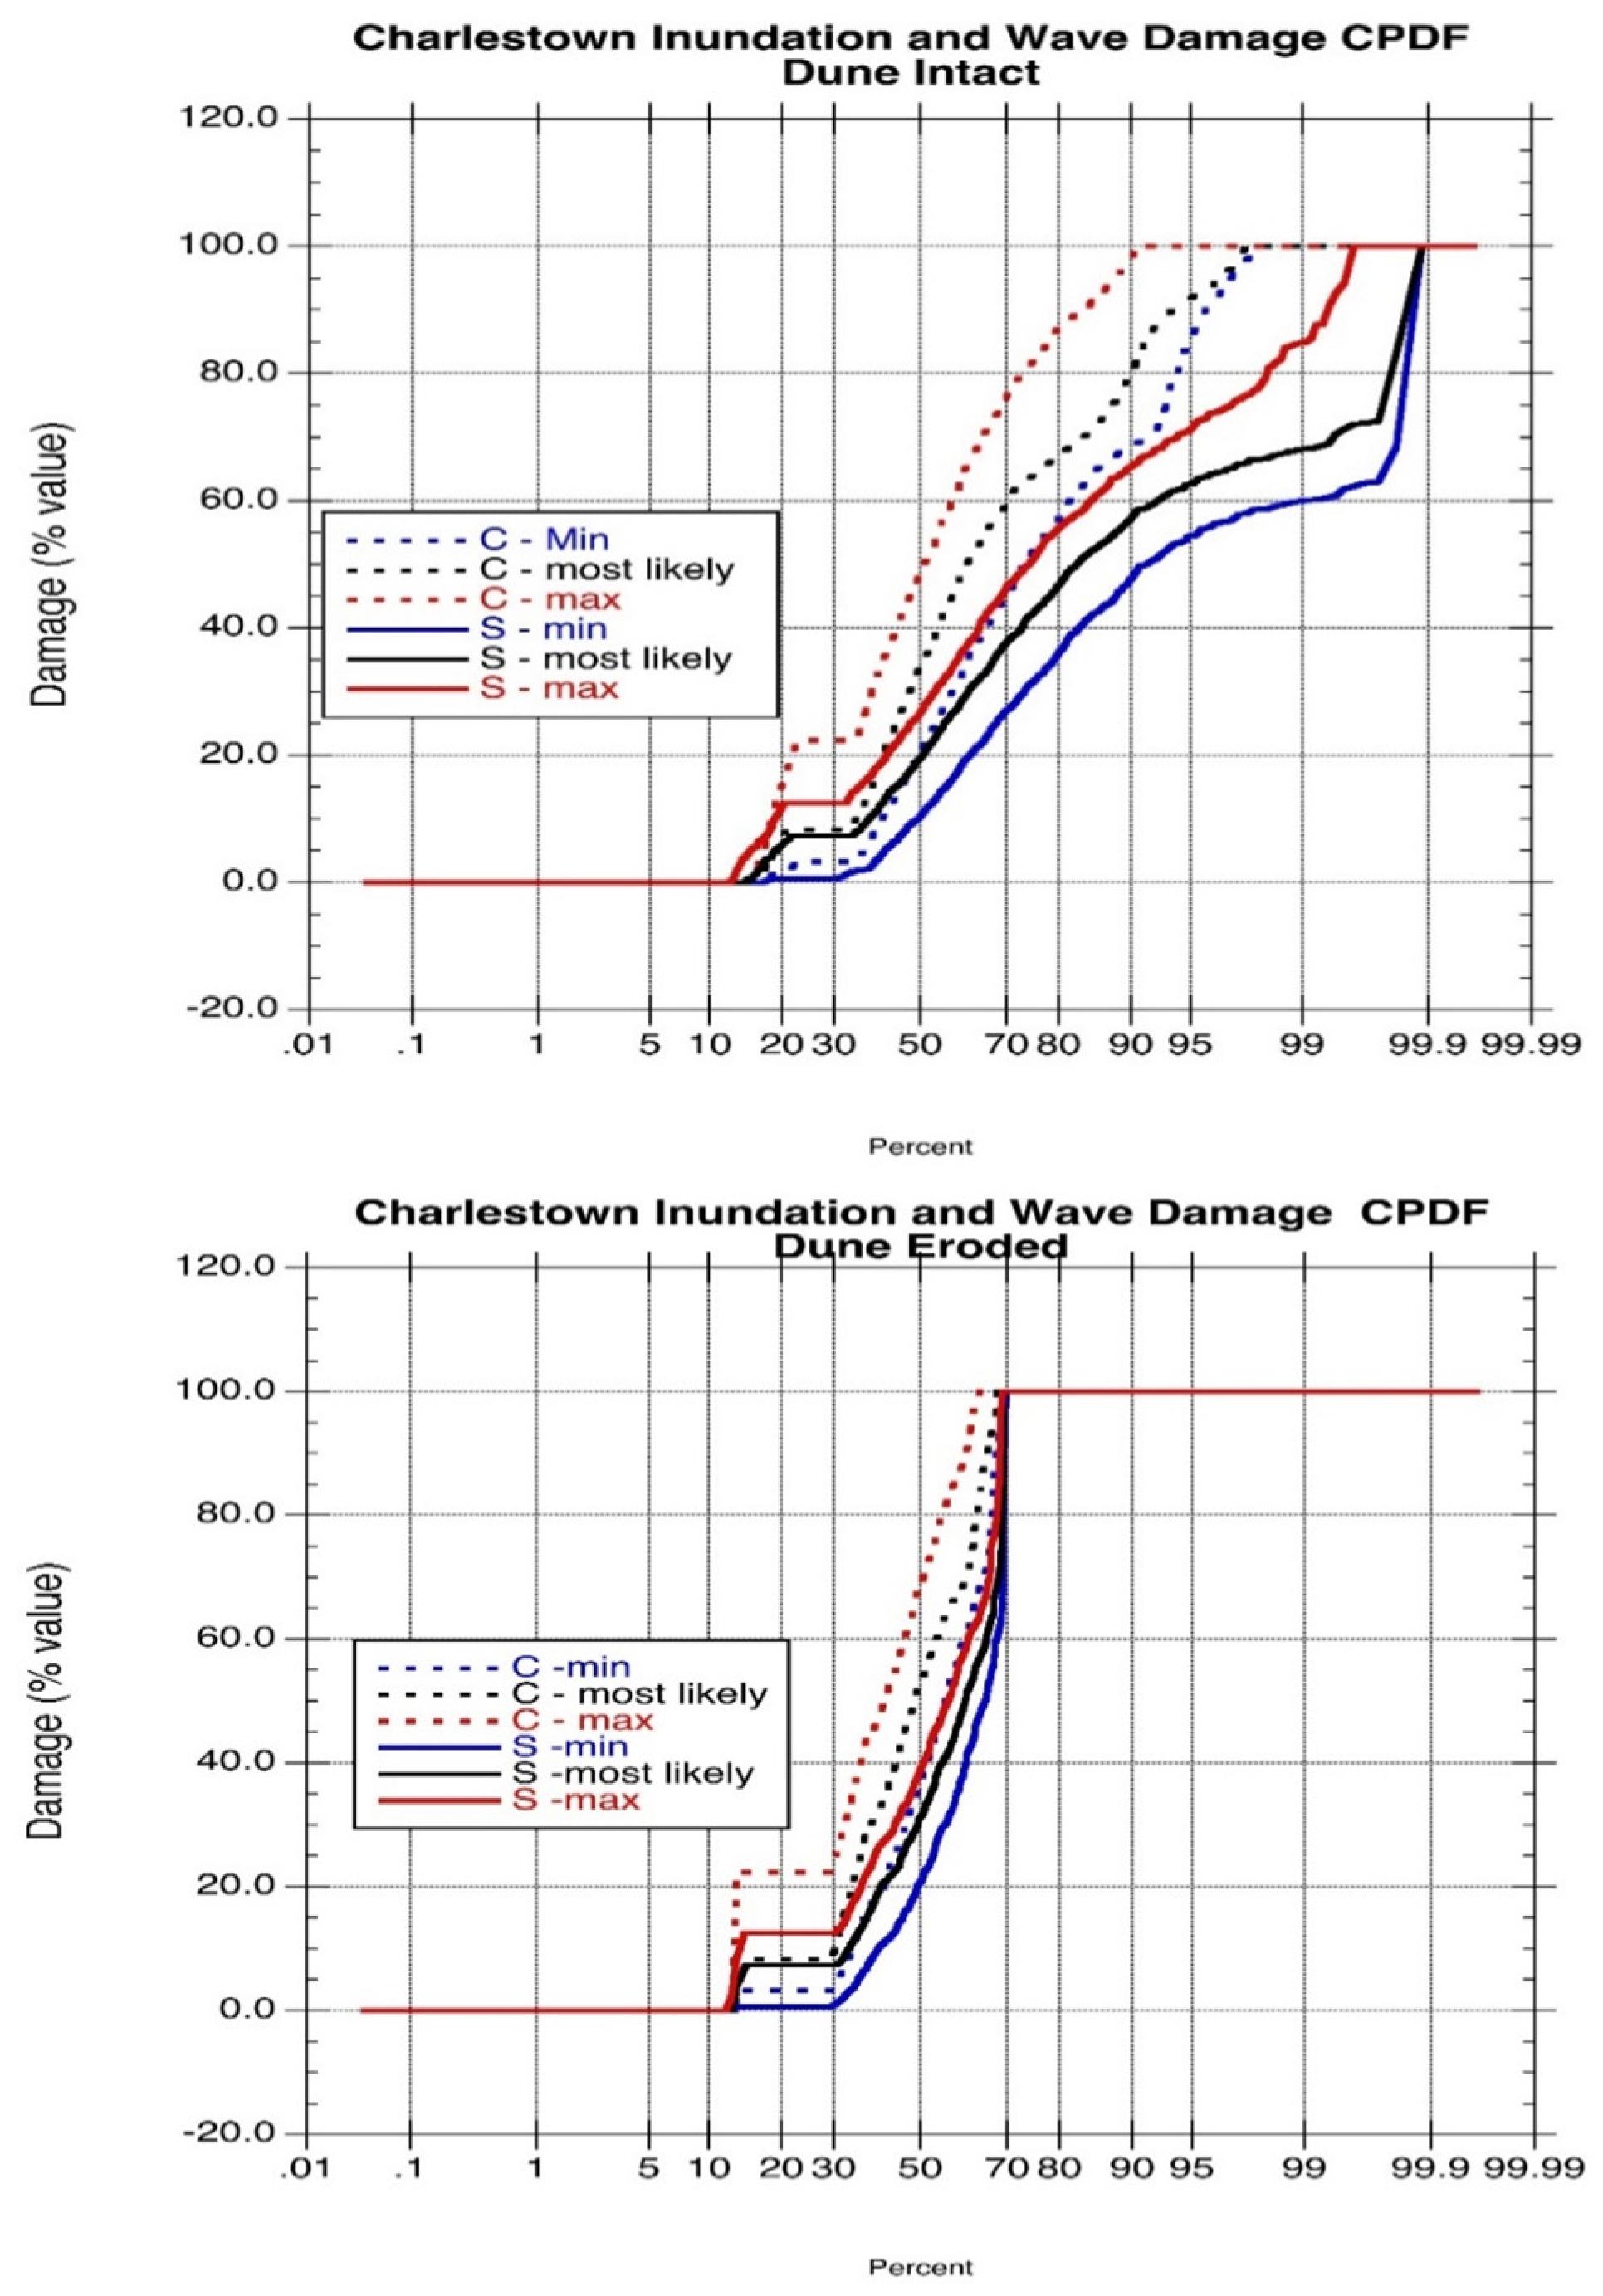
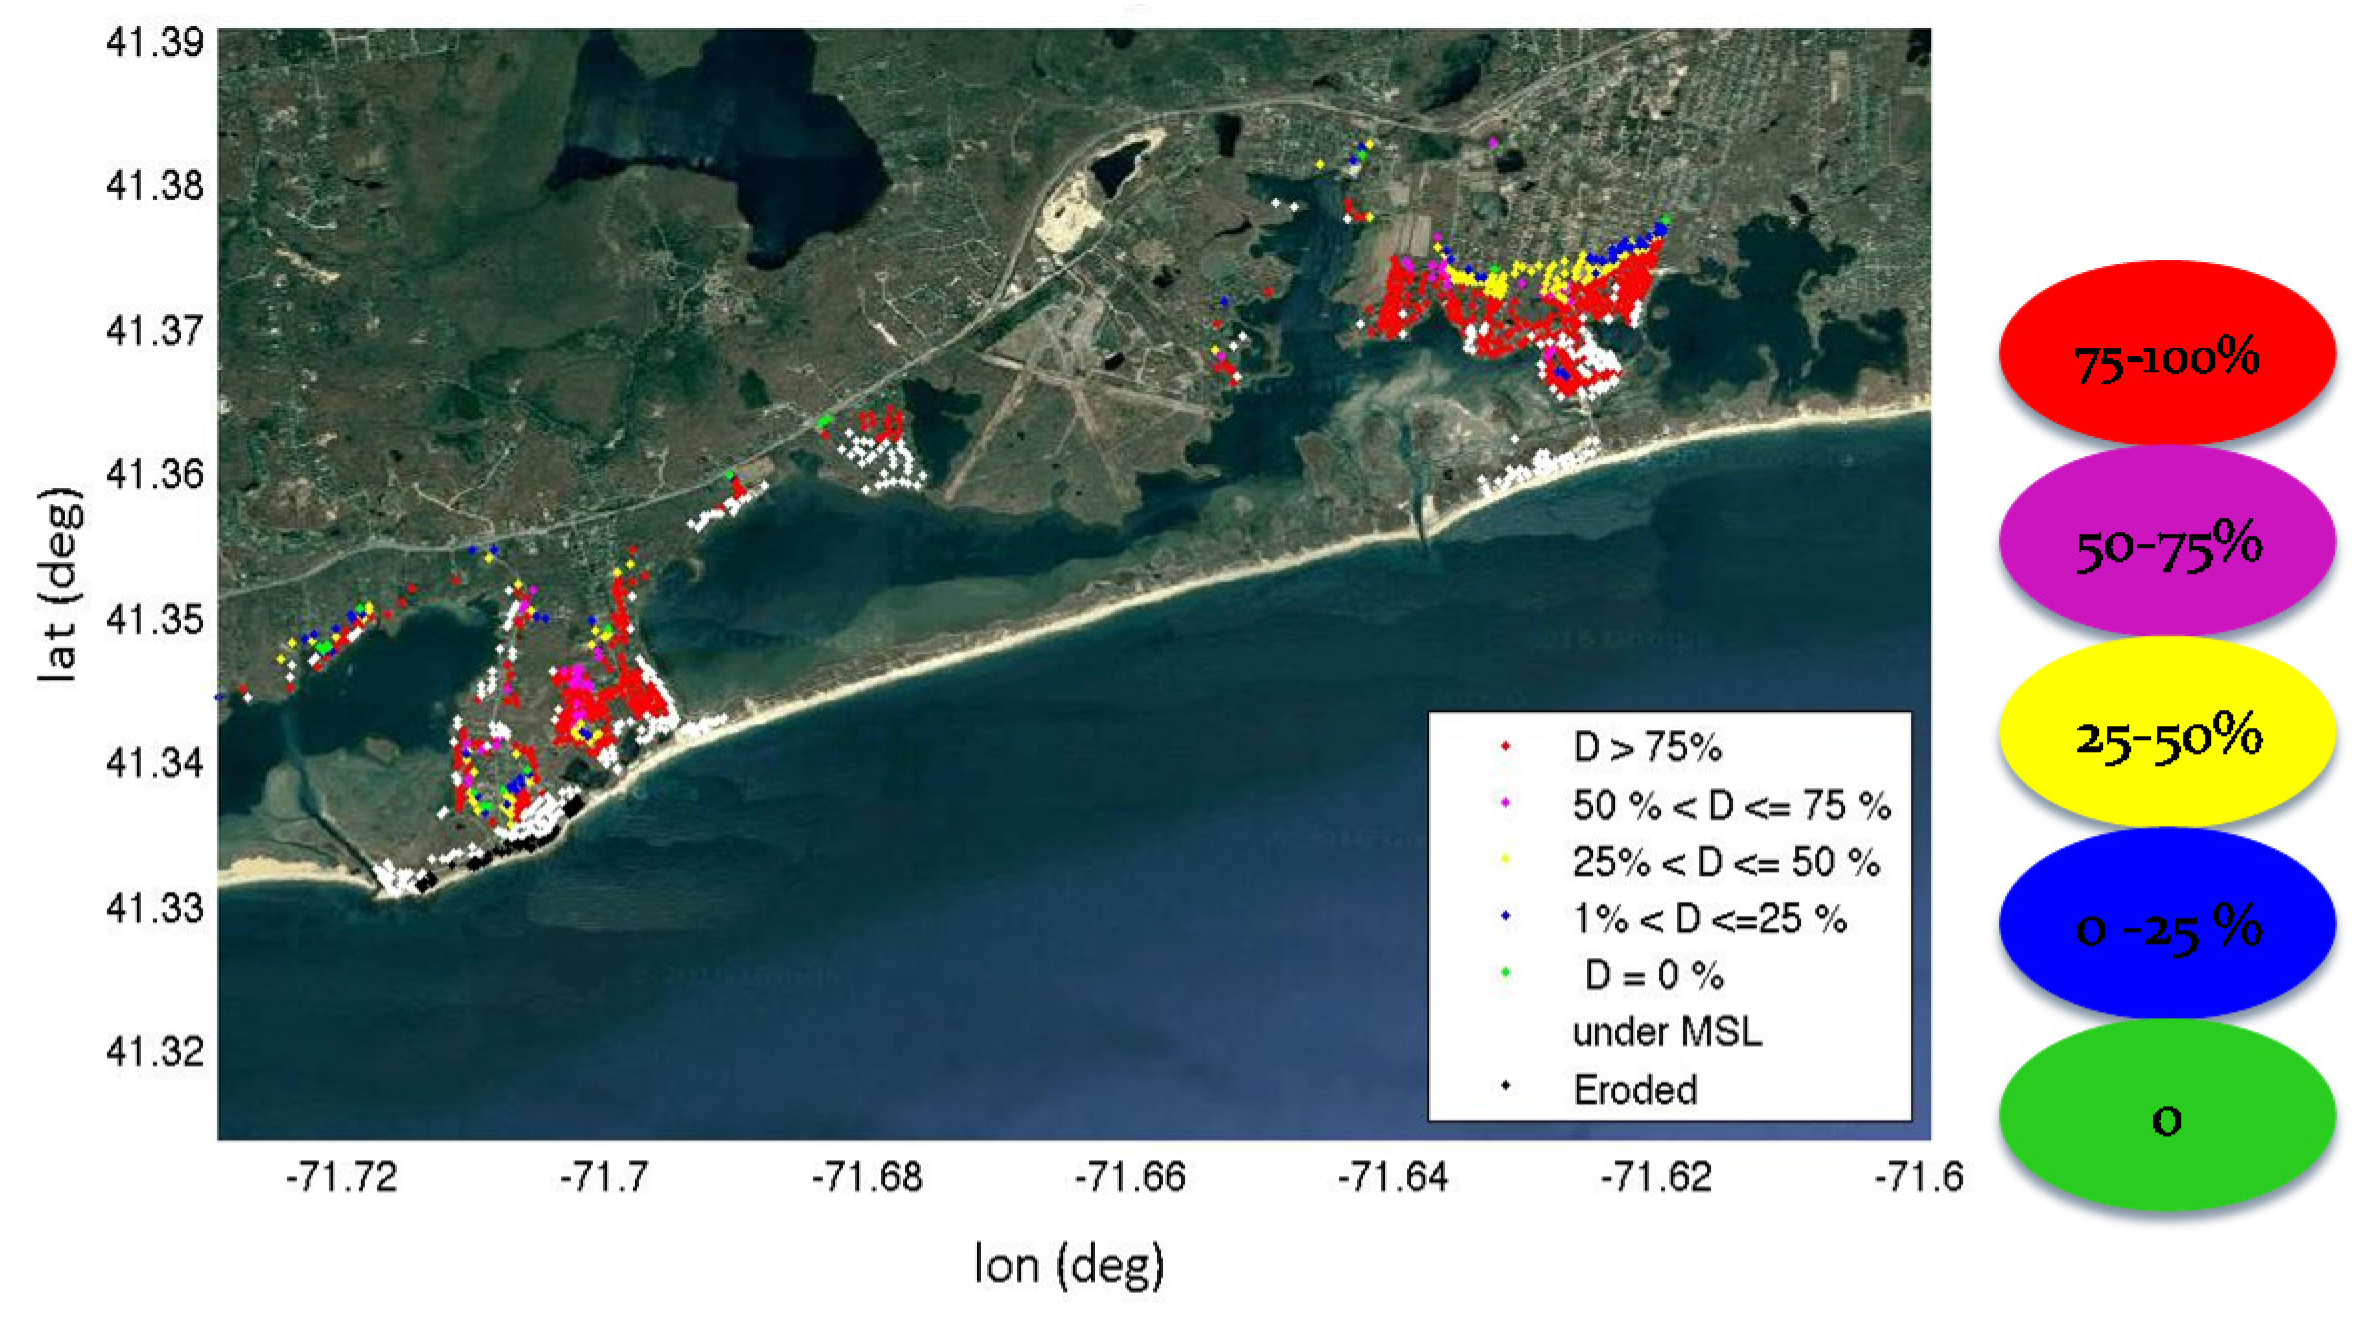
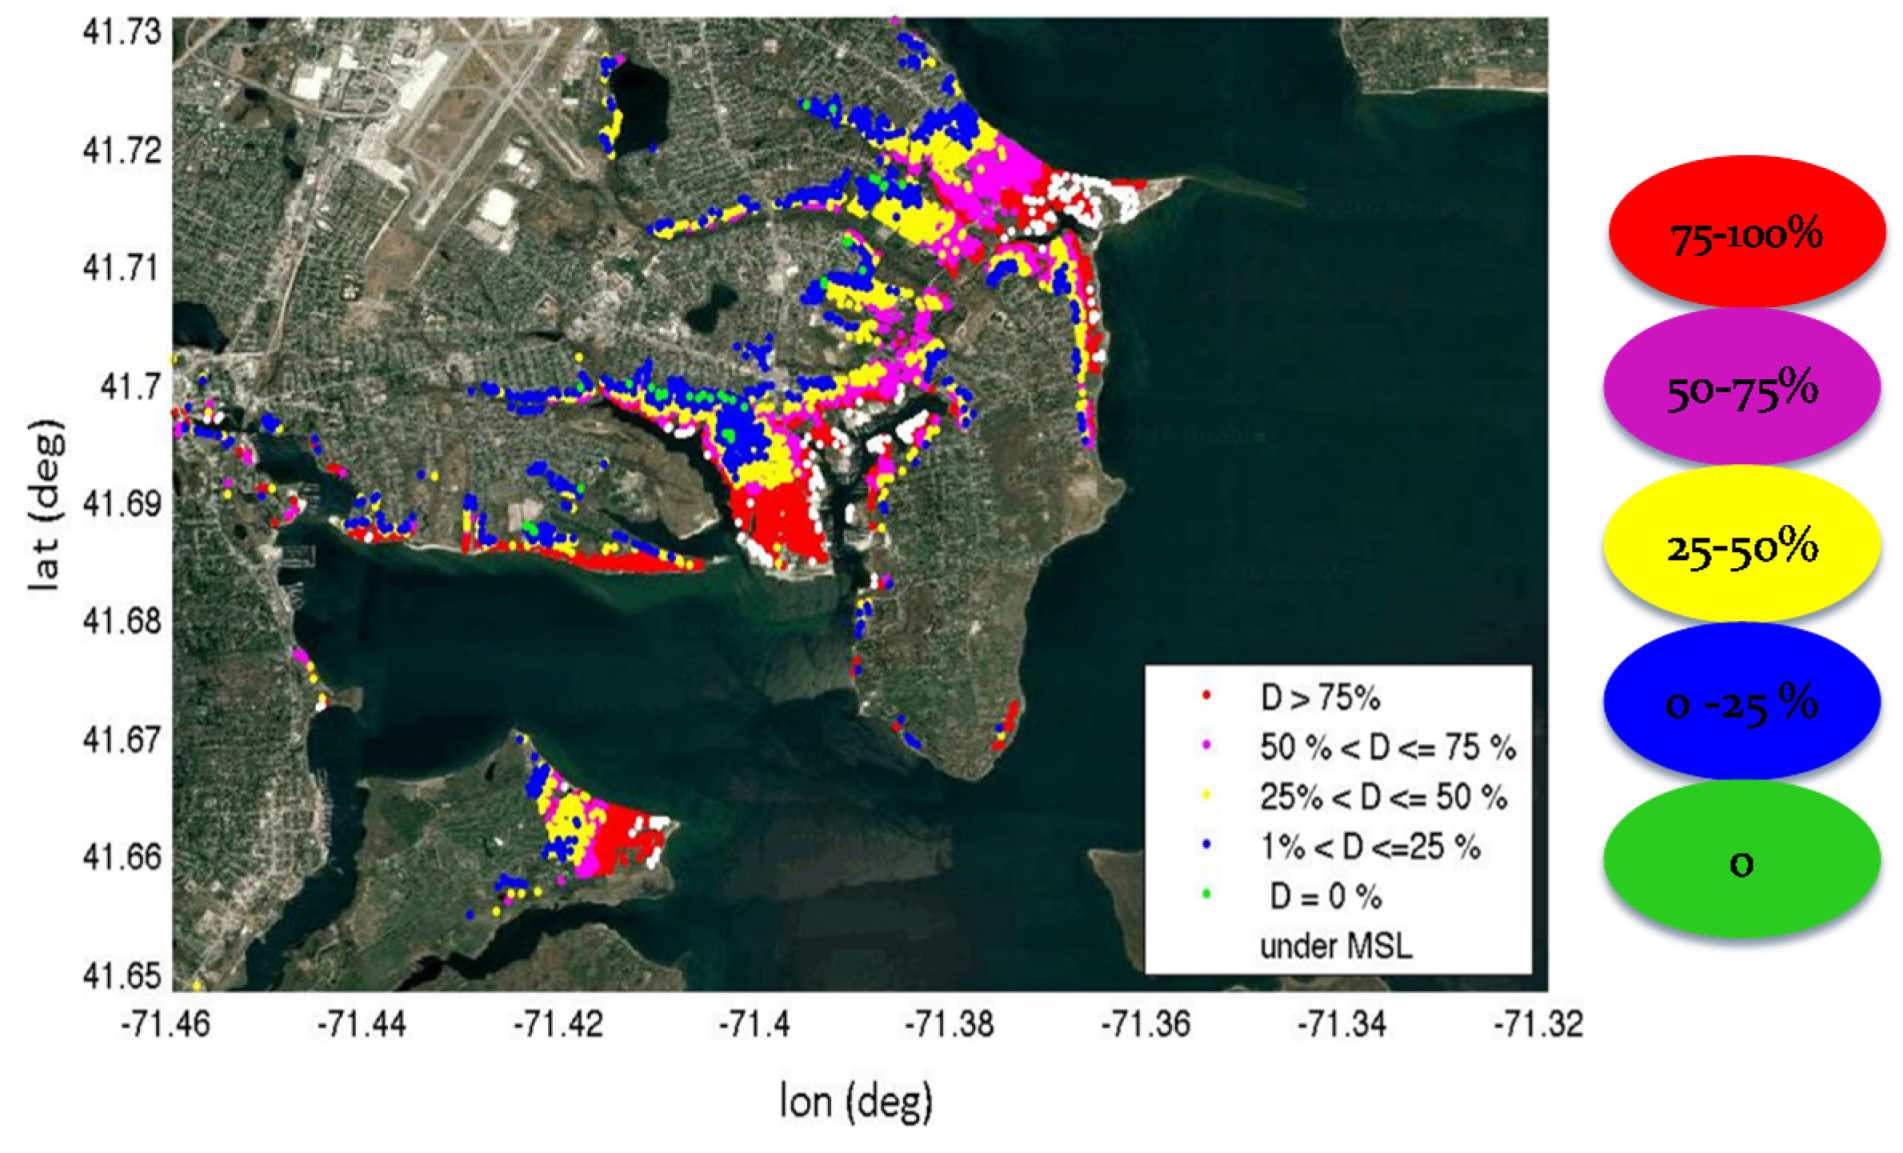
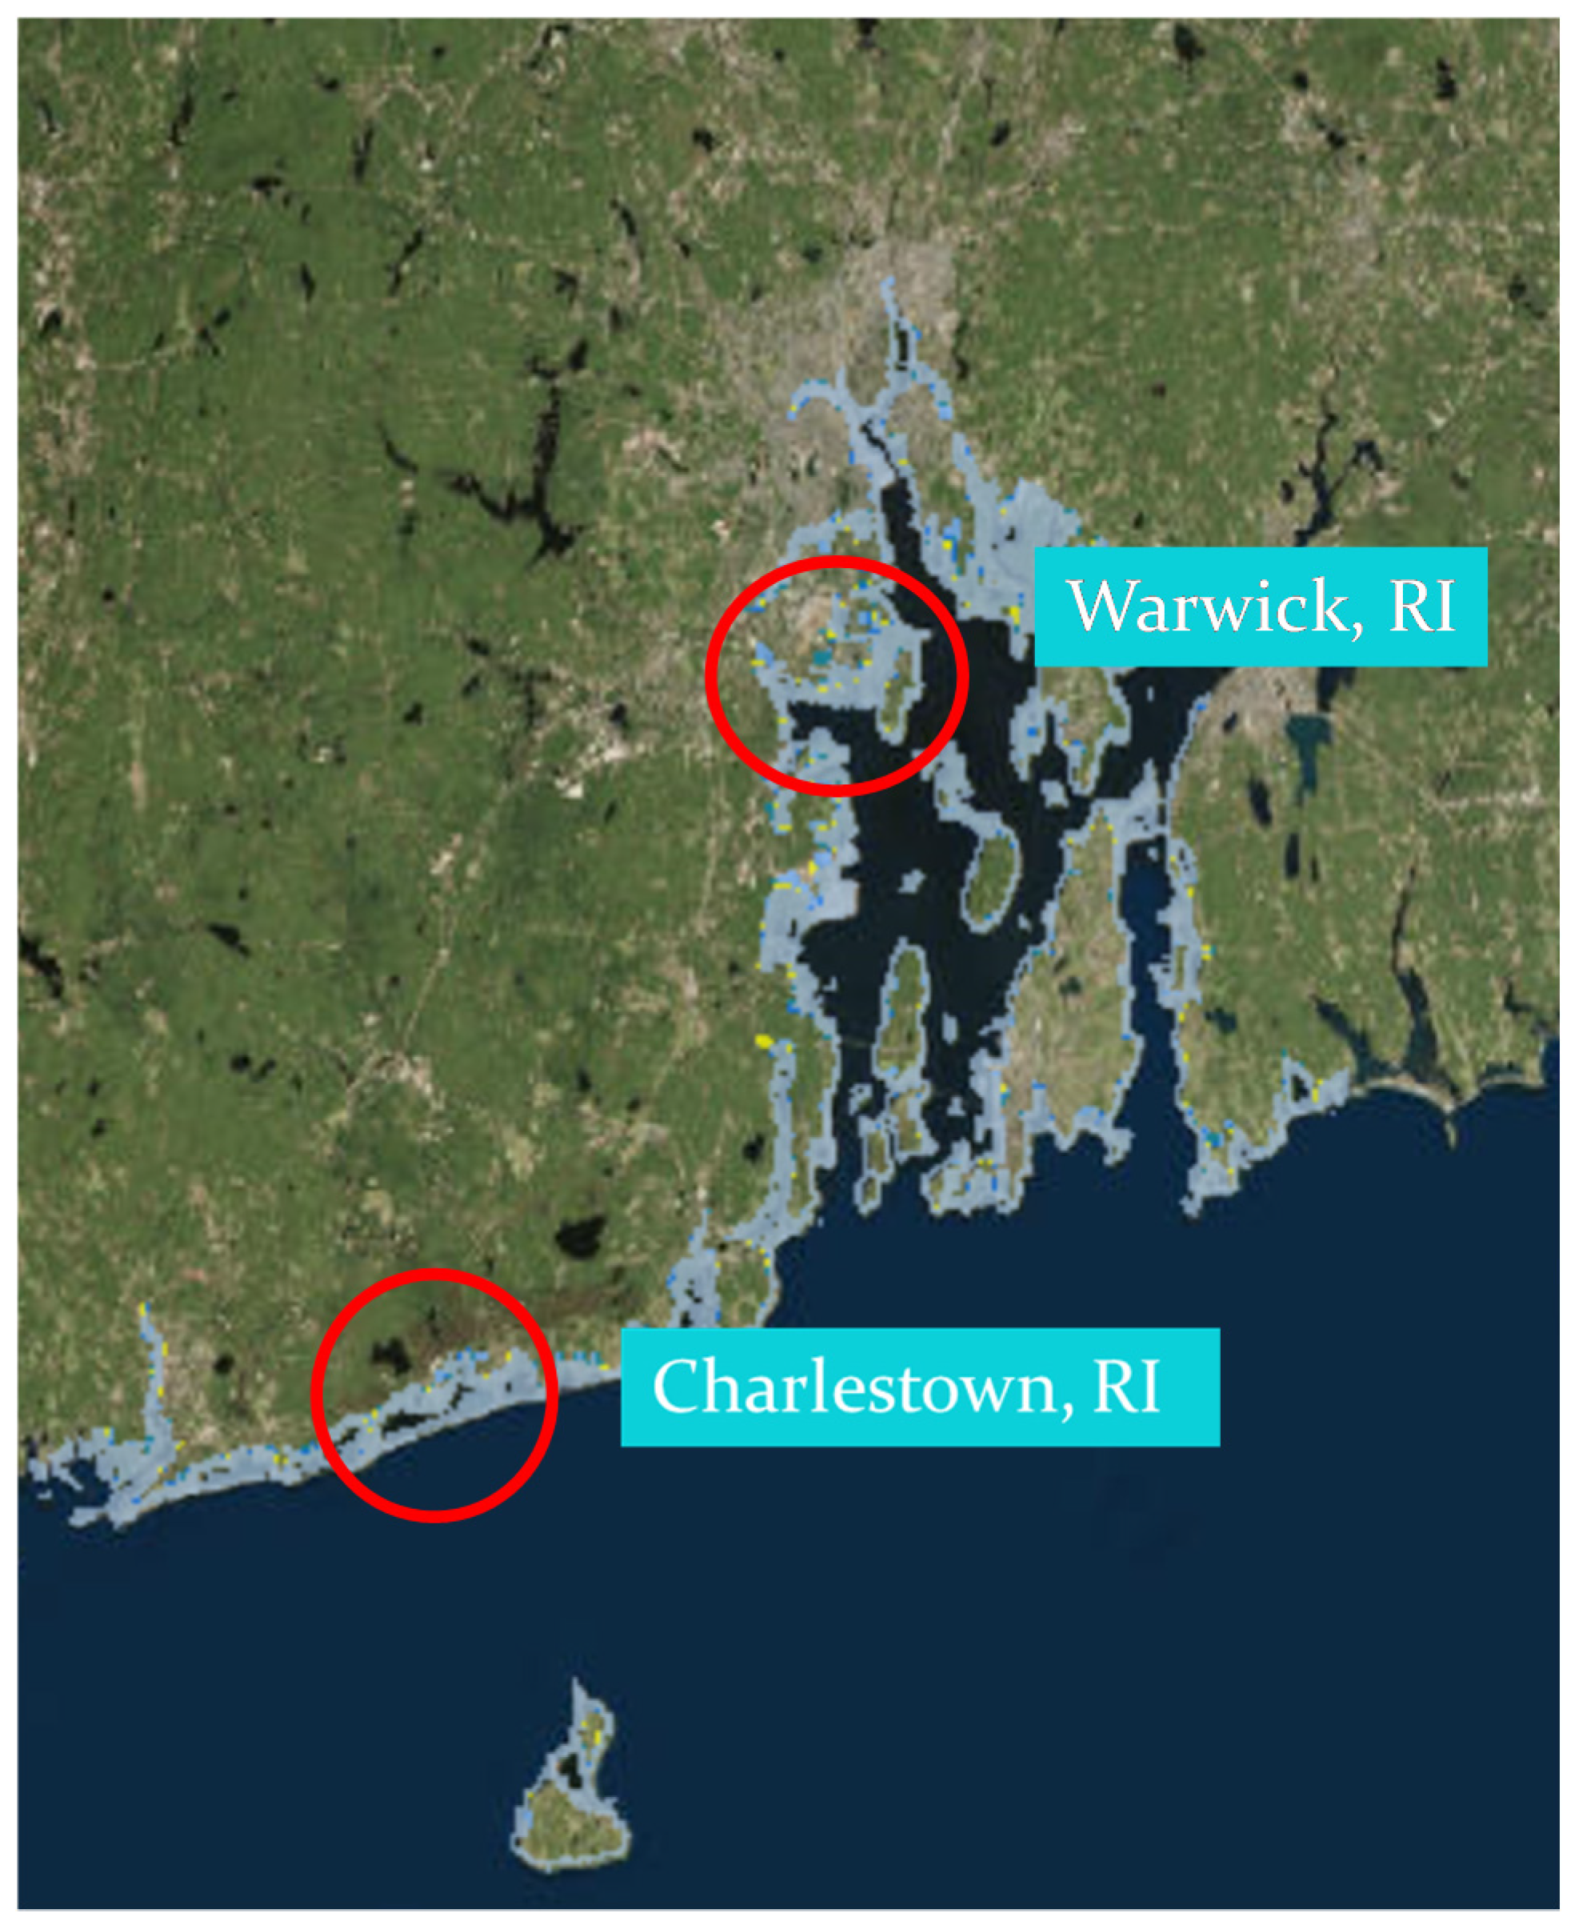
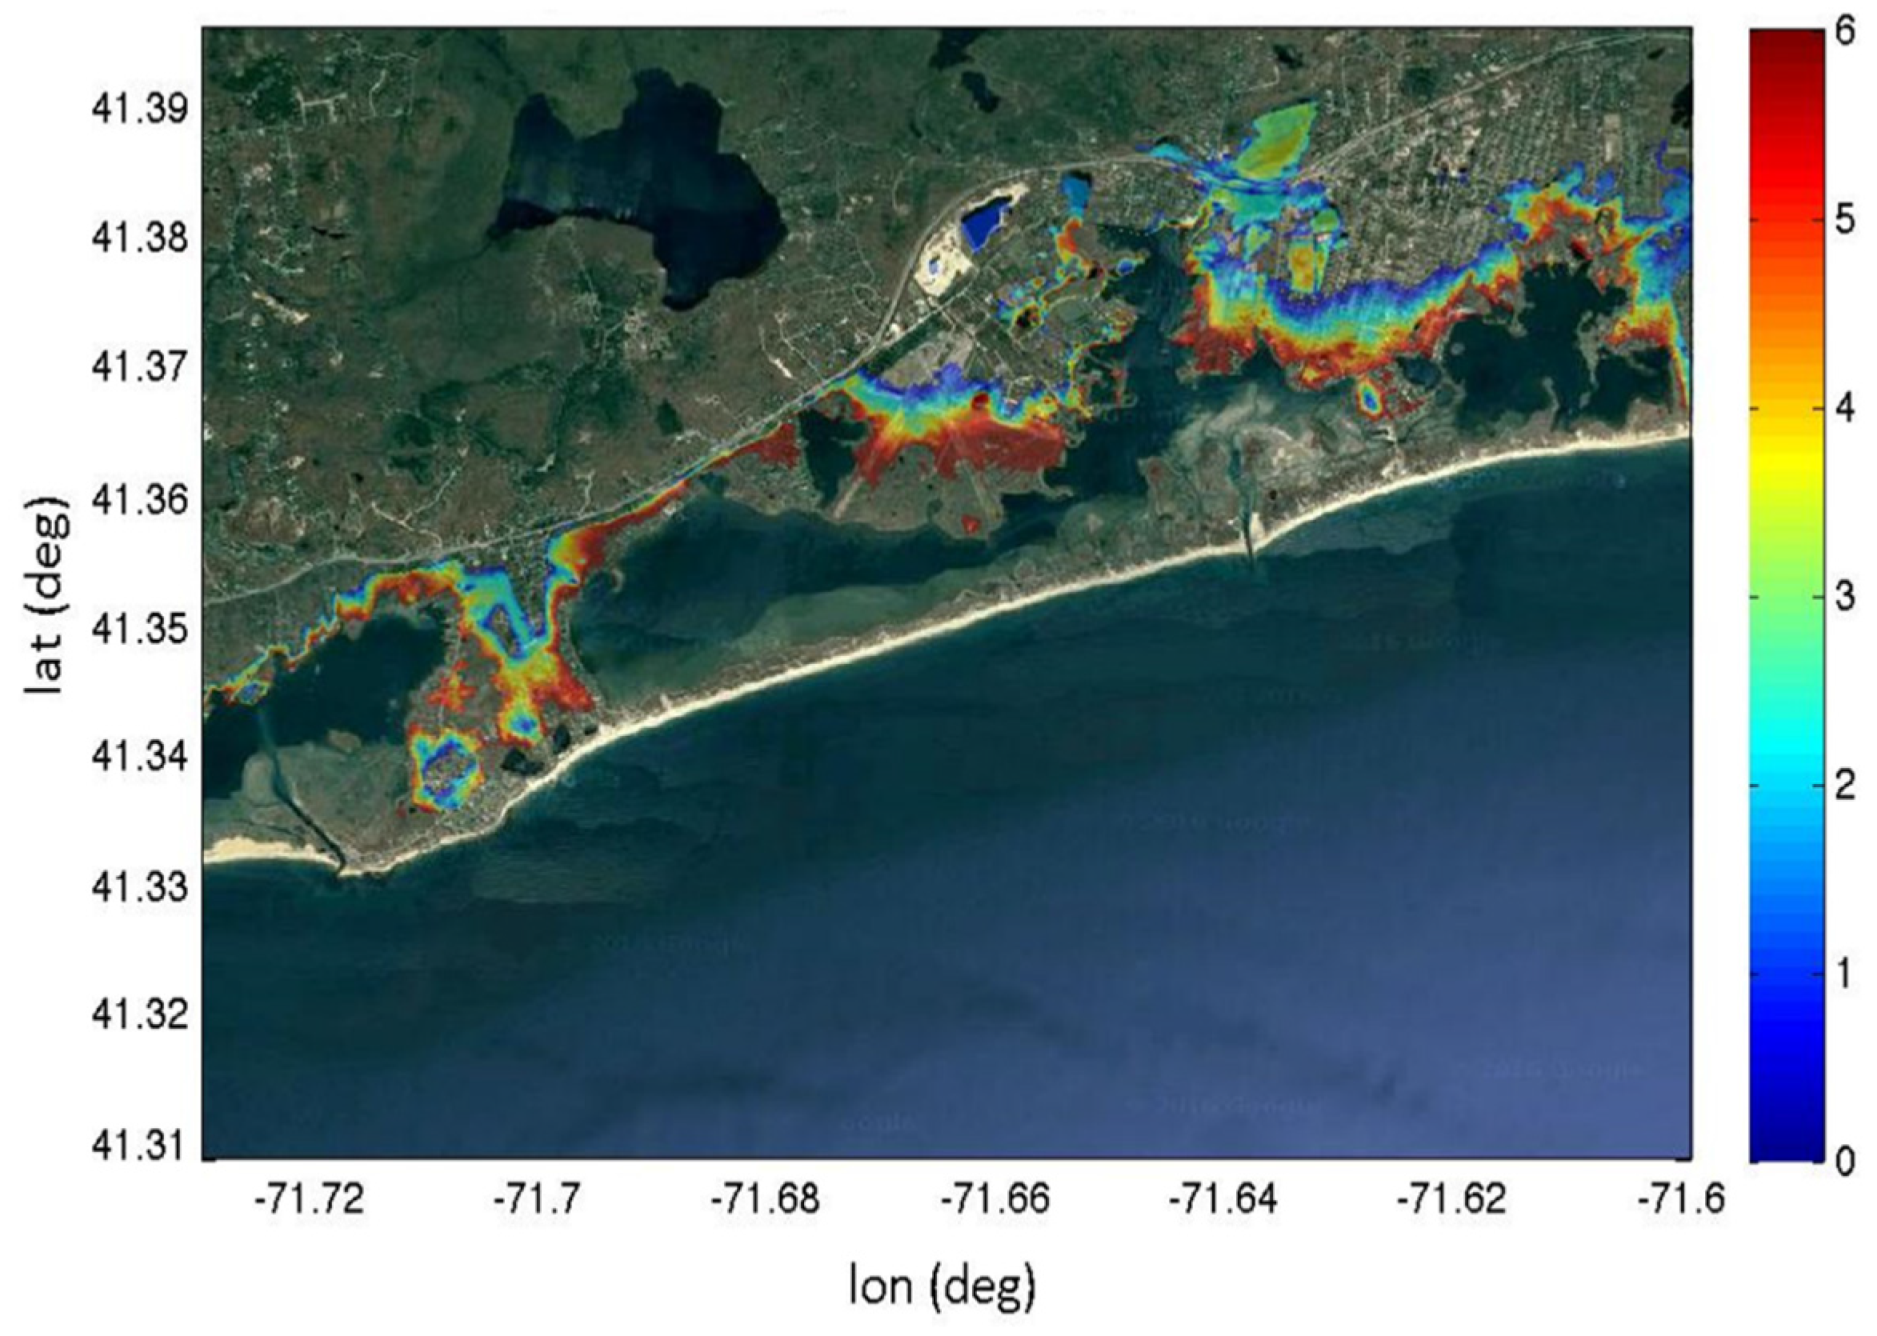
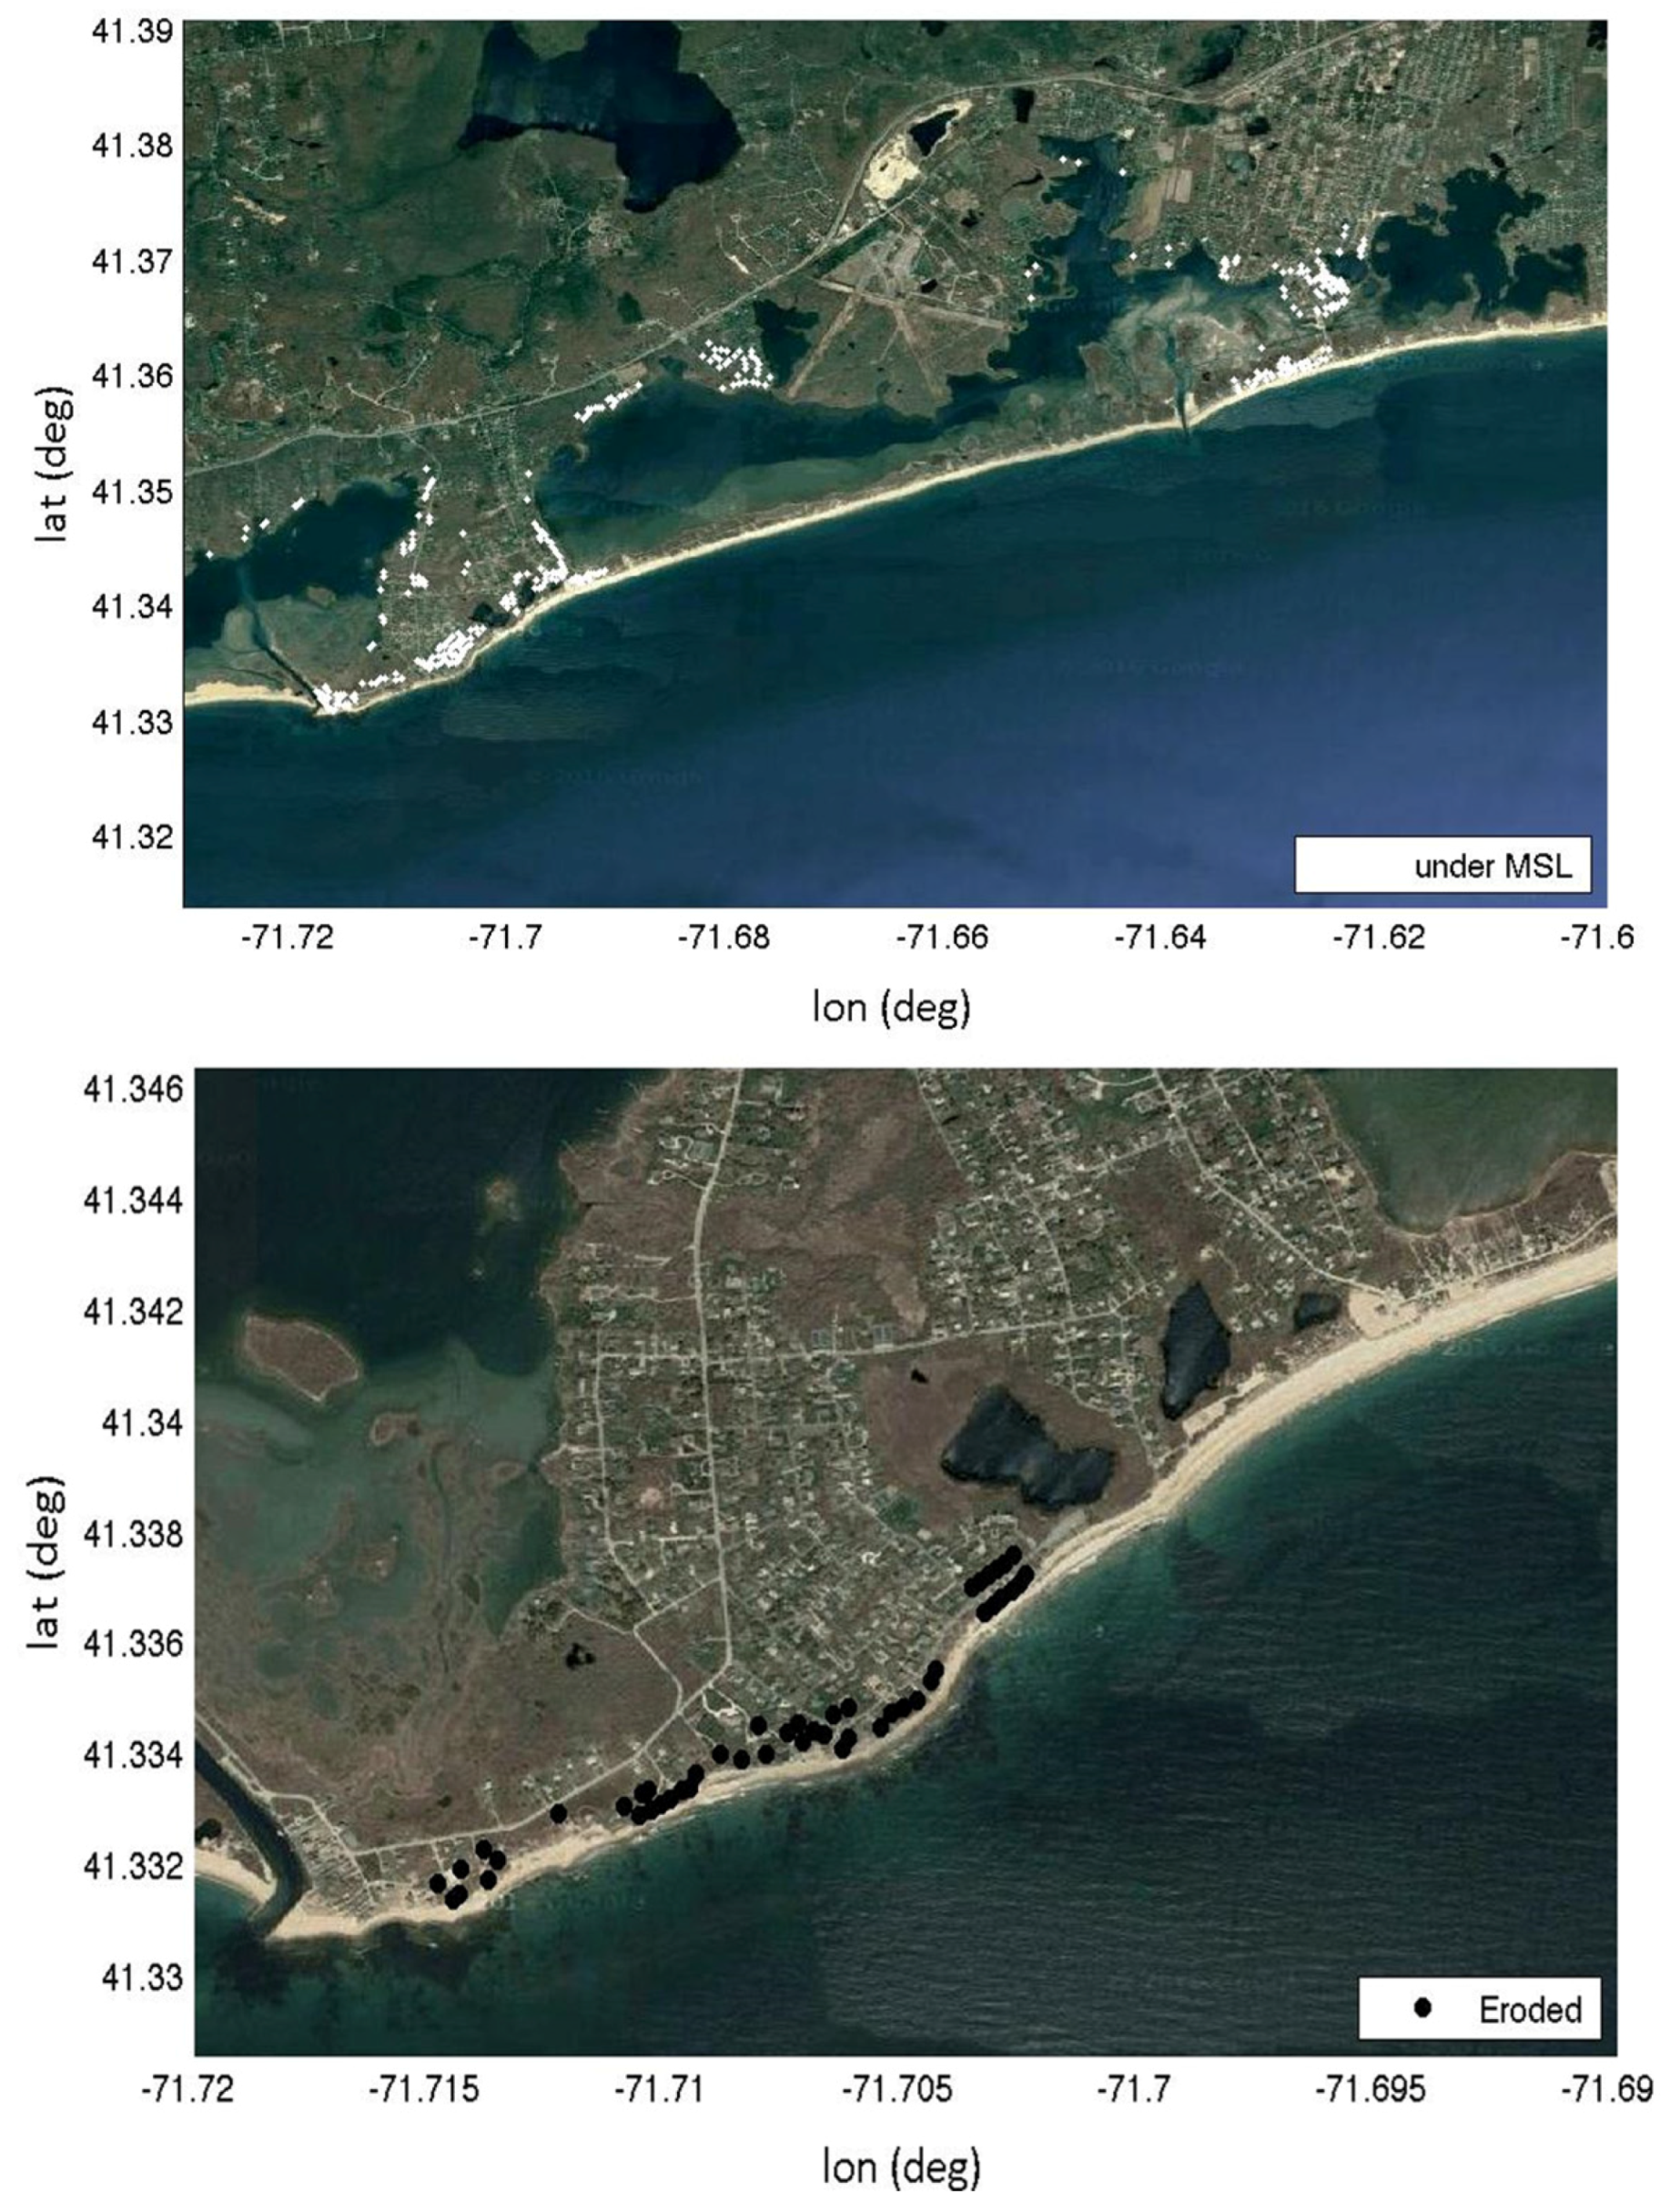
3.1. Application to Charlestown, RI

In the present application, flooding maps for varying return periods for the RI coastal waters were generated based on using ADCIRC/WAM/STWAVE numerical hydrodynamic/wave model predictions performed by the US Army Corps of Engineers (USACE) as part of the North Atlantic Coast Comprehensive Study (NACCS) for synthetic tropical (1050) and historical (100) extra tropical storms [8]. ADCIRC is a widely used system of computer programs for solving time dependent, free surface circulation and transport problems in two and three dimensions. These programs utilize the finite element method in space allowing the use of highly flexible, unstructured grids (www.adcirc.org). Simulations were performed, with and without sea level rise. The strategy employed in this application is to use extremal analysis at a primary water level station to determine the water levels for varying return period and then hydrodynamic model simulations to determine the spatial scaling of peak water levels for storms/return periods referenced to this primary gauging station. As an alternate water levels can be determined from the closest NACCS save point where return period information is available. Details on generating the inundation maps are provided in [9]. The maps are organized under the STORMTOOLS initiative and available at http://www.beachsamp.org/resources/stormtools/. The vision for STORMTOOLS is to provide access a suite of coastal planning tools (numerical models, maps, etc.), available as a web/app service, that allows wide spread accessibly and applicability at high resolution for user selected coastal areas of interest. The approach is well suited for classic downscale modeling approaches used to investigate the impact of climate change on coastal and riverine processes and can readily take advantage of rapidly evolving cloud computing resources.
Figure 5 shows the 100 year return period inundation (depth in meters) map for Charlestown, RI. Areas of open water have been masked and hence show no inundation. The wave estimates, provided in Figure 6, were made by applying STWAVE [10,11] to the study area at a grid resolution of 10 m, with forcing on the offshore boundary from an analysis of the NACCS data set. This is the same forcing as used for the inundation estimates. STWAVE is a steady state spectral wave model and simulates depth-induced wave refraction and shoaling, current induced refraction and shoaling, depth-and steepness-induced wave breaking, wind-wave growth, and wave-wave interaction and white-capping, that redistributes and dissipates energy in a growing wave field. The dune that is present along the barrier system is assumed to remain intact for this case. Frictional losses from overland flows are addressed by assigning Manning roughness coefficients to each grid and depend on land cover and vegetation type. The total water depth, considering both inundation and waves, for this case is shown in Figure 7.
Simulations for inundation and waves were performed again, but assuming the eroded dune profile and hence ceased to provide protection to Ninigret Pond. The eroded dune profile was based on Oakley’s (2016) [12] analysis of long term, time series of cross shore beach profiles for the study area. (The existing and eroded profile are shown in Figure A2 for a selected transect.) The results, comparable to Figure 7, are provided in Figure 8 for this case. One sees that inundation dominates the waters along the coast with waves playing a small role for the dune intact case, while assuming failure of the dune substantially increases the exposure of the area to waves. Even the eroded dune however provides partial protection, by shallow water wave breaking, to those structures along the northern edge of the pond.
The structures in the study area were derived from the E911 database for RI. They are shown in Figure 9, using the prototype classes given in Table 1. There are a total of 1002 structures in the study area, in the absence of sea level rise. Table 2 provides the number for each class. 6B predominates in the area inland (68.1%) followed by 5A (24.4%). Pile supported structures are principally located along the coast and account for 7.6% of the structures. There are no waste water treatment, electrical, or other infrastructure in the study area. The lower panel shows the ability of the approach to resolve details down to the individual structure level. The FFEs were defined by prototype class and field verified for pile support structures (7A and B).
The percent structural damages (maximums) by structure for the 100 year event, without and with dune failure, are shown in Figure 10, upper and lower panels, respectively. (Content damages were estimated but not discussed given space limitations). In general damage decreases with distance inland from the coast, with the highest damages immediately along the coast. Damages increase if the dunes are assumed to erode because of the increase in wave height but this effect is limited by shallow water breaking of waves as they encounter the eroded dunes. The least damage occurs for elevated structures (7) and the most for structures with basements (6).
Figure 11 shows the cumulative percent damage vs. percent of structures for dunes intact (upper panel) and dune eroded (lower panel). Results are provided for both content (C) and structural (S) for the minimum, most likely, and maximum damage curves. Table 3 provides the total number of structures in the study area, those that receive any damage, and those whose damage exceeds 50%, the latter is the criteria that is used by the RI Coastal Resources Management Council (CRMC) to determine whether a structure can be repaired as is or must conform to the most recent building standards. The analysis was performed for minimum, most likely, and maximum damage curves. Given space limitations only the values for the most likely case are provided here. In general, the cumulative probability distribution curve moves to the right for the dune eroded compared to the dune intact cases. For the dunes intact case 86.7% of the structures are damaged, while if the dunes are eroded the percent damage increases to 96.3%. If one restricts attention to the greater than 50% damage case, comparable values are 22.1% and 54%, respectively. Those structures damaged at higher than 50% are hence much smaller than those with any damage. The damage is higher for structures with basements than without, no matter the state of the dunes. If the dunes fail all pile supported structures are predicted to receive damage greater than 50% given the limited elevation of the structures.
Simulations were repeated assuming 2.1 m (7 ft) of SLR, without dunes. This value of SLR was selected as it has been adopted by CRMC for planning purposes. This case also included estimates of coastal erosion based on an analysis of historical shoreline change maps for the study area, as well as observed erosion for similar barrier systems [13] for 2100. The dunes were assumed to fail in this case. The results for total water level are shown in Figure A3. Table 2 shows the number of structures in the flooded area with SLR, by prototype class. Also provided are the number of structures that have been eliminated as a result of SLR (structures whose elevation is below mean sea level (MSL)) and those eliminated by shoreline erosion. The total number of structures is 1323, about 30% larger than the no SLR case (1002). The percent below MSL is about 30.2% while those removed by erosion is 3.7% for a total of 33.9%. All pile supported structures are eliminated given their proximity to the coast. Prototype 5A account for 21.9% of the total while 6B comprise 44.2%.
Figure 12 shows the predicted damages for this case. The structures eliminated due to erosion are shown by the black dots and those now below MSL are denoted by white dots. The location of the structures subject to erosion are difficult to see. Higher resolution versions of this same map for a selected sub area are shown in Figure A4 to illustrate the ability to obtain structure by structure detail. Structures below MSL are highlighted in Figure A5 (upper panel) and those impacted by erosion are given in A5 (lower panel). To be conservative the exponential high erosion rate is assumed and projected to 2100. Both results assume an eroded dune. Table 3 shows the damage by prototype class for any damage and greater than 50% damage; 96.6% of the structures are damaged, with 73.8% receiving damage greater than 50%. These values are comparable to the dune eroded case for the any damage case but substantially higher for the 50% or greater case. This is a result of the increased depth of inundation and waves caused by the increase in SLR.

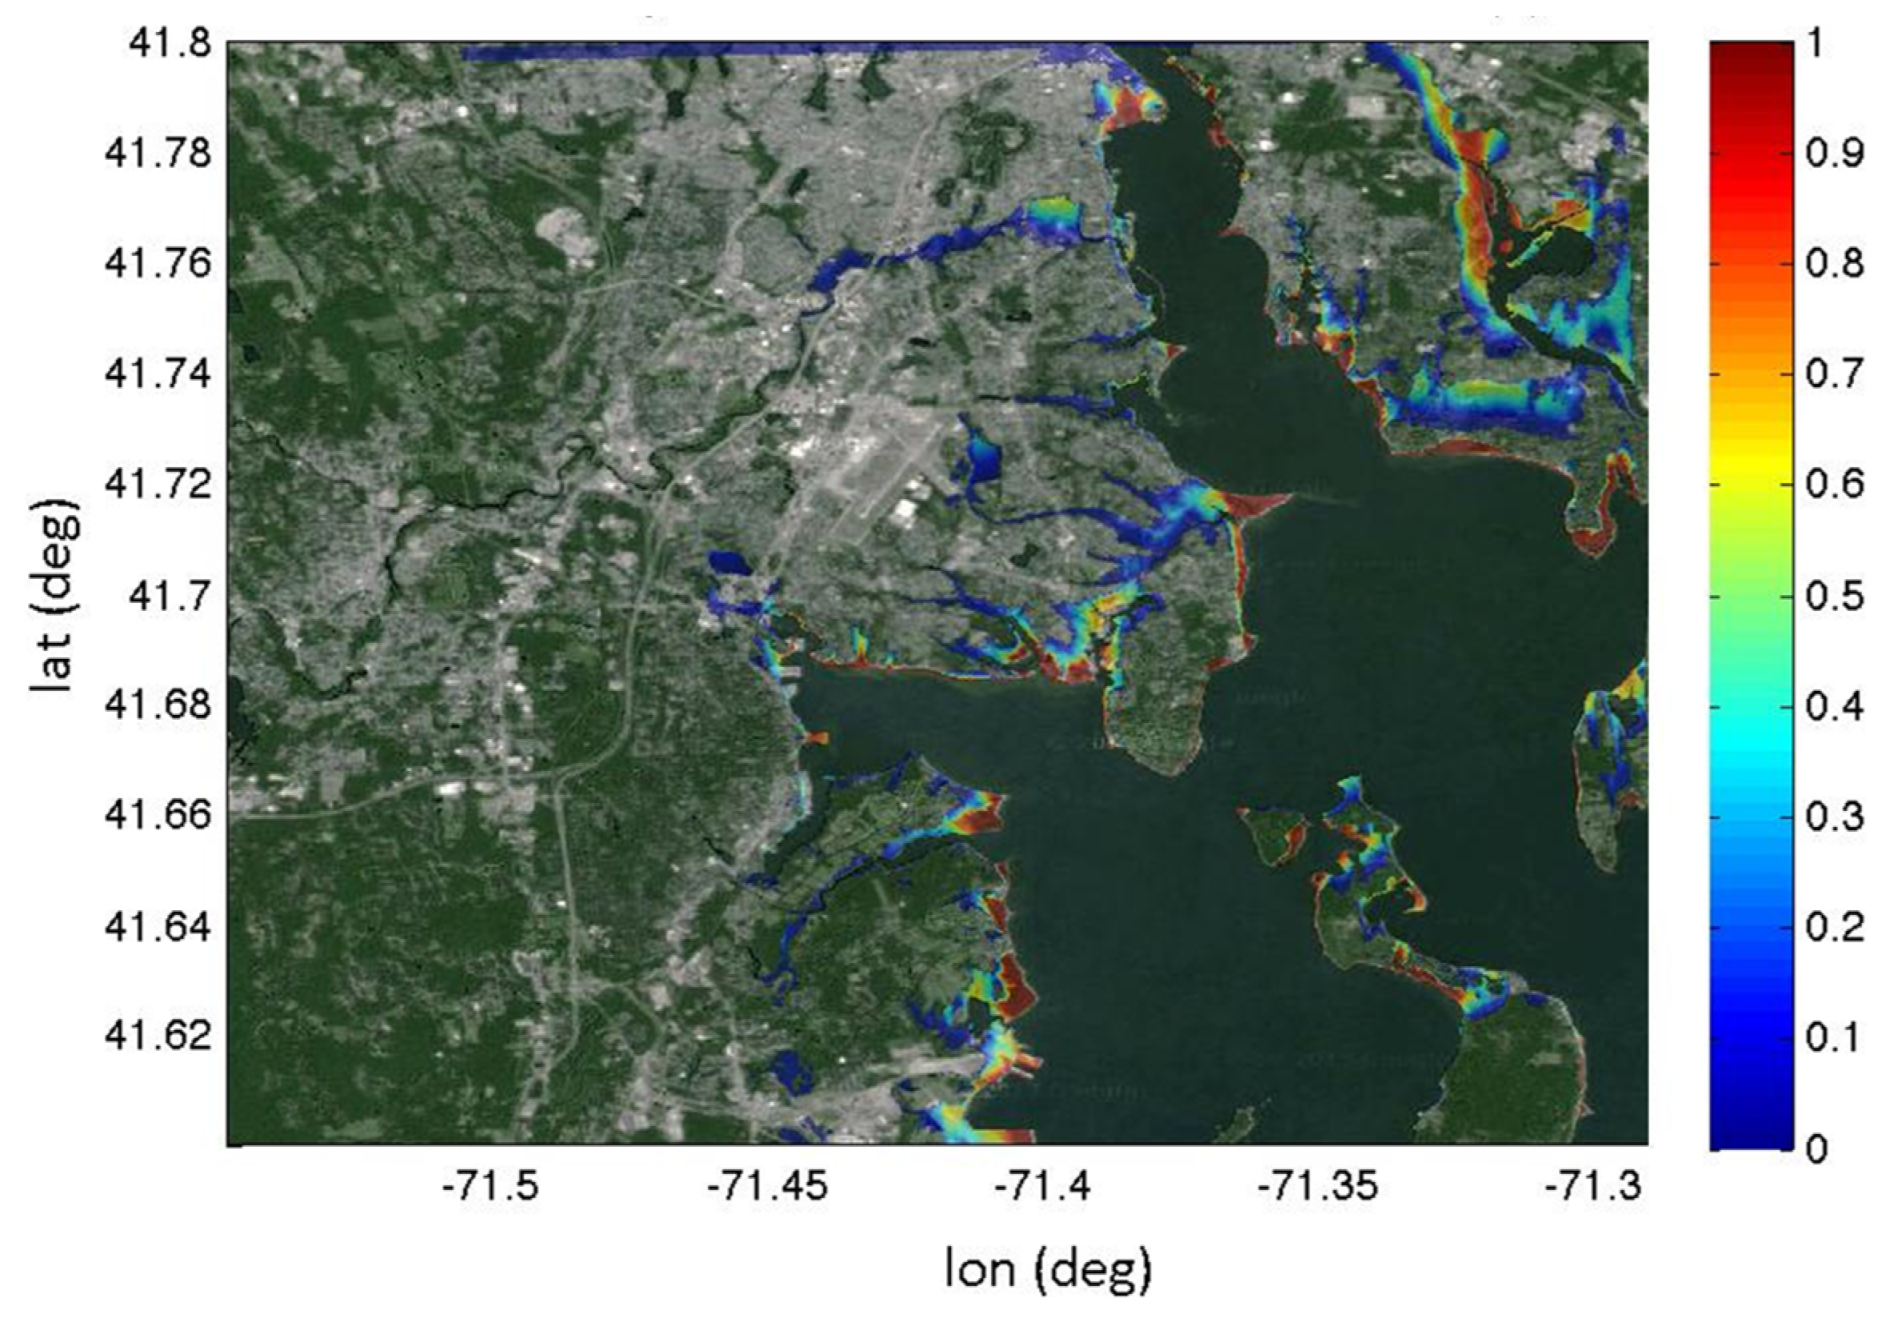
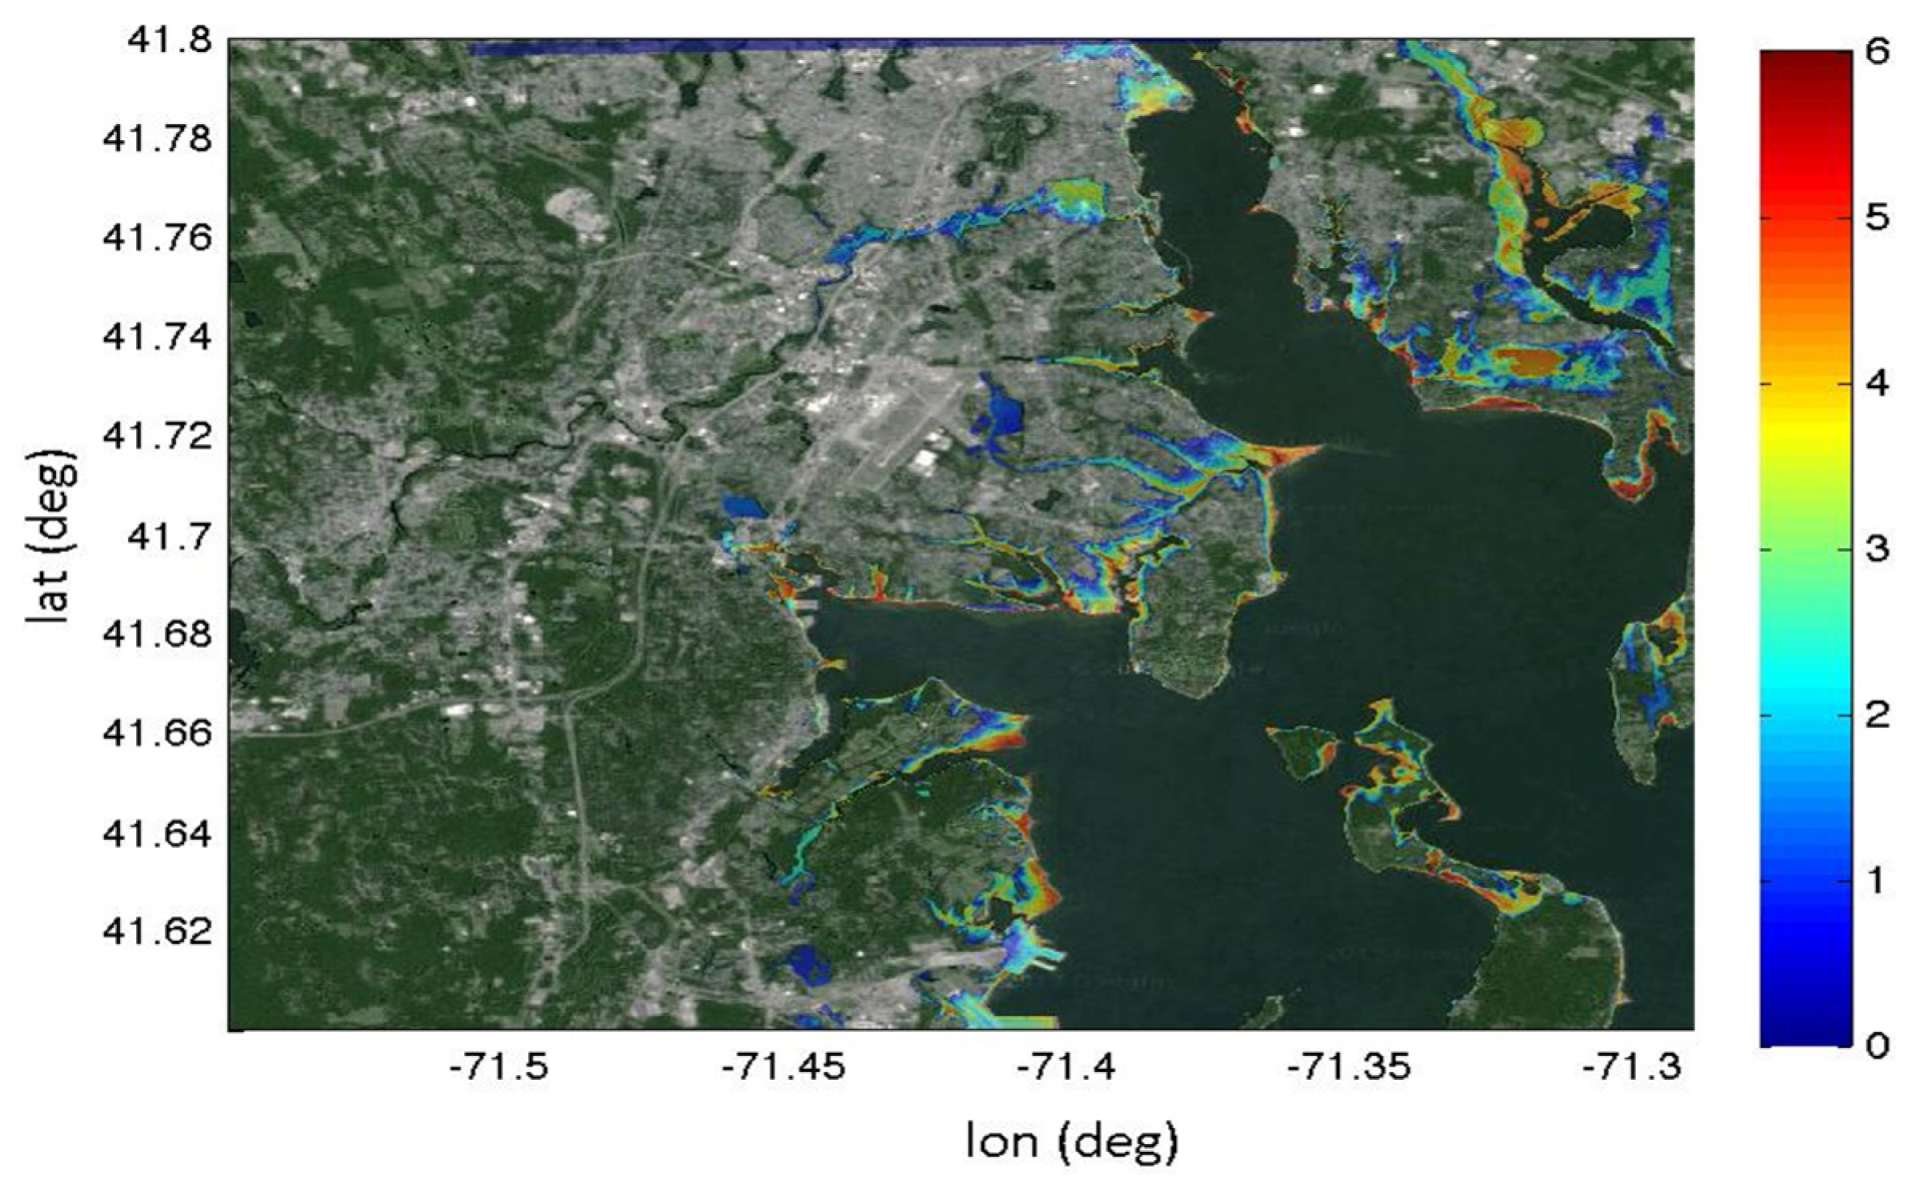
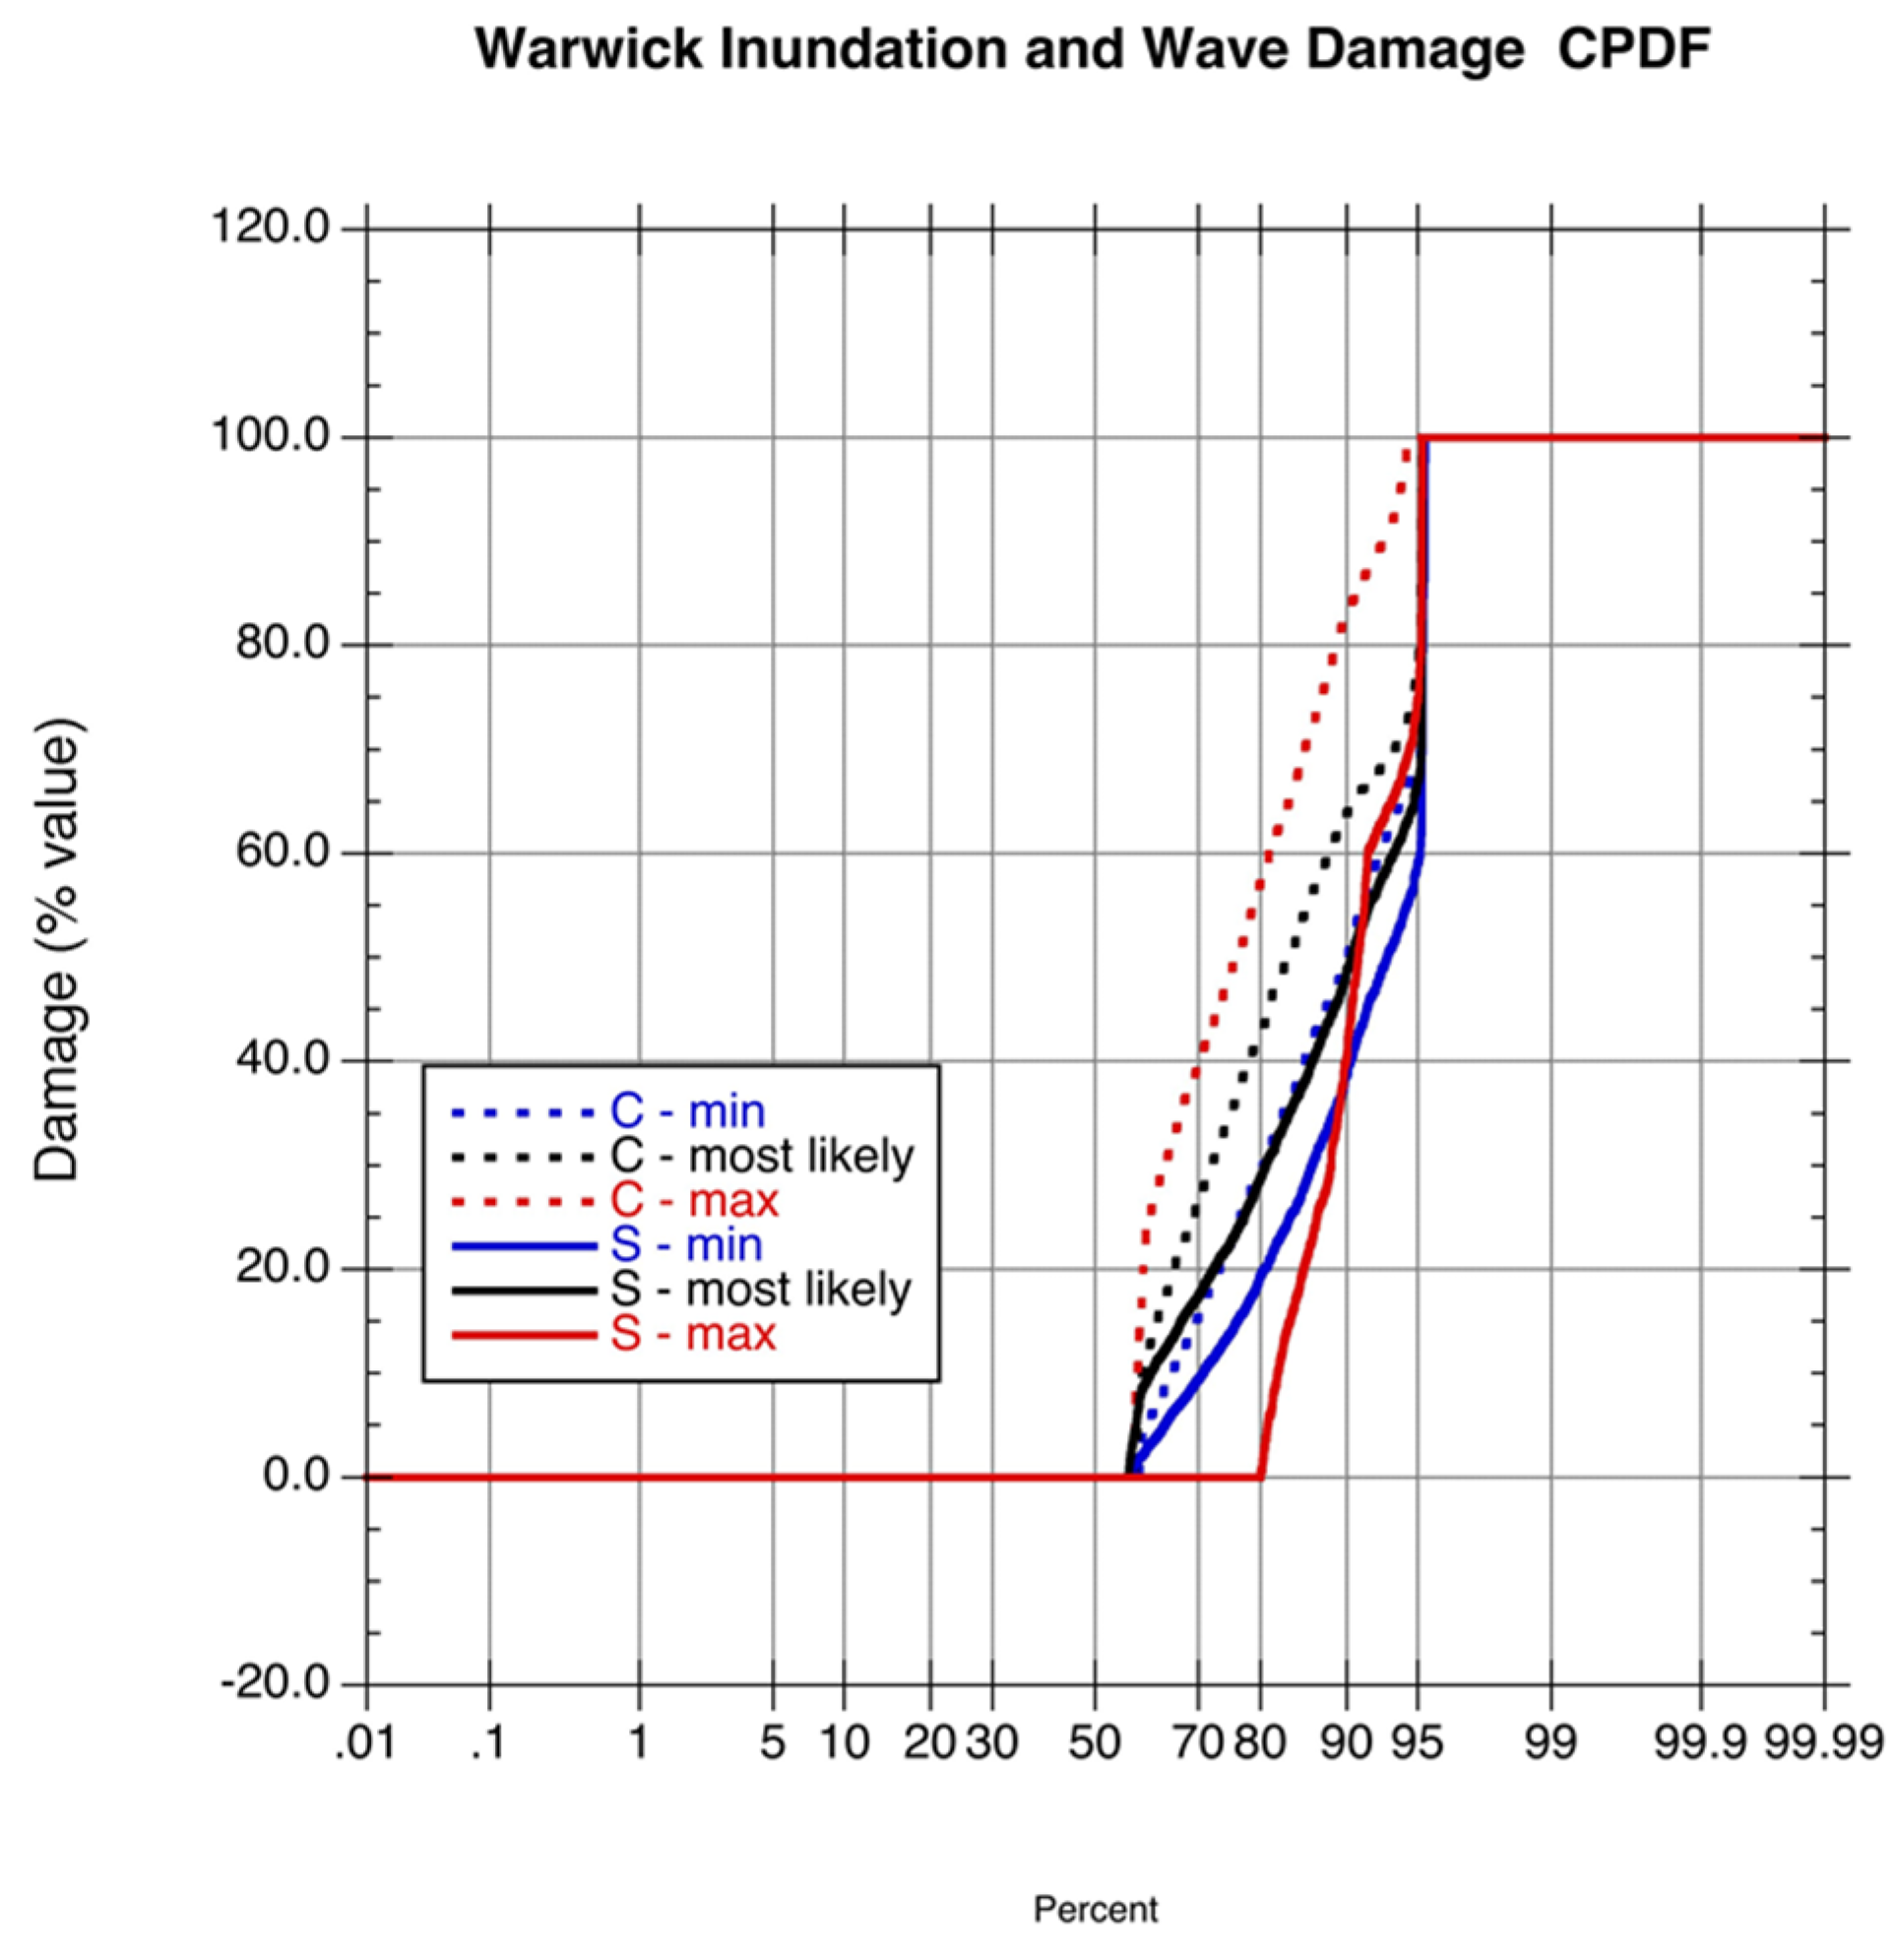
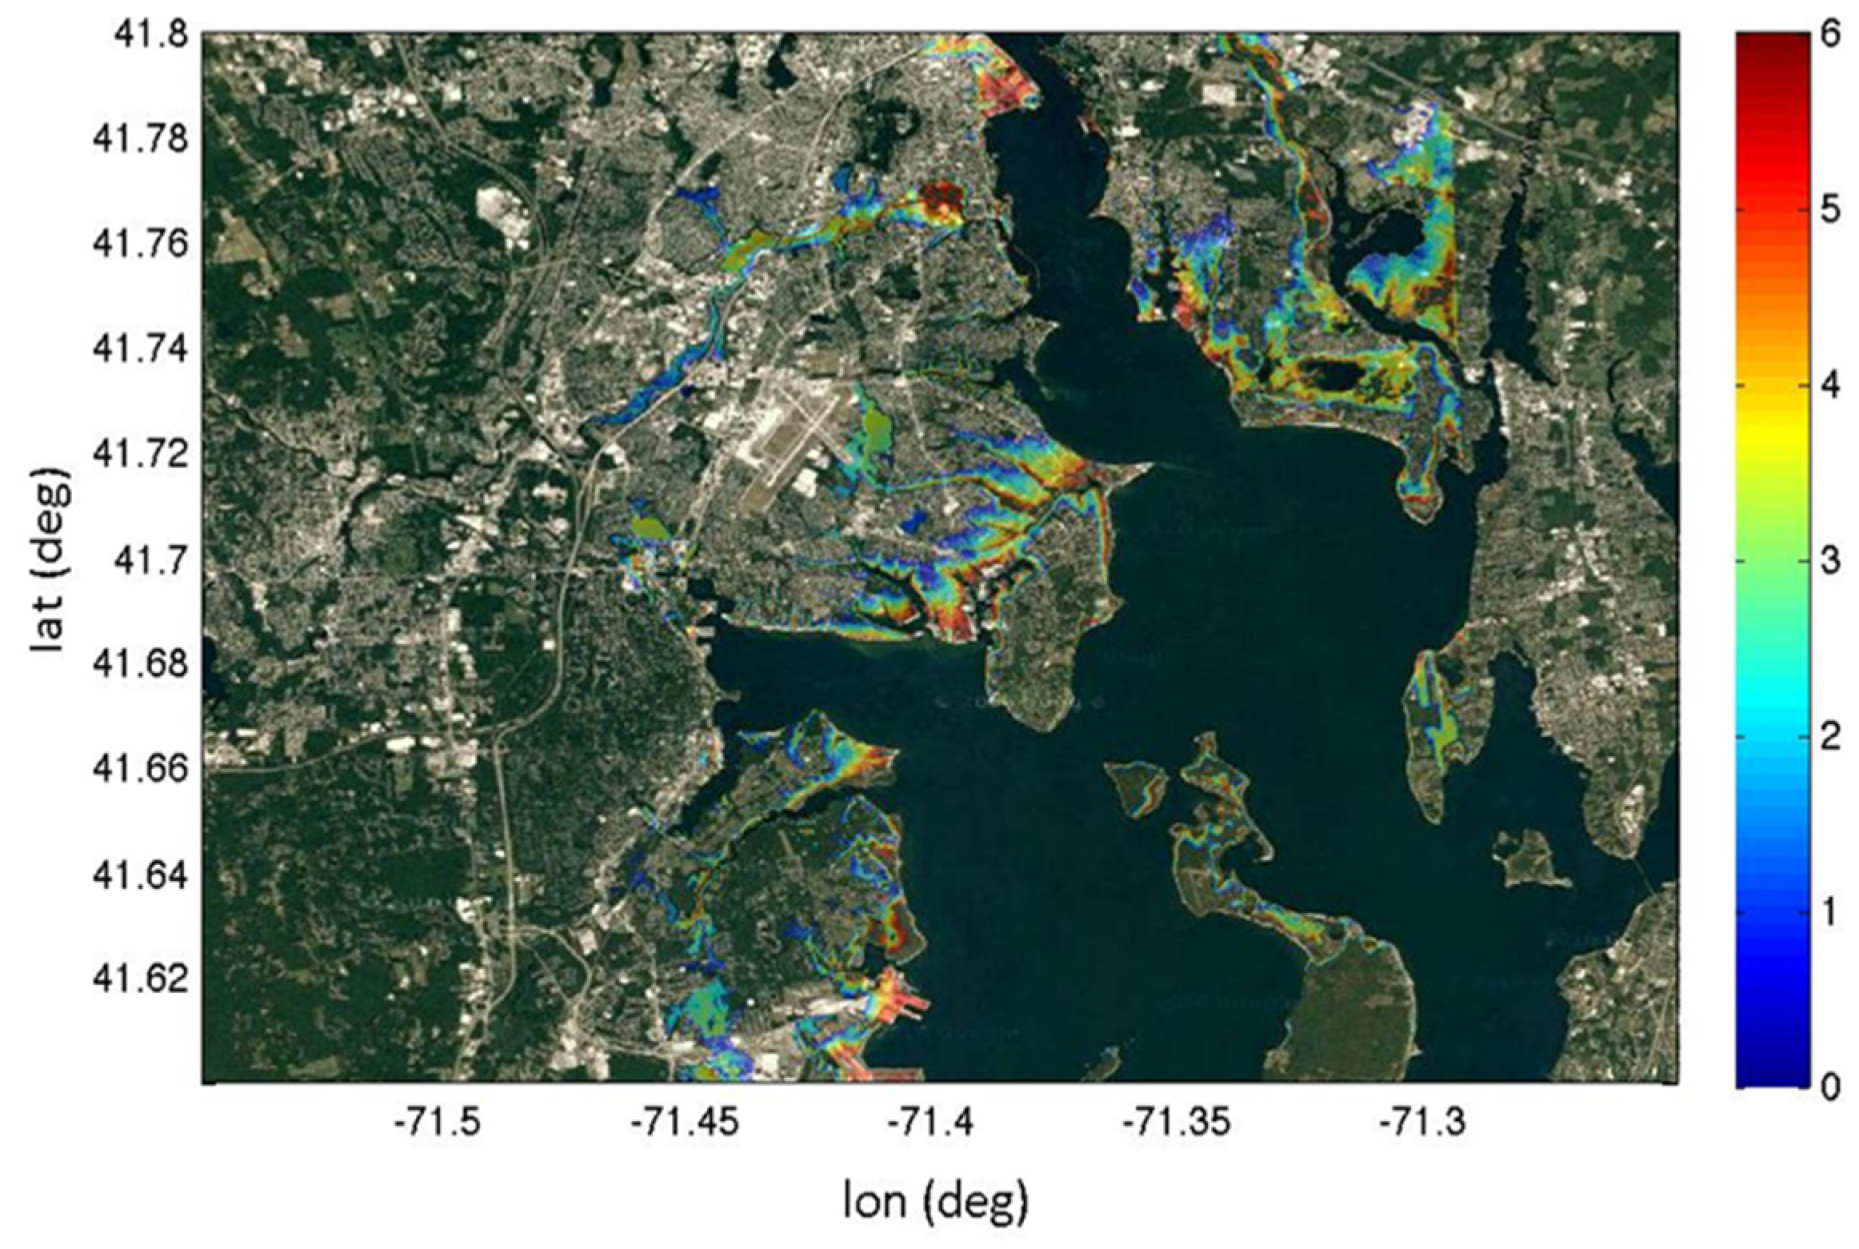
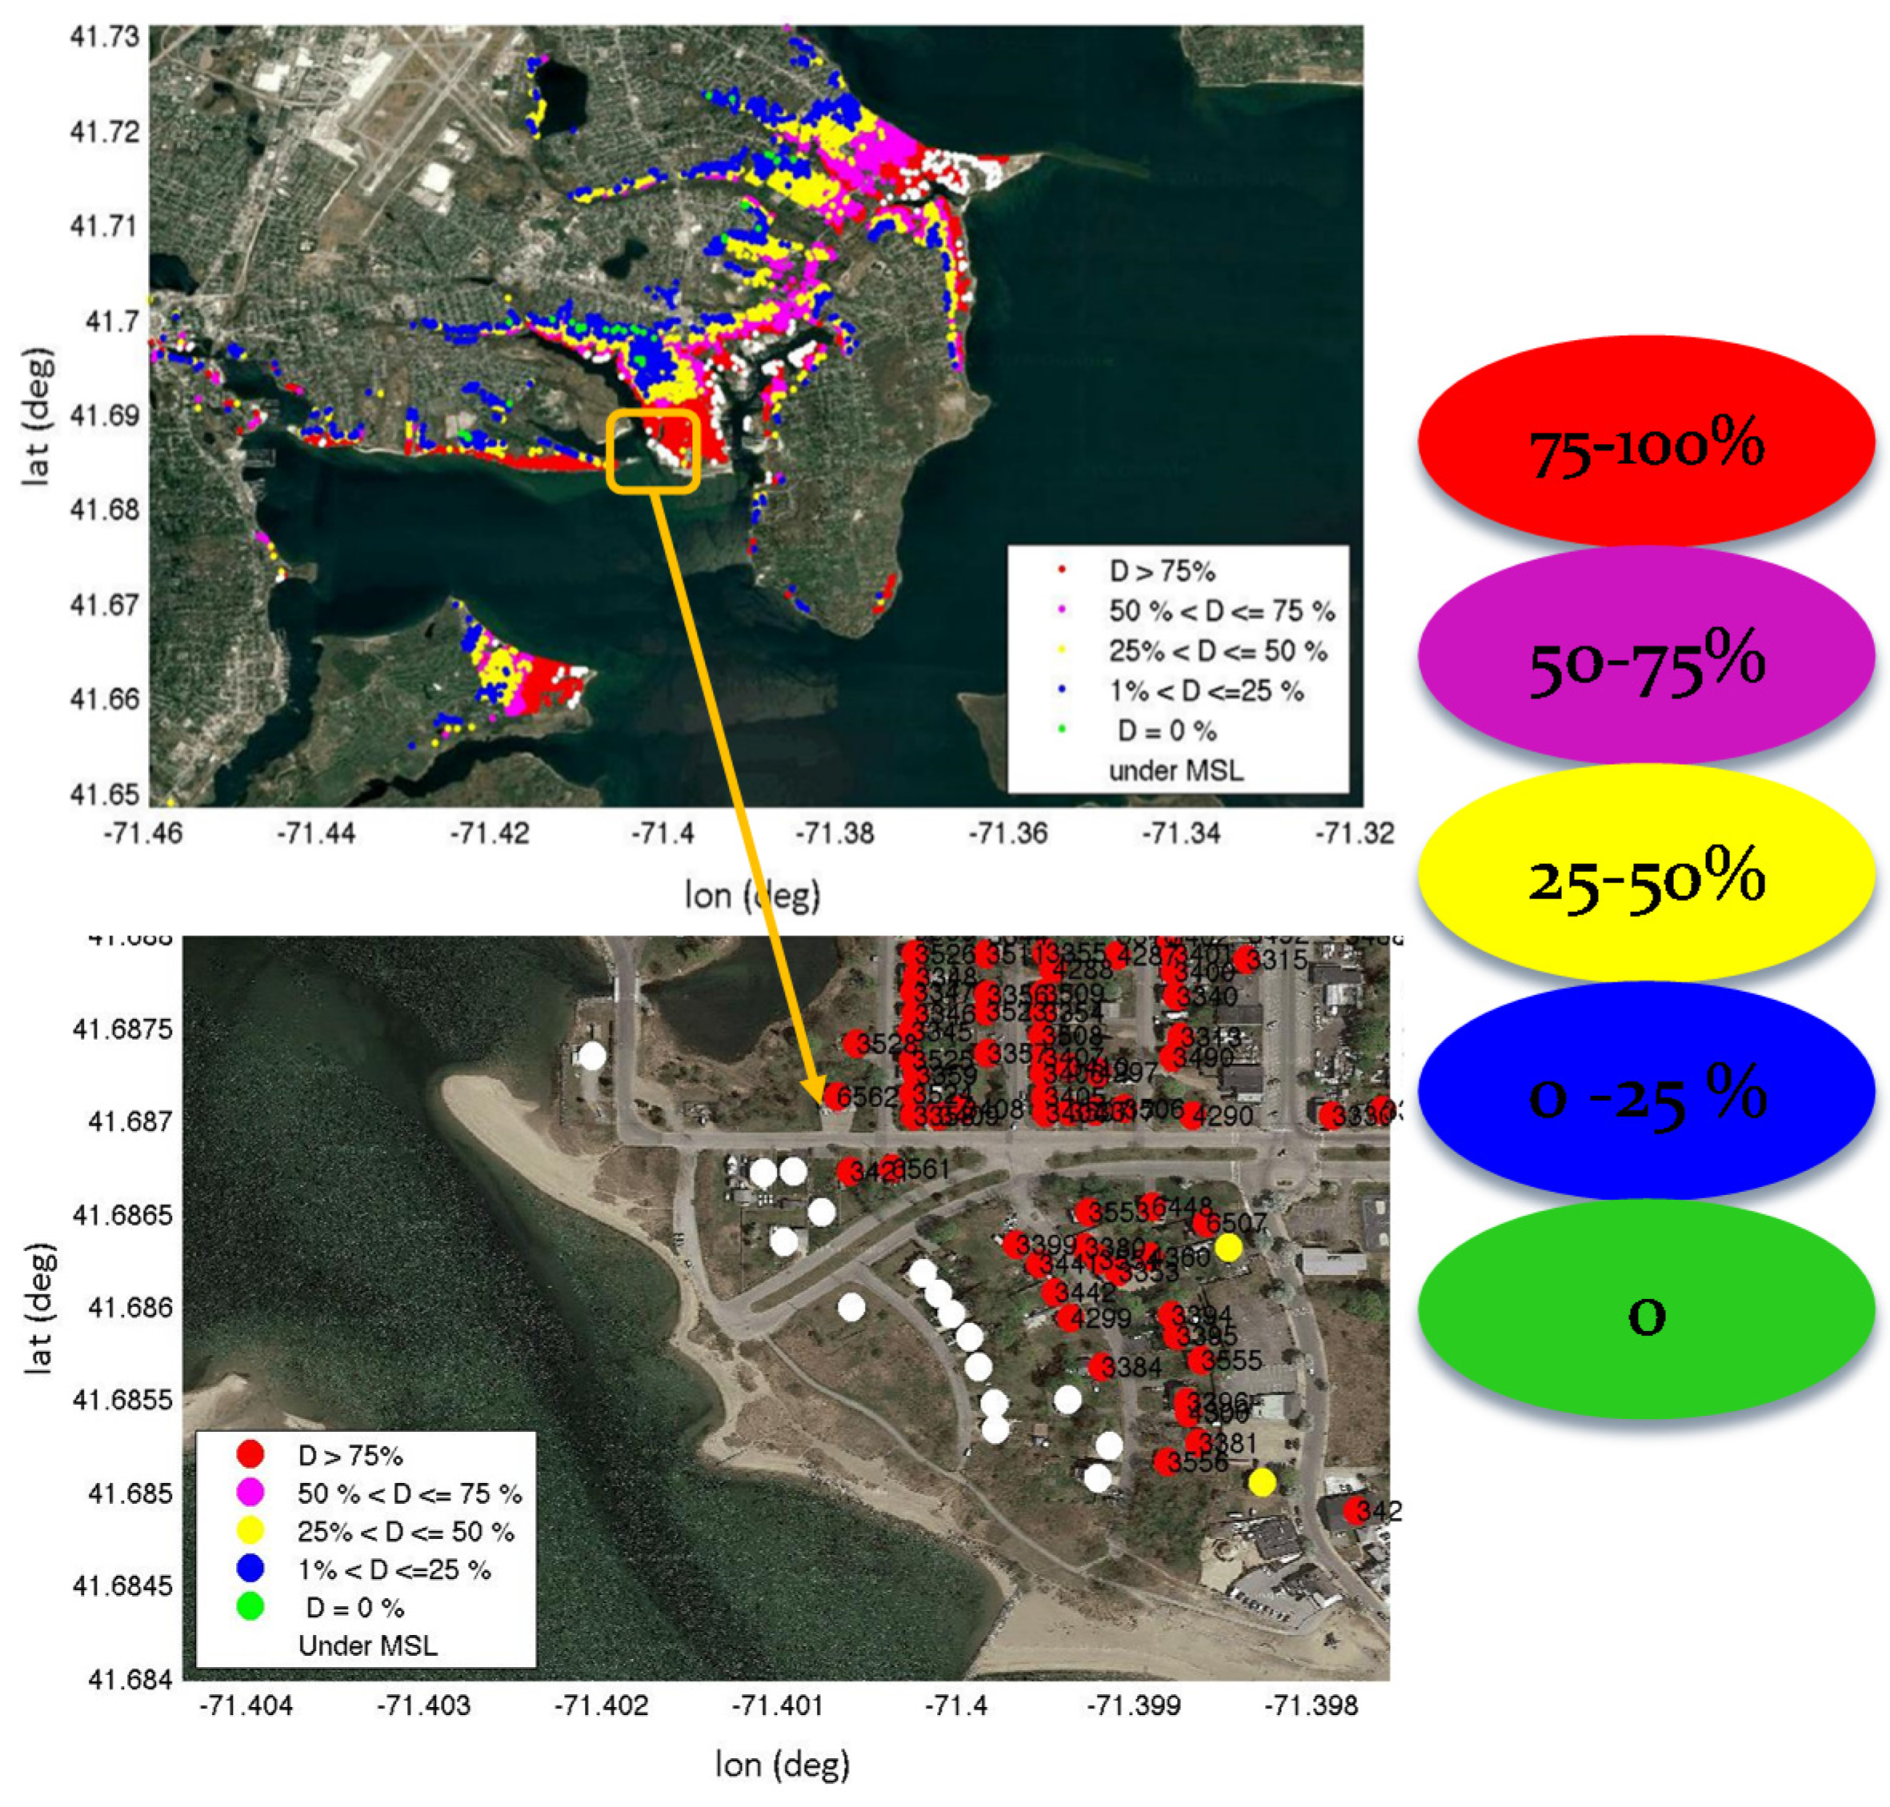
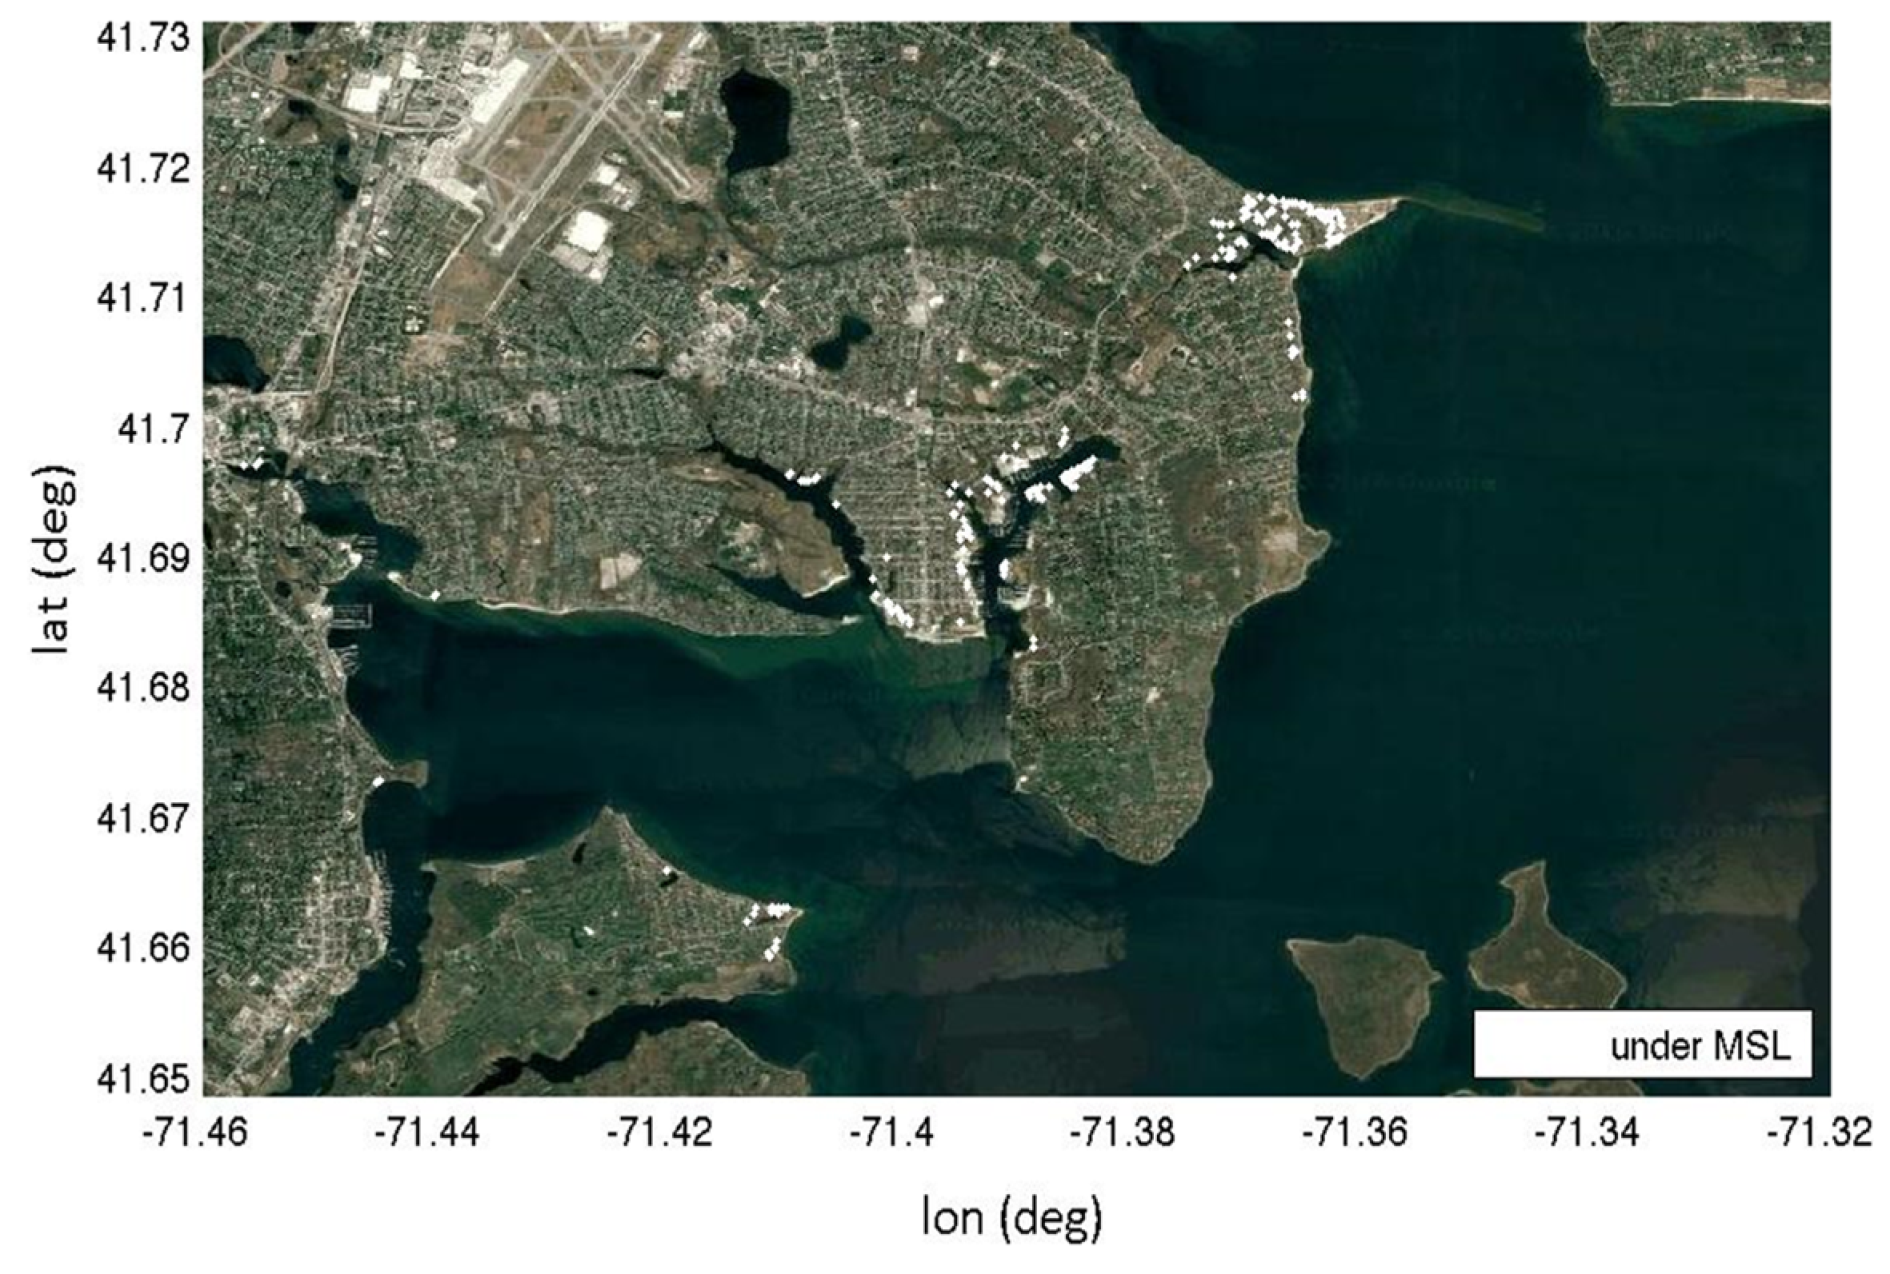
3.2. Application to Warwick, RI

CERI was similarly applied to Warwick, RI, which is located on the western side of Narragansett Bay, near the mouth of the Providence River. The area experiences little exposure to waves given the limited fetch distances, reduced wind speeds due to adjacent land mass, and very limited shoreline erosion.
Flooding maps were obtained from STORMTOOLS. The 100 year flood map is shown in Figure 13. STWAVE was applied to simulate the waves for the upper bay using a 10 m grid resolution with the wind speed, direction, and water level at the mouth of the bay provided by the NACCS model results. Wind speed of 35 m/section from the south was assumed. The predictions of the controlling wave height are provided in Figure 14. The total water depth, including both surge and waves, is shown in Figure 15. The 100 year flooding level (4.8 m) is a result of the amplification of storm surge with distance up Narragansett Bay. The contribution of waves is quite limited compared to the southern RI coast line, given the short fetch distances and the decrease in wind speed inside the bay caused by the surrounding land.
The structures in the study area were derived from the E911 data base for RI and shown in Figure 16 by the prototype classes given in Table 1. Table 4 provides the number for each class. 6B predominates in the area with 69.1% of the total followed by 5A with 30.1%. The number of pile supported structures is very limited (≤1%) and the few that are present are along the immediate coastline. There are no waste water treatment, electrical, or other infrastructure in the coastal study area. The lower panel in Figure 16 shows the ability of the approach to resolve details down to the individual structure level. The FFEs were defined by prototype class and field verified by spot checks.
The percent damages, by structure, for the 100 year event are shown in Figure 17. In general damages are highest along the coast and in the Warwick Neck area and decrease rapidly with distance inland. The least damage occurs for elevated structures (7) and the most for structures with basements (5 and 6). Figure 18 shows the cumulative percent damage vs. percent of structures. Results are provided for both content (C) and structural (S) for the minimum, most likely, and maximum damage curves. Table 5 provides the total number of structures in the study area, those that receive any damage, and those whose damage exceeds 50%. Most of the structures in the flood impacted zone receive some damage while about 20% receive 50% or more. All pile supported structures receive some damage and a large percentage (75% to 81%) receive more than 50% damage. This is attributed to inadequate elevations of the FFE.
Simulations were repeated for the 100 year plus 2.1 m (7 ft) SLR scenario. The total water level map for this case is provided in Figure A6. Table 4 shows the number of structures by prototype class for this case. The number of structures increases to 5304, more than double the number for the no SLR case (2504). 5B account for 35.4% and 6B for 60% of the structures while 4.5% are below MSL. Structures on piles are mainly eliminated given their proximity to the coast and low FFEs. The percent damages by structure for the 100 year are shown in Figure 19 for this case. Black dots are structures that have been eliminated by erosion and white dots structures that are below MSL. Higher resolution maps are provided in Figure A7.
Table 5 summarizes the damages for the 100 year plus SLR case. Most of the structures in the flooded zone receive damage, while on the average 43% receive more than 50% damage. It is important to note that the number of houses impacted by SLR (4892) is substantially larger than for the 100 year with no SLR scenario (2435).
Comparing Figure 18 to Figure 16, inclusion of SLR essentially eliminates structures along the margins of Warwick Neck due to changes in mean sea level and in general increases the damage as one moves inland. This is mainly caused by increased inundation. The impact of the change in SLR on structures is highlighted in Figure A8.

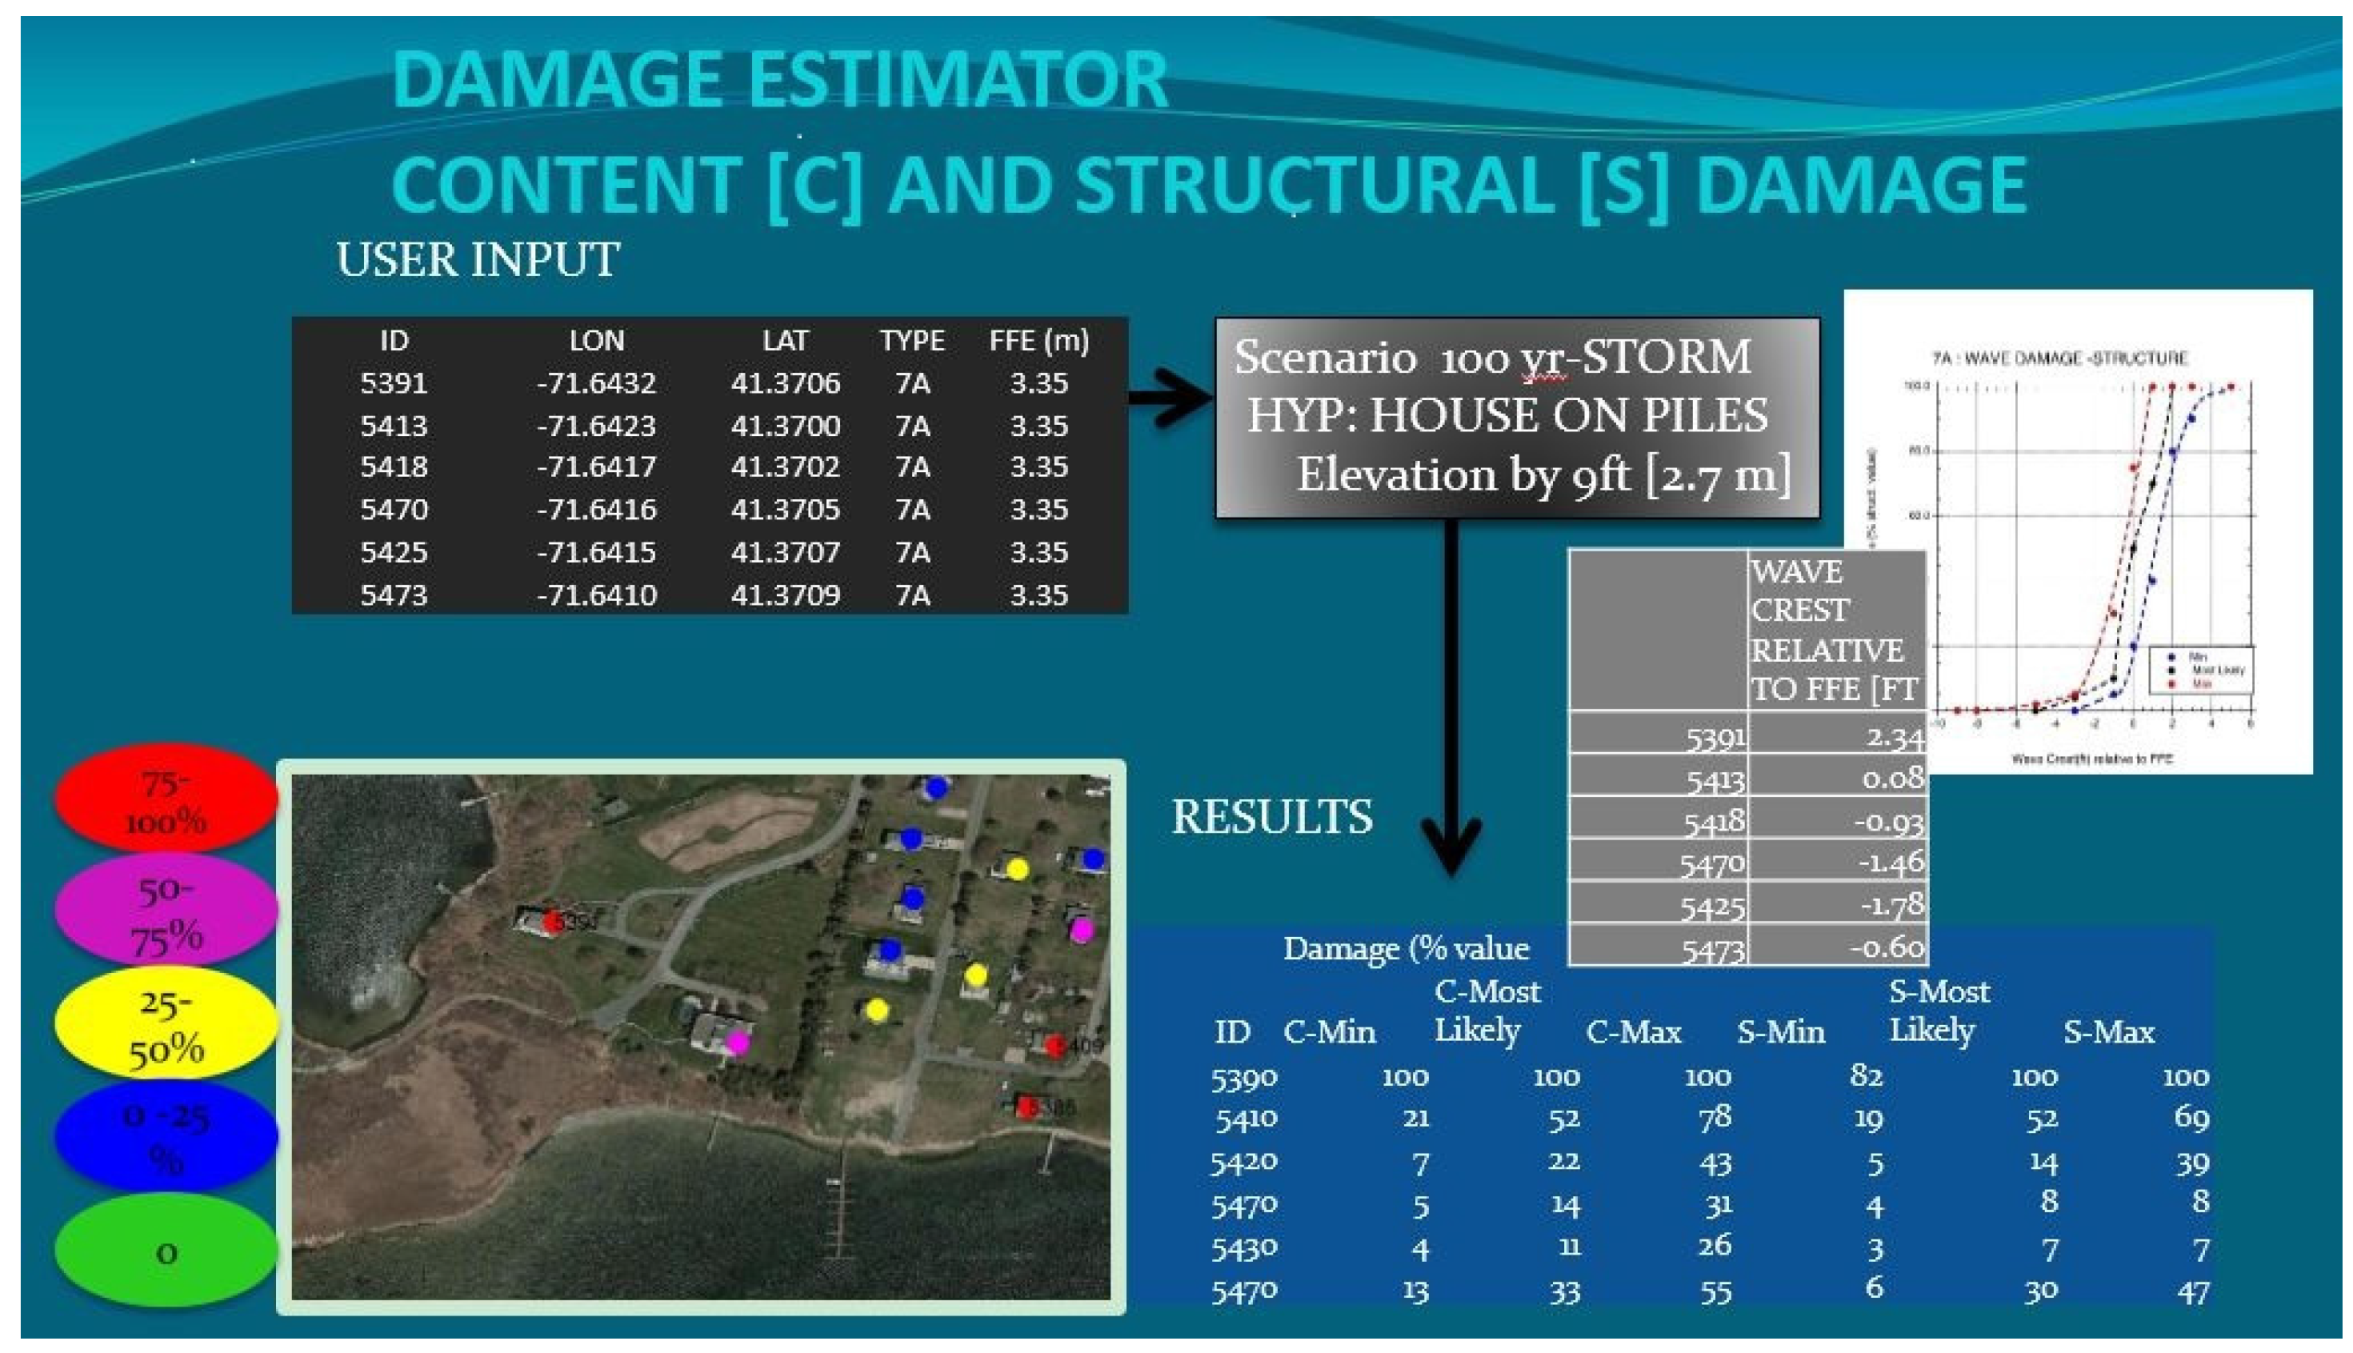
3.3. Damages Structure by Structure

Given its basic design, CERI can be used to investigate the damages on a structure by structure basis. As an example, Figure 20 shows the input and predicted damages for a few selected structures located immediately along the coast in Charlestown, RI for the 100 year event. To show the ability to explore management options with the tool, Figure 21 shows the results for the same structures but assuming all are elevated on piles 2.7 m above grade. Under existing conditions most structures face 100% damage while elevating them reduces the damages to all of them with degree of reduction based on the location relative to the coast and the associated FFE.

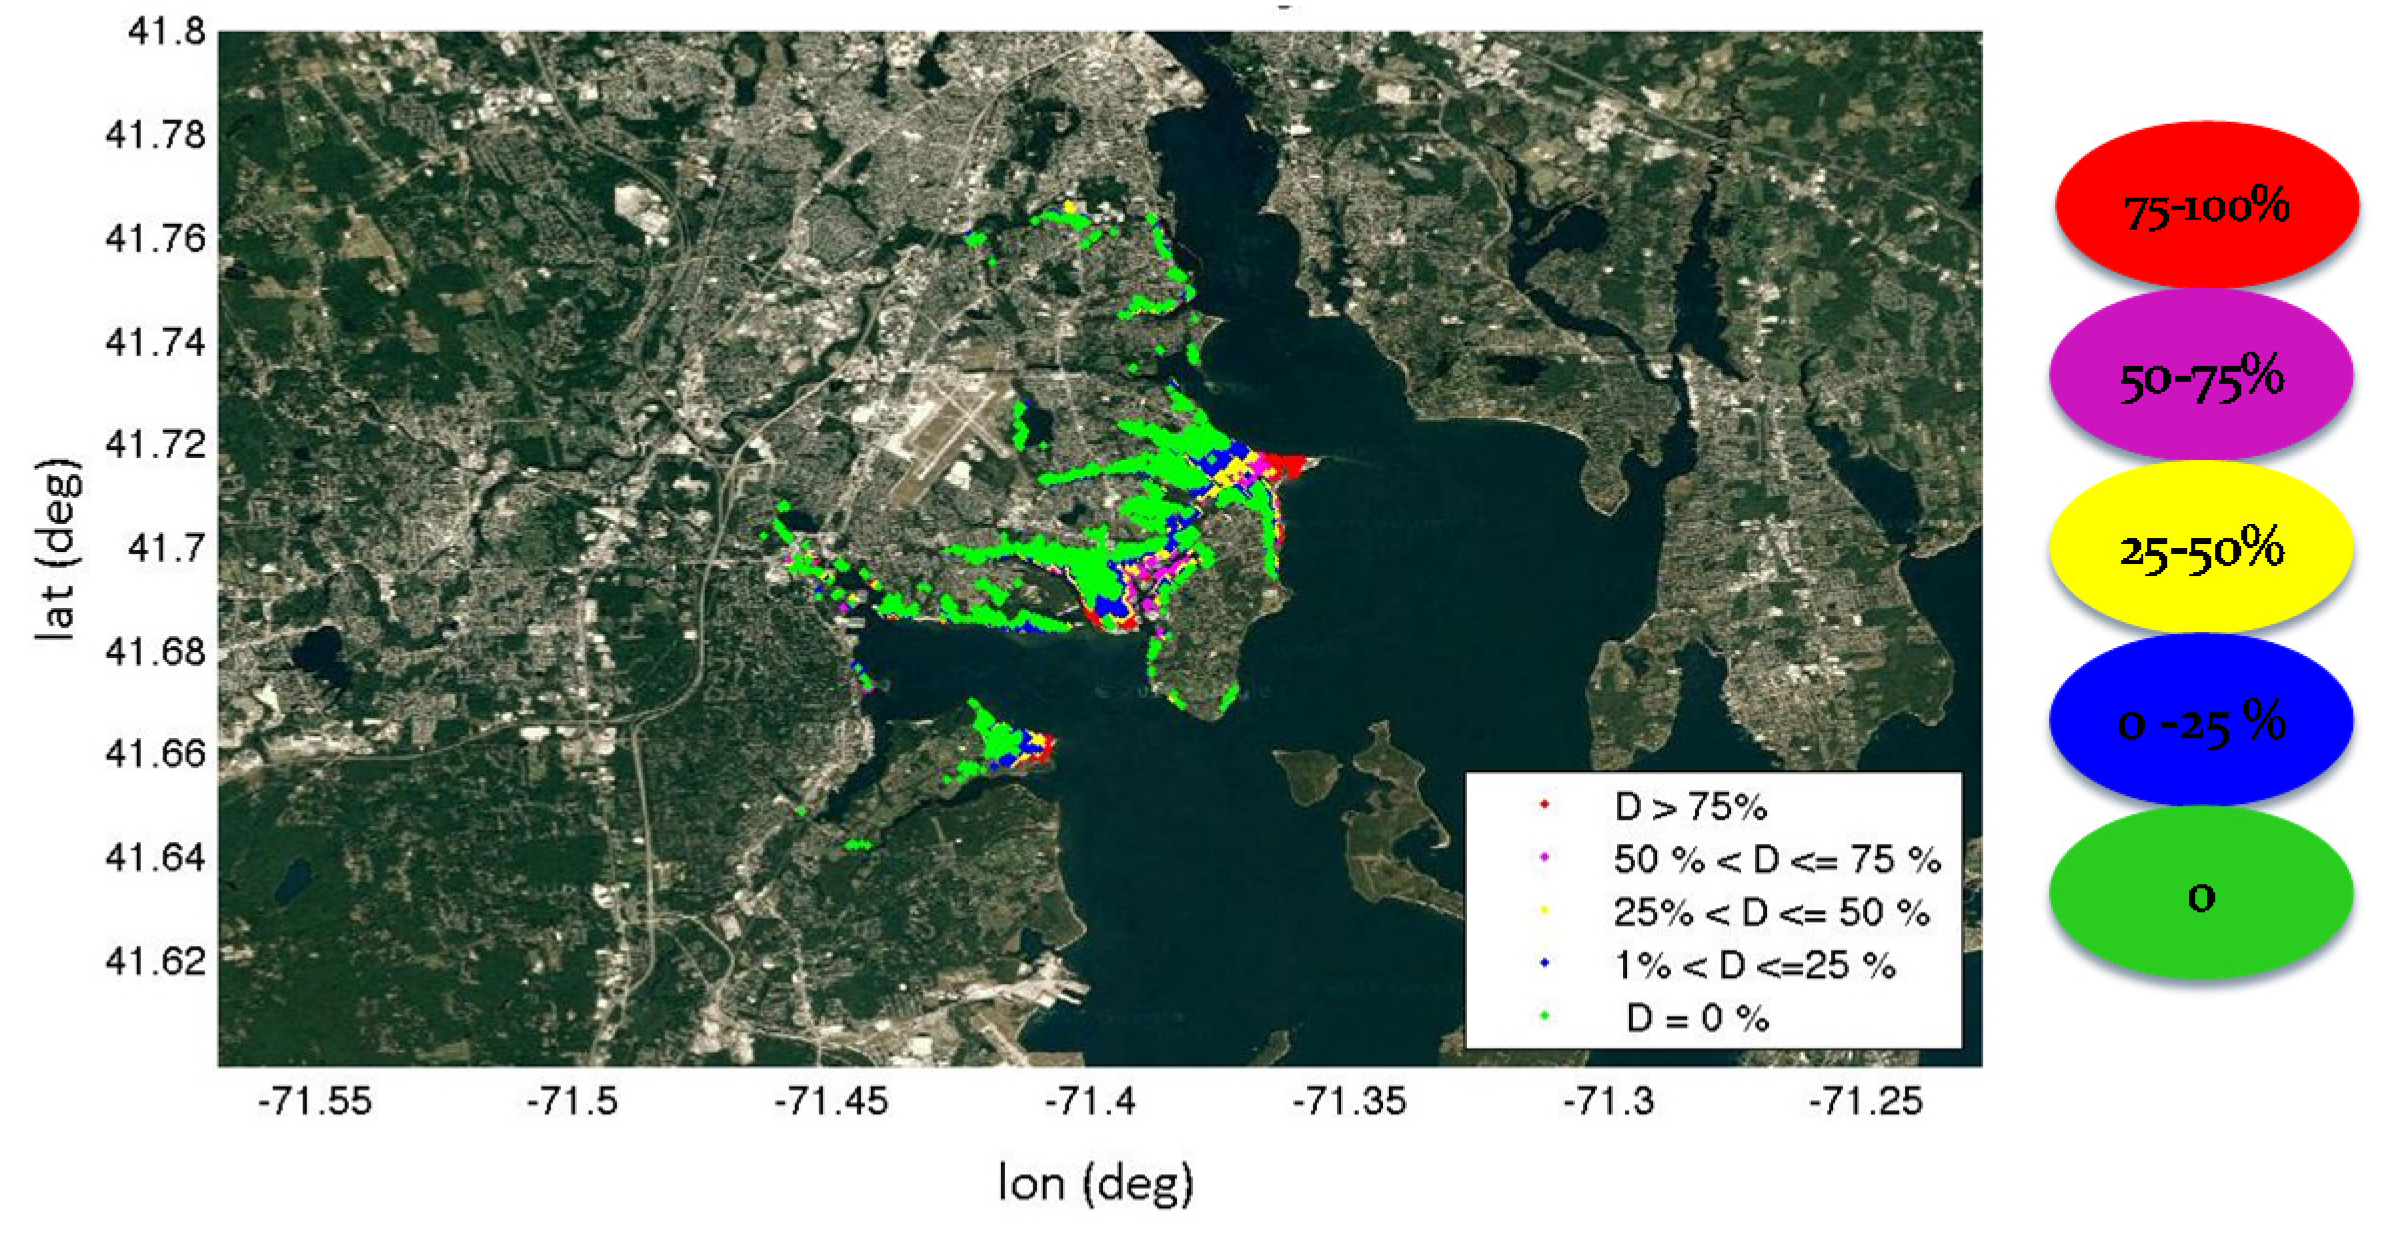
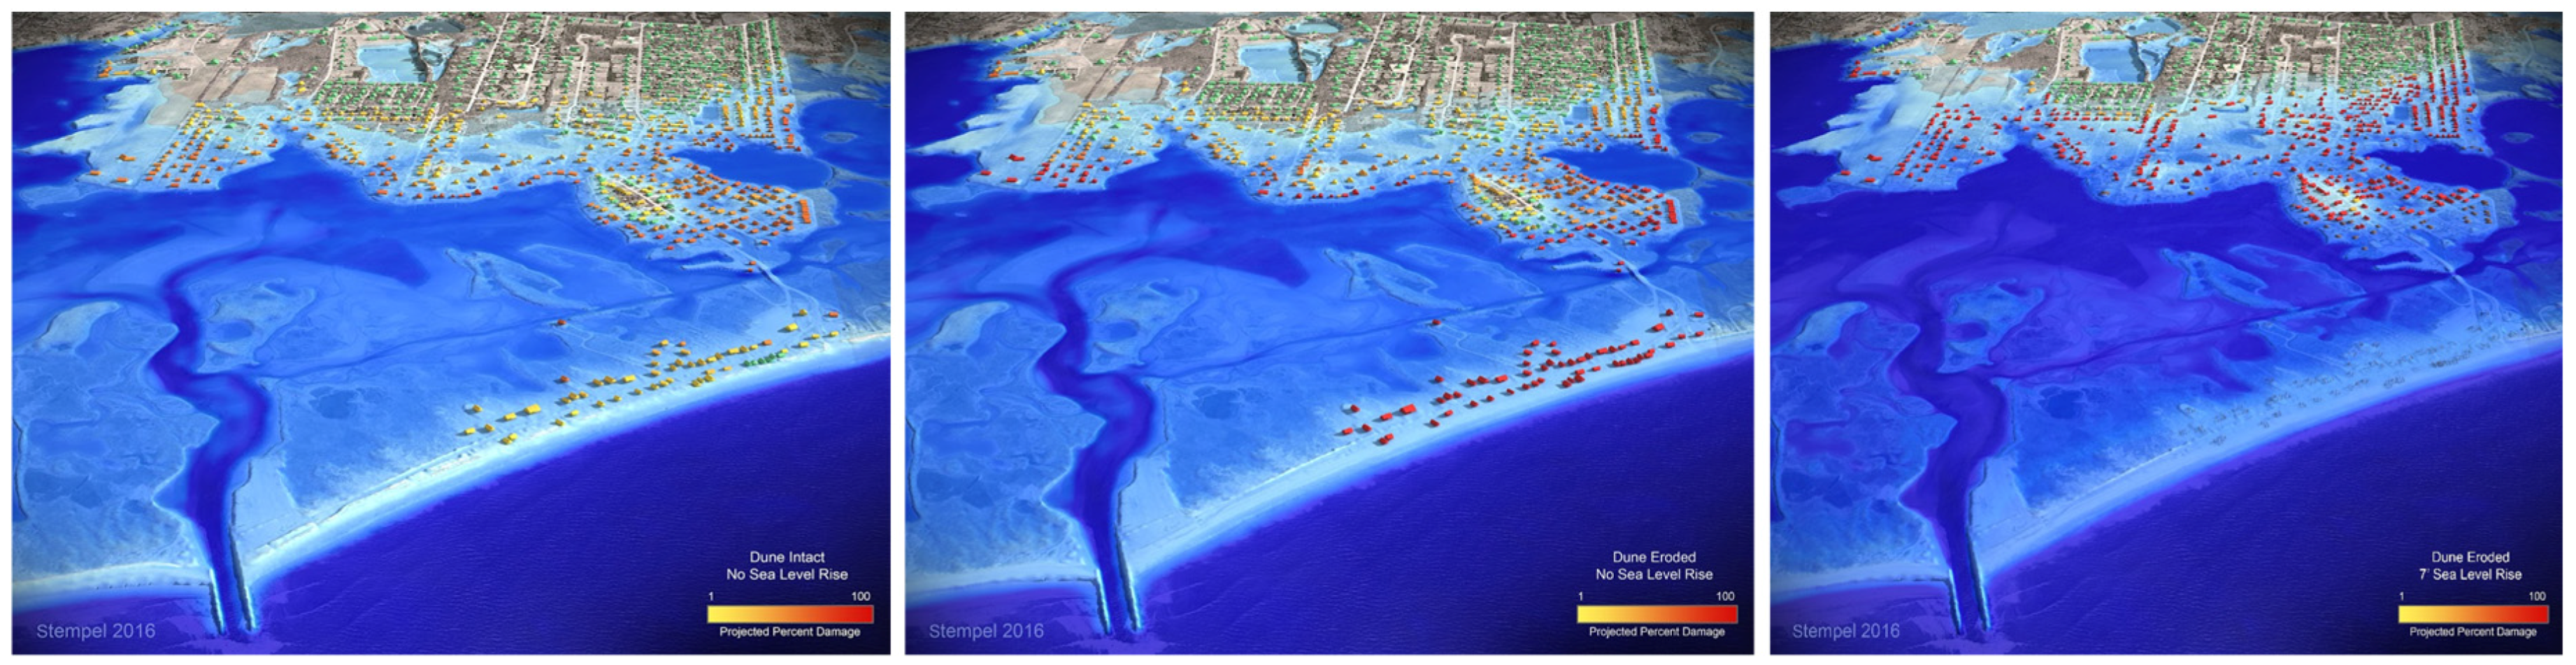
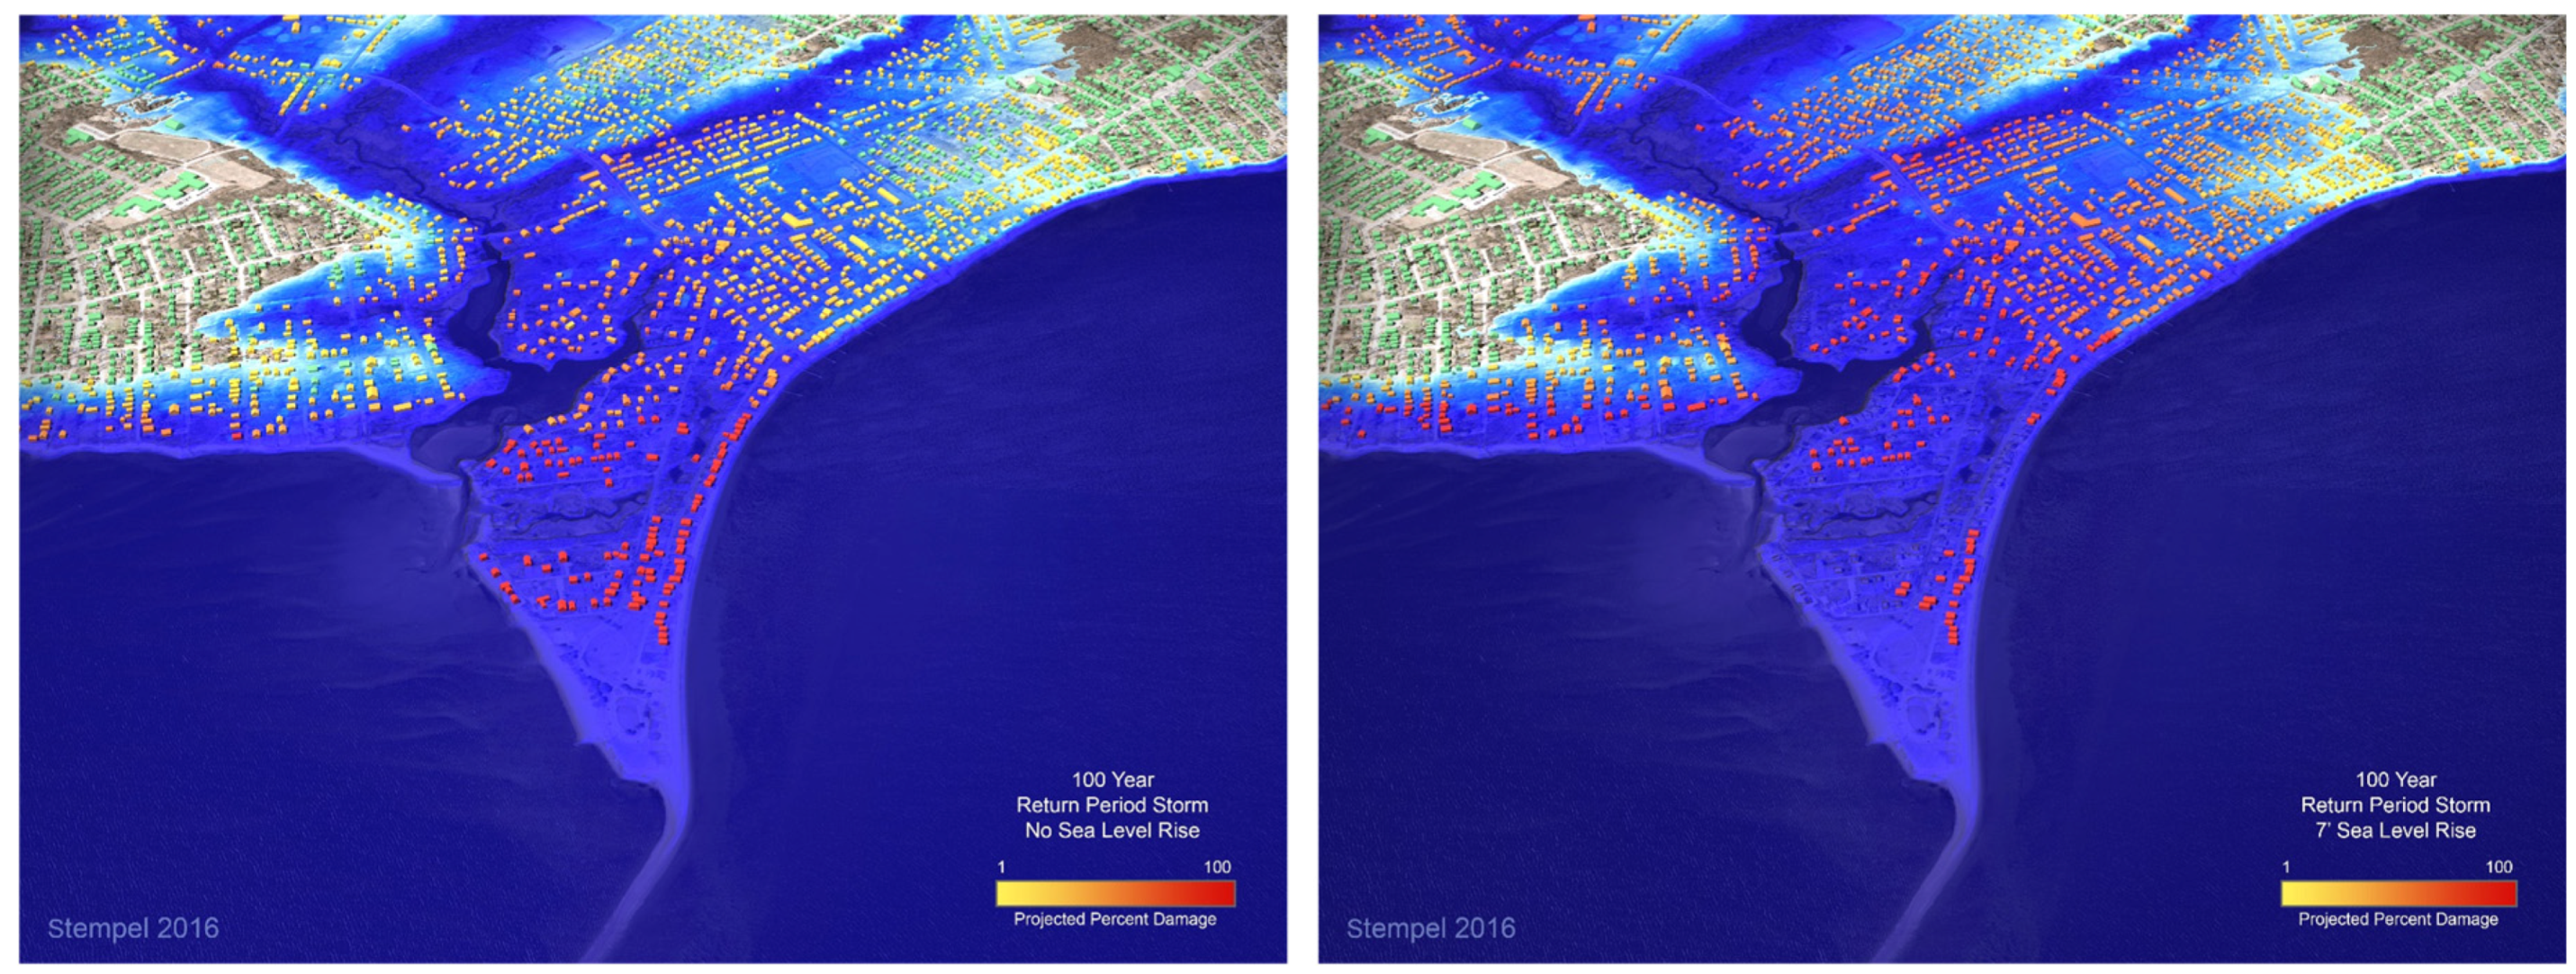
3.4. Visualizations of Damages

To assist in presenting the results to coastal and municipal managers and the general public, three dimensional visualizations of CERI predictions are shown in Figure 22 for a portion of the Charlestown, RI study area, as a case example. The barrier shoreline is located to the south with the inlet to Ninigret Pond clearly seen to the southwest. Immediately inland of the pond is a residential area. The figure shows damage by percent for each individual structure: upper panel for 100 year flooding with dune intact, center panel with 100 year flooding with dunes eroded, and the lower panel 100 year flooding with 2.1 m SLR and dune eroded. The rendering of each structure is driven by CERI outputs using custom scripts. These can be compared to the more conventional plan view maps shown in Figure 10 and Figure 12. The area impacted by 100 year event, with and without dune failure, are approximately the same but the damage levels are clearly seen to increase due to loss of protection by the dunes. This is most easily visualized along the barrier. With SLR the structures along the barrier completely disappear since they are below MSL or have been eliminated by coastal erosion. Structures on the northern side of the coastal pond have substantially increased damage relative to the 100 year dune eroded case.
Figure 23 shows 3d visualization of the percent damage to structures for Warwick, RI for the 100 year event (left panel) and the 100 year event plus 2.1 m ( 7 feet ) of sea level rise (right panel). There is no projection of erosion for this case since little of the shoreline inside the bay is subject to erosion. The view is from Conimicut Point looking toward the west. Once again the impact of sea level rise in causing additional damage to structures is clearly shown.

4. Conclusions

A Coastal Environmental Risk Index(CERI) has been designed and implemented using state of the art modeling tools (ADCIRC, STWAVE) [8] to predict storm inundation and associated wave environments for coastal areas at high spatial resolution. The method is objective and can quantify risk. It is based on the most recent damage assessment curves [5] and can be configured to address the effects of coastal erosion (shoreline erosion, dune failure) and sea level rise. The approach can be applied to user selected scenarios, from standard return period with specified SLR, to simulations for selected storm events. In addition to use as a planning and management tool, the approach can readily be used in both hindcast and forecast modes to assist in post storm damage assessments or provide predictions of expected damages from future storms. The damages can be viewed in terms of risk or converted to costs once the values of structures are specified. Damages to both structures (and content) and infrastructure can be performed with suitable damage curves. The approach is web accessible, scalable, GIS based, and simple to use. The modeling strategy can readily evaluate risks of proposed management and regulatory options. The framework is fully consistent with the design standards set by federal, state, and local regulatory agencies and authorities. CERI can be used to perform analyses for selected structures and hence is amenable for wide spread use to help managers, regulatory agencies, the public, and individuals clearly understand the risk for an individual structure.
The method was applied to two different coastal environments: Charlestown, RI representing a typical open shoreline community exposed to the coastal ocean and the other well inside Narragansett Bay: Warwick, RI. The former is subject to high surge and large waves and significant shoreline and dune erosion, while the latter is well protected from storm waves and has minimal erosion. Interestingly the storm water levels for the two sites are comparable at 4.7 m. Inundation levels along the southern RI coast are comprised of a storm surge level of 4.1 m plus a wave set up of approximately 0.7 m. The surge is amplified with distance up the bay given its semi-enclosed geometry [9] while wave set up is absent giving approximately the same total water level (4.7 m). Wave exposure at the two sites is comparable, this is attributed to the presence of the eroded dune providing partial protection to structures located along Charlestown Pond and a conservative value selected for wind forcing for the wave model application for Warwick.
Two story structures with basements dominate structures in the two study areas (65%) while single storm homes without basements are next most common in Charlestown (36%), for Warwick the second largest group is single story homes with basements (28%). The percent of elevated structures is much smaller in both areas, but larger in Charlestown (5%) compared to less than 0.5% in Warwick. The number of houses at risk is substantially larger in the more densely populated Warwick (2504) than in the Charlestown coastal area (1002). With 2.1 m of SLR the number of houses at risk increases to 5304 in Warwick compared to 1323 in Charlestown; double compared to the no SLR case for the former, but only 30% larger for the later. For Charlestown, approximately 450 structures will be eliminated due to SLR putting them below MSL (400) or by coastal erosion (50). This represents 34% of the total structures. In Warwick, 238 structures will be below MSL with 2.1 m of SLR; less than 5% of the total. None are estimated to be lost by shoreline erosion given the very low erosion rates.
For Charlestown 86.7% of the structures in the flooded area are projected to receive some damage if the dunes are intact. This increases to 96.3% if the dunes fail. The differences are more dramatic if the structures damaged above 50% are compared: 22.1% for intact dunes and 54% for eroded dunes. The highest damages are to structures with basements and the lowest to pile supported structures provided they are sufficiently elevated. With 2.1 m SLR and coastal erosion the percent of structures damaged increases to 96.6%, while those with damage greater than 50% increases to 73.8%. It is noted that the total number of structures damaged has been reduced given the number lost due to MSL and coastal erosion. Once again the highest percent damage is to structures with basements. Pile supported structures end up being removed due to coastal erosion.
In Warwick, 97.2% of the structures in the flooded area are predicted to receive damage. For damage above 50% the percent decreases to 20.2%. The highest damages are to structures with basements. Pile supported structures have significant damage as well given their relatively low FFEs. With SLR of 2.1 m, 96.6% of the structures are damaged, with 43.3% of the total with damages greater than 50%. This is greater than double the case for no SLR. It is important to note that the number of structures impacted increases substantially from 2435 to 4892, almost doubling.
CERI has many potential uses for coastal managers, the most obvious is to predict where the vulnerable segments of developed shorelines are to storm damage and target those for adaptation. Also, by using sea level rise estimates, coupled with surge and wave modeling, allows managers to see potential future damage areas. By using time dependent sea level rise curves this gives the manager a sense of how urgent it is to address future damage zones. These are just a few of the many uses for CERI for coastal managers, but this tool also has a multitude of applications for the private market users in addition. For example, banks could use this tool to estimate exposure for loan holdings or as a decision point whether to grant a loan due to the potential loss of the collateralized asset. This tool is a significant advancement for the management community for evaluating and responding to potential damage of structures from sea level rise, surge and waves, and erosion. For this reason, it will likely prove to be an important asset for evaluating the impacts for climate change in coastal areas and an essential tool in guiding coastal adaptation efforts.

Acknowledgments

The development and application of CERI to Charlestown and Warwick, RI was supported by Housing and Urban Development (HUD), Grant #B-13-DS-44-0001, Hurricane Sandy CDBG Disaster Recovery—CFDA #14.269 and administered through the State of Rhode Island, Executive Office of Commerce, Office of Housing and Community Development (OHCD).

Author Contributions

Malcolm L. Spaulding developed the idea for STORMTOOLS and CERI and led the project effort. Annette Grilli was primarily responsible for wave modeling and developing the inundation and wave damage calculator. Implementation in GIS, provision of structure type and first finished floor elevation, and providing access of CERI output to the community was provided by Chris Damon. Teresa Crean led the outreach effort and Grover Fugate advised on the design of the system to meet needs of coastal planners. Bryan Oakley was responsible for estimating erosion rates and the eroded dune profiles for Charlestown. Visualization (3d) of the results was provided by Peter Stempel.

Conflicts of Interest

The authors declare no conflict of interest in performing the study. The project sponsors had no role in the design of the study; in the collection, analyses, or interpretation of data; in the writing of the manuscript, and in the decision to publish the result.

Acronyms

ACOE
Army Corp of Engineers
ADCIRC
ADvanced CIRCulation model
BFE
Base Flood Elevation
CERI
Coastal Environmental Risk Index
CRMC
RI Coastal Resources Management Council
DEM
Digital Elevation Model
FEMA
Federal Emergency Management Agency
HUD
Housing and Urban Development
LIDAR
Laser Imaging, Detection, and Ranging
NACCS
North Atlantic Comprehensive Coastal Study
NOAA
National Oceanic and Atmospheric Administration
OHCD
Office of Housing and Community Development
SAMP
Special Area Management Plan
SLOSH
Sea, Lake, and Overland Surges from Hurricanes
SLR
Sea Level Rise
STWAVE
STeady state spectral WAVE model
STORMTOOLS
tools in support of storm analysis
SWAN
Simulating Waves Nearshore
SWEL
Still Water Elevation

Appendix A

Supplemental figures for flooding and damages.
Figure A1. RI study area with locations of Charlestown and Warwick, RI highlighted. Background of map is 100 year flooding with no SLR.
Jmse 04 00054 g024
Figure A2. Existing and eroded cross shore profiles for the dunes at Quonochontaug and Charlestown. For eroded profile: dune toe to dune crest (1.6 m NAVD88), foreshore slope: 11%, and landward slope: 0.3% (300 m from crest) representing over-wash fan, after 300 m, reverts to existing bathymetry.
Jmse 04 00054 g025
Figure A3. Total water depth (m) (inundation plus controlling wave height) for Charlestown, RI, 100 year event, plus 2.1 m (7 feet) of SLR, dune eroded.
Jmse 04 00054 g026
Figure A4. Percent damage by structure for Charlestown, RI for 100 year storm plus 2.1 m (7 feet) SLR, dunes eroded. Structures that are below MSL are noted by white dots and those removed by erosion are given by black dots. Progressively higher resolution maps of results (upper and lower panels). Individual structure IDs are noted at the highest resolution (lower panel). The yellow circle in the upper panel shows the location of the higher resolution area in the lower panel.
Jmse 04 00054 g027
Figure A5. Structure removed because they are lower the MSL with SLR of 2.1 m (7 feet) with dunes eroded (upper panel, white dots). Structures removed because of loss by erosion projected to 2100 using exponential high assumption (lower panel, black dots).
Jmse 04 00054 g028
Figure A6. Total water depth (m) (inundation plus controlling wave height) for Warwick, RI, 100 year event, plus 2.1 m (7 feet) of SLR.
Jmse 04 00054 g029
Figure A7. Percent damage by structure for Warwick, RI for 100 year storm plus 2.1 m (7 feet) SLR. Structures that are below MSL are noted by white dots and those removed by erosion are given by black dots. Progressively higher resolution maps of results (upper and lower panels). Individual structure IDs are noted at the highest resolution (lower panel). The yellow circle in the upper panel shows the location of the higher resolution area in the lower panel.
Jmse 04 00054 g030
Figure A8. Structures located below MSL (white dots) with 2.1 m (7 feet) of SLR for Warwick, RI.
Jmse 04 00054 g031

References

  1. Jelesnianski, C.P.; Chen, J.; Shaffer, W.A. SLOSH: Sea, Lake, and Overland Surges from Hurricanes; NOAA Technical Report; US Department of Commerce, National Oceanic and Atmospheric Administration: Silver Spring, MD, USA, 1992; p. 71.
  2. Hammar-Klose, E.S.; Pendleton, E.A.; Thieler, E.R.; Williams, S.J. Coastal Vulnerability Assessment of Cape Cod National Seashore (CACO) to Sea-Level Rise. Available online: http://pubs.usgs.gov/of/2002/of02-233/USGS (accessed on 24 August 2016).
  3. Hapke, C.J.; Himmelstoss, E.A.; Kratzmann, M.G.; List, J.H.; Thieler, E.R. National Assessment of Shoreline Change: Historical Shoreline Change along the New England and Mid-Atlantic Coasts; US Geological Survey: Woods Hole, MA, USA, 2011.
  4. Federal Emergency Management Agency (FEMA). Atlantic Ocean and Gulf of Mexico Coastal Guidelines Update (FEMA, 2007). Available online: http://www.fema.gov/media-library-data/1388780453134-c5e577ea3d1da878b40e20b776804736/Atlantic+Ocean+and+Gulf+of+Mexico+Coastal+Guidelines+Update+(Feb+2007).pdf (accessed 24 August 2016).
  5. North Atlantic Coast Comprehensive Study: Resilient Adaptation to Increasing Risk. Available online: http://www.nad.usace.army.mil/Portals/40/docs/NACCS/10A_PhysicalDepthDmgFxSummary_26Jan2015.pdf (accessed on 24 August 2016).
  6. Federal Emergency Management Agency. HAZUS®MH MR3 Flood Model Technical Manual. Available online: https://www.fema.gov/media-library/assets/documents/12331 (accessed on 23 August 2016).
  7. Small, C.; Blanpied, T.; Kauffman, A.; O’Neil, C.; Proulx, N.; Rajacich, M.; Simpson, H.; White, J.; Baxter, C.; Spaulding, M.L.; et al. Assessment of damage from storm surge and sea level rise along Matunuck Beach Road and surrounding communities. J. Mar. Sci. Eng. 2016. in review. [Google Scholar]
  8. Cialone, M.A.; Massey, T.C.; Anderson, M.E.; Grzegorzewski, A.S.; Jensen, R.E.; Cialone, A.; Mark, D.J.; Pevey, K.C.; Gunkel, B.L.; McAlpin, T.O.; et al. North Atlantic Coast Comprehensive Study (NACCS) Coastal Storm Model Simulations: Waves and Water Levels. Available online: http://acwc.sdp.sirsi.net/client/enUS/search/asset/1045666 (accessed 24 August 2016).
  9. Spaulding, M.L.; Isaji, T.; Damon, C.; Fugate, G. Application of STORMTOOLS’s Simplified Flood Inundation Model, with and without Sea Level Rise, to RI Coastal Waters. In Proceedings of the ASCE Solutions to Coastal Disasters Conference, Boston, MA, USA, September 2015.
  10. Massey, T.C.; Anderson, M.E.; McKee-Smith, J.; Gomez, J.; Rusty, J. STWAVE: Steady-State Spectral Wave Model User’s Manual for STWAVE, Version 6.0; Environmental Research and Development Center, US Army Corp of Engineers: Vicksburg, MS, USA, 2011. [Google Scholar]
  11. Smith, J.M.; Sherlock, A.R.; Resio, D.T. STWAVE: Steady-State Spectral Wave Model, User’s Guide for STWAVE, Version 3.0; ERDC/CHL SR-01-01; U.S. Army Engineer Research and Development Center: Vicksburg, MS, USA; Available online: http://chl.wes.army.mil/research/wave/wavesprg/numeric/wtransformation/downld/erdc-chl-sr-01-11.pdf (accessed 24 August 2016).
  12. Oakley, B.A. Generalized 1% Storm Barrier Profile for the East Beach and Quonochontaug Barriers, Rhode Island; Technical Report Prepared for the Shoreline Change Special Area Management Plan (SAMP); University of Rhode Island: Narragansett, RI, USA, 2016. [Google Scholar]
  13. Boothroyd, J.C.; Hollis, R.J.; Oakley, B.A.; Henderson, R.E. Shoreline Change from 1939–2014, Washington County, Rhode Island; 1:2,000 scale. Rhode Island Geological Survey, 45 maps; University of Rhode Island: Narragansett, RI, USA, 2016. [Google Scholar]
Figure 1. Flowchart of Coastal Environmental Risk Index (CERI) system.
Jmse 04 00054 g001
Figure 2. ACOE NACCS [5] damage curves for structure and content for inundation and waves for Prototype 5A, single story building without basement. Minimum, most likely, and maximum curves are provided for each. All plots are percent damage vs. elevation relative to finished floor elevation (FFE).
Jmse 04 00054 g002
Figure 3. ACOE NACCS [5] structure damage curves for inundation for Prototypes 5A, 6B, and 7A. Minimum, most likely, and maximum curves are provided for each. All plots are percent damage vs. elevation relative to FFE.
Jmse 04 00054 g003
Figure 4. ACOE NACCS [5] structure damage curves for inundation for Prototypes 5A, 6B, and 7A. Minimum, most likely, and maximum curves are provided for each. All plots are percent damage vs. elevation relative to FFE. FEMA definition schematic (lower panel) for flooding and structures located on grade and elevated. The still water elevation (SWEL) for 1% annual chance (100 year) is shown in the dashed red line and the Base Flood Elevation (BFE) in the blue dotted line.
Jmse 04 00054 g004
Figure 5. Inundation depths (m) relative to grade for Charlestown, RI for 100 year event.
Jmse 04 00054 g005
Figure 6. Controlling wave height (m) for Charlestown, RI, 100 year event, dune intact.
Jmse 04 00054 g006
Figure 7. Total water depth (m) (inundation plus controlling wave height) for Charlestown, RI, 100 year event, dune intact.
Jmse 04 00054 g007
Figure 8. Total water depth (m) (inundation plus controlling wave height) for Charlestown, RI, 100 year event, dune eroded.
Jmse 04 00054 g008
Figure 9. Location and type of structures for the Charlestown, RI study area (upper panel). The lower panel shows the ability to resolve at the structure by structure level.
Jmse 04 00054 g009
Figure 10. Percent damage by structure for Charlestown, RI for 100 year storm, dune intact (upper panel) and dune eroded (lower panel). The color legend for the percent damage is shown to the right of the figure and also included on the lower right corner of the figure.
Jmse 04 00054 g010
Figure 11. Cumulative structure and content damage curves for Charlestown, RI, 100 year, dunes intact (top panel) and dunes eroded (lower panel). Content damage (C) is shown by the dashed lines and structural damage (S) by the solid lines. Results are shown for the minimum, most likely, and maximum damage function curves [5].
Jmse 04 00054 g011
Figure 12. Percent damage by structure for Charlestown, RI for 100 year storm plus 2.1 m (7 ft) sea level rise (SLR), dunes eroded. Structures that are eliminated because they are below mean sea level (MSL) are noted by white dots and those removed by erosion are given by black dots. (See Figure A5 for higher resolution of these two categories).
Jmse 04 00054 g012
Figure 13. Inundation depths (m) relative to grade for Warwick, RI for 100 year event.
Jmse 04 00054 g013
Figure 14. Controlling wave height (m) for Warwick, RI, 100 year event.
Jmse 04 00054 g014
Figure 15. Total water depth (m) (inundation plus controlling wave height) for Warwick, RI, 100 year event.
Jmse 04 00054 g015
Figure 16. Location and type of structures for the Warwick, RI study area (upper panel). The lower panel shows the ability to resolve at the structure by structure level.
Jmse 04 00054 g016
Figure 17. Percent damage by structure for Warwick, RI for 100 year event.
Jmse 04 00054 g017
Figure 18. Cumulative structure and content damage curves for Warwick, RI, 100 year. Content damage (C) is shown by the dashed lines and structural damage(S) by the solid lines. Results are shown for the minimum, most likely, and maximum damage function curves.
Jmse 04 00054 g018
Figure 19. Percent damage by structure for Warwick, RI for 100 year event plus 2.1 m (7 ft) SLR. Structures that are below MSL are noted by white dots and those removed by erosion are given by black dots.
Jmse 04 00054 g019
Figure 20. Input on structure (number, location (latitude/longitude), prototype, and FFE), total water level (relative to FFE), and structure and content damage (minimum, most likely, and maximum) by structure.
Jmse 04 00054 g020
Figure 21. Input on structure (number, location (latitude/longitude), prototype (all assumed 7A with elevations of 2.7 m, and FFE), total water level (relative to FFE), and structure and content damage (minimum, most likely, and maximum) by structure.
Jmse 04 00054 g021
Figure 22. Three dimensional (3d) visualization of the percent damage to structures for Charlestown, RI: 100 year dunes intact (upper panel), 100 year dunes eroded (center panel), and 100 year dunes eroded, with 2.1 m (7 feet) SLR and shoreline erosion (lower panel). The lower panel projects coastal erosion to 2100.
Jmse 04 00054 g022
Figure 23. Three dimensional (3d) visualization of the percent damage to structures for Warwick, RI: 100 year (left panel) and 100 year with 2.1 m (7 feet) SLR (right panel).
Jmse 04 00054 g023
Table 1. ACOE NACCS (2015) [5] damage function prototype definition.
NumberDescription
1A-1One Story Apartment-No Basement
1A-3Three Story Apartment-No Basement
1B-1One Story Apartment-With Basement
1B-3Three Story Apartment-With Basement
2Commercial-Engineered
3Commercial-Pre-non Engineered
4AUrban High Rise
4BBeach High Rise
5ASingle Story Residence, No Basement
5BTwo Story Residence, No Basement
6ASingle Story Residence, With Basement
6BTwo Story Residence, With Basement
7ABuilding with Open Pile Foundation
7BBuilding with Enclosed Pile Foundation
Table 2. Number of structures total and damaged for Charlestown, RI study area for various scenarios.
Most Likely Damage Curves
StructureNumber houses in SLR0 zoneNumber houses in SLR7(2.1m) zonePercent of total houses-SLR0 zonePercent of total houses 2016-SLR7(2.1m) zonePercent of total houses 2100-SLR7(2.1m) zone
PrototypeDescription Prototype
5A1 story/no basement24429024.433.121.9
6B2 story/basement68258568.166.944.2
7AOpen piles3603.60.00.0
7BEnclosed piles4004.00.00.0
Total structures1002875100.0100.066.1
Total structures eroded by SLR493.7
Total structures under MSL39930.2
Total structures, including eroded or under MSL in 21001323100.0
Table 3. Number of structures damaged for the Charlestown, RI study area for various scenarios. Damages are based on the most likely curve. Upper panel shows all structures damaged while lower panel shows structures that are more than 50% damaged.
Most Likely Damage Curves
100-year storm (2016) Dunes intact100-year storm (2016) Dunes failed100-yr storm 2100-2.1 m SLR-Dunes failed
PrototypeDescription PrototypeNumber% of houseNumber% of houseNumber% of house
5A1 story/no basement18977.520784.827293.8
6B2 story/basement61890.6682100.057397.9
7AOpen piles2775.036100.000.0
7BEnclosed piles3587.540100.000.0
Total structures86986.796596.384596.6
Total number of structures damaged greater than 50%
100-year storm (2016) Dunes intact100-year storm (2016) Dunes failed100-year storm 2100-2.1 m SLR-Dunes failed
PrototypeDescription PrototypeNumber% of houseNumber% of houseNumber% of house
5A1 story/no basement177.08334.020069.0
6B2 story/basement20429.938256.044676.2
7AOpen piles00.036100.000.0
7BEnclosed piles00.040100.000.0
Total structures22122.154154.064673.8
Table 4. Number of structures total and damaged for Warwick, RI study area for various scenarios.
Most Likely Damage Curve
StructureNumber house SLR0 zoneNumber houses in SLR7 zonePercent of total houses-SLR0 zonePercent of total houses-SLR7 zonePercent of total houses 2016-SLR7 zone
PrototypeDescription Prototype
5B1 story/basement754187930.137.135.4
6B2 story/basement1730318069.162.860.0
7AOpen piles420.20.00.0
7BEnclosed piles1650.60.10.1
Total25045066100.0100.095.5
Total structure under MSL2384.5
Total structures, including eroded or under MSL in 21005304100.0
Table 5. Number of structures total and damaged for Warwick, RI study area for various scenarios. Damages are based on the most likely curve. Upper panel shows all structures damaged while lower panel shows structures that are more than 50% damaged.
Most Likely Damage Curves
Total Number of Structures Damaged
100-year storm (2016)100-year storm 2100-2.1 m SLR
Structure
PrototypeDescription PrototypeNumber% of houseNumber% of house
5B1 story/basement68590.8177394.4
6B2 story/basement1730100.0311297.9
7AOpen piles4100.02100.0
7BEnclosed piles16100.05100.0
Total243597.2489296.6
Total Number of Structures Damaged Greater than 50%
100-year storm (2016)100-year storm 2100-2.1 m SLR
Structure
PrototypeDescription PrototypeNumber% of houseNumber% of house
5B1 story/basement8511.350526.9
6B2 story/basement40423.4168252.9
7AOpen piles375.02100.0
7BEnclosed piles1381.3360.0
Total50520.2219243.3

