Article

Natural and Human-Induced Dynamics on Big Hickory Island, Florida

by
Tiffany M. Roberts Briggs
1,* and
Nicole Elko
2
1
Department of Geosciences, Florida Atlantic University, 777 Glades Road, Boca Raton, FL 33431, USA
2
Elko Coastal Consulting, Inc., P.O. Box 1451, Folly Beach, SC 29439, USA
*
Author to whom correspondence should be addressed.
J. Mar. Sci. Eng. 2016, 4(1), 14; https://doi.org/10.3390/jmse4010014
Submission received: 30 December 2015 / Revised: 29 January 2016 / Accepted: 2 February 2016 / Published: 22 February 2016
(This article belongs to the Special Issue Coastal Morphodynamics)

Abstract

:
Big Hickory Island, located in Lee County along the mixed-energy west Florida coast, experiences high long-term rates of shoreline recession, with much of the erosion concentrated along the central and southern portions of the island. In 2013, approximately 86,300 cubic meters of sand from an adjacent tidal inlet to the north were placed along 457 m to restore the beach and dune system. In an effort to combat erosion, seven concrete king-pile groins with adjustable panels were constructed subsequent to the completion of the beach nourishment. Natural and human-induced dynamics of Big Hickory Island are discussed through analysis of shoreline and morphologic change using historic aerial photographs and topographic and bathymetric field surveys of the recent beach erosion mitigation project. Although much of the long-term anomalously high rates of erosion for the area are related to natural interchanges between the sand resources of the barrier islands and adjacent ebb tidal shoals, additional reduction in sand supply is a result of human-interventions updrift of Big Hickory over the last several decades. The coupled natural and anthropogenic influences are driving the coastal processes toward a different morphodynamic state than would have occurred under natural processes alone.

1. Introduction

Chronic erosion plagues many developed beachfront communities in the U.S. [1,2,3,4]. Maintaining some minimum dry-beach width is critical for storm protection and sustainability of coastal environments [5,6,7]. A number of engineering approaches have been used to counteract the effect of erosion by stabilizing or restoring beaches [8]. Recent studies have shown that the implementation of groins designed specifically to retain beach fill material or stabilize the shoreline have proven effective in reducing erosion and mitigating downdrift impacts [6,9,10,11,12]. Improved understanding of the influence of anthropogenic modifications on the morphodynamics of the coastal system [13,14,15] is critical as human impacts on these environments increase concomitantly with sea level and storminess [16,17].
Many communities have reduced long-term erosion rates with beach nourishment alone or nourishment combined with erosion control structures [16,18,19,20]. Recent coastal management challenges such as fewer sediment sources, higher dredging costs, and environmental impacts on nearby habitats constrain engineers to use less sand with more cost effective beach management projects [21]. For example, most communities offer public access making them eligible for public funding assistance. Privately held beaches are often not eligible for public funds, so a number of small, private U.S. communities are financing long-term beach erosion mitigation projects with minimal to no government assistance [22,23]. Cost-effectiveness is a primary goal in these projects. In addition, from an engineering/science perspective, the relatively small shoreline frontage resulting in short community-scale beach erosion mitigation projects (sometimes bordered by non-engineered beaches and influenced by nearby tidal inlets, as in this example) creates a shoreline planform in disequilibrium with adjacent beaches.
The Pelican Landing Community Association owns approximately 700 m of shoreline along Big Hickory Island, FL with the remaining shoreline frontage to the north and south owned by Lee County. Big Hickory Island is a short barrier island (<1,300 m long) in the Gulf of Mexico, bordered to the north by New Pass and to the south by Big Hickory Pass (Figure 1). North and south of Big Hickory Island are Lover’s Key and Little Hickory Island, respectively. Regional longshore sediment transport is north to south [24,25]. Big Hickory Island is subjected to large shoreline fluctuations due to its short length and closely spaced adjacent tidal inlets. As a result, the island has experienced chronic long-term erosion, ranging between 2.3 to 2.9 meters per year over the last century [25].
As a result of beach erosion that threatened community facilities (club house and beach pavilions), the Pelican Landing Beach Restoration and Groins Project (“beach erosion mitigation project”) was constructed along the central portion of the barrier island from May to October 2013. Approximately 86,300 cubic meters of sand from New Pass were placed between R-222.5 and R-224 in Lee County (Figure 1). This was followed by the construction of seven (7) concrete king-pile groins [26] with adjustable concrete panels that fit between concrete I-beam pilings (Figure 2). An advantage to king-pile groins is the ability to remove or add panels to control or tune the amount of sediment trapped by the structures. The groins are numbered 8 to 2 from north to south, shown as black shore-perpendicular lines on Figure 1.
The effect of the community’s decision to restore the beach using nourishment and erosion control structures is driving the island toward a different morphodynamic state than what was occurring under natural processes alone. These natural and human-induced dynamics are discussed through an analysis of shoreline and morphologic change using historic aerial photographs and recent topographic and bathymetric field surveys of the beach erosion mitigation project. Evaluation of the barrier island dynamics at multiple temporal scales is critical to elucidate both the near-term (decades to half-centuries) and short-term (events, seasons, years) patterns of morphologic change and the natural and anthropogenic drivers within the system [27,28]. It is important to understand and include the role of barrier island processes and inlet dynamics in the modeling, cost-benefit analysis, and design of similar beach preservation projects incorporating erosion control structures [3,8,29].
The objective of this paper is to evaluate the natural and human-induced dynamics of shoreline and morphologic change on Big Hickory Island in southwest Florida. Near-term changes (1944 through 2012) are analyzed using historic aerial photographs and short-term changes (2012 through 2015) using recent topographic and bathymetric field surveys.

2. Experimental Section

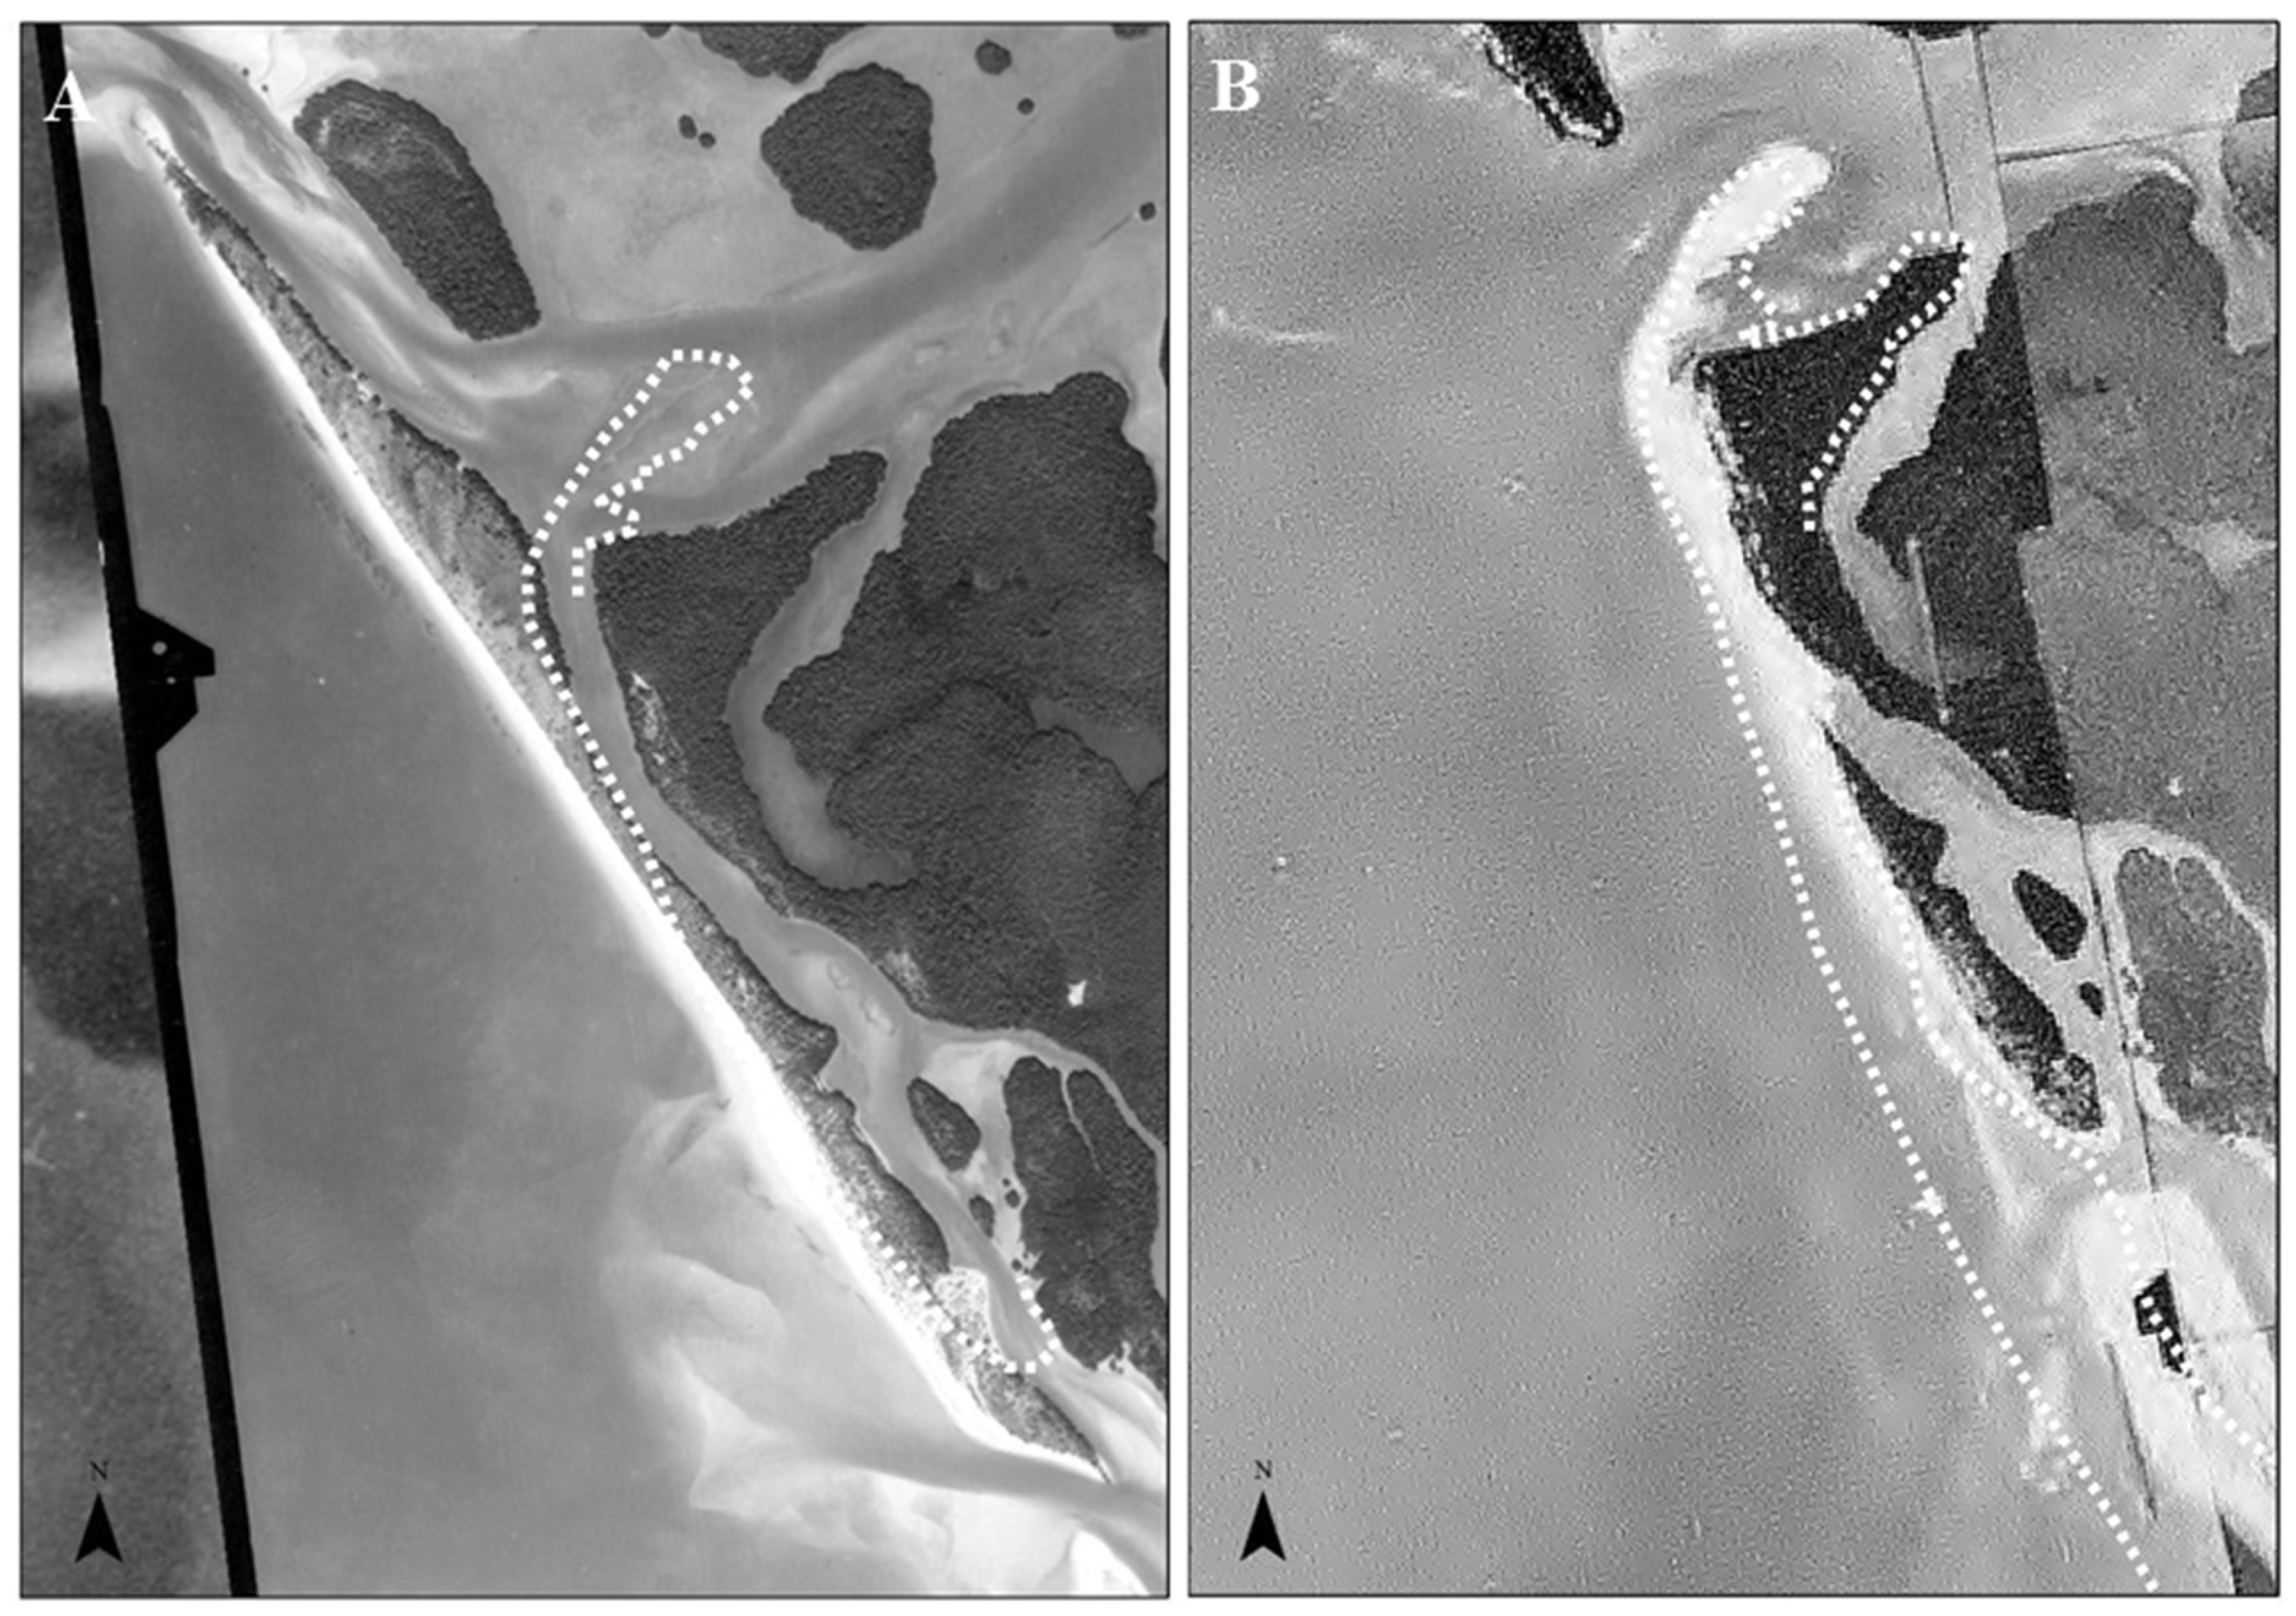
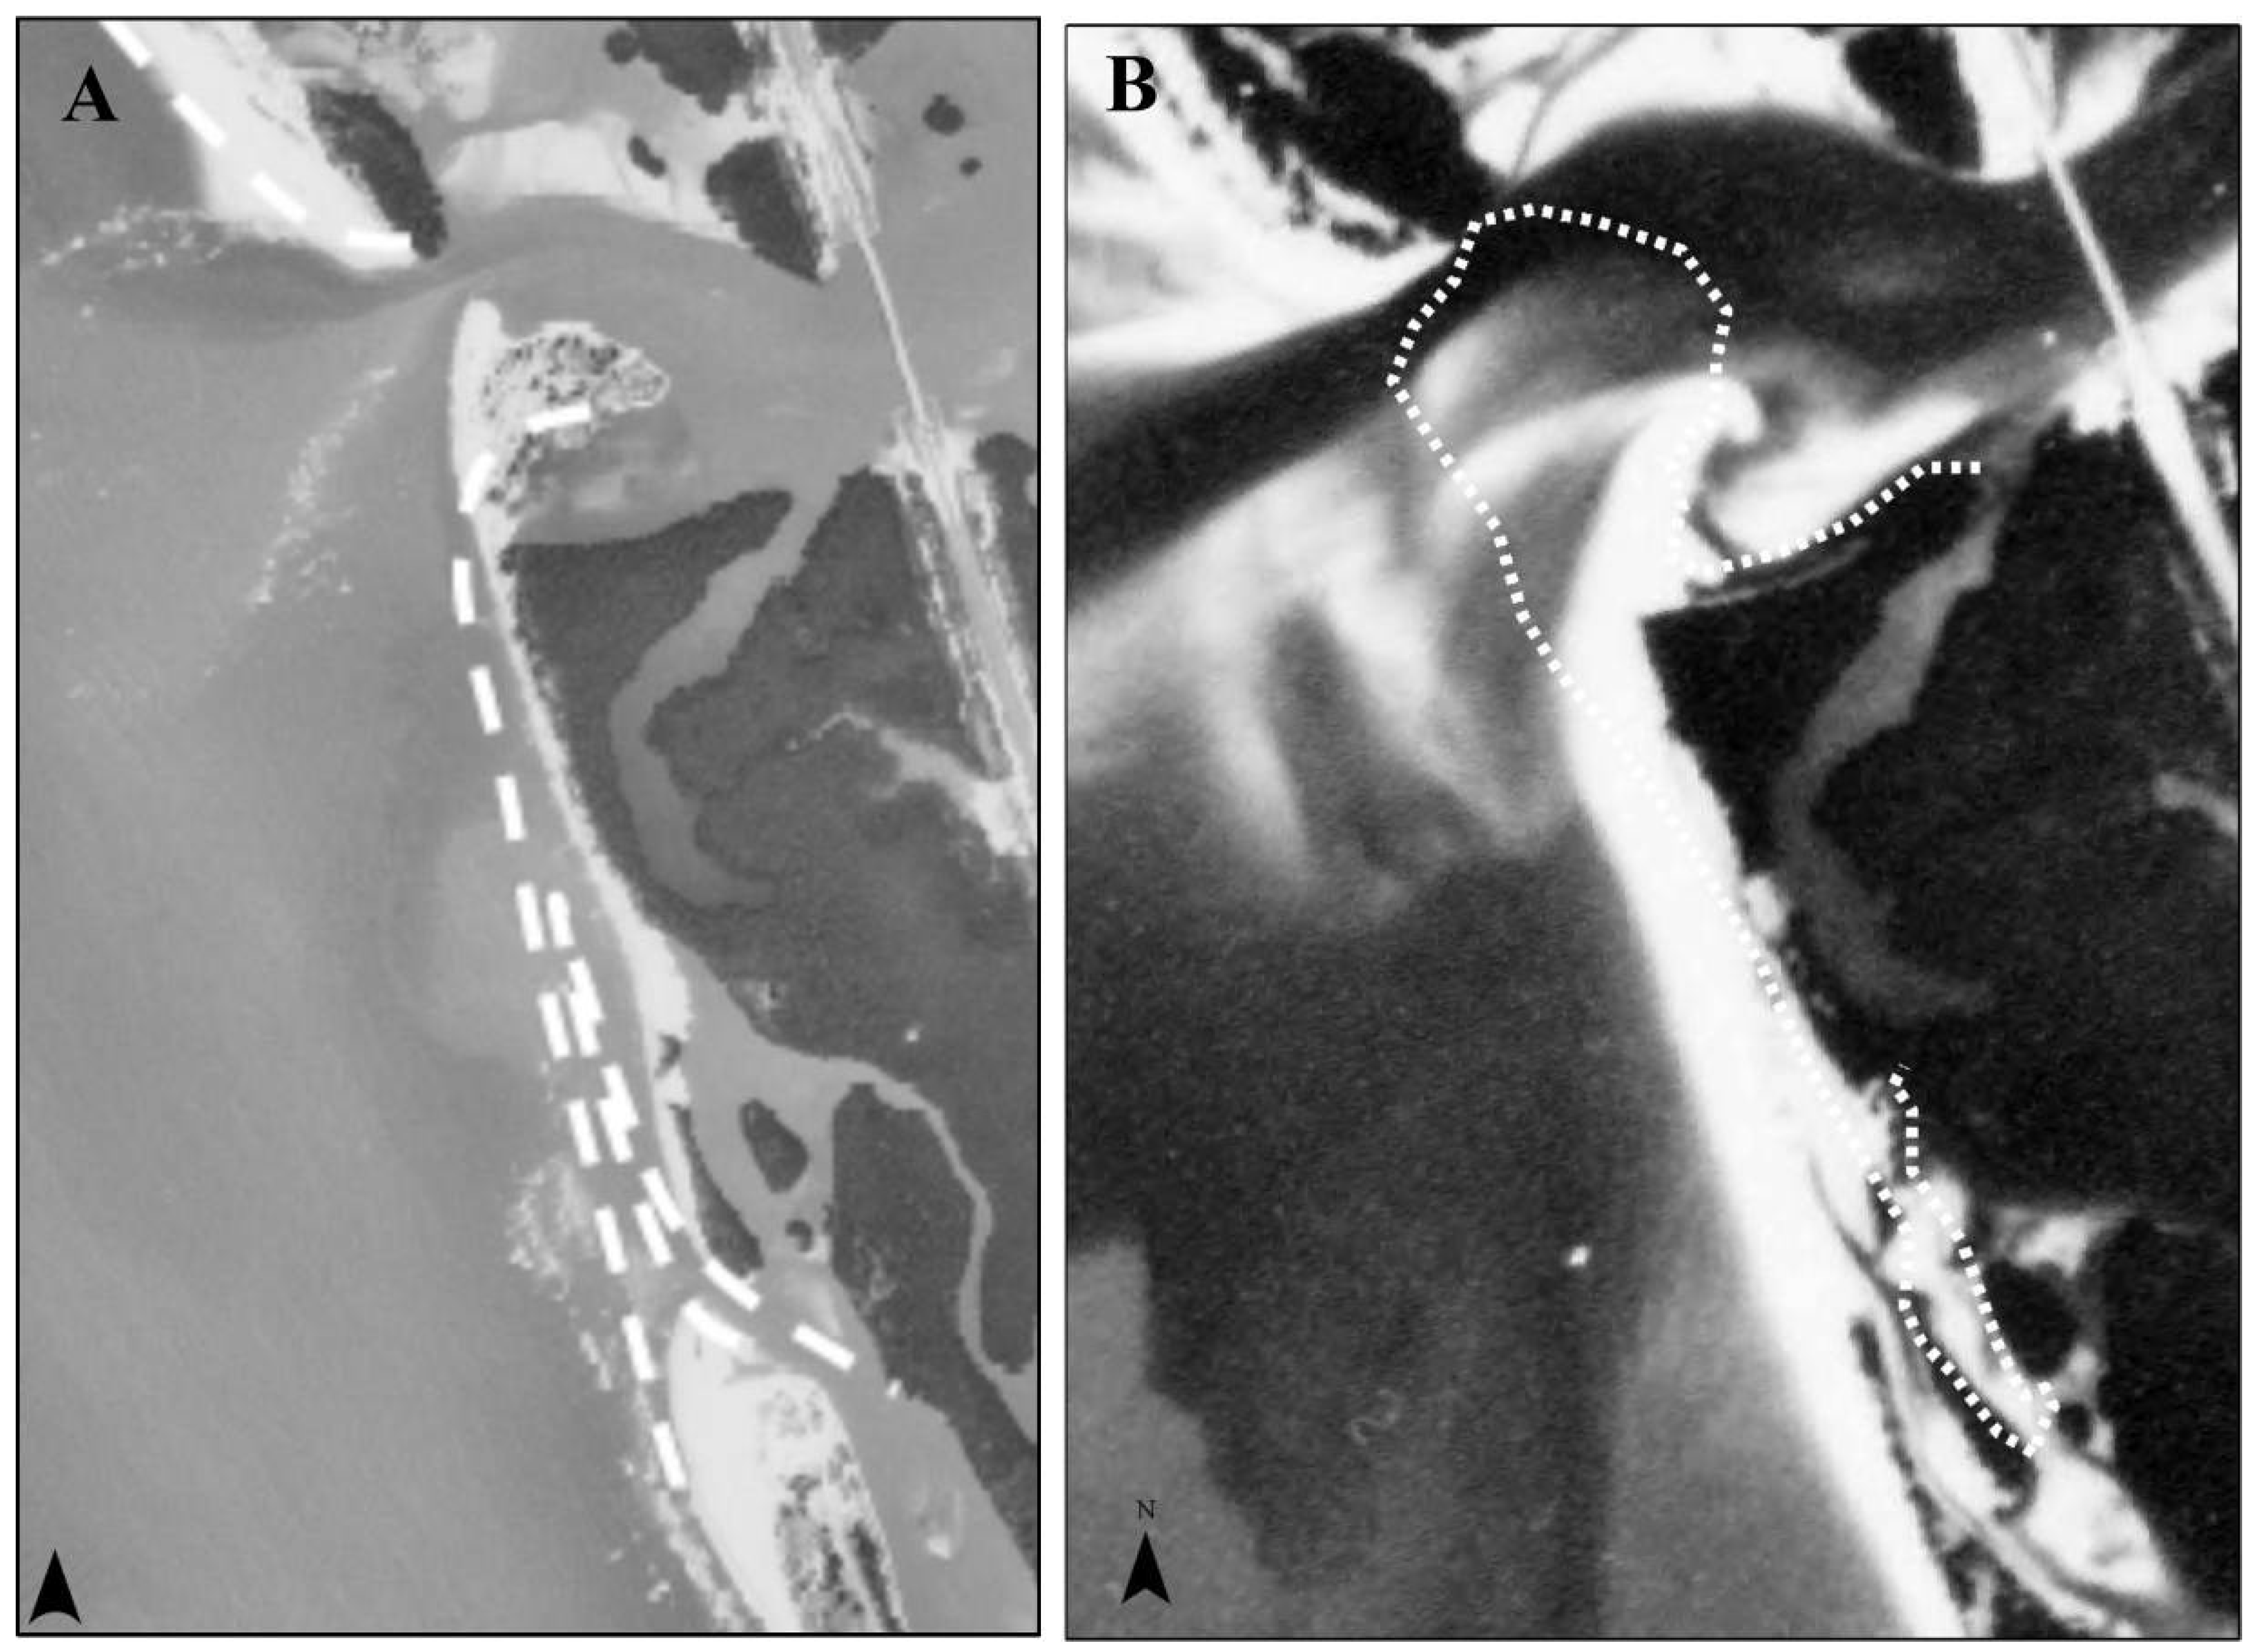
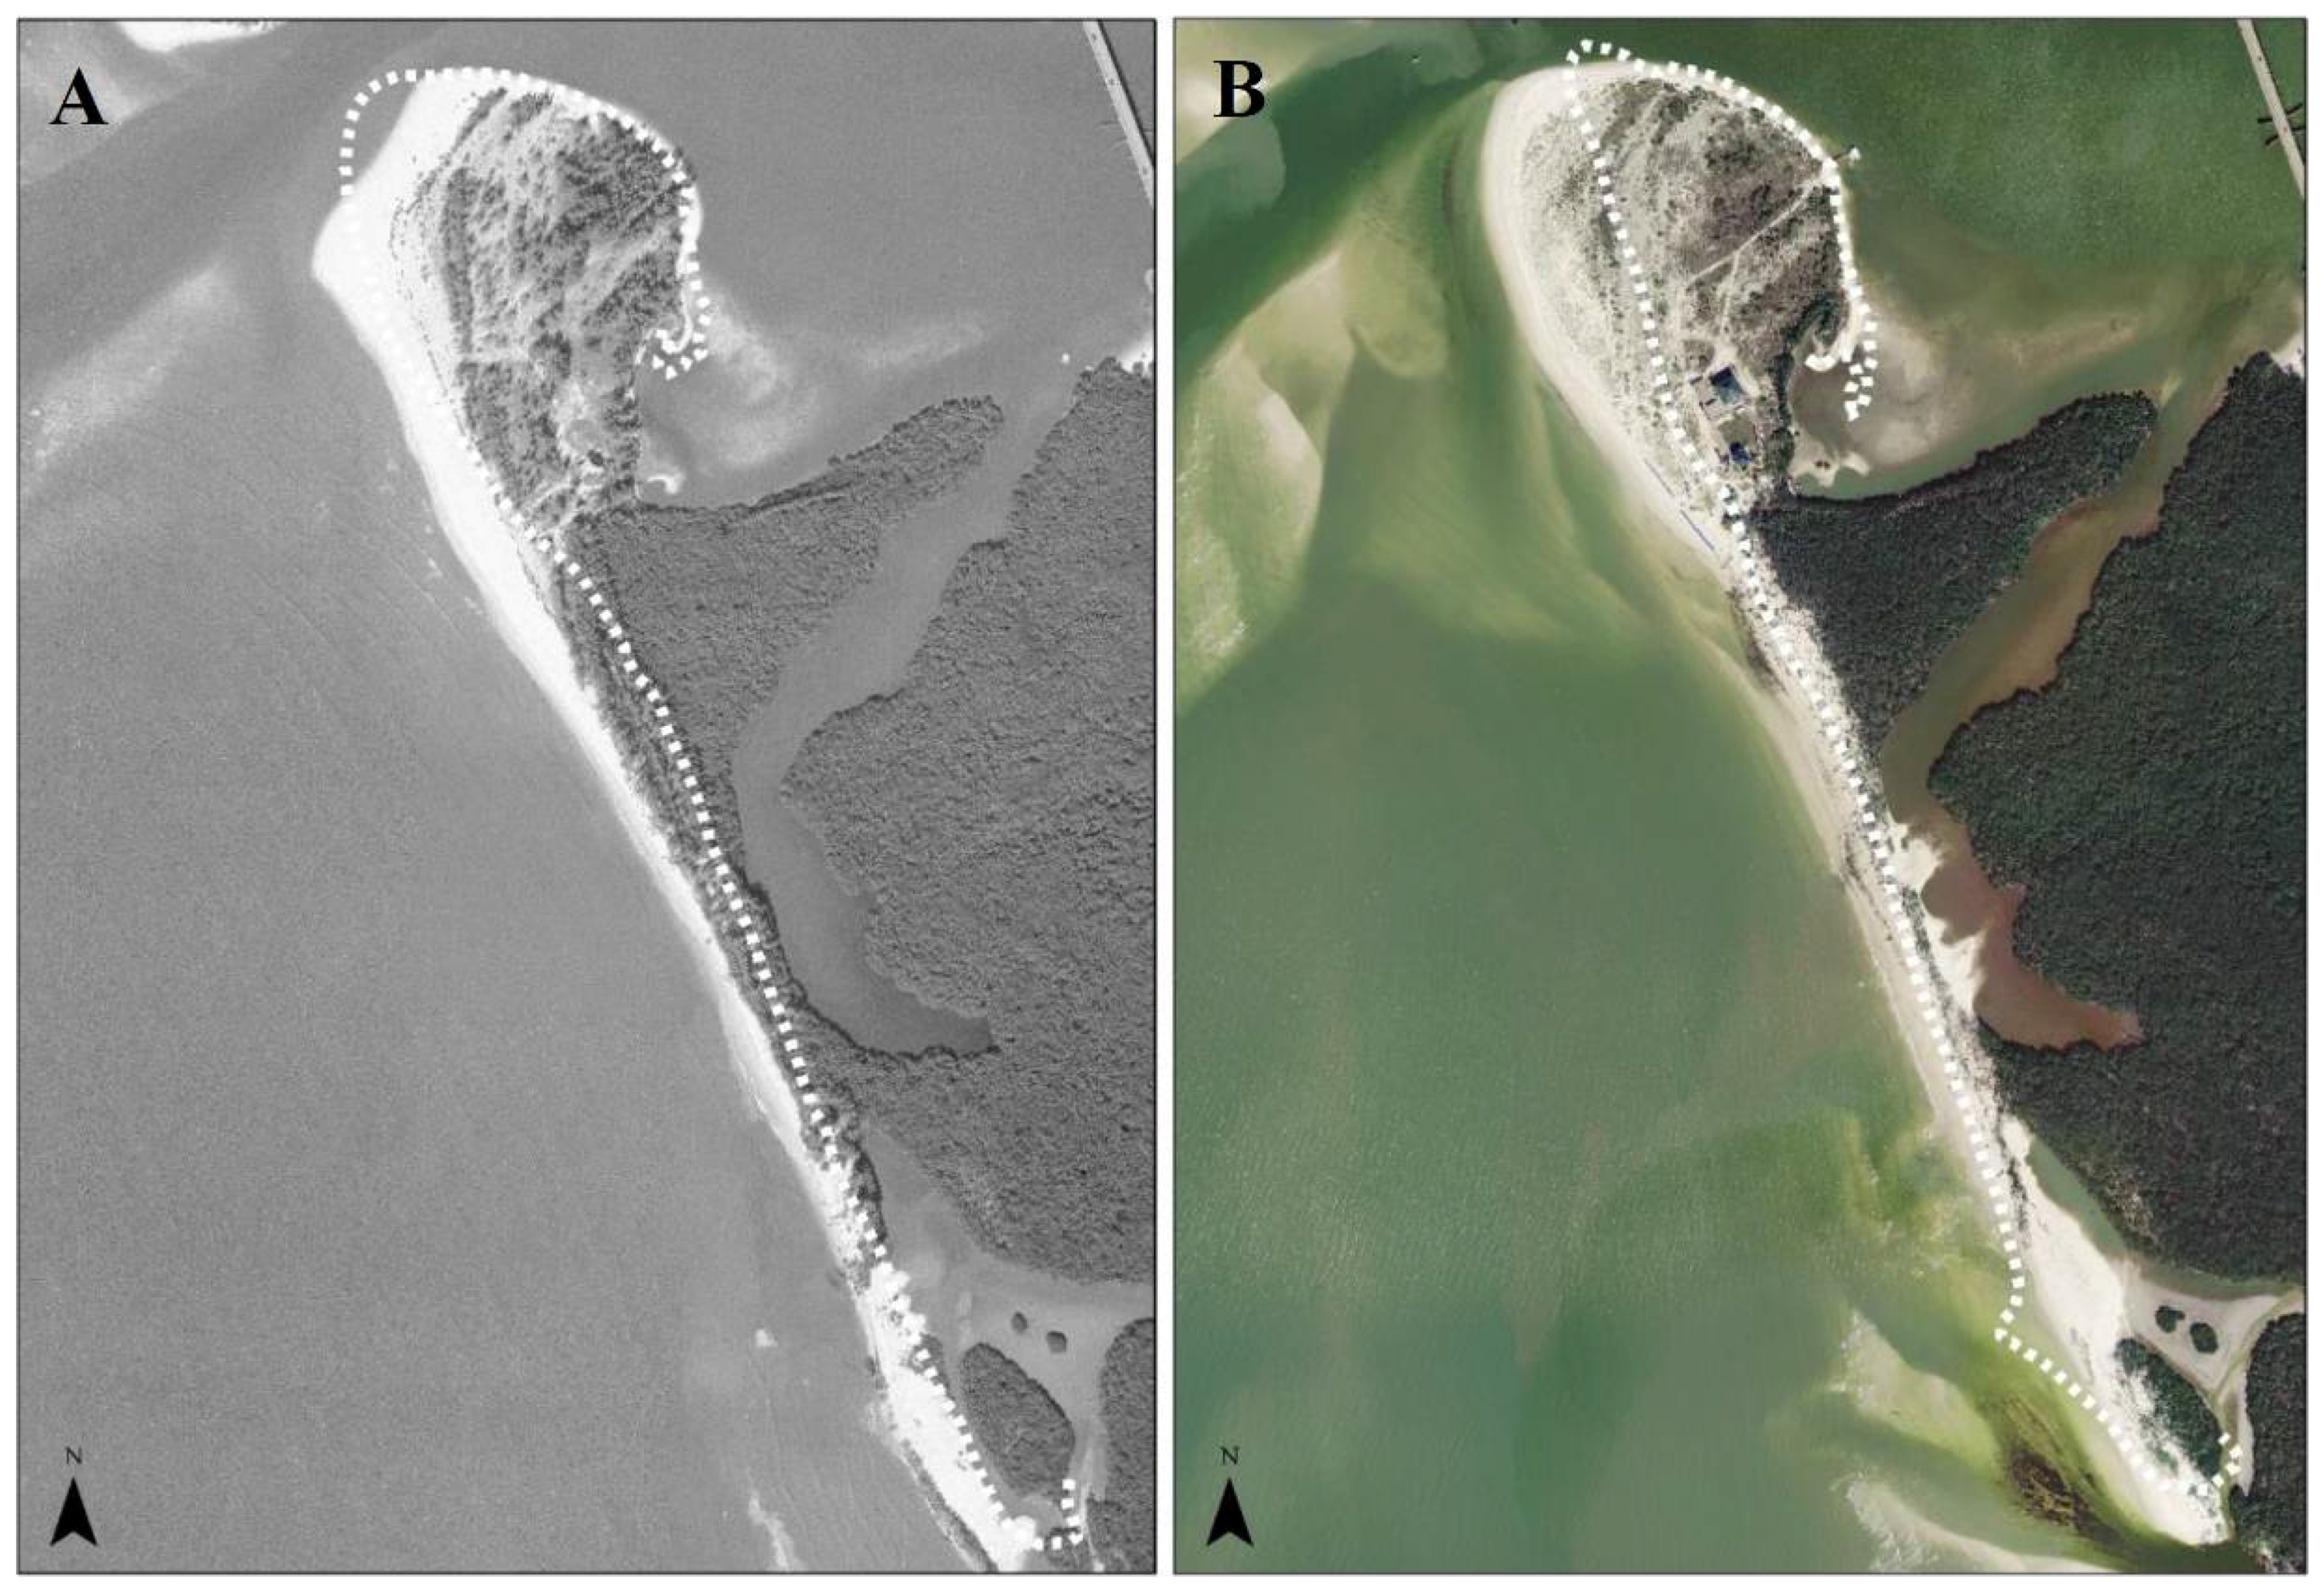
2.1. Near-Term Shoreline Change Analysis Methods

Near-term morphodynamics are established through an analysis of aerial photography (obtained from Lee County and the University of Florida Libraries) and available literature on historical shoreline change on Big Hickory Island [25,30] from 1944 through 2012. Historical aerial photographs (i.e., prior to 1996 in this study), were georeferenced using Geographic Information System (GIS) software and identifying control points from a rectified (NAD83 State Plane FL West) 1996 image [31] prior to shoreline digitization.
The Big Hickory Island shoreline is manually determined in GIS utilizing the common proxy-indicator of the visibly discernable coastal feature of the high-water line (HWL) from aerial photography [32,33]. The HWL is identified based on the change in color tone along a sandy beach (e.g., water-saturated area due to total wave runup at the time of the flight) [32,33]. It is recognized that uncertainties and error are attributed to utilizing the visually determined proxy-based shoreline indicator of the HWL, however for determining the general trends of the morphologic state of the barrier island, this method for qualitative assessment (as opposed to quantifying shoreline recession/advance or volume change) is common and adequate [32,33,34,35,36,37].

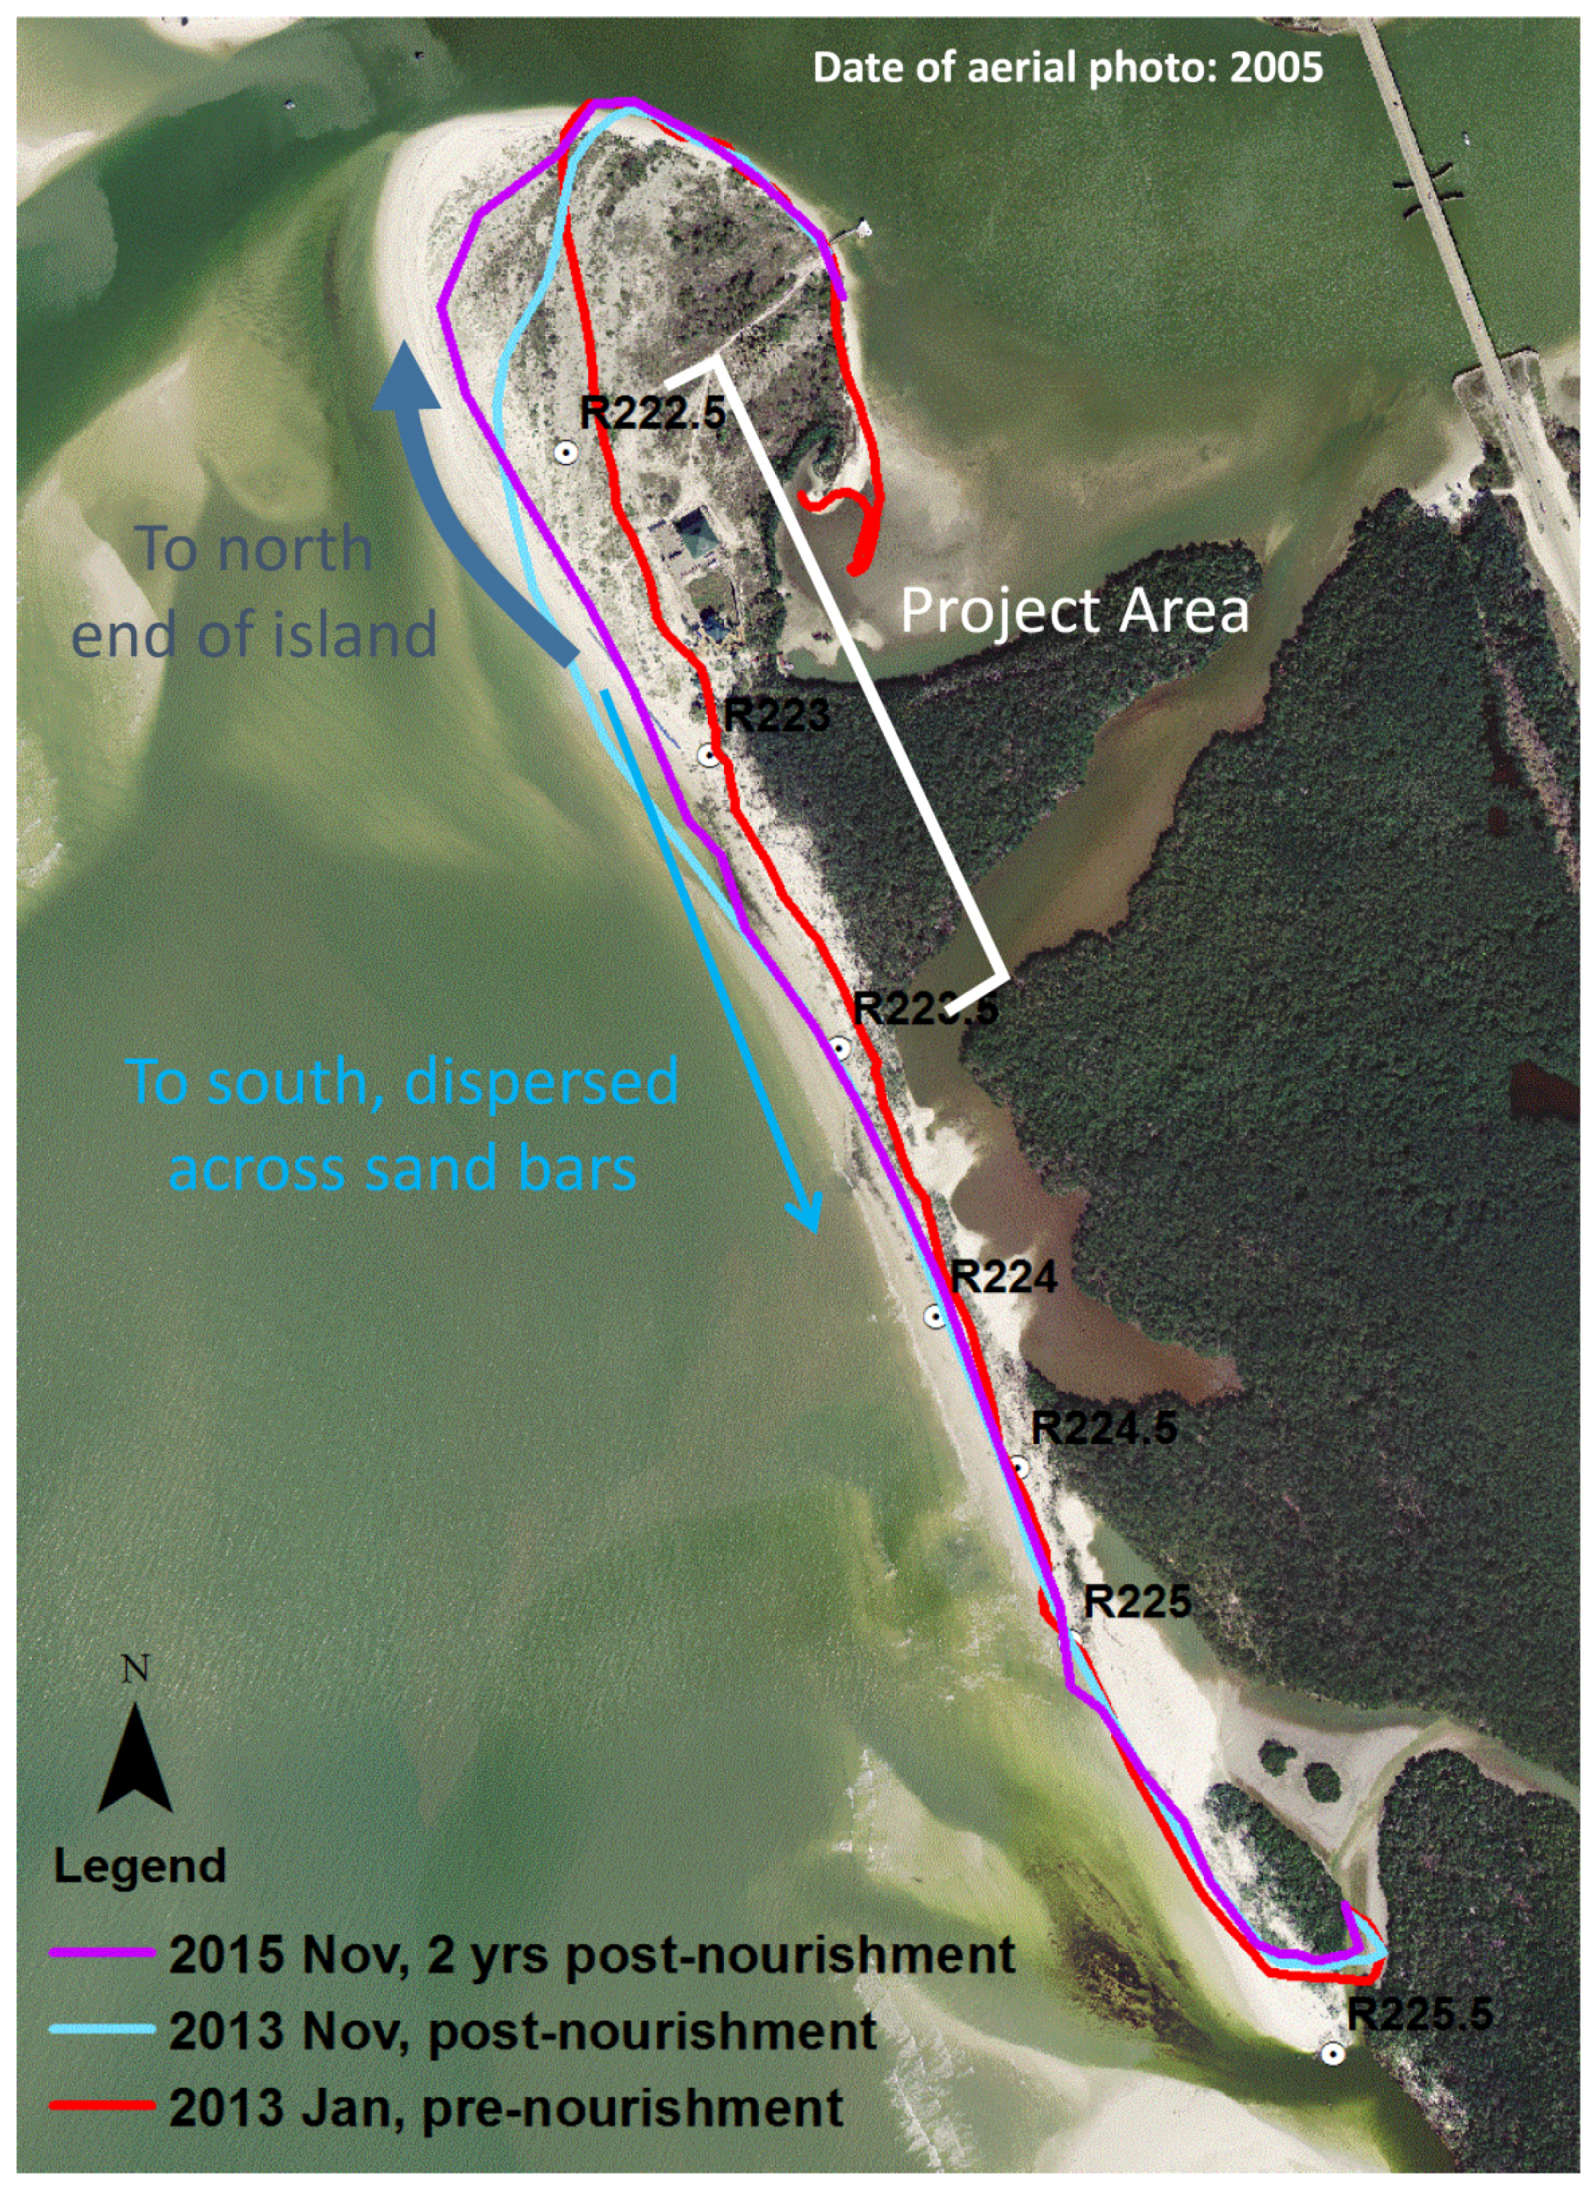
2.2. Short-Term Shoreline Change Analysis Methods

Short-term project performance is analyzed through the following survey monitoring plan, illustrated in Figure 1:
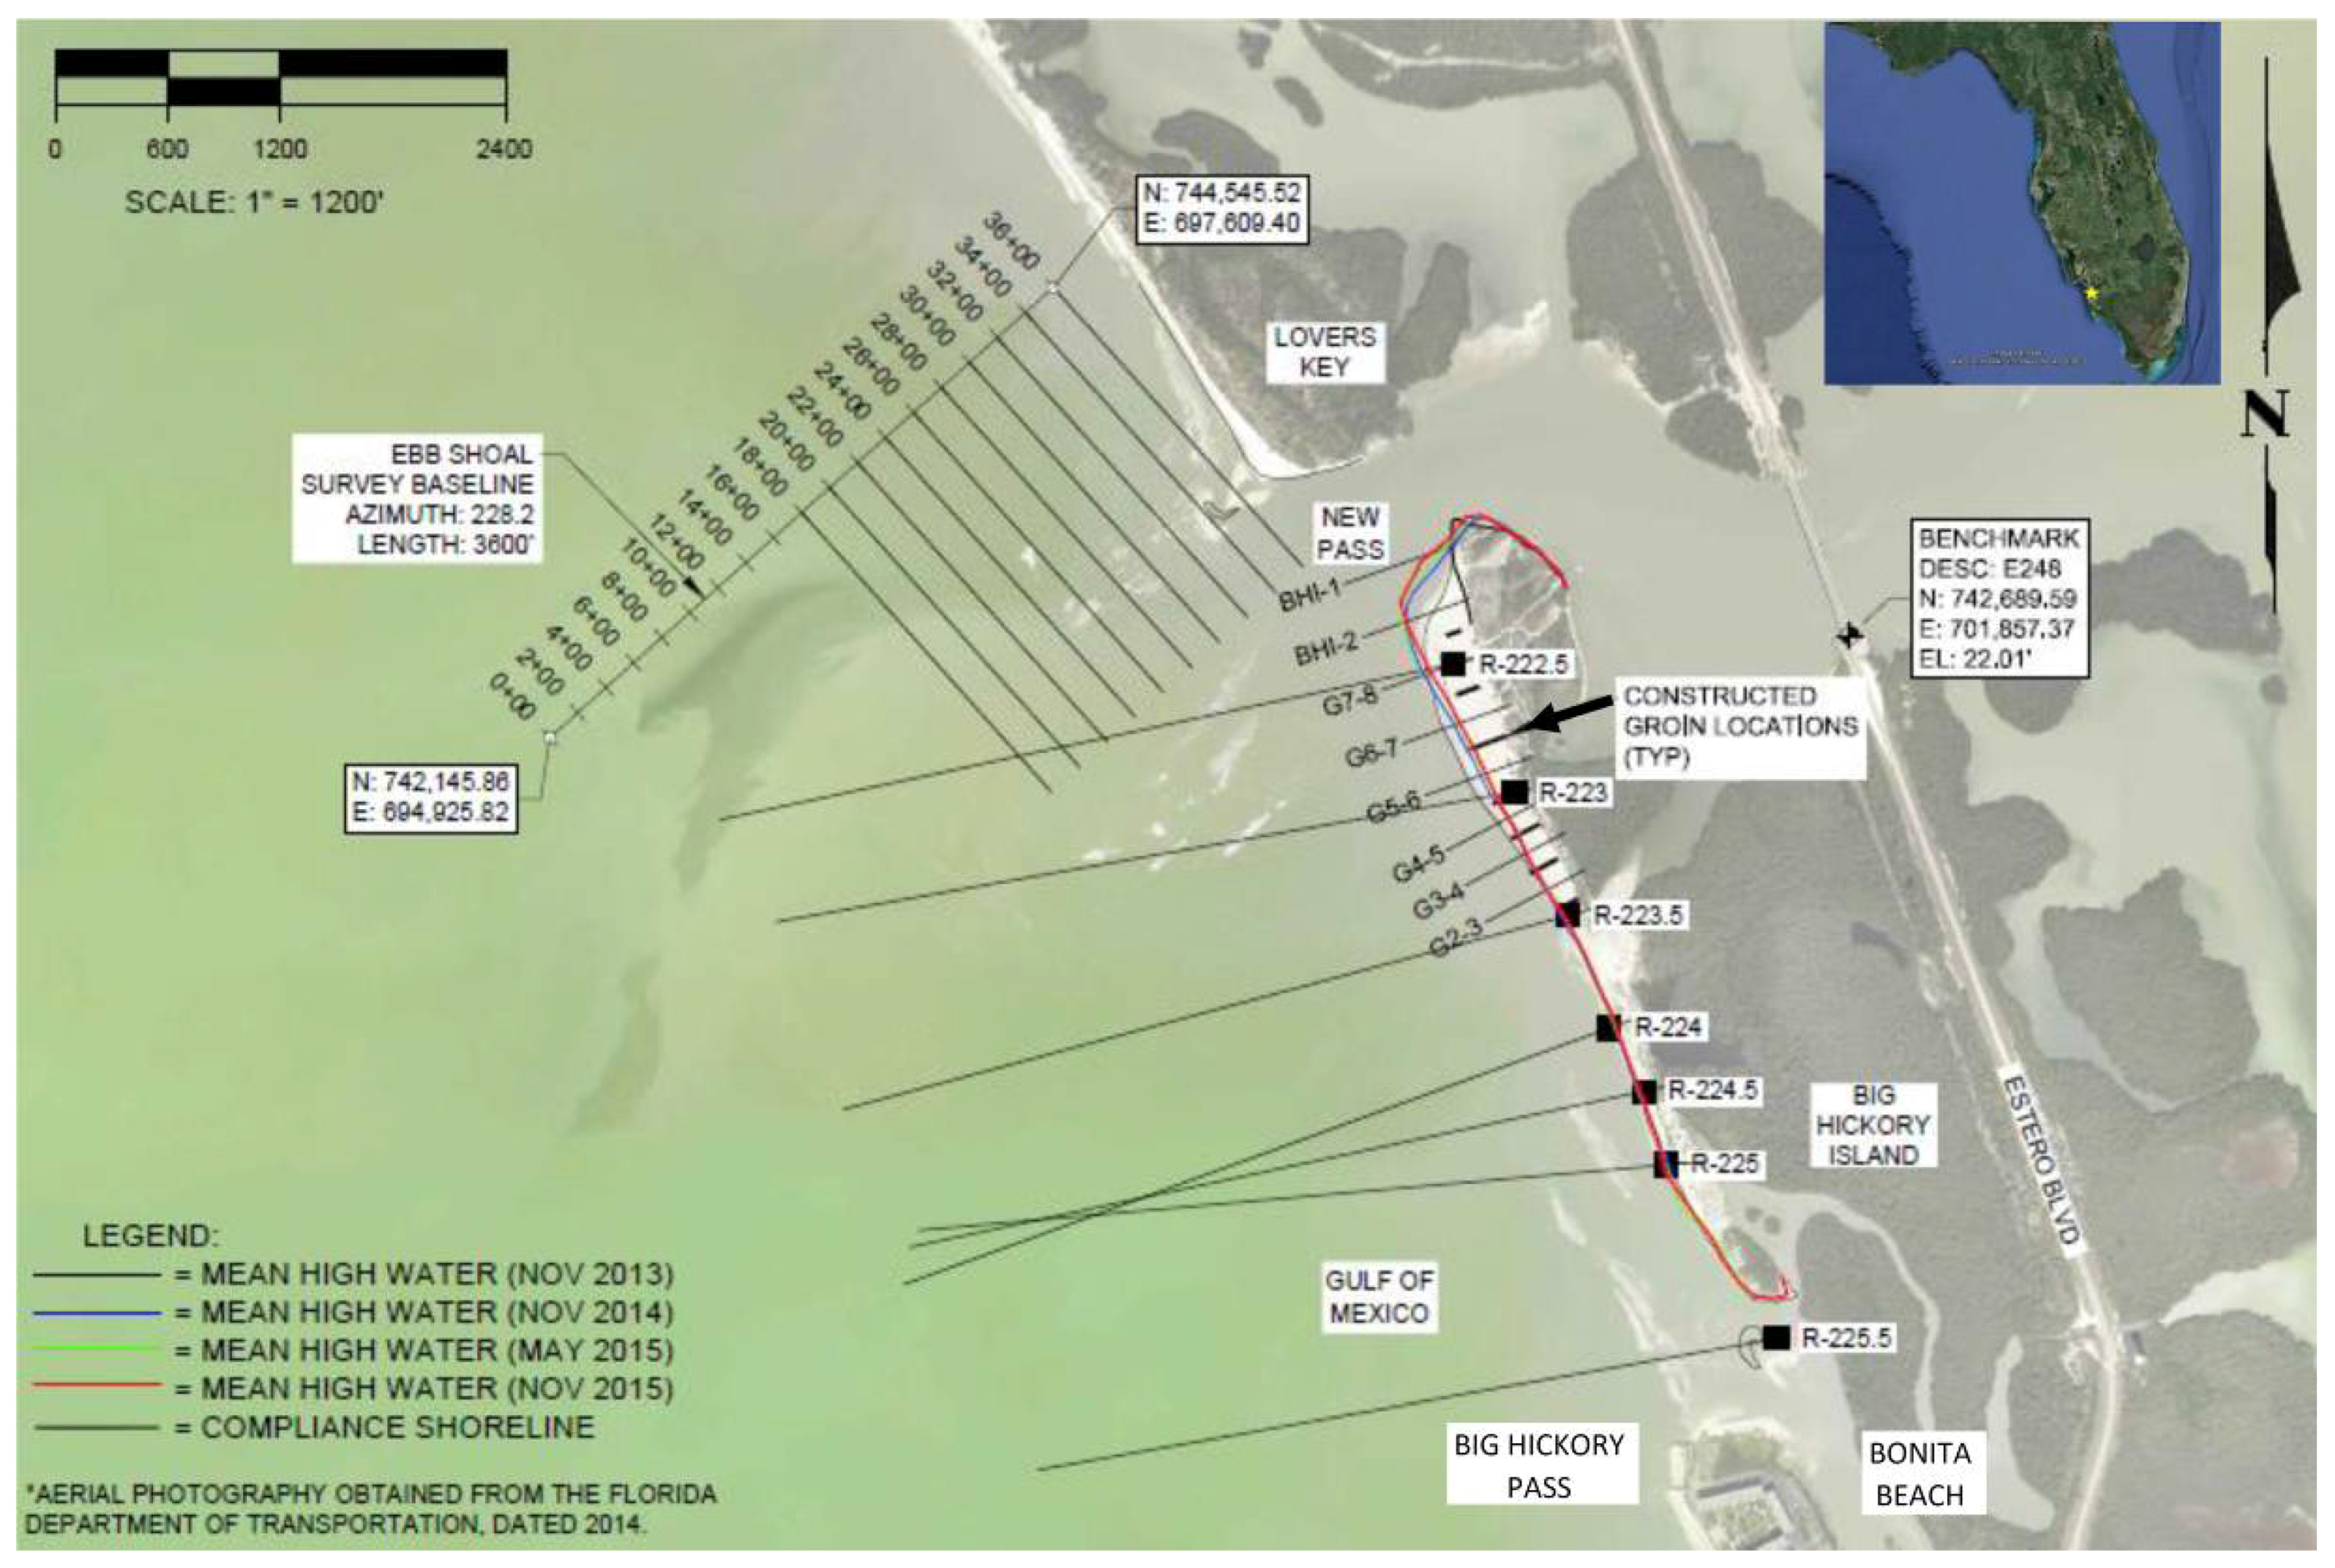
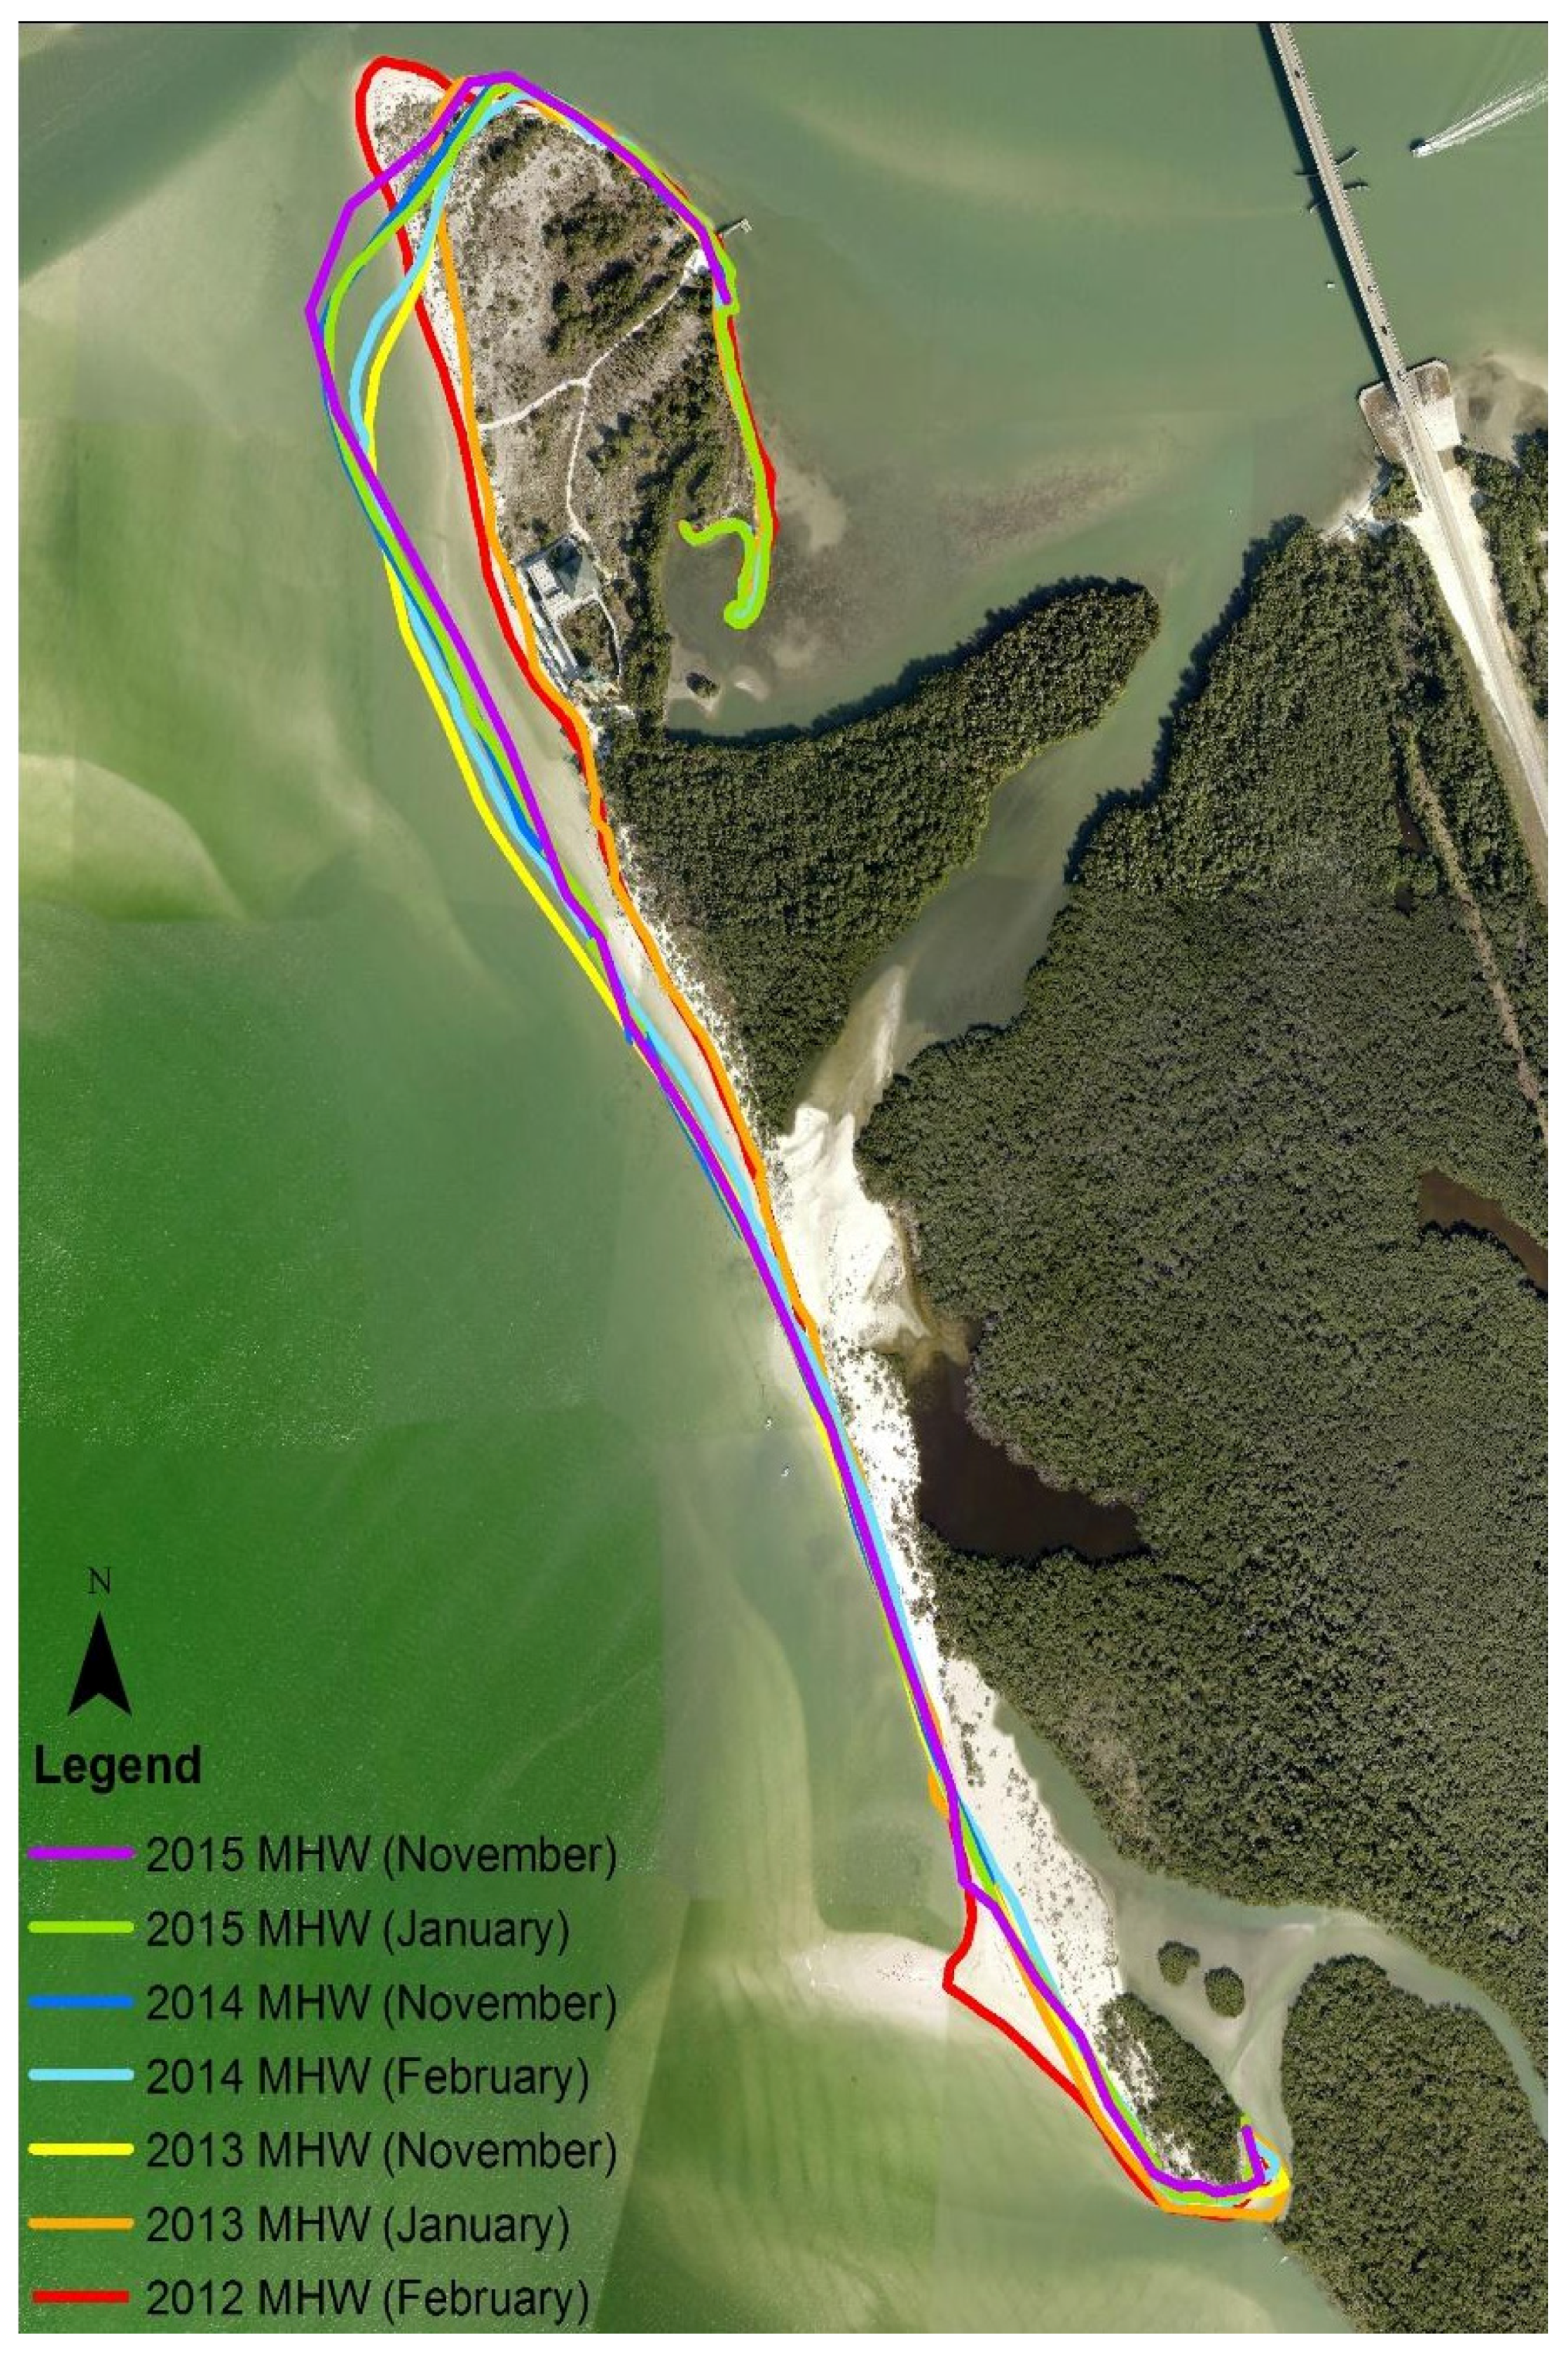
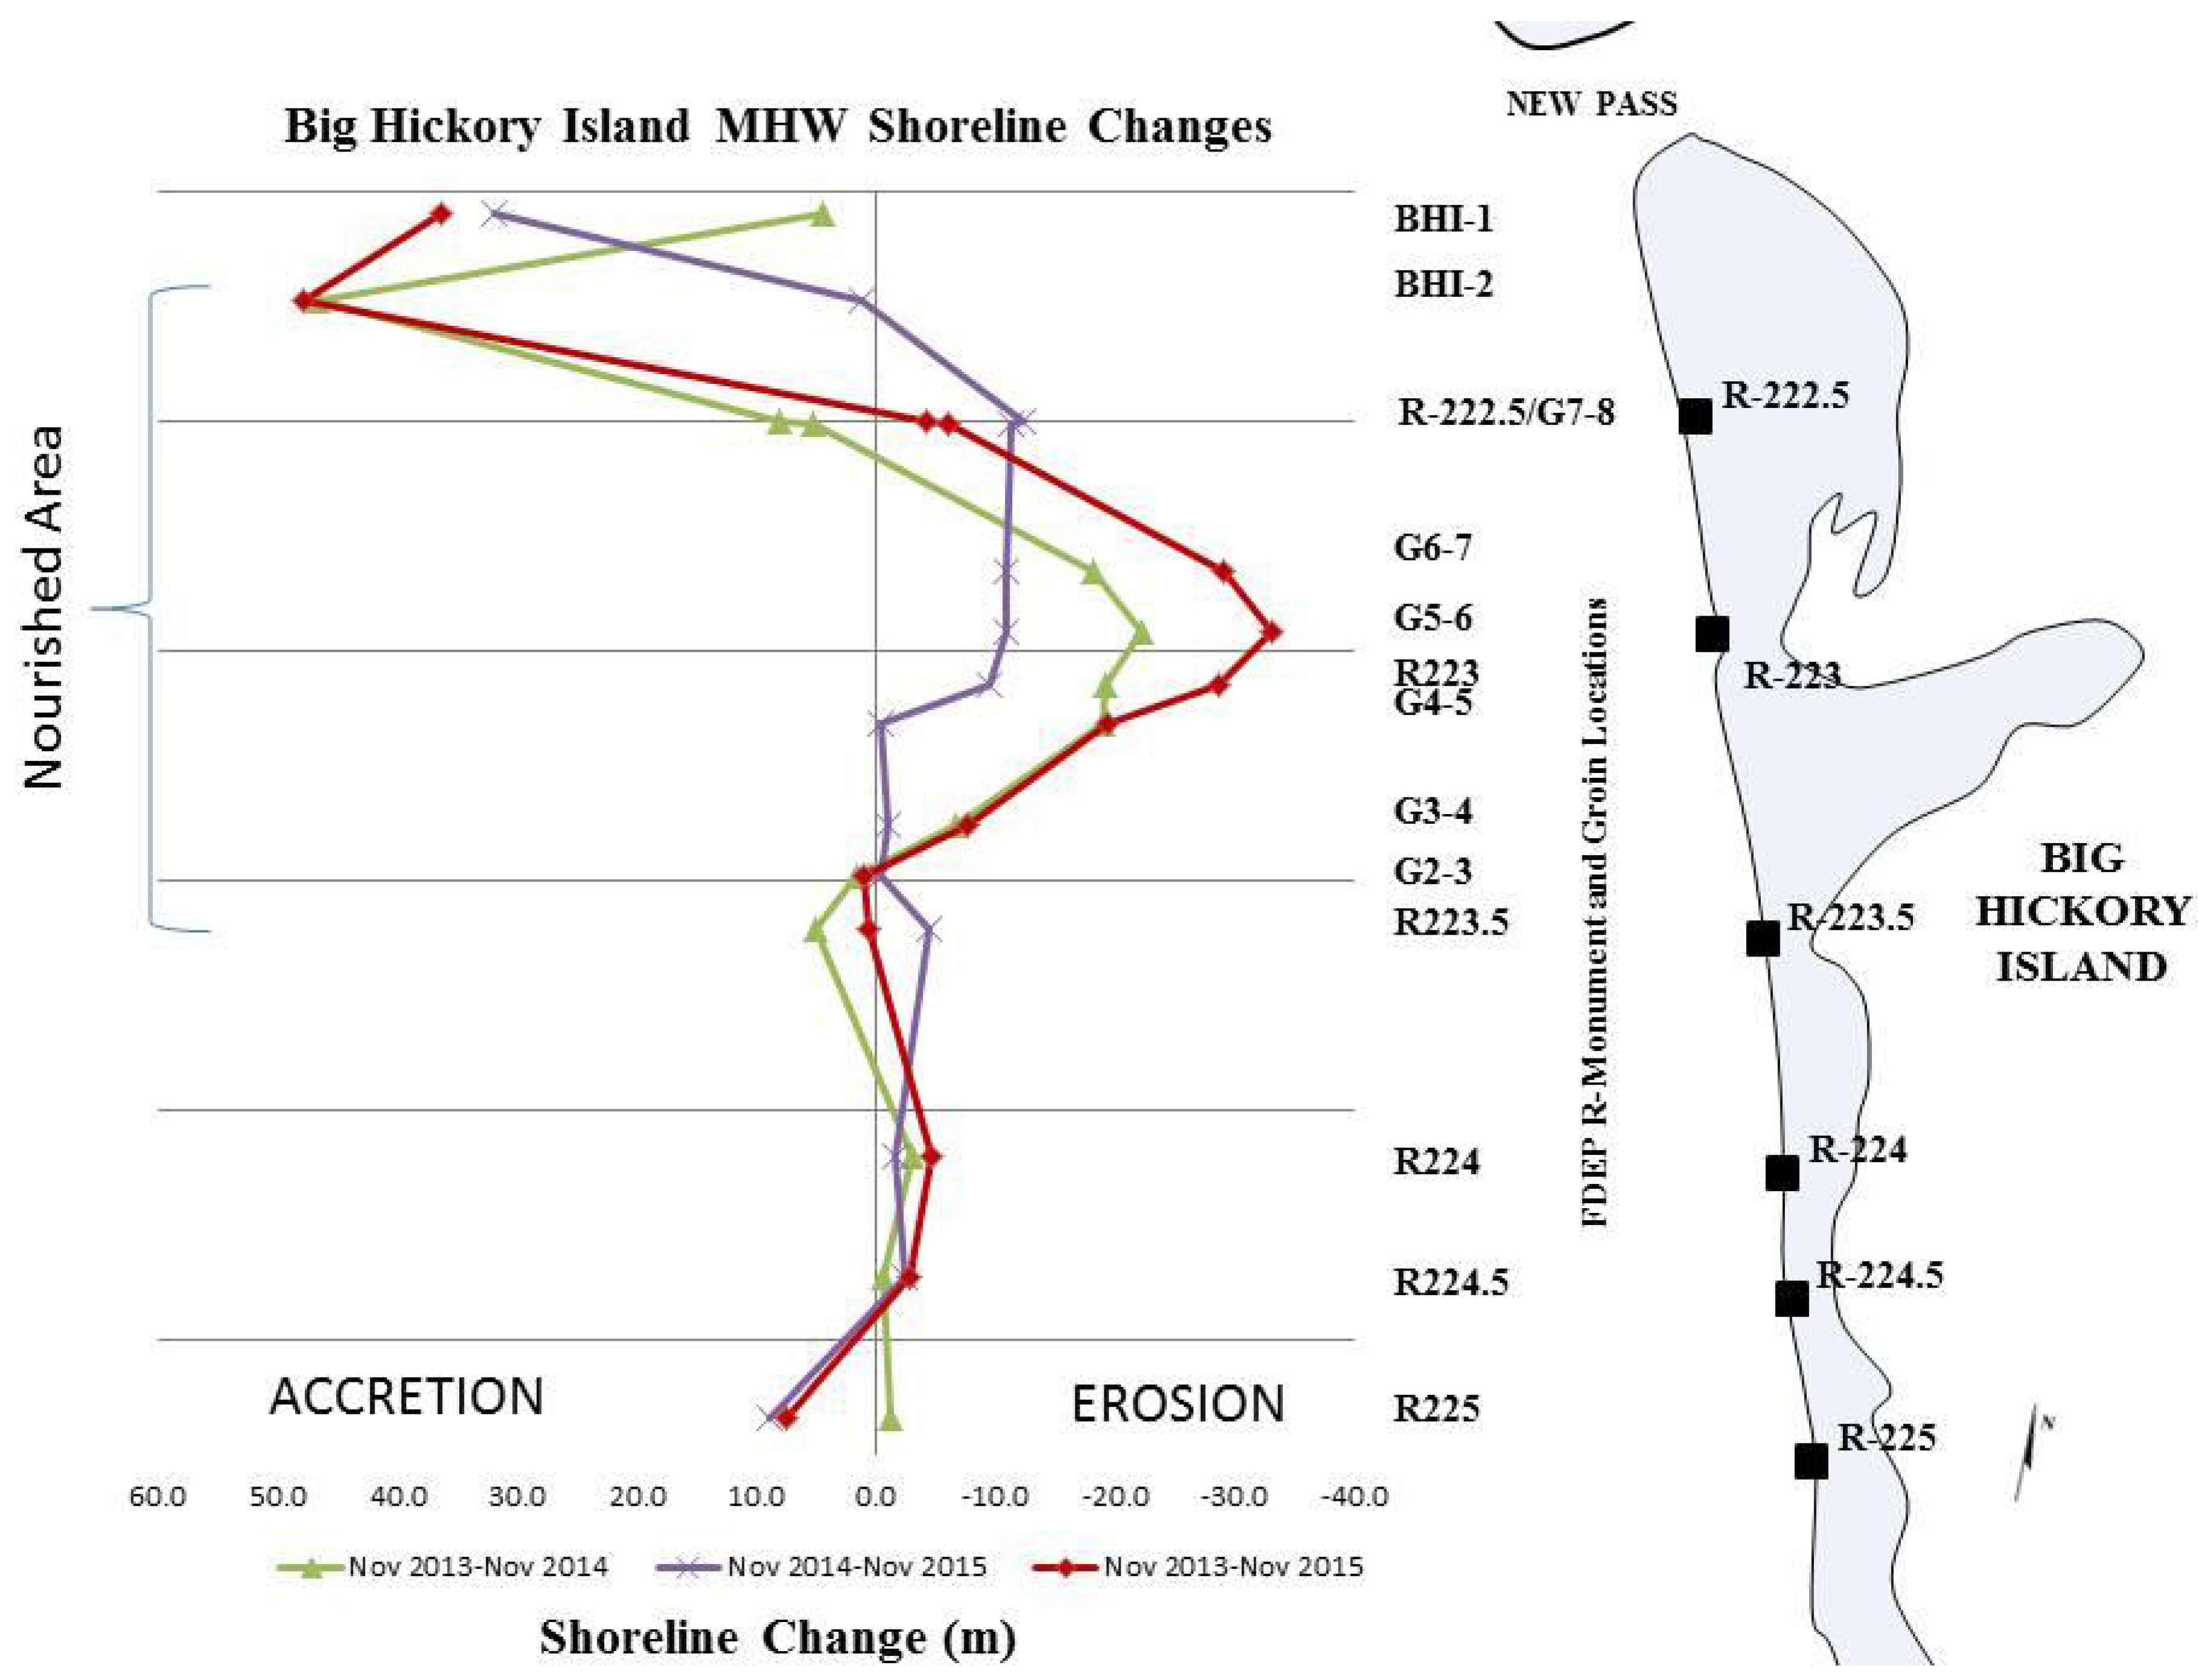
  • MHW shoreline survey along the northern portion of Big Hickory Island,
  • Topographic and hydrographic beach profiles from R-222.5 to R-225.5 to the depth of closure,
  • Wading depth (topographic only) profiles at the centerline of each groin cell, and
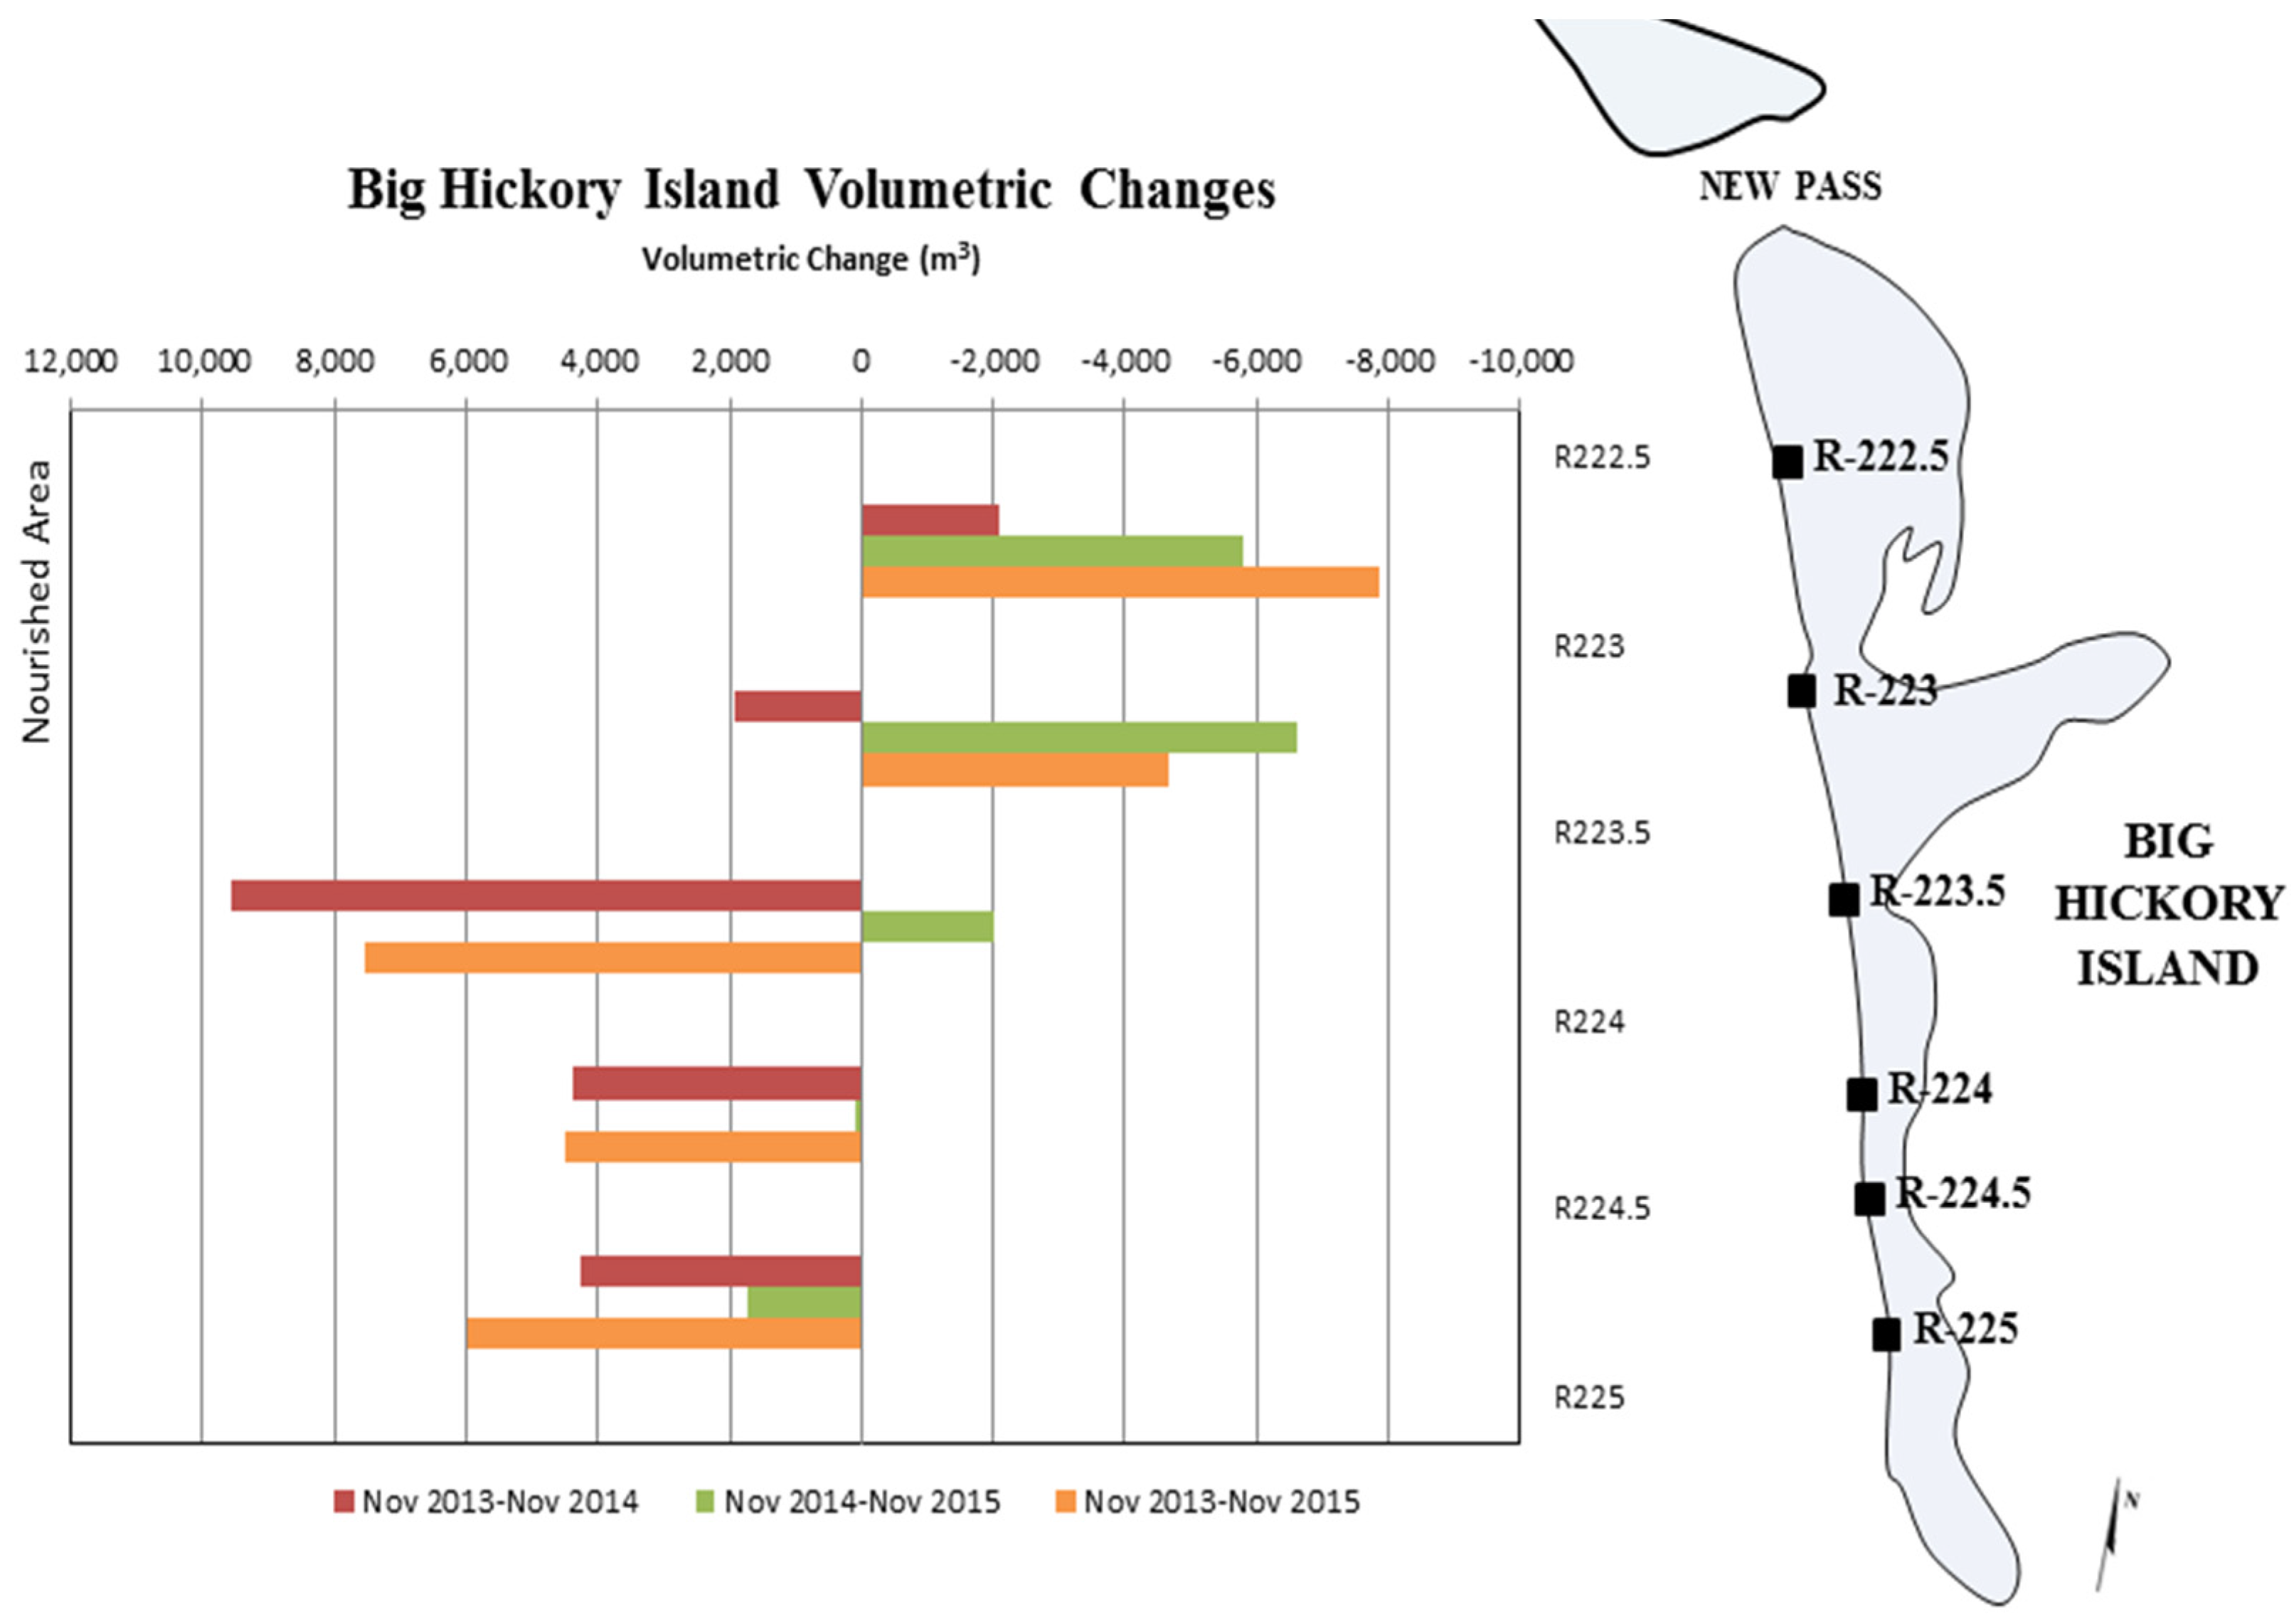
  • Volumetric changes were also calculated to supplement the short-term dynamics analysis.
The survey plan utilized advances in survey-grade Global Positioning Systems (GPS) technology, coupled with Real-Time Kinematic baseline processing (RTK-GPS). Greater spatial coverage can be achieved by collecting data continuously along the shoreline (number 1 above) in conjunction with a traditional beach profile cross-section survey (number 2 above).
MHW shoreline data and topographic beach profile data were surveyed using hand-held Trimble RTK-GPS rovers. The MHW data were collected by walking along the HWL, described in Section 2.1. Topographic and bathymetric surveys were collected at six beach profiles (R-222.5 through R225.5) and wading depth (topographic only) surveys were collected at the center line of each groin cell and at two additional locations to the north of the groin field (Figure 1). The bathymetric portion of the survey was collected using a boat equipped with Trimble R8, Hypack 2014, and a 456 Innerspace single beam echo sounder with a side-mounted transducer. The wading depth profiles (topographic portion only) within and north of the groin field extended approximately 1.2 to 1.5 meters water depth NAVD (or about wading depth during surveying).
The profiles were measured along the same azimuth and commenced at a Florida Department of Environmental Protection (FDEP) R-monument extending seaward to the short-term depth of closure (NAD83 State Plane FL West). The topographic portion of the beach profile extended seaward to a point overlapping the bathymetric component of the survey. Topographic elevation measurements were collected at 7.6 meter (25 feet) intervals or at significant changes in beach slope. The data were collected according to the state monitoring standards for beach erosion control projects [38].
The analysis of data collected through this survey plan relies primarily on shoreline position data for two reasons: (1) for comparison to the near-term shoreline change analysis described above; and (2) to capture high spatial resolution alongshore variability within the project area. Complex spatial changes, such as erosional hot-spots [5] and beach response adjacent to engineering structures, are often not captured in a series of widely-spaced (e.g., 300-m) beach profiles [6].
The volumetric changes were determined by the average end area method [39]: V = L ( A 1 + A 2 2 ) , where V is the volume, A1 and A2 are areas of cross-section (assuming each station is a trapezoid) and L is the distance between stations. Volume changes represent the difference in quantity of sand measured between the FDEP R-monument (generally landward of the dunes) and the short-term depth of closure. The short-term depth of closure is defined as the seaward limit of active sediment transport across a beach profile, beyond which negligible sediment transport is presumed to occur [40]. All volumetric changes are in cubic meters.

3. Results

The following sections present data evaluating the natural and human-induced dynamics of shoreline and morphologic change on Big Hickory Island in southwest Florida. Near-term changes (1944 through 2012) are analyzed through shoreline change using historic aerial photographs and short-term changes (2012 through 2015) are analyzed through both shoreline and volumetric change using recent topographic and bathymetric field surveys.

3.1. Near-Term Shoreline Change

The long-term evolution of Big Hickory Island suggests that the island has been highly migratory since the late 1800s [30]. A major change in the overall barrier island morphology occurred between 1885 and 1927, when the island shortened and widened as the inlet to the north (Little Carlos Pass, approximately 1.8 km north of present-day New Pass [41] substantially migrated south and Big Hickory Pass (to the south) migrated north. In addition to larger-scale drivers of change, such as the global acceleration of sea level rise [42], the natural hydrodynamic interactions between the barrier and its bounding inlets and the dynamics of the adjacent barrier islands were the primary localized drivers of morphologic change at that time (i.e., little to no human-induced change).
Evaluation of decadal trends in the near-term evolution of Big Hickory Island reveals an island continuing to exhibit unstable shoreline conditions and large morphologic variations throughout the 1900s and into the 2000s. In 1944, Big Hickory Island was an elongated barrier with a well-developed channel separating the barrier from the vegetated island to the east (landward of the barrier), similar to the general morphologic conditions of 1927. Between 1944 and 1958, overall landward migration of the barrier island, likely through overwash processes associated with the passage of several hurricanes [41], closed the channel passage along the bayside of the barrier and connected it to the vegetated landmass to the east (Figure 3). New Pass, bounding Big Hickory Island to the north, had become a well-developed and dominant inlet [41]. Shoreline recession at the south tip contributed to an overall shortening of the barrier. However, the most substantial change occurred along the northern end of the barrier island, which not only retreated south but also recurved landward closing the northern extent of the 1944 backbarrier channel. By 1958, development had begun on the barrier island to the south (Little Hickory Island). Any unvegetated areas or sediment shoals to the north of the island in 1944 disappeared by 1958. In addition, significant sediment accumulation along the northern tip of Little Hickory Island appears to have occurred during this time. This period denotes the introduction of human-induced changes to the natural barrier island system.
Between 1958 and 1980, continued morphologic change occurred in conjunction with significant anthropogenic activities within the area. Between 1958 and 1965, a coastal causeway was constructed connecting Estero Island (to the north) to Little Hickory Island, influencing the hydrodynamics of several tidal channels within the area [31]. Northward sediment transport resulted in the closure of Big Hickory Pass, consequentially connecting Big Hickory Island and Little Hickory Island. Despite anthropogenically reopening the inlet in 1976 [30], by 1980 the inlet was again infilled by northward longshore sediment transport (Figure 4). Remnants of the dredged 1976 inlet are apparent from the 1980 aerial image. The closure of this inlet allowed for significant quantities of northward transported sediment to naturally supplement the beaches along Big Hickory Island. The apparent northward longshore sediment transport represents a localized reversal in the regional north to south longshore sediment transport patterns [24,25]. Figure 4 shows a comparison of a 1970 aerial photograph to the 1980 shoreline illustrating the widening of the beach as a result of the closure of the southern inlet [25].
In November 1995, Big Hickory Pass (south channel-side) was stabilized in an open configuration with two terminal rock groins at the north end of Little Hickory Island [43] to prevent infilling by northward transported sediment. Due to the predominant northward longshore sediment transport, sediment was depleted from the southern portion of Big Hickory Island, resulting in shoreline recession along the southern extent of the island and northward shoreline advance from sediment accumulation along the northern tip of the island (Figure 4). It is evident that the groin structures along Bonita Beach (south of Big Hickory Island) had a significant impact on the morphology and sediment supply of Big Hickory Island. It also appears that when Big Hickory Pass is open, Big Hickory Island will erode due to a reduced sediment supply.
Following the stabilization of Little Hickory Pass south of Big Hickory Island, sediment supply to the island was diminished with little mechanism for sediment by-passing. As a result, the barrier island began to migrate landward, with shoreline retreat observed between 1996 and 2005 (Figure 5). During this time, community facilities were permitted and constructed on Big Hickory Island. The trend of shoreline recession continued through 2012, with rapid shoreline retreat along the northern portion of Big Hickory Island (Figure 5). The south inlet’s northern ebb tidal delta appears to have equilibrated after groin construction and started contributing sediment to the southern portion of Big Hickory Island, evident from the slight shoreline advance along this section of the island. However, overall the island appears to be in a state of severe sediment depletion as evidenced by the erosive trends exhibited leading up to the 2012 morphologic state.
Near-term evaluation of aerial photographs illustrates the dramatic morphologic changes of Big Hickory Island between 1944 and 2012. Natural processes associated with the hydrodynamic fluctuations of nearby inlets and event-driven changes resulting from the passages of storms dominated the morphodynamics of Big Hickory Island until the late 1950s. The 1960 and 1970s represent the temporal shift from natural processes to human-induced changes dominating the barrier island system. Throughout the last two decades, shoreline-stabilization structures updrift (south) of Big Hickory Island (and removal of sediment for nearby beach nourishment projects [25]) resulted in a significant deficit of sediment input onto the barrier island, causing marked barrier island retrogradation by 2012.

3.2. Short-Term Shoreline Change

Between 2012 and early 2013, the north end of Big Hickory Island continued to retreat landward, as illustrated by the Mean High Water (MHW) change (Figure 6, red and orange lines). Beach nourishment and groin construction were implemented in mid- to late-2013 in response to the rapid erosion occurring on Big Hickory Island (Figure 6, yellow line). Nourishment sediment spreading is evident with advancement of the island shoreline to the north during the two years post-construction (Figure 6, purple line). By late 2015, a new equilibrium shoreline location is emerging along the groin field. Detailed evaluation of the MHW and volumetric changes across Big Hickory Island between 2012 and 2015 provides information on the short-term morphodynamics on Big Hickory Island in response to the most recent anthropogenic influences (nourishment and groin placement), suggesting a trend toward a new barrier island dynamic equilibrium state [44] that is more consistent with the 2005 state (Figure 5B).
Tabulated annual shoreline change from construction completion (November 2013) to November 2015 at the FDEP R-monuments is given in Table 1. The average shoreline change during the first two years after project construction, from November 2013 to November 2015, was a landward movement of 5.4 (± 12.2) meters. The large standard deviation (σ) implies significant alongshore variability. The greatest shoreline change in the project area occurred at R223, which represents roughly the center of the beach nourishment perturbation. Note that no standard R-monuments exist north of the project area in the volatile region adjacent to New Pass. Shoreline change immediately south of the project area was negative (representing landward change or erosion); whereas, change along southern Big Hickory Island, adjacent to Big Hickory Pass was positive or accretional (Figure 6).
Shoreline change within the groin field since construction (November 2013 to November 2015) was on average 15.7 (± 4.2) meters landward. This change is visualized in Figure 6, illustrating that despite the substantial shoreline retreat, the 2015 shoreline position is seaward of the pre-nourishment shoreline position.
When shoreline change is calculated for all wading depth profiles, including BHI-1 and BHI-2, the total shoreline change averaged only 2.8 (± 8.9) meters landward between November 2013 and November 2015. As suggested by the high σ , the shoreline location moved 47.9 m seaward at BHI-2 during this time period (Table 2), representing significant spreading of nourished sediment to the north. As expected [45], the greatest landward shoreline movement occurred in the G5-6 groin cell, which is located close to the center of the beach erosion mitigation project.
MHW shoreline changes for both the R-monument beach profile surveys (Table 1) and the groin profile surveys (Table 2) are summarized in Figure 7. Note that Figure 7 does not represent shoreline position (i.e., not a planform or a map). Overall shoreline change after construction followed a typical planform spreading signature [45] of landward shoreline movement in the center of the nourished area and shoreline advancement to the north and south, with considerably more advancement to the north, the direction of longshore sediment transport. Shoreline change stabilized (i.e., near zero change) in the vicinity of groins 2, 3, 4, and 5 during the second year after construction; whereas, the pattern of spreading continued along the northern project area with spreading to the north.
Based on the shoreline change performance in the vicinity of R223.5 to G4-5, the groins have stabilized shoreline changes two years after project construction. The data suggest that the groins will serve to stabilize shoreline changes north of G4-5 to R222.5 once the nourished sediment is distributed outside of the project area. Provided periodic renourishment, the island should reach a new dynamic equilibrium shoreline position controlled by the groins that is farther seaward than the pre-nourishment shoreline position. Without periodic renourishment, the groin field may have adverse impacts on the downdrift shoreline located to the north of the project area.

3.3. Short-Term Volumetric Change

Tabulated volumetric changes calculated from construction completion (November 2013) to November 2015 are given in Table 3. The volumetric analysis is limited to the R-monument surveys because they extend to the depth of closure and capture all volume change across the profile. However, these monument surveys are spaced at roughly 150-m alongshore; therefore, high-resolution changes within the groin field are not analyzed in detail in this section. The volumetric change analysis supports the findings in sections 3.1 and 3.2.
A total of 7132 yd3 of sediment volume change (gain) was measured across the Big Hickory Island study area from R222.5 to R225.5 from November 2013 to November 2015. Based on R-monument calculations, the nourished area was erosional, while the area located to the south (from R224 to R225) was accretional. This corresponds to the planform spreading pattern noted in the previous section.
Relatively low shoreline change statistics south of the project area (Figure 7) and high volume change data in this area suggest that much of the sediment has accumulated below mean high water. The volumetric change data indicate that the groins have considerably reduced post-nourishment sediment volume losses.
Volumetric changes for the R-monument surveys (Table 1 and Table 3) are summarized in Figure 8. Volume loss was measured within the project area and accretion was observed to the south. Photographic and field observations, as well as shoreline change measurements, indicate substantial accretion to the north of the project area. As noted above, this is the expected post-nourishment volume change response. The positive volume change statistics suggest good beach erosion mitigation project performance.

4. Discussion

The near-term and short-term analysis of the shoreline and volume change (representing overall barrier island morphology) of Big Hickory Island suggest that coupled natural and anthropogenic influences are driving the coastal processes toward a different morphodynamic state than would have occurred under natural processes alone. The initial shift from a naturally influenced barrier island to a combined natural-human influenced barrier island system occurred in the mid-1900s with infrastructure development commencing on nearby islands. Closure of Big Hickory Pass (to the south) by 1980 allowed the island to begin morphologic recovery as natural sediment bypassing resumed. However, subsequent erosion mitigation efforts on Little Hickory Island to structurally maintain Big Hickory Pass (in an open position) resulted in severe erosion on Big Hickory Island, similar to the eroded conditions observed in the 1970s. Continued shoreline retreat was observed through the 1990s and 2000s.
Construction of community infrastructure in the mid-2000s was the first direct anthropogenic activity on Big Hickory Island. Subsequent impacts to the island were from human influences on nearby barriers and inlets. In 2013, severe erosion prompted the private landowners (Pelican Landing Community Association) to implement and self-finance a beach erosion mitigation project, consisting of the construction of king-pile groins combined with beach nourishment.
The groin field was constructed within the central region of the barrier island with undeveloped (and unmanaged) shoreline on either side of the project. To date, the groins have stabilized the central shoreline of Big Hickory Island in a more seaward position, similar to the 2005 shoreline location (Figure 9). A conceptual model illustrates the observed lateral spreading of the substantial sediment volume added by the beach nourishment, which has resulted in shoreline progradation of the northern tip of Big Hickory Island and volume gain to the south. However, the volume gain to the south has not resulted in shoreline progradation (Figure 9). The 2005 aerial photo used in Figure 9 illustrates that the project is stabilizing the shoreline to near-2005 conditions. The project is functioning as designed, thus Figure 9 represents both realized and idealized project performance.
Big Hickory Island is approaching a new dynamic equilibrium state, in response to the recent direct anthropogenic erosion mitigation efforts on the barrier island and natural coastal processes within the region. It is recognized that any new significant perturbation to the system (e.g., human-implemented coastal construction or natural storm impacts) will disrupt the current trajectory of barrier island equilibration.
As noted, little sediment has been transported to Big Hickory Island naturally since the installation of the terminal groins at Big Hickory Pass to the south (at Bonita Beach). Thus, periodic renourishment is essential. Provided continued renourishment, the barrier island should reach a new dynamic equilibrium controlled by the groins. Without periodic renourishment, the groin field may have adverse impacts on the beach located to the north of the project area. Continued monitoring will determine the effects that the newly placed groin field will have on the northern extent of the island; however to date, no adverse impacts have been observed. Results from continued monitoring will help the planning, cost-benefit analysis, and design of similar projects. This privately-funded project, in the middle of a barrier island in a relatively low-energy setting, provides coastal managers and engineers an opportunity to evaluate alternative erosion mitigation strategies.
With continued direct placement of sediment to supplement the shoreline stabilization efforts of the king pile groins, Big Hickory Island may reach a more stable morphodynamic state as compared to the last several decades of severe erosion and retrogradation due to diminished sediment input. Because of limited sediment transport to the barrier through natural processes of inlet bypassing (at Big Hickory Pass) due to the groin structures on the updrift adjacent barrier island (Little Hickory Island), anthropogenically-introduced sediment input into the barrier island system is critical to the longevity of the shoreline stability of Big Hickory Island. However, as sea-level rise [42] potentially couples with increased storminess [46], amplified rates of coastal erosion will likely require a reevaluation of the amount of sediment needed to maintain the stability not only of Big Hickory Island, but barrier islands worldwide.

Acknowledgments

Funding was provided by the Pelican Landing Community Association (PLCA). Special thanks to Marie Martel, PLCA General Manager, and Tom Schemenaur. The authors wish to thank Dr. Robert Dean for his insightful observations on island morphodynamics and Doug Mann for his engineering expertise and contributions to the construction of the beach erosion mitigation project.

Author Contributions

N.E. conceived and implemented the fieldwork involved in the project. N.E. and T.R.B. conducted data analysis and interpretation. T.R.B. and N.E. contributed to the manuscript preparations and revisions.

Conflicts of Interest

The authors declare no conflict of interest.

References

  1. Bird, E.C. The modern prevalence of beach erosion. Mar. Pollut. Bull. 1987, 18, 151–157. [Google Scholar] [CrossRef]
  2. Morton, R.A.; McKenna, K.K. Analysis and projection of erosion hazard areas in Brazoria and Galveston Counties, Texas. J. Coast. Res. 1999, 28, 106–120. [Google Scholar]
  3. Kraus, N.C.; Galgano, F.A. Beach Erosional Hot Spots: Types, Causes, Solutions; Engineer Research and Development Center: Vicksburg, MI, USA, 2001; pp. 1–17. Available online: http://citeseerx.ist.psu.edu/viewdoc/download?doi=10.1.1.492.7258&rep=rep1&type=pdf (accessed on 14 February 2016).
  4. Elko, N.A.; Mann, D.W. Implementation of geotextile t-groins in Pinellas County, Florida. Shore Beach 2007, 75, 2–10. [Google Scholar]
  5. CEM. Coastal Engineering Manual, Part V, Chapter 3; U.S. Army Corps of Engineers: Washington, DC, USA, 2002. [Google Scholar]
  6. Basco, D.R.; Pope, J. Groin functional design guidance from the Coastal Engineering Manual. J. Coast. Res. 2004, 33, 121–130. [Google Scholar]
  7. Van Rijn, L. Coastal erosion and control. Ocean Coast. Manag. 2011, 54, 867–887. [Google Scholar] [CrossRef]
  8. National Research Council. Beach Nourishment and Protection, Committee on Beach Nourishment and Protection; National Academies Press: Washington, DC, USA, 1995; p. 352. Available online: http://www.nap.edu/catalog/4984.html (accessed on 27 January 2016).
  9. Kraus, N.C.; Hanson, H.; Blomgren, S. Modern functional design of groins systems. In Proceedings 24th Coastal Engineering Conference; ASCE: New York, NY, USA, 1994; pp. 1327–1342. [Google Scholar]
  10. Donohue, K.A.; Bocamazo, L.M.; Dvorak, D. Experience with groin notching along the Northern New Jersey Coast. J. Coast. Res. 2004, 33, 198–214. [Google Scholar]
  11. Galgano, F.A. Long-term effectiveness of a groin and beach fill system: A case study using shoreline change maps. J. Coast. Res. 2004, 33, 3–18. [Google Scholar]
  12. Traynum, S.B.; Kana, T.W.; Simms, D.R. Construction and performance of six template groins at Hunting Island, South Carolina. Shore Beach 2010, 78, 21–32. [Google Scholar]
  13. Nordstrom, K.F. Beaches and dunes of human-altered coasts. Progr. Phys. Geogr. 1994, 18, 497–516. [Google Scholar] [CrossRef]
  14. Peterson, C.H.; Bishop, M.J. Assessing the Environmental Impacts of Beach Nourishment. BioScience 2005, 55, 887–896. [Google Scholar] [CrossRef]
  15. Roberts, T.; Wang, P. Four-year performance and associated controlling factors of several beach nourishment projects along three adjacent barrier islands, west-central Florida, USA. Coast. Eng. 2012, 70, 21–39. [Google Scholar] [CrossRef]
  16. Rahmstorf, S. A semi-empirical approach to projecting future sea-level rise. Science 2007, 315, 368–370. [Google Scholar] [CrossRef] [PubMed]
  17. Houston, J.; Dean, R. Erosional impacts of modified inlets, beach encroachment, and beach nourishment on the east coast of Florida. J. Coast. Res. 2015, in press. [Google Scholar] [CrossRef]
  18. Browder, A.E.; Dean, R.G. Monitoring and comparison to predictive models of the Perdido Key beach nourishment project, Florida, USA. Coast. Eng. 2000, 39, 173–191. [Google Scholar] [CrossRef]
  19. Davis, R.J.; Wang, P.; Silverman, B. Comparison of the performance of the three adjacent and differently constructed beach nourishment projects on the gulf peninsula of Florida. J. Coast. Res. 2000, 16, 396–407. [Google Scholar]
  20. Elko, N.A.; Holman, R.A.; Gelfenbaum, G. Quantifying the rapid evolution of a nourishment project with video imagery. J. Coast. Res. 2005, 21, 633–645. [Google Scholar] [CrossRef]
  21. American Shore and Beach Preservation Association (ASBPA). Reintroducing coastal structures for erosion control on the open coasts of America. Shore Beach 2011, 79, 62–67. [Google Scholar]
  22. Giannio, S.; Stevens, R.; Watts, G. Local financing for beach nourishment at Captiva Island, Florida. In Coastal Zone; Magoon, O., Converse, H., Miner, D., Clark, D., Tobin, L., Eds.; American Society of Civil Engineers: New York, NY, USA, 1985; Volume 85, pp. 2154–2170. [Google Scholar]
  23. Rudeen, K. Analysis of Proposed DeBordieu Groin and Beach Nourishment Project; Western Carolina University: Cullowhee, NC, USA, 2011; pp. 1–14. [Google Scholar]
  24. Walton, T.L. Littoral Drift Estimates along the Coastline of Florida; Sea Grant Report No. 13; Coastal and Oceanographic Engineering Laboratory, University of Florida: Gainesville, FL, USA, 1976. [Google Scholar]
  25. Dean, R.G. Investigation of Erosional Causes and Option for Big Hickory Island; Robert G. Dean: Gainesville, FL, USA, 2008. [Google Scholar]
  26. Dean, R.G. Compatibility of borrow material for beach fills. In Proceedings of the 14th Coastal Engineering Conference; American Society of Civil Engineers: New York, NY, USA, 1975; pp. 1319–1333. [Google Scholar]
  27. Morton, R.A.; Miller, T.; Moore, L. Historical shoreline changes along the US Gulf of Mexico: A summary of recent shoreline comparisons and analyses. J. Coast. Res. 2005, 21, 704–709. [Google Scholar] [CrossRef]
  28. Lentz, E.E.; Hapke, C.J.; Stockdon, H.F.; Hehre, R.E. Improving understanding of near-term barrier island evolution through multi-decadal assessment of morphologic change. Mar. Geol. 2013, 337, 125–139. [Google Scholar] [CrossRef]
  29. Weathers, H.D.; Voulgaris, G. Evaluation of beach nourishment evolution models using data from two South Carolina, USA beaches: Folly Beach and Hunting Island. J. Coast. Res. 2013, 69, 84–89. [Google Scholar] [CrossRef]
  30. Davis, R.A. Barriers of the Florida Gulf Peninsula. In Geology of the Holocene Barrier Island Systems; Davis, R.A., Ed.; Springer-Verlag: Berlin, Germany, 1994; p. 456. [Google Scholar]
  31. Hiland, M.; Byrnes, M.; McBride, R.; Jones, F. Change analysis and spatial information management for coastal environments. MicroStation Manag. 1993, 3, 58–61. [Google Scholar]
  32. Gorman, L.; Morang, A.; Larson, R. Monitoring the coastal environment; Part IV: Mapping, shoreline changes, and bathymetric analysis. J. Coast. Res. 1998, 14, 61–92. [Google Scholar]
  33. Boak, E.H.; Turner, I.L. Shoreline definition and detection: A review. J. Coast. Res. 2005, 21, 688–703. [Google Scholar] [CrossRef]
  34. Smith, G.L.; Zarillo, G.A. Calculating long-term shoreline recession rates using aerial photographic and beach profiling techniques. J. Coast. Res. 1990, 6, 111–120. [Google Scholar]
  35. Crowell, M.; Leatherman, S.; Buckley, M. Historical shoreline change: Error analysis and mapping accuracy. J. Coast. Res. 1991, 7, 839–852. [Google Scholar]
  36. Moore, L.J. Shoreline mapping techniques. J. Coast. Res. 2000, 16, 111–124. [Google Scholar]
  37. Moore, L.J.; Ruggiero, P.; List, J.H. Comparing mean high water and high water line shorelines: Should proxy-datum offsets be incorporated into shoreline change analysis? J. Coast. Res. 2006, 22, 894–905. [Google Scholar] [CrossRef]
  38. Florida Department of Environmental Protection (FDEP). Monitoring Standards for Beach Erosion Control Projects. 2014. Retrieved from Division of Water Resources, FDEP. Available online: http://www.dep.state.fl.us/beaches/publications/pdf/PhysicalMonitoringStandards.pdf (accessed on 19 December 2015).
  39. Dean, R.G.; Dalrymple, R.A. Field techniques and analysis. In Coastal Processes: With Engineering Applications; Davis, R.G., Dalrymple, R.A., Eds.; Cambridge University Press: Cambridge, UK, 2002; p. 47. [Google Scholar]
  40. Kraus, N.C.; Larson, M.; Wise, R.A. Depth of Closure in Beach-Fill Design, Coastal Engineering Technical Note CHTN II-40; U.S. Army Engineer Waterways Experiment Station, Coastal and Hydraulics Laboratory: Vicksburg, MI, USA, 1998. [Google Scholar]
  41. Jones, C. Big Hickory Pass, New Pass, and Big Carlos Pass Glossary of Inlets; Report No.8; Department of Coastal and Oceanographic Engineering, University of Florida: Gainesville, FL, USA, 1980. [Google Scholar]
  42. Church, J.A.; White, N.J. Sea-level rise from the late 19th to the early 21st Century. Surv. Geophys. 2011, 32, 585–602. [Google Scholar] [CrossRef]
  43. Olsen Associates Inc. Bonita Beach—Beach Restoration Project, Six-Months Post Construction Monitoring Report; Bureau of Beaches and Coastal Systems, Florida Department of Environmental Protection, and the Lee County Board of County Commissioners: Jacksonville, FL, USA, 1996. [Google Scholar]
  44. Dean, R. Cross-shore sediment transport processes. In Advances in Coastal and Ocean Engineering; Philip Liu, L., Ed.; World Scientific: Singapore, Singapore, 1995; pp. 159–220. [Google Scholar]
  45. Dean, R.G. Beach nourishment, theory and practice. In Advanced Series on Ocean Engineering; World Scientific: Singapore, Singapore, 2002; Volume 18, p. 399. [Google Scholar]
  46. Slott, J.M.; Murray, A.B.; Ashton, A.D.; Crowley, T.J. Coastline responses to changing storm patterns. Geophys. Res. Lett. 2006, 33, L18404. [Google Scholar] [CrossRef]
Figure 1. Big Hickory Island, FL survey plan with Google Earth image inset of Big Hickory Island location along the west Florida coast (yellow star).
Jmse 04 00014 g001
Figure 2. Photos of the king-pile groins on Big Hickory Island, FL.
Jmse 04 00014 g002
Figure 3. Morphologic changes of Big Hickory Island. (A) 1944 aerial photograph with the approximate 1958 shoreline shown as a white dashed line; (B) 1958 aerial photograph with the approximate 1980 shoreline shown as a white dashed line.
Jmse 04 00014 g003
Figure 4. Morphologic changes of Big Hickory Island. (A) 1970 aerial photograph with the approximate 1980 shoreline shown as a white dashed line (from [25] with permission from Pelican Landing Community Association); (B) 1980 aerial photograph with the approximate 1996 shoreline shown as a white dashed line.
Jmse 04 00014 g004
Figure 5. Morphologic changes of Big Hickory Island. (A) 1996 aerial photograph with the approximate 2005 shoreline shown as a white dashed line; (B) 2005 aerial photograph with the approximate 2012 shoreline shown as a white dashed line.
Jmse 04 00014 g005
Figure 6. Morphologic changes of Big Hickory Island between 2012 and 2015, represented by the Mean High Water (MHW) line surveyed bi-annually, shown on a 2012 aerial photograph.
Jmse 04 00014 g006
Figure 7. Time-series Mean High Water (MHW) shoreline changes at FDEP R-monuments and groin locations (Nov 2013–Nov 2014; Nov 2014–Nov 2015; Nov 2013–Nov 2015). Figure 6 illustrates shoreline position, whereas this figure quantifies the change.
Jmse 04 00014 g007
Figure 8. Time-series volumetric changes on Big Hickory Island, corresponding to FDEP R-monuments (Nov 2013–Nov 2014, Nov 2014–Nov 2015, and Nov 2013–Nov 2015).
Jmse 04 00014 g008
Figure 9. Conceptual model of the post-project generalized directions of sediment movement along Big Hickory Island, suggested from observations in this study.
Jmse 04 00014 g009
Table 1. MHW shoreline positions measured at the Florida Department of Environmental Protection (FDEP) R-monuments and changes from construction completion (November 2013) to November 2015. Shaded rows represent the project area.
MONMHW PositionMHW PositionMHW PositionTotal Change
2013-Nov (m)2014-Nov (m)2015-Nov (m)Nov 2013–Nov 2015 (m)
R222.546.054.141.9−4.1
R22358.439.329.8−28.6
R223.57.412.47.90.5
R224−7.1−10.1−11.7−4.6
R224.58.68.15.7−2.9
R225−1.6-3.05.97.5
Average (Standard Deviation, σ ) −5.4 (12.2)
Table 2. MHW shoreline positions* measured at within each groin cell and changes from construction completion (November 2013) to November 2015. *MHW positions measured from the MHW survey plan view (Figure 1).
Groin LineMHW PositionMHW PositionMHW PositionTotal Change
2013-Nov (m)2014-Nov (m)2015-Nov (m)Nov 2013–Nov 2015 (m)
G2-368.870.469.91.1
G3-479.673.072.0−7.6
G4-588.870.069.4−19.4
G5-6110.087.977.0−33.0
G6-7117.399.288.3−29.0
G7-8104.4109.798.4−6.1
BHI-1*−9.2−4.827.036.2
BHI-2*61.1107.7109.047.9
Average change within the groin field ( σ )−15.7 (4.2)
Average change including north end ( σ )−2.8 (8.9)
Table 3. Volumetric change measured at FDEP R-monuments from Nov 2013–Nov 2014, Nov 2014–Nov 2015, and Total (i.e., Nov 2013–Nov 2015).
MONVolume (m3)
Nov 2013–Nov 2014Nov 2014–Nov 2015Total
R222.5
−2085−5778−7863
R223
1926−6603−4678
R223.5
9568−20277542
R224
4395964491
R224.5
425117105960
R225

