Article

Variations in Microbial Community Structure through the Stratified Water Column in the Tyrrhenian Sea (Central Mediterranean)

1
Department of Animal Biology and Marine Ecology, University of Messina S. ta Sperone 31, Messina 98166, Italy
2
Institute for Coastal Marine Environment (IAMC), CNR, Spianata S. Raineri 86, Messina 98122, Italy
3
Aix Marseille Université, CNRS/INSU, Université de Toulon, IRD, Mediterranean Institute of Oceanography (MIO) UM 110, Marseille 13288, France
4
Ecosystems and Environment Group, Environment Centre Wales, Bangor University, Deiniol Road, Bangor, Gwynedd LL57 2UW, UK
*
Author to whom correspondence should be addressed.
J. Mar. Sci. Eng. 2015, 3(3), 845-865; https://doi.org/10.3390/jmse3030845
Submission received: 8 April 2015 / Accepted: 31 July 2015 / Published: 6 August 2015

Abstract

:
The central Mediterranean Sea is among the most oligotrophic habitats in the marine environment. In this study, we investigated the abundance, diversity and activity of prokaryoplankton in the water column (25–3000-m depth) at Station Vector (Tyrrhenian Sea, 39°32.050′ N; 13°22.280′ E). This specific water column consists of three different water masses (Modified Atlantic Water (MAW), Levantine Intermediate Water (LIW) and Tyrrhenian Deep Water (TDW), possessing a typical stratification of the Central Mediterranean basin. CARD-FISH showed that the metabolically-active fraction of bacterial populations exceeded the archaeal fraction along the whole water column, except at the deepest water masses. 16S rDNA and 16S rRNA clone libraries obtained from each type of water mass were used to analyse the prokaryoplankton community structure and to distinguish between active and “less active” microbial fractions. Our results showed that the rRNA-derived bacterial libraries seemed to be more depth specific compared to 16S rDNA-derived counterparts. Major differences were detected between the active fractions of bacterioplankton thriving in photic (25 m, MAW) and aphotic layers (500–3000 m, LIW and TDW respectively), whereas no statistically-significant differences were detected within the deep, aphotic layers (500–3000 m, LIW and TDW). Archaeal communities possessed more depth-specific distribution patterns with both total and active fractions showing depth stratification. Cyanobacteria and Marine Group II MAGII of Euryarchaea dominated the MAW prokaryoplankton. A notable fraction of Geitlerinema-related cyanobacteria was detected among the metabolically-active bacterial population recovered from the mesopelagic (500 m, LIW) aphotic layer, which is indicative of their mixotrophic behaviour. Heterotrophic Gammaproteobacteria and members of Marine Group 1.1a and the PSL12-related ALOHA group of Thaumarchaeota were both abundant in the aphotic layers (both LIW and TDW). Discrepancies observed between 16S rDNA- and 16S rRNA-based libraries are most likely linked to different physiological states of the prokaryoplankton community members recovered from different layers. Taking into account the relative homogeneity of the main physicochemical parameters throughout the whole water column, light and energy source are likely the most relevant environmental variables shaping microbial biodiversity through the Station Vector water column.

1. Introduction

Prokaryotes represent the major form of biomass in the oceans [1] and are important components of marine ecosystem by mediating biogeochemical cycles [2]. Prokaryoplankton composition is believed to result from selective environmental conditions, such as; resource availability and a combination of physical and hydrochemical factors. The structural changes in prokaryoplankton assemblage are typically more pronounced in regions characterized by a strong stratification [3]. Water masses differ in a number of parameters (organic matter content, quality and age, physical and hydrochemical settings) and are thought to be inhabited by structurally different prokaryotic assemblages, which possess diverse patterns of metabolic activity [4].
The advances in shotgun and next generation sequencing (NGS) techniques allow the detailed characterization of microbial populations, acquiring new information on the functional ecology of microbial communities thriving in different water layers [5,6,7,8,9]. However, it is worth noting that microbial biodiversity profiles obtained by 16S rRNA and functional gene annotation in deep-sea metagenomes were in general comparable to those obtained via the conventional 16S rRNA gene-based clone library approach, as used within this study, despite the large difference of the amount of data provided by NGS technology [7,8,10,11].
Previous studies that have investigated microbial community changes through the water column showed a general trend of decreasing prokaryoplankton abundance with increasing depth, along with a shift from a light-scavenging to a heterotrophic lifestyle [7,12,13].
More recently, physical factors, such as currents and oceanographic water masses, have been shown to be important in shaping community structure [13,14,15]. Studies on meso- and bathy-pelagic Atlantic Ocean metagenomes suggested that microbial population structure could be correlated with particular water masses, determining differences in microbial assemblages thriving at the same depths, but at different geographical location [16,17,18]. The studies performed in the Eastern Mediterranean Sea highlighted the localized distinctions between samples collected within the same water masses from different sampling stations, probably due to local chemical differences, such as organic matter load [12,13].
The Mediterranean Sea is characterized by a unique chemistry, including; high salinity (38–39 psu), elevated bottom water temperatures (13–14 °C) and ultra-oligotrophic conditions (extreme phosphorus and nitrogen limitations) [19]. These peculiar hydrochemical settings may select for distinct microbial communities throughout the water column, which are adapted for growth in nutrient-limited warm environments [13]. The aim of this study was to analyse prokaryoplankton community structure through the water column in the South Tyrrhenian Sea. The stratified water column at the sampling location known as Station Vector (39°32.050′ N; 13°22.280′ E) has been intensively studied in the past [20,21,22,23] and was chosen as a model site for this study. In this area, the Tyrrhenian Sea has a three-layered system, in which the uppermost layer (0–250 m) is occupied by the so-called Modified Atlantic Water (MAW), originating from water entering at Gibraltar from the Atlantic Ocean. The mesopelagic layer (250–700 m) is dominated by the Levantine Intermediate Water masses (LIW). The deeper bathypelagic layers (700–3300 m) are occupied by Tyrrhenian Deep Water (TDW) formed by the mixing of highly oligotrophic LIW with Western Mediterranean Dense Water (WMDW) [21,22].
In this study, to accurately interpret phylogenetic diversity patterns of stratified populations, we focused on the rRNA-containing, i.e., metabolically-active fraction of the prokaryoplankton. We hypothesized that physical and chemical variables of the stratified water column would shape the prokaryoplankton diversity. Accordingly, our objectives were: (1) to examine the effect of water stratification on prokaryotic diversity, abundance and activity; (2) to investigate whether the different taxonomic groups of bacterioplankton coexist together or apart from each other in the different water depths; and (3) to investigate the relationship between microbial community structure and the oceanographic parameters of the sampling site.

2. Experimental Section

2.1. Sampling Site and Sampling Procedure

Samples were collected from the Research vessel R/V Urania during the DEEP-PRESSURE cruise (December 2013). The study site of Station Vector with a maximum depth of 3300 m is located in the South Tyrrhenian Sea (39°32.050′ N; 13°22.280′ E). Water samples were collected from three different depths (25 m, 500 m and 3000 m), using a rosette sampler equipped with 12-L Niskin bottles (General Oceanics Inc., Miami, FL, USA) and a CTD unit (Sea-Bird Electronic, Bellevue, WA, USA) for monitoring salinity, temperature, transmission and pressure.
To isolate environmental DNA and RNA, 10 L of seawater were filtered through 47-mm diameter Nuclepore filters (0.22-μm pore size) (Sartorius, Goettingen, Germany ), which were immediately frozen at −70 °C in RNAlater solution (Ambion, Austin, TX, USA) until processing in the laboratory. For Catalyzed reporter deposition Fluorescence In Situ Hybridization (CARD-FISH), water samples were fixed with a particle-free paraformaldehyde solution (final concentration, 2% (vol/vol)) overnight at 4 °C. Afterwards, aliquots of 10, 40 and 120 mL, corresponding to the samples from 25-, 500- and 3000-m depths, were gently filtered onto white polycarbonate membrane filters (type GTTP; pore size, 0.22 μm; 47-mm diameter; Millipore, Darmstadt, Germany) and stored at −20 °C until further processing.
Determination of oxygen concentration was carried out using the Winkler method [24] with an automatic endpoint detection burette 716 DNS Titrino (Metrohm AG, Herisau, Switzerland). Samples for nutrient analysis were collected in 20-mL dark polyethylene (DPE) vials and immediately frozen in liquid nitrogen and then stored at −20 °C to await analysis. Nutrient concentrations were determined using a SEAL QuAAtro Microflow Analyzer (SEAL Analytical, Hampshire, UK). All running standards were prepared with low nutrient seawater and calibrated against Ocean Scientific Standards (OSIL, Hampshire, UK). Samples for dissolved organic carbon (DOC) analysis were collected in dark glass bottles rinsed 3–5-times with the water sample before storage. Samples were filtered through sterile 0.2-μm cellulose acetate membrane filters (SM 16534 K, Sartorius Minisart, Goettingen, Germany ) under low pressure, high-445 purity N2, and the filtered samples were stored in amber glass bottles at 4 °C in the dark until subsequent analysis. DOC measurements were carried out with a Shimadzu 5000A TOC Analyzer (Shimadzu, Kyoto, Japan) as described by [25], and concentrations were calculated according to [26].

2.2. Nucleic Acids Extraction and RT-PCR of Total RNA Templates

Genomic DNA and total RNA extractions from each sample were performed using an RNA/DNA mini kit (Qiagen, Hilden, Germany). The DNA and RNA quality of the samples was checked by performing agarose gel electrophoresis. Nucleic acid concentrations were determined using the NanoDrop ND-1000 Spectrophotometer (Thermo Scientific, Wilmington, DE, USA). Before the reverse transcription (RT) reaction, RNA templates were treated with DNase I (Invitrogen, Carlsbad, CA, USA) according to the manufacturer′s instructions. The 16S rRNA was converted to corresponding cDNA using SuperScript II Reverse Transcriptase (Invitrogen, Carlsbad, CA, USA) and the universal nucleotide primer 1492R (5′-TACGGYTACCTTGTTACGACT-3′) for Bacteria [27] and A958-R (5′-YCCGGCGTTGAMTCCAATT-3′) for Archaea [28]. Bacterial 16S rRNA genes were amplified from DNA and cDNA with the universal bacterial primer set 530F (5′-GTGCCAGCMGCCGCGG-3′) and 1492R [27], whereas the primer set A20F (5′-TTCCGGTTGATCCYGCCRG-3′) and A958R [28] was used for the amplification of the archaeal fraction of the microbial community. The PCR was performed using a 50-μL (total volume) mixture containing 1× Q solution (Qiagen, Hilden, Germany), 10× Qiagen reaction buffer, 1 μM of each primer, 10 μM dNTPs (2.5 μM of each nucleotide) (Gibco, Invitrogen, Carlsbad, CA, USA), 2.0 μL (40–50 ng) of DNA template and 2.0 U of Taq Polymerase (Qiagen, Hilden, Germany). The reaction started with a 3-min hot-start at 95 °C, continued with 30 cycles of 1 min at 94 °C, 1 min at 50 °C and 2 min at 72 °C and finished with a 10-min extension at 72 °C. PCRs without a previous RT were carried out using purified RNA as a template to control for DNA contamination. Polymerase chain reactions were performed in a Master Cycler 5331 Gradient (Eppendorf, Hamburg, Germany). Amplicons were analysed on agarose gels (0.8% w/vol), purified with QIAquick Gel Extraction Kit (Qiagen, Hilden, Germany), and the 16S rRNA gene fragments (about 900 base pairs for both Bacteria and Archaea) were cloned into the pGEM®-T EasyVector (Promega, Fitchburg, MA, USA) according to the manufacturer’s instructions. The resulting ligation products were used to transform Escherichia coli DH10B cells (Invitrogen, Carlsbad, CA, USA). One hundred white colonies from each clone library were randomly picked, and the cells were directly used in a PCR reaction with standard M13f and M13r primers under the conditions described above. Amplified inserts of expected sizes were identified by gel electrophoresis and subjected to further sequencing.

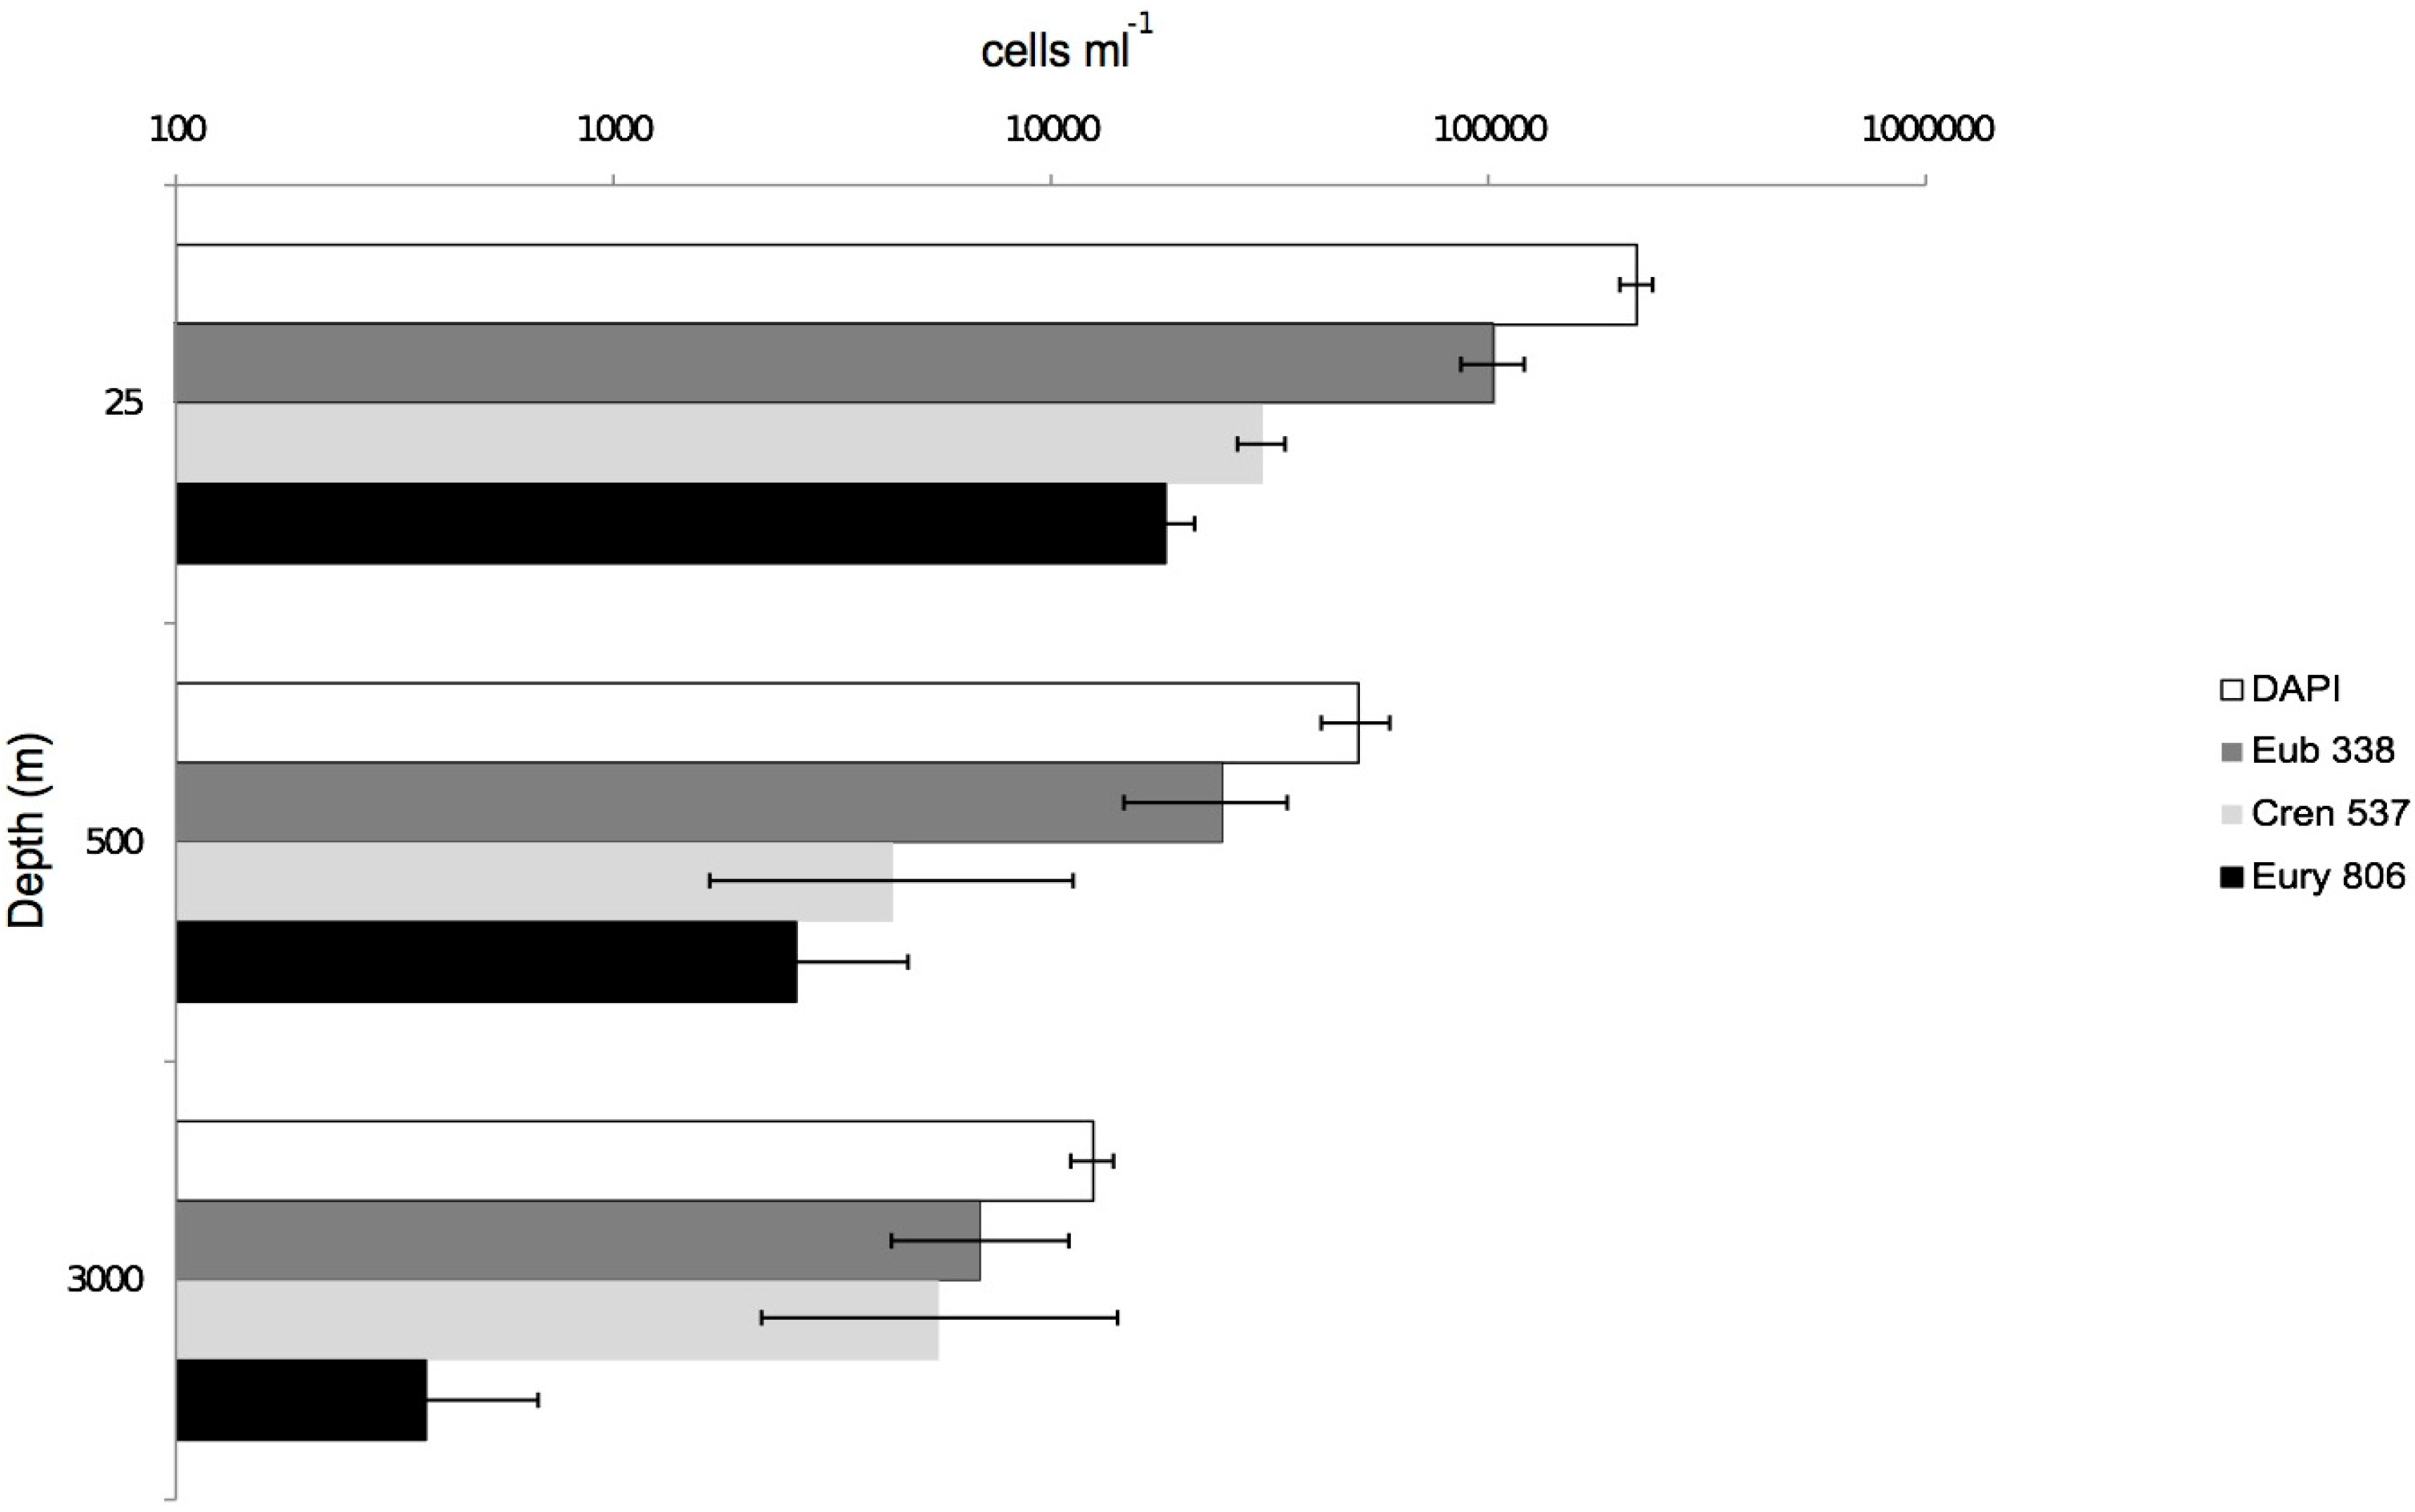
2.3. CARD-FISH Analysis

Filters for CARD-FISH counts were embedded in low-gelling point agarose (0.1% agarose, Sigma, St Louis, MO, USA), dried at 37 °C for 10 min and then dehydrated with 95% ethanol. To detect Bacteria, embedded cells were permeabilized by treatments with lysozyme (10 mg mL−1, Sigma, Saint Louis, MO, USA ) in 0.5 M EDTA, 0.1 M Tris-HCl (pH 8.0) for 60 min at 37 °C [29]. Filters were then treated as described by [30]. To detect Archaea, embedded cells were permeabilized with proteinase K (0.2 μL mL−1, Fluka-Sigma, Saint Louis, MO, USA) for 45 min at 37 °C as described by [31]. Filters were cut in sections and hybridized with 5′-horseradish peroxidase (HRP)-labelled oligonucleotide probes in the dark at 35 °C for 12 h according to [32]. Amplifications were done at room temperature for 20 min in the dark. Probes used through this work are listed in Table 1. After the hybridization and amplification steps, slides were examined under an Olympus BX61 microscope (Olympus Corporation, New York, NY, USA) equipped with a 100-W Hg lamp (Osram, Monaco di Baviera, Baviera, Germany) and appropriate filter (Olympus Corporation, New York, NY, USA) sets for DAPI (Olympus Corporation, New York, NY, USA) and Alexa488 (Olympus Corporation, New York, NY, USA). The fraction of positive CARD-FISH-stained cells (CARD-FISH+) was quantified in at least 1000 DAPI-stained cells per sample. Prior to counting, the slides were stored at −20 °C up to several days without any significant loss of fluorescence intensity. Negative control counts of hybridization with HRP-Non338 [33] averaged 1% and were always below 5% of the total DAPI-stained cells.
Table 1. 16S rRNA-targeted oligonucleotide probes used in this study.
ProbeSequence (5′ to 3′) of ProbeTarget Organisms% FormamideReferences
Eub338GCTGCCTCCCGTAGGAGTBacteria55(Amann et al., 1990) [29]
Cren537TGACCACTTGAGGTGCTGCrenarchaea20(Teira et al., 2004) [31]
Eury806CACAGCGTTTACACCTAGEuryarchaea20(Teira et al., 2004) [31]
Non338ACTCCTACGGGAGGCAGCFor non-specific probe binding55 (Wallner et al., 1993) [33]

2.4. Sequencing and Phylogenetic Analysis

Sequencing was performed with an ABI PRISM 3100-Avant Genetic Analyzer (PE Applied Biosystems, Foster City, CA, USA) using the ABI PRISM BigDye® Terminator v 3.1 Cycle Sequencing Kit (PE Applied Biosystems, Foster City, CA, USA). Sequences were checked for possible chimeric origin using the Bellerophon software [34]. Initial alignment of amplified sequences and close relatives identified with BLAST [35] were performed using the SILVA alignment tool [36] and manually inserted in ARB [37]. After alignment, the neighbour-joining algorithm and the Jukes–Cantor distance matrix of the ARB package were used to generate the phylogenetic trees based on distance analysis for 16S rRNA. One thousand bootstrap re-samplings were performed to estimate the robustness of the tree. Differences between DNA and RNA clone libraries were evaluated using the LIBSHUFF software [38], as previously described by [39].

2.5. Statistical Analysis

For statistical analysis, the clones from each library were considered to define phylotypes at 97% similarity [40,41]. The presence of library-specific phylotypes was further analysed by a total alignment. Clustering of sequences, rarefaction analysis, taxa, total clones, singletons, dominance, Shannon (H), equitability (E) and Simpson (D) chao1–2 indexes for each clone library were performed using the Dotur program [42]. Coverage values (C) were calculated to determine the efficiency of the different clone libraries. The coverage value is given as C = 1 − (n1/N), where n1 is the number of clones that occurred only once in the library (singletons ) [43]. To study the influence of depth on prokaryotic biodiversity at the three different sampling depths, the Primer 6 ecological software package [44] was employed to obtain the ANalysis Of SIMilarities (ANOSIM) test from DNA-RNA distance matrix [45]. The DNA-RNA distance matrix of sequences was obtained by MEGA5 software using the Jukes–Cantor method [46].

2.6. Nucleotide Sequence Accession Numbers

The sequences have been submitted to the GenBank database and assigned Accession Numbers KF001521–KF001628 for bacterial and KF001629–KF001698 for archaeal 16S rRNA gene sequences, respectively.

3. Results

3.1. Hydrological and Hydrochemical Conditions of the Sampling Site

The hydrological parameters of the sampling site Station Vector showed a typical winter stratification consistent for the Central Tyrrhenian Sea [47]. Seawater temperature ranged from 15.42, 13.99, up to 12.99 °C, as measured at the surface (25 m), 500-m and 3000-m depths, respectively. Salinity values were ranging between 38.08 psi (25 m) and 38.73 psi (500 m). At a 500-m depth, there was a minimum oxygen zone (3.94 mL L−1). The chosen depths of sampling were attributed to the major water masses, namely the surface layer (25 m) representing the MAW, whereas samples from 500-m and 3000-m depths were attributed to the LIW and TDW masses, respectively.
The superficial MAW mass at Station Vector was strongly depleted in all nutrients measured (0.5 μmol L−1 for nitrate; 1.1 μmol L−1 for silicates and 0.05 μmol L−1 for phosphate). The LIW mass showed an increase in nutrient levels compared to the overlying MAW mass with nitrate values measured at 6.2 μmol L−1. In addition, silicate and phosphate concentrations showed a similar increasing trend with concentrations of 5.9 μmol L−1 and 0.22 μmol L−1, respectively. The deeper TDW layer showed nutrient concentrations continuing to rise with values for nitrate, silicate and phosphate recorded at 8.1, 9.3 and 0.31 μmol L−1, respectively. The amount of DOC was higher in the surficial MAW layer (51 ± 8 μmol L−1) compared to the LIW (39 ± 6 μmol L−1) and TDW (45 ± 7 μmol L−1) layers.

3.2. CARD-FISH Distribution

The total amount of prokaryotic cells, as determined by DAPI staining, decreased from (21.86 ± 1.89) × 104 cells mL−1 in the shallow MAW layer (25 m) to (5.05 ± 0.9) × 104 and (1.25 ± 0.14) × 104 cells mL−1 in the LIW (500 m) and TDW (3000 m) layers, respectively. CARD-FISH-positive cells followed similar patterns. Moreover, CARD-FISH analysis indicated that the majority of epi- and meso-pelagic prokaryoplankton (found in the MAW and LIW layers, respectively) was metabolically active, because 84.5% and 78.7% of DAPI-stained cells were also stained by CARD-FISH in the MAW and LIW layers, respectively. This percentage reached 99.6% in the deep TDW layer, suggesting that the integral microbial population of the deepest layer were in an active metabolic state.
Figure 1. Distribution of total amount of prokaryotic cells counted as DAPI-stained cells (in white), CARD-FISH-positive Bacteria (in dark grey), Crenarchaea (in light grey) and Euryarchaea (in black) at the Station Vector site in December 2013, for 25 m (Modified Atlantic Water (MAW)), 500 m (Levantine Intermediate Water (LIW)) 3000 m (Tyrrhenian Deep Water (TDW)).
Jmse 03 00845 g001
As detected by CARD-FISH analysis, the metabolically-active epipelagic prokaryoplankton found in the MAW layer was dominated by bacteria ((10.37 ± 1.71) × 104 cells mL−1), followed by Crenarchaea ((3.05 ± 0.38) × 104 cells mL−1) and Euryarchaeota ((1.83 ± 0.30) × 104 cells mL−1) (Figure 1). The bacterial density decreased gradually with depth, and in the deep TDW, values dropped to approximately 20-times lower than those detected in the surface waters (MAW). The archaeal fraction of prokaryoplankton followed the same negative trend, though to a lesser extent, and in the deepest layer (TDW), both Archaea and Bacteria were represented equally (52.4% ± 8.5% versus 47.2% ± 3.7%) (Figure 1).

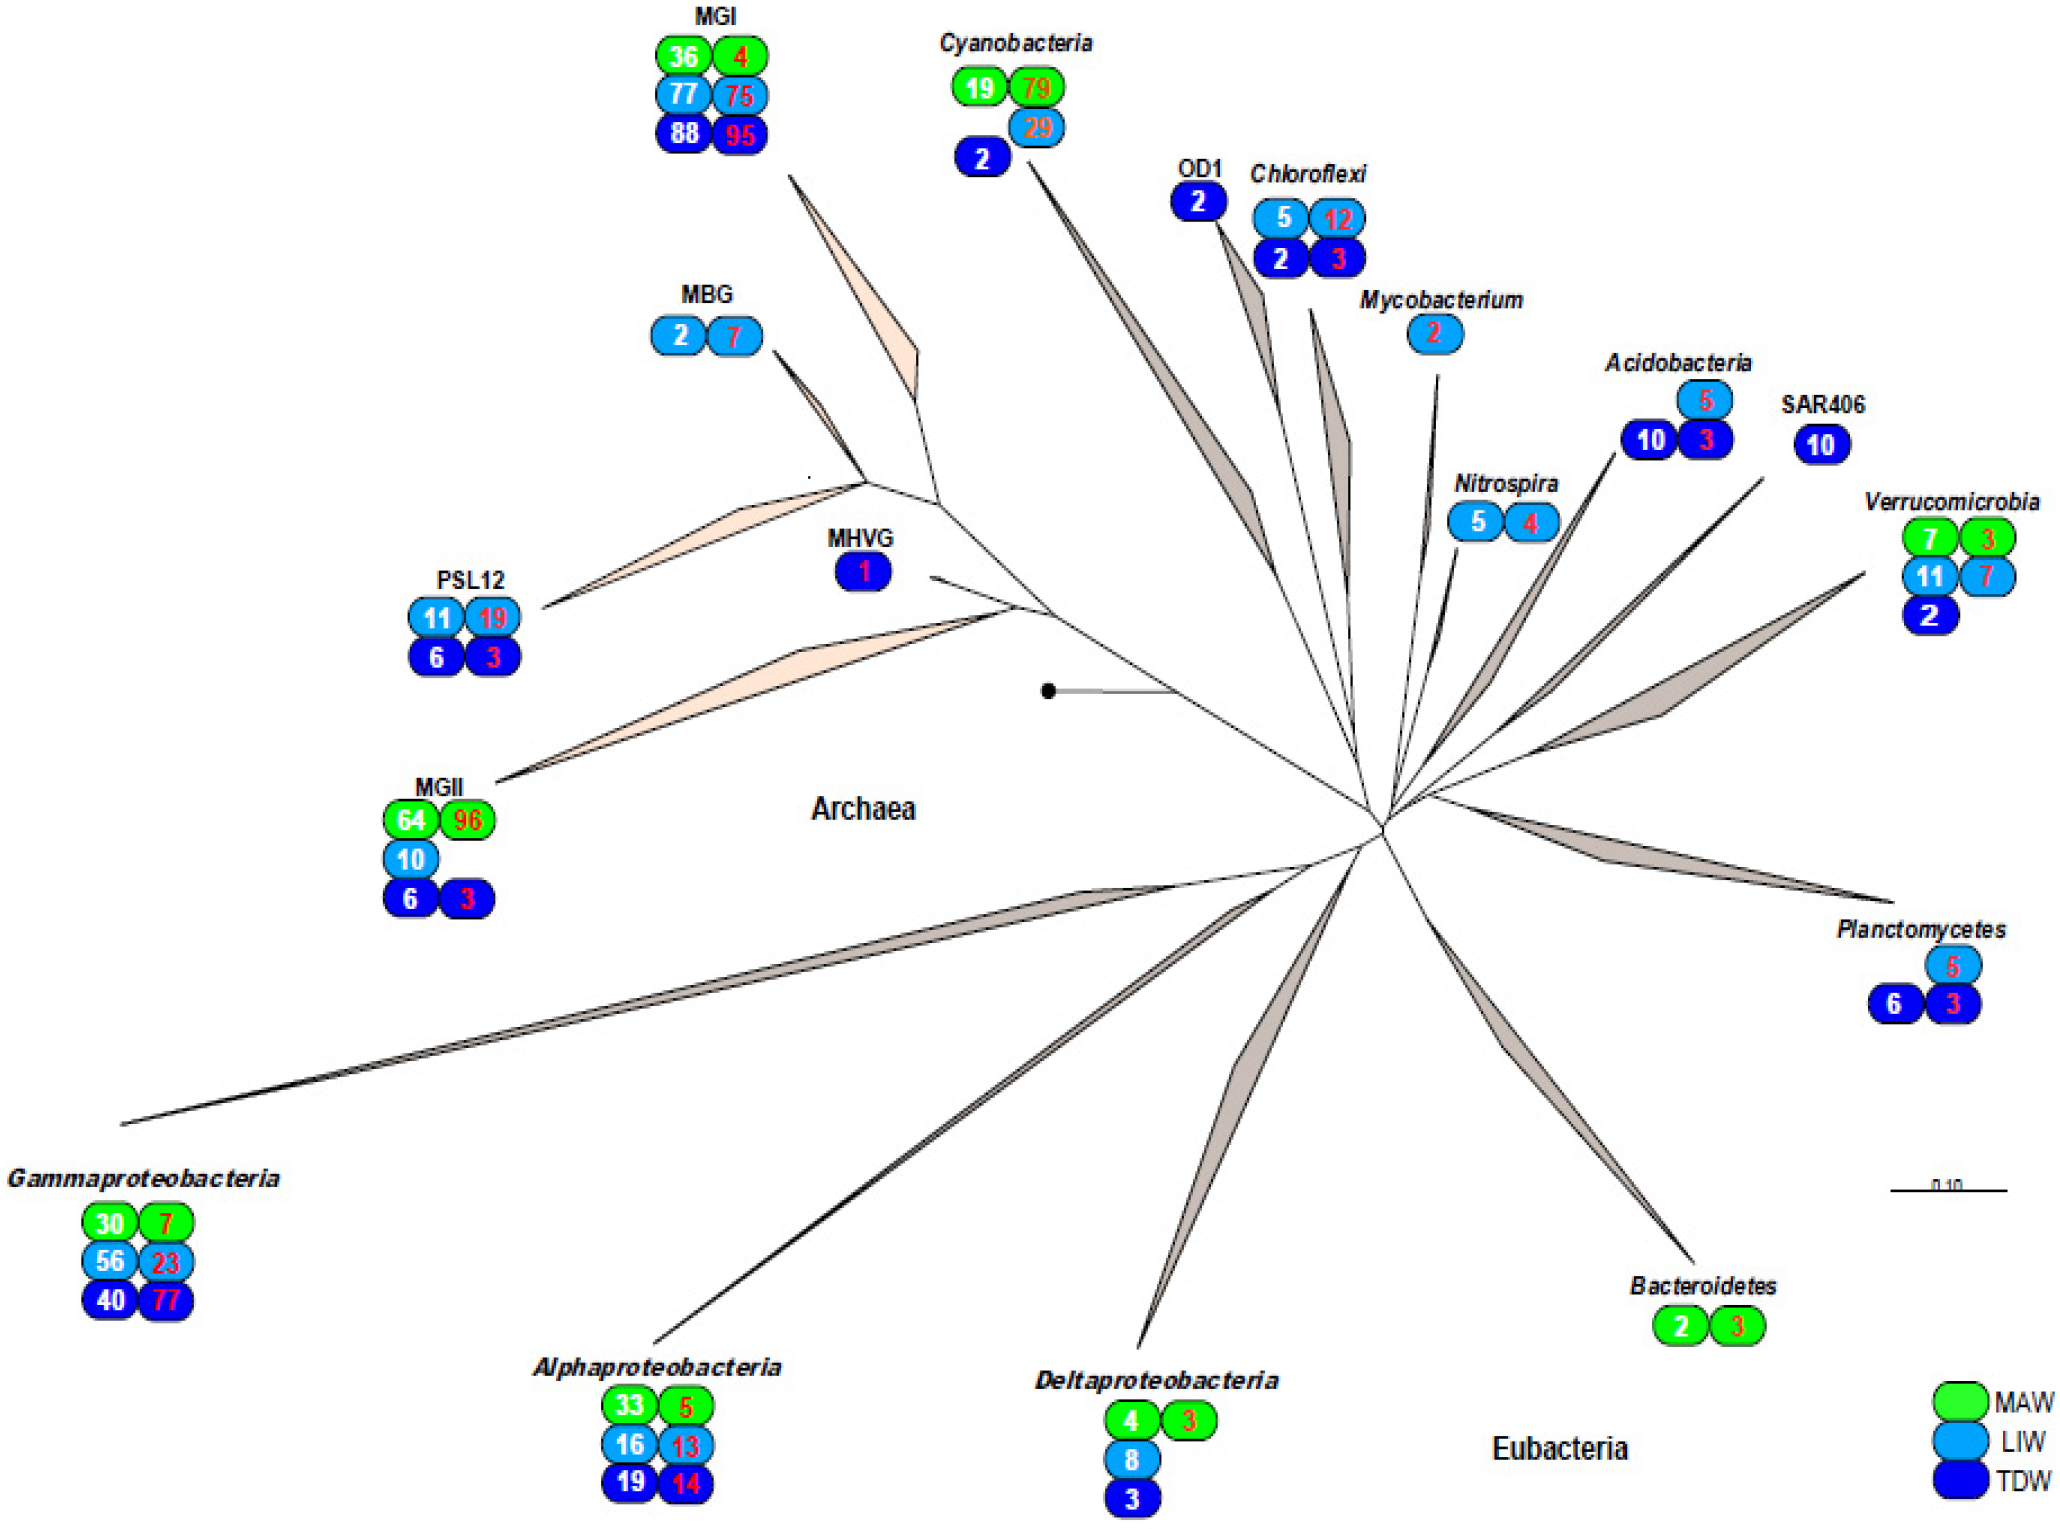
3.3. Phylogenetic Analysis of 16S rDNA and 16S rRNA Bacterial Clones Retrieved from Different Depths

In the present study, we retained a 99% similarity as a suitable cut-off for identification at the species level and a 97% similarity as a suitable cut-off for identification at the genus level. The phylogenetic analysis of 418 clones obtained from six bacterial clone libraries revealed their distribution within 86 separated lineages (≥97% sequence similarity), belonging to 18 major prokaryotic taxa (Table S1; Figure 2).
Figure 2. Phylogenetic affiliation and relative abundance of archaeal and bacterial clones from the Station Vector water column classified at the class/phylum level. The numbers below each class/phylum represent the percentages of each phylogenetic group detected in either 16S rDNA (white numbers) or 16S rRNA (red numbers) clone libraries obtained from three depths: MAW (green), LIW (blue) and TDW (dark blue). The scale bar represents the expected numbers of changes per nucleotide position. Abbreviations used: OD1 (candidate division OD1); MGI (Marine Group I); MBG (Marine Benthic Group); MGII (Marine Group II); MHVG (Marine Hydrothermal Vent Group).
Jmse 03 00845 g002
Among these taxa, only Alpha- and Gamma-proteobacteria and Thaumarchaeota of Marine Group I were detected in all libraries. Comparative alignment of the Gammaproteobacteria clones revealed their clustering at a ≥97% level within 23 different (phylotypes) (Figure S1). Many of them were found as depth-specific phylotypes. This is exemplified by the superficial MAW water mass of Station Vector being inhabited by the genus Umboniibacter (three clones) and uncultured clades SAR86 and OM60 (ten and two clones, respectively); these were not detected in the deeper LIW and TDW masses. In contrast, sequences affiliated with the families Alteromonadaceae, Alcanivoraceae, Halomonadaceae, Pseudomonaceae and the order Thiotrichales were found only in the bathypelagic TDW (Table 2).
Table 2. Identification of representative phylogenetic groups obtained from clustering of rDNA and rRNA bacterial clone sequences from different depths (MAW = 25 m; LIW = 500 m; TDW = 3000 m).
Bacterial or Archaeal DivisionGenus/CladeClosest Relative (EMBL Accession No.)% IdentityMAWLIWTDW
GammaproteobacteriaSAR 86Clone S23_686 (EF572587)998D-2R
JL-ENTP-VEClone HOT157_350m7 (JN166339.1)1002D-2R
AlteromonadaceaeAlteromonas macleodii str. “Deep ecotype” (CP001103)99 10D3D-17R
OM60 cladeClone SHTA403 (GU235460)972D
UmboniibacterUmboniibacter marinipuniceus strain: KMM 3891 (AB467279)993D
PseudospirillumClone HOT157_350m9 (JN166361)992D-2R2D
E01-9C-26Clone ASTS_SIM_500m_310 (KJ589919)992D5D-1R1D
E01-9C-26Clone PRTBB84 (HM798879)98 2D-1R1D
AlphaproteobacteriaSAR 11Clone C146Chl358 (JX530113)995D3D
SAR 11Clone C146300253 (JX530857)99 2D1D
SAR 11Clone PRTAB7655 (HM798613)983D3D1D
DB1-14Clone HglFeb5D7m (JX017019)985D-1R
AEGEAN-169Clone SPOTSFEB02_70m27 (DQ009450)972D2D
AEGEAN-169Cone 20162U78 (EU237459)992R
S25-593Clone CTD005-32B-02 (DQ513053)99 4D-1R
SAR 116Clone 20154U16 (EU237278)995D-1R
SAR 116Clone SPOTSAUG01_5m101 (DQ009267)993D
DeltaproteobacteriaSAR 324Clone SHAB608 (GQ348695)992D-2R
OM27Clone 52-3-11 (JN018836)99 2D
Planctomycetes Clone OS2BR2-03 (JN233146)99 2R
Verrucomicrobia Clone SPOTSMAY03_150m14 (DQ009456)98 2D
Acidobacteria Clone J8P41000_1H01 (GQ351195)97 2R2D-2R
Nitrospira Clone HMMVPog-53 (AJ704710)95 2R
Chloroflexi Clone SAR250 (AY534097)99 2R
Clone CTD005-79B-02 (AY704386)100 1R1D-2R
CyanobacteriaProchlorococcusProchlorococcus marinus str. NATL2A (CP000095)10010D-32R
SynechococcusSynechococcus sp. RS9920 (AY172830)996D-6R
GeitlerinemaGeitlerinema sp. A28DM (FJ410907)100 18R
ThaumarchaeotaMGIClone HF770_015N17 (DQ300532)99 9D-1R2D-2R
MGIClone TS_HP_RNAA_69 (AM937105)99 9D-5R8R
MGIClone KM3_193_A03 (KF900772)99 10D-4R
MGIClone MT793-NA08 (AB193963)99 2D-6R
MGIClone SC5_2222_T2_E3 (KJ814656)99 33D-19R14D-69R
MGINitrosopumilus maritimus SCM1 (NR_102913)9913D-8R 1D
CrenarchaeotaMBGClone TS_NB_DNAA_125 (AM937086)99 1D-4R
PSL12Clone TS_HP_RNAA_67 (AM937090)100 2R
PSL12Clone TS_NB_RNAA_25 (AM937096)100 3R1D
PSL12Clone TS_NB_DNAA_66 (AM937087)99 4D-3R
EuryarchaeotaMGIIClone HF70_25A12 (DQ156469)994D-10R
MGIIClone HF200_89A11 (DQ156453)996D1D
MGIIClone HF770_037J18 (DQ300558)992D-5R
MGIIClone KM3-136-D10 (EF597686)991D-1R1D
MGIIClone HF4000_48H06 (DQ300561)99 4D2D-2R
MGIIClone PD_18 (JX103589)988D-2R
Phylogenetic group or phylotype: a clone group with sequence similarity higher than 97%. Abbreviations used: MGI (Marine Group I); MBG (Marine Benthic Group); MGII (Marine Group II); D (16S rDNA-derived sequences); R (16S rRNA-derived sequences); numbers before D or R indicate the absolute abundances of clones found in each library. EMBL: European Molecular Biology Laboratory.
The finding of the genus Umboniibacter in the surficial MAW layer is rather unusual, as it was first isolated from the marine mollusc Umbonium costatum [48]. However, this microorganism has the ability to utilize different types of carbohydrates as a carbon source, which are commonly found in surficial water [21,48].
Among all Gammaproteobacteria-related organisms, only representatives of the uncultured group E01-9c-26 were found along the entire water column in both types of libraries. In contrast, the clade K189A was found only in rDNA-derived libraries, whereas the clades SVA0071 and ZD0405 were detected in the rRNA-derived LIW library (Figure S1).
Alphaproteobacteria-related 16S rDNA sequences formed the second taxon found at all depths in significant amounts (Table S1). Remarkably, one third of all rDNA clones retrieved from the surface MAW layer belonged to this taxon; however, in the corresponding rRNA library, these organisms accounted for only 5%. In the deeper water masses, Alphaproteobacteria-related organisms were distributed more equally in both types of libraries (Table S2). In total, 15 and four phylotypes, belonging to seven uncultivated clades and to the family Rhodospirillaceae, respectively, were identified in bacterial libraries (Figure S2; Table 2).
SAR11 clade-related organisms constituted the most abundant group detected throughout the whole water column. Further phylogenetic analysis revealed that these organisms were sub-divided into three phylotypes, and only one was found to be ubiquitous. An additional two phylotypes were identified as being layer-/depth-specific (Figure S2). The clades AEGEAN-169 and SAR116 were mainly attributed to the superficial water MAW mass. The remaining clades of uncultured Alphaproteobacteria (E60D10, DB1-14, MNG3 and S25-593) exhibited depth-specific distribution (Figure S2). Four different phylotypes of Deltaproteobacteria-related sequences were recovered from all sampled layers, although abundances never exceeded 8%. Two of the phylotypes, belonging to the SAR324 clade, were identified in MAW and LIW layers, whilst the OM27 clade and JS624-8 groups were found only in LIW and TDW masses, respectively (Figure S3; Table 2). It is worth mentioning that the metabolically-active fraction of Deltaproteobacteria was detected only in the photic MAW layer. In general, more than 70% of all 16S rRNA epipelagic clones obtained from the surface MAW layer were related to Synechococcus and Prochlorococcus; the cyanobacterial genera frequently recovered from superficial seawater [49,50]. The Cyanobacteria-related sequences also dominated the mesopelagic LIW zone, where almost a third (29%) of all 16S rRNA clones were attributed to the genus Geitlerinema (Figure S4), a cyanobacterium previously found only in the euphotic zone [49]. Hydrochemical conditions observed in the sampling site include a lack of strong vertical mixing of water masses, thus giving the study area a typical winter stratification common for the Central Tyrrhenian Sea [47]. Such deep distribution of this phototrophic organism could be explained by its capability to sustain a mixotrophic lifestyle, a common feature among cyanobacteria [43].
All remaining bacterial groups detected in analysed clone libraries had low abundance, which did not exceed 12%. Verrucomicrobia-related clones were obtained from all depths, with a maximum abundance of 11% detected at intermediate LIW zone. Other groups were found to be depth-specific. In particular, members of the class Flavobacteria and a small fraction of 16S rDNA clone sequences (4%) affiliated with eukaryotic plastids were found only in the superficial MAW layer. Members of Chloroflexi and Acidobacteria were found in both the LIW and deeper TDW layers. Noteworthy, only three clones affiliated with an uncultured Acidobacteria (similarity 99%) were found in meso- (LIW) and bathy-pelagic (TDW) rRNA libraries. These sequences, likely belonging to deep-sea-adapted organisms, were previously found in deep, bathypelagic seawater and sediments of the South Atlantic Ocean and Eastern Mediterranean Sea [10,51].
Finally, uncultured marine group SAR 406 and candidate division OD1, Planctomycetes and Nitrospira were mainly represented by TDW-specific phylotypes (Figure S4).

3.4. Phylogenetic Analysis of 16S rDNA and 16S rRNA Archaeal Clones Retrieved from Different Depths

The total of 314 clones analysed in six 16S rDNA- and16S rRNA-derived libraries were clustered within 38 different archaeal phylotypes (≥97% of similarity was used as a cut-off). They were unevenly distributed within five groups of higher taxonomic rank belonging to typically marine Eury- and Thaumarchaeota (Figure 2; Tables S1 and Table 2).
Marine Group II (MGII) of Euryarchaeota was the most heterogeneous group with 17 different phylotypes recovered mainly from the superficial MAW layer (more than 80% of all MGII-related phylotypes). This group of organisms dominated both types of MAW clone libraries covering 64% and 96% of all rDNA and rRNA analysed sequences, respectively. According to data obtained by CARD-FISH analysis, in the deeper layers of the water column, these values dropped to less than one-tenth of all clones analysed in LIW and TDW 16S rDNA libraries. Fifteen MGII phylotypes were recovered only in MAW, whereas two MGII-related phylotypes were detected both in MAW and LIW, and only one phylotype was found in both the LIW and TDW libraries (Figure S5). All remaining archaeal clones recovered from the surface MAW mass were affiliated with the Marine Group I (MGI) of mesophilic marine Thaumarchaeota (Figure S5). Being in the minority in the surface MAW layer, members of this group became dominant in meso- (LIW) and bathy-pelagic (TDW) layers reaching 76% and 91%, respectively, for all analysed archaeal clones. Comparative alignment of MGI-related clones revealed that they were grouped within 12 phylotypes possessing different depth-specific behaviours (Figure S5; Table 2). Only two phylotypes were detected in superficial water masses (MAW), although other sequences clustered in these phylogenetic groups were previously detected in deep-sea environments deeper than 3000 m [10]. The remaining phylotypes, which formed more than 65% of total clones analysed in 16S rDNA and rRNA libraries, belonged to MGI-related phylotypes of Thaumarchaeota and were found both in the intermediate LIW layer and the deeper TDW layer. For this cluster of marine mesophilic archaea, the lifestyle adapted to deep-sea habitats has already been demonstrated previously [20,52,53,54,55].
The clade PSL12-related clones revealed a deep-sea adaptation and were found only in LIW (19%) and TDW (6%) libraries. At greater resolution, the PSL12 sequences were clustered into six different depth-specific phylotypes, with only one phylotype found to be ubiquitous to both LIW and TDW layers. Less than 4% of clones related to marine benthic groups were found as a monophyletic group in LIW, whilst only a single clone affiliated with euryarchaeal Marine Hydrothermal Vent Group (MHVG) was recovered from the rRNA library at the deep TDW layer (Figure S5). Similarly to the previous group, members of this clade are preferentially found in meso- and bathy-pelagic oceanic realms all over the world, including the Mediterranean Sea [10,20].

3.5. Rarefaction Analysis, Diversity Index and Coverage Values of Analysed Clone Libraries

As shown in Table S2, diversity, dominance and coverage indices have been calculated for each of the twelve bacterial and archaeal libraries. After applying the cut-off values for a genus member (≥97% similarity), the generated curves for bacteria did not demonstrate saturation in any of produced libraries (data not shown); consequently, these results need to be treated with caution, in order to avoid over-interpretation of the results. This finding was further confirmed by the low mean coverage values found (0.53–0.71). Equitability values varied from 0.9342 to 0.8283, which were both detected from epipelagic (MAW layer) bacterial communities. As indicated by low dominance index values (0.0361–0.124), no single monophyletic group at the species level was found to be dominant. Chao1 and Chao2 showed elevated values throughout the whole water column ranging from 69 to 86.1 in LIW to >215.3 in TDW for chao1 and 64.6–76.9 up to >150 for chao2 at the same depths. The highest values were observed in TDW libraries 215.3–343.5 and 150–181, respectively, for Chao1 and Chao2. Thus, the most heterogeneous bacterial community of the Station Vector water column was found in the bathypelagic TDW layer.
In contrast to bacteria, the rarefaction analysis performed on archaeal libraries revealed that their diversity was sufficiently covered, especially in the case of LIW and TDW archaeal communities (data not shown). The highest number of missing species [56] was detected in the surface MAW layer, with Chao1 showing the highest value (307) (Table S2). The coverage values were much higher in deeper layers (both LIW and TDW, respectively), with values >0.9 for both rDNA and rRNA libraries, confirming that a significant fraction of total meso- and bathy-pelagic archaeal diversity was covered. The dominance index values showed that archaeal populations throughout the water column lacked a dominant species (≤97% of similarity), with the exception of the metabolically-active fraction of the TDW community (dominance 0.794), which was dominated by one site-specific MGI phylotype (R3000_A24_50) [20].

3.6. Cluster Analyses of Clone Libraries

The LIBSHUFF method was used to compare the 16S rDNA- and rRNA-derived clone libraries and to determine the significance of observed differences (Table 3). The analysis revealed that for all three sampling depths, the bacterial rDNA-based clone libraries were composed of significantly-different phylotypes to those obtained from the corresponding rRNA-based libraries (p = 0.001 for each combination). Obviously, these differences could be partially explained by the higher degree of bacterial 16s gene diversity and the possibility that bacterial diversity should not be totally covered by clone libraries investigation. Nevertheless, the differences between rDNA- and rRNA-derived libraries are not constant along depths. The highest divergence values were detected between 16S rDNA- and rRNA-derived MAW and TDW clone libraries (delta-C of 6.198 and 7.647, respectively). In contrast, comparative analysis of the epi- and bathy-pelagic archaeal clone libraries, from the MAW and TDW layers, respectively, revealed no significant differences between the metabolically-active and total archaeal communities (p-values of >0.05 for MAW and TDW) and more than 85% of shared sequences.
In absence of strongly-dominating phylotypes, the total and metabolically-active fractions of the archaeal community detected in the LIW layer showed a greater divergence (p = 0.002 and a delta-C of 0.511).
Table 3. LIBSHUFF results between bacteria and archaeal clone libraries obtained from different depths in Station Vector; (D: 16S rDNA-derived library; R: 16S rRNA-derived library).
LIBSHUFF results between bacterial librariesdelta-Cp-valueLIBSHUFF results between archaeal librariesdelta-Cp-value
MAW 25 m (DNA vs. RNA)6.1980.001MAW 25 m (DNA vs. RNA)0.0190.824
LIW 500 m (DNA vs. RNA)3.5280.001LIW 500 m (DNA vs. RNA)0.5110.002
TDW 3000 m (DNA vs. RNA)7.6470.001TDW 3000 m (DNA vs. RNA)0.0900.037
Sampling depth was investigated by the ANOSIM analysis and selected as the eventual factor, which may influence the observed microbial biodiversity. For this purpose, the 16SrDNA- and 16S rRNA-derived libraries were analysed separately. Taking all bacterial 16S rDNA clones into analysis, no statistical differences were detected between total bacterial communities throughout the whole water column (global R of 0.048 and p = 0.8). Pairwise testing confirmed these results, giving the values of global R between 0.000 and 0.077 and p ≥ 0.3 (Table 4). In contrast, the ANOSIM analysis performed on 16S rRNA libraries revealed that bacterial communities recovered from different depths were statistically different (global R = 0.302 and p = 0.1). The pairwise testing showed significant differences between MAW and LIW masses and between MAW and TDW mass libraries (R = 0.311 and 0.409 respectively with p = 0.1) (Table 4).
The ANOSIM analysis of archaeal libraries was separately carried out on 151 and 162 clones from 16S rDNA- and 16S rRNA-derived libraries, respectively. The total and metabolically-active fraction of archaeal communities showed significant stratification with depth (global R = 0.378 and 0.476, respectively at p = 0.1) (Table 4). In addition, the pairwise testing of both 16S rDNA and 16S rRNA archaeal clone libraries also confirmed this stratification. As seen with the distribution of metabolically-active bacteria, clear differentiation between MAW and LIW masses and between MAW and TDW masses was identified (R ≥ 0.446 and p = 0.1). The differences dramatically decreased when comparing meso- (LIW) and bathy-pelagic (TDW) libraries, where the ANOSIM test showed no statistically-significant differences (p ≥ 0.9).
Table 4. ANOSIM result between bacterial and archaeal clone libraries obtained from different depths in Station Vector; (D: 16S rDNA-derived library; R: 16S rRNA-derived library). For reference, MAW = 25 m, LIW = 500 m and TDW = 3000 m.
BacteriaR statisticSignificance level of sample statistic (%)ArchaeaR statisticSignificance level of sample statistic (%)
DNA-derived libraries0.0480.8DNA-derived libraries0.3780.1
MAW, LIW(D)0.0530.3MAW, LIW (D)0.4460.1
MAW, TDW(D)0.0770.5MAW, TDW (D)0.4700.1
LIW, TDW (D)0.00046.4LIW, TDW (D)−0.00757.2
RNA-derived libraries0.3020.1RNA-derived libraries0.4760.1
MAW, LIW (R)0.3110.1MAW, LIW (R)0.6840.1
MAW, TDW (R)0.4090.1MAW, TDW (R)0.8420.1
LIW, TDW (R)0.03715.2LIW, TDW (R)0.0390.9

4. Discussion

The present study focused on a 16S rRNA-based phylogenetic survey of bacterial and archaeal populations collected from three different depths (25 m, 500 m and 3000 m), which represent the three main water masses found at the Station Vector site in the South Tyrrhenian Sea. This station is located in the deepest and in the most isolated basin of the Western Mediterranean Sea [22]. In spite of its marginal position, it plays an important role in the Mediterranean circulation, because of the permanent presence of these three water masses. As highlighted by the LIBSHUFF method, the differences between bacterial total community and the metabolically-active fraction, respectively represented by the 16S rDNA- and 16S rRNA-based clone libraries, were higher in the epi- (MAW) and bathy-pelagic (TDW) layers compared to the mesopelagic water masses (LIW).
In total, 86 different phylogenetic bacterial groups were identified in 16S rDNA clone libraries. More than 80% of them showed a depth-specific distribution. Comparative analysis of 16S rRNA-derived libraries indicated an even stronger stratification of the metabolically-active fraction of microbial communities, with no single bacterial phylotype present at all three depths. The discrepancy between total and active fractions, i.e., 16S rDNA- and rRNA-containing fractions, of bacterioplankton, respectively, was additionally confirmed by the ANOSIM test. Statistically-acceptable differences between bacterial communities identified at different depths were found only in the active fraction, especially between communities thriving in photic and aphotic layers. Aphotic layers, including LIW and TDW, harbour a more homogeneous population with several organisms able to survive both at 500- and 3000-m depths.
It is worth noting that using clone libraries has some limitations, mainly low numbers of sequences, so there can be some element of underestimating the microbial diversity.
The depth-specificity of microbial populations was evidenced by the phylogenetic affiliation of all bacterial clones analysed. Most of the sequences found in the photic zone were affiliated with bacteria typically detected in superficial water down to 200 m [49,50,57,58]; In fact, the MAW active fraction was dominated by Synechococcus and Prochlorococcus cyanobacteria genera, and the LIW active community was formed abundantly by another cyanobacteria Geitlerinema. Different requirements for light intensity or slight differences in nutrient concentration, or indeed, the selective pressure from viruses, or other predators could determine this microbial stratification. In the aphotic layers, the abiotic factors that could potentially influence microbial populations are weaker, with temperature and nutrient concentration presenting a more homogeneous trend. The majority of clones recovered from the Station Vector deep layers (LIW and TDW masses, respectively) was related to deep-sea microbiota detected at different bathypelagic depths (up to 3500 m), in deep-sea marine sediments, microbial mats, abyssal plain in the Northeast Atlantic and deep-sea ridge flank crustal fluid in the Northeast Pacific oceans (Figures S1–S4) [53,59,60]. Archaeal communities in the Station Vector water column were found to be depth specific in both types of clone libraries. Remarkably, the LIBSHUFF method showed statistically-insignificant differences between the 16S rDNA and 16S rRNA libraries collected at the same depths, generally exhibiting low diversity with more than 85% of sequences shared. As seen with the bacterial data, members of the Archaea possessed a depth-dependent succession of community profiles (Figure S5) [20,22,52,61]. Light requirement seemed to be the dominant factor describing the trend with more than 80% of all MGII-related phylotypes mainly confined to epipelagic prokaryoplankton found within the MAW mass.
Although the metabolic capability of this group of organisms is still relatively unknown, their higher abundance in the euphotic zone (MAW mass), confirmed by CARD-FISH analysis, coincides with the presence of proteorhodopsin-like genes in their genomes, which may suggest a phototrophic or light-scavenging metabolism [52,61]. Below the photic zone, archaeal communities tended to be more homogeneous, highlighted by the presence of a cluster of marine mesophilic archaea, which are preferentially found in meso- and bathy-pelagic oceanic realms all over the world, including the Mediterranean Sea (Figure S5) [20,52,54,55,61,62].
Our results from a combined analysis using both 16S rDNA and 16s rRNA clone libraries and also quantitative CARD-FISH analysis showed that the prokaryoplankton communities of the Station Vector site showed evidence for microbial stratification, corresponding to the different defined water masses. Looking at both DNA- and 16S rRNA-containing fractions of prokaryotic populations, their biodiversity changes through the water column with depth, and the epipelagic (MAW) prokaryoplankton community, especially its metabolically-active fraction, is very different from those found in deeper layers (LIW and TDW masses). This finding is consistent with the fact that among all environmental parameters shaping microbial biodiversity in an open ocean ecosystem, light, serving as an energy source, is the most important factor, followed by temperature and pressure [20,63,64].
The Mediterranean Sea presents a unique marine ecosystem due to it being characterized by the persistence of warm (≥13 °C) water masses down to bathyal and abyssal (>4000 m) depths. This fact places the Mediterranean Sea apart from the majority of oceanic aphotic realms (≥200–500-m depth), which are permanently cold habitats (≤2–4 °C). As is well known, low temperature is a crucial parameter that requires specific molecular adaptations. Thus, in most bathypelagic habitats, this factor prevents the metabolism of many microbes, which often come from warm superficial water masses above [64,65].
The homogeneous water temperature throughout the three investigated water masses allowed metabolic activity by a wider range of prokaryotes down to deeper strata. Energy source availability was possibly the predominant factor in determining community structure and lifestyles in the deep Mediterranean Sea, whereas depth and increasing pressure would seem less critical, at least down to about 4000 m.

5. Conclusions

The central Mediterranean Sea is among the most oligotrophic marine habitats on our planet. Hydrological characterization of the sampling site at Station Vector (Tyrrhenian Sea, 39°32.050′ N; 13°22.280′ E) showed a typical winter stratification consistent for the Central Tyrrhenian Sea. According to abiotic factors, the diversity and activity of prokaryoplankton in the whole water column (0–3000 meters) showed a marked stratification, especially regarding the active fraction of microbial communities thriving in photic and aphotic layers. The photic zone was characterized by a prevalence of phototrophic cyanobacteria and light-scavenger Euryarchaeota, whereas heterotrophic bacteria and Thaumarchaeota dominated all aphotic layers. The unique characteristic of the Mediterranean basin is the persistence of warm (≥13 °C) water masses down to bathyal and abyssal (>4000 m) depths. This feature allows high metabolic activity of wider range of prokaryotes inhabiting both superficial and deeper strata. Energy source availability was possibly the predominant factor in determining community structure and lifestyles in the deep Mediterranean Sea.

Supplementary Materials

Supplementary File 1

Acknowledgments

This work was supported by research fund from the Italian Ministry of University and Research under RITMARE Flagship Project (2012–2016).

Author Contributions

S.F., Y.M., D.D.E. and G.L. conceived of and designed the experiments. G.G, L.C.V., S.S. and G.M. performed the experiments. S.F., T.C. and Y.M. analysed the data. S.F., G.H.C. and Y.M. wrote the paper.

Conflicts of Interest

The authors declare no conflict of interest.

References

  1. Gasol, J.M.; Del Giorgio, P.A.; Duarte, C. Biomass distribution in marine planktonic communities. Limnol. Oceanogr. 1997, 42, 1353–1363. [Google Scholar] [CrossRef]
  2. Azam, F. Microbial control of oceanic carbon flux: The plot thickens. Science 1998, 280, 694–696. [Google Scholar] [CrossRef]
  3. Pedros-Alio, C. Marine microbial diversity: Can it be determined? Trends Microbiol. 2006, 14, 257–263. [Google Scholar] [CrossRef] [PubMed]
  4. Cottrell, M.T.; Kirchman, D.L. Contribution of major bacterial groups to bacterial biomass production (thymidine and leucine incorporation) in the Delaware estuary. Limnol. Oceanogr. 2003, 48, 168–178. [Google Scholar] [CrossRef]
  5. Venter, J.; Remington, K.; Heidelberg, J.; Halpern, A.; Rusch, D.; Eisen J Wu, D.; Paulsen, I.; Nelson, K.E.; Nelson, W.; Fouts, D.E.; et al. Environmental genome shotgun sequencing of the Sargasso Sea. Science 2004, 304, 66–74. [Google Scholar] [CrossRef] [PubMed]
  6. Sogin, M.L.; Morrison, H.G.; Huber, J.A.; Welch, D.M.; Huse, S.M.; Neal, P.R.; Arrieta, J.M.; Herndl, G.J. Microbial diversity in the deep sea and the underexplored “rare biosphere”. Proc. Natl. Acad. Sci. 2006, 103, 12115–12120. [Google Scholar] [CrossRef] [PubMed]
  7. DeLong, E.F.; Preston, C.M.; Mincer, T.; Rich, V.; Hallam, S.J.; Frigaard, N.U.; Martinez, A.; Sullivan, M.B.; Edwards, R.; Brito, B.R.; et al. Community genomics among stratified microbial assemblages in the ocean’s interior. Science 2006, 311, 496–503. [Google Scholar] [CrossRef] [PubMed]
  8. Quaiser, A.; Zivanovic, Y.; Moreira, D.; López-García, P. Comparative metagenomics of bathypelagic plankton and bottom sediment from the Sea of Marmara. ISME J. 2011, 5, 285–304. [Google Scholar] [CrossRef] [PubMed]
  9. Smedile, F.; Messina, E.; La Cono, V.; Yakimov, M.M. Comparative analysis of deep-sea bacterioplankton OMICS revealed the occurrence of habitat-specific genomic attributes. Mar. Genom. 2014, 17, 1–8. [Google Scholar] [CrossRef]
  10. Martín-Cuadrado, A.B.; López-García, P.; Alba, J.C.; Moreira, D.; Monticelli, L.; Strittmatter, A.; Gottschalk, G.; Rodríguez-Valera, F. Metagenomics of the deep Mediterranean, a warm bathypelagic habitat. PLoS ONE 2007, 2, e914. [Google Scholar] [CrossRef] [PubMed]
  11. Smedile, F.; Messina, E.; La Cono, V.; Tsoy, O.; Monticelli, L.S.; Borghini, M.; Giuliano, L.; Golyshin, P.N.; Mushegian, A.; Yakimov, M.M. Metagenomic analysis of hadopelagic microbial assemblages thriving at the deepest part of Mediterranean Sea, Matapan-Vavilov Deep. Environ. Microbiol. 2013, 15, 167–182. [Google Scholar] [CrossRef] [PubMed]
  12. Yokokawa, T.; De Corte, D.; Sintes, E.; Herndl, G.J. Spatial patterns of bacterial abundance, activity and community composition in relation to water masses in the eastern Mediterranean Sea. Aquat Microb. Ecol. 2010, 59, 185–195. [Google Scholar] [CrossRef]
  13. Techtmann, S.M.; Fortney, J.L.; Ayers, K.A.; Joyner, D.C.; Linley, T.D.; Pfiffner, S.M.; Hazen, T.C. The Unique Chemistry of Eastern Mediterranean Water Masses Selects for Distinct Microbial Communities by Depth. PLoS ONE 2015, 10, e0120605. [Google Scholar] [CrossRef] [PubMed]
  14. Wilkins, D.; van Sebille, E.; Rintoul, S.R.; Lauro, F.M.; Cavicchioli, R. Advection shapes Southern Ocean microbial assemblages independent of distance and environment effects. Nat. Commun. 2013, 4, 2457. [Google Scholar] [CrossRef] [PubMed]
  15. Alves Junior, N.; Meirelles, P.; de Oliveira Santos, E.; Dutilh, B.; Silva, G.Z.; Paranhos, R.; Cabral, A.S.; Rezende, C.; Iida, T.; de Moura, R.L.; et al. Microbial community diversity and physical–chemical features of the Southwestern Atlantic Ocean. Arch. Microbiol. 2014, 10, 1–15. [Google Scholar] [CrossRef] [PubMed]
  16. Varela, M.M.; van Aken, H.M.; Sintes, E.; Herndl, G.J. Latitudinal trends of Crenarchaeota and Bacteria in the meso- and bathypelagic water masses of the Eastern North Atlantic. Environ. Microbiol. 2008, 10, 110–124. [Google Scholar] [CrossRef] [PubMed]
  17. Galand, P.E.; Lovejoy, C.; Hamilton, A.K.; Ingram, R.G.; Pedneault, E.; Carmack, E.C. Archaeal diversity and a gene for ammonia oxidation are coupled to oceanic circulation. Environ. Microbiol. 2009, 11, 971–980. [Google Scholar] [CrossRef] [PubMed]
  18. Galand, P.E.; Casamayor, E.O.; Kirchman, D.L.; Potvin, M.; Lovejoy, C. Unique archaeal assemblages in the Arctic Ocean unveiled by massively parallel tag sequencing. ISME J. 2009, 3, 860–869. [Google Scholar] [CrossRef] [PubMed] [Green Version]
  19. Krom, M.D.; Emeis, K.C.; Van Cappellen, P. Why is the Eastern Mediterranean phosphorus limited? Prog. Oceanogr. 2010, 85, 236–244. [Google Scholar] [CrossRef]
  20. La Cono, V.; Tamburini, C.; Genovese, L.; La Spada, G.; Denaro, R.; Yakimov, M.M. Cultivation-independent assessment of the bathypelagic archaeal diversity of Tyrrhenian Sea: Comparative study of rDNA and rRNA-derived libraries and influence of sample decompression. Deep Sea Res. II Top. Studies Oceanogr. 2009, 56, 768–773. [Google Scholar] [CrossRef]
  21. Ribera d’Alcalà, M.; Brunet, C.; Conversano, F.; Corato, F.; Lavezza, R. Nutrient and pigment distributions in the southern Tyrrhenian Sea during mid-summer and late fall 2005. Deep Sea Res. II Top. Studies Oceanogr. 2009, 56, 676–686. [Google Scholar] [CrossRef]
  22. Yakimov, M.M.; La Cono, V.; Smedile, F.; Ferrer, M.; Golyshin, P.N.; Giuliano, L. Contribution of crenarchaeal autotrophic ammonia oxidizers to the dark primary production in Tyrrhenian Deep Waters (Central Mediterranean Sea). ISME J. 2011, 5, 945–961. [Google Scholar] [CrossRef] [PubMed]
  23. Millot, C.; Taupier-Lepage, I. Circulation in the Mediterranean Sea. In The Handbook of Environmental Chemistry; Saliot, A., Ed.; Springer: Ouverney, Germany, 2005; pp. 29–66. [Google Scholar]
  24. Carpenter, J.H. The accuracy of the Winkler method for dissolved oxygen analysis. Limnol. Oceanogr. 1965, 10, 135–140. [Google Scholar] [CrossRef]
  25. Yakimov, M.M.; La Cono, V.; Smedile, F.; Crisafi, F.; Arcadi, E.; Leonardi, M.; Decembrini, F.; Catalfamo, M.; Bargiela, R.; Ferrer, M.; et al. Heterotrophic bicarbonate assimilation is the main process of de novo organic carbon synthesis in hadal zone of the Hellenic Trench, the deepest part of Mediterranean Sea. Environ. Microbiol. Rep. 2014, 6, 709–722. [Google Scholar] [CrossRef] [PubMed]
  26. Thomas, C.; Cauwet, G.; Minster, J.F. Dissolved organic carbon in the 825 equatorial Atlantic Ocean. Mar. Chem. 1995, 49, 155–169. [Google Scholar] [CrossRef]
  27. Lane, D.J. 16S/23S rRNA sequencing. In Nucleic Acid Techniques in Bacterial Systematics; Stackerbrandt, E., Goodfellow, M., Eds.; Wiley: New York, NY, USA, 1991; pp. 115–175. [Google Scholar]
  28. Hallam, S.J.; Girguis, P.R.; Preston, C.M.; Richardson, P.M.; De Long, E.F. Identification of methyl coenzyme MreductaseA (mcrA) genes associated with methane-oxidizingarchaea. Appl. Environ. Microbiol. 2003, 69, 5483–5491. [Google Scholar] [CrossRef] [PubMed]
  29. Amann, R.; Ludwig, W.; Schleifer, K. Phylogenetic identification and in situ detection of individual microbial cells without cultivation. Microbiol. Rev. 1995, 59, 143–169. [Google Scholar] [PubMed]
  30. Tamburini, C. Life under Pressure: Deep-Sea Microbial Ecology. In Life as we know it. Series: Cellular Origin and Life in Extreme Habitats and Astrobiology; Springer: Dordrecht, The Netherlands, 2006; pp. 125–143. [Google Scholar]
  31. Teira, E.; Reinthaler, T.; Pernthaler, A.; Pernthaler, J.; Herndl, G.J. Combining catalyzed reporter deposition-fluorescence in situ hybridization and microautoradiography to detect substrate utilization by bacteria and Archaea in the deep ocean. Appl. Environ. Microbiol. 2004, 70, 4411–4414. [Google Scholar] [CrossRef] [PubMed]
  32. Pernthaler, A.; Pernthaler, J.; Amann, R. Fluorescence in situ hybridization and catalyzed reporter deposition for the identification of marine bacteria. Appl. Environ. Microbiol. 2002, 68, 3094–3101. [Google Scholar] [CrossRef] [PubMed]
  33. Wallner, G.; Amann, R.; Beisker, W. Optimizing fluorescent in situ hybridization of suspended cells with rRNA-targeted oligonucleotide probes for the flow cytometric identification of microorganisms. Cytometry 1993, 14, 136–143. [Google Scholar] [CrossRef] [PubMed]
  34. Huber, T.; Faulkner, G.; Hugenholtz, P. Bellerophon: a program to detect chimeric sequences in multiple sequence alignments. Bioinformatics 2004, 20, 2317–2319. [Google Scholar] [CrossRef] [PubMed]
  35. Altschul, S.F.; Madden, T.L.; Schaffer, A.A.; Zhang, J.; Zhang, Z.; Miller, W.; Lipman, D.J. Gapped BLAST and PSI-BLAST: A new generation of protein database search programs. Nucleic Acids Res. 1997, 25, 3389–3402. [Google Scholar] [CrossRef] [PubMed]
  36. Pruesse, E.; Quast, C.; Knittel, K.; Fuchs, B.M.; Ludwig, W.; Peplies, J.; Glöckner, F.O. SILVA: A comprehensive online resource for quality checked and aligned ribosomal RNA sequence data compatible with ARB. Nucleic Acids Res. 2007, 35, 7188–7196. [Google Scholar] [CrossRef] [PubMed]
  37. Ludwig, W.; Strunk, O.; Westram, R.; Richter, L.; Meier, H.; Yadhukumar; Buchner, A.; Lai, T.; Steppi, S.; Jobb, G.; et al. ARB: A software environment for sequence data. Nucleic Acids Res. 2004, 32, 1363–1371. [Google Scholar] [CrossRef] [PubMed]
  38. Singleton, D.R.; Furlong, M.A.; Rathbun, S.L.; Whitman, W.B. Quantitative comparisons of 16S rDNA sequence libraries from environmental samples. Appl. Environ. Microbiol. 2001, 67, 4373–4376. [Google Scholar] [CrossRef]
  39. Gentile, G.; Giuliano, L.; D’Auria, G.; Smedile, F.; Azzaro, M.; De Domenico, M.; Yakimov, M.M. Study of bacterial communities in Antarctic coastal waters by a combination of 16S rRNA and 16S rDNA sequencing. Environ. Microbiol. 2006, 8, 2150–2161. [Google Scholar] [CrossRef] [PubMed]
  40. Giovannoni, S. Evolutionary biology: Oceans of bacteria. Nature 2004, 430, 515–516. [Google Scholar] [CrossRef] [PubMed]
  41. Kemp, P.F.; Aller, J.Y. Bacterial diversity in aquatic and other environments: What 16S rDNA libraries can tell us. FEMS Microbiol. Ecol. 2004, 47, 161–177. [Google Scholar] [CrossRef]
  42. Schloss, P.D.; Handelsman, J. Introducing DOTUR, a computer program for defining operational taxonomic units and estimating species richness. Appl. Environ. Microbiol. 2005, 71, 1501–1506. [Google Scholar] [CrossRef] [PubMed]
  43. Good, I.J. The population frequencies of species and the estimation of the population parameters. Biometrika 1953, 40, 237–264. [Google Scholar] [CrossRef]
  44. Clarke, K.R.; Gorley, R.N. PRIMER v6: User Manual/Tutorial; PRIMER-E Ltd.: Plymouth, UK, 2006. [Google Scholar]
  45. Clarke, K.R. Non-parametric multivariate analyses of changes in community structure. Aust. J. Ecol. 1993, 18, 117–143. [Google Scholar] [CrossRef]
  46. Tamura, K.; Peterson, D.; Peterson, N.; Stecher, G.; Nei, M.; Kumar, S. MEGA5: Molecular evolutionary genetics analysis using maximum likelihood, evolutionary distance and maximum parsimony methods. Mol. Biol. Evol. 2011, 28, 2731–2739. [Google Scholar] [CrossRef] [PubMed]
  47. Budillon, G.; Gasparini, G.P.; Schröder, K. Persistence of an eddy signature in the central Tyrrhenian basin. Deep Sea Res. II Top. Studies Oceanogr. 2009, 56, 713–724. [Google Scholar] [CrossRef]
  48. Romanenko, L.A.; Tanaka, N.; Frolova, G.M. Umboniibacter marinipuniceus gen. nov., sp. nov., a marine gammaproteobacterium isolated from the mollusc Umbonium costatum from the Sea of Japan. Int. J. Syst. Evol. Microbiol. 2010, 60, 603–609. [Google Scholar] [CrossRef] [PubMed]
  49. Garczarek, L.; Dufresne, A.; Rousvoal, S.; West, N.J.; Mazard, S.; Marie, D.; Claustre, H.; Raimbault, P.; Post, A.F.; Scanlan, D.J.; et al. High vertical and low horizontal diversity of Prochlorococcus ecotypes in the Mediterranean Sea in summer, FEMS Microbiol. Ecol. 2007, 60, 189–206. [Google Scholar] [CrossRef]
  50. Margheri, M.C.; Piccard, R.; Ventura, S.; Viti, C.; Giovannetti, L. Genotypic diversity of Oscillatoriacean strains belonging to the genera Geitlerinema and Spirulina determined by 16S rDNA restriction analysis. Curr. Microbiol. 2003, 46, 359–364. [Google Scholar] [CrossRef] [PubMed]
  51. Walsh, D.A.; Zaikova, E.; Howes, C.G.; Song, Y.C.; Wright, J.J.; Tringe, S.G.; Tortell, P.D.; Hallam, S.J. Metagenome of a versatile chemolithoautotroph from expanding oceanic dead zones. Science 2009, 23, 578–582. [Google Scholar] [CrossRef] [PubMed]
  52. Tamburini, C.; Garel, M.; Al Ali, B.; Mérigot, B.; Kriwy, P.; Charrière, B.; Budillon, G. Distribution and activity of Bacteria and Archaea in the different water masses of the Tyrrhenian Sea. Deep Sea Res. II Top. Studies Oceanogr. 2009, 56, 700–712. [Google Scholar] [CrossRef]
  53. Zaballos, M.; Lopez-Lopez, A.; Ovreas, L.; Bartual, S.G.; D’Auria, G.; Alba, J.C.; Legault, B.; Pushker, R.; Daae, F.L.; Rodríguez-Valera, F. Comparison of prokaryotic diversity at offshore oceanic locations reveals a different microbiota in the Mediterranean Sea. FEMS. Microbiol. Ecol. 2006, 56, 389–405. [Google Scholar] [CrossRef] [PubMed]
  54. Fuhrman, J.A.; Davis, A.A. Widespread Archaea and novel Bacteria from the deep sea as shown by 16S rRNA gene sequences. Mar. Ecol. Prog. Ser. 1997, 150, 275–285. [Google Scholar] [CrossRef]
  55. Massana, R.; De Long, E.F.; Pedrós-Alió, C. A few cosmopolitan phylotypes dominate planktonic archaeal assemblages in widely different oceanic provinces. Appl. Environ. Microbiol. 2000, 66, 1777–1787. [Google Scholar] [CrossRef] [PubMed]
  56. Chao, A. Nonparametric Estimation of the Number of Classes in a Population. Scand. J. Statist. 1984, 11, 265–270. [Google Scholar]
  57. Fuller, N.J.; Marie, D.; Partensky, F.; Vaulot, D.; Post, A.F.; Scalan, D.J. Clade-specific 16S rDNA oligonucleotides reveal the predominance of a single marine Synechococcus clade throughout a stratified water column in the Red Sea. Appl. Environ. Microbiol. 2003, 69, 2430–2443. [Google Scholar] [CrossRef] [PubMed]
  58. Tittel, J.; Bissinger, V.; Zippel, B.; Gaedke, U.; Bell, E.; Lorke, A.; Kamjunke, N. Mixotrophs combine resource use to outcompete specialists: Implications for aquatic food webs. Proc. Natl. Acad. Sci. 2003, 100, 12776–12781. [Google Scholar] [CrossRef] [PubMed]
  59. Allers, E.; Wright, J.J.; Konwar, K.M.; Howes, C.G.; Beneze, E.; Hallam, S.J.; Sullivan, M.B. Diversity and population structure of Marine Group A bacteria in the Northeast subarctic Pacific Ocean. ISME J. 2013, 7, 256–268. [Google Scholar] [CrossRef] [PubMed]
  60. Borin, S.; Brusetti, L.; Mapelli, F.; D’Auria, G.; Brusa, T.; Marzorati, M.; Rizzi, A.; Yakimov, M.; Martyd, D.; De Lange, G.J.; et al. Sulfur cycling and methanogenesis primarily drive microbial colonization of the highly sulfidic Urania deep hypersaline basin. Proc. Natl. Acad. Sci. 2009, 106, 9151–9156. [Google Scholar] [CrossRef] [PubMed]
  61. DeLong, E.F.; Taylor, L.T.; Marsh, T.L.; Preston, C.M. Visualization and enumeration of marine planktonic archaea and bacteria by using polynucleotide probes and fluorescence in situ hybridization. Appl. Environ. Microbiol. 1999, 65, 5554–5563. [Google Scholar] [PubMed]
  62. Konstantinidis, K.T.; Braff, J.; Karl, D.M.; DeLong, E.F. Comparative metagenomic analysis of a microbial community residing at a depth of 4000 meters at station ALOHA in the North Pacific subtropical gyre. Appl. Environ. Microbiol. 2009, 75, 5345–5355. [Google Scholar] [CrossRef] [PubMed]
  63. Feller, I.C.; Whigham, D.F.; Mckee, K.L.; Lovelock, C.E. Nitrogen limitation of growth and nutrient dynamics in adisturbed man grove forest, Indian River Lagoon, Florida. Oecologia 2003, 134, 405–414. [Google Scholar] [CrossRef] [PubMed]
  64. D’Amico, S.; Marx, J.C.; Gerday, C.; Feller, G. Activity-stability relationships in extremophilic enzymes. J. Biol. Chem. 2003, 278, 7891–7896. [Google Scholar] [CrossRef] [PubMed]
  65. Greaves, R.B.; Warwicker, J. Mechanisms for stabilisation and the maintenance of solubility in proteins from thermophiles. BMC. Struct. Biol. 2007, 7, 18. [Google Scholar] [CrossRef] [PubMed]

