1. Introduction
For over one hundred years, coastal protection structures were designed and constructed based mostly on assumptions that parameters were fairly constant and predictable and conditions driving forces of the past would persist pretty much unchanged into the future. Results of climate science studies over the past three decades, especially the past decade, show that climate change is unequivocal, due largely to carbon dioxide increase and other greenhouse gas (GHG) concentrations in the atmosphere. Observations show the effects are global, but vary greatly on regional scales. The impacts of climate change most germane to coastal protection are: global mean sea-level rise (GSLR), increase in storm surge and flooding levels, increase in high tide nuisance flooding, change in wave characteristics due to more intense storm events, and increase in extreme weather events. Natural disasters are becoming more frequent and more severe on highly vulnerable deltas and lowland coastal areas. This is evident for barrier islands and river delta coasts, which are experiencing high rates of erosion, flooding, and marine transgression. Projected future GSLR poses further significant threat, especially to coastal landforms, which are already undergoing deterioration due to anthropogenic impacts. The impacts of climate change on coasts vary temporally and regionally but all coastal regions are facing similar issues.
Adaptation measures responding to climate change impacts should be implemented in a phased and progressive manner over time and all vulnerable countries can benefit by international cooperation and sharing of experiences, expertise, and resources.
2. Objective
This paper presents an assessment of the impacts of accelerating climate change (GSLR, storm intensity, tidal nuisance flooding) on the adequacy of coastal protection strategies and explores additional measures needed for an optimum degree of protection and risk reduction. Three coastal regions with similar circumstances are considered: the Nile Delta Coast at Abu-Qir Bay, Egypt; the Louisiana coast including the Lake Borgne Surge Barrier; and the New York City region. Current plans are discussed and recommendations are made for employing adaptation to cope with projected climate change impacts and reduce risk to humans living in low coastal regions.
3. Climate Change—Global Sea-Level Rise
Climate science is expanding in information and its understanding rapidly. Applying 50 to 100 year conditions into the future and beyond will be different than the historic past or the present. This requires a significant change in thinking about sustainable coastal management and protection of delta and lowland coastlines (
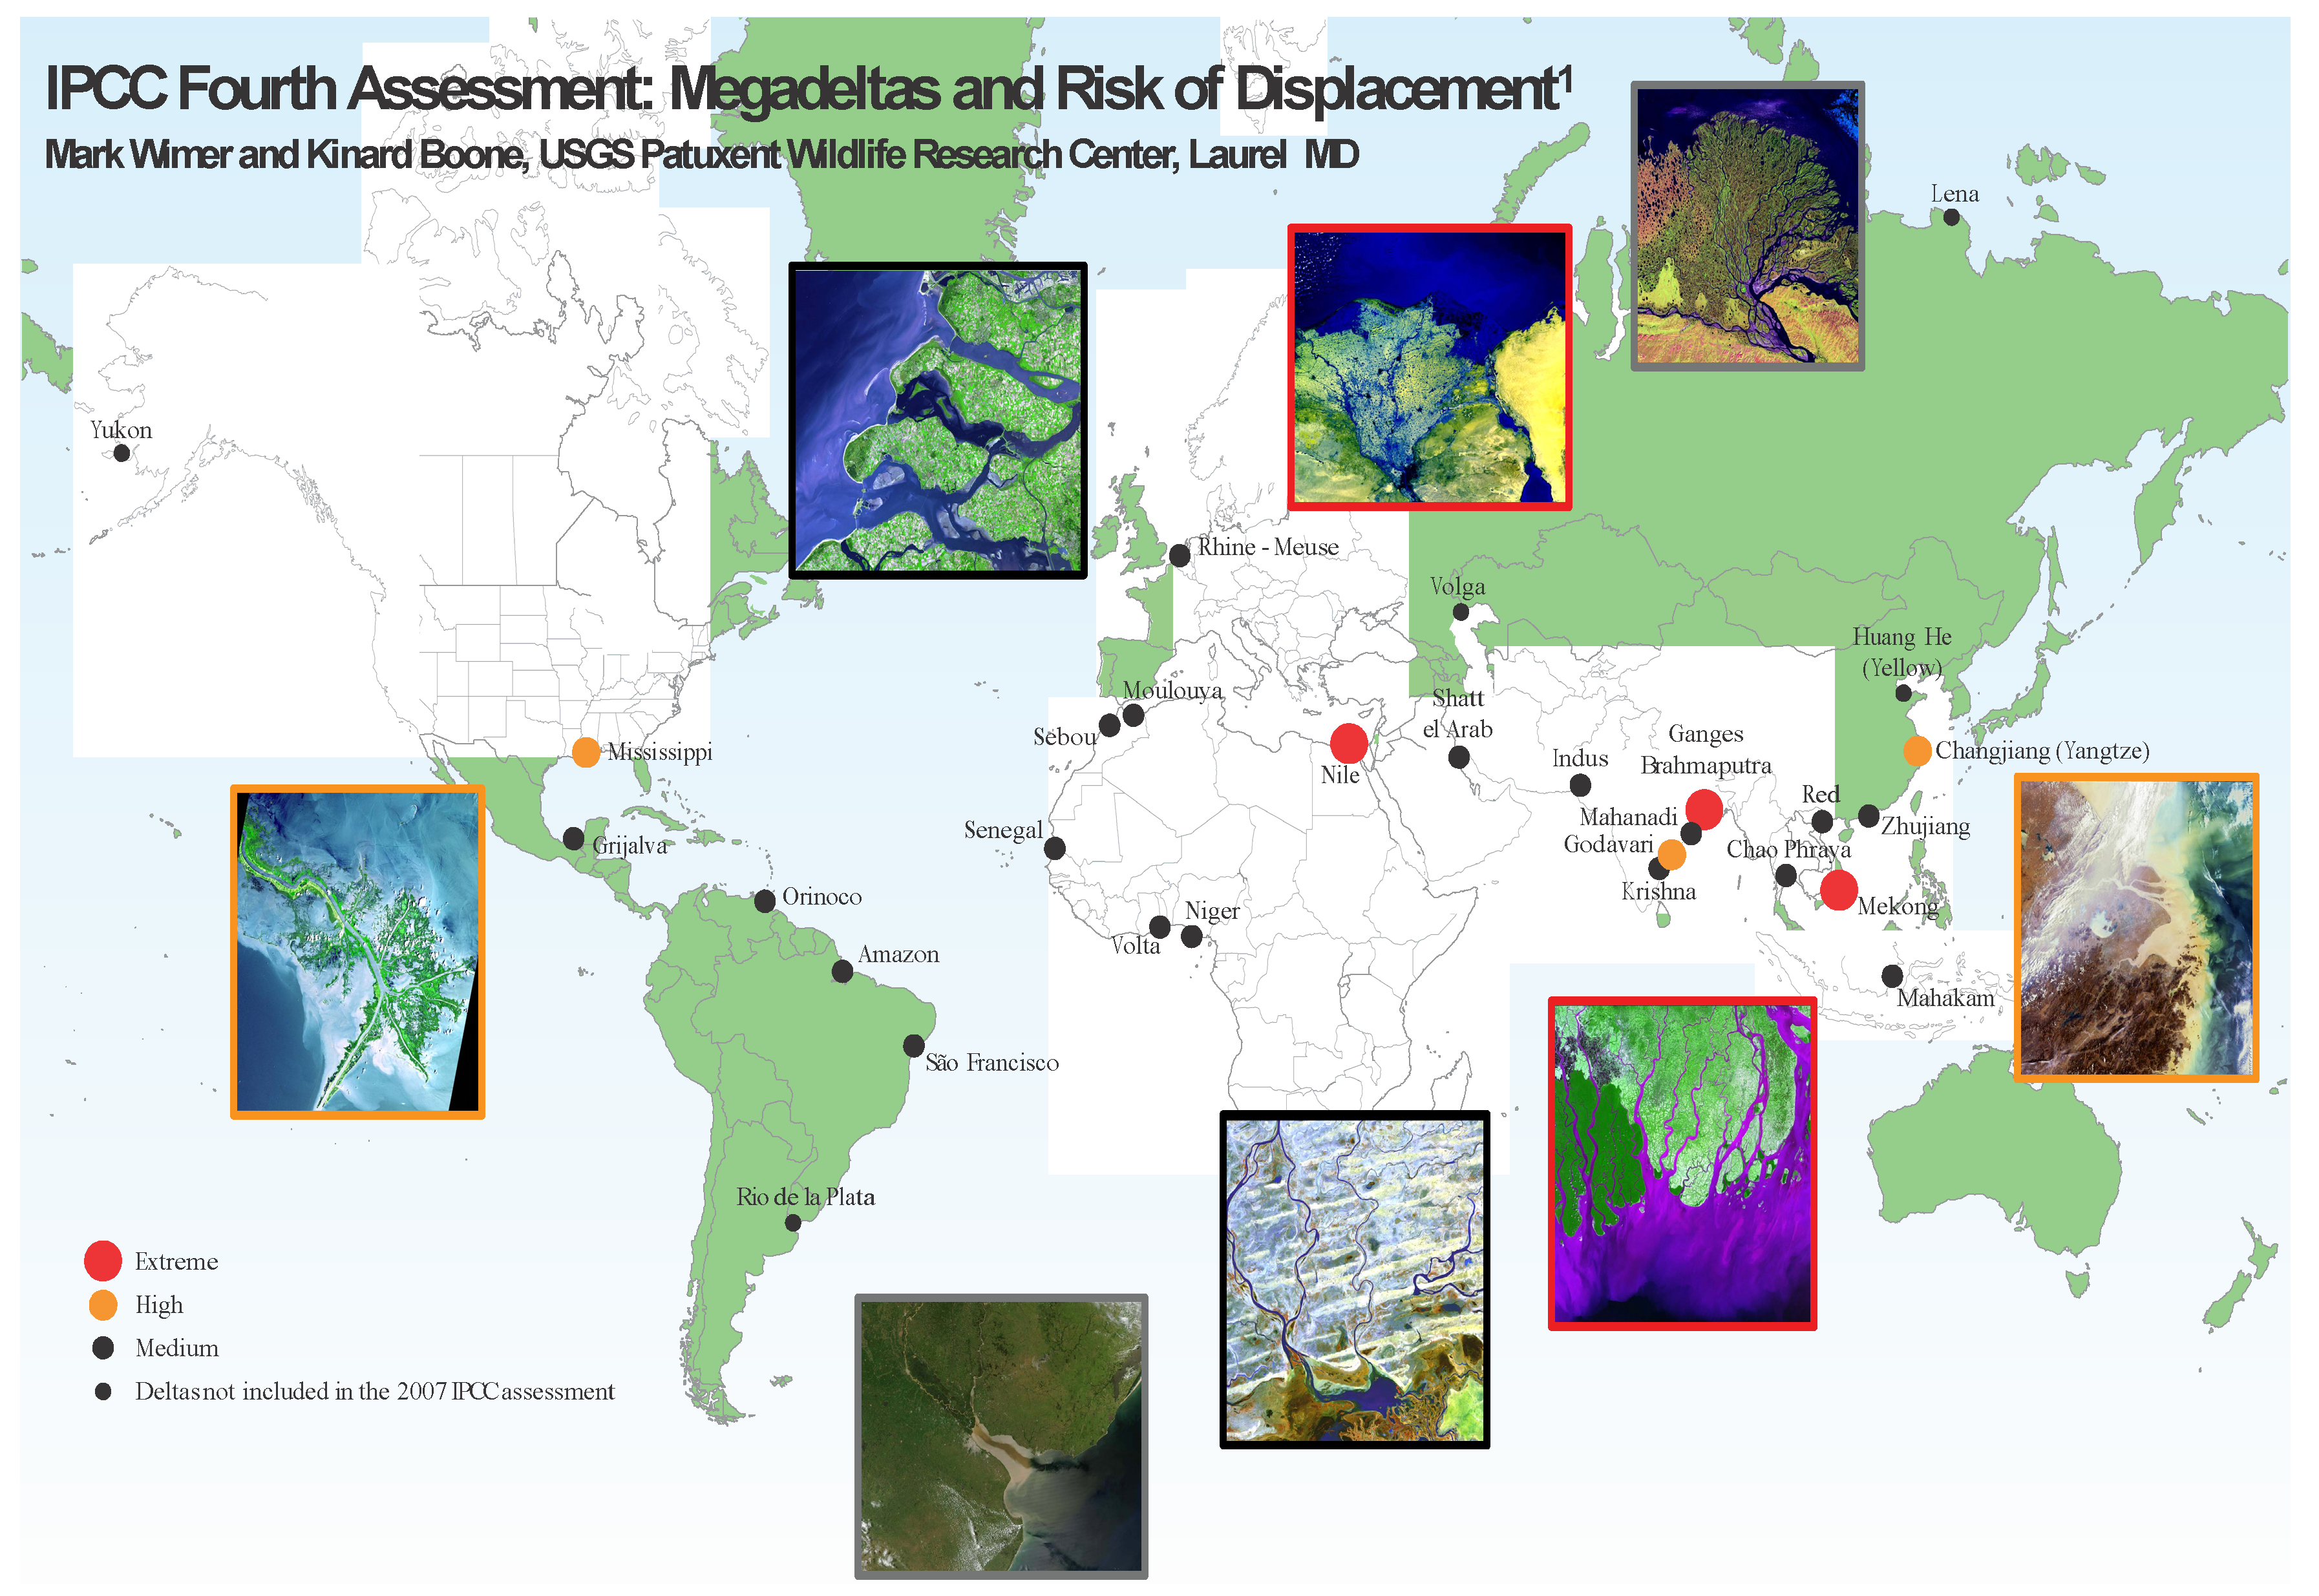
Figure 1). Impacts of climate change should be fully integrated into coastal planning and engineering and uncertainties factored in. Risk and vulnerability need to be assessed to decide on the most cost-effective approach for projects designed for the next 50 years, to 2100 and well beyond.
The changes in climate already have significant consequences with regard to precipitation (extreme rain events, flooding, droughts), temperature extremes, and ocean levels (storm surge, sea-level rise, tidal flooding). Sea-level rise, increasingly recognized as important on local and regional scales, is a dominant driver of coastal change, along with storms.
Figure 1.
World Mega Deltas threatened by climate and human changes (open source poster modified by USGS from [
1]).
Figure 1.
World Mega Deltas threatened by climate and human changes (open source poster modified by USGS from [
1]).
Global mean sea level was relatively stable for the past several thousand years under a mild climate until the mid-19th century, but during the 20th century sea level began rising due to global warming resulting from human activities at a global average rate of 1.2 mm/year. The current average global rise rate is 3.2 mm/year, 2.5 times faster [
2,
3]. Many coastal regions, particularly deltas, however, are experiencing much greater local or relative sea-level rise (LSLR), defined as global mean sea-level rise plus subsidence, plus sediment compaction, and in minor cases land emergence. Example rates are: Nile delta region 2–5 mm/year, Louisiana delta region ~4–10+ mm/year, and New York City area 4 mm/year. These higher than global rates have significant areal variations and are due to local geophysical (subsidence, faulting), oceanographic, and human factors (oil, gas, and ground water extraction, as well as wetland reclamation). Combined with storms, this rise is resulting in greater surge elevations, more frequent tidal nuisance flooding, and record increases in damage to coastal infrastructure and loss of life [
2]. Projected GSLR by 2100 [
4,
5,
6,
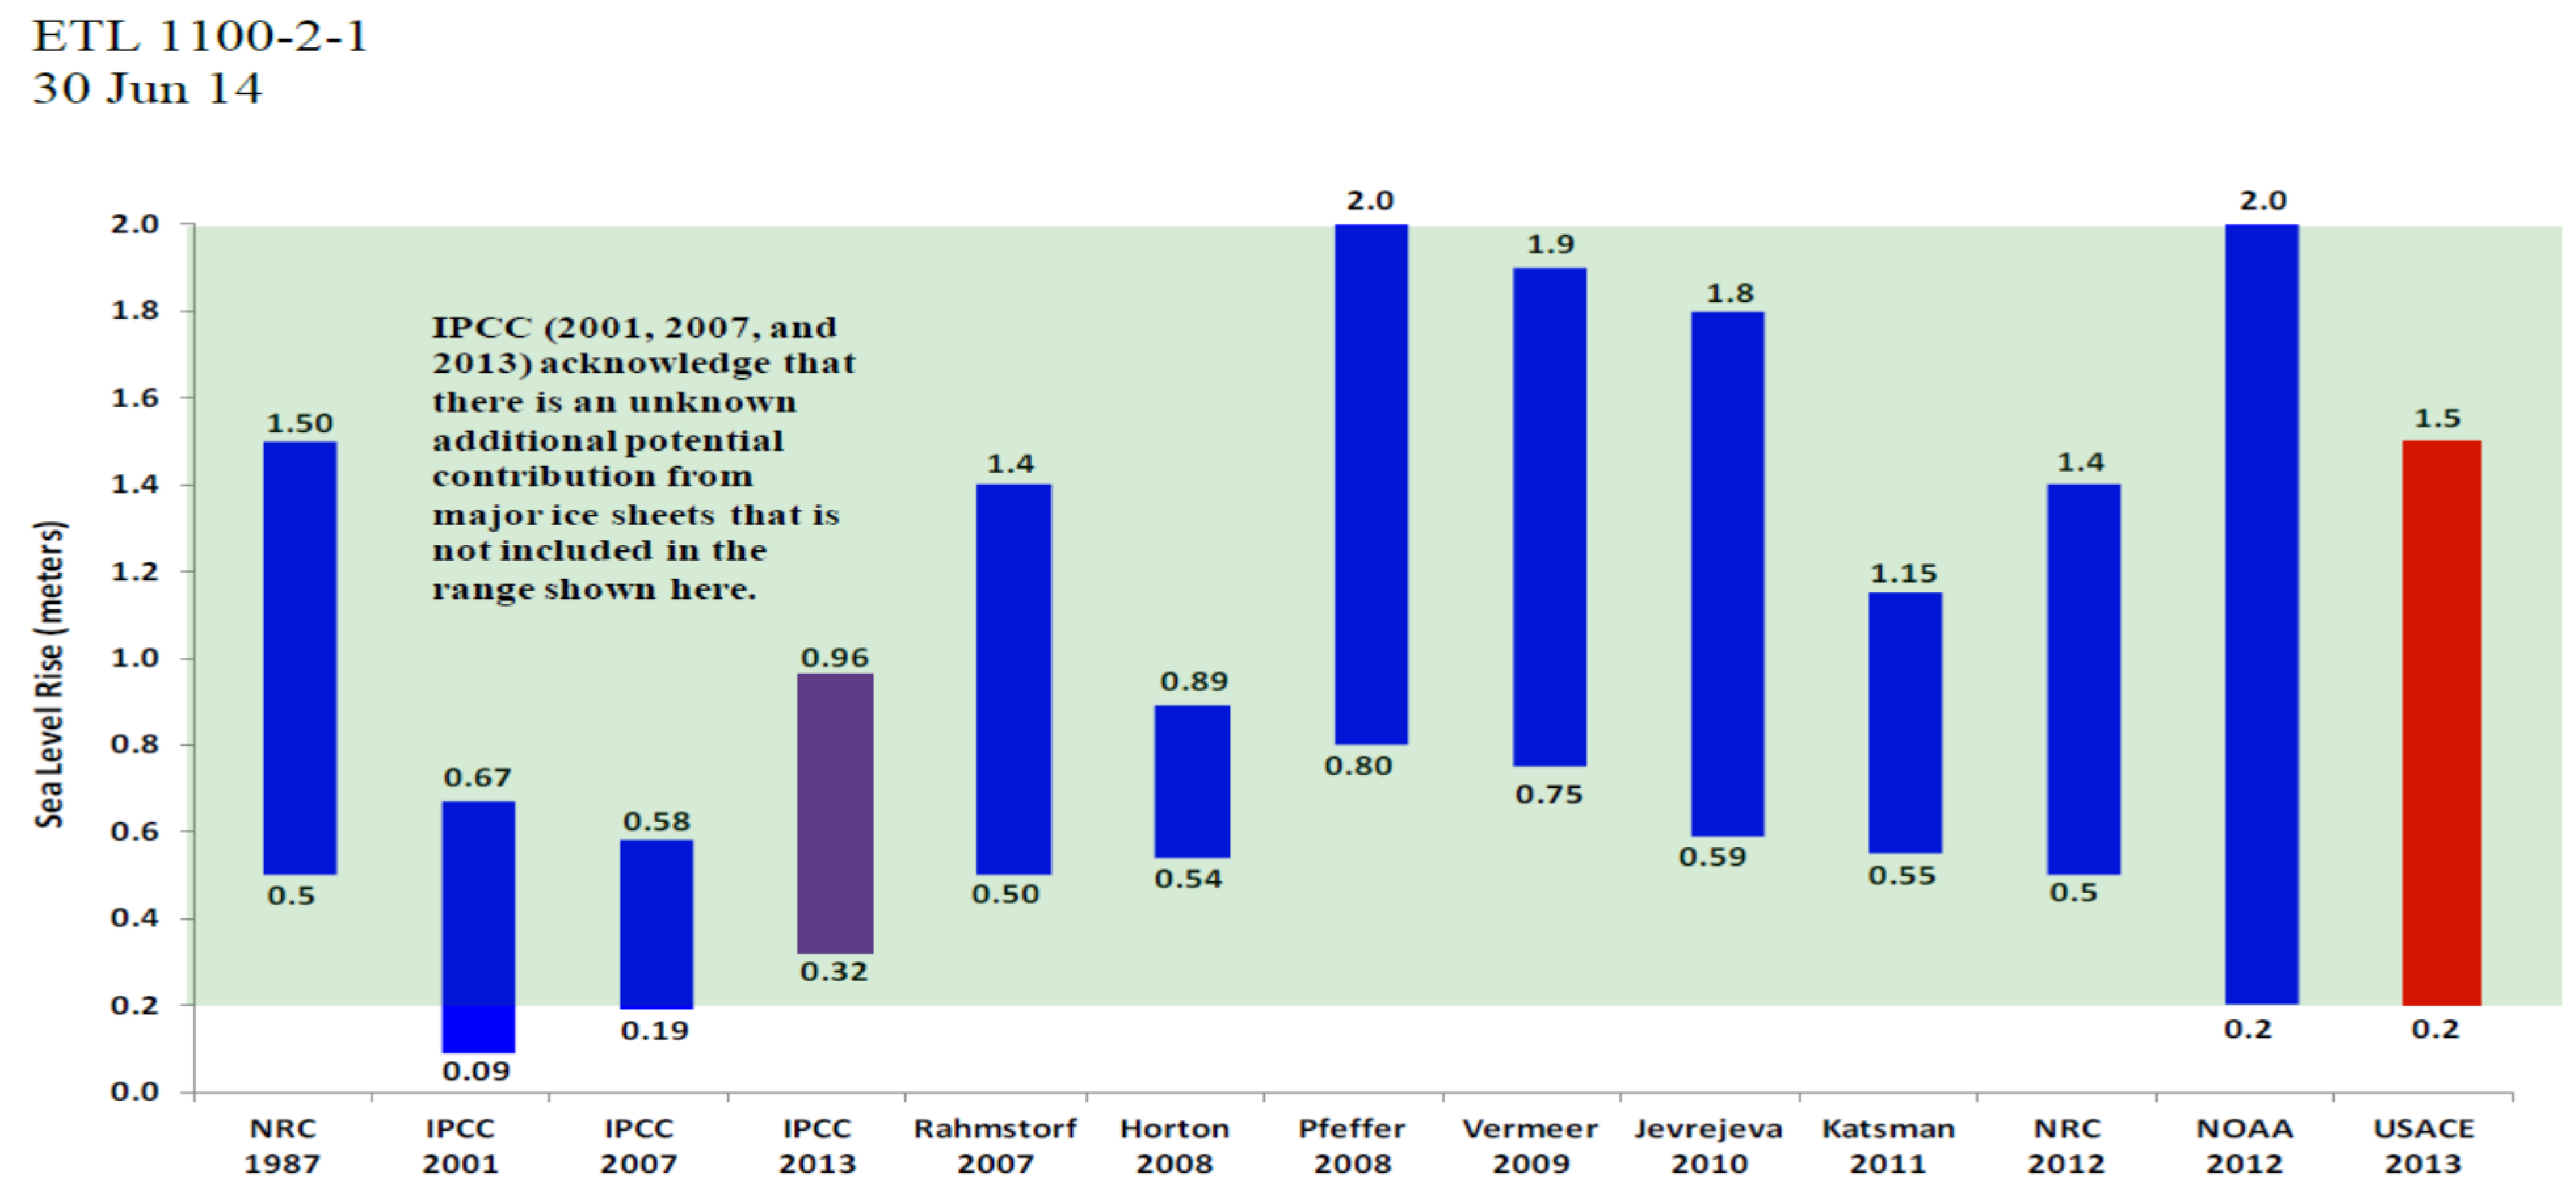
7] is 0.2 m to 2 m and would be in addition to local rise factors such as subsidence and oceanographic processes (
Figure 2). The purple and red color bars simply denote the most recent published projections. The range of projections is large due to the uncertainty of continued global warming, which in turn depends on the extent of continued man-made emissions of greenhouse gases into the atmosphere. Even greater global sea-level rise is possible (3 m+) over the next several hundred years [
8,
9], unless carbon emissions, global warming, and ice-sheet melting are greatly slowed or ideally reversed.
Figure 2.
Comparison of maximum and minimum estimates of global sea level rise by 2100.
Figure 2.
Comparison of maximum and minimum estimates of global sea level rise by 2100.
4. Recent World Catastrophic Storm Events
Hurricane Katrina, with a storm surge of up to 8.5 m and wave heights of 5.5 m (total 14 m), made landfall in eastern Louisiana and the Mississippi coast on 29 August 2005, resulting in major loss of lives from massive levee failures and flooding of New Orleans, loss of wetlands, and extensive erosion of barrier islands along the Gulf coast.
The Nile Delta Super Storm on 12 December 2010 is a striking example of the severity of more energetic storm events since 2003. The storm caused extensive flooding of the delta and coastal cities in Egypt. A surge of over 1.2 m and 7 m waves forced the closure of Alexandria’s main harbor. The main damage resulted from wave and surge overtopping of coastal structures designed for smaller events.
Hurricane “Super storm” Sandy made landfall along the New Jersey–New York coast on 29 October 2012 at high tide after taking an unusual path at landfall. The largest storm on record for the Atlantic, Sandy, a combination tropical–extra tropical storm, caused catastrophic damage by overtopping barrier islands and coastal structures with damage throughout the region, including New York City, which experienced a 4.4 m storm surge.
5. Vulnerability of Deltas and Lowland Coastlines to Climate and Anthropogenic Changes
All the World’s major deltas, including the Nile Delta and Louisiana’s Mississippi River Delta, developed about seven to eight thousand years ago when Holocene sea-level rise slowed and rivers were able to transport sediment to the coast in volumes sufficient to maintain landforms acted on by marine processes. Deltas develop by lateral movement of channels that spread alluvial sediments while at the same time thick deposits undergo rapid subsidence. Acted on by marine processes over time, deltas become fronted by sandy barrier island shorelines, backed by vegetated wetlands and marshes [
10].
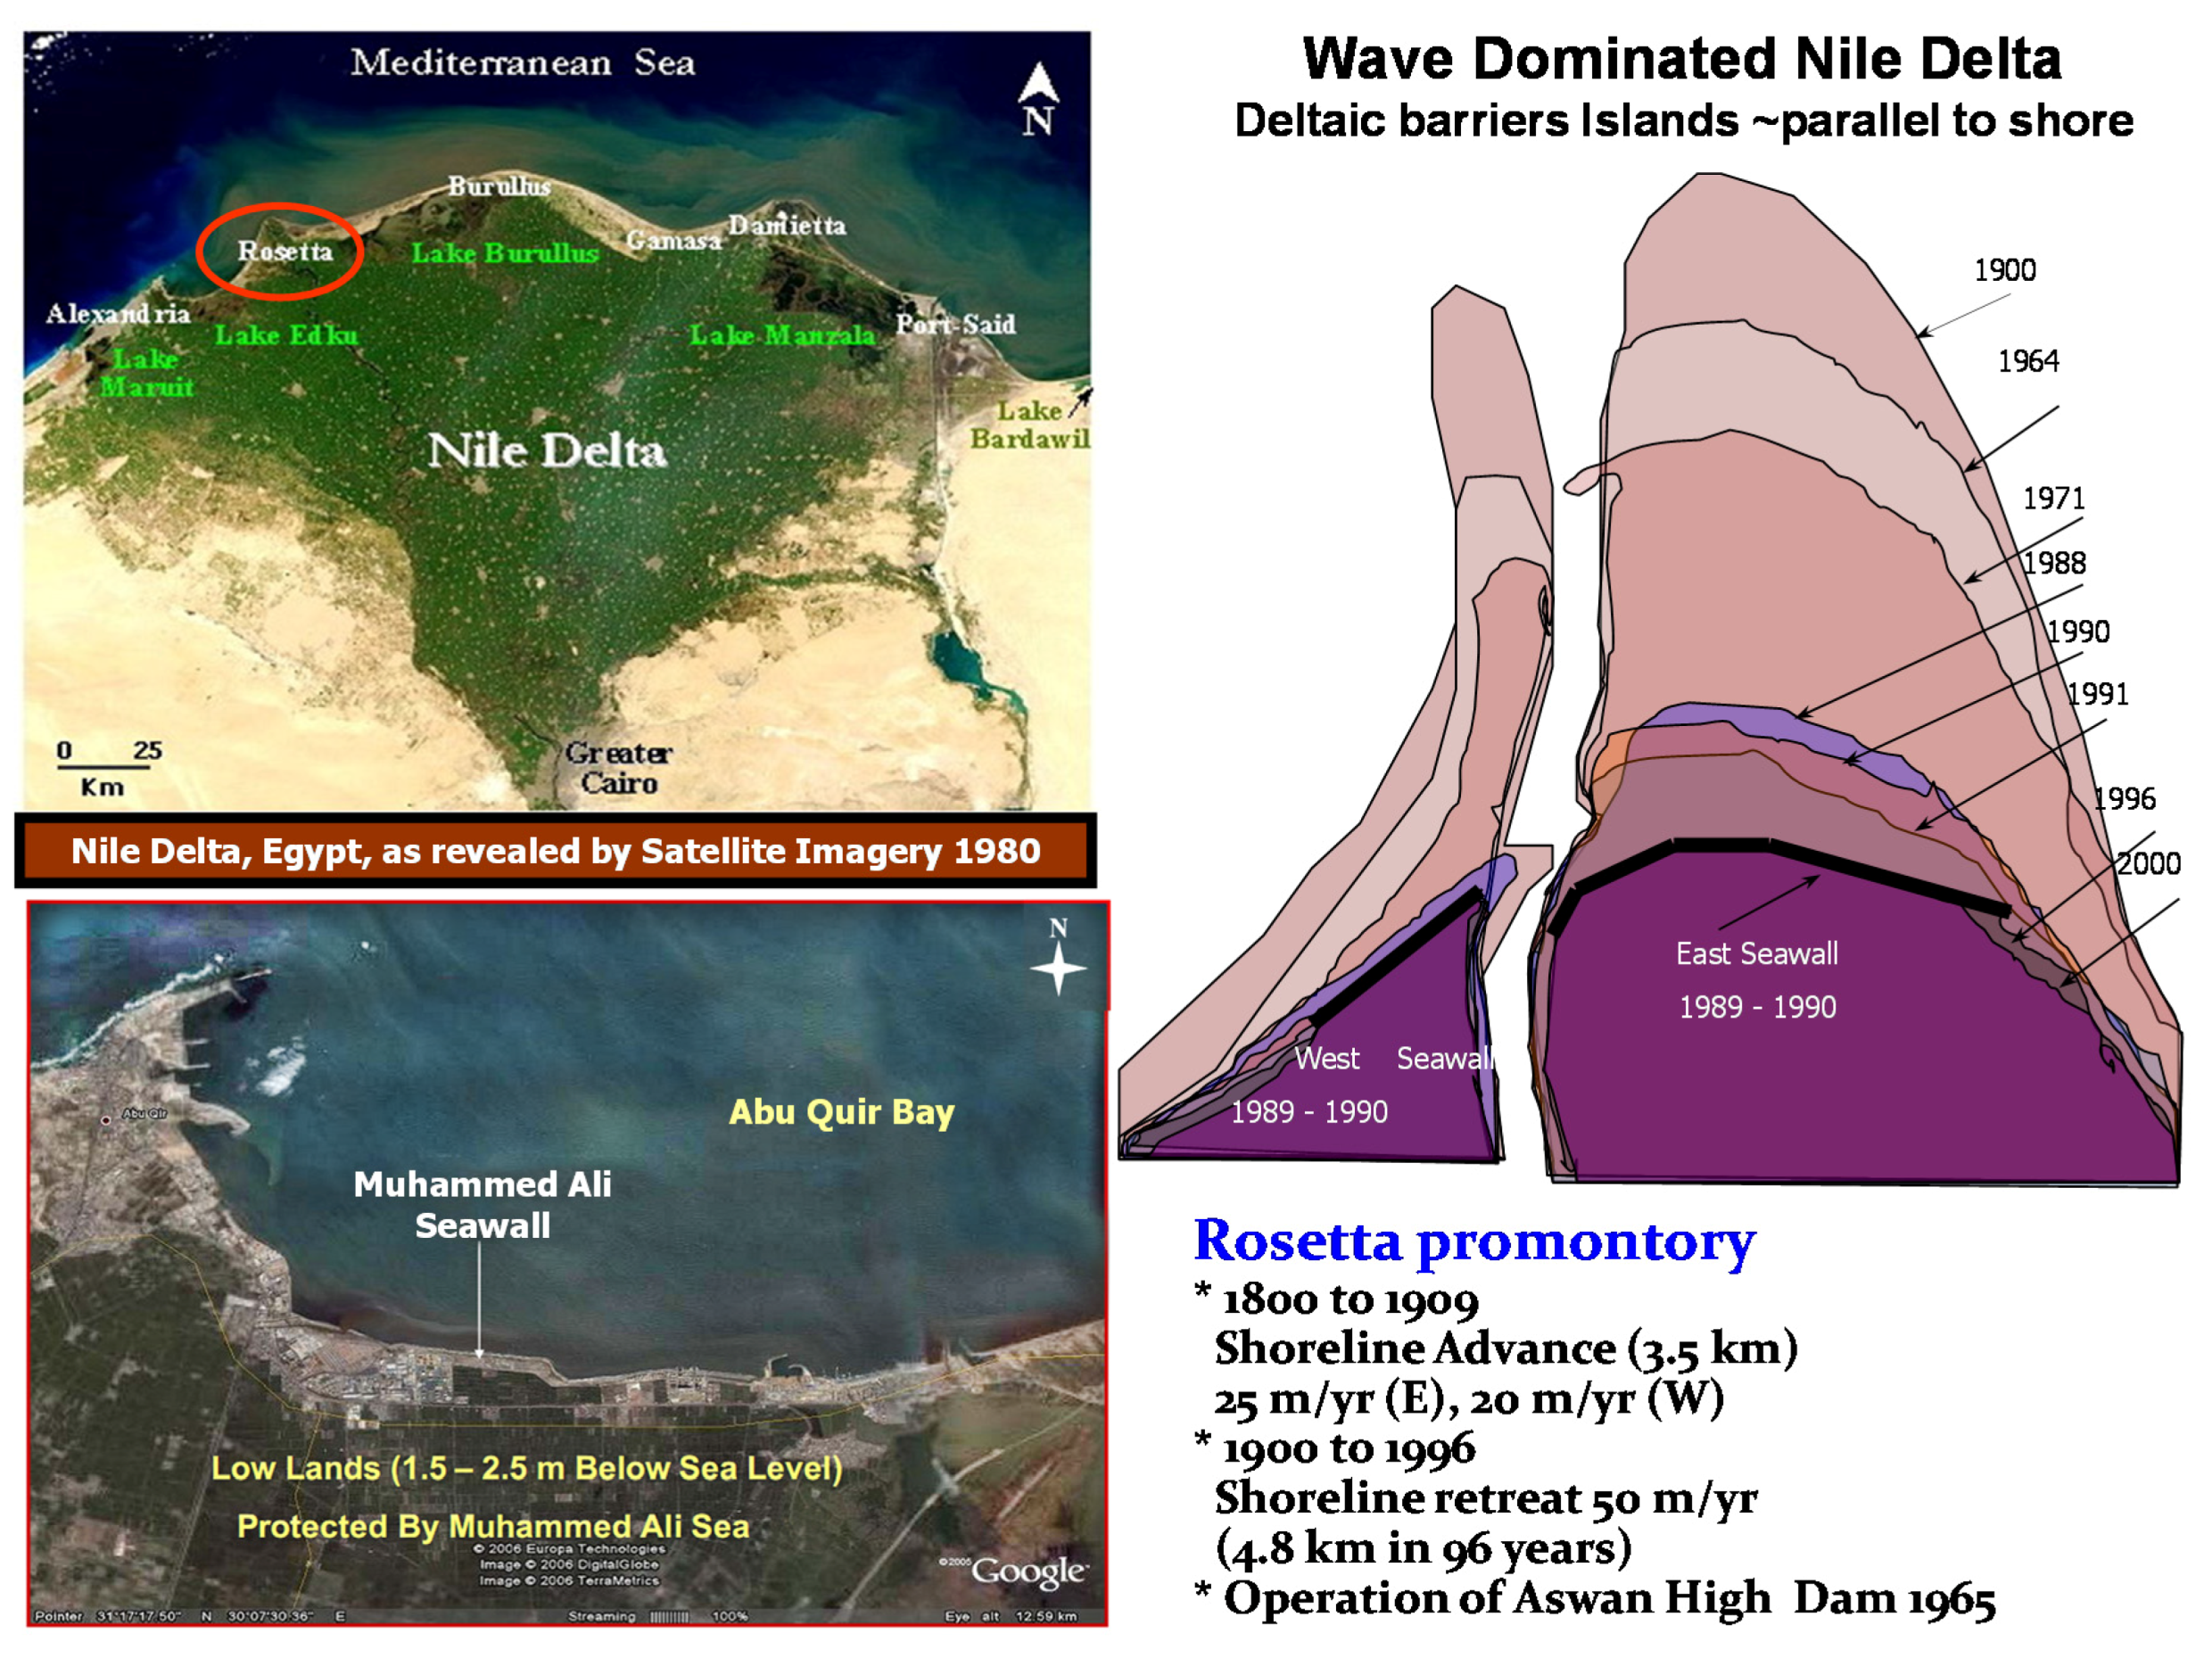
Figure 3.
Coastal retreat of Rosetta Headland (1900 to 2010) and M. Ali Seawall [
11] from open source maps.
Figure 3.
Coastal retreat of Rosetta Headland (1900 to 2010) and M. Ali Seawall [
11] from open source maps.
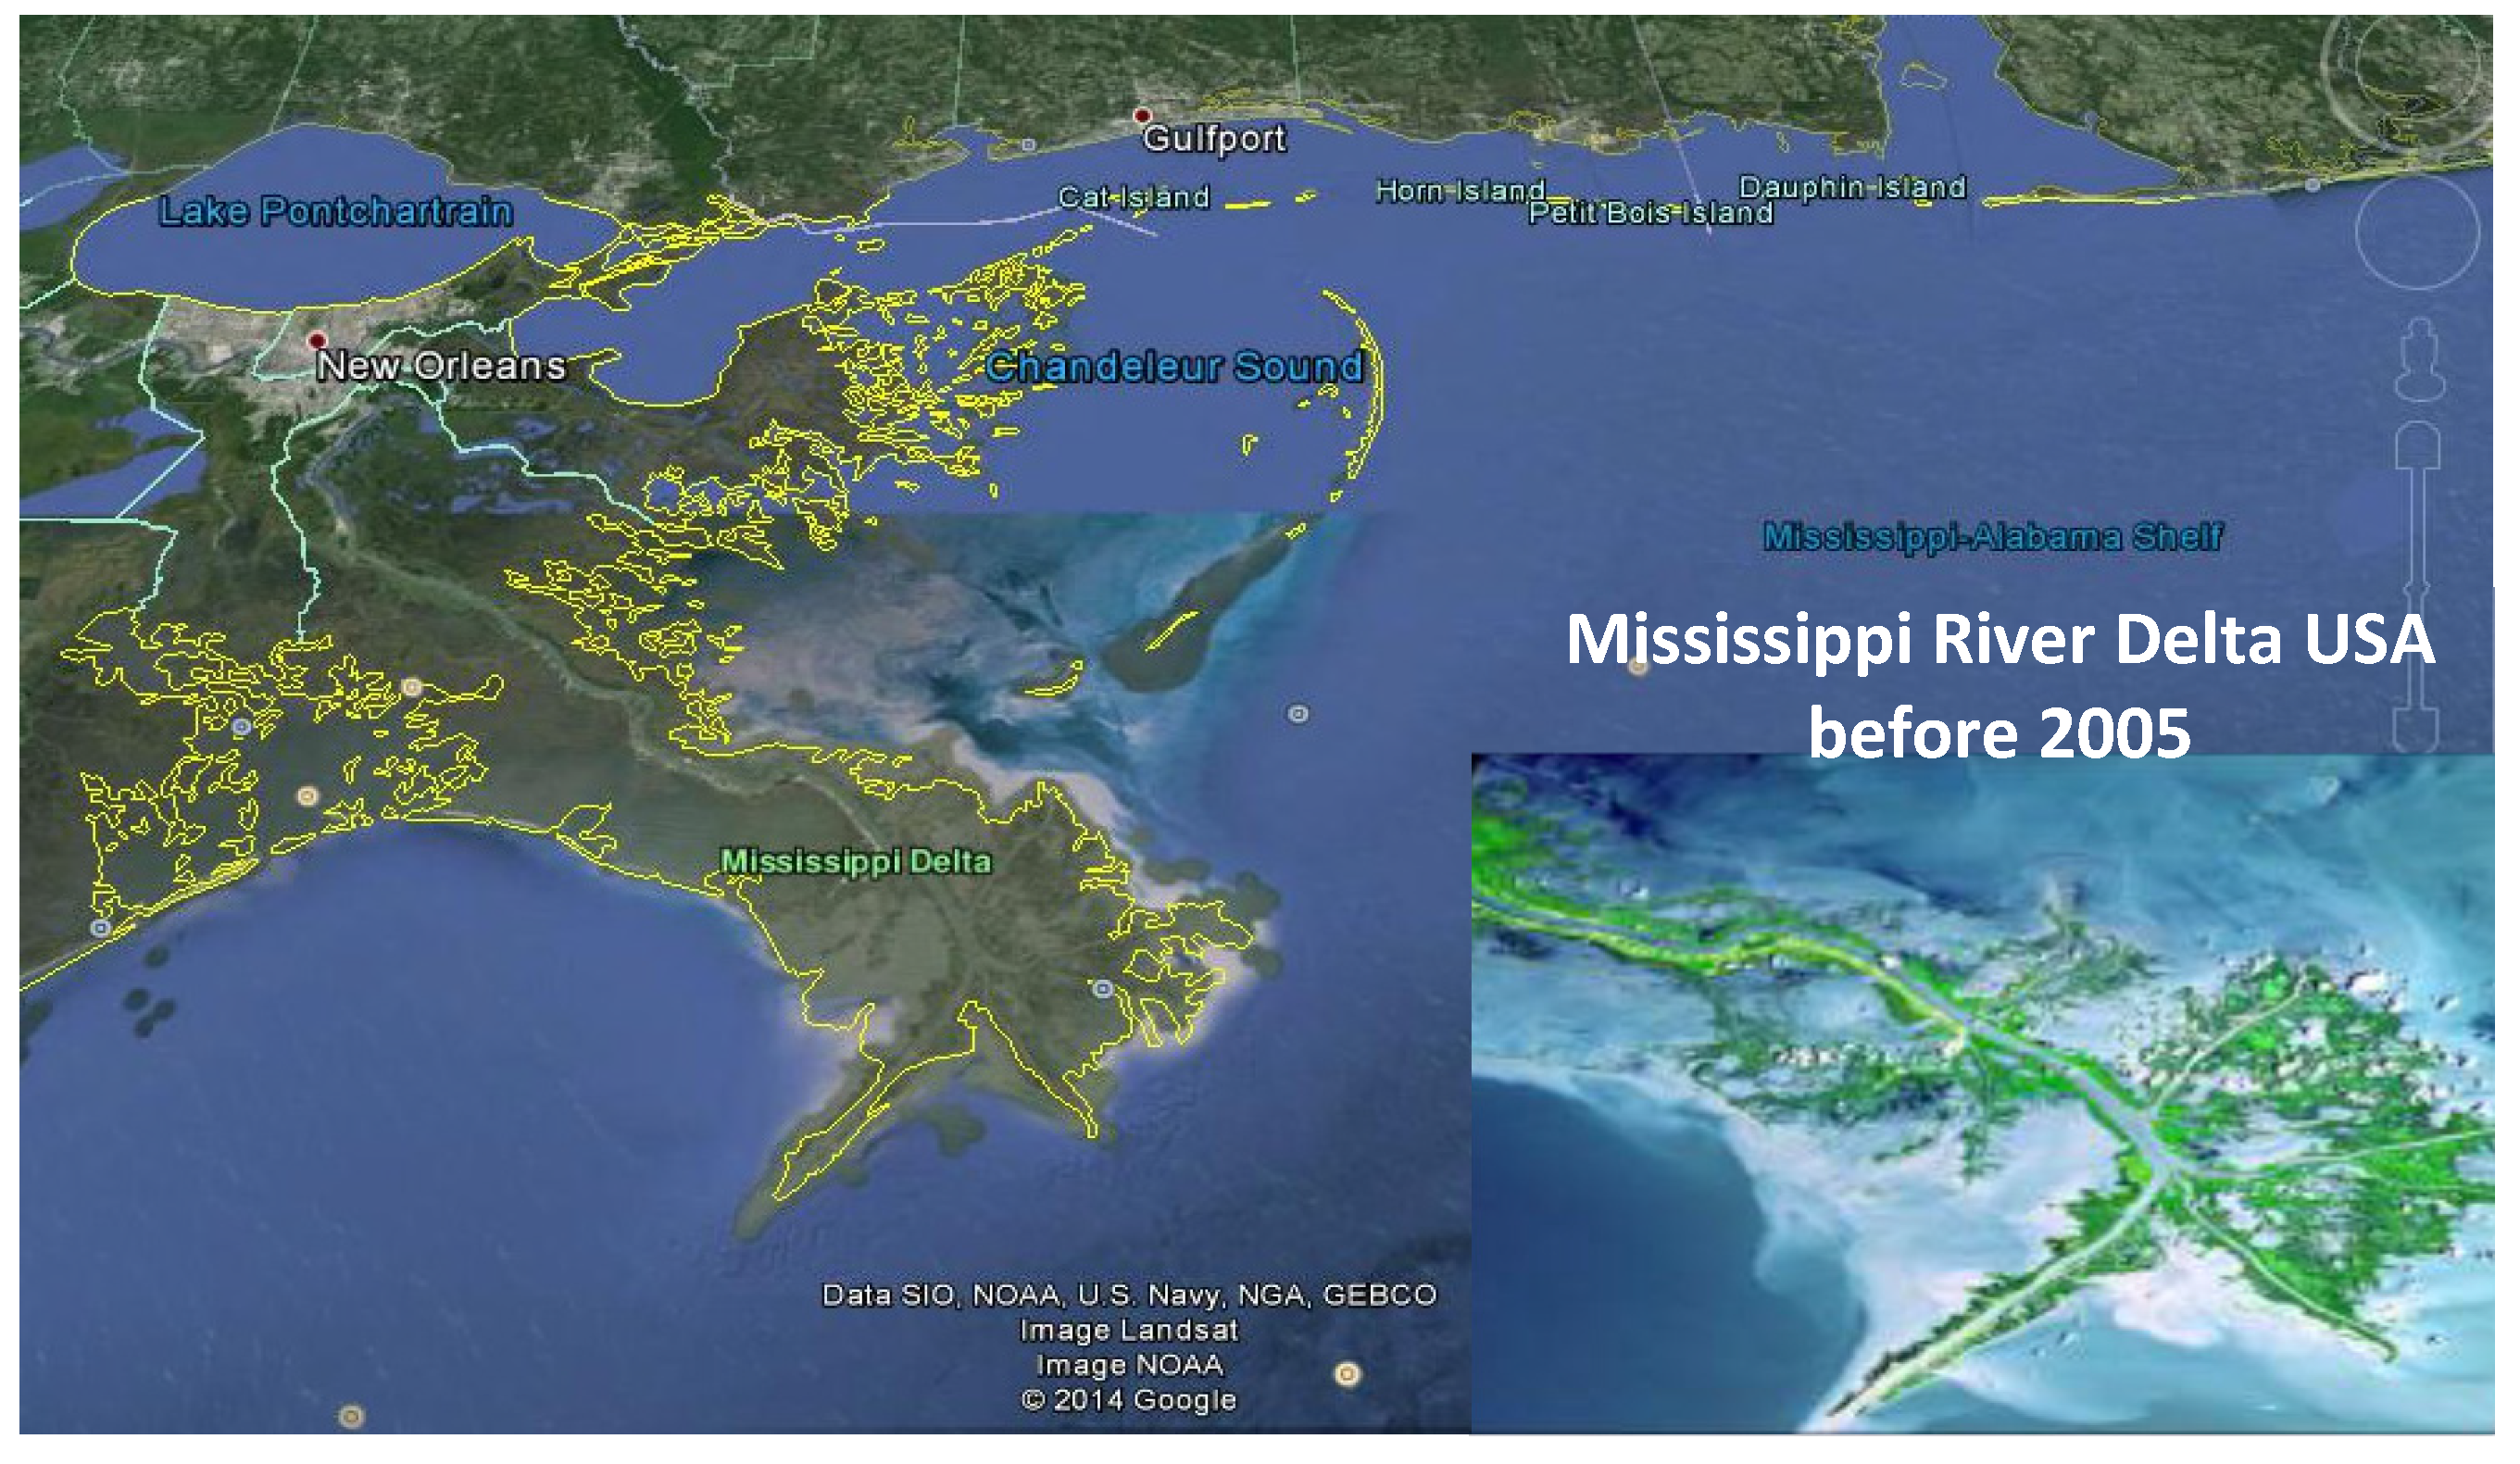
Figure 4.
Map image of the Louisiana delta plain, Mississippi River delta, coastal barrier islands and wetlands, and New Orleans just south of Lake Pontchatrain (Google Earth 2014).
Figure 4.
Map image of the Louisiana delta plain, Mississippi River delta, coastal barrier islands and wetlands, and New Orleans just south of Lake Pontchatrain (Google Earth 2014).
Deltas have been subjected to significant coastal changes due to a variety of man-made factors over the past several hundred years, such as reduction in sediment load due to the construction of dams and levees, such as along the Mississippi River and the Nile River. In addition, the reduction of river currents modifies the near shore circulation, induced by wave–current interaction, which maintained the delta morphology for many centuries. Such effects of the combined wave–current flow, on nearshore circulation, are detailed in studies by Ismail [
12,
13]. For the Nile, the Aswan High Dam built in 1965 has caused significant coastal changes due to sediment depletion, exacerbating subsidence and shoreline erosion (
Figure 3). For the USA, Louisiana’s delta plain has the highest rates of coastal erosion and wetland loss of any region in the world due to a combination of complex natural processes and anthropogenic actions. Since 1900, about 4900 km
2 of wetlands in coastal Louisiana have been lost (
Figure 4).
6. Nile Delta Coast and 2010 Storm Effects
The coastal flooding in Alexandria on 12 December 2010 is a striking example of the more progressive severity of events since 2003. Egypt was hit by strong winds, exacerbated by heavy precipitation, up to 60 km/h with 10 h duration. These weather conditions resulted in waves of ~7 m height with a surge of 1.2 m, which forced the closure of Alexandria harbor. The typical significant wave height is 1–1.5 m. Maximum wave height during storm conditions averages 4.5 m. Typical values of storm surge on the delta coast are 40–50 cm. The storm had profound destructive effects on Alexandria, Abu Qir Bay as well as on shorelines between the two river Nile promontories, Rosetta and Damietta.
A comprehensive program has been underway since 1970 to gather data related to coastal erosion along the Nile Delta shore. Review of major coastal problems and general description of the recommended protective measures to address these problems are in the coastal Master Plan for Phase I, as reported by [
14]. Plans are underway to prepare Master Plan Phase II for coastal protection of the Nile Delta coast that will further address future climate change impacts and the need for adaptation alternatives (
Figure 5).
Figure 5.
Maps of the Nile Delta showing potential impacts of a 1 m rise in sea level (Maps from open sources).
Figure 5.
Maps of the Nile Delta showing potential impacts of a 1 m rise in sea level (Maps from open sources).
Mohamed Ali-Seawall Case Study
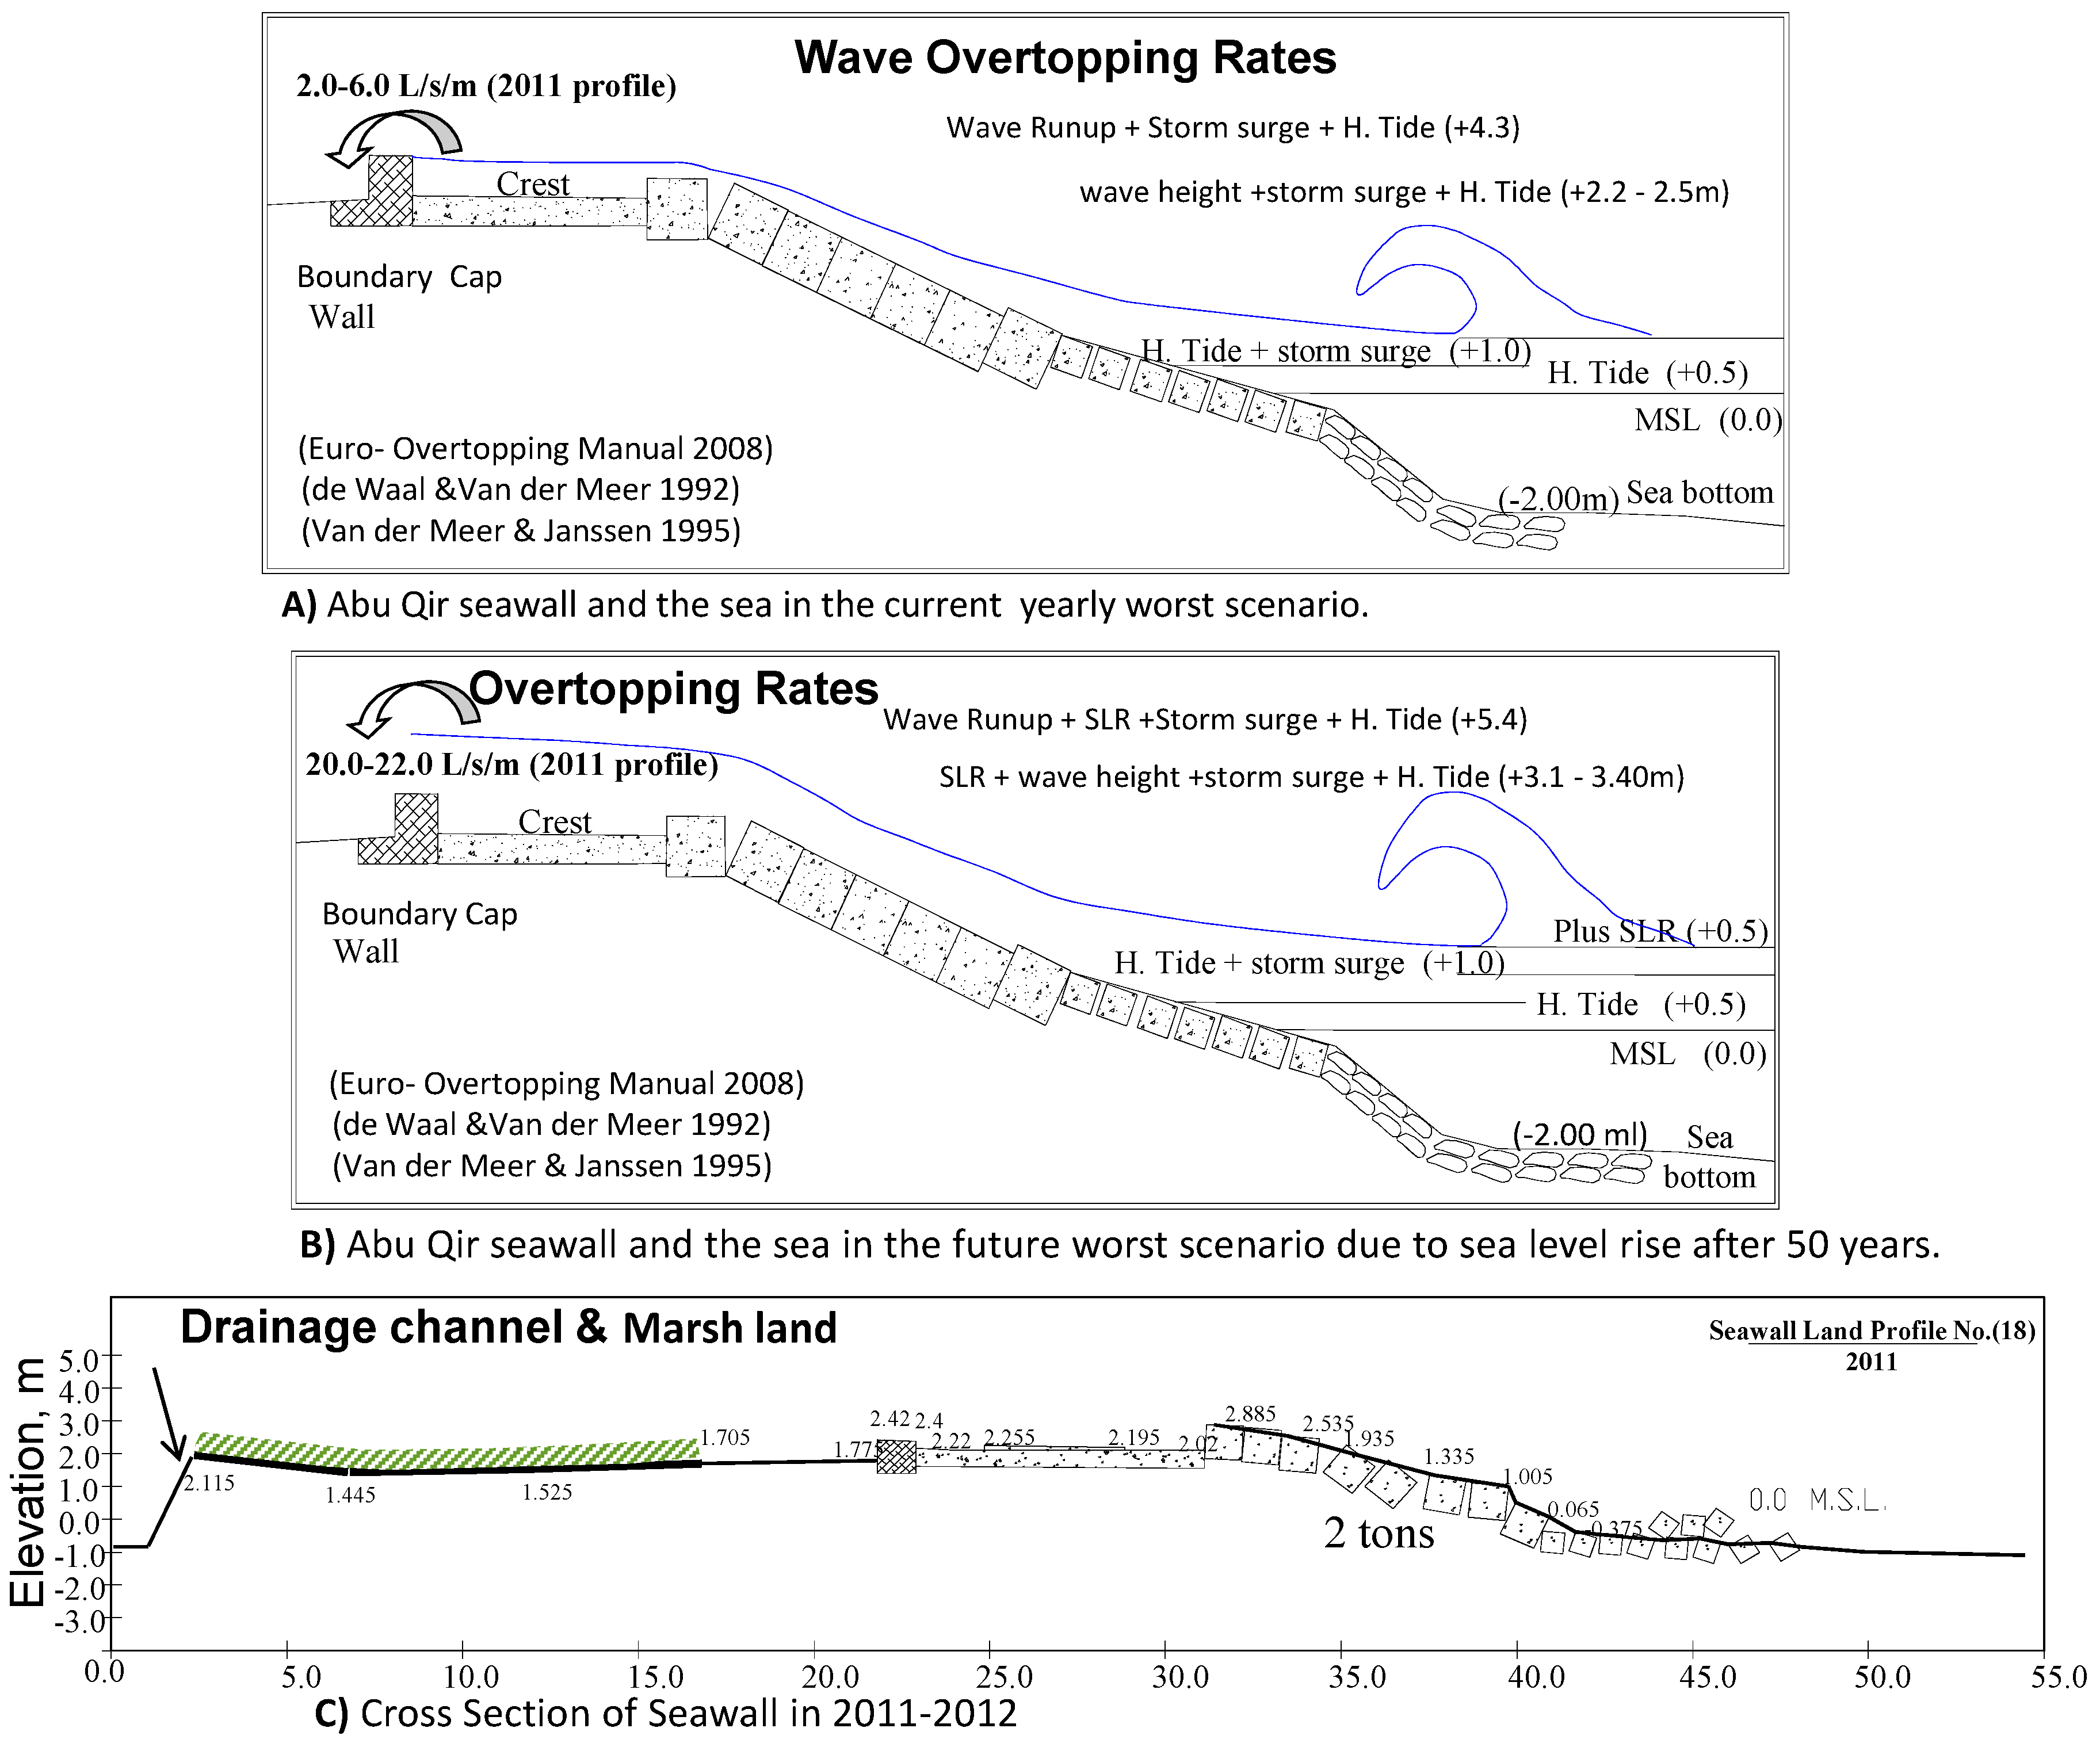
This project is the design-review and upgrade of Mohamed Ali seawall (revetment) in the partially protected Abu Qir Bay under scenarios of extreme storm conditions for the future 50 years return period. These design conditions include: storm wave height, storm surge, subsidence, and projected LSLR (
Figure 6). Rosetta headland with its adjacent Abu Qir Bay form a littoral cell, in which sedimentation is controlled by a combination of waves, coastal currents, tides, and river discharge. The M.A. seawall located in Abu Qir Bay was constructed in 1830 to protect the agriculture lowland against sea flooding (
Figure 3). The seawall was repaired and upgraded in 1981 and a beach segment was created for recreation. As in many coastal regions near major urban areas, the coast is used for a variety of purposes including, a power plant and a liquefied natural gas export terminal. The seawall was upgraded again in 2009, one year before the 2010 storm. Damages from the storm showed an urgency for further upgrades, as highlighted by [
11].
Hydrodynamic analyses were conducted to provide design recommendations to increase the life of the structure, deter flooding of the lowlands, and increase the stability of the structure to impacts of climate change. Using a future LSLR value of 0.5 m in the next 50 years, resulted in a design wave run-up height of 5.4 m (
Figure 6). Two design scenarios were considered to estimate wave height distributions within Abu Qir Bay and along M. Ali seawall.
I. Current morphology with the obtained maximum storm yearly wave condition (Hmax = 3.5 m, T = 7.5 s, N direction, Water Depth = 14 m).
II. Future morphology (recent bathymetry +0.5 m sea-level rise within the next 50 years) with the maximum yearly wave condition in Abu-Qir Bay (4.8 m).
Figure 6.
Impact of climate change on the the M.A. design and recommended drainage channel and creation of wetlands. The value of 0.5 m includes projected global sea-level rise and local subsidence [
11].
Figure 6.
Impact of climate change on the the M.A. design and recommended drainage channel and creation of wetlands. The value of 0.5 m includes projected global sea-level rise and local subsidence [
11].
The model results showed that sea-level rise has a noticeable effect for the case of maximum wave condition at the wall. The wave height in front of the coastal structure at the toe will increase by about 25% after 50 years. Further, based on the obtained wave run-up of 5.4 m and subsequent overtopping, recommendations were made to increase the weight of the armor layer from 0.5 t to 2 t, increase the seawall top elevation to 3 m, and reinforce the revetment toe. Further recommendations are given to increase the height of the seawall cap, and to strengthen the beach top and back slope with a facility to drain the overtopped storm water behind the seawall (
Figure 6).
7. Hurricane Katrina, Storm Protection, and Louisiana Coastal Restorations Plans
Hurricane Katrina (2005) was the fourth most powerful storm to strike Louisiana since 1893 with respect to maximum wind speed and surge elevations at landfall. As Katrina progressed across Breton Sound and Lake Borgne, it generated storm surge of 8.5 m, and 5.5 m wave run-up (total 14 m) on the Mississippi coast, and a 6 m surge southeast of New Orleans, and up to 2 m of additional wave run-up, a total of 8 m. In addition, Katrina dropped 20–30 cm of rain across southeastern Louisiana. In southeastern Louisiana, communities unprotected by levees were flooded; the surge overtopped and destroyed levees protecting eastern New Orleans as well as parishes (i.e., counties) to the south and east, flooding the city and killing an estimated 1400 people. Floodwalls failed along drainage and navigation canals connected to Lakes Pontchartrain and Borgne with significant coastal erosion and wetland loss.
In response to Hurricane Katrina, the Louisiana Coastal Protection and Restoration (LACPR) technical report was prepared by [
15]. In collaboration with the State, the USACE developed and analyzed a range of alternatives, based on a number of structural, nonstructural, and coastal restoration measures, to reduce storm surge risk in south Louisiana. As a representation of Category 5 storm risk reduction, the report presents alternatives for the 100-year, 400-year, and 1000-year design levels. The 400-year flood event is an approximation of Hurricane Katrina. The philosophy of integrated defense for reducing risk from hurricane surge was used based on a “Multiple Lines of Defense” strategy that no single measure or approach will be sufficient for achieving the risk reduction objectives. This integrated defense solution has been the Hurricane and Storm Damage Risk Reduction System (HSDRRS), with a budget of $14.5 billon. It includes five parishes and consists of 560 km of levees and floodwalls, 73 non-federal pumping stations, three canal closure structures with pumps, and four gated outlets. One major structural component of the system is the Inner Harbor Navigation Canal—Lake Borgne Surge Barrier (IHNC-LBSB) [
16,
17,
18].
7.1. IHNC Lake Borgne Storm Surge Barrier—Sea Level, Subsidence and Barrier Design Height
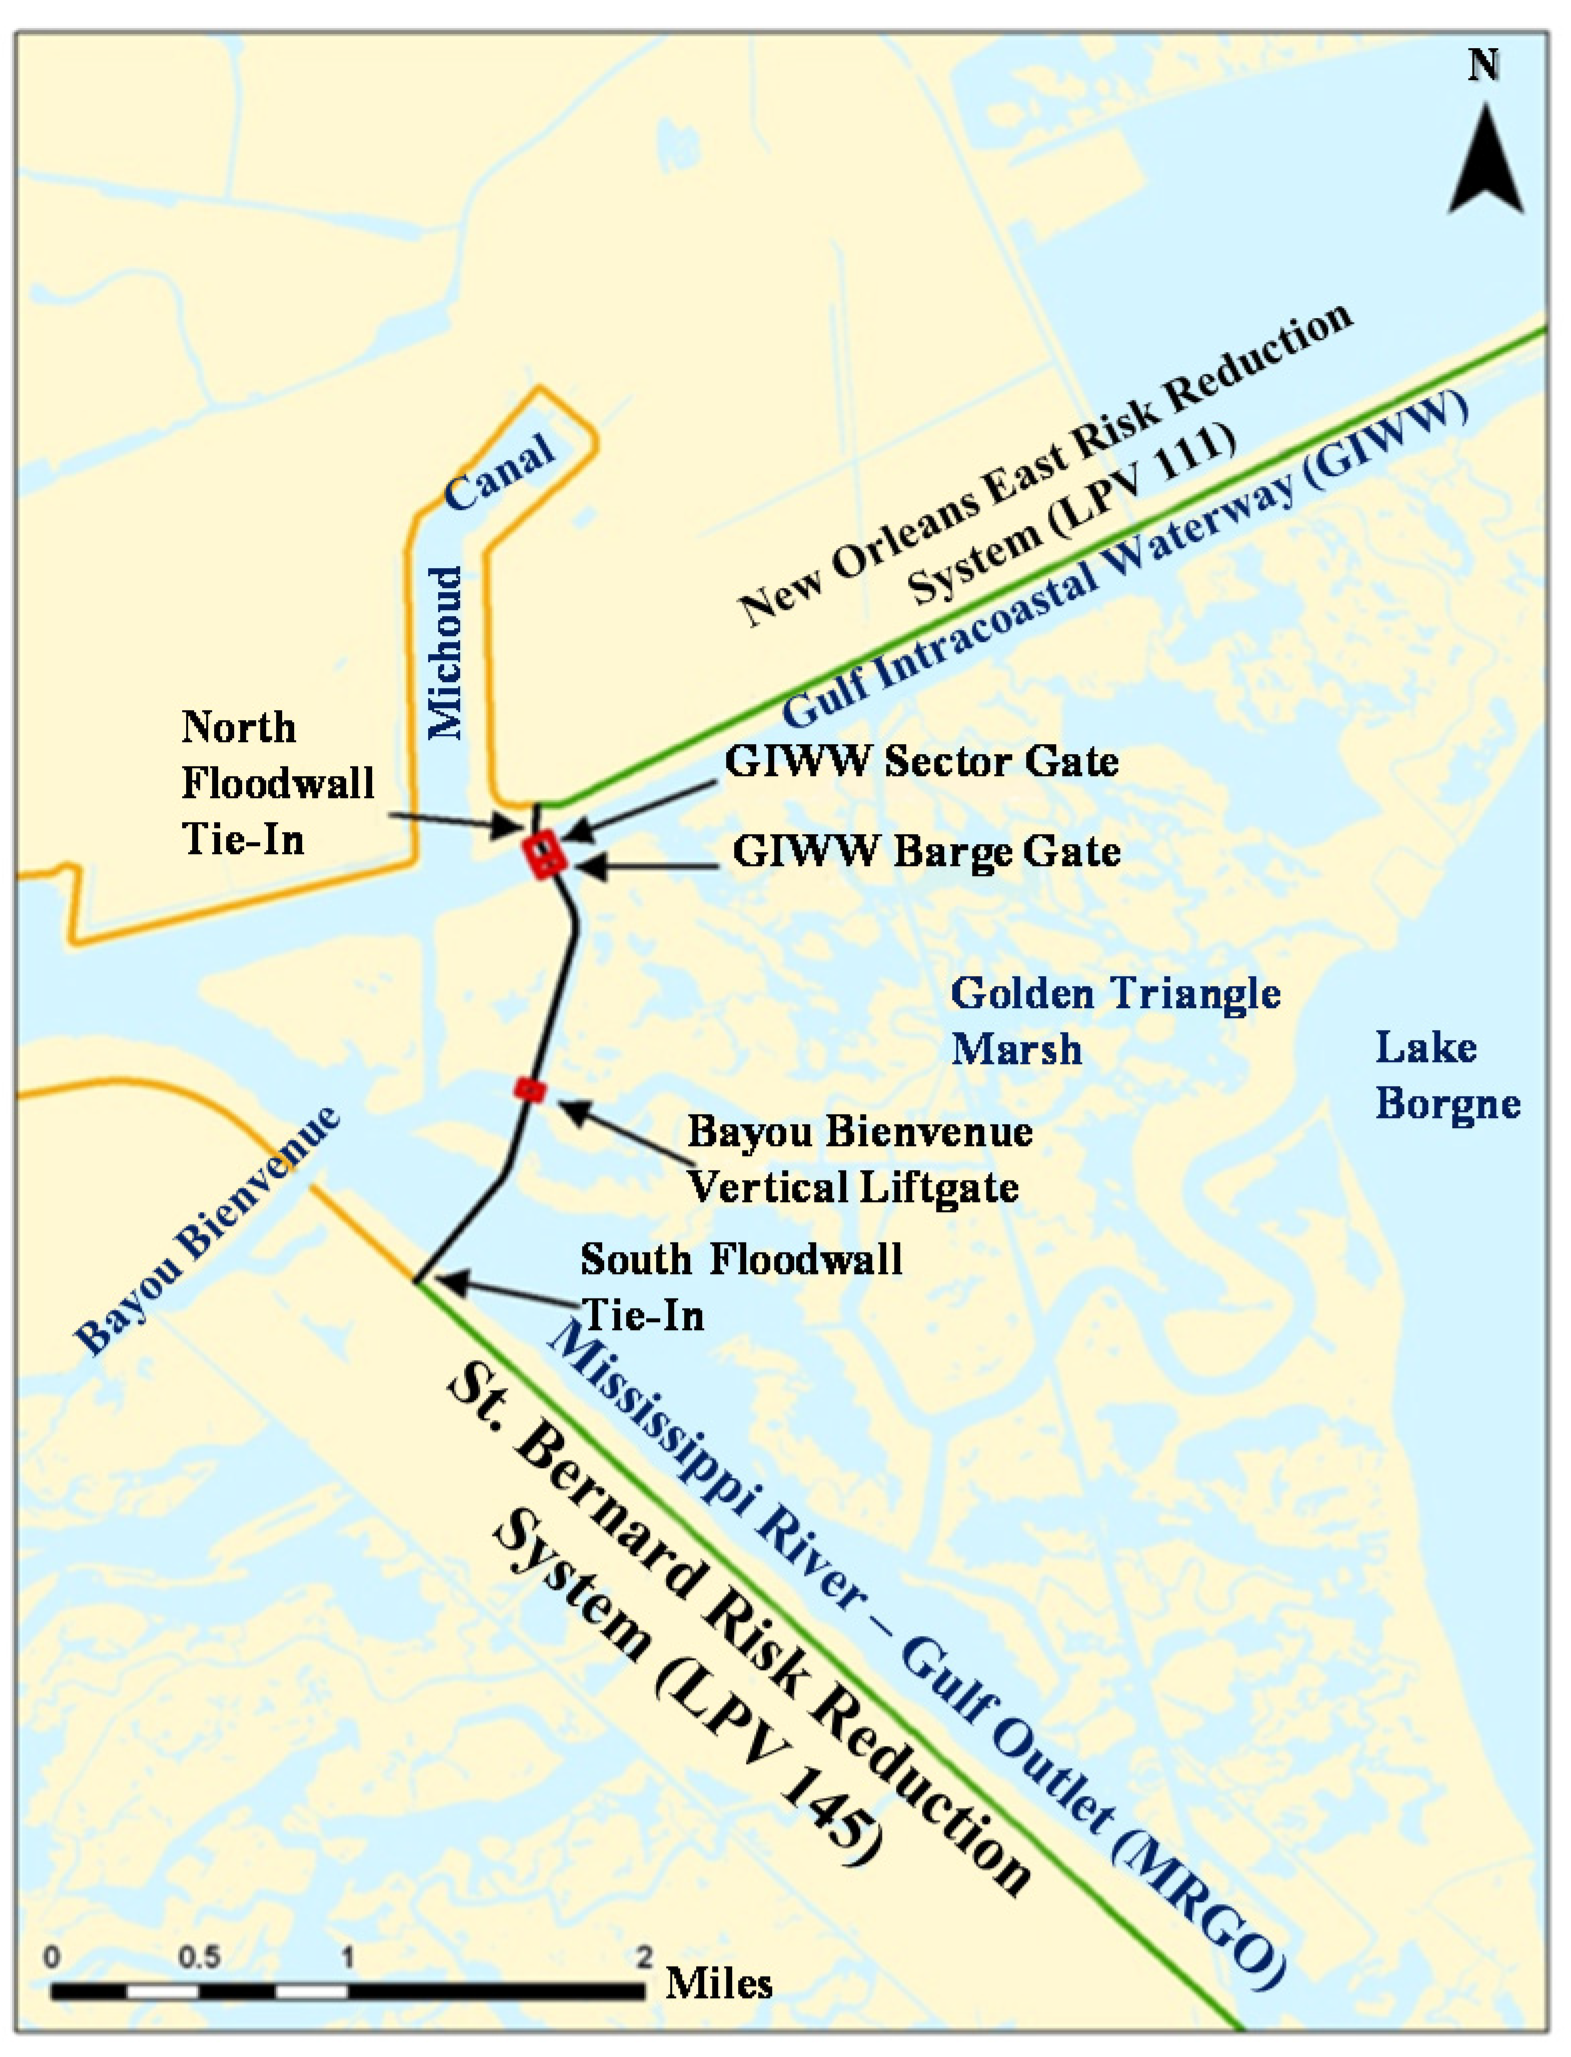
The 2.9 km-long IHNC-LBSB is located at the confluence of the Gulf Intracoastal Waterway (GIWW) and the Mississippi River Gulf Outlet (MRGO), about 19 km east of New Orleans (
Figure 7). The surge barrier, completed in 2011, works in tandem with the Seabrook Floodgate Complex constructed at the north end of the IHNC at Lake Pontchartrain, (
Figure 8) [
18,
19].
The IHNC-LBSB has three gates that allow vessel passage through the barrier and provides a complete closure of the MRGO navigation channel.
Figure 7.
Map from open source of the Lake Borgne surge barrier [
15].
Figure 7.
Map from open source of the Lake Borgne surge barrier [
15].
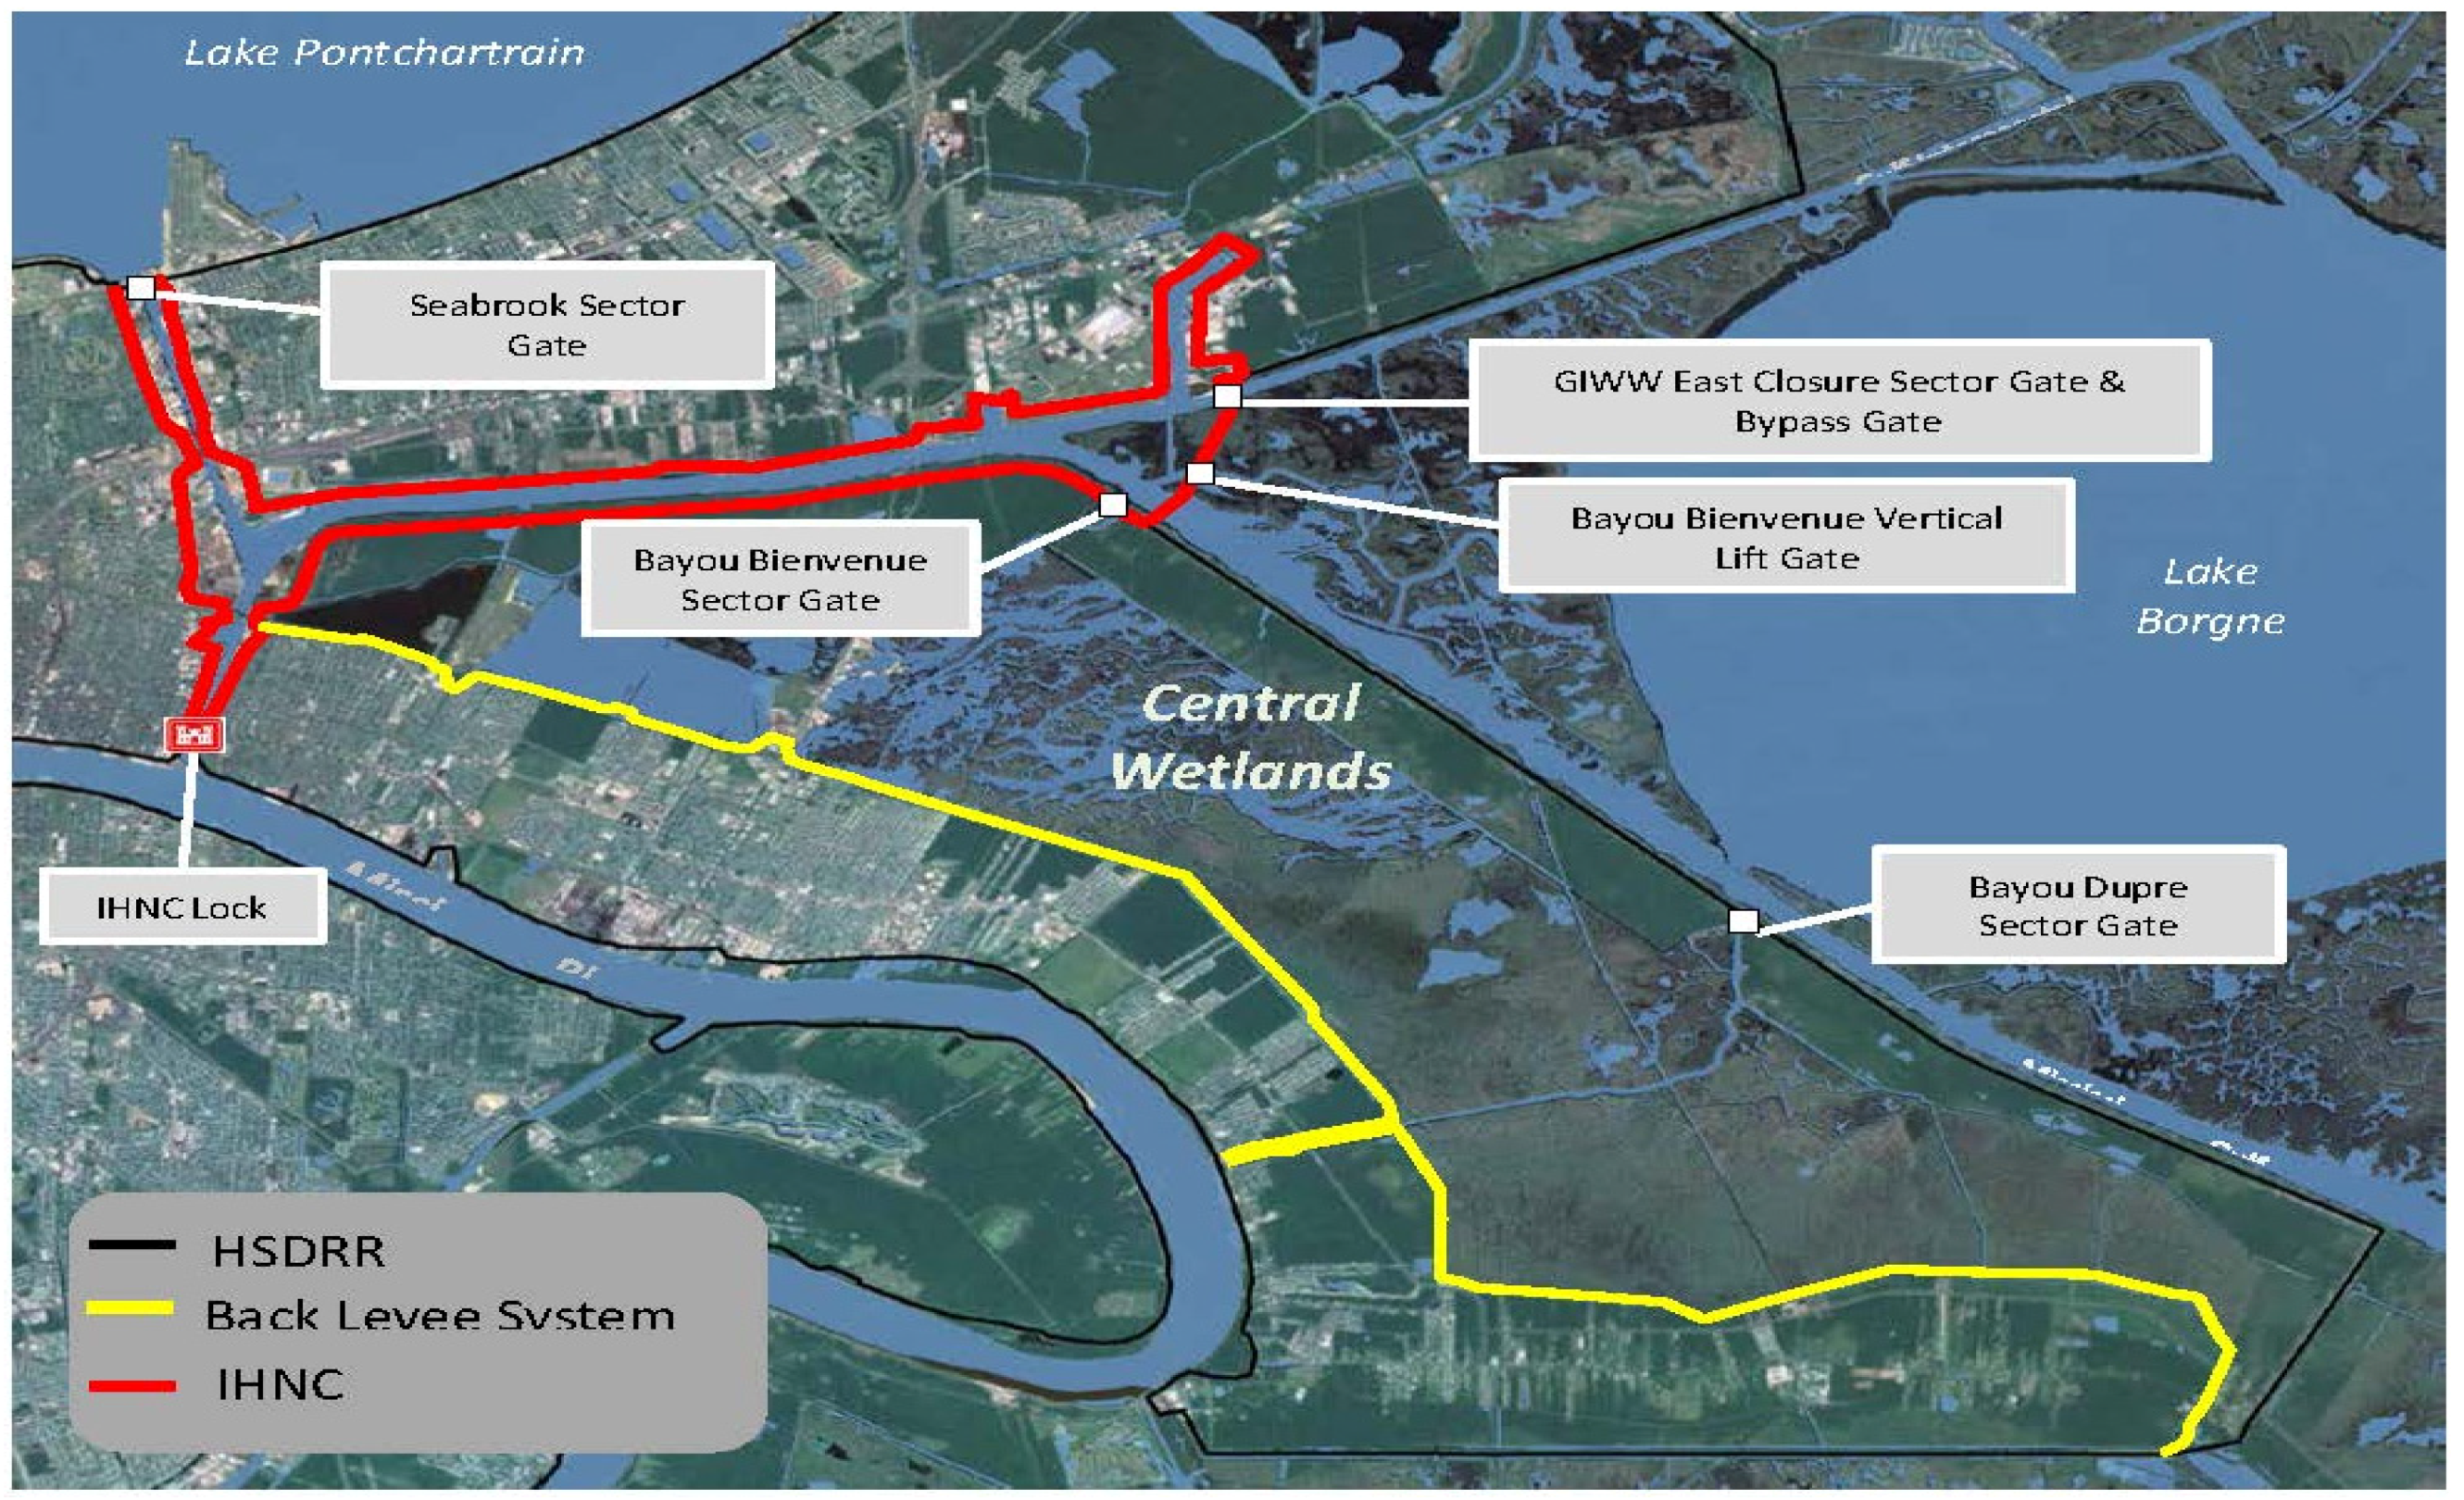
Figure 8.
Location map of the IHNC-LBSB, IHNC floodwalls and the Central Wetlands.
Figure 8.
Location map of the IHNC-LBSB, IHNC floodwalls and the Central Wetlands.
The surge barrier design was based on detailed modeling of wind, surge, waves and rainfall for 152 synthetic storms that were selected to span the historical record of storms that have impacted southeastern Louisiana. Responses from this limited storm set were then interpolated to a much larger storm set to represent the full range of possible storm conditions and to enable recurrence analysis. The final 8 m design height (selected to minimize the impact of a 100-year, 1% chance annual occurrence event and provide resilience to a 500-year, 0.2% chance annual occurrence event) included 0.3 m of LSLR over the 50-year design life [
20]. Given the magnitude of the IHNC-LBSB project, the significance of the urban area that is being protected, the global sea level rise predicted by [
15], (
i.e., [
15] Table 4.1, 0.64–1 m by 2100) and the substantial subsidence that has been observed in parts of southern Louisiana, (e.g.,
Figure 9), one might question why a more conservative design height was not selected (e.g., ~10 m) that would minimize the effects of a 500-year event over a design lifetime reaching until 2100. An alternative means of increasing the design capacity of the IHNC-LBSB is to expand the storage capacity for water that overtops the barrier. Currently there is a modest storage volume inside the IHNC for water to accumulate before exceeding the IHNC floodwalls if it overtops the IHNC-LBSB barrier. This storage volume is critical to providing system resilience to the 500-year event. However, the elevated water levels in the IHNC would bring any vessel that remained inside and broke its mooring to a level where they could directly impact and damage the IHNC floodwalls. The IHNC storage volume could be expanded by more than ten-fold, and the water level minimized, if water is allowed to flow through the Bayou Bienvenue Sector Gate (
Figure 8) and enter a marsh area called the Central Wetlands (
Figure 8). While the Central Wetlands are actually located inside the HSDRRS, the inhabited areas of Orleans and St. Bernard Parishes are protected by an interior “back” levee system, as shown in
Figure 8. We strongly encourage investigation of this option as a critical, long term means of lowering the risk of overtopping or failure of the floodwalls in the IHNC and another catastrophic flooding of New Orleans.
Figure 9.
USACE projected sea-level rise curves for Grand Isle, Louisiana. These curves include eustatic (global) sea-level rise values and subsidence rates [
7].
Figure 9.
USACE projected sea-level rise curves for Grand Isle, Louisiana. These curves include eustatic (global) sea-level rise values and subsidence rates [
7].
7.2. West Closure Pump Station
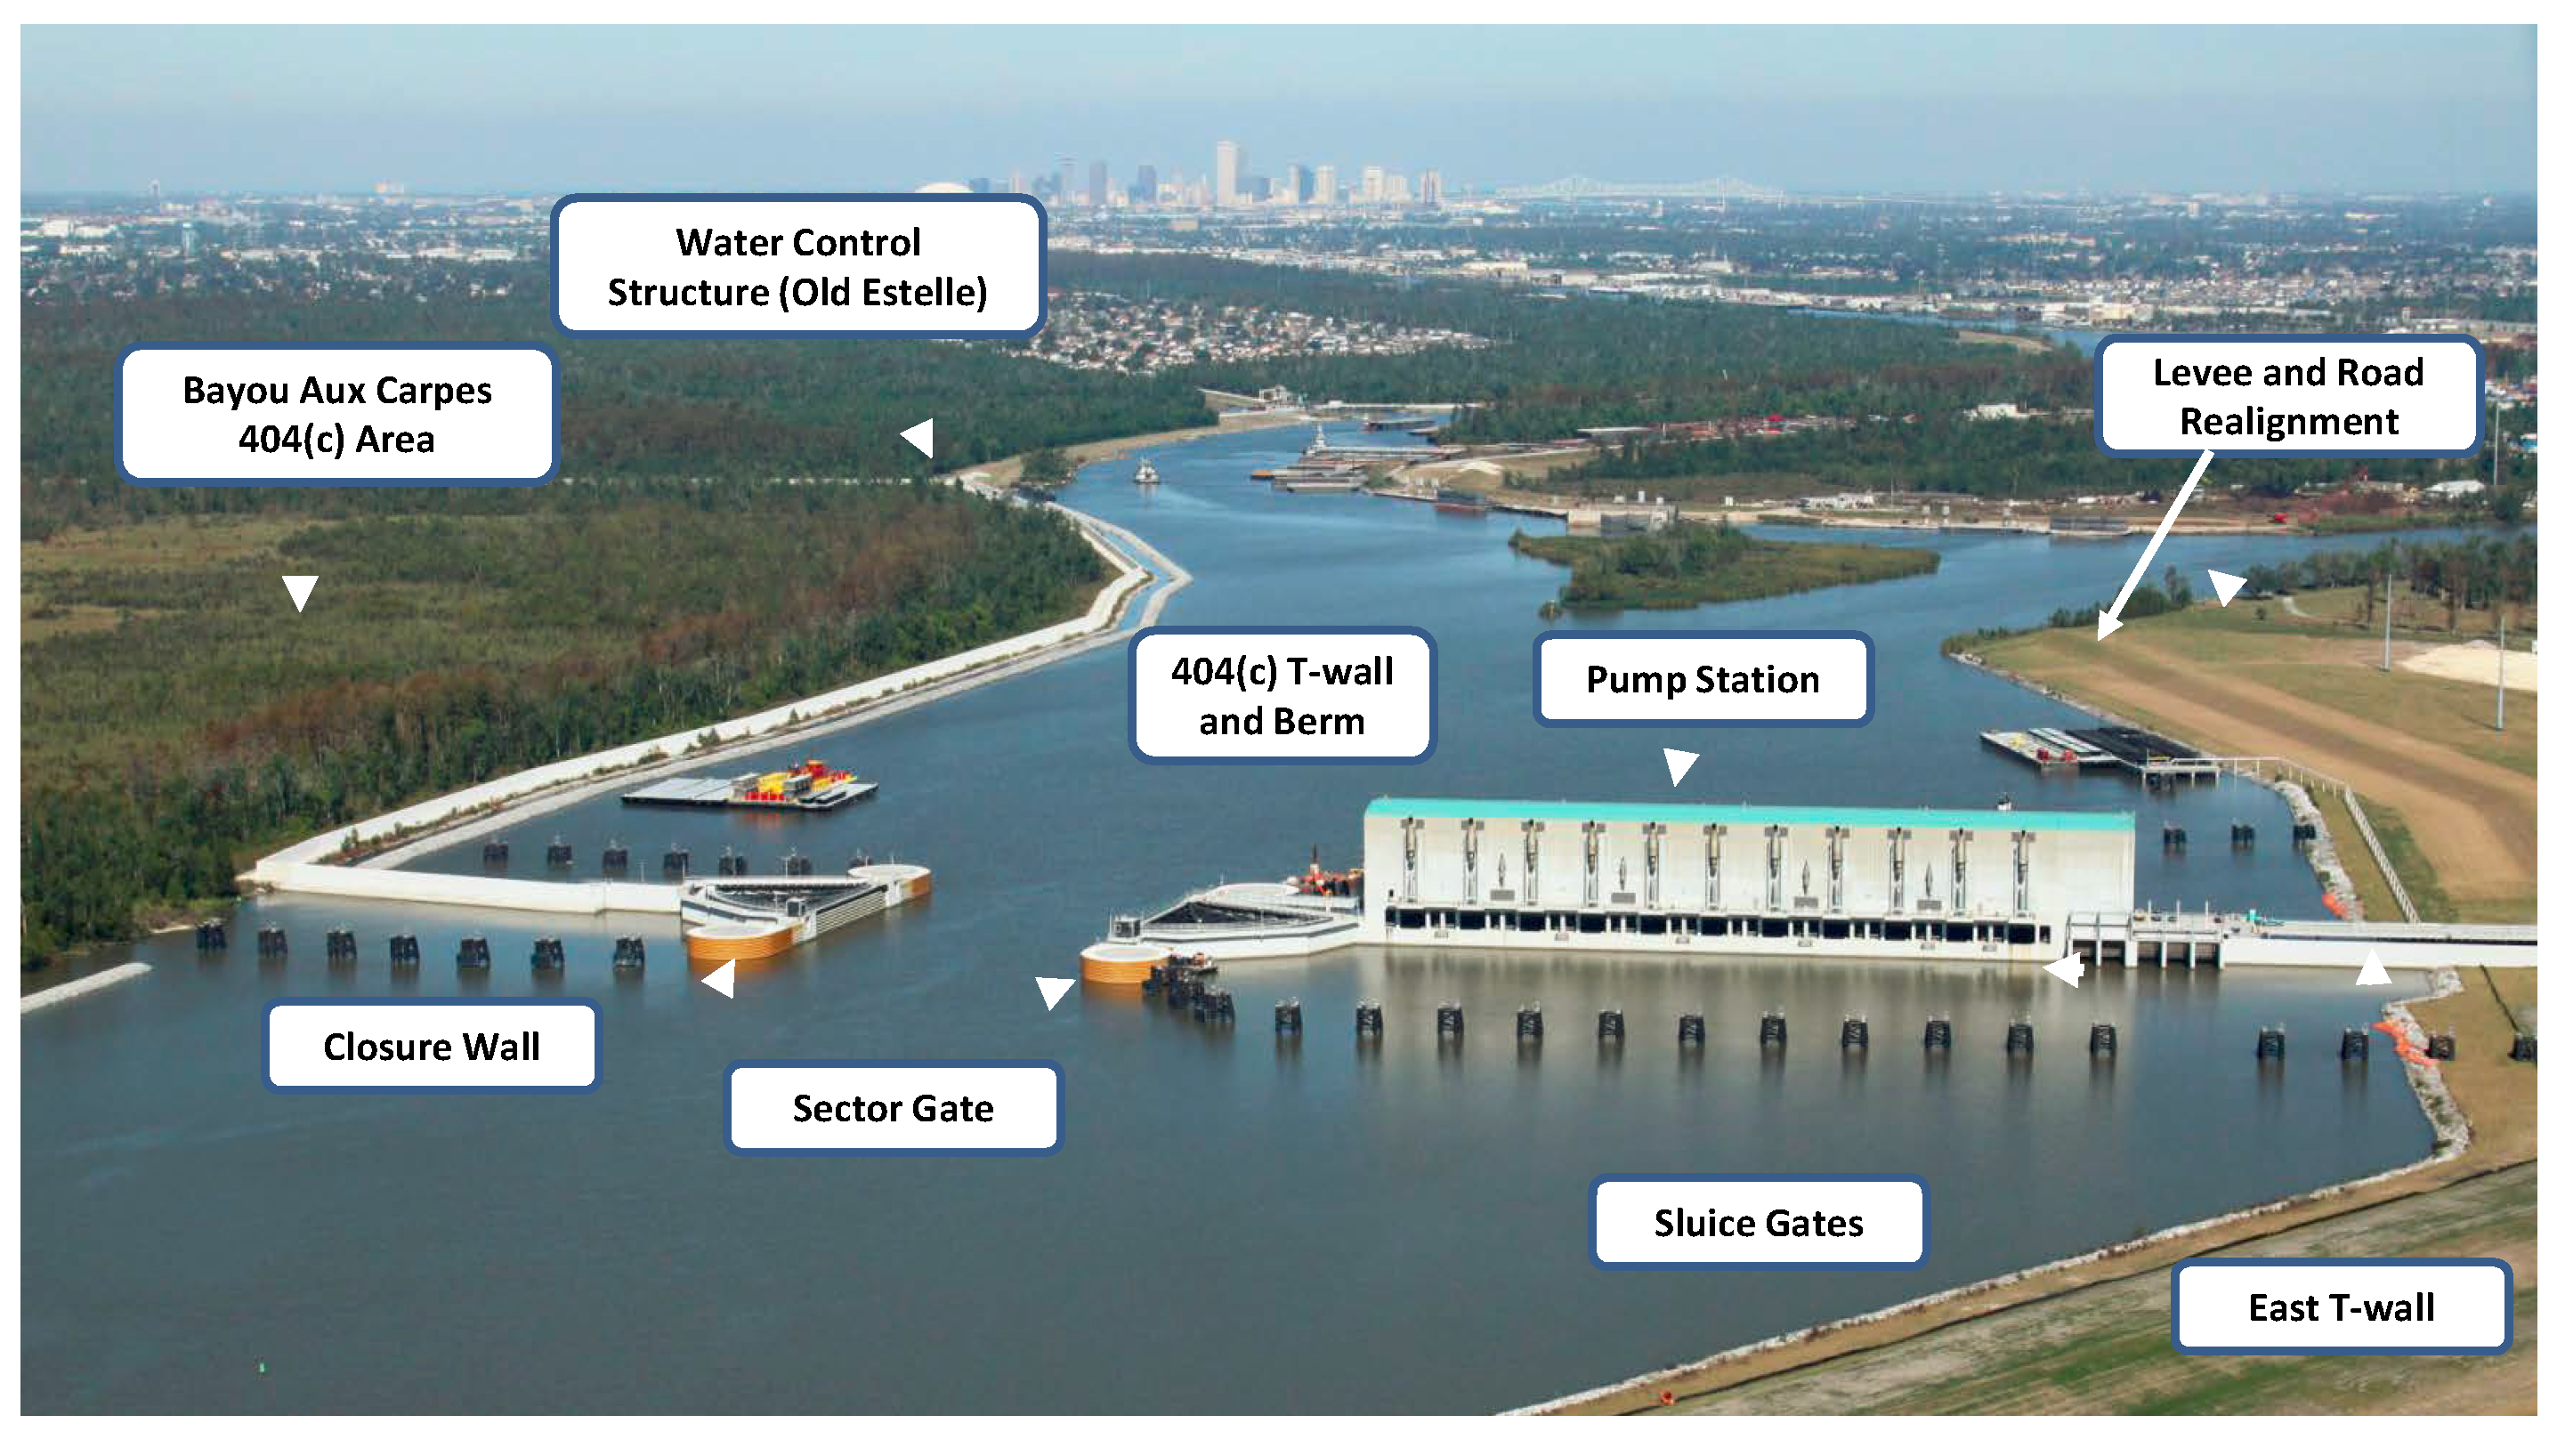
On the opposite side of the Mississippi River, lies the other main perimeter defense against flooding from storm surge (
Figure 10). The West Closure Complex must operate in a fail-safe mode whenever severe storms threaten New Orleans, to prevent interior flooding of the west basin. When the navigable sector gate is closed to block storm surges, catastrophic flooding can be mitigated by pump station operation. Similar concerns to those raised for the Lake Borgne surge barrier exist about the design parameters (including the design storm recurrence and the design lifetime) and the accompanying adequacy of LSLR (subsidence and sea-level rise) assumptions in the design of this facility. In this case, the situation is further exacerbated by the potential impact to pumping operations if the closure is overtopped by surge and waves or experiences an extended power outage that is likely to accompany such an event.
Figure 10.
Image of the GIWW—West Closure Pump station.
Figure 10.
Image of the GIWW—West Closure Pump station.
7.3. Louisiana Comprehensive Master Plan 2012
Over the past 30 years, a series of plans for addressing land loss have been developed, the LACPR is described above, but the most recent and ambitious is the Comprehensive Master Plan completed in 2012 [
21]. This plan builds on earlier plans and discusses the importance of trying to deal with land loss by means of a variety of structural, nonstructural, and even “voluntary acquisition”. The time frame is limited to 50 years into the future with a projected budget of $50+ billion. Restoration efforts aim at reconnecting the Mississippi River to the deltaic plain. While the objective of the plan is to ultimately have a healthy and sustainable coast, the lack of discussion of conditions likely to prevail beyond the next 50 years is an unfortunate omission.
Future changes to the delta plain over just the next 50 years were addressed in maps and figures showing predicted change, and rather than using the usual terms for sea-level rise projections due to global warming, the plan instead used “moderate environmental scenarios” for the current situation and “less optimistic environmental scenarios” using the GSLR reported values of 0.12 to 0.65 m by 2050. But there is no discussion of climate change and its impacts as the central driver of the less optimistic environmental conditions. Land subsidence, a large component of LSLR (~75%), is highly variable across the delta plain (~2–35 mm/year) and was factored into the reported scenarios. However, discussion is lacking on the natural geologic forces and man-made causes of subsidence such as oil, gas, and ground-water extraction. Since LSLR is already 0.9 m over parts of the coast over the past century [
22], the current global average is 3.2 mm/year, and recent climate literature projects GSLR to be 2 m+ by 2100, it appears the CPRA’s plan scenarios understate the risk to New Orleans and the delta plain due to continued rapid land subsidence and projected sea-level rise to 2100 and for centuries into the future. More realistic scenario values of LSLR for planning and design might be 0.5 to 1 m by 2050 and 3 m by 2100.
8. Hurricane Sandy and New York City Coastal Protection Plans
The New York City (NYC) Metropolitan area is the largest of the 25 most densely populated areas in the east coast of the U.S., out of which 23 are highly vulnerable to storms and sea-level rise. Hurricane Sandy made landfall along the New Jersey coast on 29 October 2012. Sandy was the largest extra-tropical cyclone in recorded history for the north Atlantic region. It made landfall near high tide with maximum surge elevation of 4.4 m (NOAA Battery tide gauge station), while the average tide range is 1.4 m. Deaths totaled 72 people ; total damages were ~$50 Billion and New York City sustained $19 Billion in damages, mostly due to surge flooding and fires. Damages were also significant for the northern New Jersey region and extended as far east as Cape Cod, Massachusetts. While Hurricane Sandy was not “caused” by climate change, storm surge elevations were enhanced by LSLR over the past century, which is partly an impact of climate warming. The Battery gauge shows 28 cm of relative rise over the past century and of that total about 12.2 cm is due to land subsidence as a result of rebound of Earth’s crust. Moreover, the Sandy Hook, New Jersey gauge located across Lower New York Harbor has even higher rates of 39 cm LSLR over the past century, of which ~22.7 cm is due to subsidence [
22].
Integrated elements of plans to rebuild after Sandy include elevating structures, nourishing barrier islands and dunes, and flood-proofing major infrastructure. Another long-term infrastructure adaptation measure considered was installation of storm surge barriers across vulnerable openings to the sea, including the Verrazano Narrows, upper East River and the Arthur Kill channel.
New York City Climate Change Plans for Adaptation
Following Sandy, NYC undertook comprehensive studies of the effects of Sandy on the coast as well as the urban infrastructure and developed plans for making the city more resilient to future storms and the increasing impacts of climate warming [
23]. The plans were intermediate in time span, looking to year 2080 (
Figure 11). For projecting sea-level rise, two model scenarios were employed. One, using methods from the recent IPCC assessment resulted in GSLR projections of 20.3–58.4 cm by 2080. A second method that included local subsidence and uncertainty values, more rapid rates of ice sheet melt for Greenland and Antarctica and greater atmospheric GHG emissions resulted in LSLR projections of 1.0–1.4 m by 2080, which is in close agreement with [
6]. Beyond 2080, GSLR very likely will continue, possibly at even higher rates. Levels of 3 m or higher are possible over the next several hundred years if current high GHG emissions, ice sheet melting and global warming continue.
For many recent U.S. coastal protection plans, sea level change is factored in as a critical element from response to Hurricane Sandy, to the North Atlantic Coast Comprehensive Study, to analyses for projects currently in planning and engineering design. The planning process by NYC will be refined as climate science and predictive tools improve. New Jersey also sustained major flood damage and loss of life from Sandy and restoration is underway, mostly on barrier islands, but except for some floodplain “buy-outs”, there appears to be less planning for future conditions and adaptation. Integrated elements of plans to rebuild after Sandy include elevating structures, nourishing barrier islands and dunes, and flood-proofing major infrastructure.
Figure 11.
(
a) NYC projected flooded areas for 100-year storm, SLR 79 cm by 2050 [
23]. (
b) Proposed surge barriers [
24] and surge barrier with gates [
24].
Figure 11.
(
a) NYC projected flooded areas for 100-year storm, SLR 79 cm by 2050 [
23]. (
b) Proposed surge barriers [
24] and surge barrier with gates [
24].
For New York, conceptual design of storm surge barriers was presented by Arcadis [
24] across the vulnerable openings to the sea including the Verrazano Narrows, upper East River and Arthur Kill. Due to requirements of maintaining ship navigation, tidal exchange, and river discharge, barrier gates were proposed by Halcrow [
24] within a surge barrier to be placed across Ambrose channel to accommodate passage of navigating vessels (
Figure 9b). Due to high cost and complexity of such large structures, surge barriers are not in current plans.
9. Conclusions and Recommendations
Review of response and planning of coastal projects following major storms in Egypt, Louisiana, and the New York City region are presented. The review considers varying degrees of climate change impacts projected for the next 50–100 years. To reduce risk and vulnerability, [
3,
8] recommended that adaptation planning using projected GSLR of 0.5–2 m by 2100, plus local geophysical and man-made factors, is advisable. Planning should fit the time frame and degree of protection desired. These boundary conditions demand that the protection of coastal areas requires flexible designs that can be adapted in a phased manner to increasing sea-level rise and increased storm activity over the next 50 to 100 years and beyond [
7]. The reality is that it is not economically feasible to protect all coastlines from high rates of sea-level rise and catastrophicsuper-storms. Structures built for short term (~50 years) and modest sea-level rise (~0.5 m) should be designed such that their height can be raised and size increased in the event that even higher sea levels prevail. New planning protocols need to employ cost-effective coastal protection technologies affordable by developing countries. Engineering plans and design need to incorporate alternatives such as beach nourishment, dune stabilization, and wetland restoration, which could serve as buffers protecting mainland areas from full effects of storm surge and wave action as well as provide environmental benefits. High-risk urban areas will likely require hard structures (e.g., seawalls, revetments, and flood barriers) and pump station infrastructure. Pump operations, however, need to be assured during extended storms. Strategic development of new urban planning policies, including relocation, should be considered when risk is great and in-place adaptation is no longer economically feasible.
