Article

Marine Benthic Habitats and Seabed Suitability Mapping for Potential Ocean Current Energy Siting Offshore Southeast Florida

1
Tierra Consulting Group, Inc., Fort Lauderdale, FL 33309, USA
2
School of Urban & Regional Planning, Florida Atlantic University, Boca Raton, FL 33431, USA
3
Department of Geosciences, Florida Atlantic University, Boca Raton, FL 33431, USA
4
Division of Research, Florida Atlantic University, Boca Raton, FL 33431, USA
*
Author to whom correspondence should be addressed.
These authors contributed equally to this work.
J. Mar. Sci. Eng. 2015, 3(2), 276-298; https://doi.org/10.3390/jmse3020276
Submission received: 15 March 2015 / Accepted: 15 May 2015 / Published: 25 May 2015

Abstract

:
This study examines the legal framework for ocean current energy policy and regulation to develop a metric for assessing the biological and geological characteristics of a seabed area with respect to the siting of OCE devices, a framework of criteria by which to assess seabed suitability (seabed suitability framework) that can facilitate the siting, and implementation of ocean current energy (OCE) projects. Seafloor geology and benthic biological data were analyzed in conjunction with seafloor core sample geostatistical interpolation to locate suitable substrates for OCE anchoring. Existing submarine cable pathways were considered to determine pathways for power transmission cables that circumvent biologically sensitive areas. Suitability analysis indicates that areas east of the Miami Terrace and north of recently identified deep-sea coral mounds are the most appropriate for OCE siting due to abundance of sand/sediment substrate, existing underwater cable route access, and minimal biological presence (i.e., little to no benthic communities). Further reconnaissance requires higher resolution maps of geological substrate and benthic community locations to identify specific OCE development locations, classify benthic conditions, and minimize potentially negative OCE environmental impacts.

Graphical Abstract

1. Introduction

With rising greenhouse gas emissions and climate change, the demand for efficient, clean, renewable energy sources has grown. One such energy source is ocean current energy (OCE), a type of marine renewable energy (MRE), which harnesses power from ocean currents using a hydrokinetic turbine anchored to the seafloor. Despite the fact that the Florida Current generally flows at low speeds (an order of magnitude slower than wind), it has the power of a gale force wind because the density of seawater (1.027 to 1.040 g/cm3) is much higher than that of air (1.275 kg/m3) [1]. This study focuses on a potential OCE project development site in the Florida Current offshore Southeast Florida, in the channel between Florida and the Bahamas (approximately 35 kilometers offshore Palm Beach, Broward and Miami-Dade Counties). Since its inception in 2007, the Southeast National Marine Renewable Energy Center (SNMREC) at Florida Atlantic University has been involved in several studies to evaluate the environmental constraints of OCE and recently conducted at sea tests of the first prototype turbine device [2]. In addition to the hydrokinetic devices, future OCE installations will most likely utilize anchors, mooring buoys, and cable systems all of which attach to the seafloor [3]. While several siting factors (i.e., land-based power grid connection, shore-side infrastructure) play a role in OCE development, seabed suitability for OCE devices (anchors, moors, and cables) remains a topic of interest for future research due to the lack of readily available data. Because OCE installations must be attached to the seafloor there is a possibility of negatively impacting the benthic marine environment (e.g., OCE turbine being placed on or near coral reef communities resulting in coral damage). Existing marine renewable energy projects (i.e., wave and tidal energy) have shown that a thorough evaluation of seafloor geology and benthic communities allows for better, more environmentally-sound MRE siting decisions [4,5,6].

1.1. Laws and Regulations Guiding OCE Development

The siting of OCE installations requires compliance with existing U.S. environmental legislation. Devices used in ocean current energy projects (e.g., anchors, moors, and cables) must be attached to the seafloor or operate in the water column in a way that inflicts minimal negative impacts on the surrounding marine environment. Several federal environmental laws including the National Environmental Policy Act of 1970 (NEPA), the Clean Water Act of 1972 (CWA), the Coastal Zone Management Act of 1972 (CZMA, reauthorized in 1990), Marine Mammal Protection Act of 1972 (MMPA) as Amended in 2007, Magnuson–Stevens Fishery Conservation and Management Act of 1976 (MSFCMA) and its amendments of 1996 and 2006, and the Endangered Species Act of 1973 (ESA) explicitly authorize state involvement in decision-making and enforcement of the federal law in coastal waters (approximately twelve nautical miles) [7]. The OCE research and development occurring on the outer continental shelf (OCS) must also comply with the federal Outer Continental Shelf Lands Act of 1953 (OCSLA) which gives the Bureau of Ocean Energy Management (BOEM) jurisdiction over the federal offshore lands including the southeastern Florida areas proposed for OCE testing. BOEM holds the responsibility to lease the outer continental shelf seabed and leads the NEPA process for activities occurring on the shelf. Other federal agencies such as the U.S. Fish and Wildlife Service (USFWS) have regulatory and enforcement responsibilities with respect to MMPA (1972) and ESA (1973). BOEM consults with USFWS, the National Oceanic and Atmospheric Administration (NOAA) and other federal and state agencies regarding regulatory activities under specific sections of the Acts, and if necessary includes in its environmental impact statements provisions requested by the consulting agencies [8]. The Federal Energy Regulatory Commission (FERC) is authorized by amendments of the Federal Power Act of 1920 and the Energy Policy Act of 2005 to regulate hydroelectric projects on navigable waters and federal lands [9]. A license issued by FERC for ocean current energy installations requires careful consideration of the prospects for power generation in the context of existing non-energy resources and environmental impacts. Finkl and Charlier [10] emphasize the complexity of the regulatory framework as Florida’s unique nearshore coral habitats are under the careful watch of local, national and international environmental agencies and entities including the Florida Department of Environmental Protection, Florida Fish and Wildlife Conservation Commission, the United States Coral Reef Task Force, the Marine Environment Protection Committee of the U.N. International Maritime Organization, and others [10]. The authors discuss in detail environmental concerns associated with OCE deployment in shallow and deepwater marine environments near the southeast Florida coast which is globally known for its presence of abundant coral reef systems and other benthic habitats. Specific considerations related to anchoring, mooring and deployment of power transmission cable systems are underlined [10]. In addition, potential impacts to commercial (crab and shrimp) and recreational fisheries, sea turtles and large mammals are also discussed [10].

1.2. Benthic Characterization and Seabed Suitability for OCE

In compliance with NEPA (42 U.S.C. §§ 4321-4370f) and the Council on Environmental Quality (CEQ) regulations (40 CFR 1501.3b and 1508.9), BOEM issued a lease authorizing Florida Atlantic University (FAU) SNMREC to test ocean current energy technology offshore from southeast Florida, dependent upon the outcomes of an environmental assessment (EA) to assess potential environmental impacts. A Revised Environmental Assessment published in August 2013 established a Finding of No Significant Impact (FONSI) [11]. This finding suggests that potential deployment of OCE by FAU SNMREC is expected to have negligible, insignificant or no impact on the surrounding environment which includes air quality, water quality, biological resources (i.e., beaches), marine mammals, sea turtles, benthic habitats, fish and essential fish habitat (waters and substrate necessary to fish for spawning, breeding, feeding or growth to maturity according to the Magnuson–Stevens Fishery Conservation and Management Act of 1976 (MSFCMA) and its amendments of 1996 and 2006), avian communities, and bats. Under the BOEM’s final Revised Environmental Assessment [11] FAU SNMREC is required to provide additional site-specific reconnaissance surveys to ensure consistency with NEPA and the Essential Fish Habitat provisions of the MSFCMA. More detailed analysis of locations suitable for OCE deployment including anchors, moorings, cables will require high-resolution geophysical surveys using acoustic equipment (i.e., side-scan sonar) or remotely-operated vehicles (ROVs) to further characterize sediments, seafloor geomorphology, and obstructions (e.g., high slope hard-bottom depressions) [11]. Site-specific videographic and/or photographic reconnaissance surveys may also be needed to identify any potential hard-bottom habitat and aid in impact assessment on essential fish habitats as defined under MSFCMA [11].
BOEM [11] and Vinick et al. [12] suggest that the deployment of OCE devices in hard bottom habitats increases the likelihood of significant impacts on the surrounding seabed environment due to higher concentrations of biologic activity. The BOEM Revised Environmental Assessment [11] also suggests that anchoring and mooring of OCE devices in sand or sediment is less likely to result in significant environmental impacts. More specifically, the report states that “the ideal sediment type for the anchoring activity is sand, and disturbances to sand do not cause significant turbidity due to the size of the sand grains” ([11], p. 46).
Against this backdrop and for the purposes of this study, seabed suitability is defined as a metric for assessing the biological and geological characteristics of a seabed area with respect to the siting of OCE devices. Seabed areas with higher presence of biological activity would be classified as unsuitable while seabed areas of lower biological activity would be categorized as having a higher suitability ranking. Environmentally sensitive habitats (i.e., coral reefs, essential fish habitats, and marine protected areas) with respect to proposed OCE development are further discussed in BOEM [11], Vinick et al. [12], Dubbs et al. [13], and Orth et al. [14]. A study commissioned by BOEM in 2012 provides in-depth analysis of the effects of OCE developments on environmental resources (avian communities, marine mammals, sea turtles, fish, and benthic habitats) as well as cultural (archaeological) resources [15]. The report explores the effects of offshore renewable energy projects on three scales: (i) small-scale, at the level of a demonstration project; (ii) large scale, at the level of single commercial development; and (iii) large-scale, at the level of multiple commercial deployments in a region ([15], p. 6). The report further outlines the magnitude of the potential adverse effects at all three scales focusing on moderate and major impacts that warrant future monitoring [15]. The Renewable Energy Effects Matrix and the associated protocols provide a systematic approach toward understanding the impacts of offshore renewable energy projects on ecosystem components at the three scales of development [15]. Orth et al. [14] highlights the ecological importance of seagrass communities due to their ability to act as carbon sinks, nutrient filters, biodiversity hotspots, and nursery grounds. The potential environmental impacts of offshore renewable energy projects at the three scales of development are broad and encompass ecosystems as well as anthropogenic activity components [15]. The focus of this paper is on the benthic communities that represent one of the potential environmental effects of OCE.
Vinick et al. [12] used a host of publicly available data in conjunction with non-invasive geophysical and benthic video surveys to designate habitat areas within the lease blocks. The report specifies that gravelly sediment such as boulders, rubble, and cobble is generally unfavorable for OCE devices and determines that sand is the most appropriate seabed substrate for OCE development [12]. Anchoring studies related to marine hydrokinetic energy [16,17,18,19] specify that clays, mud, sand, and glacial till can be considered functional substrates for many MRE anchor types. However, these studies consistently highlight the importance of sand properties which outperform mud and clay in anchoring studies [12,16,17,18,19]. Sedimentology studies differentiate sand substrates from fine-grained (e.g., mud or clay) and large-grained (e.g., gravel or glacial till) sediments for their varying compatibility with OCE anchoring [18,19,20].
The biological and geological sources explored here collectively suggest that areas containing benthic communities should be given low suitability values (i.e., less suitable, least suitable) when considering OCE placement offshore Florida, while seafloor substrate suitability values will vary based on their physical properties (i.e., grain size). The BOEM [11], p. 46 EA highlights the importance of grain size in relation to sediment disruption due to mooring installations. The report indicates that a sand layer with a depth of at least 0.5 m will have a sufficient holding power for OCE anchoring. Other unconsolidated sediments such as ooze, mud and clay also can provide favorable anchoring and mooring conditions but in such environments anchors’ drag and chain sweeps can cause sediment release into the water column and significant turbidity [11]. Vinick et al. [12] recognized the importance of soft-bottom habitats, which may support a variety of species, and therefore, even though sand-bottom is generally considered a more favorable seabed substrate for OCE deployment, further surveys are still required during the permitting process.

1.3. Geostatistical Methods for Seafloor Geology Mapping

Studies suggest that spatial interpolation methods when used in conjunction with seabed core sample data can provide useful information for both seabed screening and final siting of ocean current energy projects [21,22,23]. Grain size analysis of the ocean floor core data collected at various locations can provide information about the distribution of seabed substrates at commercial deployment scale which is one of the three levels of analysis identified by McCann [15]. Simultaneously, cores at each sampled location can be used for more detailed stratigraphic analyses to study subsurface seabed lithology and stratigraphy, and thus can provide baseline information for small-scale final siting in testing or demonstration projects [15]. This study focuses on commercial-scale seabed mapping and screening for OCE deployment. Geostatistical methods involving various deterministic and probabilistic approaches are useful in developing seafloor surfaces and identifying suitable locations for commercial siting of ocean current energy projects. Deterministic approaches which include Thiessen Polygon Analysis (TPA) and Inverse Weighted Distance (IDW) rely on distance decay functions, while probabilistic methods such as Kriging employ semivariograms weighted by spatial covariance values [24]. Previous studies have discussed in detail the usefulness of both deterministic and probabilistic methods in generating seafloor substrate maps. Thiessen or Voronoi polygons are mathematically derived from perpendicular bisectors of the lines connecting TIN vertices. Technically, points inside a Thiessen polygon are in closer proximity to its generating vertex than points outside the polygon [25]. IDW interpolation is a deterministic approach assigning higher weights to known values closest to the prediction site than other known values located farther away (Johnston et al., 2001) [26]. The Empirical Bayesian Kriging (EBK) is a probabilistic method considered more accurate than other kriging models as its standard errors of prediction are lower [24,27]. EBK offers a more sophisticated kriging approach based on several semivariogram models instead of a single semivariogram applied by other kriging methods [28].
Goff et al. [21] applied ordinary kriging to randomly sampled sediment data from the usSEABED database which includes U.S. continental shelf areas. The dataset held both numerical and textual data types. The text-based descriptions were analyzed via an algorithm that parses text descriptions, then constructs an estimated grain size to separate from the numeric data. Goff et al. [21] found that fact textual (parsed) and numerical semivariograms were quite alike, and therefore, the two were combined for an interpolation using a “bias-correction proxy” approach. Backscatter data for a small section of Long Island continental shelf available through USGS was used to validate the interpolated surface of seafloor sediments. Goff et al. [21] concluded that usSEABED data can be successfully processed using geostatistical methods to characterize the distribution of seabed sediment mean grain size.
Li [22] conducted a study to identify the best technique for spatial prediction of seabed gravel content in the northwest Australia using a hybrid approach combining Random Forest (RF) with IDW or OK (called RFOK or RFIDW, respectively). Li [22] concluded that all RF hybrid methods yielded considerable potential for predicting environmental properties, and suggested additional testing for spatial predictions in individual studies to determine which technique might be the most appropriate based on the dataset and intended applications.
Verfaille et al. [23] conducted an analysis of the Belgian continental shelf using linear regression, ordinary kriging (OK) and kriging with an external drift (KED) to predict sand fractions median grain-size distribution. KED incorporates bathymetry data as ancillary variable to improve the accuracy of the interpolation. A comparison of the results of ordinary kriging and kriging with an external drift indicated that both methods produced relatively accurate spatial representation of grain size. Ordinary kriging did not indicate correlation between bathymetric data and median grain-size. The KED interpolation improved the predictive mapping of seafloor substrates indicating a linear correlation between the median grain-size and water depths. Verfaille et al. [23] found that seafloor sample data can be successfully interpolated using sophisticated kriging methods such as KED.
The flow of the Florida Current offshore southeast Florida, makes this area a prime location for the development of OCE [1,3] and existing underwater cable routes for alternative projects (i.e., telecommunications) supply potential pathways for OCE electric transmission lines. Previous studies [11,12,21,22,23] have implemented geostatistical methods for mapping seafloor substrate and considered biological and geological factors in siting OCE offshore southeast Florida. This paper builds upon previous work by introducing the concept of a seafloor substrate suitability model that uses new geostatistcal techniques to consider biological and geological factors integral to OCE siting offshore southeast Florida. Furthermore, this suitability model expands upon the limited body of research on OCE in southeast Florida study (at present only reported on by Vinick et al. [12] in conjunction with BOEM) thereby enriching our understanding of the benthic environment in this area. Such knowledge facilitates the progression of ocean renewable energy development in Florida.
In this context, our study focuses on: (1) assembling a comprehensive database of geological and benthic parameters relevant to offshore OCE siting; (2) interpolating seafloor geology core sample data to identify suitable substrate for OCE anchoring; (3) analyzing benthic biological data to identify biologically sensitive areas; and (4) determining suitable pathways for power transmission cables to onshore grid systems.

2. Materials and Methods
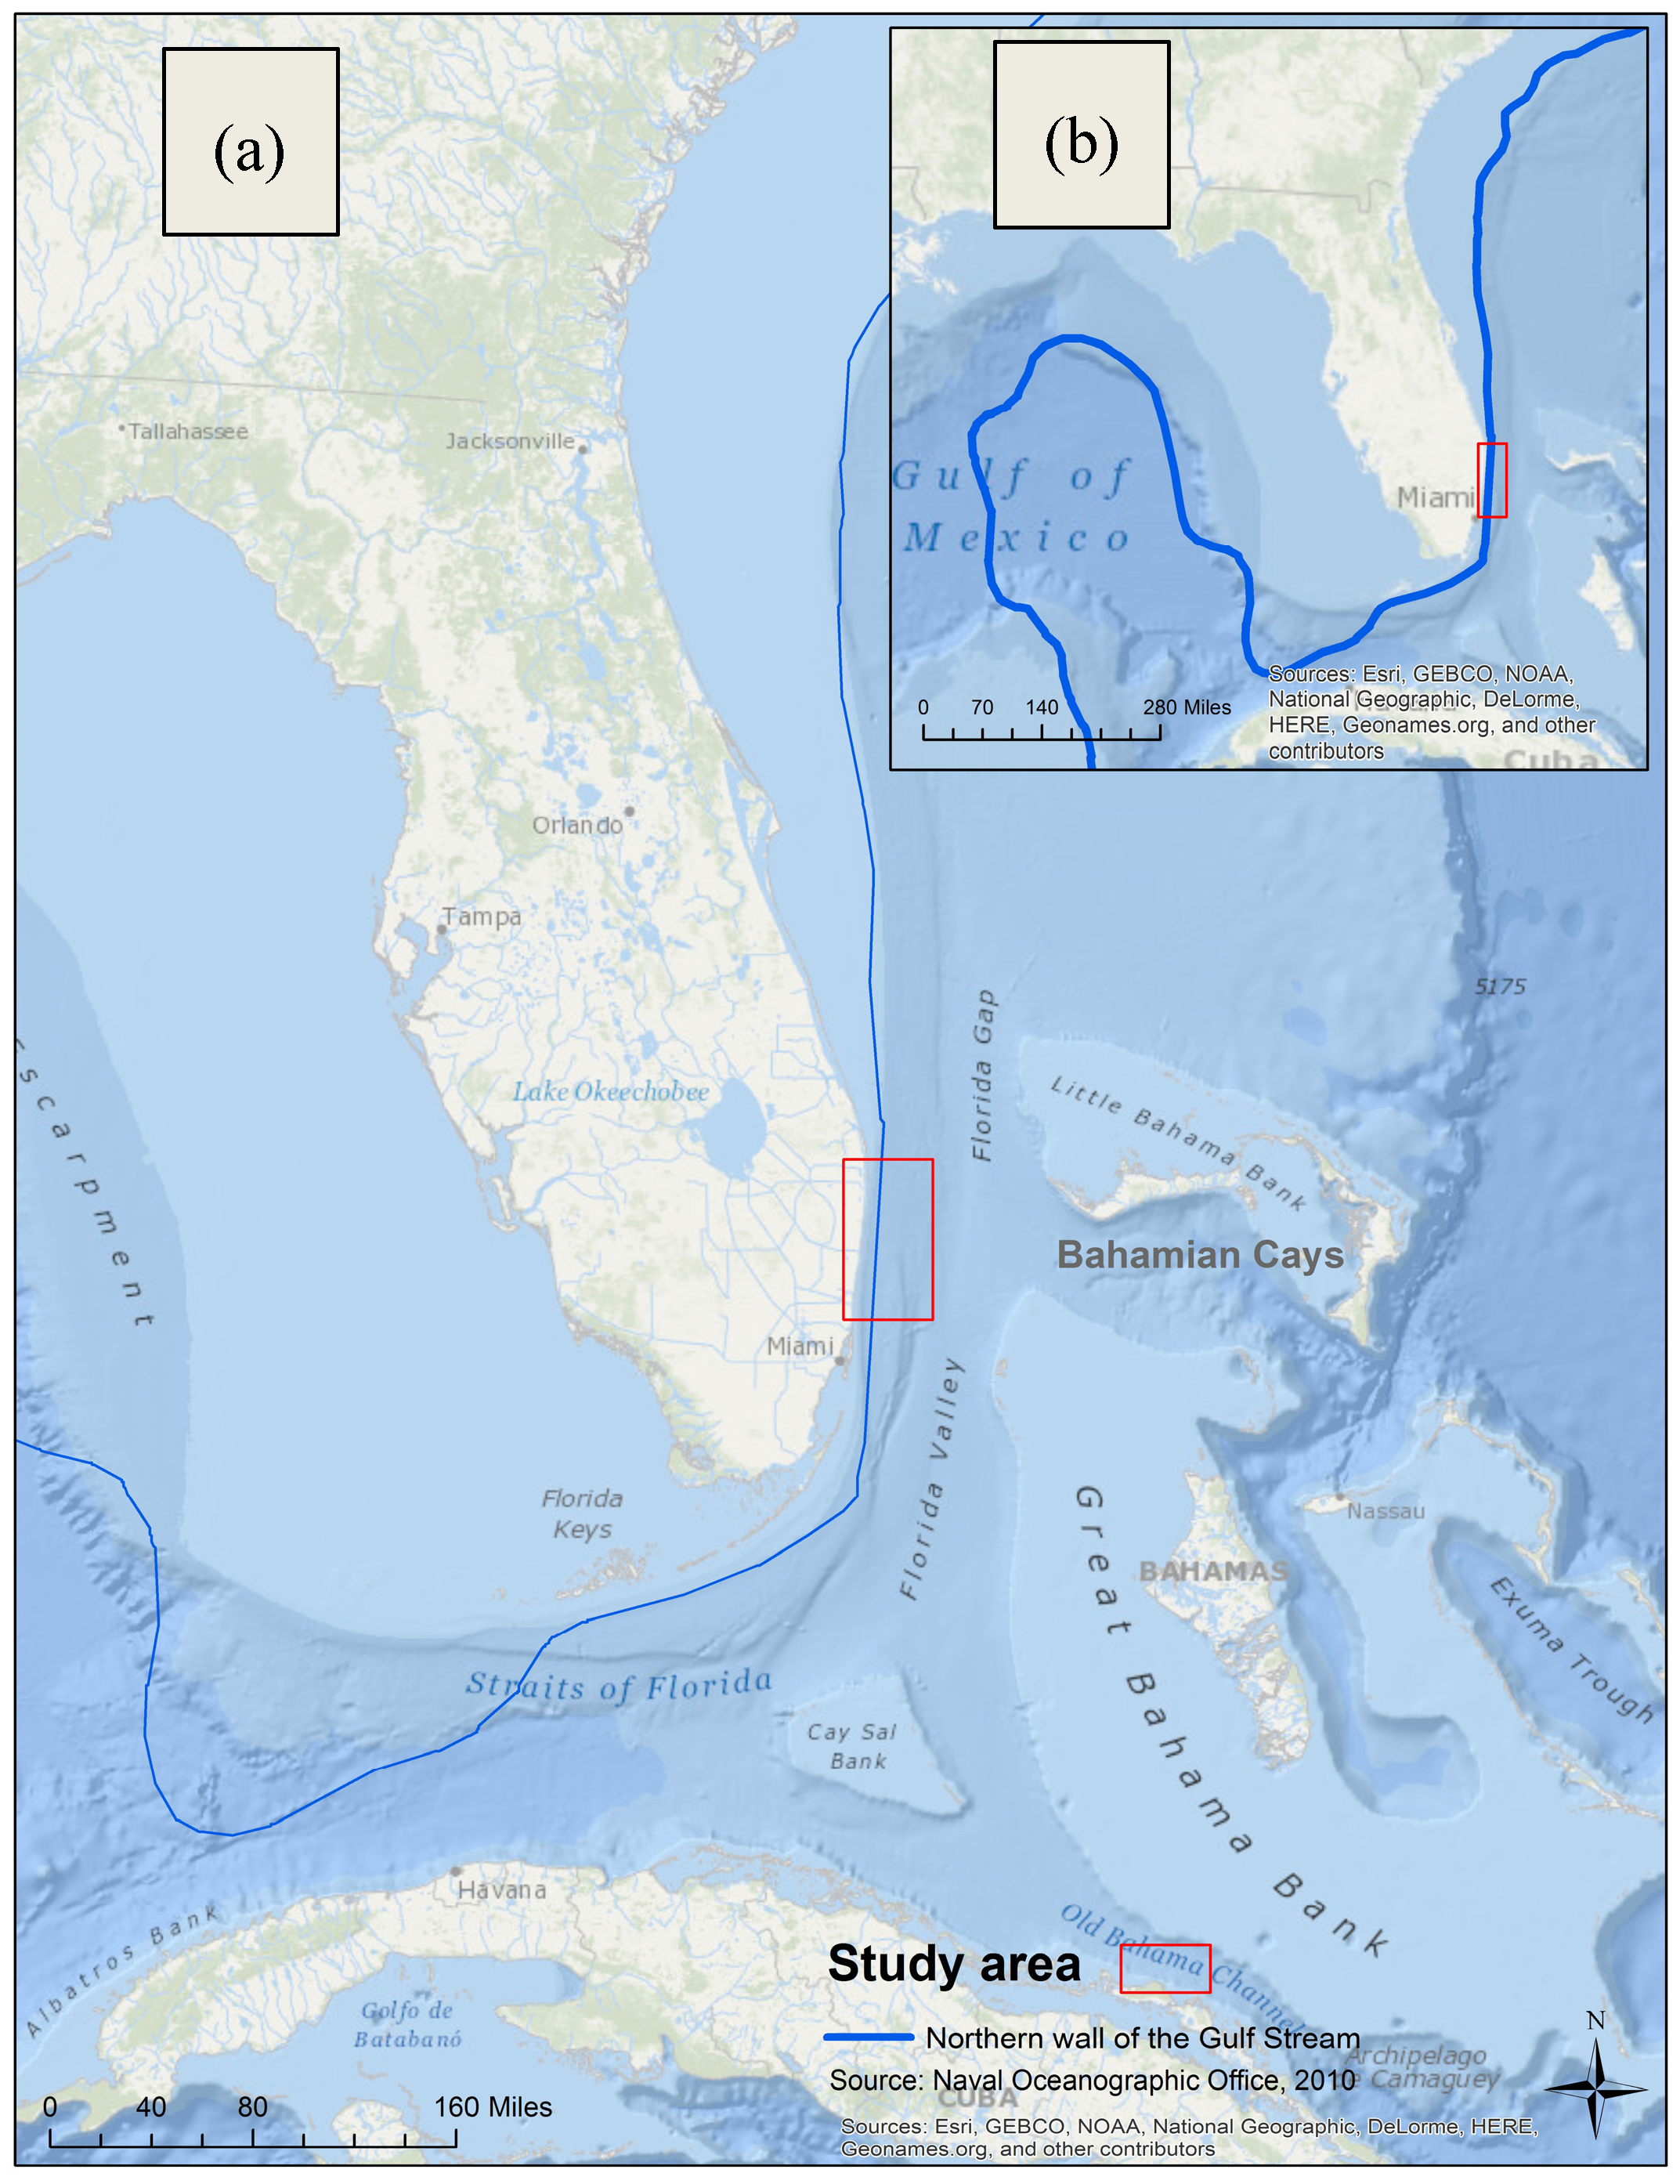
2.1. Study Area

The proposed area for future commercial scale ocean current energy development [3] is located approximately 35 kilometers off the coast of southeast Florida stretching from Palm Beach to Miami-Dade County (Figure 1). In this area, the Florida Current moves closer to the shore as it emerges from the Florida Straits and moves into the seafloor channel between the Florida peninsula and the Bahamas Bank carrying approximately 25 million cubic meters of sea water per second. Charlier and Justus [29] estimate that on average the cross-sectional velocity of the Florida Current is 0.9 m/s whereas surface velocities can reach 2.5 m/s. Total power can exceed 20 GW while extractable power is estimated at 0.8 KW per m2 [29]. The continental shelf offshore southeastern Florida hosts both nearshore hardbottom habitats and deep-water coral system. While the primary area of interest for siting OCE projects is within the deeper water environments (well offshore of the shallow-water reef system), future deployment of OCE cables connecting to an onshore electrical transmission grid will entail traversing the shallow-water habitats [12].
Figure 1. The outline in red depicts the location of the study area. The blue line indicates the northern wall of the Florida Current as it emerges from the Florida Straits and moves into the seafloor channel between the Florida peninsula and the Bahamas Bank: (a) Gulfstream path around Florida; (b) Gulfstream path in the Gulf of Mexico and the South Atlantic (Data source for the Florida Current path; Naval Oceanographic Office, 2010).
Jmse 03 00276 g001
The shallow-water coral system (with water depths of less than 30 m) falls in state waters (roughly five kilometers offshore) and hosts standard Caribbean coral reef fauna in varying composition and density [30,31]. This tropical coral reef system consists of a sequence of shallow, near shore ridges, parallel to shore, almost linear and continuous in nature [12,30,32].
In addition, the deeper outer continental shelf offshore southeast Florida hosts still unmapped and fairly unexplored deep-water coral communities [30,32]. A ridge parallel to shore (70–90 m depth), the Miami Terrace (a 65 kilometer north-south stretch of deep-water terrace and escarpment with depths ranging between 200 and 700 m that is about 8–24 kilometers offshore from Palm Beach, Broward and Miami-Dade Counties), and deep-sea coral mounds in excess of 700 m depth make up the deeper water ecosystems and support a high diversity of deep-water fish and invertebrates including many commercially valuable and ecologically sensitive species [32]. The area was designated Habitat Areas of Particular Concern (HAPC) by NOAA in 2010. Within the study area approximately thirty-four canals drain into nearby Biscayne Bay, many of which deposit sediment-heavy loads into the bay [33].

2.2. Data and Data Processing

This section provides a summary of the various datasets used in the study and data processing. They include multi-beam and submarine cable data, seafloor geology and bathymetry data, and benthic datasets.

2.2.1. Seafloor Geology and Bathymetry Data

The usSEABED program provides a single integrated seabed sample dataset of seafloor sediment samples collected by federal, state, local, and regional agencies, consortiums, and research institutions [34]. The database contains seafloor sediment texture and composition data including seafloor features (e.g., rock, ripples, etc.), biota, acoustic properties, and results from geochemical and geotechnical analyses of the core and grab samples [34]. Data from varying sources for a single location were retained when significant additional information was gained (e.g. for a single site one source may contain grain size while another includes geophysical properties, in which case duplicate points were kept) [34].
Another useful data source is the USGS Continental Margin Mapping Program (CONMAP), which is also based on seafloor sediment core and grab samples. The sediment information from CONMAP is a collection of grain-size data originating from the sedimentation laboratory of the Woods Hole Science Center (WHSC) (USGS Coastal and Marine Geology Program) [35]. The USGS East Coast Sediment Texture Database (ECSTD) includes seafloor sediment core and grab samples location, description, and texture [35]. The database has information for more than 26,000 samples from 1955 through January 2011 [35]. NOAA Index to Marine and Lacustrine Geological Samples (IMLGS) includes basic collection method, lithology, age, and texture information for seafloor samples recorded by about twenty oceanographic institutions and government agencies. Some samples also include primary and secondary lithology, rock type, texture, mineralogy, weathering, province, principal investigator, age, and other descriptive notes [36].
In addition to the seafloor core and grab sample data, the USGS Geological LOng-Range Inclined Asdic (GLORIA) provides side-scan sonar data collected for the Exclusive Economic Zone Atlantic continental margin seaward of the continental shelf from the Canadian border to the northern Blake Plateau offshore Florida during five cruises in 1987 [37]. These data were processed and digitally mosaicked creating continuous seafloor imagery. For the Atlantic margin, 23 digital mosaics with a two by two degree (or smaller) area and 50 m pixel resolution were completed; 21 of these mosaics were integrated to generate an overview of the Atlantic continental margin [37]. GLORIA data constitute a portion of the seafloor geology datasets used in this study.
A consolidated dataset of seafloor core and grab samples was created based on data available through usSEABED [34] East Coast Sediment Texture Database [35] and the Index of Marine and Lacustrine Geological Samples [36]. Points with missing data entries were removed. Duplicate data points in each dataset were examined and the ones containing the most detailed description were kept in the dataset. This resulted in a consolidated seafloor geology dataset containing a total of 646 core data points. The file was geocoded by latitude/longitude and a new layer was generated in ArcMAP in which all three datasets were merged. A new field was created in the consolidated attribute table to enter the unified code system used to describe the data points. The basic descriptions in the unified code system were consistent with the ECSTD file which contained the most detailed information. For the purposes of the suitability analysis, the data points were classified by a unified description code consisting of five geology classes (ooze/mud/silt/clay/sand, sand/sediment, gravelly sediment, seagrass presence, and coral presence/hard bottom/miscellaneous biota/phosphorous nodules/phosphorous in sand).

2.2.2. Biological Data

Detailed coral reef mapping information was obtained from the Florida Fish and Wildlife Commission (FFWC), the Florida Department of Environmental Protection (FDEP) and BOEM’s Marine Cadastre service. The 2013 FFWC coral hard bottom habitat GIS dataset is a collection of coral and hard bottom type data available to the FFWC Fish and Wildlife Research Institute (FWRI). The time frame, resolution, mapping methods, and physical extent vary by source dataset. Gaps in the data exist amid small, narrow polygons that represent differences in overlying study areas and actual small polygons from the original source data [38]. Walker et al. [30] used high-resolution (4 m resolution) Light Detection and Ranging (LIDAR) bathymetric and aerial photography surveys to collect images of the seafloor as deep-water clarity issues prohibited underwater image-based analyses. Habitats delineated in these surveys were catalogued and described to produce habitat maps categorized in accordance with NOAA guidelines and the National Ocean Service Coral Mapping Program [30].
Offshore Critical Habitat Designations and Habitat Areas of Particular Concern (HAPC) data for southeastern Florida were accessed from NOAA Multipurpose Marine Cadastre service. The HAPC data consisted of two data layers. The first one consisted of shallow water (<20 km offshore) benthic habitat features while the second contained deepwater coral habitat (>20 km offshore). The HAPC datasets spatially represent areas where coral and hard bottom activity is considered high with respect to ecological function, probability of stressor introduction, sensitivity, and Essential Fish Habitat-Habitat Areas of Particular Concern (EFH-HAPC) criteria [38]. Geospatial data indicating the exact location of deepwater coral habitat is not readily available. In the absence of such data, NOAA (as reflected in the Multipurpose Marine Cadastre) has designated potentially large areas as containing the habitats. It is also likely that these areas contain soft bottoms including sand or sediment with minimal biological presence. Government and academic research studies mapping the locations of coral habitats offshore Florida constitute the basis of the HAPC files, which aim to protect what may be the greatest distribution of deep water coral ecosystems globally [39]. In addition, the Critical Habitat Designations dataset indicates “critical habitat” areas where species listed under the Endangered Species Act (ESA) offshore Florida are present [40].

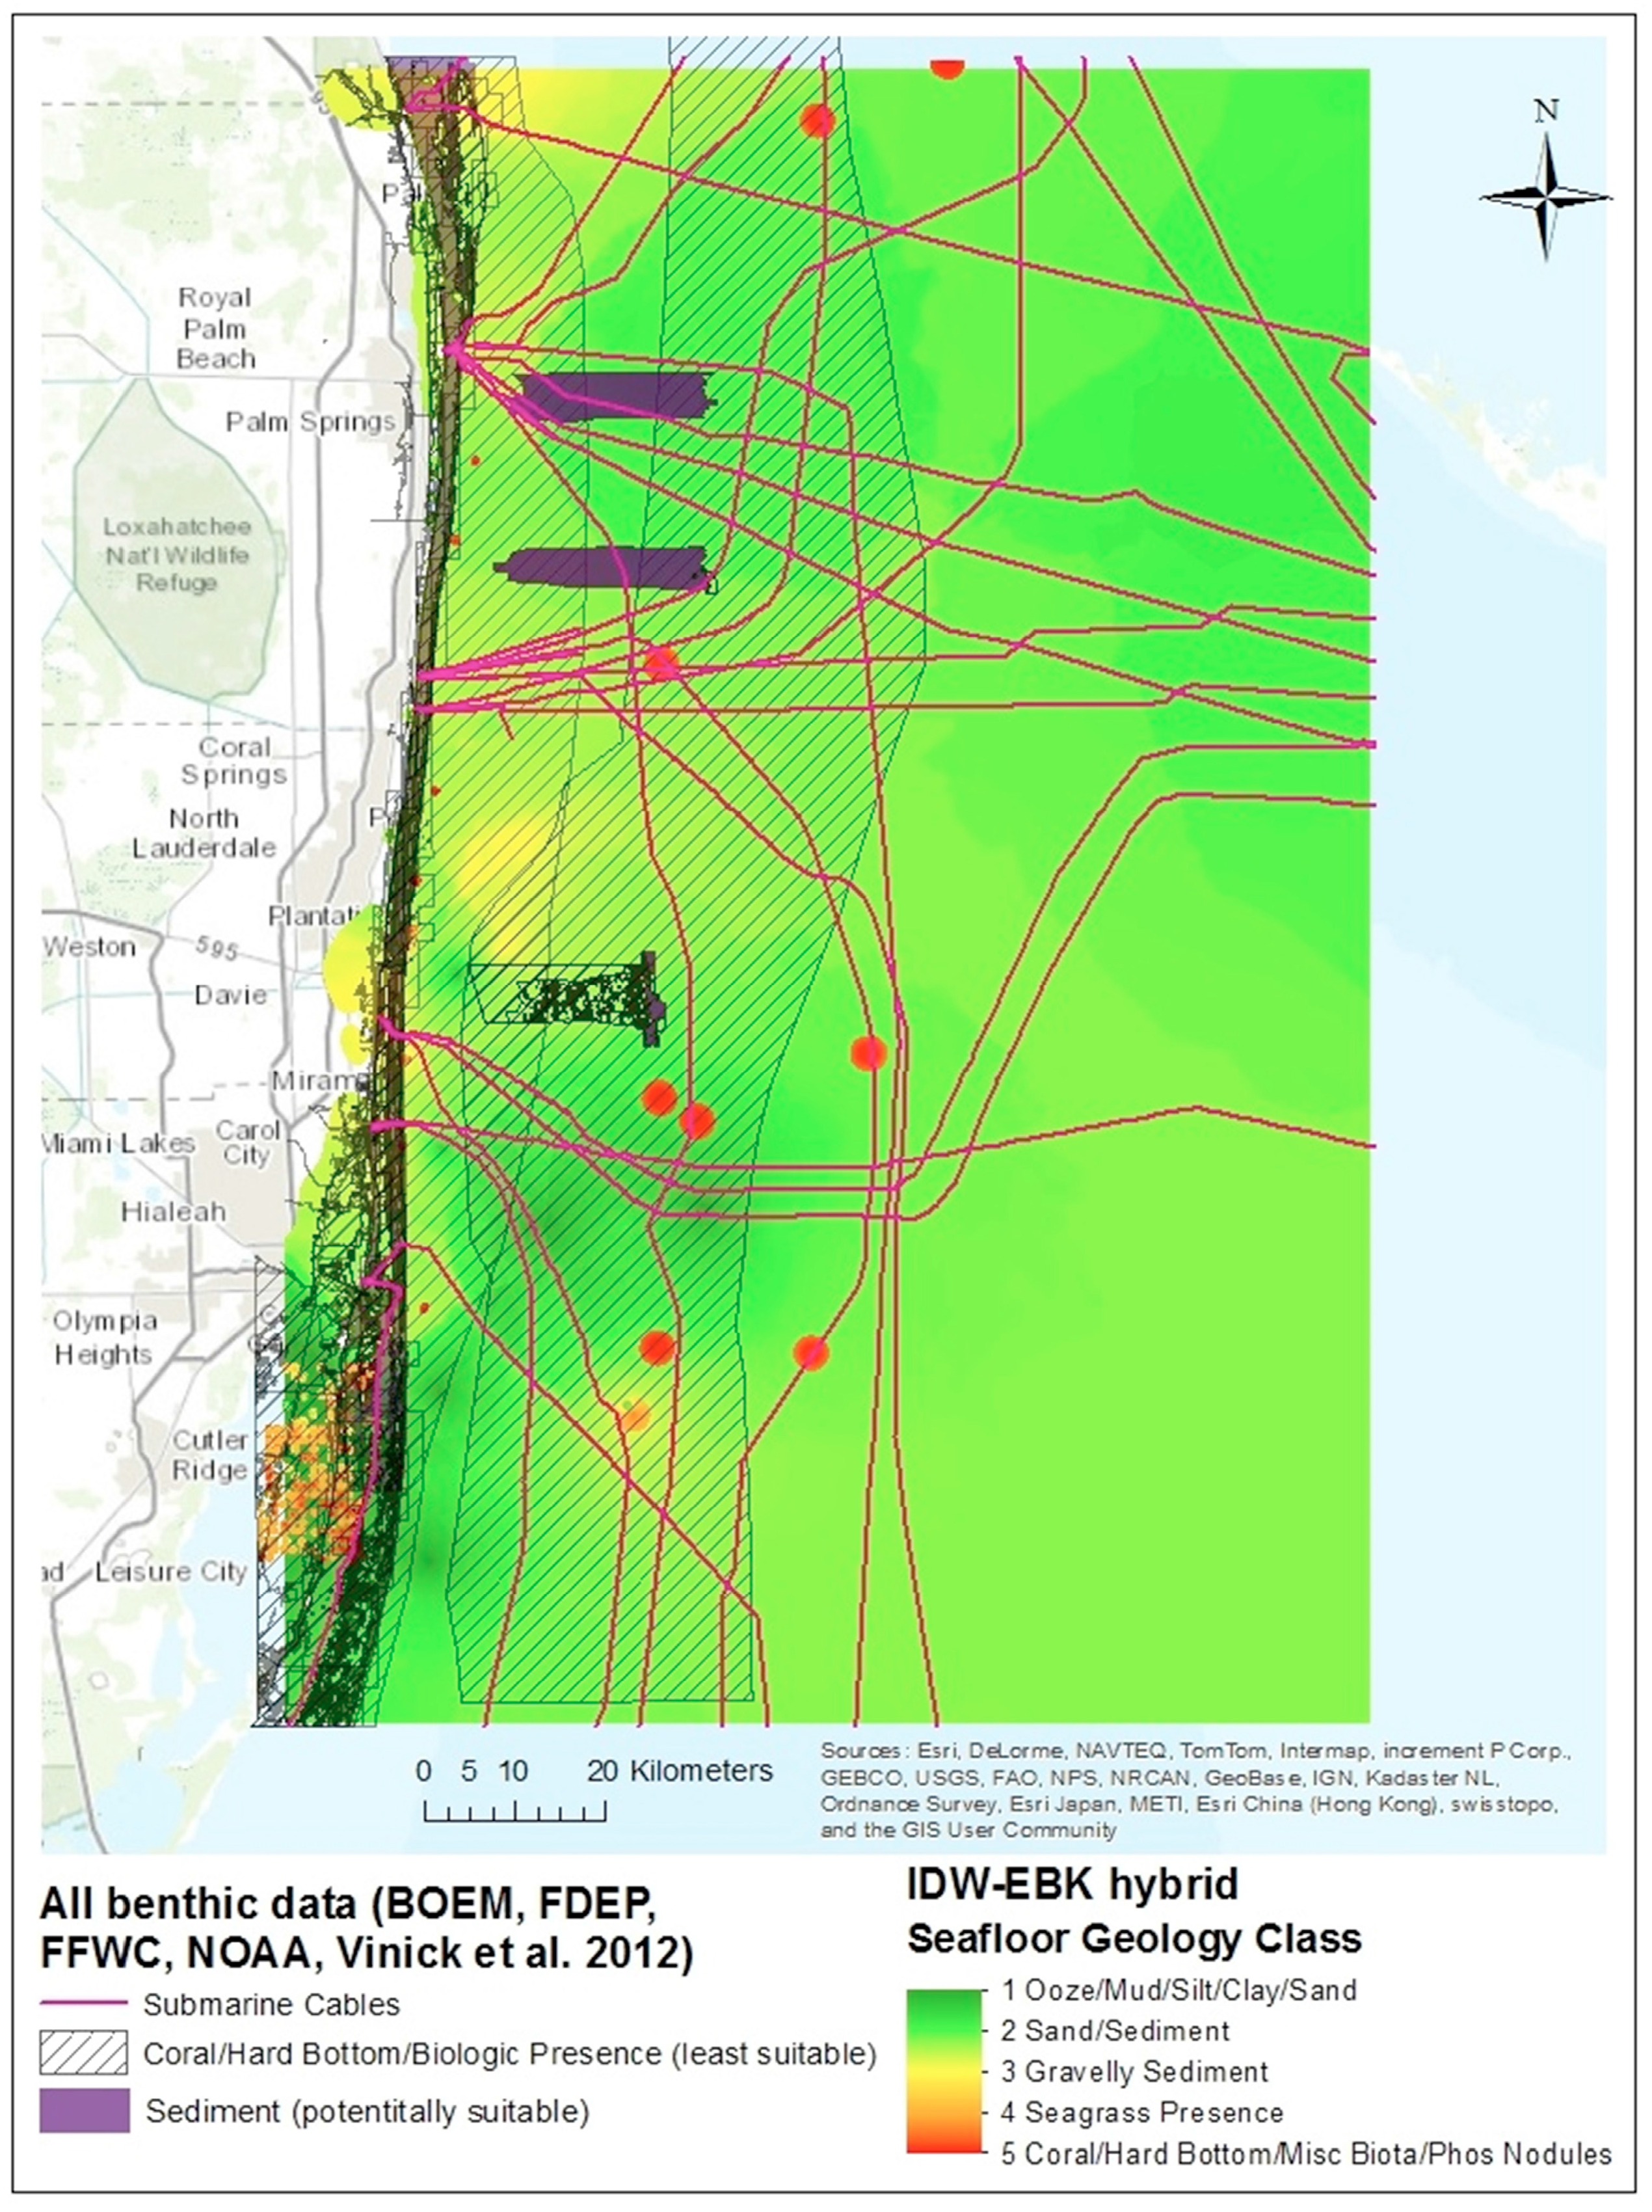
2.2.3. Multibeam and Submarine Cable Data

Multibeam data was collected by Vinick et al. [12] and used by BOEM in the FAU SNMREC Environmental Assessment. The multibeam data was collected using a Kongsberg EM 710 FM sweep multibeam backscatter and bathymetry system that operated in the 70 to 100 kHz range to collect the geophysical information [12]. The submarine cable dataset acquired from BOEM’s Marine Cadaster indicates the placement of existing submarine cables in U.S. navigable waters. The original source geometry and attribute information comes from NOAA’s 2010 Electronic Navigational Charts (ENCs) and 2009 Raster Navigational Charts (RNCs) [41]. The Raster Navigational Charts were updated in 2013. For the purposes of this analysis, polyline features that were clearly defined as cables were assembled from the original sources.

2.3. Methods

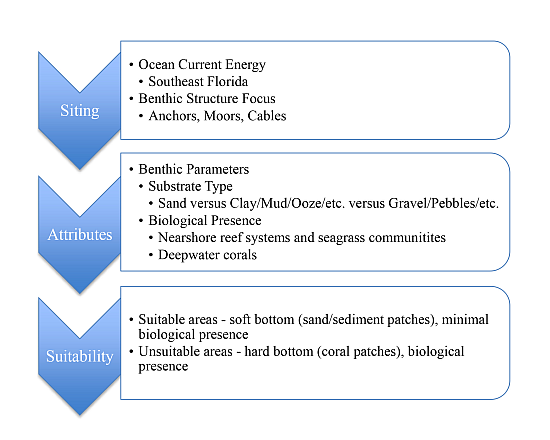
2.3.1. Seabed Suitability for OCE Deployment: A Conceptual Framework

Van Cleve et al. [42] developed a suitability framework for siting marine renewable energy projects. The study found that bathymetry, energy generation potential, presence of seafloor hard and soft bottom, and distance to onshore resources to be among the factors relevant MRE deployment. This study draws upon the “Site Quality—Substrate” component of the Van Cleve et al. [42] conceptual model. In addition to Van Cleve et al. [42], other studies also provided background information that was useful in developing a uniform scale of benthic siting suitability attributes [12,14,30,31,32,43]. Table 1 and Table 2 provide a summary of the benthic suitability scale for ocean current energy projects used in the analysis.
Table 1. Benthic data classes with suitability.
ClassesSpecies/HabitatSuitability
1Coral/Hard bottom/Probable Hard bottom1
2Sinkhole/Probable sinkhole1
3FL slope—artificial1
4Unconsolidated Sediment5
5Seagrass1
6Manatee Habitat1
7Crocodile Habitat1
8Other1
Suitability classes of 1 (least suitable) to 5 (most suitable) were assigned to individual data points depending on their biological or geological classifications. Biological and habitat features (coral, miscellaneous biota/sponge growth/tubes, seagrasses, manatee and crocodile habitats) were given a suitability score of 1 (least suitable) in order to avoid harmful environmental impacts as a result of OCE siting [12,13,14]. Geological settings associated with geomorphologic complexity such as sinkholes (i.e., areas that are geologically unstable), the artificial Florida slope as well as substrate classes identified as “other” (i.e., unknown or unidentified substrate types) were also given a suitability score of 1 (least suitable). Phosphorous nodules /phosphorous in sand areas which include rubble and/or rocky like bottom features with phosphorous presence were given a suitability score of 2 (unsuitable) due to hardbottom presence and complex geological setting. Seafloor substrates that represent a mixture of ooze, sand, mud, silt and clay were given a suitability score of 3 (less suitable). Several studies have indicated that fine-grained sediments are prone to disturbance and turbidity and therefore less suitable for OCE anchoring [11,16,17,18,19]. Once disturbed, they take longer periods of time to settle and because of their fine grain texture they remain suspended in the water column long enough to be carried over larger areas by the ocean currents [11]. Also, they often occur over hard-bottoms which may become undistinguishable when fine grain sediment is layered over it. For example, Lirman et al. [44] reported a chronic exposure of coral colonies in Biscayne Bay, FL, to sediment burial due to the impact of the extensive network of canals, levies and navigational inlets constructed in the study area over the past decades.
Table 2. Seafloor geology classes with suitability.
ClassesSeafloor Geology TypeSuitability
1Coral Presence/Hard bottom/Rock Fragments/Limestone 1
2Seagrass Presence1
3Miscellaneous Biota/Sponge Growth/Brown Tubes & Worm Tubes 1
4Phosphorous Nodules/Phosphorous in Sand 2
5Silt/Clay3
6Ooze/Sand/Mud3
7Gravelly Sediment4
8Sand/Sediment5
Due to similarities in grain size [20] gravel and glacial seafloor material are considered identical for the purposes of this analysis. Vinick et al. [12] report that gravel occurs in tandem with hard bottom substratey as well as with sand/sediment substrates. A study conducted by Sound and Sea Technology [18] evaluated the suitability of seafloor sediments for MRE anchoring. The analysis revealed that glacial till (gravel) was not suitable for drag anchor type [18]. Clay/mud was found to obstruct pile and plate anchoring and may occasionally occur overlaying hard bottom substrate [18]. These and other studies suggest that gravel is somewhat less suitable for anchoring and mooring. Hence, gravelly sediment was given a suitability score of 4 (moderately suitable). Gravel is still better suited for some anchor types than silty substrates and for this reason it was given a higher suitability score than finer grained clay/mud sediments.
Soft bottom refers to unconsolidated sediments or loose sand and is considered the most suitable substrate for OCE anchors, cables, and moorings [12,15,16,17,18,19,20]. Therefore, the categories identified as “sediment” and “sand” were given a suitability score of 5 as they are potentially most suitable for OCE deployment.

2.3.2. Geostatistical and Statistical Methods

Three interpolation methods were applied to the consolidated core dataset. They include two deterministic methods—Thiessen Polygon Analysis (TPA) and Inverse Distance Weighting (IDW), and one probabilistic—Empirical Bayesian Kriging (EBK). A cell size of 30 m was applied in all interpolations. Overlaying geological and biological data required a hybrid approach that combined the strengths of the deterministic IDW and probabilistic EBK. This resulted in a “hybrid” (IDW-EBK) approach that addressed the difference between biological and geological data points in the interpolation. Based on previous analyses, we assumed that coral reef or seagrass patches were better represented by IDW within a short distance from the site where the sample was collected, while the dynamic nature of the ocean floor substrate was better represented by probabilistic kriged values [45,46].
A sensitivity analysis was conducted on the probabilistic EBK surface to address the Modifiable Areal Unit Problem (MAUP) in which the same data produce differing results when aggregated at different scales [47]. Least square regression and piecewise linear regression with breakpoint were used to analyze the relationship between water depth and grain size associated with seafloor geology. We calculated the correlations between water depth and grain size using Pearson correlation test statistic. Correlations between water depth and the seafloor geology classes/benthic categories were calculated using Spearman rank coefficient and Kendall Tau rank correlation coefficient.
The interpolation results were validated using three statistical measures. The Root Mean Square Error (RMSE) is derived by squaring the differences between known (observed) and unknown (interpolated) data points, adding the differences together, dividing that by the number of total number of data points, and finally taking the square root of that result [26,48]. Geostatistcal Wizard in ArcGIS 10.1 was used to find the RMSE values for the IDW-EBK hybrid interpolation. In order to calculate the Coefficient of Relative Variation (CRV), standard deviation and mean values for the observed and interpolated core point values were found using ArcGIS 10.1 Summary Statistics tool (Esri, Relands, CA, USA). The Coefficient of Relative Variation (CRV) is a measure of dispersion estimated by dividing the mean by the standard deviation [49]. Lastly, the Mean Absolute Percentage Error (MAPE) measures the absolute value of deviation between interpolated data points and observed data points [50].

3. Results and Discussion

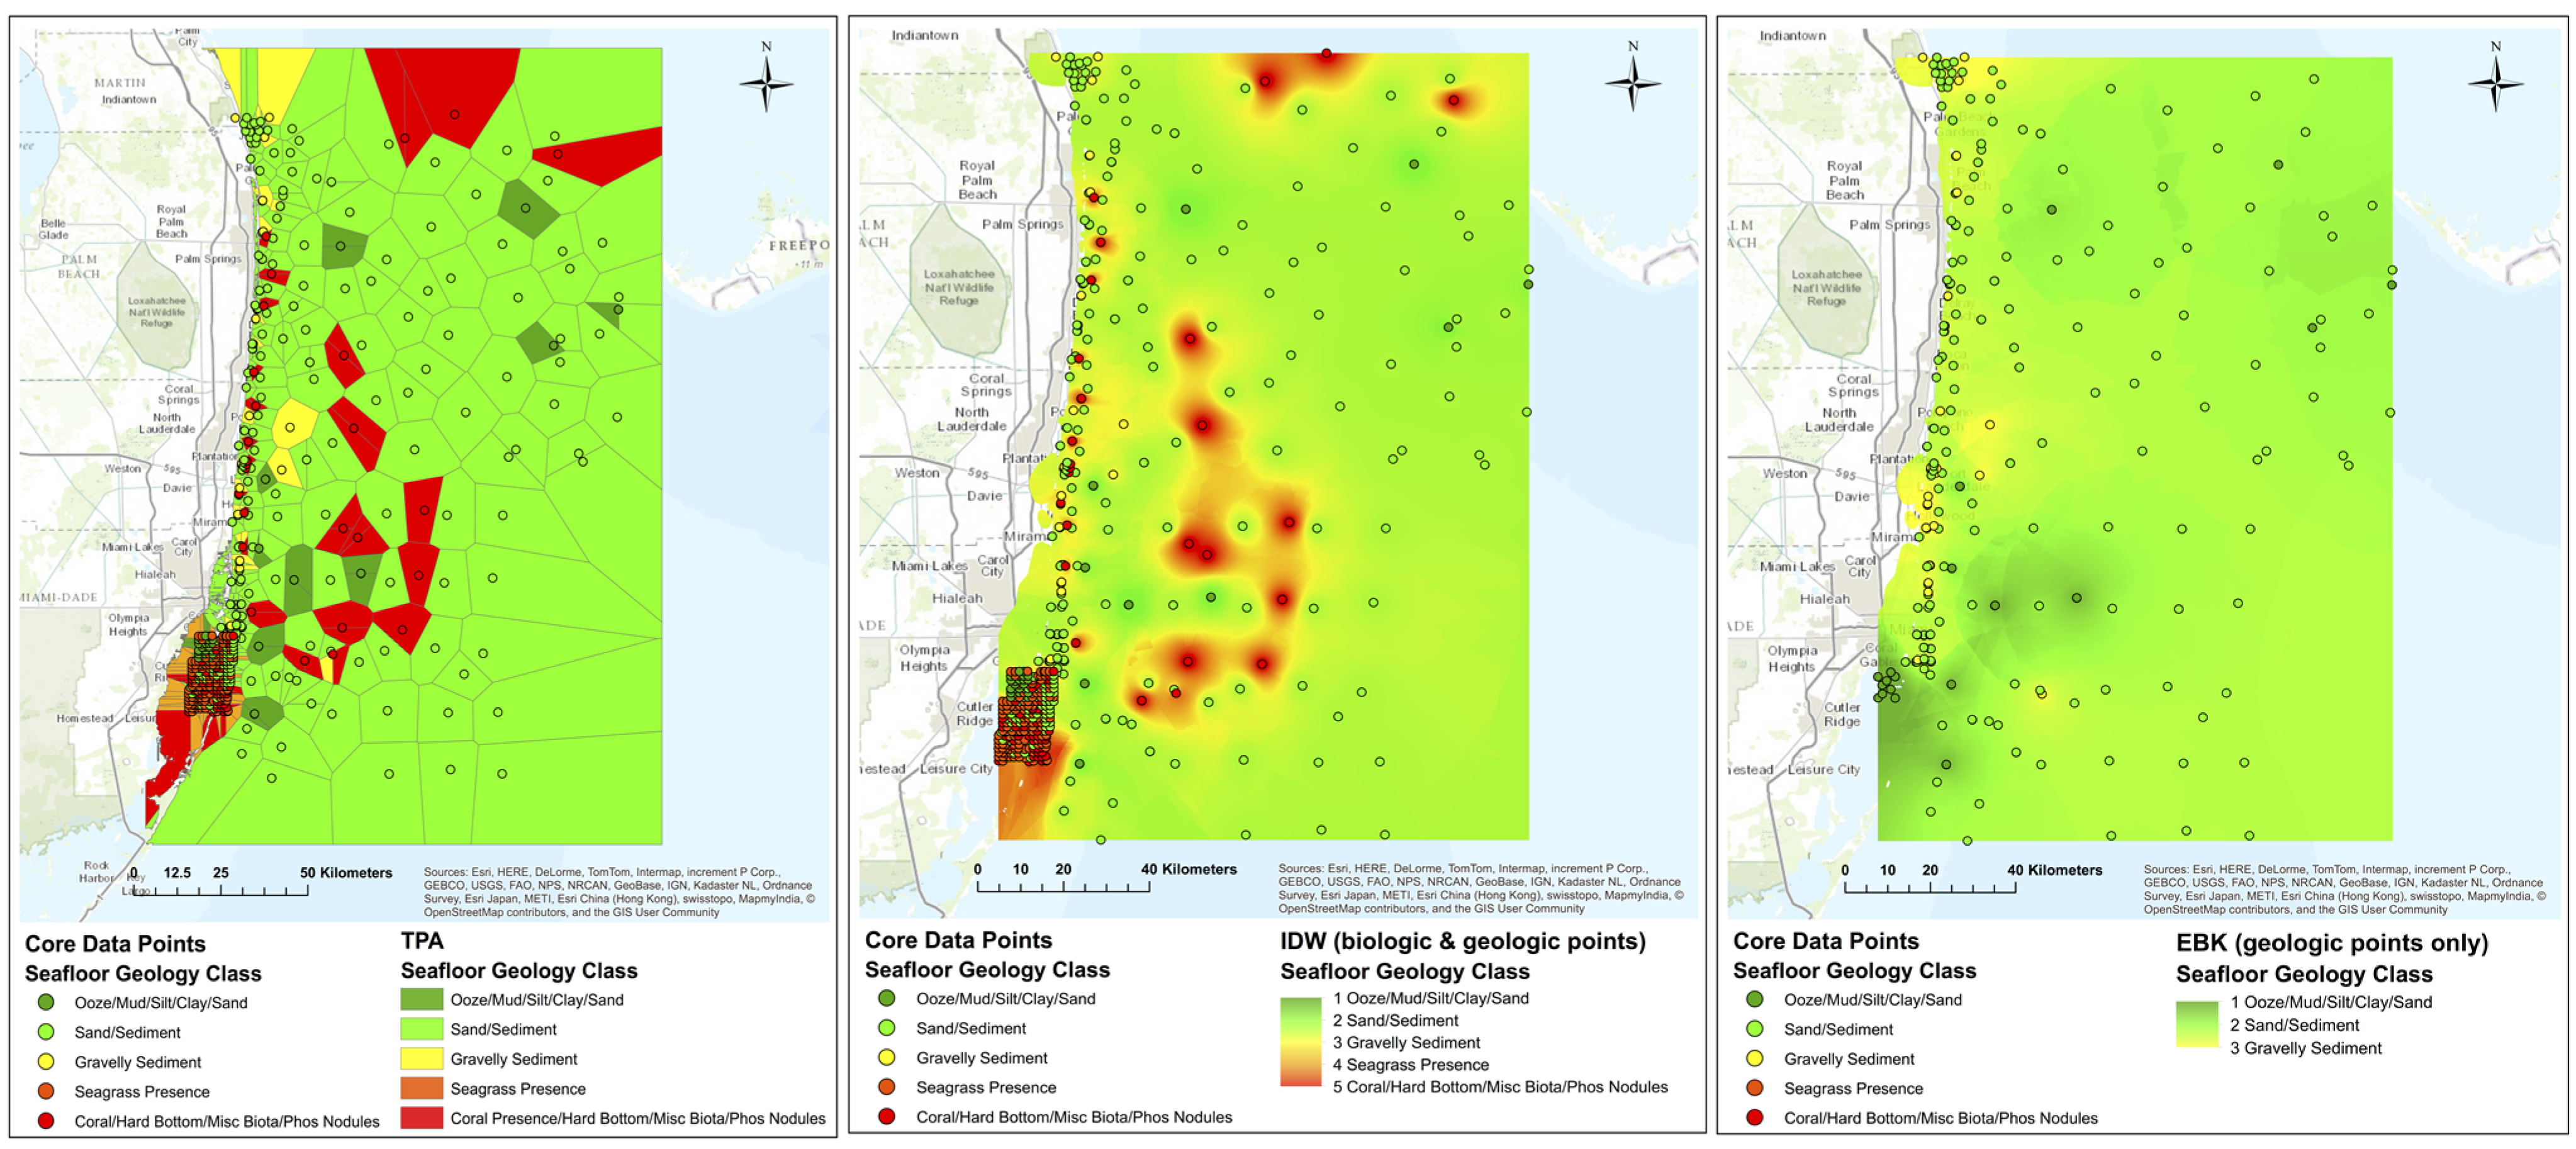
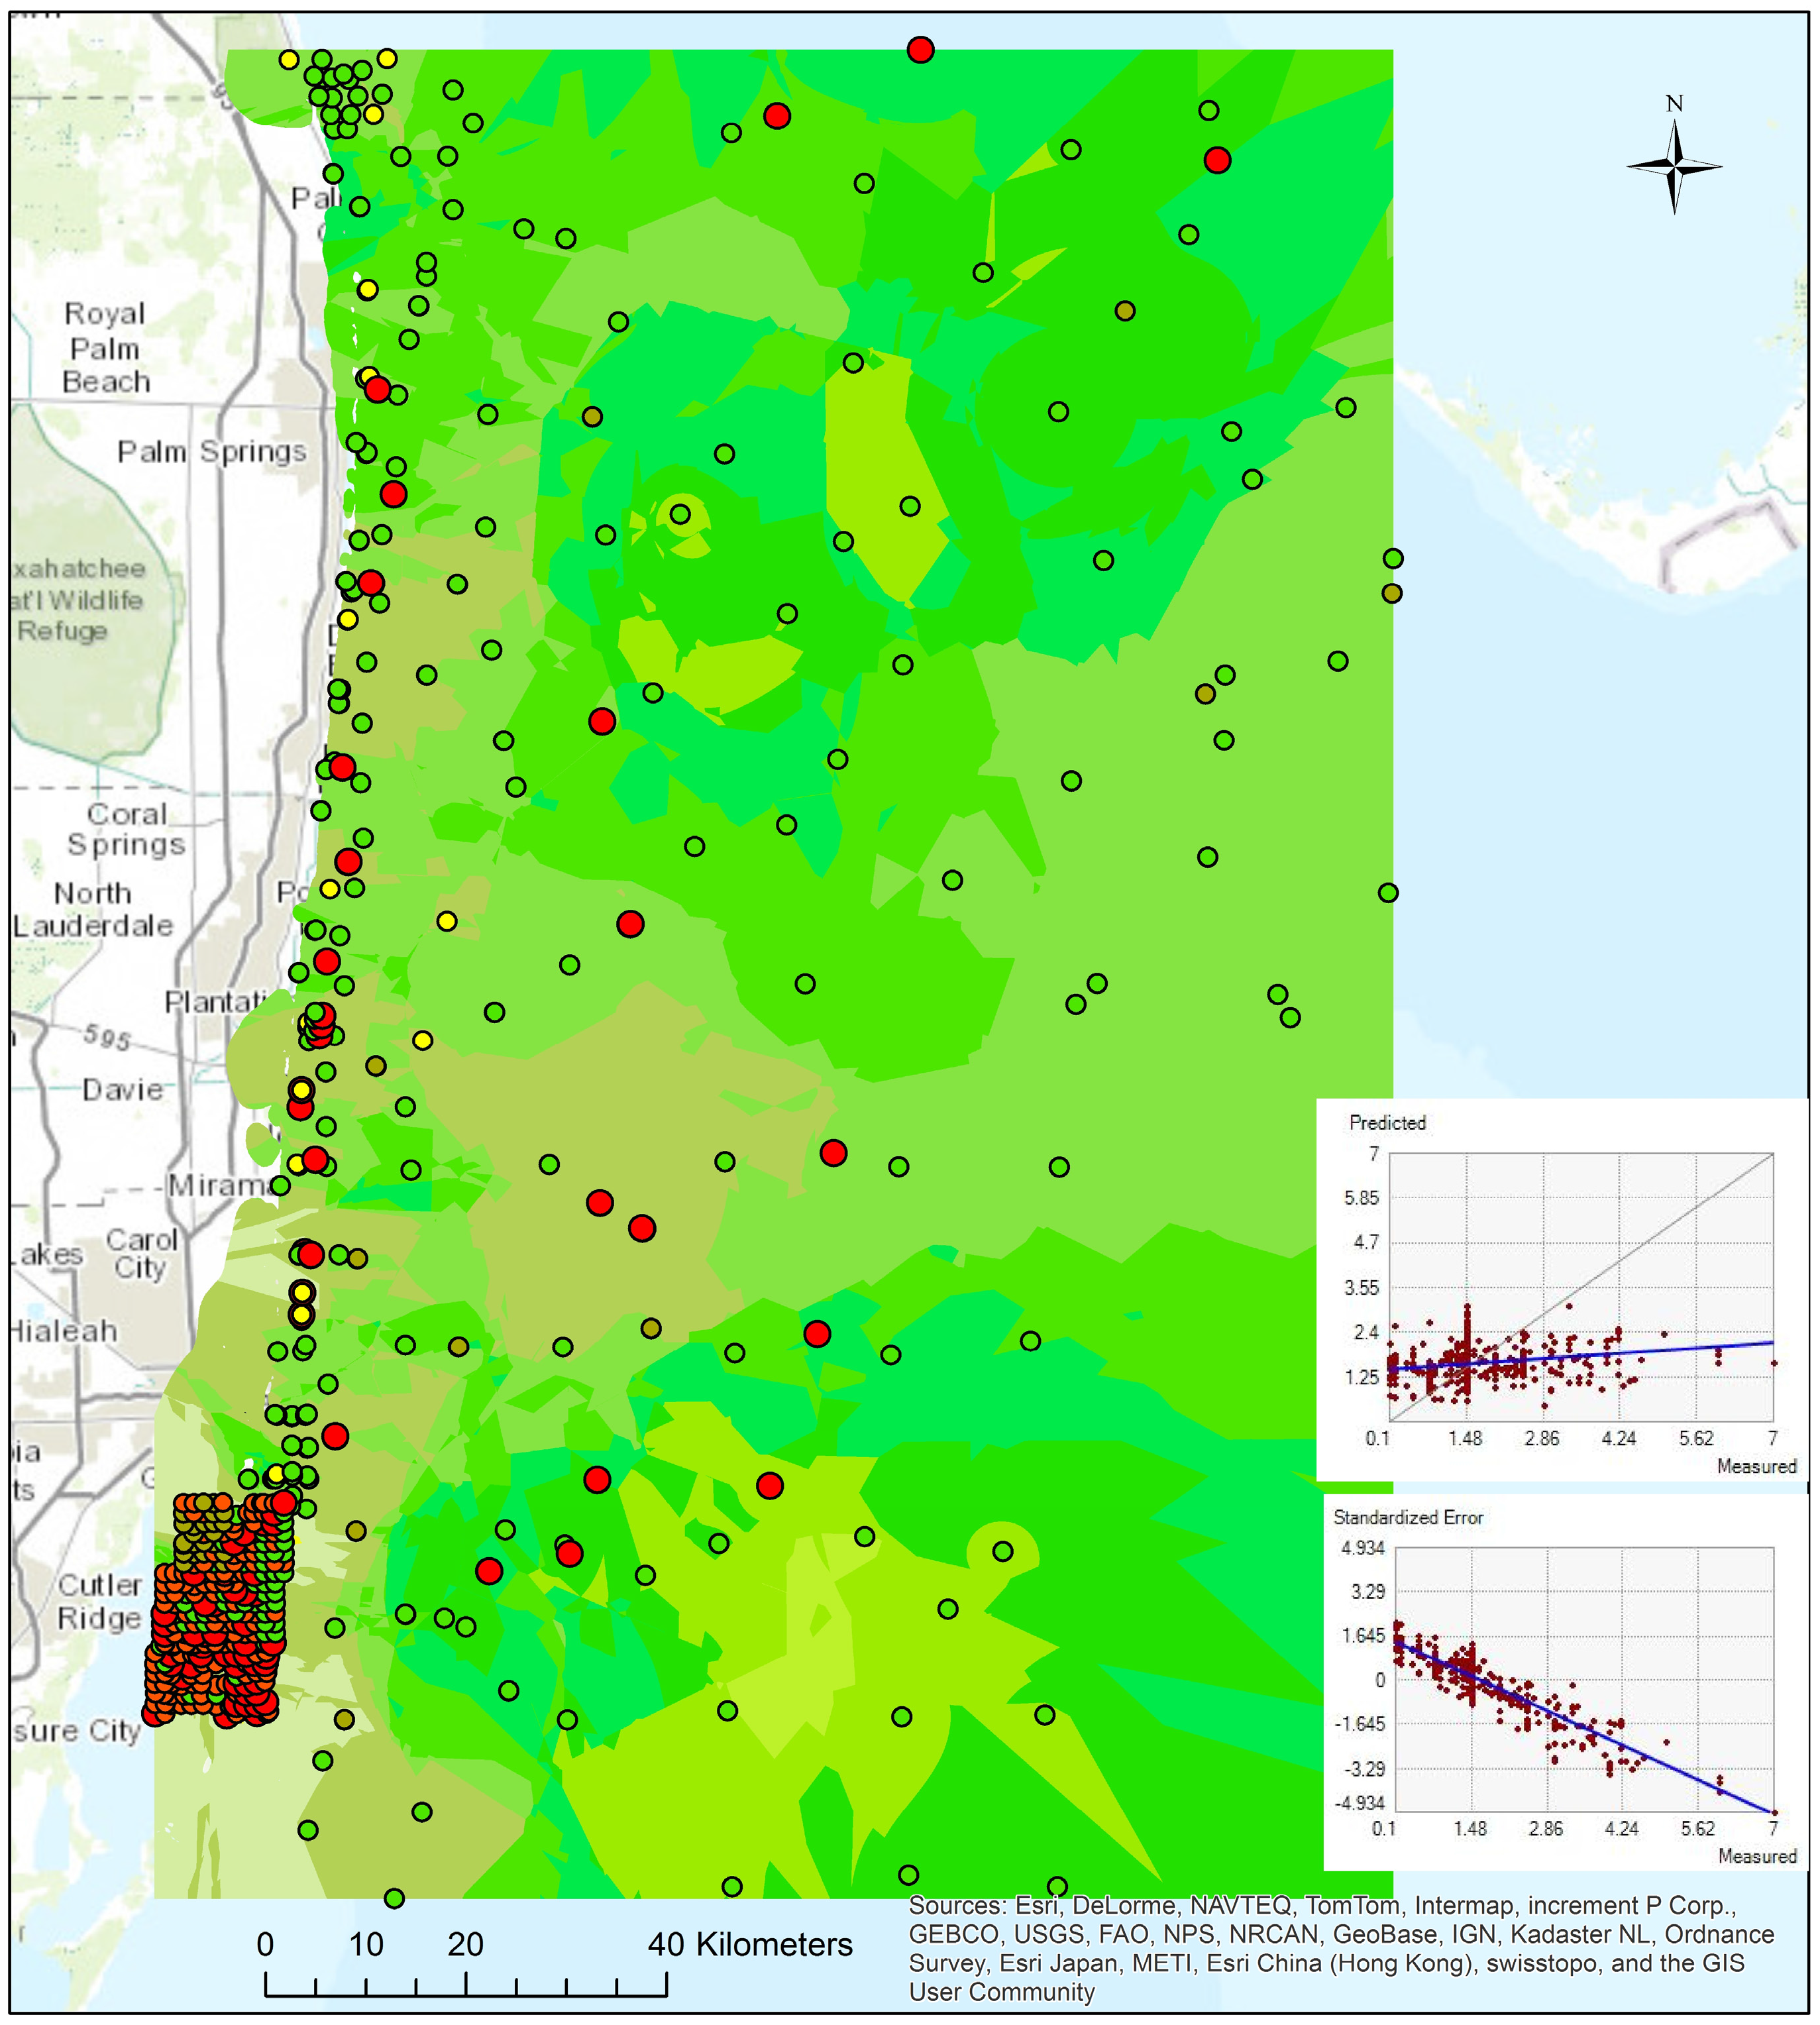
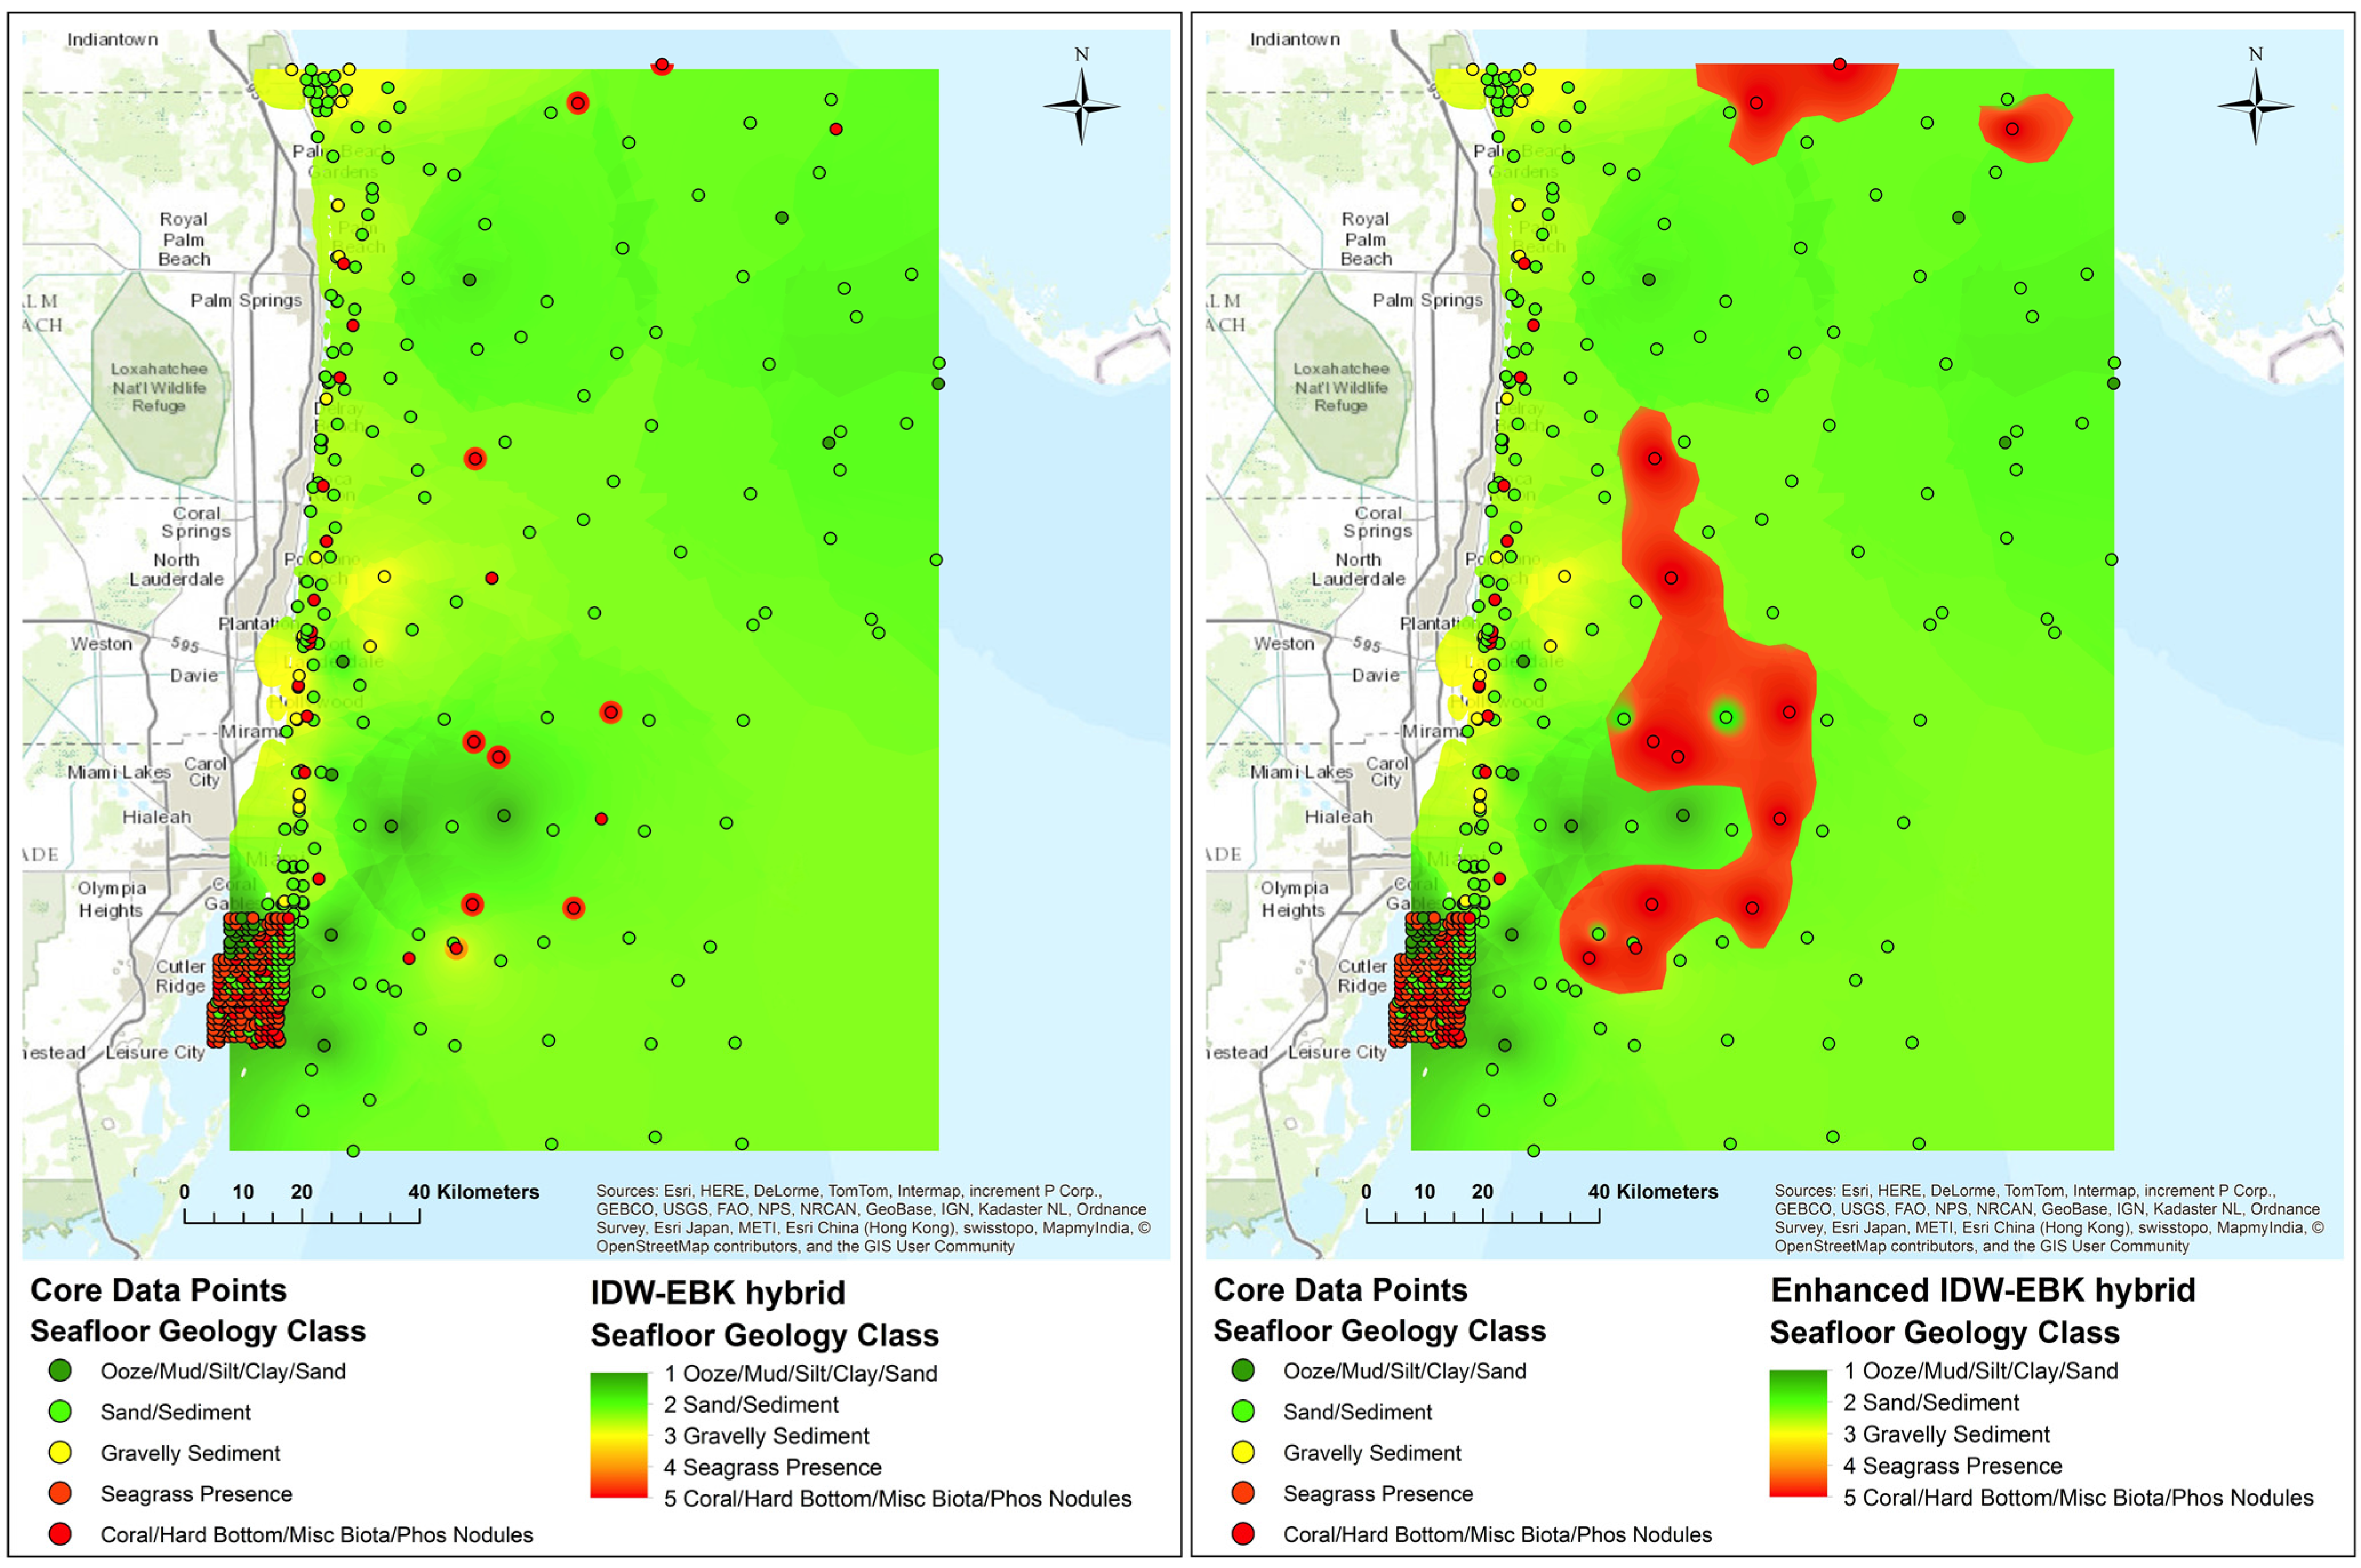
3.1. Geostatistical Analysis

One of the most important tasks in determining OCE suitable areas was to locate the presence of coral in the seafloor data mapping. Coral Hard Bottom Habitat, Critical Habitat Designations, HAPC, Florida Benthic Habitats, and multibeam benthic datasets were reclassified to identify areas that consist of coral/hard bottom/probable hard bottom, seagrass, manatee habitat, crocodile habitat, miscellaneous biota/sponge growth/tubes, sinkhole/probable sinkhole, artificial Florida slope, unconsolidated sediment, and other (unknown or unidentified). All data points indicating coral/hard bottom/biological presence were consolidated in one suitability class (least suitable for OCE cable placement and anchoring).
The next step toward identifying OCE suitable areas was to isolate possible benthic community (reef) gaps through which OCE power transmission lines can be placed. Existing cable corridors were identified using the submarine cable dataset and overlaid with benthic habitat data to identify potential reef gaps that can be considered for potential pathways for OCE cable deployment. The Critical Habitat Designation and HAPC benthic were helpful in identifying the location of important biological areas. Due to their coarse resolution however, they could not be used to select possible reef gaps for OCE cable deployment. The Florida Benthic Habitat and Coral Hard Bottom Habitat datasets have a higher spatial resolution displaying detailed coral reef locations among the surrounding unconsolidated sediment. As such, these datasets are useful for determining sensitive biological zones and determining potential OCE cable routes. Vinick et al. [12] multibeam data were collected using backscatter, and therefore, were a reliable source in designating sediment and benthic community locations. The high resolution multibeam data were useful in validating the results from the seafloor core data interpolation.
To implement the hybrid method, we used the Average Nearest Neighbor analysis of the sampled biological data to find the average distance between core samples. The analysis revealed a mean expected distance of roughly 500 m between shallow water (near shore < 25 m) biological data points (field sample points confirming the presence of coral) and about 2000 m between deepwater biological data points. Based on this analysis, we have clipped a 500-m buffer around shallow water biological data points and a 2000-m around the deepwater biological data points. The buffered areas were merged with the interpolated EBK surface to create the IDW-EBK. Thus, biological data points with known locations and sufficiently large buffers were placed amidst seafloor sediment probabilistic surface without distorting the interpolation.
Figure 2. Results from the seafloor core data interpolation using three methods: (a) Thiessen polygons; (b) Inverse Distance Weighted (biological and geological points), and (c) Empirical Bayesian Kriging (geological points only).
Jmse 03 00276 g002
Based on preliminary coral mapping studies in the study area [30,31,32], a second set of buffers were placed around the coral areas in the IDW, extracted from the IDW surface, and overlaid on the IDW-EBK to enhance the IDW-EBK by offering an expanded view of the potential spatial extent of coral features in the study area (Figure 2). We used the 500 m buffers for shallow water features and 2000 m buffers for deepwater features to carry the seabed suitability analysis for OCE development. The results were then compared with the enhanced IDW-EBK (Figure 3), which highlights the potential spatial extent of the deepwater coral habitat. Existing submarine cable routes identified multiple cable pathways already being used in Palm Beach, Broward, and Miami-Dade counties, which offer potential corridors for OCE power transmission cables to connect to land-based power grids.
Figure 3. Original (left) and enhanced (right) IDW-EBK hybrid interpolation results. Based on previous coral mapping studies in the study area and the benthic data set coverage, the enhanced IDW-EBK is considered a more accurate representation of the deep-water coral reef coverage.
Jmse 03 00276 g003

3.2. Statistical Analysis

Three tests that evaluate the association between paired samples (i.e., water depth and seafloor geology) were conducted. They include both parametric (Pearson correlation coefficient) for numerical grain size data, and non-parametric tests (Spearman rank coefficient and Kendall’s Tau) for categorical data. Simple linear regression and piecewise least squares with breakpoint were employed to investigate the relationship between bathymetry and seafloor sediment grain size.
Understanding the relationship between water depth and sediment grain size is important in seabed suitability analysis for commercial scale OCE deployment as it has the potential to reveal patterns in seafloor sediment distribution [45]. Out of 646 core data points used in the interpolations only 552 contained water depth values (in meters). Bathymetry surface raster was generated from bathymetric contours available through the NOAA Coastal Services Center and used to estimate the water depth values for the remaining 94 data points for which water depth data were not readily available. The ArcGIS geoprocessing tool that extracts values to points was used for data mining and derivation of estimates for the missing water depth data points. Additionally, missing grain size values were imputed by using the median grain size derived from sampled core data from a specific seafloor geology sub-class. Median grain size was calculated for eight seafloor geology subclasses. Table 3 and Figure 4 provide an overview of the results of the regression analysis. Data transformation was performed using the two-step approach suggested by Templeton [51] to normalize the grain size and water depth data. The approach requires computation of fractional ranks that are then fitted to an approximate normal distribution using the inverse distribution function in SPSS (IDF. Normal).
The Pearson correlation coefficient between grain size and water depth was found to be 0.29, which indicates relatively weak association. This result is confirmed by both the Spearman rank coefficient test and Kendall’s Tau which are not statistically significant at the 0.05 and 0.01 significance levels. At the α = 0.001 level, the null hypothesis could not be rejected for both statistical tests. The Spearman rank coefficient test yielded a value of −0.1556 (p-value = 0.004665), which provides weak evidence of a statistical association between water depth and sediment categories. The Kendall tau test yielded a test statistic of −3.24 with a p-value of 0.001196 (Table 3) which indicates that the null hypothesis cannot be rejected at the α = 0.001 significance level. Therefore, at α = 0.001 a statistically significant correlation between seafloor geology categories and water depth is present.
We followed the protocol suggested by Zuur et al. [52] to ensure that the assumption for performing linear regression analysis were not violated. The simple linear regression model explained only 10% of the variance. A second model based on nonlinear estimation was fitted to predict the relationship between grain size and water depth. More specifically, piecewise least squares regression with breakpoint was used to improve the goodness of fit of the model. The program (STATISTICA 12.0) [53] found a break point of 1.645 (mm) in the grain size dataset and estimated two constants and two regression coefficients (Table 3). The nonlinear model resulted in R = 0.777, and accounted for 60.482% of the variance which indicates significant improvement over the linear regression model.
Table 3. Results from the statistical analysis.
Paired Variables—Water Depth & SedimentValid (N)Spearman (R)Kendall (Tau)Pearson (r)p-value
Spearman rank correlation coefficient329−0.1556--- 0.0047
Kendall’s Tau coefficient329---−0.1197 0.0012
Pearson correlation coefficient646--- 0.29480.0000
Model: Piecewise linear regression with breakpoint; Least Squares Dependent variable: Grain size (mm); Independent variable: Water depth (m) Variance explained: 60.482%; R = 0.7777
Constant β01Water Depth1 (m)Constant β02Water Depth2 (m)Breakpoint
1.18080.0001352.65660.0009301.6445
β01 is the intercept for segment 1 of the piecewise linear regression; Water Depth1 is the regression coefficient for segment 1 of the piecewise linear regression; β02 is the intercept for segment 2 of the piecewise linear regression; Water Depth2 is the regression coefficient for segment 2 of the piecewise linear regression.
Figure 4. Grain size interpolation based on Empirical Bayesian Kriging indicates that the northern section of the study area is predominantly composed of various types of sand substrates whereas the mid- and southern sections have large sections of fine-grained sediments. Fine-grained sediment such as ooze, mud, silt and clay is found consistently in shallow waters near the coast due to the impact of the extensive network of canals and navigational inlets.
Jmse 03 00276 g004
Figure 5 displays the results from the Empirical Bayesian Kriging interpolation of grain size. Figure 5 indicates that fine-grained sediment such as ooze, mud, silt and clay is found consistently in shallow waters near the coast. This finding is consistent with the literature on the sedimentation patterns in the near-shore littoral environments impacted by human activities. A study by Lirman et al. [44] suggested that the sedimentation rates and specifically those measured near navigational inlets, are an order of magnitude higher than those found elsewhere. Grain size data indicate that the northern section of the study area is predominantly composed of various types of sand substrates whereas the mid- and southern sections have large sections of fine-grained sediments.
Figure 5. Benthic data and existing submarine cables routes overlaid atop IDW-EBK surface. The finalized suitability map suggests the areas east of the Miami Terrace and north of the known deep-sea coral mounds as most suitable for OCE siting due to its abundance of potentially suitable sand and sediment substrates, access to existing underwater cable routes, and minimal biological presence.
Jmse 03 00276 g005
The finalized suitability maps (Figure 5) suggest the areas east of the Miami Terrace and north of the known deep-sea coral mounds as most suitable for OCE siting due to its abundance of potentially suitable sand and sediment substrates, access to existing underwater cable routes (this study was not able to identify additional cable pathways), and minimal biological presence. Based on previous coral mapping studies in the study area [30,31,32] and the benthic data set coverage, the enhanced IDW-EBK is considered a more accurate representation of the deep-water coral reef coverage. While TPA, IDW, EBK and IDW-EBK approaches provide useful insights to the distribution of seafloor substrates in the study area, these approaches remain at the screening level. The suitability analysis presented in this study provides an initial assessment to selecting potentially suitable areas for OCE siting. Site-specific studies using advanced geotechnical equipment will assist further exploration of the potentially suitable sites to determine the best location and eliminate the likelihood of negative environmental impacts.

3.3. Sensitivity and Error Analysis

The accuracy of the EBK interpolation was assessed by using three levels of spatial resolution: a 30-m, 200-m, and 500-m input cell size parameter. A value (interpolated) to a point (observed) was extracted to evaluate the accuracy of the EBK interpolation. Interpolated point values were also extracted from the cells in a von Neumann-type neighborhood (i.e., the cells located directly to the north, south, east, and west of the individual core point). Actual core values were compared with the interpolated values and the averaged neighboring cells values for the 30-m, 200-m, and 500-m EBK interpolations. A sensitivity analysis based on comparisons between EBK pixel values and discrete core data point values show minimal variation between the 30 m, 200 m, and 500 m EBK interpolations which suggests that cell size does not affect the EBK interpolation accuracy. Raster cell size does not appear to influence the results of the EBK interpolation.
The Root Mean Square Error for the EBK interpolation based on grain size was found to be 0.97, while Root-Mean-Square Standardized Error was 1.02. For the EBK interpolation based on seafloor geology classes, the RMSE was 0.339907. The CRV values (Table 4) for the EBK interpolation indicate that the relative variability in the results of the probabilistic model (values of roughly 0.24 and 0.17) is less than the relative variability in the results of the IDW interpolation (CRV = 0.44). The MAPE calculation revealed a mean average percentage error of roughly 5% for the IDW-EBK hybrid surface, the lowest compared to IDW and EBK alone. For the IDW-EBK the sum of errors resulting from the difference between observed and interpolated values was found to be 17.67 and the Mean Absolute Percentage Error was 5.4% (MAPE = 0.05369).
Table 4. Coefficient of Relative Variation (CRV).
Data TypeNumber of PointsSourceMeanStandard DeviationCRV
IDW (biological & geological points)646Observed2.93651.29300.4403
IDW (biological & geological points)646Interpolated2.89321.29980.4493
EBK (geological points only)329Observed2.03650.48630.2388
EBK (geological points only)329Interpolated1.94830.33190.1703

4. Conclusions

BOEM requires a suite of geophysical and geotechnical investigations of the seabed before siting a device on the outer continental shelf (OCS) [11]. In order to select appropriate locations for such site-specific investigations, a preliminary “screening” assessment of seabed suitability provides a useful approach to narrowing down potential options. These types of screening assessments are particularly important in areas with protected reef ecosystems. The suitability analysis presented here provides the basis for such preliminary investigations by introducing the concept of a seafloor substrate suitability model that incorporates new geostatistcal techniques to assess the biological and geological factors of OCE siting. Moreover, the suitability model builds upon the limited body of research pertaining to OCE offshore southeast Florida. This new depth contributes a clearer visualization of the benthic environment offshore southeast Florida as it relates to the progression of ocean energy development in Florida and provides future OCE researchers a more comprehensive baseline for designing and executing higher-resolution surveys.
An important aspect of this process is to identify a suite of biological and geological datasets that can serve the objectives of the analysis. The study relied exclusively on seafloor core and grab sample datasets acquired from BOEM, FDEP, FFWC, NOAA, USGS and Vinick et al. [12]. The datasets came in various formats and level of detail. Data were processed to remove samples with missing values or duplication. A consolidated dataset of 646 data points was compiled and a unified codification scheme was applied based on the most detailed descriptions available in the datasets. In order to conduct an assessment of the degree of suitability of seabed substrates for OCE deployment, a related literature search was conducted. Geostatistical Analyst extension in ArcGIS provides a suite of tools to interpolate point data using both deterministic and probabilistic approaches. We have established that deterministic geostatistical approaches are better suited to represent benthic communities in relatively close proximity to the sampled data locations. Probabilistic geostatistical techniques were particularly useful in interpolating seafloor geology. A hybrid approach where unknown locations of benthic communities were derived from samples using IDW interpolation and a surface of the seafloor substrate was created using empirical Bayesian kriging was found to yield the most reliable results. The interpolated seafloor substrate maps (based on the seafloor geology core data) generally revealed biological substrate types closer to shore (<200 m water depth) and sand/sediment substrates further offshore (>200 m water depth). Analysis of the benthic data highlighted the presence of coral that must be circumvented when siting OCE so as to minimize potential negative environmental impacts. The statistical analysis of the relationship between water depth and grain size in seafloor sediment indicated that piecewise least squares regression with breakpoint fits the data best and accounts for over 60 percent of the variance.
Detailed stratigraphic analysis including studying subsurface seabed lithology will be required for the proper siting of large-scale ocean current energy projects. Deployment of hydrokinetic devices offshore southeast Florida must adapt to South Florida’s unique geomorphic setting and ecological resources the most prominent of which is its extensive coral reef ecosystem. Ocean current turbines are likely to be installed farther offshore than other marine renewable energy projects. Deployment of OCE devices at a commercial scale including installation of additional cable transmission lines will require wide-ranging offshore benthic surveys which may not be feasible. Bathymetric (notably multibeam and side-scan sonar) data and sediment core data (physical samples taken directly from the seabed) and interpolations of these data can assist decision-makers and industry in identifying areas with soft bottom versus hard bottom substrate. Multibeam echosounder devices and side-scans are types of sonar system employed to construct an image of large areas of the seafloor in an efficient manner [54]. Combined with seafloor samples, methods such as these will allow exploration of differences in material and texture type of the seabed. High-resolution seafloor mapping techniques can satisfy the detailed and extensive survey requirements stipulated by BOEM [11]. These methods along with careful regulatory compliance will provide the basis for continued siting research, which is crucial for the implementation of future large-scale southeastern Florida ocean current energy projects.

Acknowledgments

The authors would like to acknowledge the contribution of the anonymous reviewers for their helpful comments and suggestions.

Author Contributions

All authors contributed to the conceptual development of this study and provided various inputs regarding the literature overview, conceptual framework, analysis, discussion and results.

Conflicts of Interest

The authors declare no conflict of interest.

References

  1. Hanson, H.P.; Bozek, A.; Duerr, A.E. The Florida Current: A clean but challenging energy resource. EOS Trans. Am. Geophys. Union 2011, 92, 29–36. [Google Scholar] [CrossRef]
  2. Southeast National Marine Renewable Energy Center (SNMREC). FAU’s Southeast. National Marine Renewable Energy Center Successfully Tests Research Turbine Offshore; Southeast National Marine Renewable Energy Center (SNMREC), 2014. Available online: http://snmrec.fau.edu/news/fau%E2%80%99s-southeast-national-marine-renewable-energy-center-successfully-tests-research-turbine#sthash.lL8w5BLA.dpuf (accessed on 25 October 2014).
  3. Hanson, H.P.; Skemp, S.H.; Alsenas, G.M.; Coley, C.E. Power from the Florida Current: A new perspective on an old vision. Bull. Am. Meteorol. Soc. 2010, 91, 861–867. [Google Scholar] [CrossRef]
  4. Kenny, A.J.; Cato, I.; Desprez, M.; Fader, G.; Schuttenhelm, R.T.E.; Side, J. An overview of seabed mapping technologies in the context of marine habitat classification. ICES J. Mar. Sci. 2003, 60, 411–418. [Google Scholar] [CrossRef]
  5. Keenan, G.; Sparling, C.; Williams, H.; Fortune, F. SeaGen Environmental Monitoring Programme Final Report; Royal Haskoning Enhancing Society: Edinburgh, UK, 2011. [Google Scholar]
  6. Stewart, P.L. Suspended Sediment Monitoring. In Environmental Assessment of the Bay of Fundy Tidal Power Project; Envirosphere Consultants Limited Windsor: Halifax, Nova Scotia, Canada, 2010. [Google Scholar]
  7. Portman, M.E. Marine renewable energy policy some U.S. and international perspectives compared. Oceanogr 2010, 23, 98–105. [Google Scholar] [CrossRef]
  8. Salcido, R. Siting offshore hydrokinetic energy projects: A comparative look at wave energy regulation in the Pacific Northwest. Golden Gate Univ. Envtl. Law J. 2011, 5, 109–158. [Google Scholar]
  9. Federal Energy Regulatory Commission (FERC). Legal Resources—Federal Statutes; Federal Energy Regulatory Commission (FERC): Washington, DC, USA, 2014. Available online: http://www.ferc.gov/legal/fed-sta.asp (accessed on 23 January 2015).
  10. Finkl, C.W.; Charlier, R. Electrical power generation from ocean currents in the Straits of Florida: Some environmental considerations. Renew. Sust. Energ. Rev. 2009, 13, 2597–2604. [Google Scholar] [CrossRef]
  11. Bureau of Ocean Energy Management (BOEM). Lease Issuance for Marine Hydrokinetic Technology Testing on the Outer Continental Shelf Offshore Florida Revised Environmental Assessment, OCS EIS/EA BOEM 2013–01140; Office of Renewable Energy Programs, U.S. Department of the Interior: Washington, DC, USA, 2013. Available online: http://www.boem.gov/Florida-Revised-EA-FONSI-August2013/ (accessed on 13 Febuary 2014).
  12. Vinick, C.; Riccobono, A.; Messing, C.G.; Walker, B.K.; Reed, J.K.; Rogers, S. Siting study for a Hydrokinetic Energy Project Located Offshore Southeastern Florida: Protocols for Survey Methodology for Offshore Marine Hydrokinetic Energy Projects; U.S. Department of Energy: Washington, DC, USA, 2012; pp. 1–100.
  13. Dubbs, L.; Keeler, A.; O’Meara, T. Permitting, risk and marine hydro-kinetic energy development. Electr. J. 2013, 26, 64–74. [Google Scholar] [CrossRef]
  14. Orth, R.J.; Carruthers, T.J.B.; Dennison, W.C.; Duarte, C.M.; Fourquerean, J.W.; Heck, K.L.; Hughes, R.A.; Kendrick, G.A.; Kenworthy, J.W.; Olyarnik, S.; et al. A global crisis for seagrass ecosystems. BioScience 2006, 56, 987–996. [Google Scholar] [CrossRef]
  15. McCann, J. Developing Environmental Protocols and Modeling Tools to Support. Ocean. Renewable Energy and Stewardship; National Oceanographic Partnership Program, OCS Study BOEM 2012–082, U.S. Department of the Interior, Bureau of Ocean Energy Management, Office of Renewable Energy Programs: Herndon, VA, USA, 2012. [Google Scholar]
  16. Valent, P.J.; Taylor, J.M.; Beard, R.M. OTEC Single Anchor Holding Capacities in Typical Deep Sea Sediments; U.S. Energy Research and Development Administration: Port Hueneme, CA, USA, 1976. [Google Scholar]
  17. Taylor, R.J. Interaction of Anchors with Soil and Anchor Design; U.S. Department of the Navy: Port Hueneme, CA, USA, 1982. [Google Scholar]
  18. Sound and Sea Technology. In Advanced Anchoring and Mooring Study; Oregon Wave Energy Trust: Portland, OR, USA, 2009.
  19. Van Zwieten, J.H.; Seibert, M.G.; Von Ellenreider, K. Anchor Selection Study for Ocean Current Turbines; Technical Report TR-12-003; Florida Atlantic University Southeast National Marine Renewable Energy Center: Boca Raton, FL, USA, 2012. [Google Scholar]
  20. Bennett, M.M.; Glasser, N.F. Glacial Geology: Ice Sheets and Landforms; Wiley: Hoboken, NJ, USA, 2009. [Google Scholar]
  21. Goff, J.A.; Jenkins, C.J.; Williams, S.J. Seabed mapping and characterization of sediment variability using the usSEABED database. Cont. Shelf Res. 2008, 28, 614–633. [Google Scholar] [CrossRef]
  22. Li, J. Predicting the Spatial Distribution of Seabed Gravel Content Using Random Forest, Spatial Interpolation Methods and Their Hybrid Methods. In Proceedings of the 20th International Congress on Modelling and Simulation, Adelaide, Australia, 1–6 December 2013.
  23. Verfaille, E.; van Lancker, V.; van Meirvenne, M. Multivariate geostatistics for the predictive modelling of the surficial sand distribution in shelf seas. Cont. Shelf Res. 2006, 26, 2454–2468. [Google Scholar] [CrossRef]
  24. Knotters, M.; Heuvelink, G.B.M.; Hoogland, T.; Walvoort, D.J.J. A Disposition of Interpolation Techniques; Wageningen University and Research Centre, Statutory Research Tasks Unit for Nature and the Environment: Wageningen, The Netherlands, 2010. [Google Scholar]
  25. Tchoukanski, I. Build. Thiessen Polygons. 2013. Available online http://www.ian-ko.com/ETGeoWizards/UserGuide/thiessenPolygons.htm (accessed on 3 November 2013).
  26. Johnston, K.; Ver Hoef, J.M.; Krivoruchko, K.; Lucas, N. Using ArcGIS Geostatistical Analyst; ESRI Press: Redlands, CA, USA, 2001. [Google Scholar]
  27. Krivoruchko, K.; Butler, K. Unequal Probability-Based Spatial Mapping; Esri: Redlands, CA, USA, 2013; Available online: http://www.esri.com/esrinews/arcuser/spring2013/~/media/Files/Pdfs/news/arcuser/0313/unequal.pdf (accessed on 14 March 2014).
  28. Krivoruchko, K. Empirical Bayesian Kriging; Esri: Redlands, CA, USA, 2012; Available online: http://www.esri.com/news/arcuser/ 1012/empirical-byesian-kriging.html (accessed on 7 April 2014).
  29. Charlier, R.H.; Justus, J.R. Ocean. Energies—Environmental, Economic and Technical Aspects of Alternative Power Sources; Elsevier Oceanography Series: Amsterdam, The Netherlands, 1993. [Google Scholar]
  30. Walker, B.K.; Riegl, B.M.; Dodge, R.E. Mapping Coral Reef Habitats in Southeast Florida Using a Combined Technique Approach. J. Coast. Res. 2008, 24, 1138–1150. [Google Scholar] [CrossRef]
  31. Walker, B.K.; Jordan, L.K.B.; Spieler, R.S. Relationship of fish assemblages and topographic complexity on southeastern Florida coral reef habitats. J. Coast. Res. 2009, 39–48. [Google Scholar] [CrossRef]
  32. Reed, J.K.; Weaver, D.; Pomponi, S.A. Habitat and fauna of deep-water Lophelia pertusa coral reefs off the southeastern USA: Blake Plateau, Straits of Florida, and Gulf of Mexico. Bull. Mar. Sci. 2006, 78, 343–375. [Google Scholar]
  33. South Florida Water Management District Staff. Canals in South Florida: A Technical Support Document (Appendices A-C); South Florida Water Management District: West Palm Beach, FL, USA, 2010.
  34. Reid, J.M.; Reid, J.A.; Jenkins, C.J.; Hastings, M.E.; Williams, S.J.; Poppe, L.J. usSEABED: Atlantic Coast Offshore Surficial Sediment Data Release; Data Series 118, Version 1.0; U.S. Geological Survey: Woods Hole, MA, USA, 2005.
  35. Poppe, L.J.; Williams, S.J.; Paskevich, V.F. USGS East.-Coast. Sediment. Analysis: Procedures, Database, and GIS Data; Open-File Report 2005–1001; U.S. Geological Survey: Woods Hole, MA, USA, 2005.
  36. National Oceanic and Atmospheric Administration (NOAA). The Index to Marine and Lacustrine Geological Samples (IMLGS); National Oceanic and Atmospheric Administration (NOAA): Boulder, CO, USA, 2013. Available online: http://www.ngdc.noaa.gov/mgg/curator (accessed on 7 Feburary 2014).
  37. Gardner, J.V.; Field, M.E.; Twichell, D.C. Geology of the United States’ Seafloor: The View from GLORIA; Cambridge University Press: Cambridge, UK, 1996. [Google Scholar]
  38. Florida Fish and Wildlife Commission-Fish and Wildlife Research Institute. Coral and Hard Bottom Habitats Florida; Florida Fish and Wildlife Commission-Fish and Wildlife Research Institute: Tallahassee, FL, USA, 2013; Available online: http://atoll.floridamarine.org/Data/Metadata/SDE_Current /coral_hardbottom_poly.htm (accessed on 17 November 2013).
  39. Florida Fish and Wildlife Commission-Fish and Wildlife Research Institute. Deepwater Coral HAPCs; Florida Fish and Wildlife Commission-Fish and Wildlife Research Institute: Tallahassee, FL, USA, 2008; Available online: http://ocean.floridamarine.org/efh_coral/zip/Final_DC_HAPC.shp.xml (accessed on 5 December 2013).
  40. National Oceanic Atmospheric Administration (NOAA). Critical Habitat Designations for the coastal US and US waters as of October 2012; Coastal Services Center: Charleston, SC, USA, 2012.
  41. National Oceanic Atmospheric Administration (NOAA). Submarine Cables; Coastal Services Center: Charleston, SC, USA, 2011.
  42. Van Cleve, F.B.; Judd, C.; Radil, A.; Ahmann, J.; Geerlofs, S.H. Geospatial Analysis of Technical and Economic Suitability for Renewable Ocean. Energy Development on Washington’s Outer Coast; Pacific Northwest National Laboratory: Richland, Washington, DC, USA, 2013.
  43. Nelson, W.G. Seagrasses and Protective Criteria: A Review and Assessment of Research Status; U.S. Environmental Protection Agency: Newport, OR, USA, 2009.
  44. Lirman, D.; Orlando, B.; Macia, S.; Manzello, D.; Kaufman, L.; Biber, P.; Jones, T. Coral communities of Biscayne Bay, Florida and adjacent offshore areas: diversity, abundance, distribution, and environmental correlates. Aquat. Conserv. Mar. Freshw. Ecosys. 2003, 13, 121–135. [Google Scholar] [CrossRef]
  45. Ewing, M.; Carpenter, G.; Windisch, C.; Ewing, J. Sediment distribution in the oceans: The Atlantic. Geol. Soc. Am. Bull. 1973, 84, 71–88. [Google Scholar] [CrossRef]
  46. Karl, H.A. Sediment. of the Sea Floor; United States Geological Survey: Boulder, CO, USA, 2006.
  47. Jelinski, D.E.; Wu, J. The modifiable areal unit problem and implications for landscape ecology. Landsc. Ecol. 1996, 11, 129–140. [Google Scholar] [CrossRef]
  48. Willmott, C.J.; Matsuura, K. Advantages of the mean absolute error (MAE) over the root mean square (RMSE) in assessing average model performance. Clim. Res. 2005, 30, 79–82. [Google Scholar] [CrossRef]
  49. Forkman, J. Estimator and tests for common coefficients of variation in normal distributions. Commun. Stat. Theor. M. 2009, 38, 233–251. [Google Scholar] [CrossRef]
  50. Coleman, C.; Swanson, D. On MAPE-R as a measure of cross-sectional estimation and forecast accuracy. J. Econ. Soc. Meas. 2007, 32, 219–233. [Google Scholar]
  51. Templeton, G.F. A Two-Step Approach for Transforming Continuous Variables to Normal: Implications and Recommendations for IS Research; Communications of the Association for Information Systems: Mississippi State, MS, USA, 2011; Available online: http://aisel.aisnet.org/cais/vol28/iss1/4/ (accessed on 12 January 2014).
  52. Zuur, A.; Ieno, E.N.; Elphick, C.S. Mixed effects models and extensions in ecology with R. Methods Ecol. Evol. 2010, 1, 3–14. [Google Scholar] [CrossRef]
  53. StatSoft. STATISTICA 12.0. 2013. Available online http://www.statsoft.com/Products/STATISTICA-Features/Version-12 (accessed on 14 October 2014).
  54. De Moustier, C.; Matsumoto, H. Seafloor acoustic remote sensing with multibeam echo-sounders and bathymetric sidescan sonar systems. Mar. Geophys. Res. 1993, 15, 27–42. [Google Scholar] [CrossRef]

