Article

Weed Suppressive Ability of Cover Crop Mixtures Compared to Repeated Stubble Tillage and Glyphosate Treatments

by
Alexandra Schappert
*,
Miriam H. Messelhäuser
,
Marcus Saile
,
Gerassimos G. Peteinatos
and
Roland Gerhards
Department of Weed Science, Institute of Phytomedicine, University of Hohenheim, 70599 Stuttgart, Germany
*
Author to whom correspondence should be addressed.
Agriculture 2018, 8(9), 144; https://doi.org/10.3390/agriculture8090144
Submission received: 15 August 2018 / Revised: 11 September 2018 / Accepted: 13 September 2018 / Published: 15 September 2018
(This article belongs to the Special Issue Weed Management)

Abstract

:
The utilization of an effective stubble management practice can reduce weed infestation before and in the following main crop. Different strategies can be used, incorporating mechanical, biological, and chemical measures. This study aims at estimating the effects of cover crop (CC) mixtures, various stubble tillage methods, and glyphosate treatments on black-grass, volunteer wheat and total weed infestation. Two experimental trials were conducted in Southwestern Germany including seven weed management treatments: flat soil tillage, deep soil tillage, ploughing, single glyphosate application, dual glyphosate application, and a CC mixture sown in a mulch-till and no-till system. An untreated control treatment without any processing was also included. Weed species were identified and counted once per month from October until December. The CC mixtures achieved a black-grass control efficacy of up to 100%, whereas stubble tillage and the single glyphosate treatment did not reduce the black-grass population, on the contrary it induced an increase of black-grass plants. The dual glyphosate application showed, similar to the CC treatments, best results for total weed and volunteer wheat reduction. The results demonstrated, that well developed CCs have a great ability for weed control and highlight that soil conservation systems do not have to rely on chemical weed control practices.

1. Introduction

A crop rotation, including spring crops, requires an effective weed management strategy during the crop-free period. This might include biological, mechanical, and chemical (also repeated and in combination) weed control tools on the fallow ground not in production in autumn. These tools have the aim to encourage the germination of volunteer crops, remove emerged weeds, reduce available sources, especially for perennial weeds, and to avoid a new weed seed production. The success of a weed management technique during the crop-free period may have a major impact on the weed seed bank, and weed infestation on the subsequent crops. Weeds compete for resources with the main crops and may also act as a host for pests and diseases [1]. The ergot fungus (Claviceps purpurea (Fr.) Tul.) for example uses Alopecurus myosuroides Huds. (A. myosuroides) as an alternate host [2]. An effective weed control strategy therefore improves plant health and provides yield stability.
The application of synthetic herbicides is a common weed control practice in conventional farming systems. The use of non-selective herbicides (e.g., glyphosate) is a non-time-intense and efficient weed management practice particularly in conservation agriculture systems. A. myosuroides, an annual grassy-weed (Poaceae), became a major problem in autumn sown crops in Western Europe [3]. The increasing impact of A. myosuroides in agricultural cropping systems can be attributed to the modifications on the current agricultural strategies, like increasing numbers of autumn sown crops, the alteration of cropping and tillage systems and the consequent usage of herbicides with the same mode of action [3]. Several weed species have developed resistance to herbicides including glyphosate [4]. Since A. myosuroides has already evolved field resistance to multiple herbicide modes of action [5], increasing the reliance on glyphosate can lead to a resistance to it [6]. The current public concern raised, regarding the use of glyphosate in agriculture and the restrictions enforced in different countries, increases the necessity to search for alternative measures and different weed management tools. Biological and mechanical control methods might be an option to compete with resistant populations as well as to mitigate the development of herbicide resistant weeds.
Mechanical weed control practices, including tillage, might differ regarding the implementation, timing, and frequency [7]. This might include flat tillage (<5 cm) and as well a deep stubble tillage (>5 cm) [8]. Ploughing buries the weed seeds and mostly prevents them to emerge from deeper soil layers. Systems with a lower or superficial soil disturbance, compared to ploughing, usually result in a greater weed infestation [9] and weed seed accumulation near the soil surface [10]. However, reduced tillage systems have the advantage of decreasing run-off, increasing aggregate stability [11] and preserving a higher soil moisture [12]. Repeated flat or medium deep tillage may combine the benefits of reduced tillage systems for soil conservation with a sufficient weed control, yet with a possible negative impact concerning nutrient losses, soil compaction, or carbon gas emissions.
Winter cover crops (CCs), used as a biological weed control measure [13], may demonstrate several advantages, including nutrient recycling efficiency [13] and reduced soil erosion [14]. The success of CCs as an integrated weed management practice, is related to a fast emergence and high soil cover, which depends on the chosen species, soil properties, and the weather conditions at the field location. Using different cover crop (CC) species within a mixture increases the resilience for management failures, bad weather conditions, and combines species-specific benefits [15]. Seed predation, which may also act as a biological weed control measure [16], is enhanced in cover-cropping [17] and no-till systems [18] and decreases the amount of weed seeds at the soil surface.
The straw management, also in combination with the different weed management practices as mentioned above, has an impact on weed infestation. Generally, straw disposal can for example reduce the number of A. myosuroides plants, due to weed seed removal from the field [19]. In no-till systems the straw surface coverage, which generates a physical barrier, is reducing the weed density [20]. Otherwise, the herbicide efficacy could be reduced by crop residues [21]. On the other hand, the presence of straw in CC systems might lead to an immobilization of nitrogen, which will then narrow the CC development and their subsequent success for weed suppression [22].
There is little information available about the potential of repeated flat and deep stubble tillage in comparison to ploughing and cover-cropping to substitute herbicide applications in autumn. In a non-inversion tillage system grass weeds, like A. myosuroides, might be encouraged [23]. Furthermore, CCs are a suitable tool for broad-leave weed control [24]. Within cover-cropping systems grass weeds may also become a severe challenge [25] which might require the use of herbicides [24]. The presence and absence of straw will additionally deliver information about the impact of straw management in combination with different weed management treatments on weed infestation.
This study aims at estimating the ability of selected biological, mechanical, and chemical weed control practices on weed suppression before spring cropping. The following hypotheses were investigated: (i) stubble tillage and CCs have similar success in reducing weeds as glyphosate applications; (ii) repeated stubble tillage is a more effective weed suppression measure in comparison to a single deep, turning soil tillage; (iii) the sowing method of CCs (mulch-tillage and no-tillage) has an impact on the success of weed suppression; (iv) the removal of straw after harvest is influencing the weed infestation.
The study was implemented at field sites with an increased population of A. myosuroides. The results may clarify if tillage, herbicide application, or cover-cropping can reduce the number of A. myosuroides plants. CCs were sown within a mulch-till and no-till systems to evaluate if no-till systems lead to an increasing number of weeds in comparison to stubble tillage systems as shown by Gruber et al. [26].

2. Materials and Methods

2.1. Experimental Sites

Two field experiments (Binsen: 48°25′22.0′′ N 8°53′15.4′′ E and Risp: 48°25′06.3′′ N 8°53′48.0′′ E) were conducted in Southwestern Germany from August until December 2017. The weather data are shown in Table 1.
The soil type at both trials was characterized as a loamy silt with pH values of 6.9 (field Binsen) and 5.9 (field Risp). The fields had a different crop rotation history with the same previous crop at the beginning of the experiment. Crop rotation at the field Binsen was winter wheat (2013), triticale (2014), spring barley (2015), peas (2016), and winter wheat (2017). The trial at the field Risp had a crop rotation of peas (2013), winter wheat (2014), red clover (2015), flowering mixture (2016), followed by winter wheat (2017). The winter wheat was harvested at the 1st of August at both trials. The experimental trials were set up as a randomized strip-plot design. The two factorial experiments included seven weed management practices with regard to mechanical, chemical, and biological treatments (1st factor). The untreated control plots were left without any weed control treatment. The details according to the weed management treatments are shown in Table 2. The 2nd factor (which was implemented as the strip) combined the same weed management treatments as mentioned before including the presence and absence of straw. The straw from the plots with the straw removal was baled and taken from the plots at the same day as the harvest. In total, 16 treatments with 3 repetitions were included at both field trials.
The plots had a size of 16.5 × 5 m (field Binsen) and 21.5 × 5 m (field Risp). The CC mixture sown at both trials for treatments 7 and 8 was provided by DSV-Saaten [27] and included the following CC species (their ratios within the mixture are shown in brackets): Avena strigosa Schreb. (45%), Fagopyrum esculentum Moench (18%), Linum usitatissimum L. (12%), Phacelia tanacetifolia Benth. (6%), Raphanus sativus var. oleiformis (6%), Sinapis alba L. (6%), Brassica carinata A.Braun (4%), Helianthus annuus L. (2%), Camelina sativa Crantz (1%). The plots with the CC treatments sown with mulch-till (treatment 7) were prepared with a cultivator and a rotary harrow. A Cambridge roller was used after sowing to increase the soil contact of the seeds and to improve the CC seed germination.

2.2. Data Collection

Individual weed species as well as the total amount of plants were identified and counted at three dates: 12th of October (73 DAH), 17th of November (109 DAH) and 13th of December (135 DAH). This was performed with a circular 0.33 m2 frame at four randomly chosen spots per plot. CC biomass was cut at both mulch-till sown and no-till treatments once at the 14th of October. The CC biomass was measured to determine which sowing technique results in a greater CC development. The biomass of 0.33 m2 was cut and fresh weed and CC biomass measured at four randomly chosen locations per plot.

2.3. Data Analysis

RStudio software (Version 1.1.453, RStudio Team, Boston, MA, USA) was used for analysing the data. Prior to analysis, the data was visually checked for normal distribution and homogeneity of variance. A transformation of the data was not necessary before doing an analysis of variance (ANOVA). The Tukey–HSD test (p ≤ 0.05) was performed to compare the means of the different treatments. The weed control efficacy (WCE), A. myosuroides control efficacy (ACE), and volunteer wheat control efficacy (VCE) was calculated according to Rasmussen et al. [28] and Machleb et al. [29]:
WCE, ACE, VCE (%) = 100 − wt (0.01 × wc)−1
whereby wt is the weed, A. myosuroides or volunteer wheat density (weeds m−2) of the weed management treatments, and wc is the weed, A. myosuroides or volunteer wheat density (weeds m−2) of the untreated control plots.

3. Results

3.1. Total Weed Suppression

Even though a diverse crop rotation was conducted at both experimental field sites, including winter and spring crops, A. myosuroides was the most dominant monocotyledons weed species, besides volunteer wheat. Other than that, dicotyledons like Lamium purpureum L., Veronica persica Poir., Stellaria media Vill., Thalaspi arvense L., and Raphanus raphanistrum L. were the dominant weed species (Table A1). The untreated control plots at the field Binsen showed a mean weed infestation of 96.9 weeds m2 (averaged over all counting dates). The WCE of all soil tillage treatments (flat soil tillage (FST), deep soil tillage (DST) and ploughing (PL)) at 73 DAH was between 1–76%, which was significantly lower (Figure 1) than for both glyphosate and the CC treatments. The FST and DST treatments showed an improved WCE with up to 82% at 109 and 135 DAH. Nevertheless, repeated tillage (FSL, DST) treatments resulted in lower WCE than the CC and the GLY+GLY (dual glyphosate application) treatments throughout the season. The CC+NT (cover crop mixture + no-till) treatment showed a WCE of 88% (135 DAH). The GLY+GLY treatment showed the highest WCE with more than 97% (109 DAH).
The untreated control plots at the trial at field Risp showed a generally higher mean weed infestation of 183.7 weeds m−2 (averaged over all counting dates). Similar to the trial at the field Binsen the GLY (single glyphosate application) and GLY+GLY performed significantly best, with a WCE of approximately 97% 73 DAH. Whereby the dual glyphosate application (GLY+GLY) increased the WCE 135 DAH up to 99%, the single treatment (GLY) reduced the WCE and showed no significant differences according to the WCE, compared to the CC and the repeated tillage (FST, DST) treatments 135 DAH. The CC+NT treatments seem to reduce weeds less efficient than the CC+MT (cover crop mixture + mulch-till) treatments. This trend was only significant at the field site at Risp 73 DAH. The PL treatments performed always significantly worse, at both trials (excluding the field Binsen 73 DAH), resulting in a WCE reaching a maximum of 59% 135 DAH at the field site at Risp. The factor straw was not significant, therefore Figure 1 is giving average values for total WCE, including treatments with straw and those with straw removal.

3.2. A. myosuroides Suppression

The untreated control at the field Binsen showed an average number of A. myosuroides with 7.1 plants m−2 (73, 109, and 135 DAH). Whereas all weed control practices were able to reduce the total amount of weeds, compared to the control, treatments like FST and DST increased the number of A. myosuroides to 20.6 and 18.7 plants m−2 (73, 109, and 135 DAH at field Binsen), respectively. The control treatments at the field Risp had a higher amount of A. myosuroides with 8.6 plants m−2. At both trials the repeated stubble tillage (FST, DST) and the PL treatment achieved a significant increase of A. myosuroides 73 DAH (Table 3). The CC treatments showed the highest ACE from 91.7 up to 100%. Both glyphosate treatments (GLY and GLY+GLY) are not showing the same efficacy against A. myosuroides as for the total weed control. The presence of straw reduced the number of A. myosuroides plants significantly within the FST and the DST treatments at the field Binsen.
The factor straw had a significant effect on the suppression of A. myosuroides at the field Risp 109 DAH within the DST and the GLY treatments (Table 4). The other treatments at field Risp and also at field Binsen were not affected by the presence or absence of straw. At both trials 109 DAH the GLY+GLY treatment showed an ACE up to 80.8%. Whereby, the GLY treatment was increasing the amount of A. myosuroides compared to the control, which resulted in a minimum ACE of −119.8% (field Risp). The CC treatments again performed best with an ACE between 94.4–100% (both trials).
Both CC treatments show an AWE of 100% at both field trials 135 DAH (Figure 2). FST and DST treatments increased the amount of A. myosuroides, compared to the control. ACE for the FST treatment was −175.0% at the field Binsen and −54.7% at the field Risp (135 DAH). The GLY treatment was also inducing an increase of A. myosuroides plants compared to the control, which showed an ACE of −262.5% (field Binsen). The GLY+GLY treatment showed an ACE up to 52.2% (field Risp). The absence or presence of straw had no significant effect on the ACE at both trials 135 DAH.

3.3. Volunteer Wheat Suppression

Volunteer wheat was the main weed within both trials. The amount of volunteer wheat achieved 72.9 (field Binsen) and 138.6 plants m−2 (field Risp), averaged over the three counting dates. At both trials and all counting dates, the GLY+GLY treatments had a VCE of 100% (Figure 3). The GLY and CC+MT treatments achieved similar results with a VCE of 99.2% at field Binsen 135 DAH. The VCE at the field Risp for the GLY and CC+MT treatments were only slightly lower with 96.1 and 98.1%, respectively (135 DAH). The CC+NT treatments, especially at the trial at field Risp, showed significantly less VCE, compared to both glyphosate (GLY and GLY+GLY) and the CC+MT treatments. Generally, all treatments were able to reduce the amount of volunteer wheat and reached at least 84.4% VCE. The absence or presence of straw had no significant effect according to VCE at both trials (73, 109, and 135 DAH).

3.4. CC Biomass

Even though the CC+NT treatment showed in some cases significantly less WCE and VCE, compared to the CC+MT treatment, the fresh CC biomass was not significantly different between those two treatments (Table 5). The factor straw had no statistical impact on the fresh CC biomass. The CC+MT treatment with the presence of straw at the field Binsen and Risp had a fresh CC biomass of 26.9 and 30.5 t ha−1, respectively. The CC+NT treatments, also with straw, showed fresh biomass values of 25.9 (field Binsen) and 27.3 t ha−1 (field Risp). Neither the sowing technique (no-till or mulch-till) of CCs, nor the presence or absence of straw had an impact on the fresh weight of weeds.

4. Discussion

Stubble management can have a big impact on weed dynamics [30]. The result of postharvest tillage on annual weeds mainly relates to the weed flora, the seed bank, and the dormancy status of the seeds [30]. Flat postharvest tillage incorporates crop residues and stimulates volunteer wheat to germinate. Multiple soil tillage induces weed seeds for germination and destroys and buries them at the subsequent tillage. This might decrease the total weed seed amount in the soil.
No clear differences concerning weed suppression were found between flat (FST) and deep stubble (DST) cultivation, which had also been demonstrated by Boström [31]. In the past, the shallow plough, as stubble tillage practise, was seen as most effective tool for weed management in Germany and Austria, as reported by Gruber et al. [26]. Within our study ploughing (PL) showed worst results concerning WCE among all treatments. It is therefore not reasonable to recommend a deep soil tillage (including ploughing), which is labor intense and costly and does not provide benefits for weed control and soil conservation. In this study, ploughing was done early after harvest. However, a late treatment before weed seed maturity might improve the performance. The generally moderate performance of all mechanical treatments in comparison with the chemical and the biological treatments might be caused by the wet weather conditions during autumn. Cirujeda and Taberner [32] who harrowed in cereals and state that a high WCE of harrowing is attributed to dry conditions after harrowing. From time to time inversion tillage or stubble management might be useful in order to control weeds in highly infested fields [26]. Ploughing, especially in combination with stubble tillage [33], is a useful tool against perennial and root spreading weeds. At both field trials, annual weeds were dominant, which allows a reduction of the tillage intensity [34] and a conservation stubble management with reduced soil disturbance. Pekrun and Claupein [7] recommend to leave the stubble undisturbed. In terms of a biological weed control strategy, keeping the freshly produced weed seeds on the soil surface enhances biodiversity and increases seed predation as biological weed control [35].
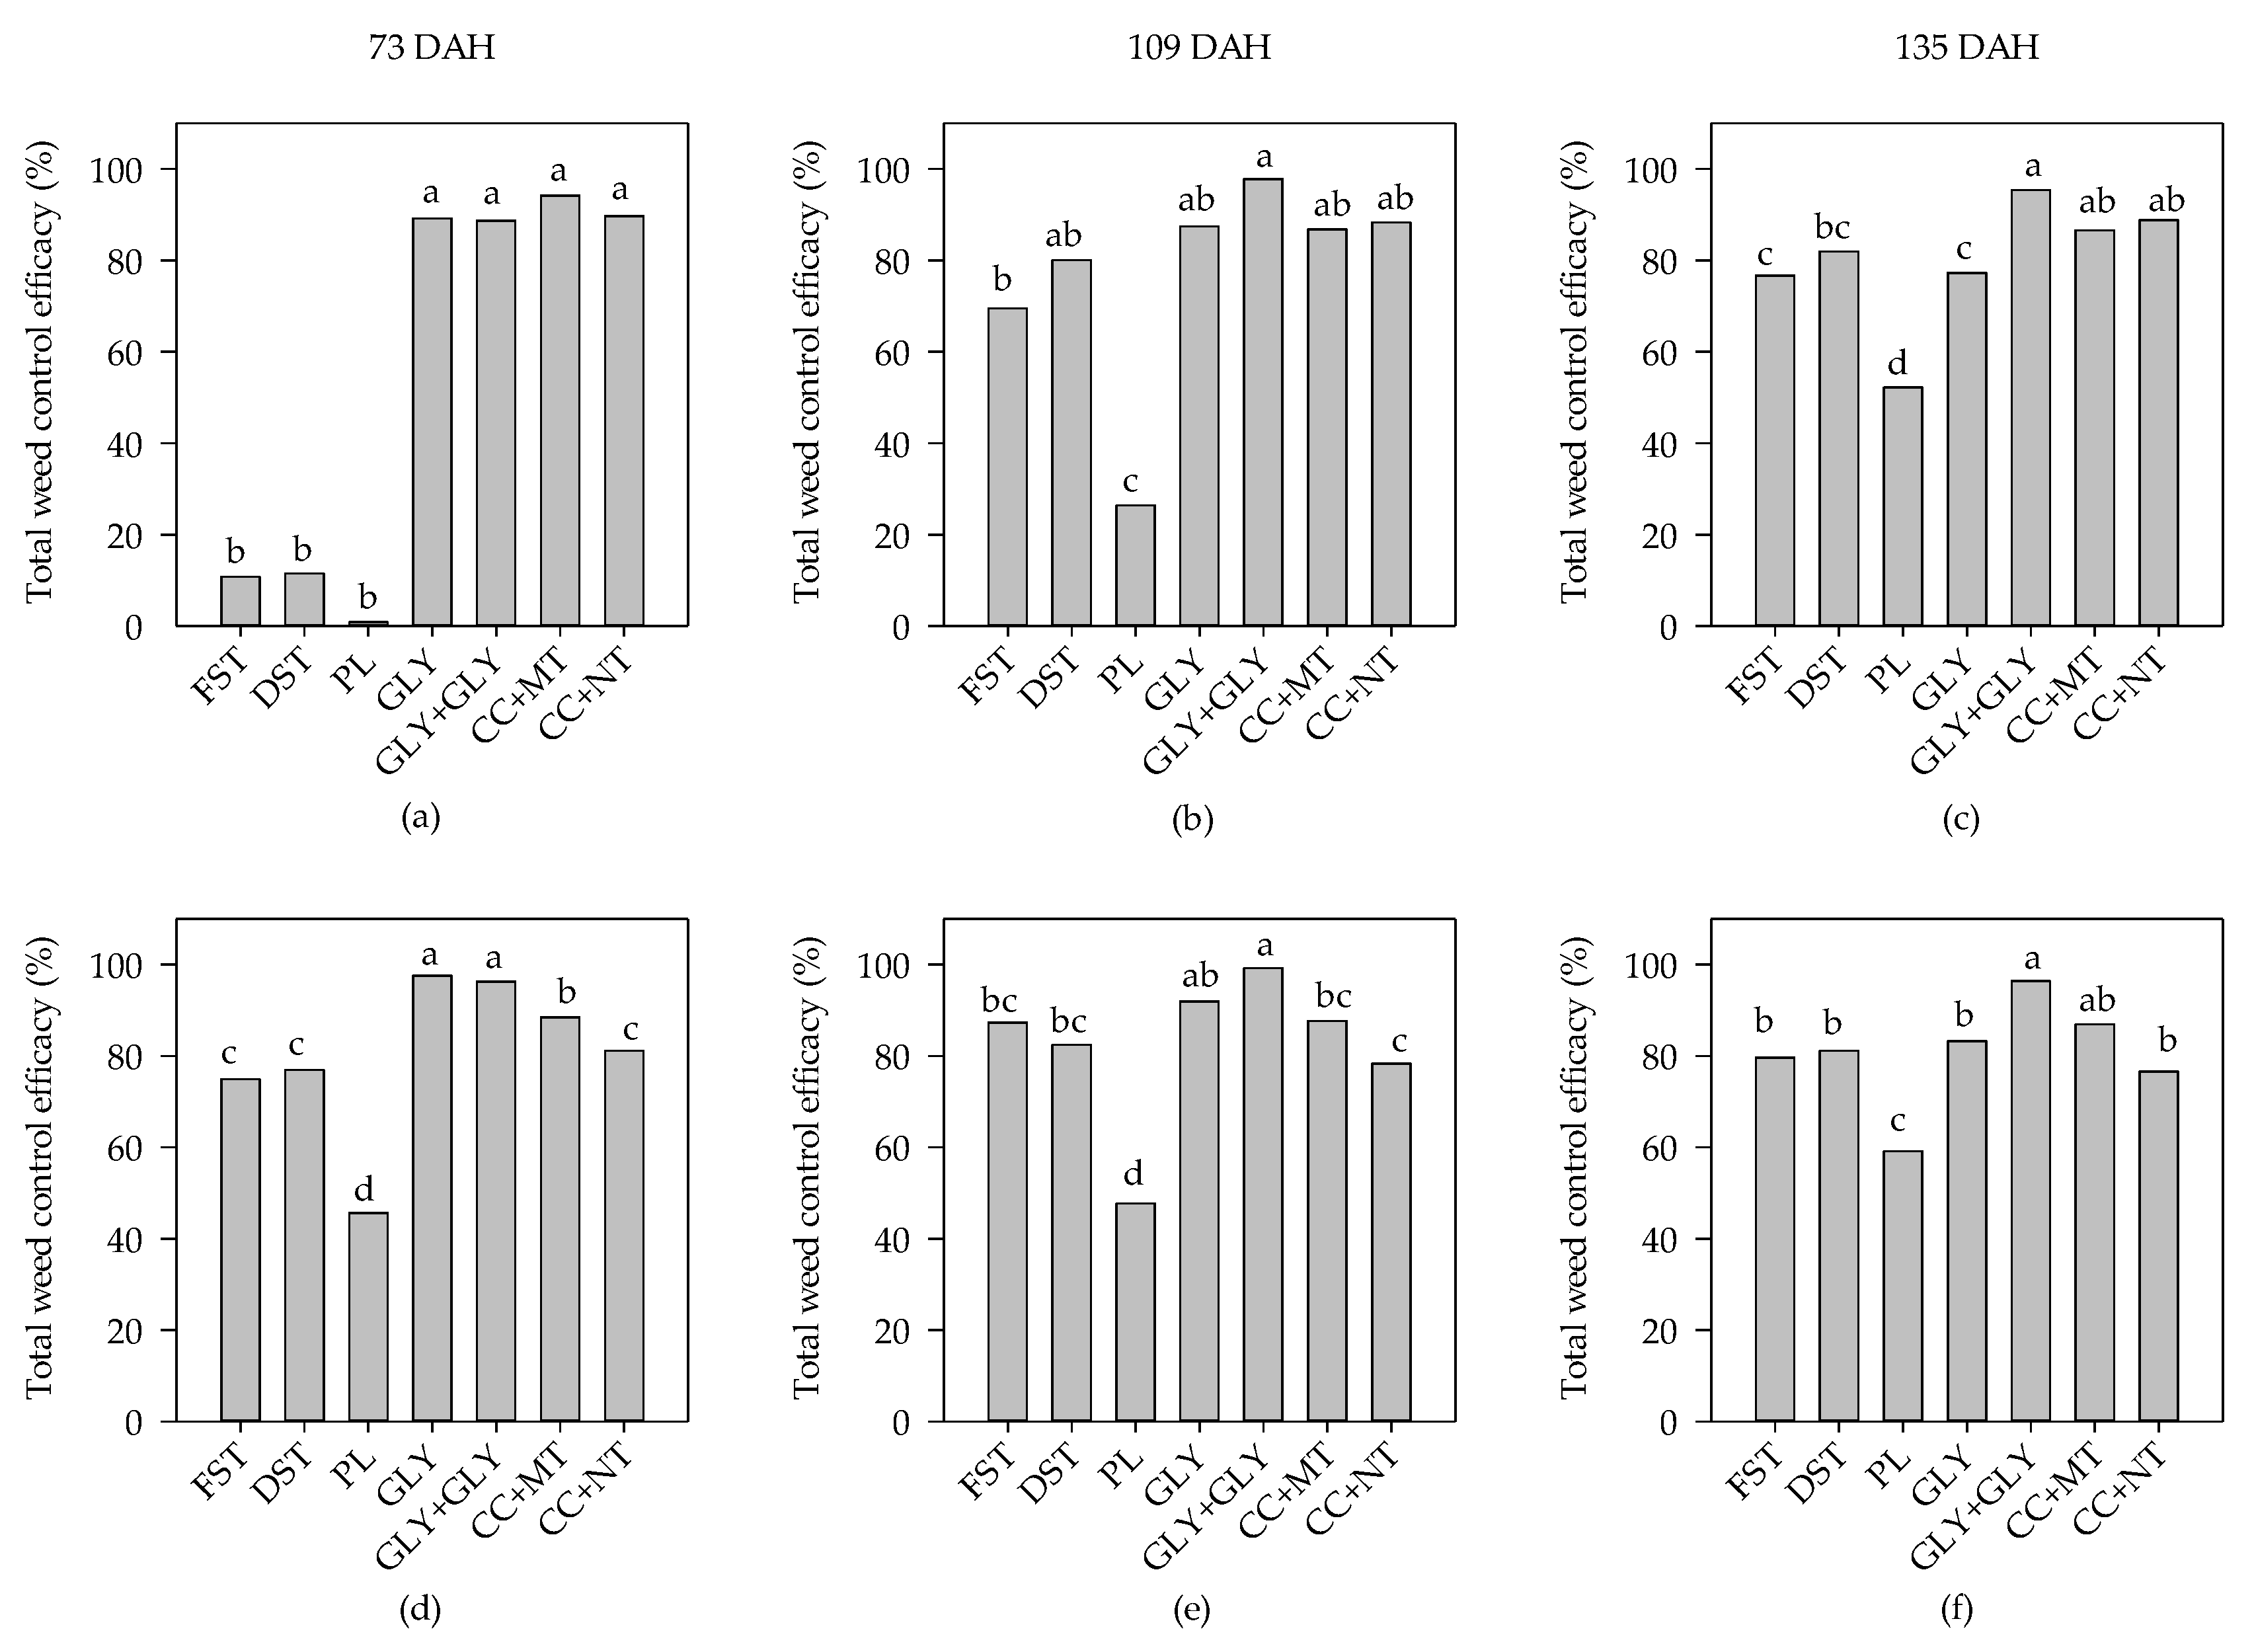
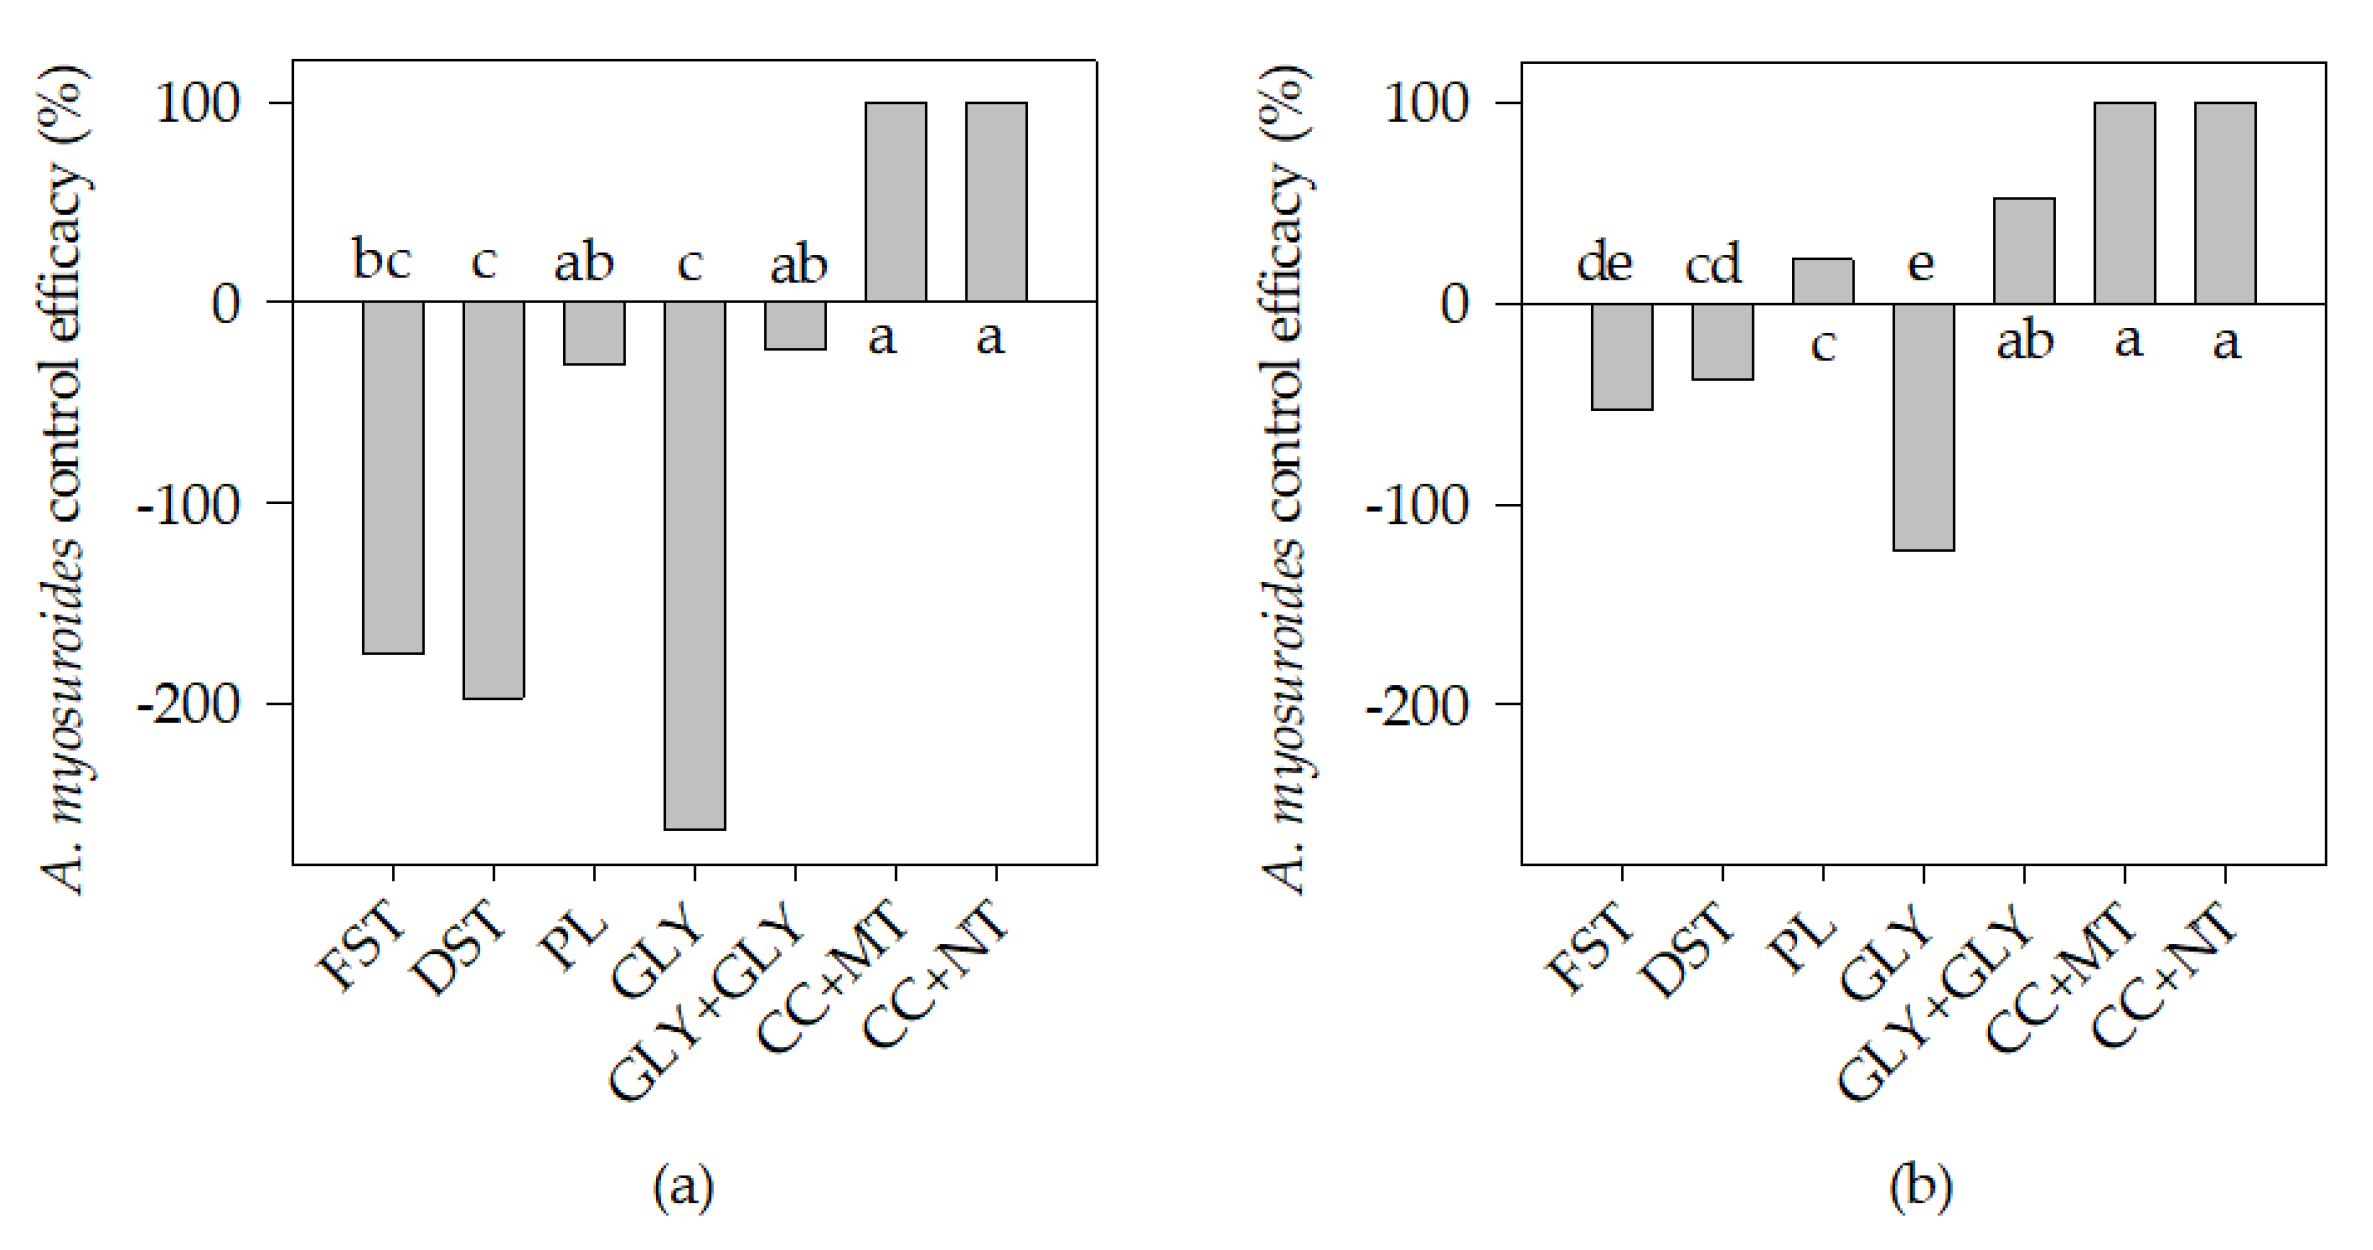
The experiments had shown that both CC treatments (CC+NT and CC+MT) achieved an effective weed control during the crop-free period from August until December. In contrast to Brust et al. [36,37] CCs were also able to suppress volunteer wheat. Especially A. myosuroides, which tend to be the most challenging grass weed, was successfully controlled by CCs, whereas stubble tillage and glyphosate application mostly failed this effect. The CC treatments reached an ACE up to 100% and a WCE up to 94%. The weed suppression potential of CCs has been proven by several studies [30,37,38]. Winter CC cultivation has the potential to shift the use of herbicides towards a postemergence herbicide program [24]. Weed seed germination and establishment is reduced in cover-cropping systems, but the amount of weed seeds in the soil may increase in the upper layer, especially in no-tillage systems. The success of CCs concerning their WCE is site specific and relates to the CC chosen. Further, it depends on the present weed species and the management at the field site [39]. The weather conditions at both field sites, with sufficient amount and distribution of rainfall and the long growing period, were very suitable to achieve a dense canopy and competitive plant stand to suppress weeds. The biomass production of CCs, does not necessarily need to correlate with their weed suppression ability [38,40]. However, biomass-driven CCs are generally more competitive [24,40]. Instead of single CCs species, a species mixture was used within this study. By combining different CC species with specific advantages in CC mixtures, the benefits concerning weed, soil, nutrient, and pest management may increase [41,42].
The continuous loss of herbicides in the EU [30] and the increasing problems with herbicide resistant weeds will raise the awareness of producers to strengthen their focus on non-chemical weed management. The GLY+GLY treatment achieved the significantly highest WCE within this experiment. However, a single glyphosate application (GLY) was not sufficient, in particular, to control A. myosuroides weeds. A. myosuroides plants emerge in several flushes during autumn, when the climate conditions are favorable [10]. Applying glyphosate too early might miss most of the plants. Furthermore, this study demonstrated that at both trials, during autumn and at the end of the growing period, CCs (especially CC+MT) had similar effects on WCE, ACE, and VCE as the chemical treatments. The CC+NT treatment was only showing a slightly weaker WCE and VCE than the CC+MT treatment. Nevertheless, glyphosate is a useful tool within no-till and reduced tillage systems.
The wheat residue management (presence or absence of straw) had a minor effect on the success of either mechanical, chemical, or biological weed control practices. Even though burning the straw on the field is used in some regions and it might result in decreasing weed numbers, it can have some negative side effects especially concerning the carbon gas emissions. The baling of straw is not achieving a decrease of the weed infestation [19], which was also demonstrated within this study.
Within this study, the effects of postharvest weed control on the previous spring crop season were not evaluated, but might deliver interesting insights to see whether the CC treatments preserved weed seeds, instead of reducing the weed seed bank for the repeated stubble tillage treatments (FSL, DST).

5. Conclusions

The flat soil tillage with rotary harrow (FST) and the deep soil tillage with wing share cultivation (DSL) treatments did not show satisfying results concerning WCE and ACE, compared to the chemical and biological methods, but seemed to be a suitable tool for volunteer wheat control. The cover crop (CC) suppression performance for total weed and especially for A. myosuroides showed, that even conservation practices have the potential to minimize future weed control challenges. Their success mainly attributes to their fast and competitive development, which is determined by external factors. In a season with unfavorable growing conditions for CCs, stubble tillage and glyphosate applications might be more efficient weed control practices. Even though the weed suppression ability of CCs is often unpredictable, it is worthwhile to do cover-cropping in terms of soil conservation and biodiversity. The effect of non-chemical weed management in reduced and no-till systems still needs a better understanding for weed dynamics [30]. Long-term experiments will help to show how continuous stubble tillage, herbicide application and cover-cropping will affect the weed density and the weed community and which combinations will enable a sufficient and sustainable weed control.

Author Contributions

A.S. did the statistical analysis and wrote the manuscript. M.S. was responsible for the field experiments and data collection. M.H.M. helped writing the abstract and revised the manuscript. G.G.P. helped analyzing the data and revising the manuscript. R.G. supervised the experiments and revised the manuscript.

Funding

This research received no external funding.

Conflicts of Interest

The authors declare no conflict of interest.

Appendix A

Table A1. Mean number of weed species (averaged over all counting dates) per m2 for the eight treatments (averaged for the treatments with the presence and the absence of straw) at the field sites Binsen and Risp. 1: untreated control; 2: flat soil tillage; 3: deep soil tillage; 4: ploughing; 5: single glyphosate application; 6: dual glyphosate application; 7: cover crop mixture + mulch-till; 8: cover crop mixture + no-till. Alopecurus myosuroides Huds. (A. myosuroides), Veronica persica Poir. (V. Persica), Thalaspi arvense L. (T. arvense), Lamium purpureum L. (L. purpureum), Stellaria media Vill. (S. media), Raphanus raphanistrum L. (R. raphanistrum). Others: Cirsium arvense (L.) Scop., Sonchus arvensis L., Matricaria chamomilla L., Euphorbia helioscopia L., Borago officinalis L.
BinsenRisp
1234567812345678
A. myosuroides72119151362191414914512
Volunteer wheat738664412139161811109314
V. persica6427--631257142-1110
T. arvense2--14-1--5--11----
L. purpureum3425--445461311712
S. media2-1811--4--12--11
R. raphanistrum1113----2-13----
Others31-2----7--5----

References

  1. Norris, R.F.; Kogan, M. Interactions between weeds, arthropod pests, and their natural enemies in managed ecosystems. Weed Sci. 2000, 48, 94–158. [Google Scholar] [CrossRef]
  2. Mantle, P.G.; Shaw, S. Role of ascospore production by Claviceps purpurea in aetiology of ergot disease in male sterile wheat. Trans. Br. Mycol. Soc. 1976, 67, 17–22. [Google Scholar] [CrossRef]
  3. Moss, S. Black-grass (Alopecurus myosuroides): Why has this Weed become such a Problem in Western Europe and what are the Solutions? Outlooks Pest Manag. 2017, 28, 207–212. [Google Scholar] [CrossRef]
  4. Powles, S.B.; Yu, Q. Evolution in action: Plants resistant to herbicides. Annu. Rev. Plant Biol. 2010, 61, 317–347. [Google Scholar] [CrossRef] [PubMed]
  5. Heap, I. The International Survey of Herbicide Resistant Weeds. Available online: www.weedscience.org (accessed on 7 September 2018).
  6. Davies, L.R.; Neve, P. Interpopulation variability and adaptive potential for reduced glyphosate sensitivity in Alopecurus myosuroides. Weed Res. 2017, 57, 323–332. [Google Scholar] [CrossRef] [PubMed]
  7. Pekrun, C.; Claupein, W. The implication of stubble tillage for weed population dynamics in organic farming. Weed Res. 2006, 46, 414–423. [Google Scholar] [CrossRef]
  8. Melander, B.; Liebman, M.; Davis, A.S.; Gallandt, E.R.; Bàrberi, P.; Moon, A.; Rasmussen, J.; van der Weide, R.; Vidotto, F. Non-chemical weed management. In Weed Research: Expanding Horizons, 1st ed.; Hatcher, P.E., Froud-Williams, R.J., Eds.; John Wiley & Sons: Hoboken, NJ, USA, 2017; pp. 245–270. [Google Scholar]
  9. Wrucke, M.A.; Arnold, W.E. Weed species distribution as influenced by tillage and herbicides. Weed Sci. 1985, 33, 853–856. [Google Scholar] [CrossRef]
  10. Colbach, N.; Dürr, C.; Roger-Estrade, J.; Chauvel, B.; Caneill, J. AlomySys: Modelling black-grass (Alopecurus myosuroides Huds.) germination and emergence, in interaction with seed characteristics, tillage and soil climate: I. Construction. Eur. J. Agron. 2006, 24, 95–112. [Google Scholar] [CrossRef]
  11. Hernanz, J.L.; López, R.; Navarrete, L.; Sanchez-Giron, V. Long-term effects of tillage systems and rotations on soil structural stability and organic carbon stratification in semiarid central Spain. Soil Tillage Res. 2002, 66, 129–141. [Google Scholar] [CrossRef]
  12. De Vita, P.; Di Paolo, E.; Fecondo, G.; Di Fonzo, N.; Pisante, M. No-tillage and conventional tillage effects on durum wheat yield, grain quality and soil moisture content in southern Italy. Soil Tillage Res. 2007, 92, 69–78. [Google Scholar] [CrossRef]
  13. Snapp, S.S.; Swinton, S.M.; Labarta, R.; Mutch, D.; Black, J.R.; Leep, R.; Nyiraneza, J.; O’neil, K. Evaluating cover crops for benefits, costs and performance within cropping system niches. Agron. J. 2005, 97, 322–332. [Google Scholar]
  14. Langdale, G.W.; Blevins, R.L.; Karlen, D.L.; McCool, D.K.; Nearing, M.A.; Skidmore, E.L.; Thomas, A.W.; Tyler, D.D.; Williams, J.R. Cover crop effects on soil erosion by wind and water. In Cover Crops for Clean Water; Soil and Water Conservation Society: Ankeny, IA, USA, 1991; pp. 15–22. [Google Scholar]
  15. Wortman, S.E.; Francis, C.A.; Bernards, M.L.; Drijber, R.A.; Lindquist, J.L. Optimizing cover crop benefits with diverse mixtures and an alternative termination method. Agron. J. 2012, 104, 1425–1435. [Google Scholar] [CrossRef]
  16. Hartwig, N.L.; Ammon, H.U. Cover crops and living mulches. Weed Sci. 2002, 50, 688–699. [Google Scholar] [CrossRef]
  17. Blubaugh, C.K.; Hagler, J.R.; Machtley, S.A.; Kaplan, I. Cover crops increase foraging activity of omnivorous predators in seed patches and facilitate weed biological control. Agric. Ecosyst. Environ. 2016, 231, 264–270. [Google Scholar] [CrossRef]
  18. Petit, S.; Trichard, A.; Biju-Duval, L.; McLaughlin, Ó.B.; Bohan, D.A. Interactions between conservation agricultural practice and landscape composition promote weed seed predation by invertebrates. Agric. Ecosyst. Environ. 2017, 240, 45–53. [Google Scholar] [CrossRef]
  19. Moss, S.R. The influence of tillage and method of straw disposal on the survival and growth of black-grass, Alopecurus myosuroides, and its control by chlortoluron and isoproturon. Ann. Appl. Biol. 1979, 91, 91–100. [Google Scholar] [CrossRef]
  20. Bilalis, D.; Sidiras, N.; Economou, G.; Vakali, C. Effect of different levels of wheat straw soil surface coverage on weed flora in Vicia faba crops. J. Agron. Crop Sci. 2003, 189, 233–241. [Google Scholar] [CrossRef]
  21. Dao, T.H. Field decay of wheat straw and its effects on metribuzin and S-ethyl metribuzin sorption and elution from crop residues. J. Environ. Qual. 1991, 20, 203–208. [Google Scholar] [CrossRef]
  22. Kahnt, G. Gründüngung; Verlagsunion Agrar: Frankfurt, Germany, 1983; p. 146. [Google Scholar]
  23. Froud-Williams, R.J.; Chancellor, R.J.; Drennan, D.S.H. The Effects of Seed Burial and Soil Disturbance on Emergence and Survival of Arable Weeds in Relation to Minimal Cultivation. J. Appl. Ecol. 1984, 21, 629–641. [Google Scholar] [CrossRef]
  24. Teasdale, J.R. Contribution of cover crops to weed management in sustainable agricultural systems. J. Prod. Agric. 1996, 9, 475–479. [Google Scholar] [CrossRef]
  25. Clemens, R.O.; Martyn, T.M.; Donaldson, G.; Wolfe, M. Clover: Cereal bi-cropping for organic farms.: Farming systems for the new Millennium. Asp. Appl. Biol. 2000, 62, 181–185. [Google Scholar]
  26. Gruber, S.; Pekrun, C.; Möhring, J.; Claupein, W. Long-term yield and weed response to conservation and stubble tillage in SW Germany. Soil Tillage Res. 2012, 121, 49–56. [Google Scholar] [CrossRef]
  27. Deutsche Saatveredelung AG. TerraLife®—VitaMaxx TR. Available online: https://www.dsv-saaten.de/zwischenfruechte/terralife/mischungen/vitamaxx-tr.html (accessed on 14 September 2018).
  28. Rasmussen, J. A model for prediction of yield response in weed harrowing. Weed Res. 1991, 31, 401–408. [Google Scholar] [CrossRef]
  29. Machleb, J.; Kollenda, B.L.; Peteinatos, G.G.; Gerhards, R. Adjustment of Weed Hoeing to Narrowly Spaced Cereals. Agriculture 2018, 8, 54. [Google Scholar] [CrossRef]
  30. Melander, B.; Munier-Jolain, N.; Charles, R.; Wirth, J.; Schwarz, J.; van der Weide, R.; Bonin, L.; Jensen, P.K.; Kudsk, P. European perspectives on the adoption of nonchemical weed management in reduced-tillage systems for arable crops. Weed Technol. 2013, 27, 231–240. [Google Scholar] [CrossRef]
  31. Boström, U. Type and time of autumn tillage with and without herbicides at reduced rates in southern Sweden: 1. Yields and weed quantity. Soil Tillage Res. 1999, 50, 271–281. [Google Scholar] [CrossRef]
  32. Cirujeda, A.; Taberner, A. Relating weed size, crop soil cover and soil moisture with weed harrowing efficacy on Papaver rhoeas and other dicotyledoneous weeds in Mediterranean conditions. Biol. Agric. Hortic. 2006, 24, 181–195. [Google Scholar] [CrossRef]
  33. Melander, B.; Holst, N.; Rasmussen, I.A.; Hansen, P.K. Direct control of perennial weeds between crops–Implications for organic farming. Crop Protect. 2012, 40, 36–42. [Google Scholar] [CrossRef]
  34. Gruber, S.; Claupein, W. Effect of tillage intensity on weed infestation in organic farming. Soil Tillage Res. 2009, 105, 104–111. [Google Scholar] [CrossRef]
  35. Westerman, P.R.; Hofman, A.; Vet, L.E.M.; van der Werf, W. Relative importance of vertebrates and invertebrates in epigeaic weed seed predation in organic cereal fields. Agric. Ecosyst. Environ. 2003, 95, 417–425. [Google Scholar] [CrossRef]
  36. Brust, J.; Gerhards, R.; Karanisa, T.; Ruff, L.; Kipp, A. Why undersown and cover crops become important again for weed suppression in european cropping systems. Gesunde Pflanz. 2011, 63, 191–198. [Google Scholar] [CrossRef]
  37. Brust, J.; Claupein, W.; Gerhards, R. Growth and weed suppression ability of common and new cover crops in Germany. Crop Protect. 2014, 63, 1–8. [Google Scholar] [CrossRef]
  38. Kunz, C.; Sturm, D.J.; Varnholt, D.; Walker, F.; Gerhards, R. Allelopathic effects and weed suppressive ability of cover crops. Plant Soil Environ. 2016, 62, 60–66. [Google Scholar] [Green Version]
  39. Bàrberi, P. Weed management in organic agriculture: Are we addressing the right issues? Weed Res. 2002, 42, 177–193. [Google Scholar] [CrossRef]
  40. Finney, D.M.; White, C.M.; Kaye, J.P. Biomass production and carbon/nitrogen ratio influence ecosystem services from cover crop mixtures. Agron. J. 2016, 108, 39–52. [Google Scholar] [CrossRef]
  41. Bàrberi, P.; Mazzoncini, M. Changes in weed community composition as influenced by cover crop and management system in continuous corn. Weed Sci. 2001, 49, 491–499. [Google Scholar] [CrossRef]
  42. Malézieux, E.; Crozat, Y.; Dupraz, C.; Laurans, M.; Makowski, D.; Ozier-Lafontaine, H.; Rapidel, B.; de Tourdonnet, S.; Valantin-Morison, M. Mixing plant species in cropping systems: Concepts, tools and models: A review. In Sustainable agriculture; Springer: Berlin, Germany, 2009; pp. 329–353. [Google Scholar]
Figure 1. Average total weed control efficacy of the treatments flat soil tillage (FST), deep soil tillage (DST), ploughing (PL), single glyphosate application (GLY), dual glyphosate application (GLY+GLY), cover crop mixture + mulch-till (CC+MT), and cover crop mixture + no-till (CC+NT) at the two trials at the fields (ac) Binsen and (df) Risp. (a,d) 73, (b,e) 109, and (c,f) 135 days after harvest (DAH). Different small letters within one graph show significant differences according to Tukey–HSD test (p ≤ 0.05). Means with identical letters do not differ significantly.
Agriculture 08 00144 g001
Figure 2. Average Alopecurus myosuroides Huds. (A. myosuroides) control efficacy of flat soil tillage (FST), deep soil tillage (DST), ploughing (PL), single glyphosate application (GLY), dual glyphosate application (GLY+GLY), cover crop mixture + mulch-till (CC+MT) and cover crop mixture + no-till (CC+NT) treatments at the fields (a) Binsen and (b) Risp 135 days after harvest. Different small letters within one graph show significant differences according to the Tukey-HSD test (p ≤ 0.05). Means with identical letters do not differ significantly.
Agriculture 08 00144 g002
Figure 3. Average volunteer wheat control efficacy of flat soil tillage (FST), deep soil tillage (DST), ploughing (PL), single glyphosate application (GLY), dual glyphosate application (GLY+GLY), cover crop mixture + mulch-till (CC+MT), and cover crop mixture + no-till (CC+NT) treatments at the two trials at the fields (ac) Binsen and (df) Risp. (a,d) 73, (b,e) 109, and (c,f) 135 days after harvest (DAH). Different small letters within one graph show significant differences according to the Tukey–HSD test (p ≤ 0.05). Means with identical letters do not differ significantly.
Agriculture 08 00144 g003
Table 1. Monthly minimum (Min.), maximum (Max.), average temperature (T) and precipitation in Southwestern Germany from July until December 2017.
Min. T (°C)Max. T (°C)Average T (°C)Precipitation (mm)
July12.624.918.5119.5
August12.224.618.388.2
September7.017.912.035.3
October4.715.89.740.1
November0.76.83.676.0
December−1.33.61.255.9
Table 2. Weed management treatments, weed control type and treatment dates for the experimental field sites at Binsen and Risp. Weed management dates include dates for tillage, herbicide applications, and sowing dates for the cover crop mixtures. (DAH = Days after harvest).
Treatment 1Weed Management Practices (depth in cm/dose in L ha−1/seed density kg ha−1)Weed Control TypeWeed Management (Date)Weed Management (DAH)
1ControlWeed fallow without weed management---
2FSTFlat soil tillage with rotary harrow (5 cm)mechanical8 August8
6 September37
14 October75
3DSTDeep soil tillage with wing share cultivator (15–16 cm)mechanical8 August8
6 September37
15 October76
4PLTurning soil tillage with a plough (25 cm)mechanical14 August14
5GLYSingle glyphosate treatment (4 L ha−1)chemical6 September37
6GLY+GLYDual glyphosate treatment (4 L ha−1)chemical6 September37
4 October75
7CC+MTCover crop mixture + mulch-till (1–1.5 cm, 25 kg ha−1)biological19 August19
8CC+NTCover crop mixture + no-till (1–1.5 cm, 25 kg ha−1)biological7 August7
1 Flat soil tillage (FST), deep soil tillage (DST), ploughing (PL), single glyphosate application (GLY), dual glyphosate application (GLY+GLY), cover crop mixture + mulch-till (CC+MT) and cover crop mixture + no-till (CC+NT).
Table 3. Average Alopecurus myosuroides Huds. control efficacy of flat soil tillage (FST), deep soil tillage (DST), ploughing (PL), single glyphosate application (GLY), dual glyphosate application (GLY+GLY), cover crop mixture + mulch-till (CC+MT) and cover crop mixture + no-till (CC+NT) treatments in combination with the presence (+) or absence (−) of straw 73 days after harvest (DAH) at the two trials at the fields Binsen and Risp. Different small letters within one column show significant differences according to Tukey–HSD test (p ≤ 0.05). Means with identical letters do not differ significantly. Different capital letters show significant differences within one experiment and within one treatment according to the presence or absence of straw. Means with no capital letter do not differ according to the Tukey–HSD test (p ≤ 0.05).
Treatment73 DAH
BinsenRisp
− Straw+ Straw− Straw+ Straw
FST−603.5 cB−244.5 bA−279.0 d−299.0 cd
DST−860.6 dB−337.7 bA−114.0 bcd−500.4 d
PL−356.4 b−230.4 b−198.1 cd−185.9 bcd
GLY−33.0 a45.2 a28.1 ab24.8 ab
GLY+GLY−31.6 a33.3 a6.7 abc−45.5 abc
CC+MT100.0 a100.0 a100.0 a97.4 a
CC+NT100.0 a95.8 a91.7 a94.1 a
Table 4. Average Alopecurus myosuroides Huds. control efficacy of flat soil tillage (FST), deep soil tillage (DST), ploughing (PL), single glyphosate application (GLY), dual glyphosate application (GLY+GLY), cover crop mixture + mulch-till (CC+MT), and cover crop mixture + no-till (CC+NT) treatments in combination with the presence (+) or absence (−) of straw 109 days after harvest (DAH) for the two trials at the fields Binsen and Risp. Different small letters within one column show significant differences according to Tukey–HSD test (p ≤ 0.05). Means with identical letters do not differ significantly. Different capital letters show significant differences within one experiment and within one treatment according to the presence or absence of straw. Means with no capital letter do not differ according to Tukey–HSD test.
109 DAH
BinsenRisp
− Straw+ Straw− Straw+ Straw
FST−19.0 a−6.7 a47.4 abc21.5 bc
DST−1.4 a−3.4 a13.3 bcA−40.7 cB
PL−160.2 b−182.5 b−14.1 c−44.1 c
GLY−13.0 a−4.2 a−119.8 dB−46.3 cA
GLY+GLY75.5 a60.0 a80.8 ab64.4 ab
CC+MT100.0 a96.7 a100.0 a100.0 a
CC+NT94.4 a100.0 a96.7 a96.7 ab
Table 5. The fresh cover crop biomass (t ha−1) 8 (CC+NT) and 9 (CC+MT) weeks after sowing for the trials at the fields Binsen and Risp. CC+MT = cover crop mixture + mulch-till. CC+NT = cover crop mixture + no-till. − straw = straw removal after harvest. + straw = no straw removal from the previous crop. n.s. = means do not differ significantly within one experiment based on the Tukey–HSD test (p ≤ 0.05).
TreatmentsFresh Cover Crop Biomass
BinsenRisp
CC+MT− straw32.0 n.s.28.2 n.s.
+ straw26.9 n.s.30.5 n.s.
CC+NT− straw33.1 n.s.29.0 n.s.
+ straw25.9 n.s.27.3 n.s.

