1. Introduction
In the last few years, many models of farm management information systems (FMIS) have been investigated [
1,
2,
3]. These models generally design a hardware and software layout that should improve the sharing of data and the availability of software functionalities [
4,
5,
6]. Often, they include a decision support system (DSS) [
7,
8] even though these support systems can be frequently used with independent FMIS [
9]. In some cases, following a holistic approach, these models have become more complex and conceptual [
10]. They are called farm software environments (FSE) and they have the scope to make farm informative systems more collaborative, linkable, interoperable and scalable [
11], taking as an example what happened in the information and communication technology (ICT) sector with the development of heterogenic projects related to specific operating systems (OS), software applications, market places, mobile and smart devices, customers retention, etc. [
12]. However, after their development, these models have been tested in specific contexts [
13]. Therefore, it is difficult to know if one of these models will become a real tool able to reach a critical mass that could attract software houses and affect the development of new products [
14].
A different approach to follow in order to reach a possible improvement of FMIS could be the study of farm workflows. In a workflow, it is possible to define: the sequence of activities (and transactions) that must be performed; the actors responsible for specific activities; data that have to be sent, received and shared (between actors and/or workflows); and the format to use for the messaging. Through the standardization of farm workflows, as done in other scientific sectors [
15,
16], interesting progress in the development of FMIS could be achieved because better data sharing and integration of software applications could be possible [
17,
18]. Furthermore, farm workflows could be investigated using a business process management (BPM) approach [
19]. This paradigm is focused on the evaluation of different aspects, of a business organization, in order to promote process effectiveness and efficiency [
20]. It can help to standardize and improve the business processes; follow the market and environmental changes; and carry out processes reengineering and/or cost reductions [
21]. The application of a BPM approach is the basis of making a business organization computerized because it allows separating the logical layer from the technical implementation (i.e., the process modeling and the software application development [
20,
22]). Furthermore, it is intrinsically oriented to a design for services [
19]. Therefore, it could be a useful method for the rapid development, and collaborative integration, of FMIS (in accordance with the scopes of the FSE models [
11]) also considering the recent availability of software tools for the implementation of BPM schemas.
As a first evaluation of this paradigm from a practical point of view, an experimental FMIS was developed considering a “use-case” studied in a previous project [
23]. The scope of the past project was to develop a hardware and software solution for the traceability of milk produced by farm members of the Fontina Cheese Producers’ Consortium. They were, in general, farms of small sizes with milking systems of a low technological level. In the project, a portable milking machine was equipped with a radio frequency identification (RFID) antenna and an electronic milking unit able to evaluate, on line and for each teat, the electrical conductivity of milk [
24]. The RFID antenna was connected to a Palm device (Palm Inc., Sunnyvale, CA, USA) where a customized plug-in was able to record: the cow ID, the milking can ID and the “teat-alarm” scores. A database application, developed in Access (Microsoft, Redmond, WA, USA), completed the technical solution in order to store milking and farming data. Through that software application, and the queries that were implemented inside it, a basic traceability between the farm supplies and the farm outputs (i.e., the milking cans), was reached. Nevertheless, some limits were observed. The technology used to implement the software application was imposed to develop a “stand-alone” solution. Data were accessible only by a unique PC and could not be shared outside the farm with a third party, like the cheese factories. No kind of role was defined and no farm workflow was implemented. As a result, real improvements in the management of the whole farm, and production cycle, were not reached. In this scenario, an organization of farm activities as workflows, and the use of a service oriented technology, could allow better results. For this reason, this use-case was considered a good candidate in order to evaluate, under a practical point of view, if a BPM approach could be a valid method for the development of a real FMIS. On the basis of our knowledge, no similar studies have ever been performed.
2. Background and Design Considerations
2.1. The O3-Farm Project
What is presented in this paper was a first step in the development of a more extensive project. Its general scope is to investigate new software technologies, and design approaches, in order to promote the development of software applications for farm management. The primary objectives of the project are: an improvement of data sharing, an improvement of data elaboration and an increased interoperability of software applications to be reached through a possible standardization of data structures, of communication and collaboration protocols, and of paradigms for the development of software applications, procedures and workflows.
2.2. The Business Process Management (BPM) Paradigm
Business process management allows users to define, implement, and control, business processes. Its main scope is to improve the efficiency of each process in order to reach a global increase in the effectiveness of the whole business organization.
The BPM adopts a standard notation for the description of a business process, called business process management notation (BPMN). It allows users to describe a process with a graphical schema, called a “diagram”. Each diagram, generally includes:
A “Pool” where the workflow is performed; where all diagram elements must be positioned; and where the actors that are involved in the process are defined.
A “Swim lane”: when two or more lanes are defined in a pool, each lane includes a subset of activities, of the workflow that has a specific role in the process.
“Events”: an event is shown in a diagram like a circle. It is something that can happen when a process is in execution (i.e., a “case” is performed). It is usually activated by a trigger, such as a signal, a message, a timer, an error, etc.; and it has a result that generally affects the workflow. For example, an event can start a process, modify the sequence of activities in a process, conclude a process, etc. Furthermore, an event can be classified as “catching” (if it catches an incoming trigger), “throwing” (if it creates a result and/or a trigger) or “non-interrupting” (if it has a result that does not affect the workflow).
“Tasks”: a task is shown in a diagram like a rounded-corner rectangle. It is an activity to perform in a workflow that cannot be spilt to a lower level. Different types of task can be used in a diagram, such as: a “human task” (when an action is expected by a human subject); a “service task” (when something, typically a data elaboration, is required to a system); and a “send or receive task” (when a message has to be sent or received from another pool). Furthermore, a task can be repeated many times as a standard loop or as a parallel/sequential multi-instantiation.
“Activities”: an activity is also shown in a diagram like a rounded-corner rectangle. It is a part of a workflow that has to be carried out. It can be “atomic” (when it is a task) or “compound” (when it is a sub-process, a transaction, etc.).
“Gateways”: a gateway is shown in a diagram like a rhombus. It is an element of a diagram that can control the path of the workflow. A gateway can be: “exclusive” (when it creates alternatives flows in a diagram); “inclusive” (when it allows alternative flows in a diagram that are all evaluated); and “parallel” (when it creates parallel flows without any evaluation of a specific condition).
“Flows”: a flow is shown in a diagram like an arrow. It is used to connect two elements of a diagram. It can be a “sequence flow” (when it shows the execution order of the diagram activities); a “message flow” (when it highlights a messaging flow between two pools); or an “association” (when it connects a part of a diagram that is linked to an artifact, such as a text annotation, etc.).
Finally, other information can be considered as a part of a diagram or business process. For example: its name and its version can be useful to identify a change when a process that is already active in the business organization must be updated.
3. System Description
3.1. O3-Farm Main Features
The O3-Farm is a “web oriented” software application. It is accessible via the internet, using a common browser and the HyperText Transfer Protocol (HTTP). Its graphical theme is “responsive” to allow its use with any kind of internet device (PC, tablet, smart phone, etc.).
Data entry is shared between different groups of users and organized in business processes (i.e., farm workflows) in order to: assign each task to a specific group of users; perform in different times a process that involves more than one user; and allow the execution of more processes, or more instances of the same process, in a concurrent way.
The groups of users of the O3-Farm application describe the structure of a possible farm organization. For each of them, roles and responsibilities are well defined and are mapped in the farm workflows where the groups are involved.
3.2. O3-Farm Functional Description
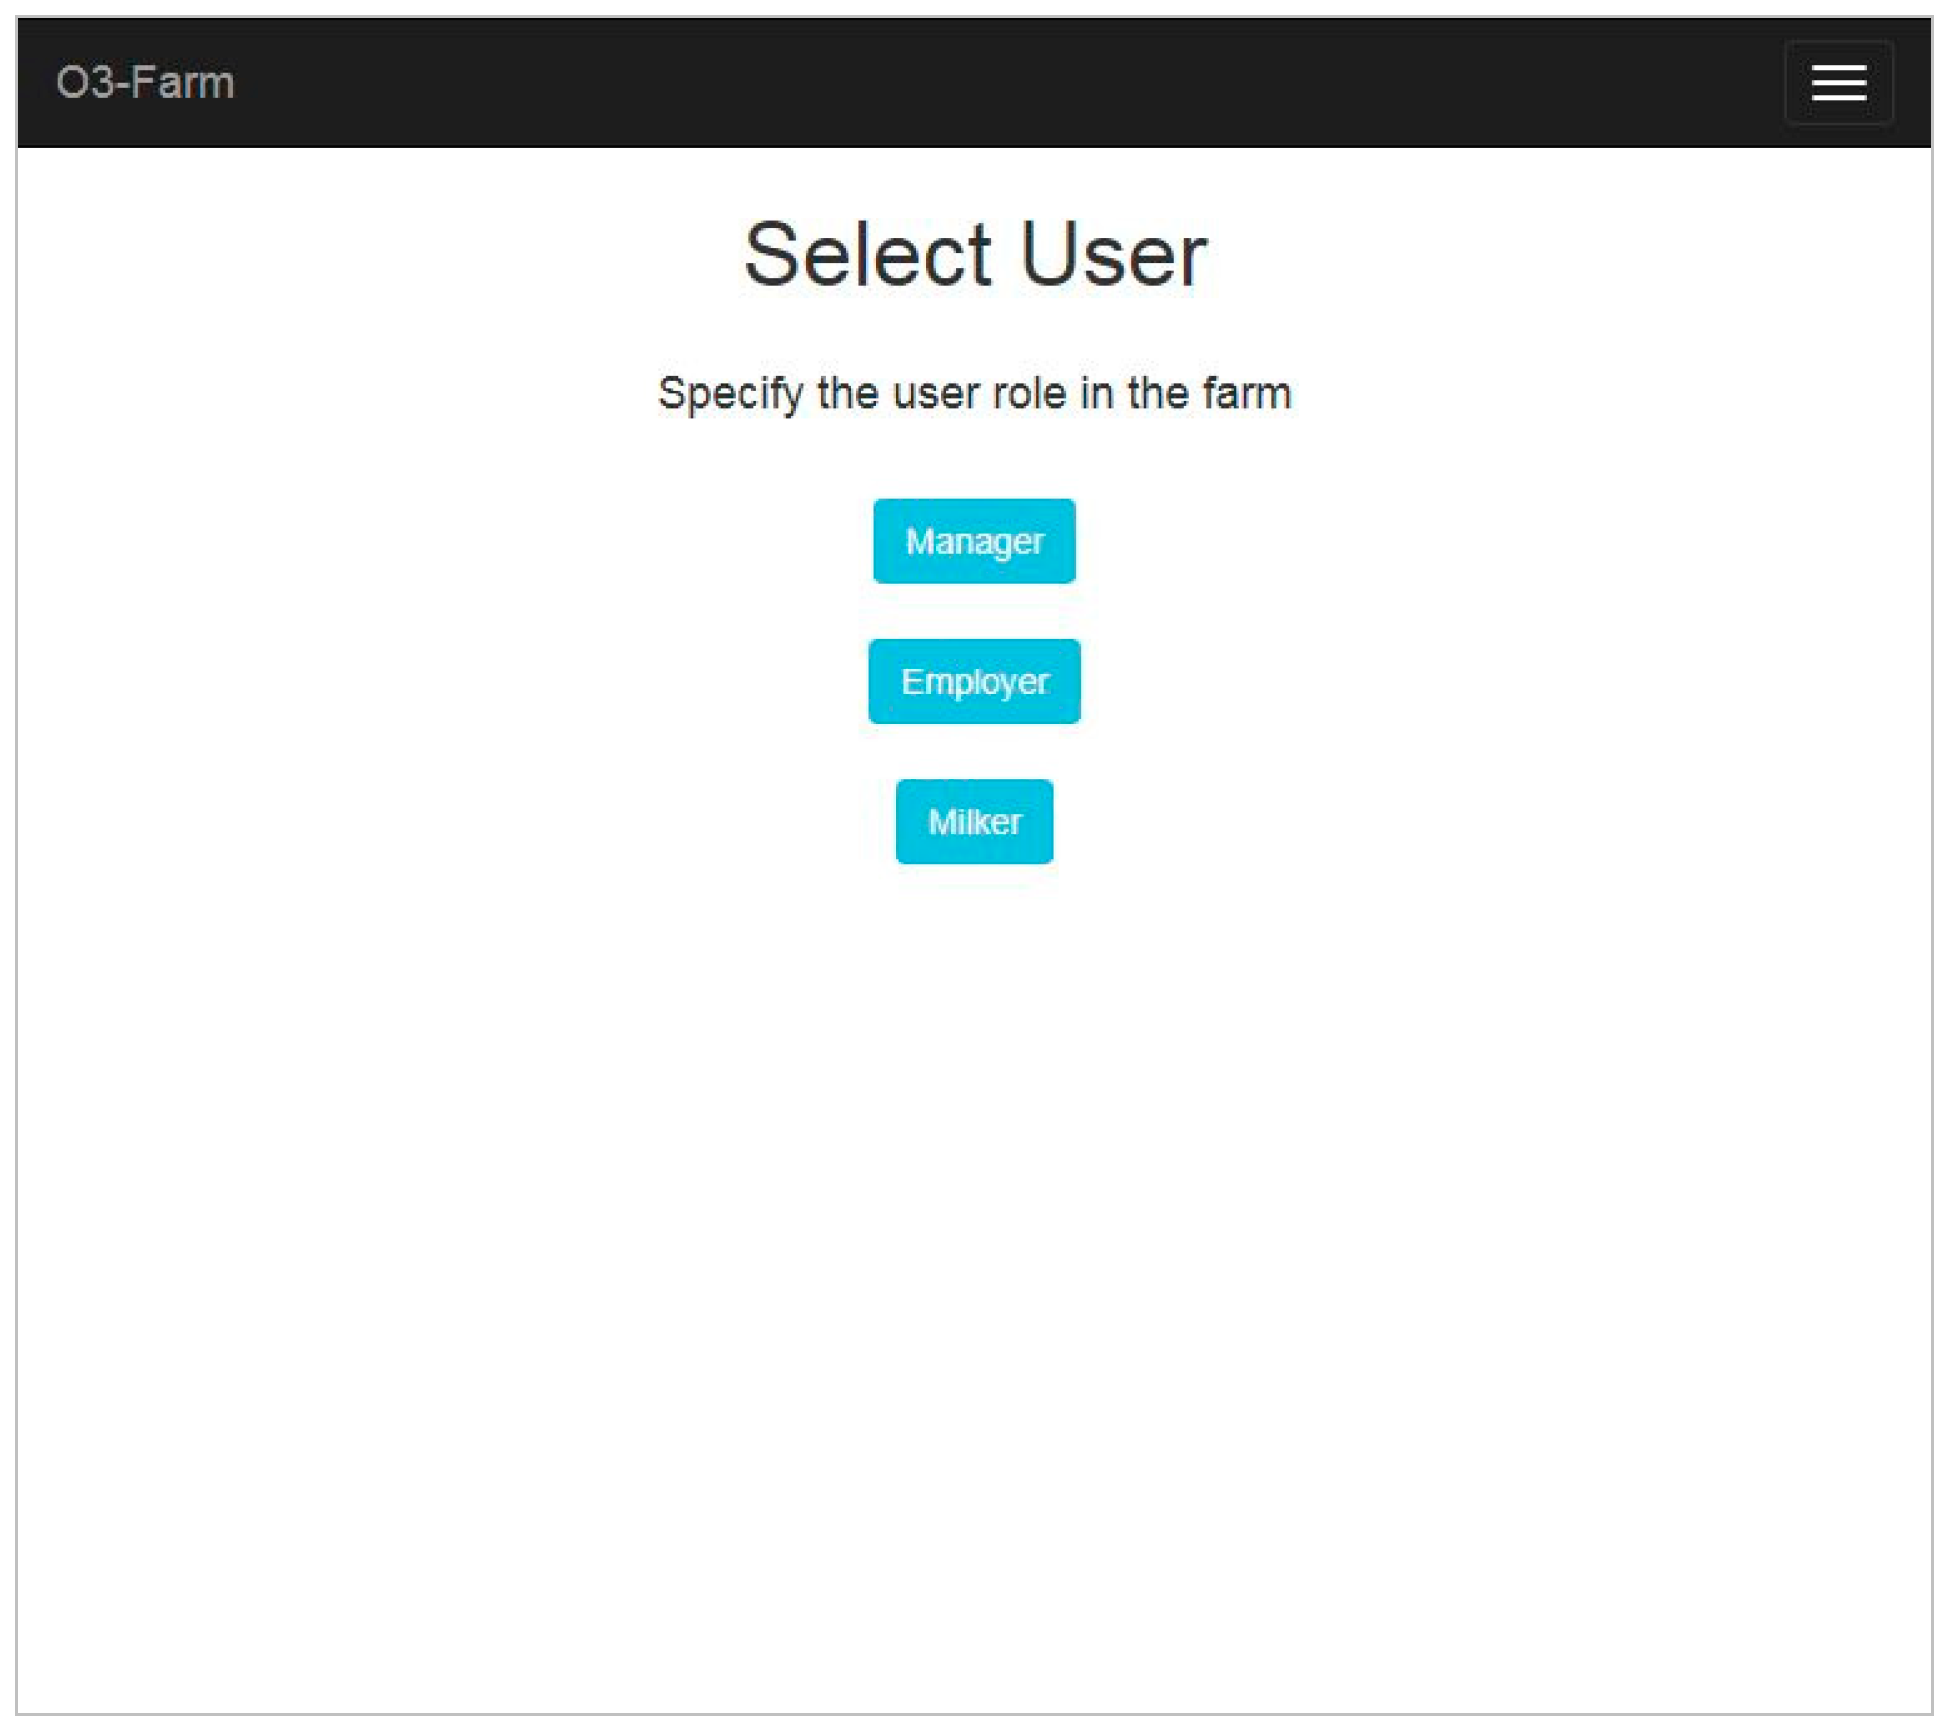
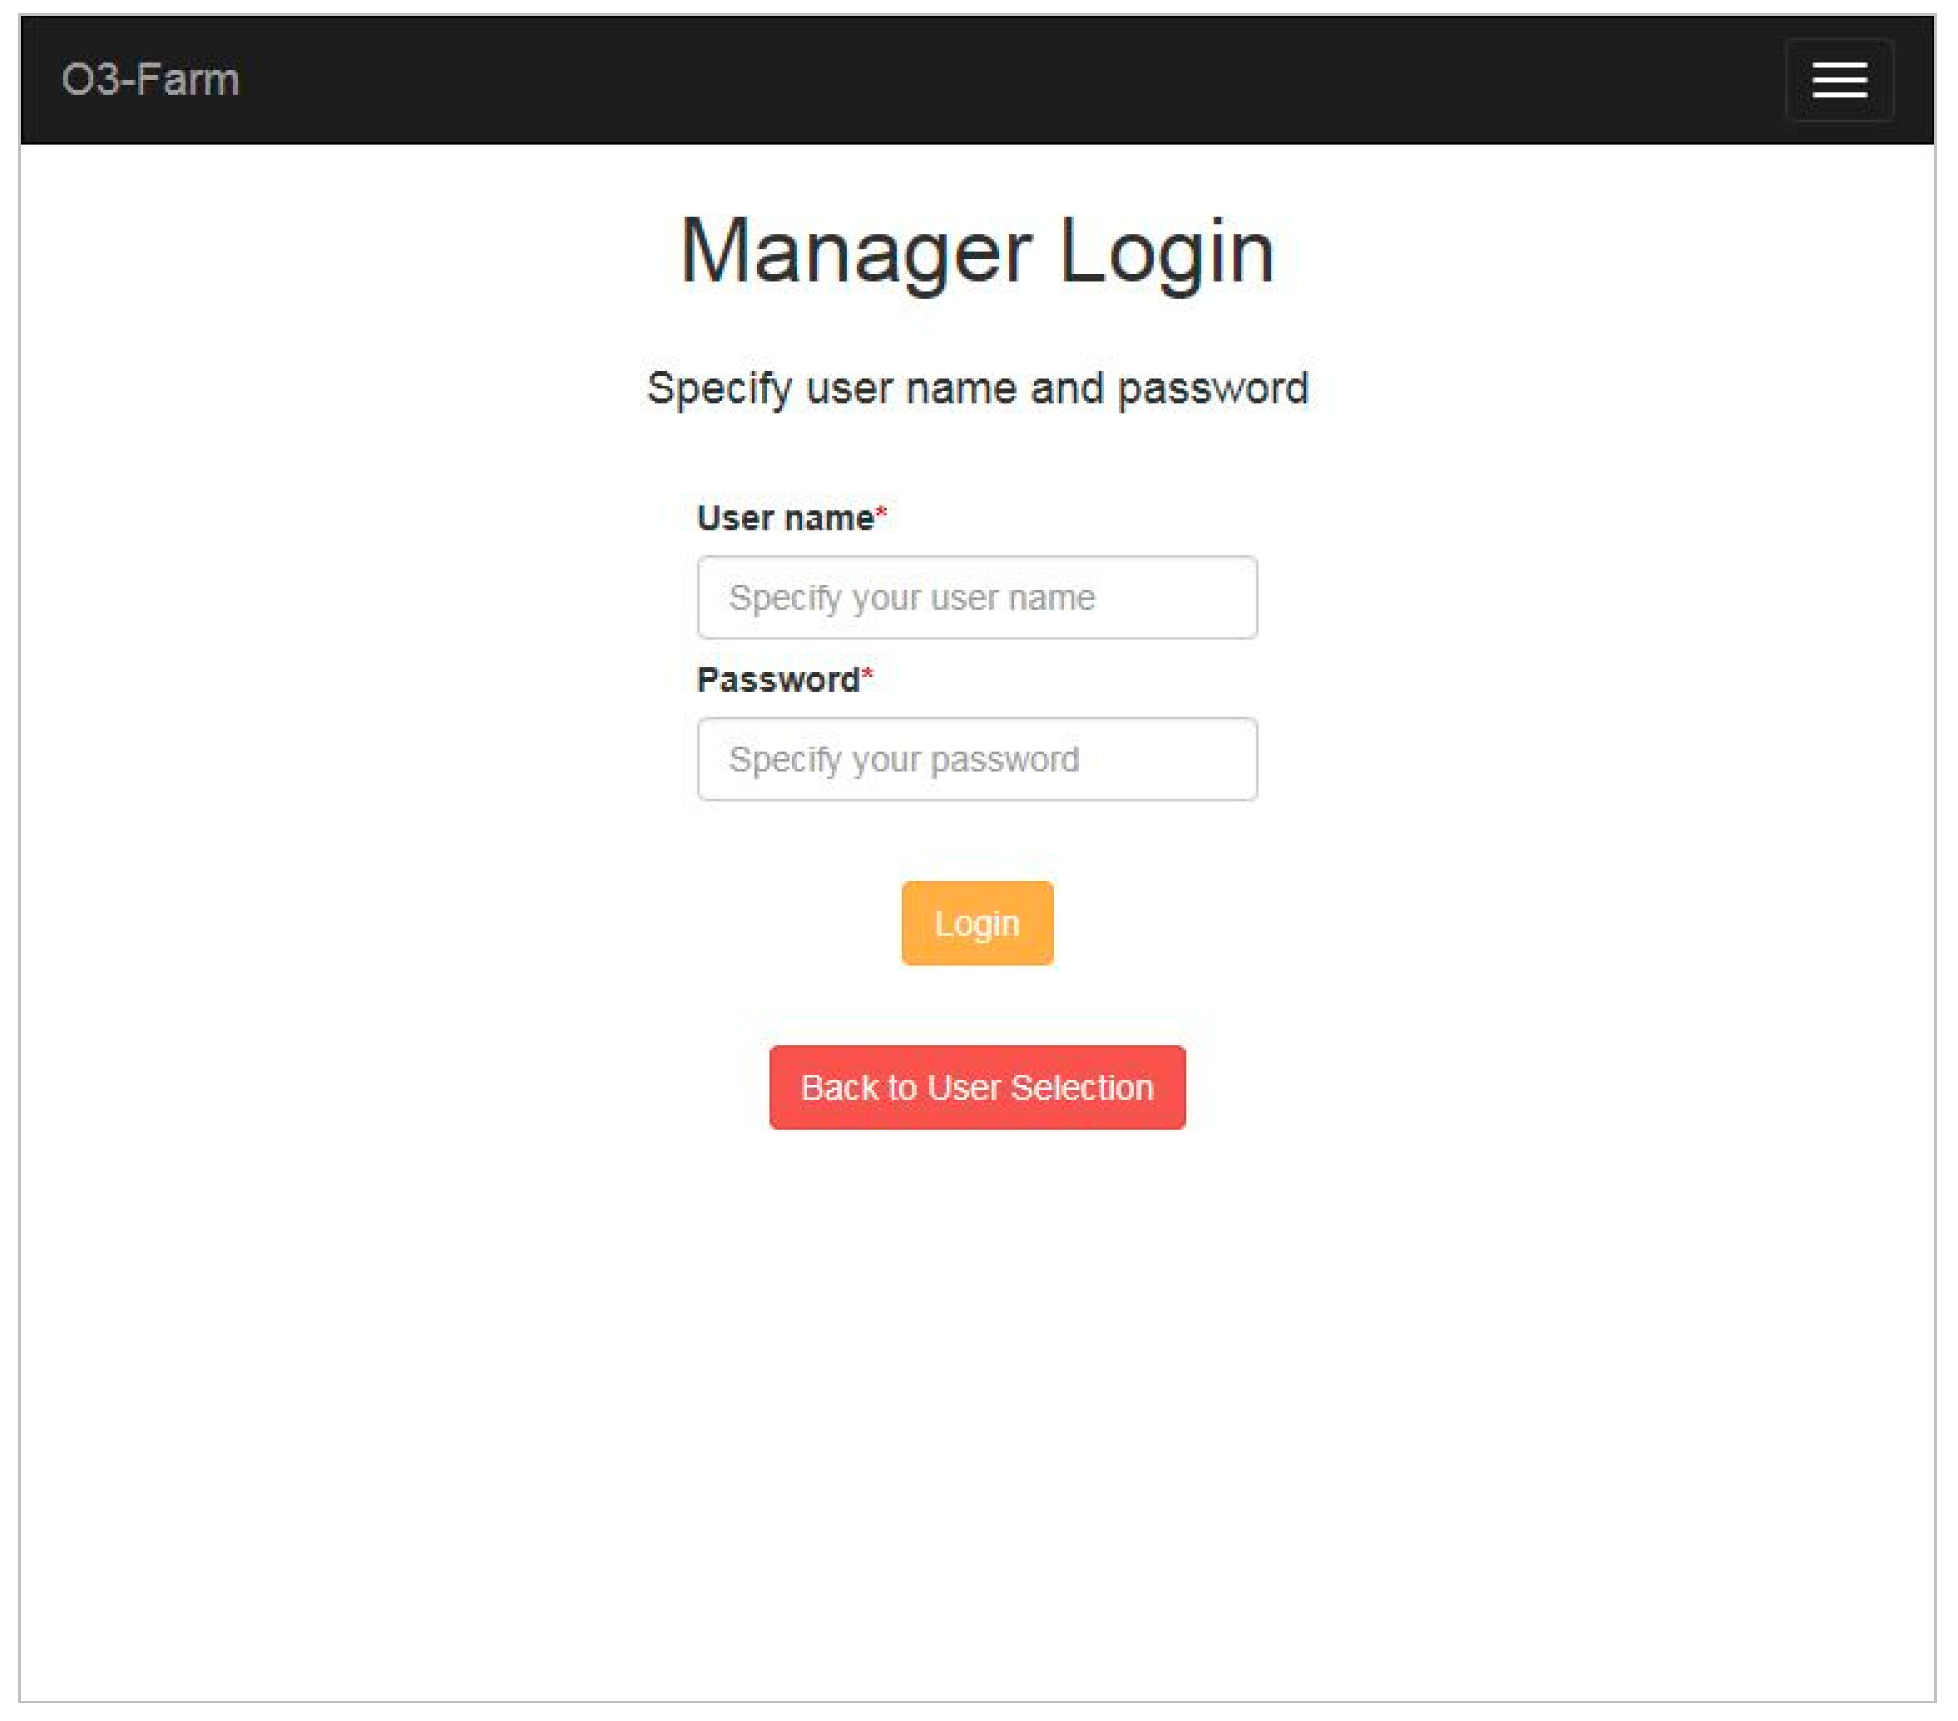
After a web page for the “user-group” selection (
Figure 1), each user is forced to follow a login procedure (
Figure 2) that allows them to reach a different functional page on the basis of the group to which the user belongs. In the software application, three different groups of users are defined: “managers”, “employees” and “milkers”.
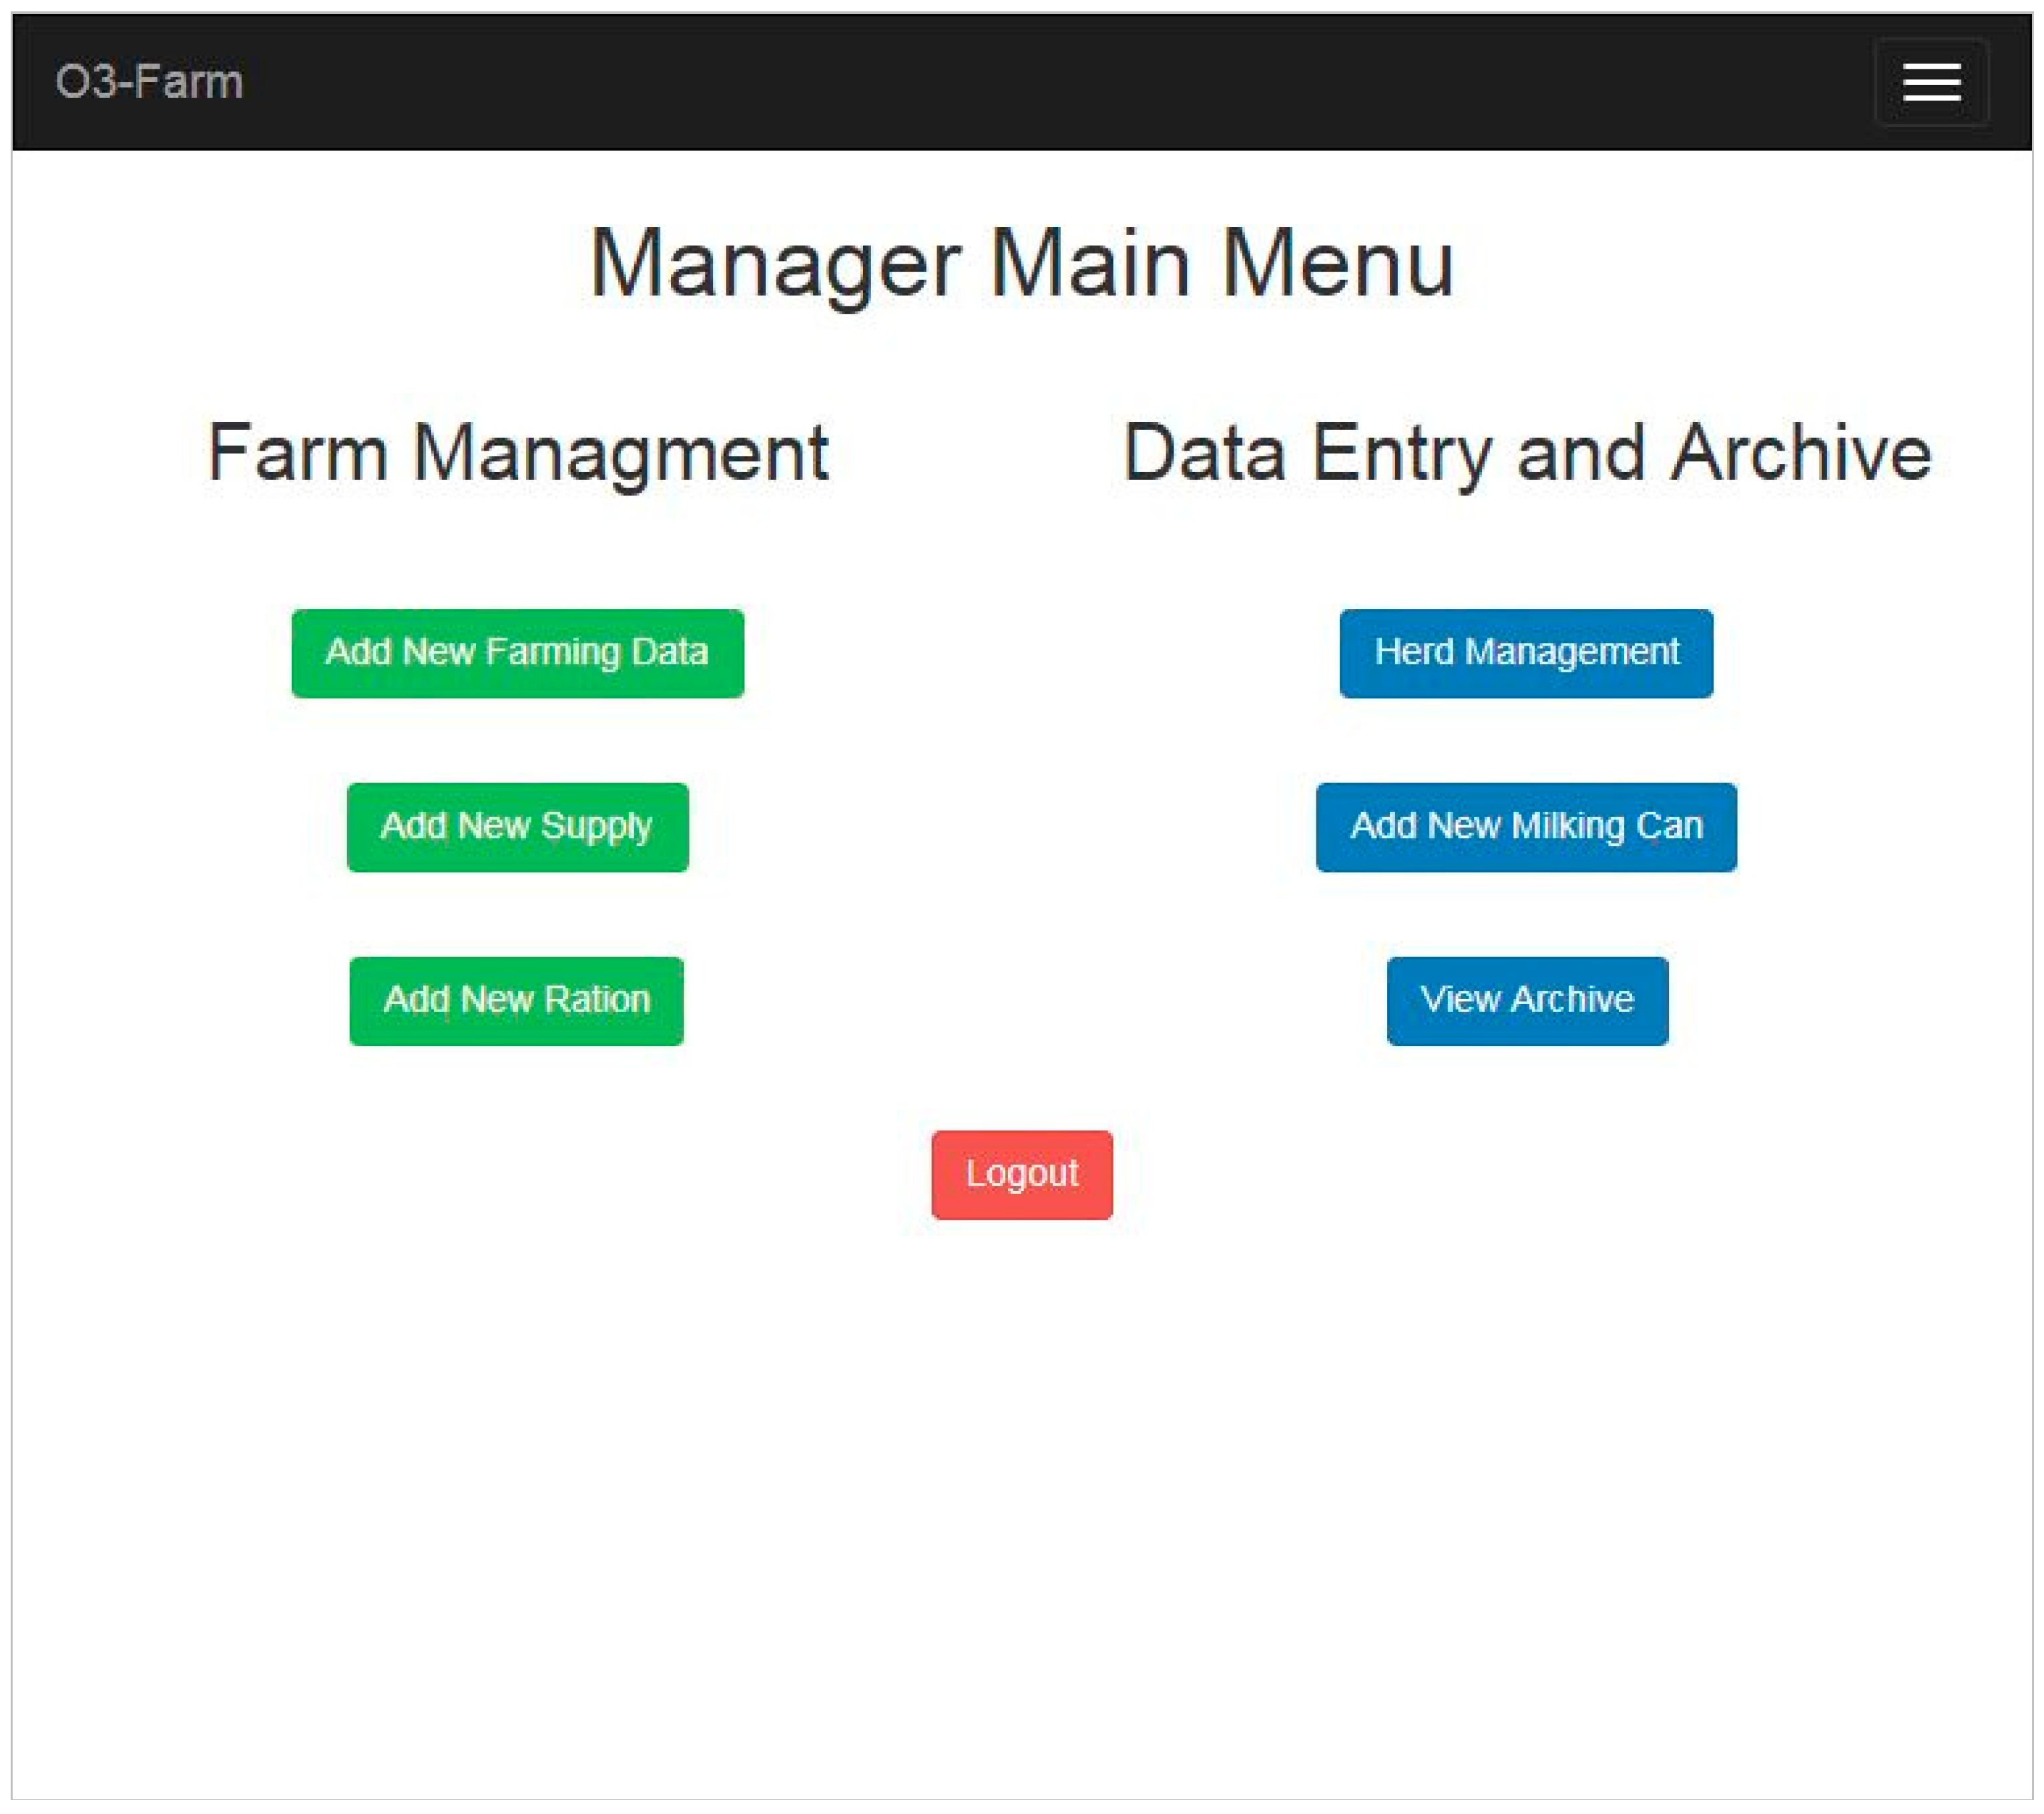
Users of the group “managers” organize most of the farm data. After a login procedure, they reach a web page (
Figure 3) that includes two functional areas. The first area, on the left side of the page, allows farm data to be stored. The second area, on the right side of the page, permits milking data to be managed and any information to be retrieved from the archive.
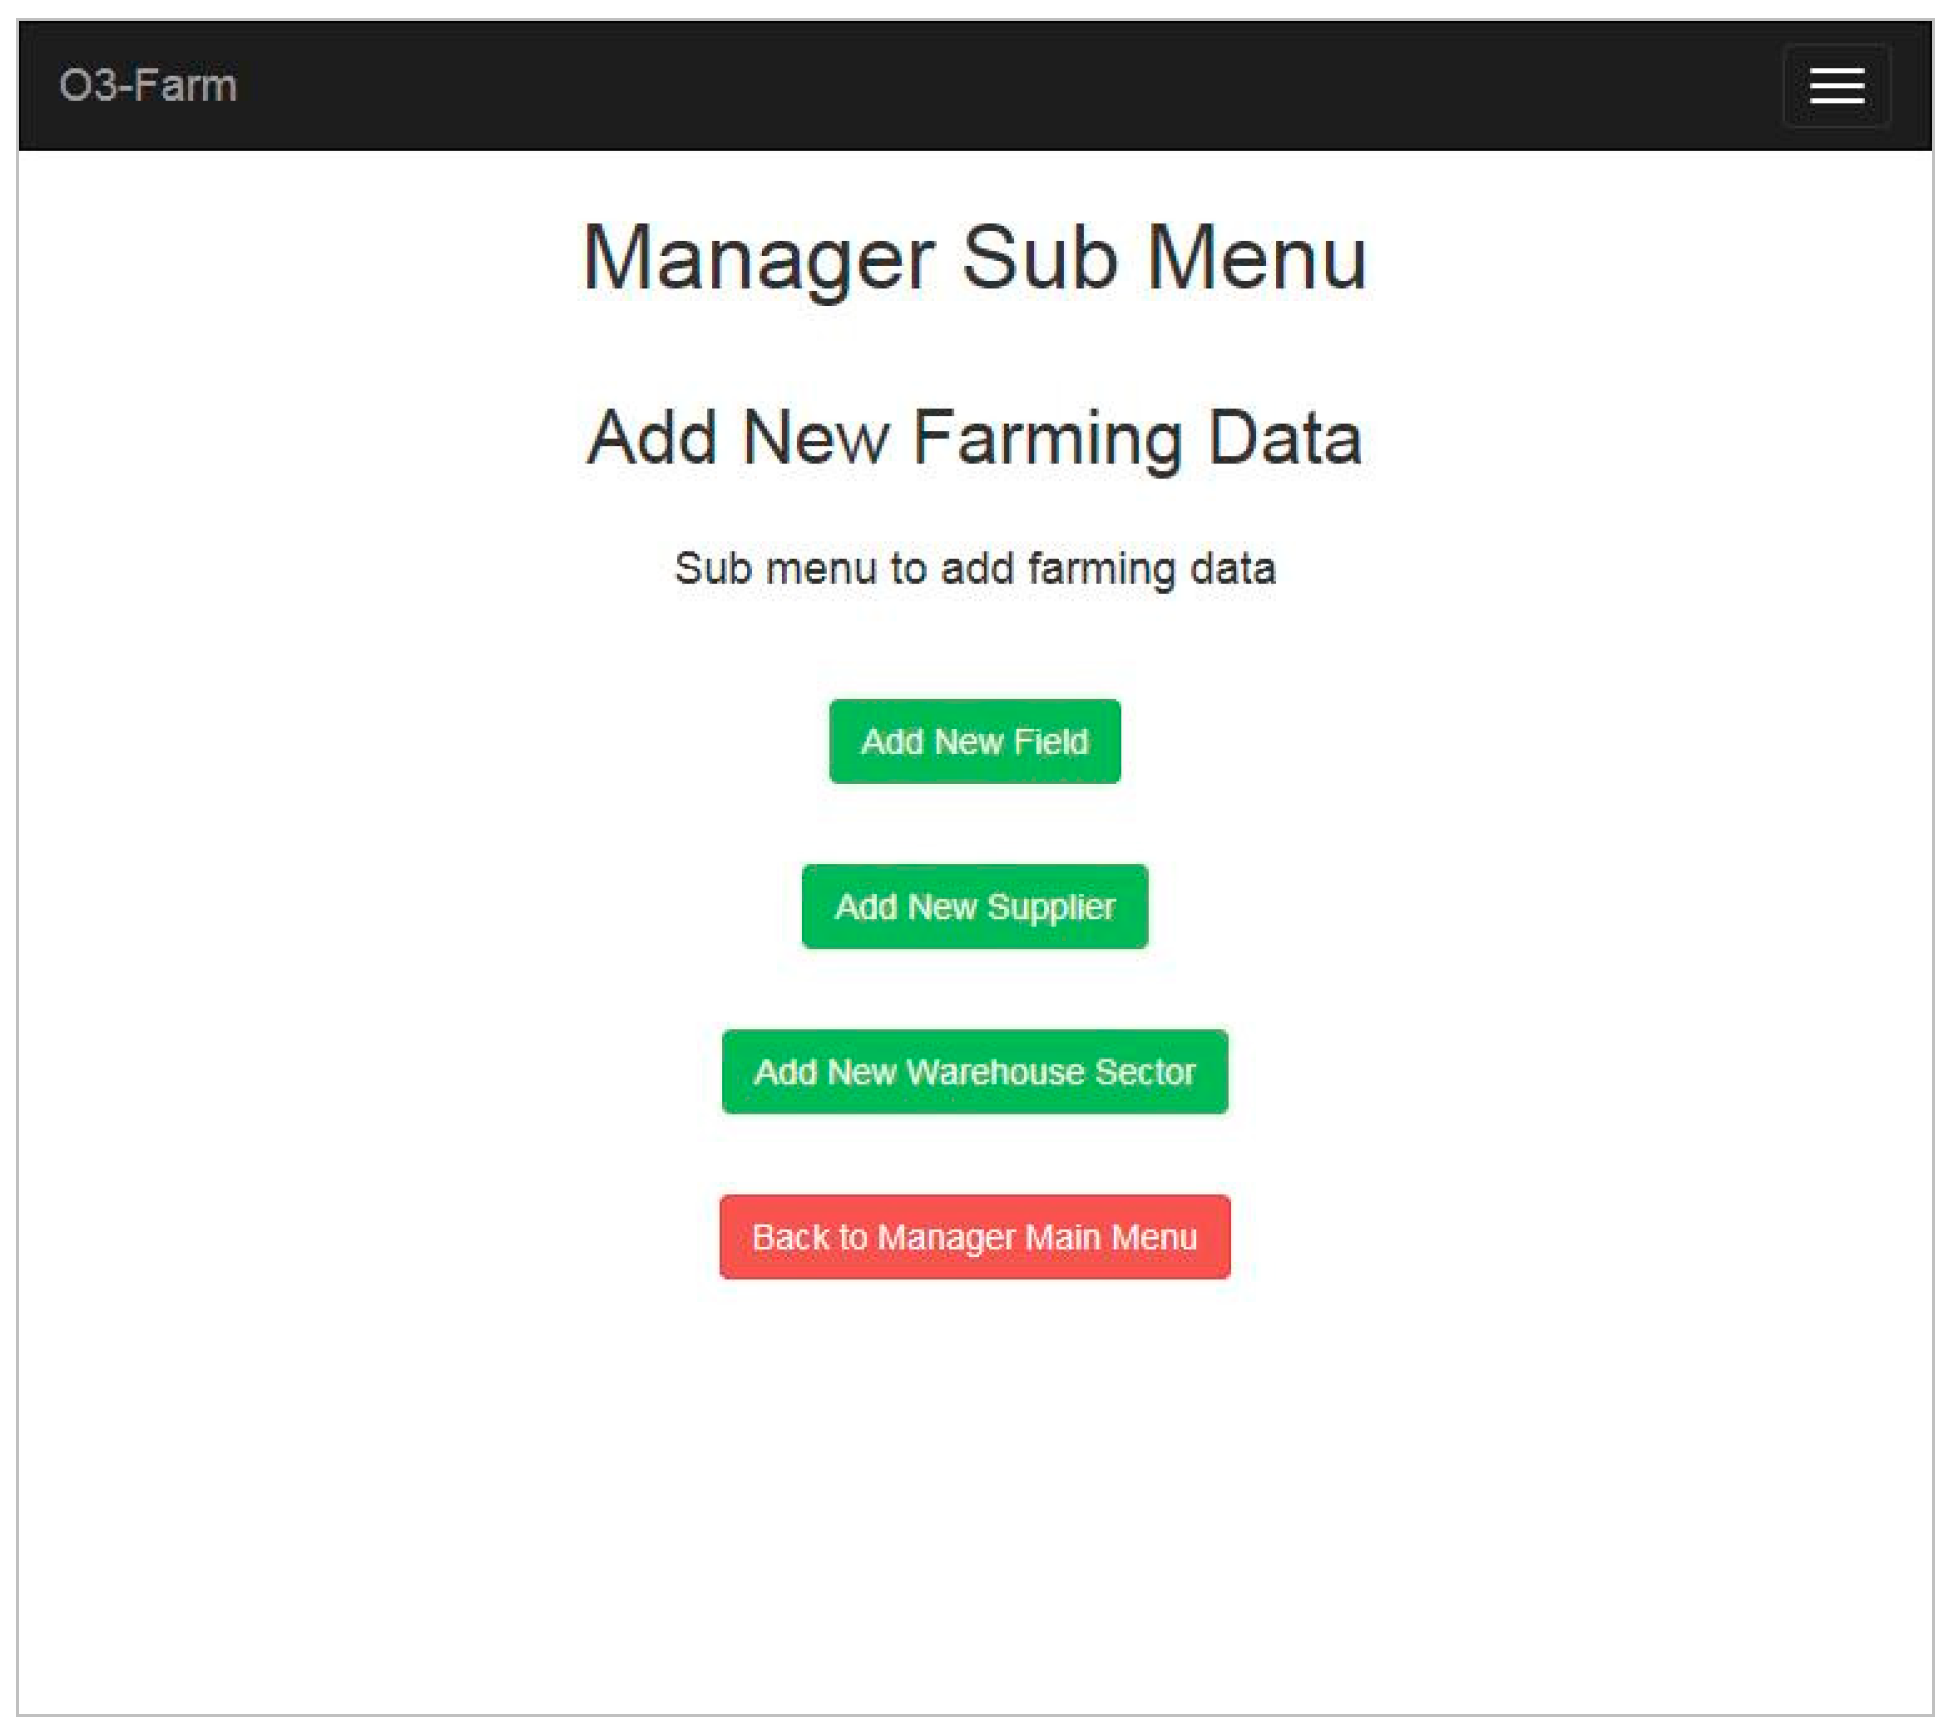
Through the first functional area, called “Farm Management”, a manager can:
“Add new farming data”. Through a linked sub-menu (
Figure 4), he/she can:
- a)
“Add a new field” and define: a “Field code”, its “Area”, and its “Type” using a dedicated window selection box.
- b)
“Add a new supplier” and store: its “Name”, its “Address”, and its “Value Added Tax (VAT) identification number”.
- c)
“Add a warehouse sector” and define: a “Progressive sector code” (useful to identify this sector of the farm warehouse), and a textual “Description”.
“Add a new supply” and specify: the “Delivery date”, the “Product type” and its “Description”. When the supply is produced in the farm, the manager can select a “Field code”. In the other cases, he/she can select a “Supplier name” (from a list of suppliers already stored in the O3-Farm application) and include: the “Lot”, the “Seal”, and the “Invoice” number.
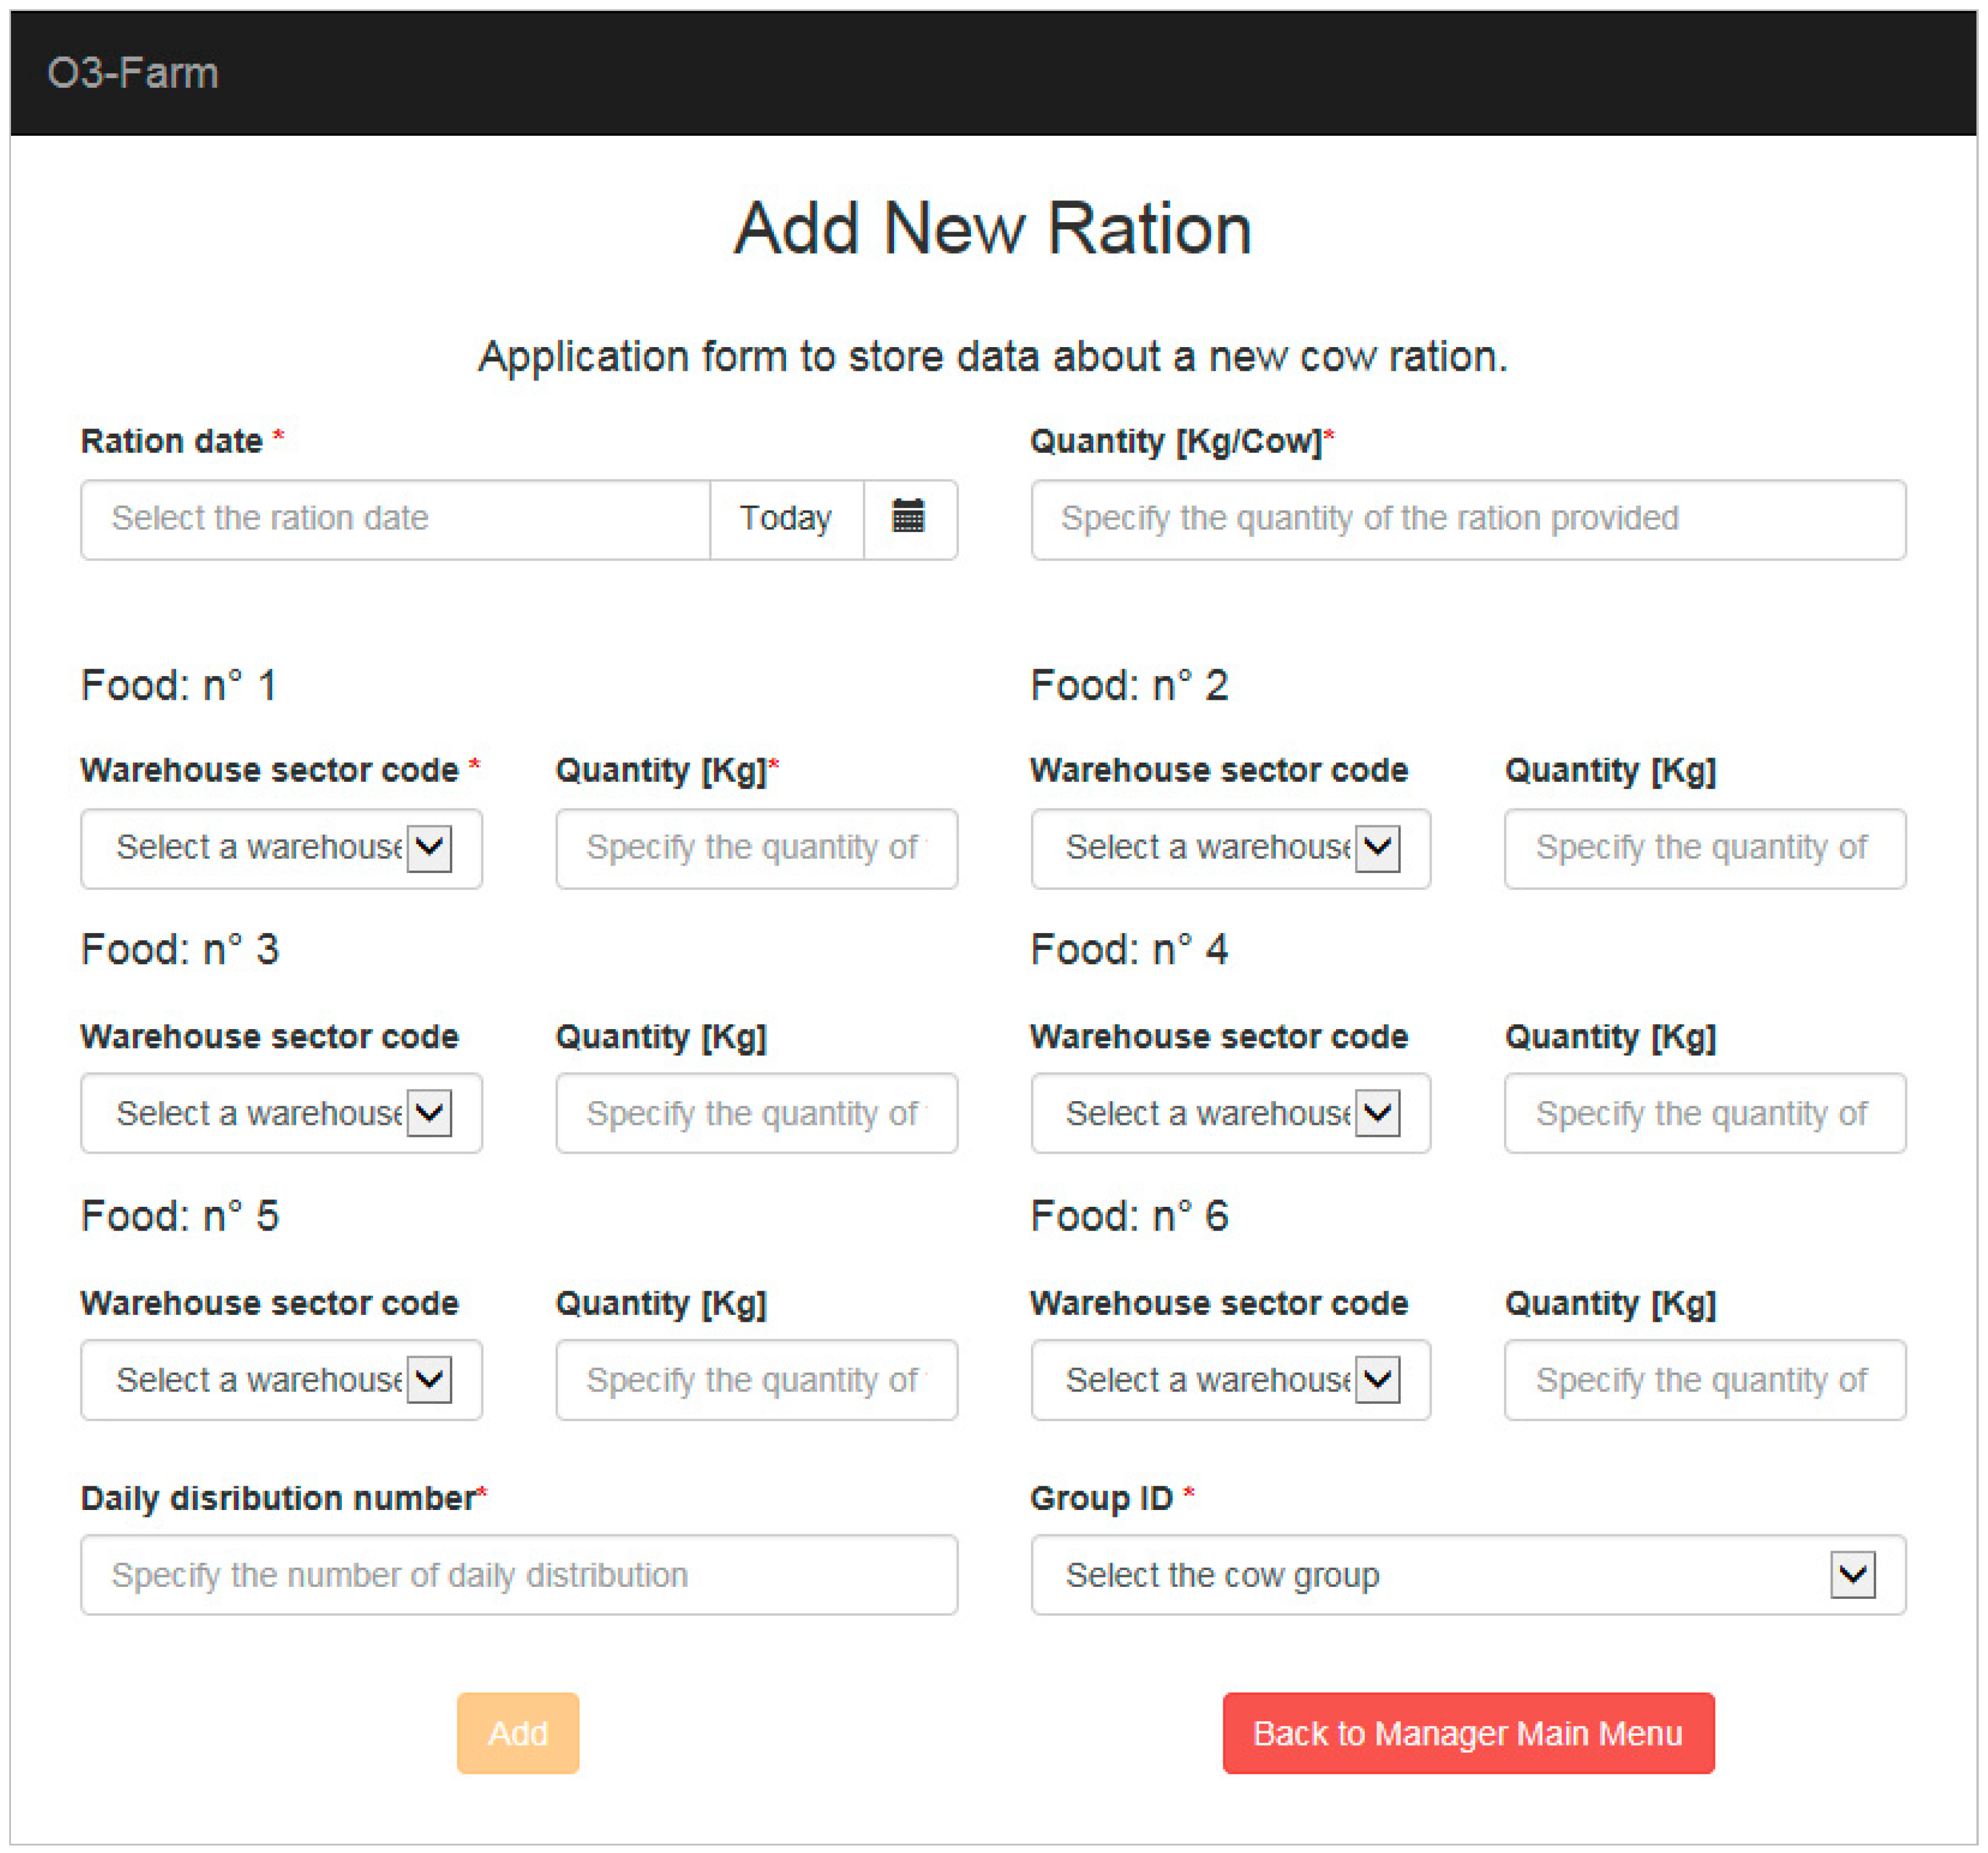
“Add a new ration” for a group of cows. Each ration can be defined selecting up to six different ingredients. For each ingredient of the ration, the “Warehouse sector” where it is stored, and its “Quantity”, are information requested. With this web form, the manager can also define: the “Number of daily distributions”, the “Group ID” of the cows that will receive this ration, and the starting day using a “Ration date” box (
Figure 5).
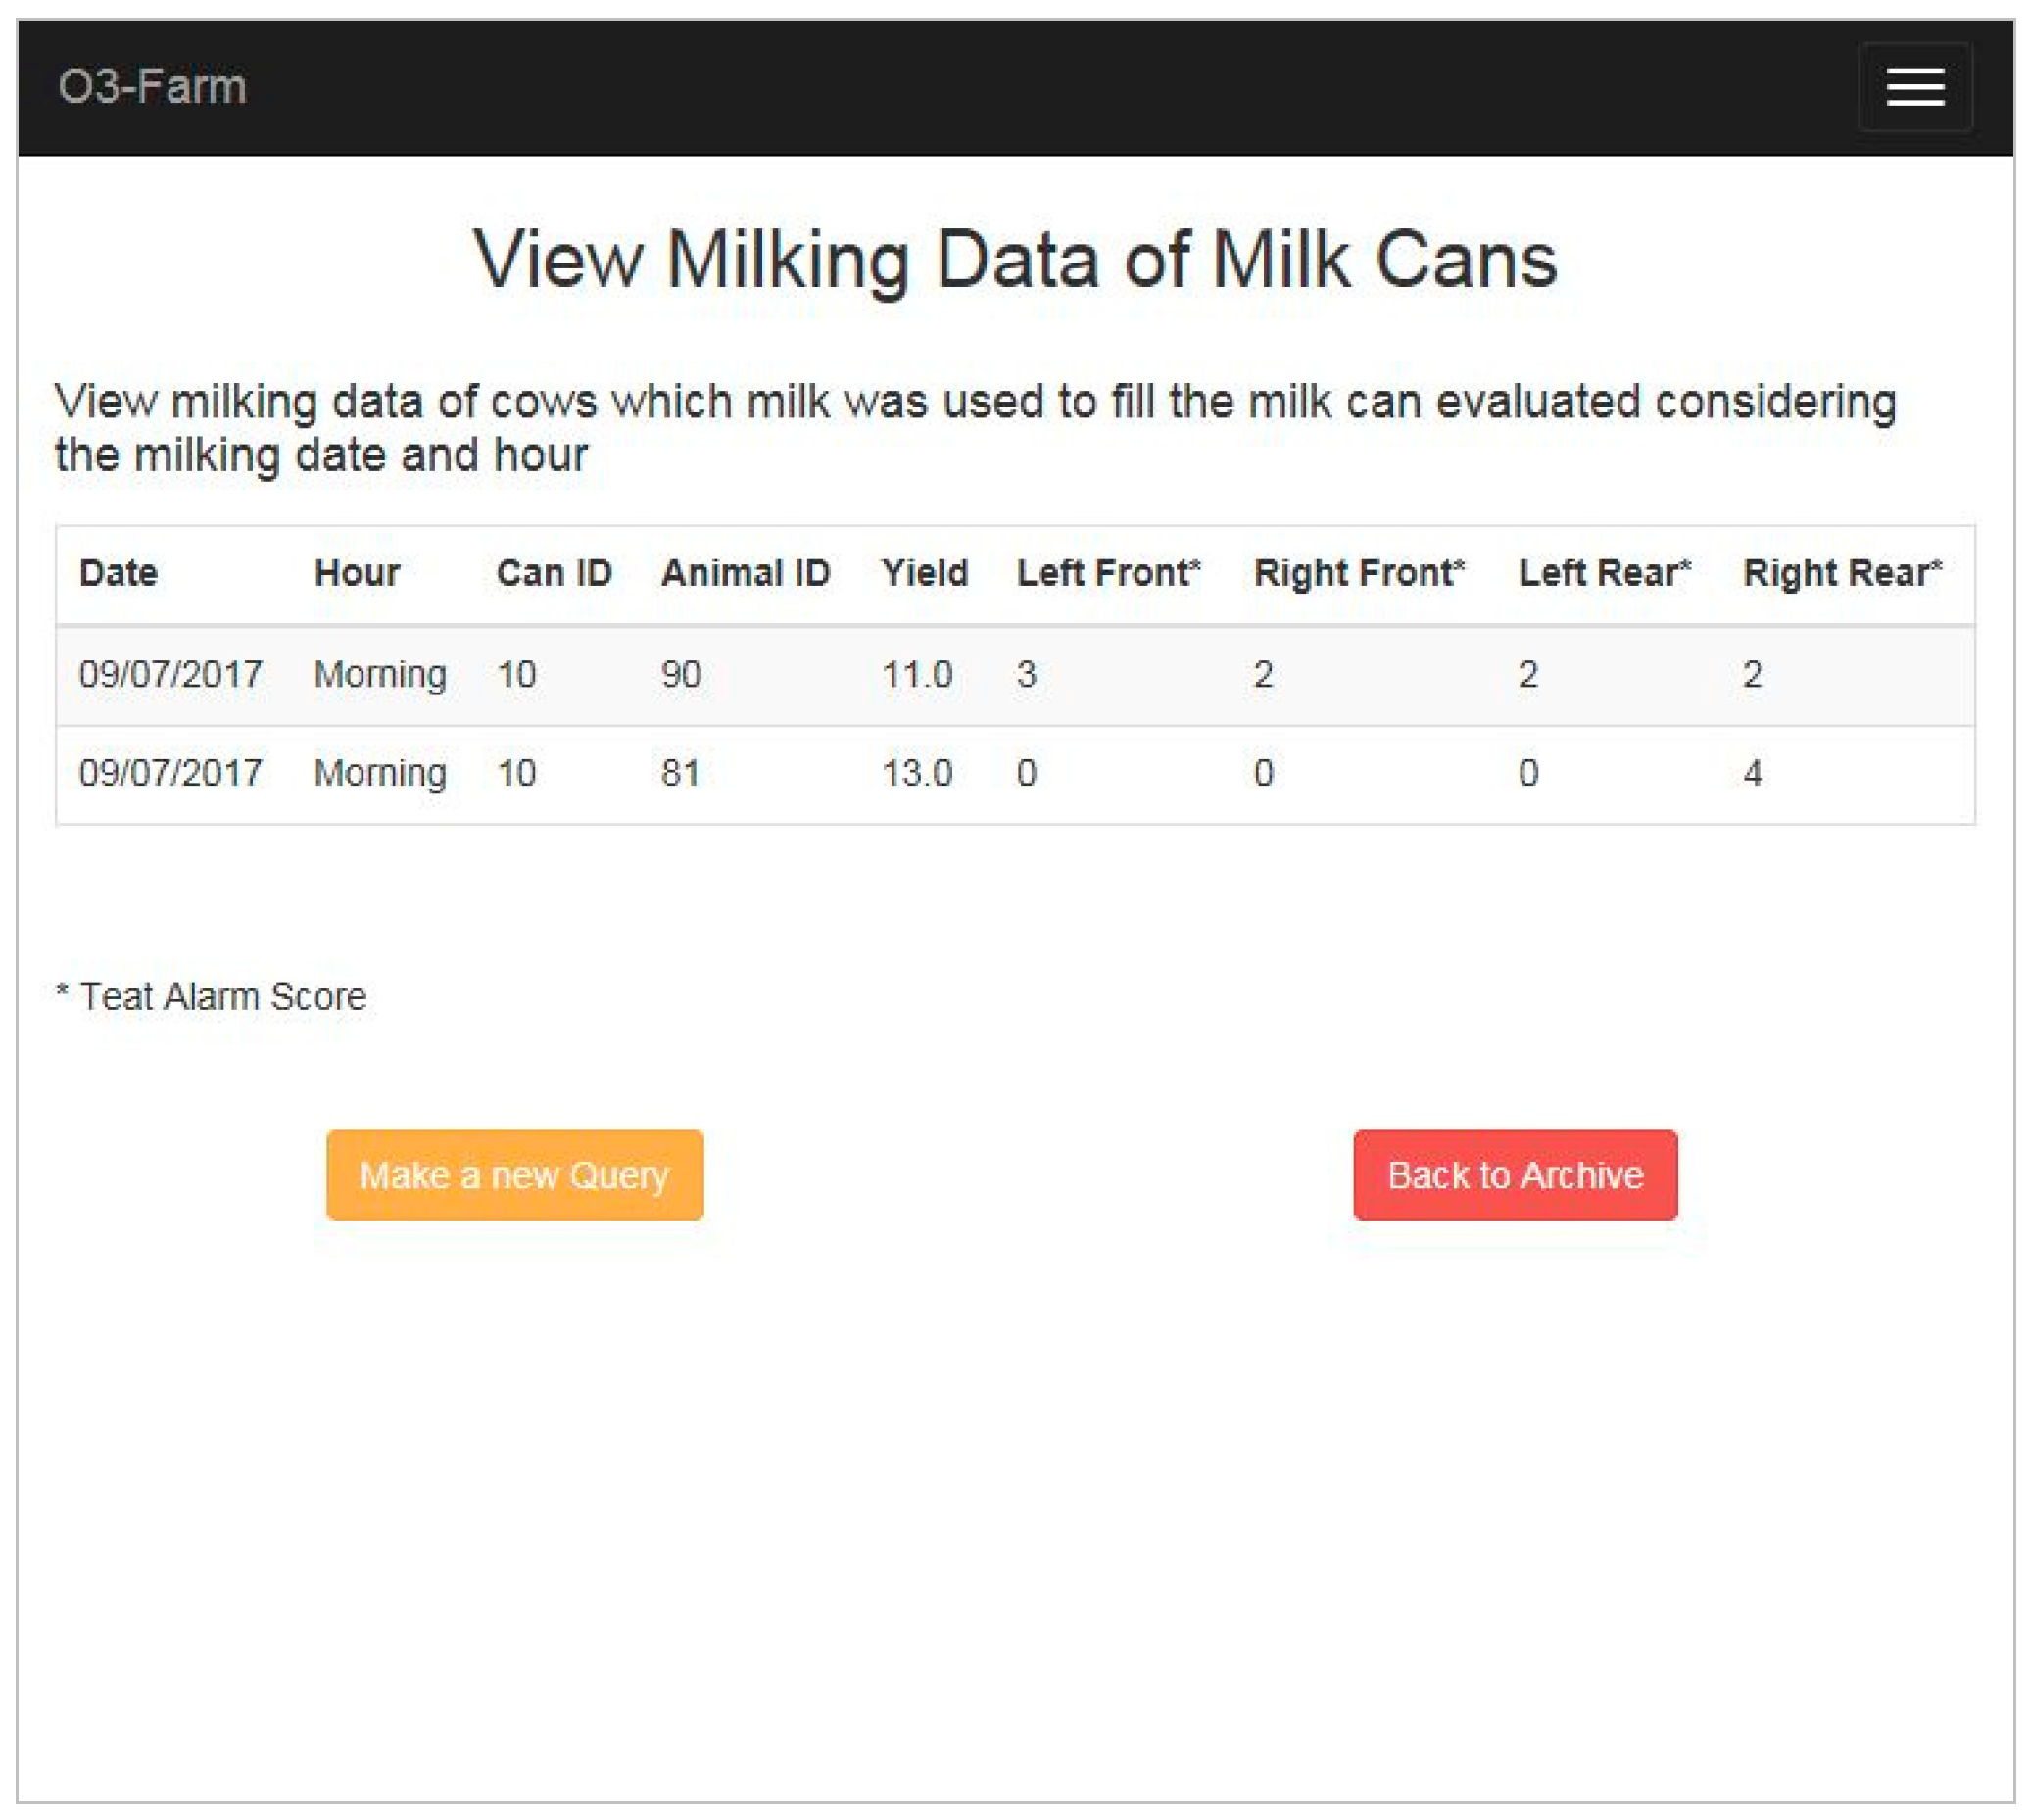
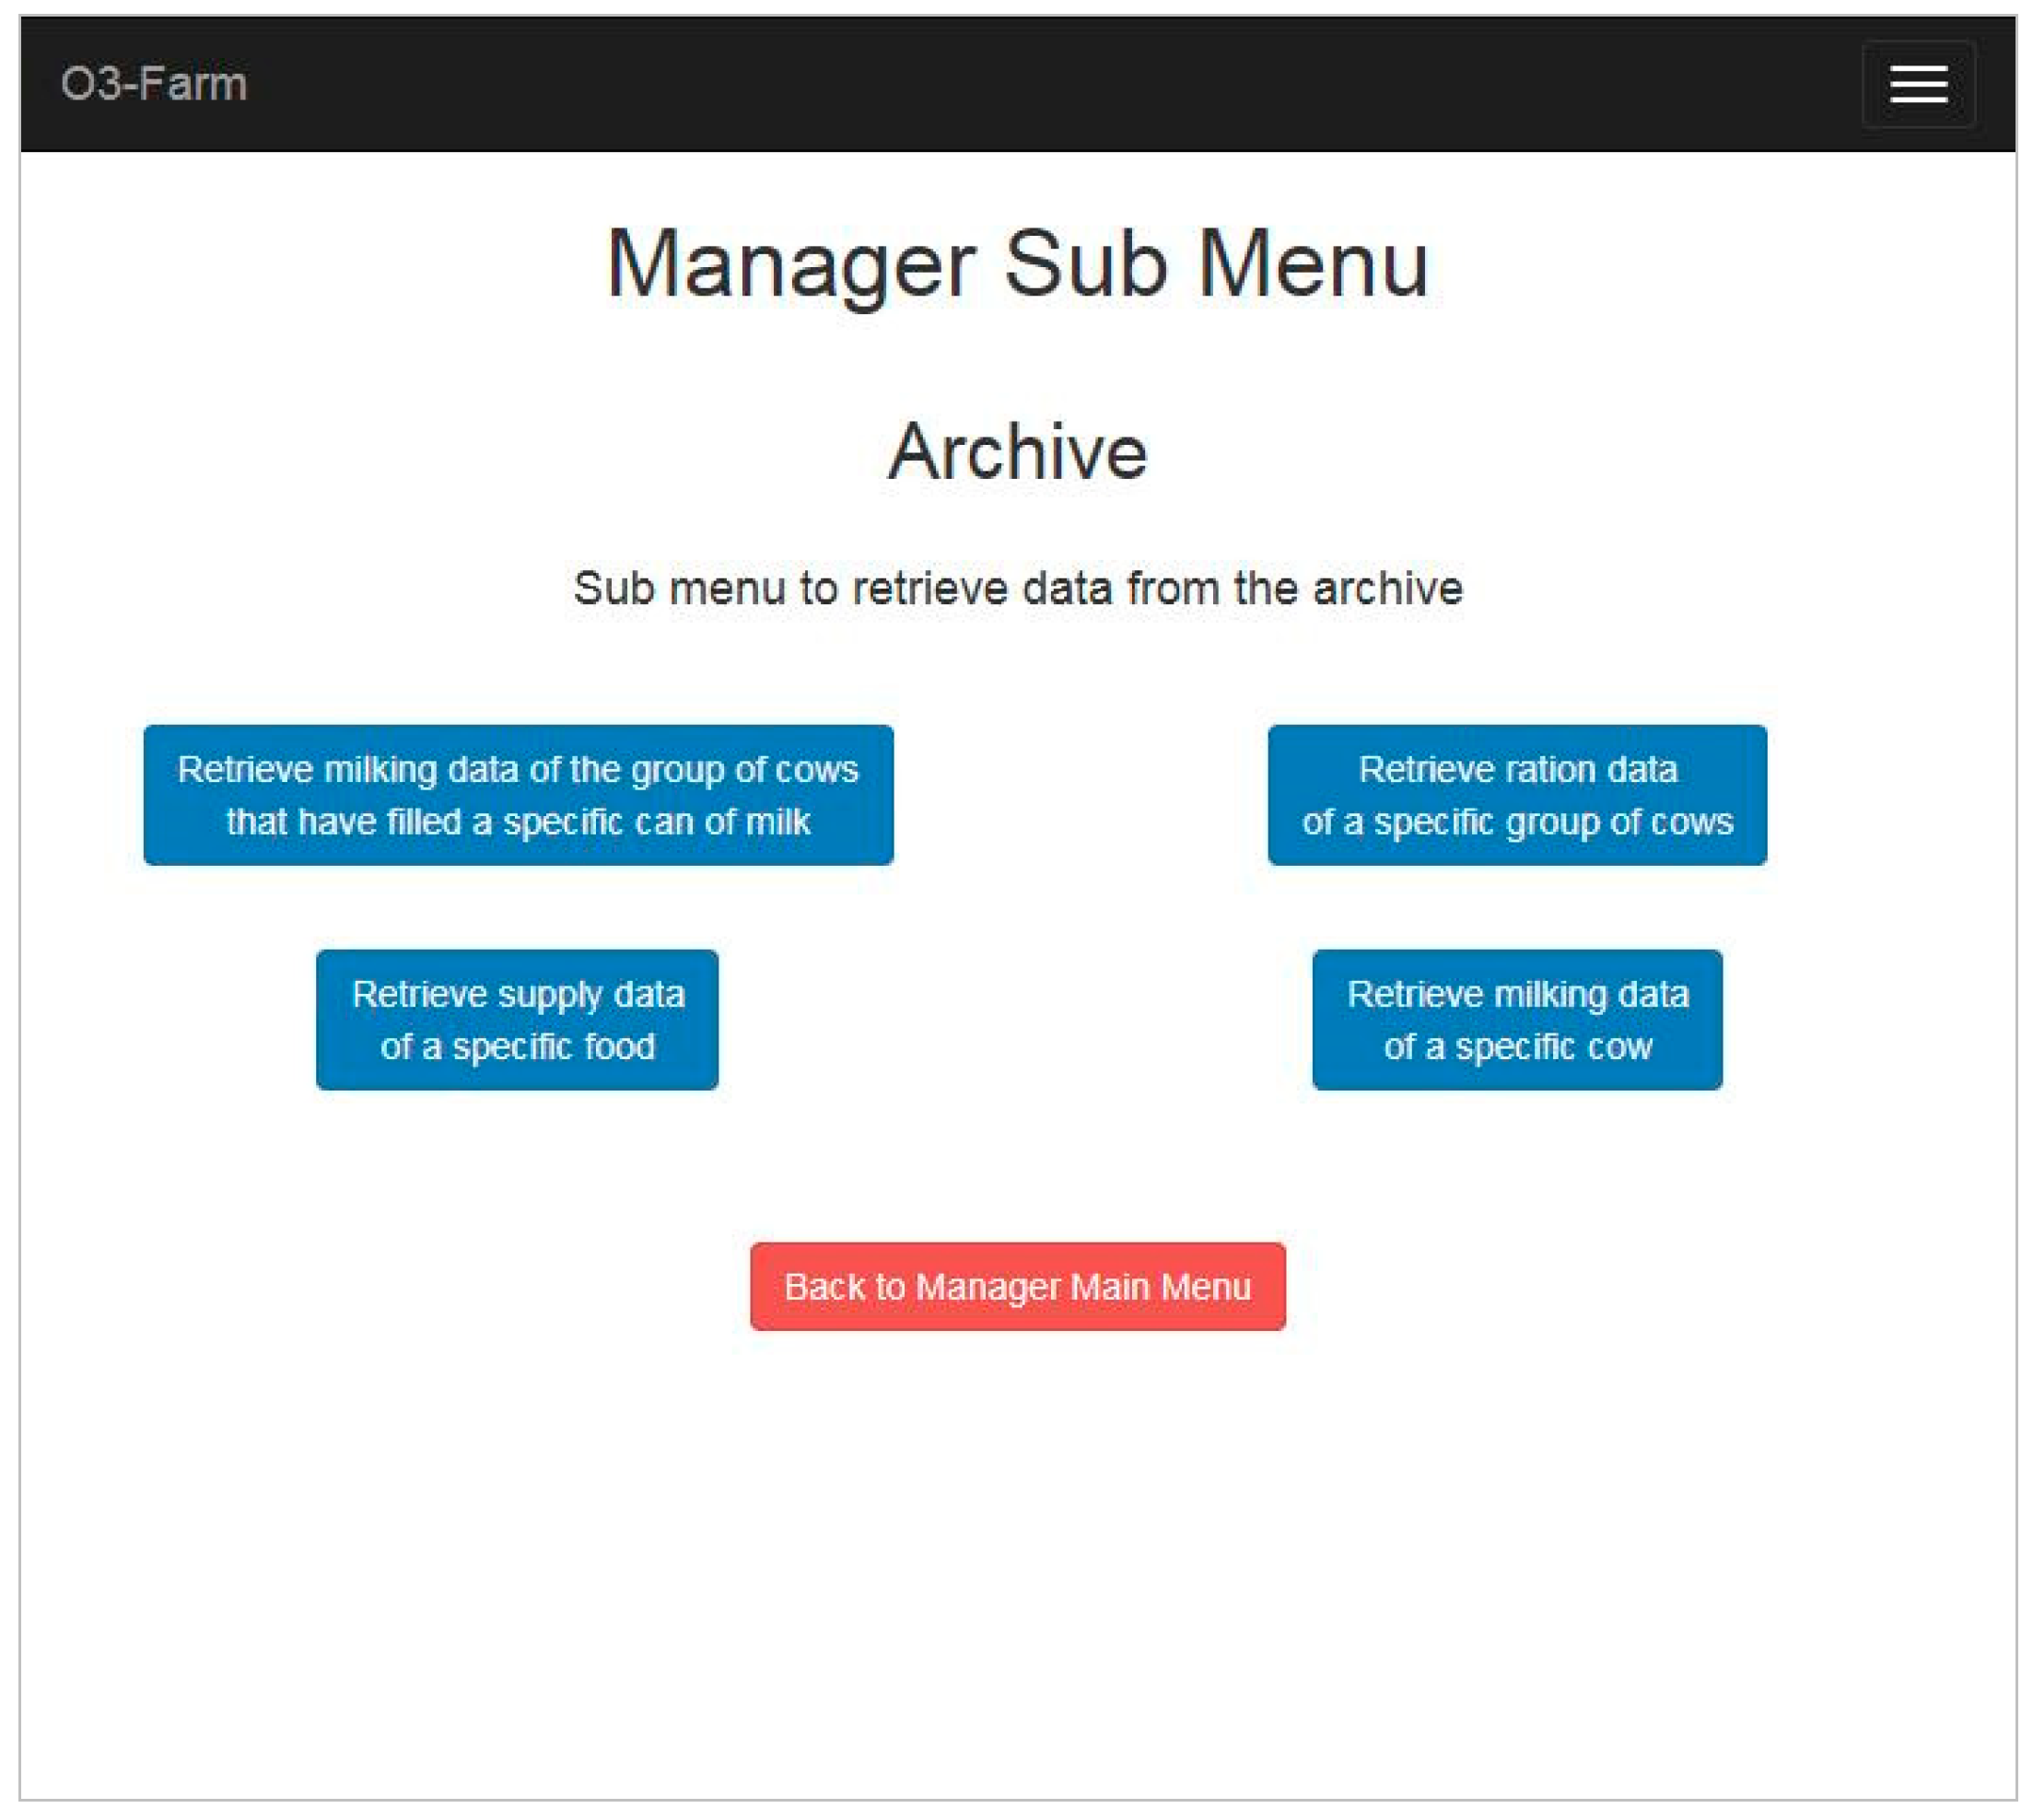
Through the second functional area, called “Data Entry and Archive” (
Figure 3), a manager can:
The users of the group “employees” are responsible for the farm warehouse. After a login procedure, when a new supply is waiting to be stored in the farm warehouse, employees can reach a web page where a dedicated link is provided. Through this link, an employee can display supply data, such as: the “Delivery date”, the “Product type” and its “Description”. When the supply comes from the farm, the “Field code” where it has been produced is shown to the user. In the other cases, the “Supplier name”, the “Lot”, the “Seal” and the “Invoice” number are the data displayed on the screen. When the supply is stored in a specific sector of the farm warehouse, he/she can record this data using this page. Of course, when no other supply is waiting to be stored, the message “no further tasks are required” is displayed to users that reach the web page described above.
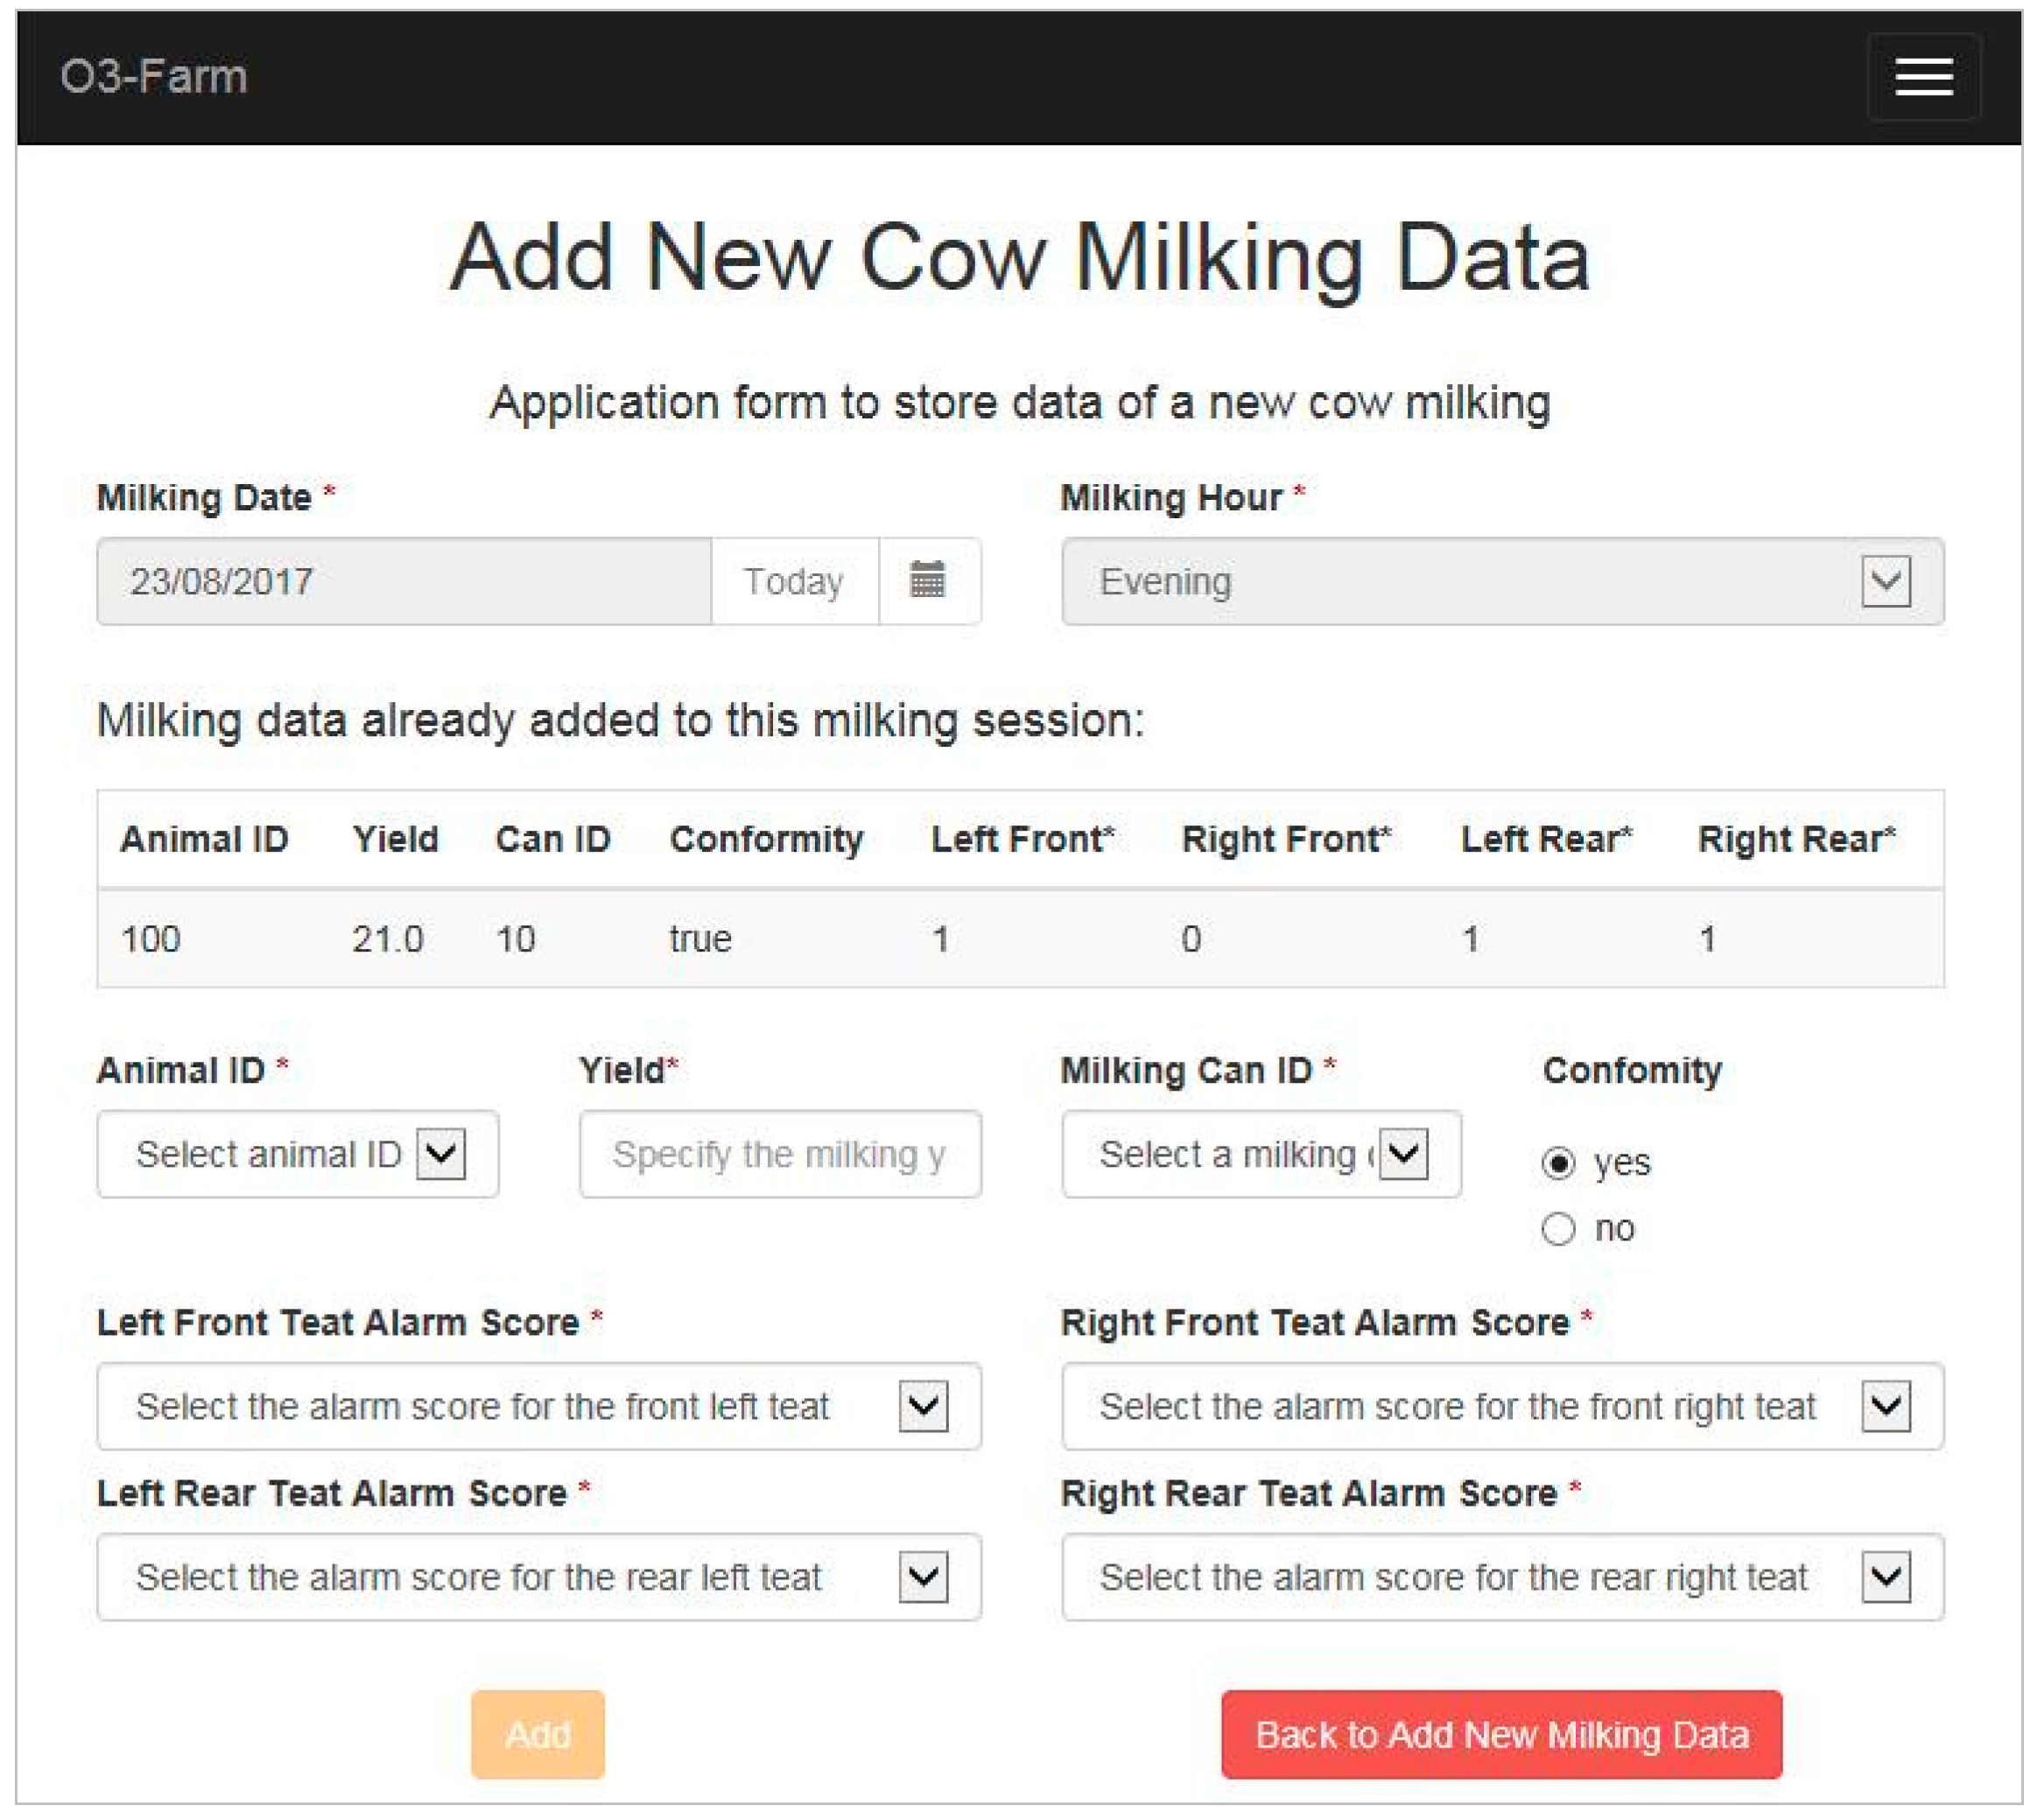
The users of the group “milkers” have the responsibility to add milking data, two times a day, after the end of milking procedures. When a new set of milking data are available, the milkers can reach a web page, after a login procedure, where a dedicated link is shown. Through this link, milkers can display a page (
Figure 9) that reports: the “Milking date”, the “Milking hour”, and a set of milking data already stored for that milking. Using the input fields that are in the lower side of the page, milkers can add a new set of milking data that includes: the “Animal ID”, the “Yield”, the “Milking can ID” (where the milk of a specific cow has been stored), a “Conformity” evaluation of the milk produced, and all “teat alarm scores” recorded by the electronic milking unit. When this web page is reloaded, the new set of data is added to the list of milking data already recorded. The activity of data entry is suspended when data of all cows have been stored and no other milking session has to be recorded. In this latter case, if a user tries to reach the web page described above, he/she is informed that “no further tasks are required”.
3.3. Description of the Business Procedures
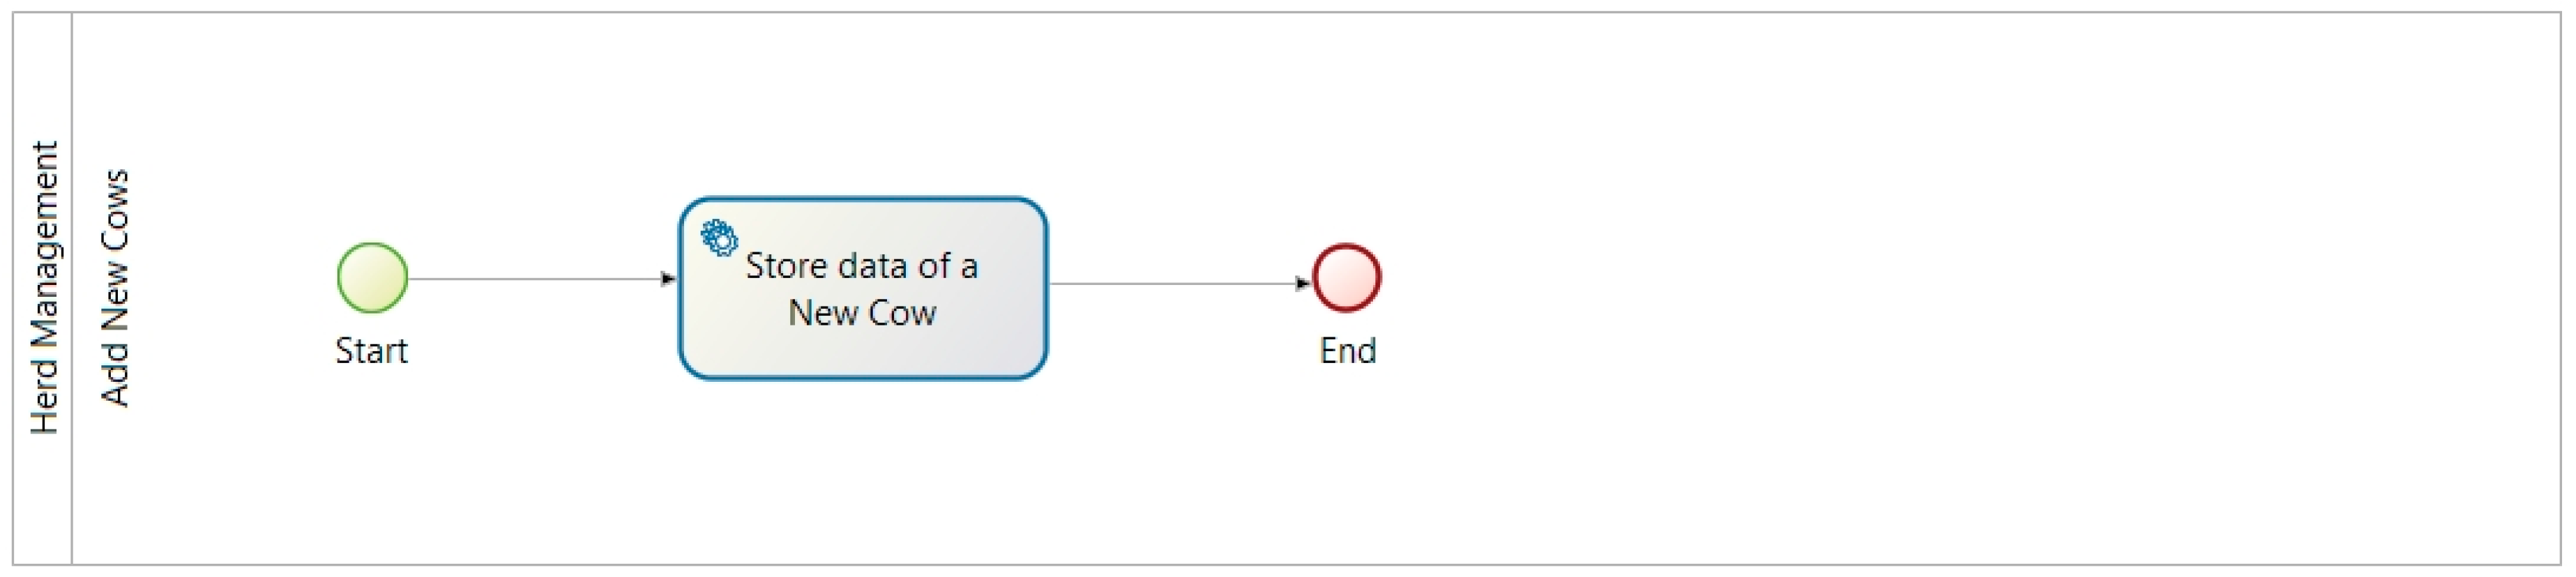
Data entry of the O3-Farm application is shared between different groups of users and designed in business processes. The most frequent process has a structure like the one reported in the diagram of
Figure 10. This type of business process is used when a user must store a set of data in the database. When he/she submits a set of inputs, by a dedicated web form, the process starts and a “service task” allows data submitted to be collected and recorded. After this task, the process ends.
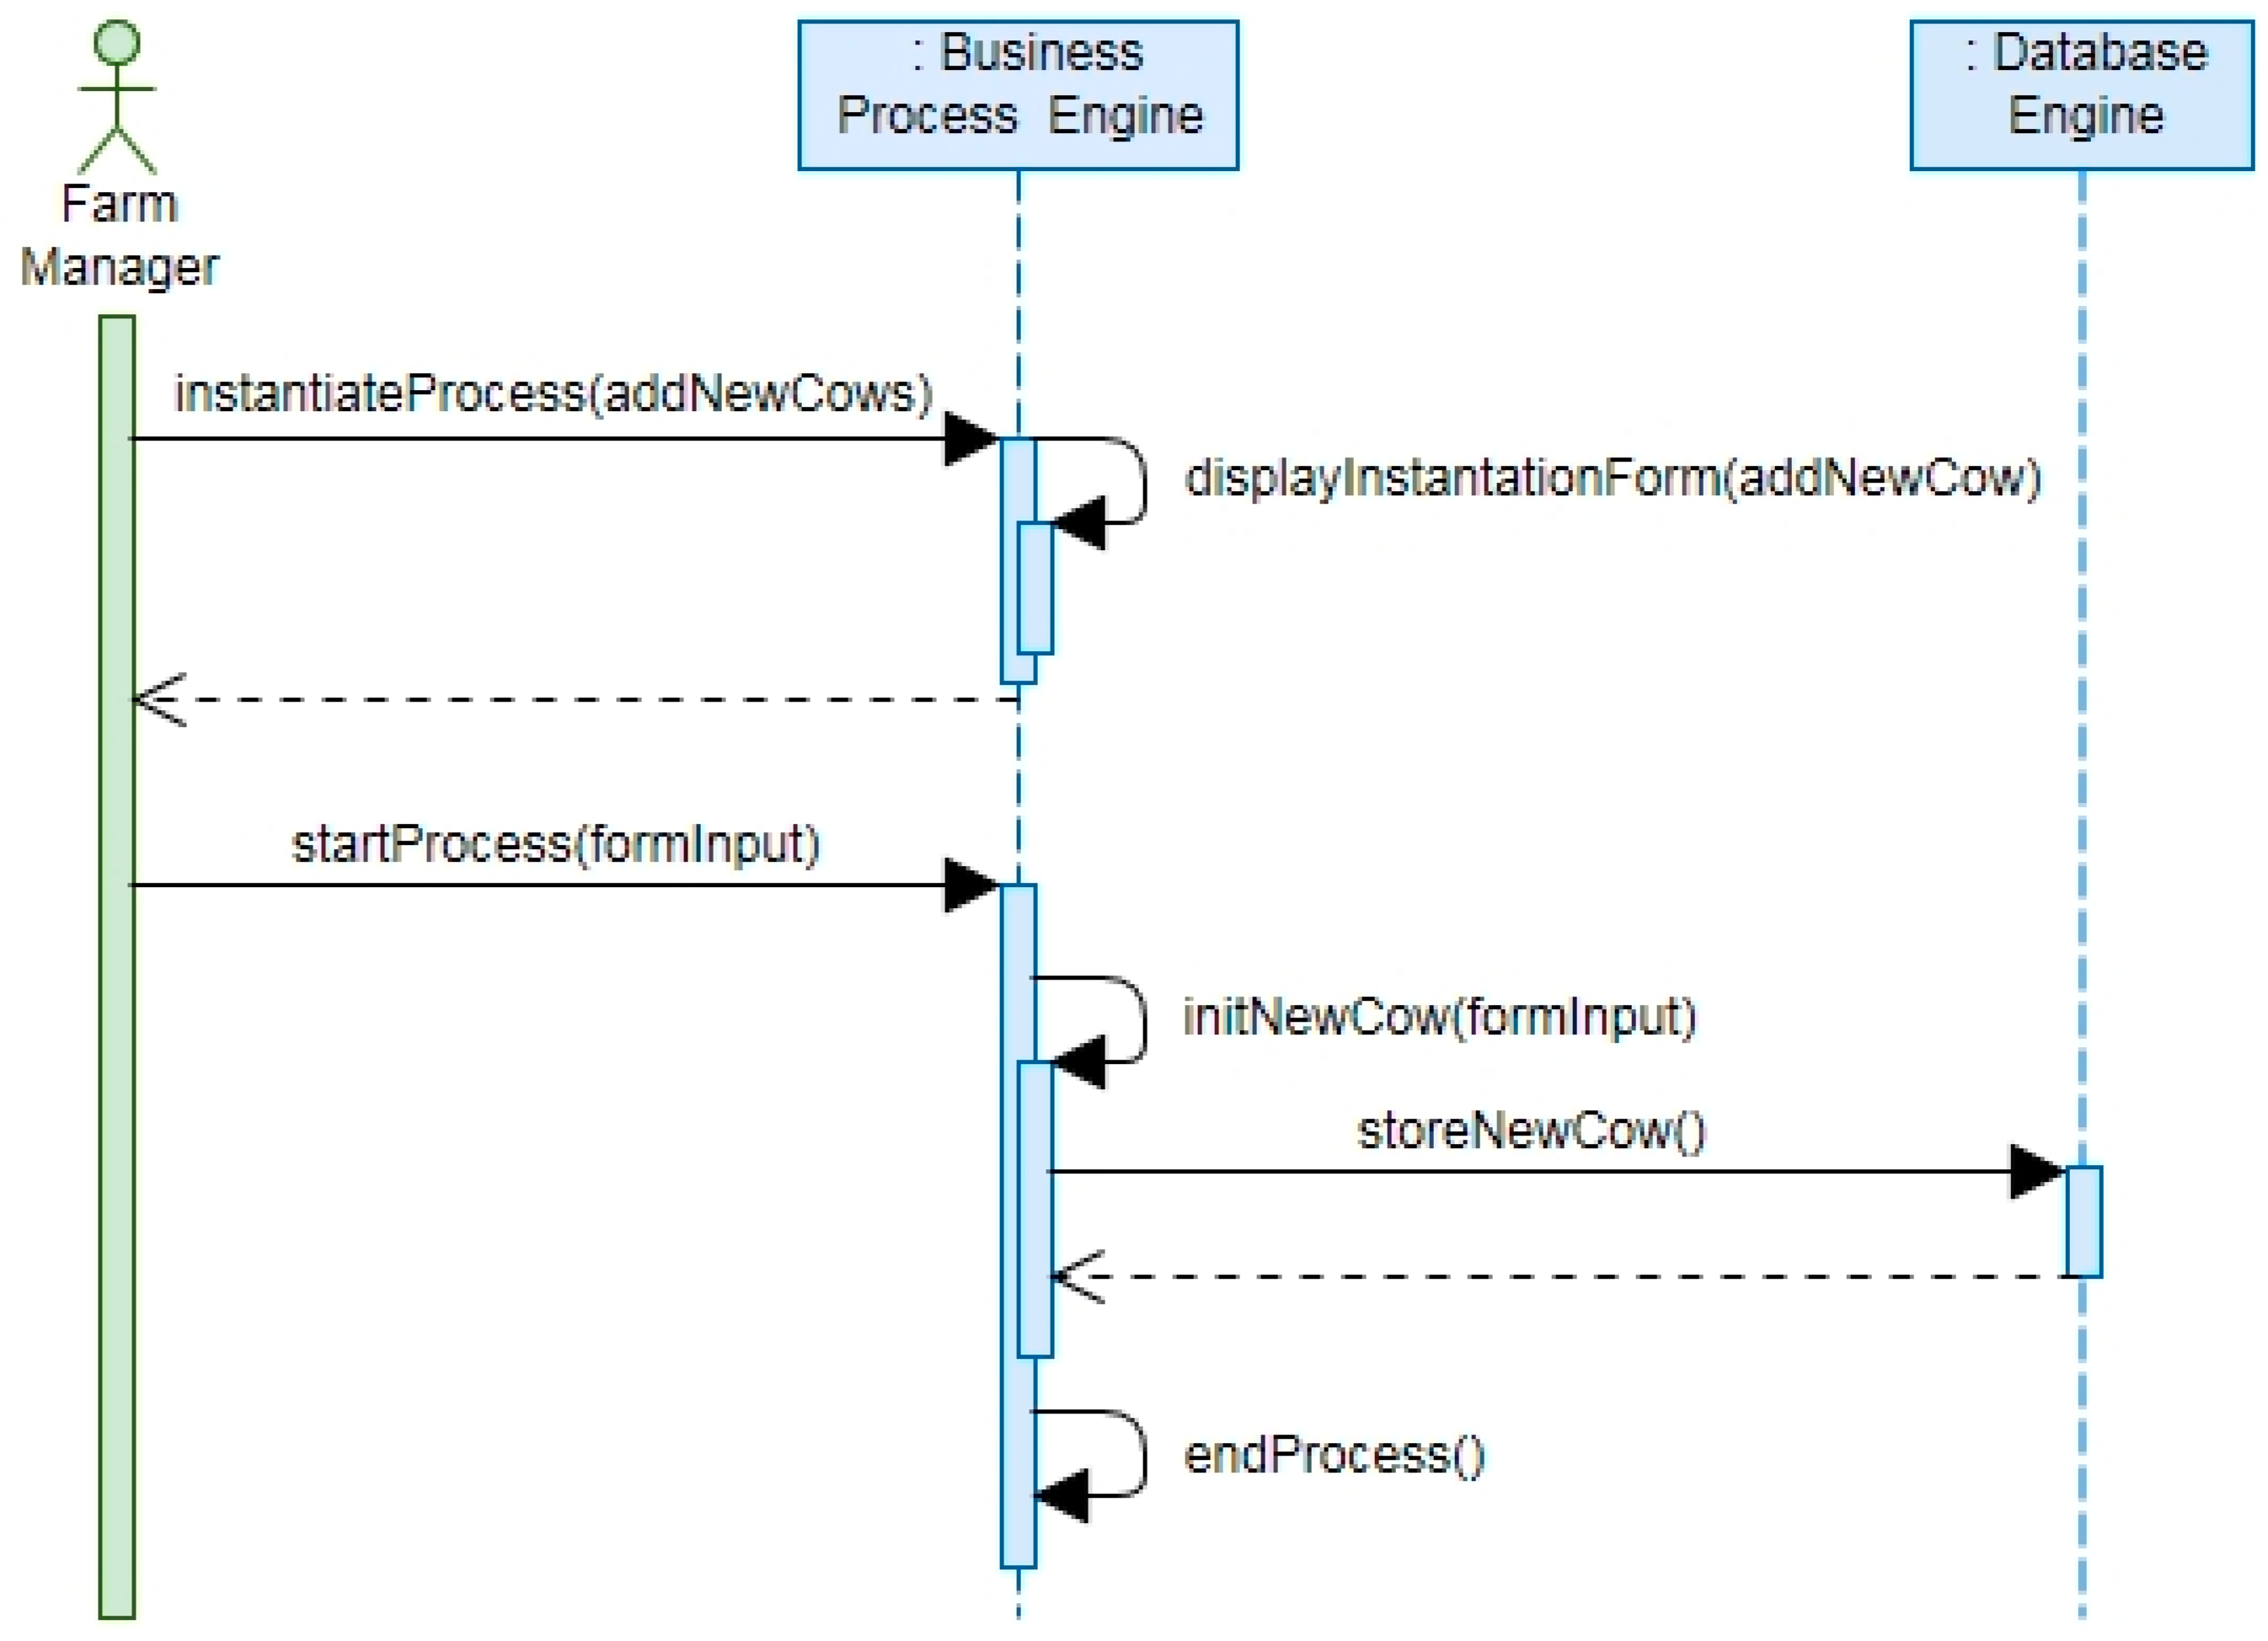
Even though simple, this kind of business process involves different components of the software application. As shown in the activity diagram of
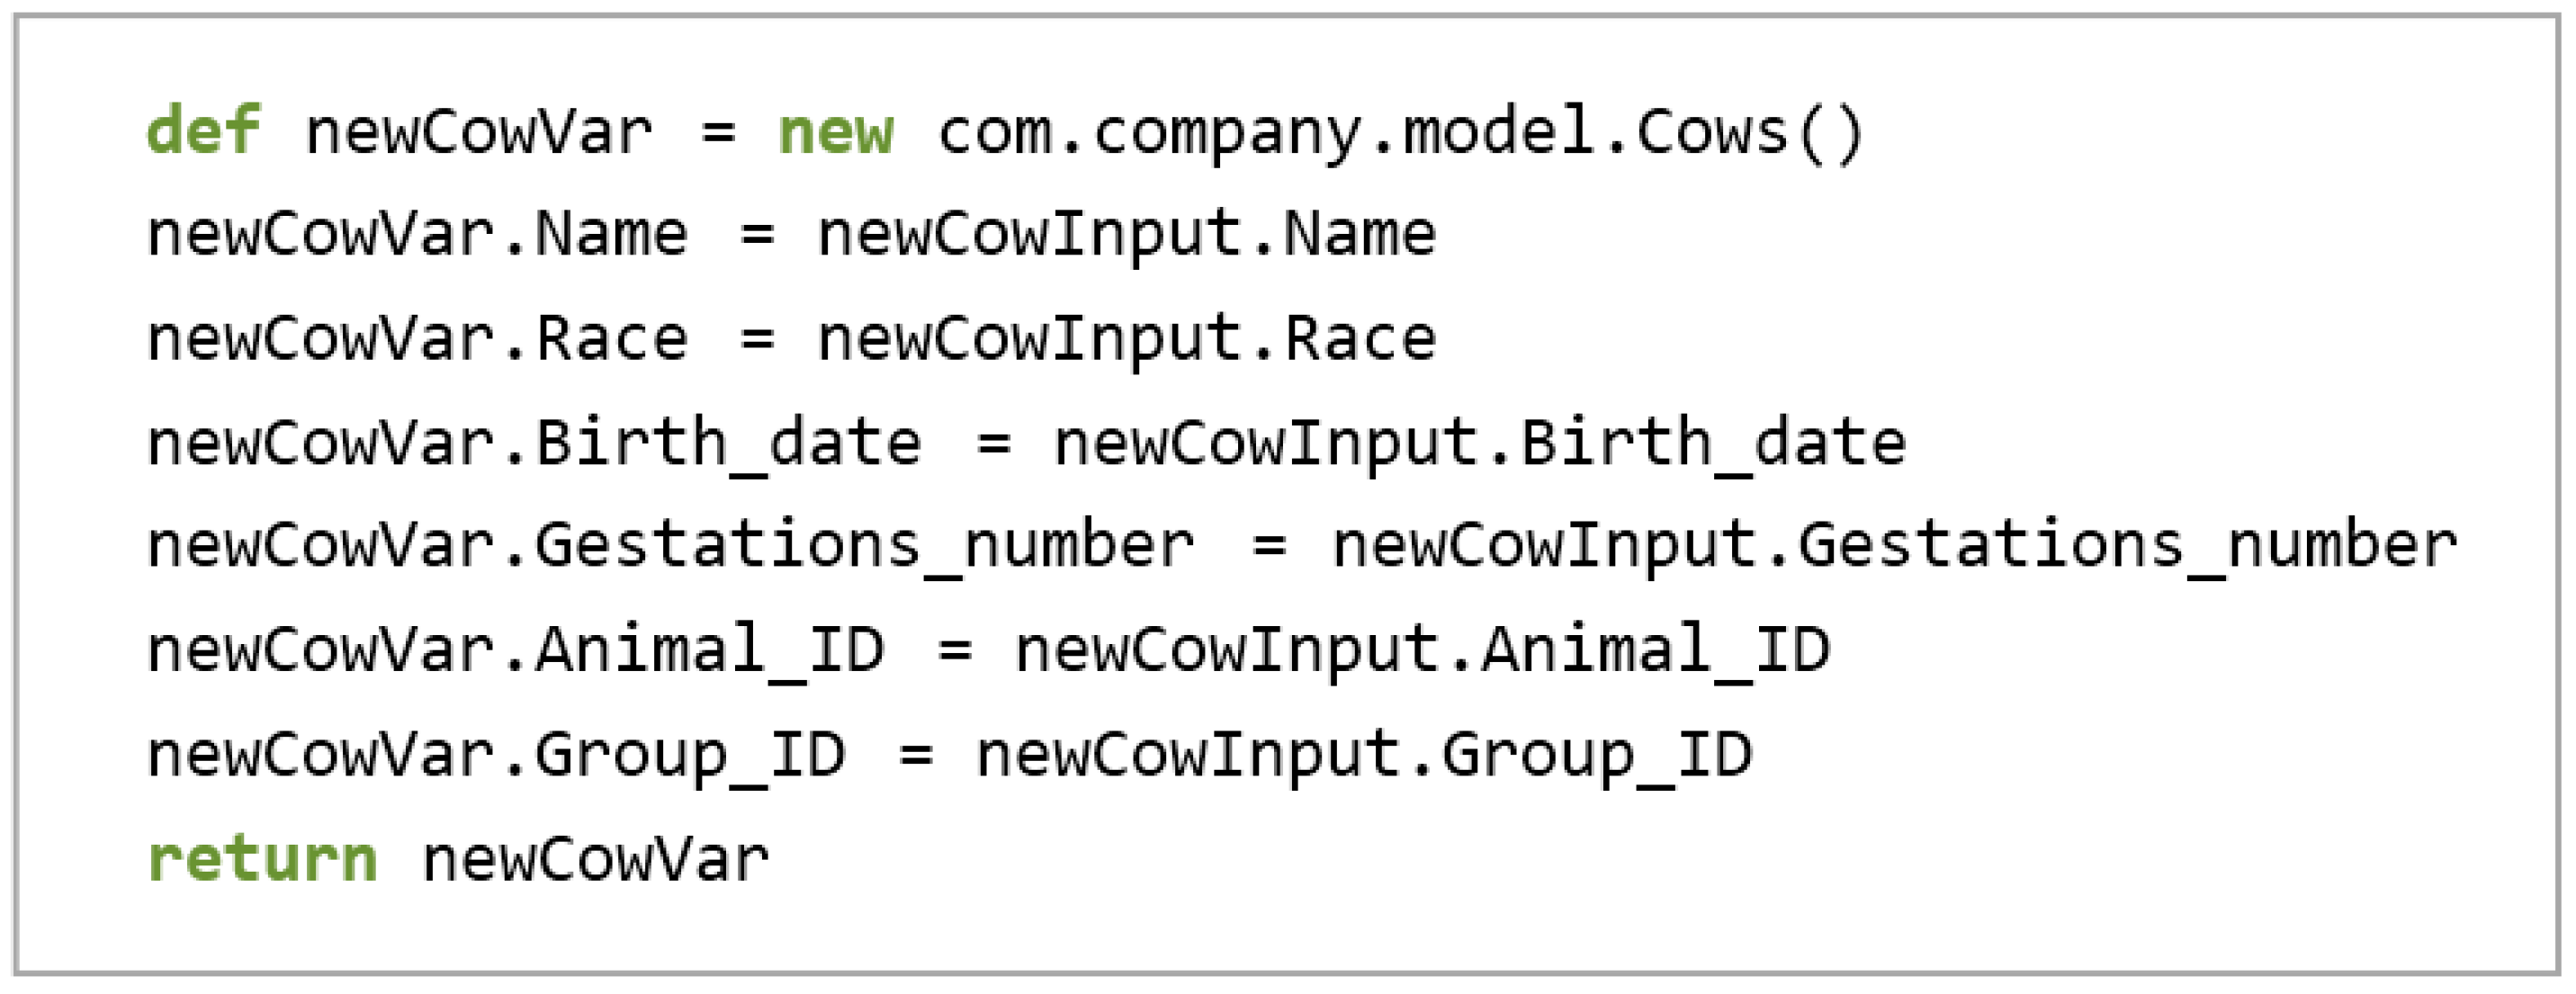
Figure 11, the business engine instantiates a process when a user selects a specific function of the O3-Farm application. An instantiation form is displayed on the screen of the user in order to collect the data. When the user pushes the button “Add”, the business processes engine starts the process. A new “business variable” is created, from a set of variables defined in the “business model”, and is initialized with the inputs received by the web-form. A dedicated Groovy script, like the one reported in
Figure 12, is used by the business processes engine to perform this activity. In a following step, the data are permanently stored in the database by an internal task performed by the business process engine. After this step, the business processes engine closes the process instance without the need for other user’ activities.
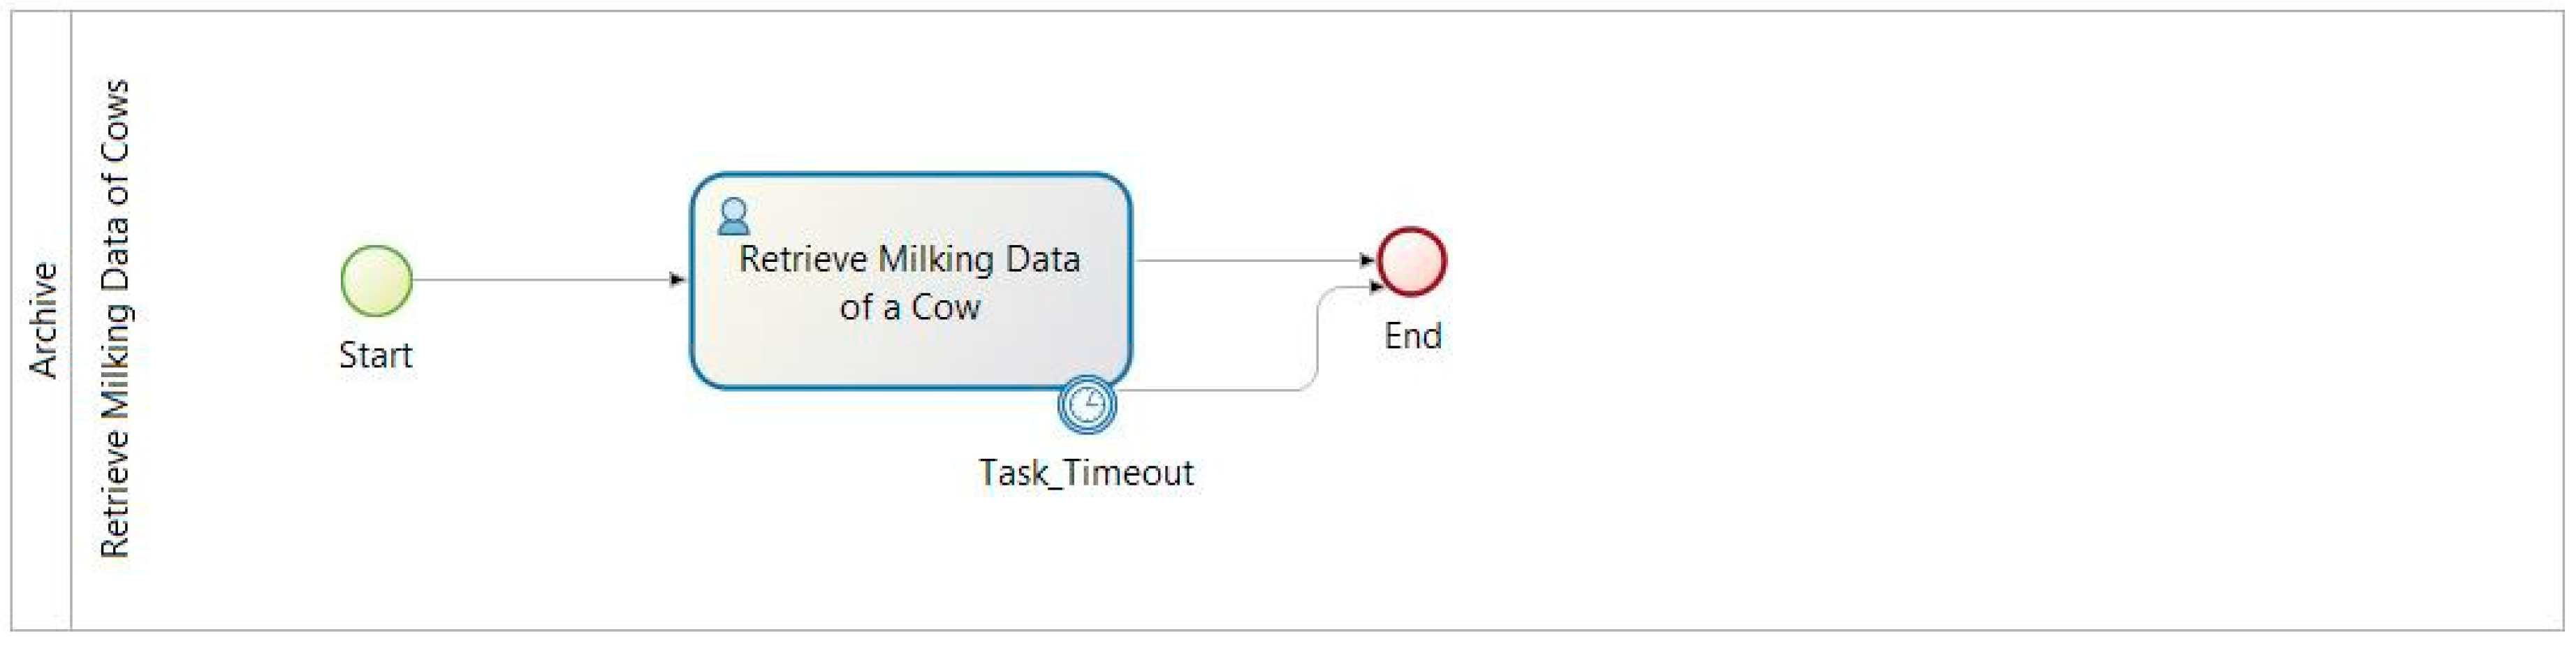
A different business process, adopted in the O3-Farm application, is shown in
Figure 13. This kind of process is used when a user of the group “managers” must retrieve a set of data from the database. The process starts through the submission of inputs collected by an instantiation form, filled by the user. These inputs are parameters used to build a query for the database. The “human task” is used to display the query result and catch the subsequent user actions (i.e., to make another query or to close a “case”). However, on the boundary of the human task, a “timer event” is provided. This timer is a “task timeout” that can close the human task if an action has not been selected by the user. In this way, any instance of the process can be closed after a reasonable interval of time.
The software activities required by the business process of
Figure 13 are described also in the activity diagram of
Figure 14. As shown in the diagram, when a farm manager selects this kind of function, from the web page of the software application, the corresponding process is instantiated by the business processes engine. An instantiation form is displayed on the screen of the user in order to collect data necessary to build the database query. When the user pushes the button “Submit”, the business processes engine starts the process and retrieves the required data through a dedicated database connector. This connector is a software element that allows the process to read or write information from an external information system, like a database. Its configuration requires to define: the name of the Java Database Connectivity driver (JDBC) to use (org.h2.Driver—h2-1.3.170.jar), the JDBC Uniform Resource Locator (URL); and the name and password of the user that has the required privileges in the database to perform a query. The configuration of this specific connector adopts a dedicated query which Groovy scripts is reported in
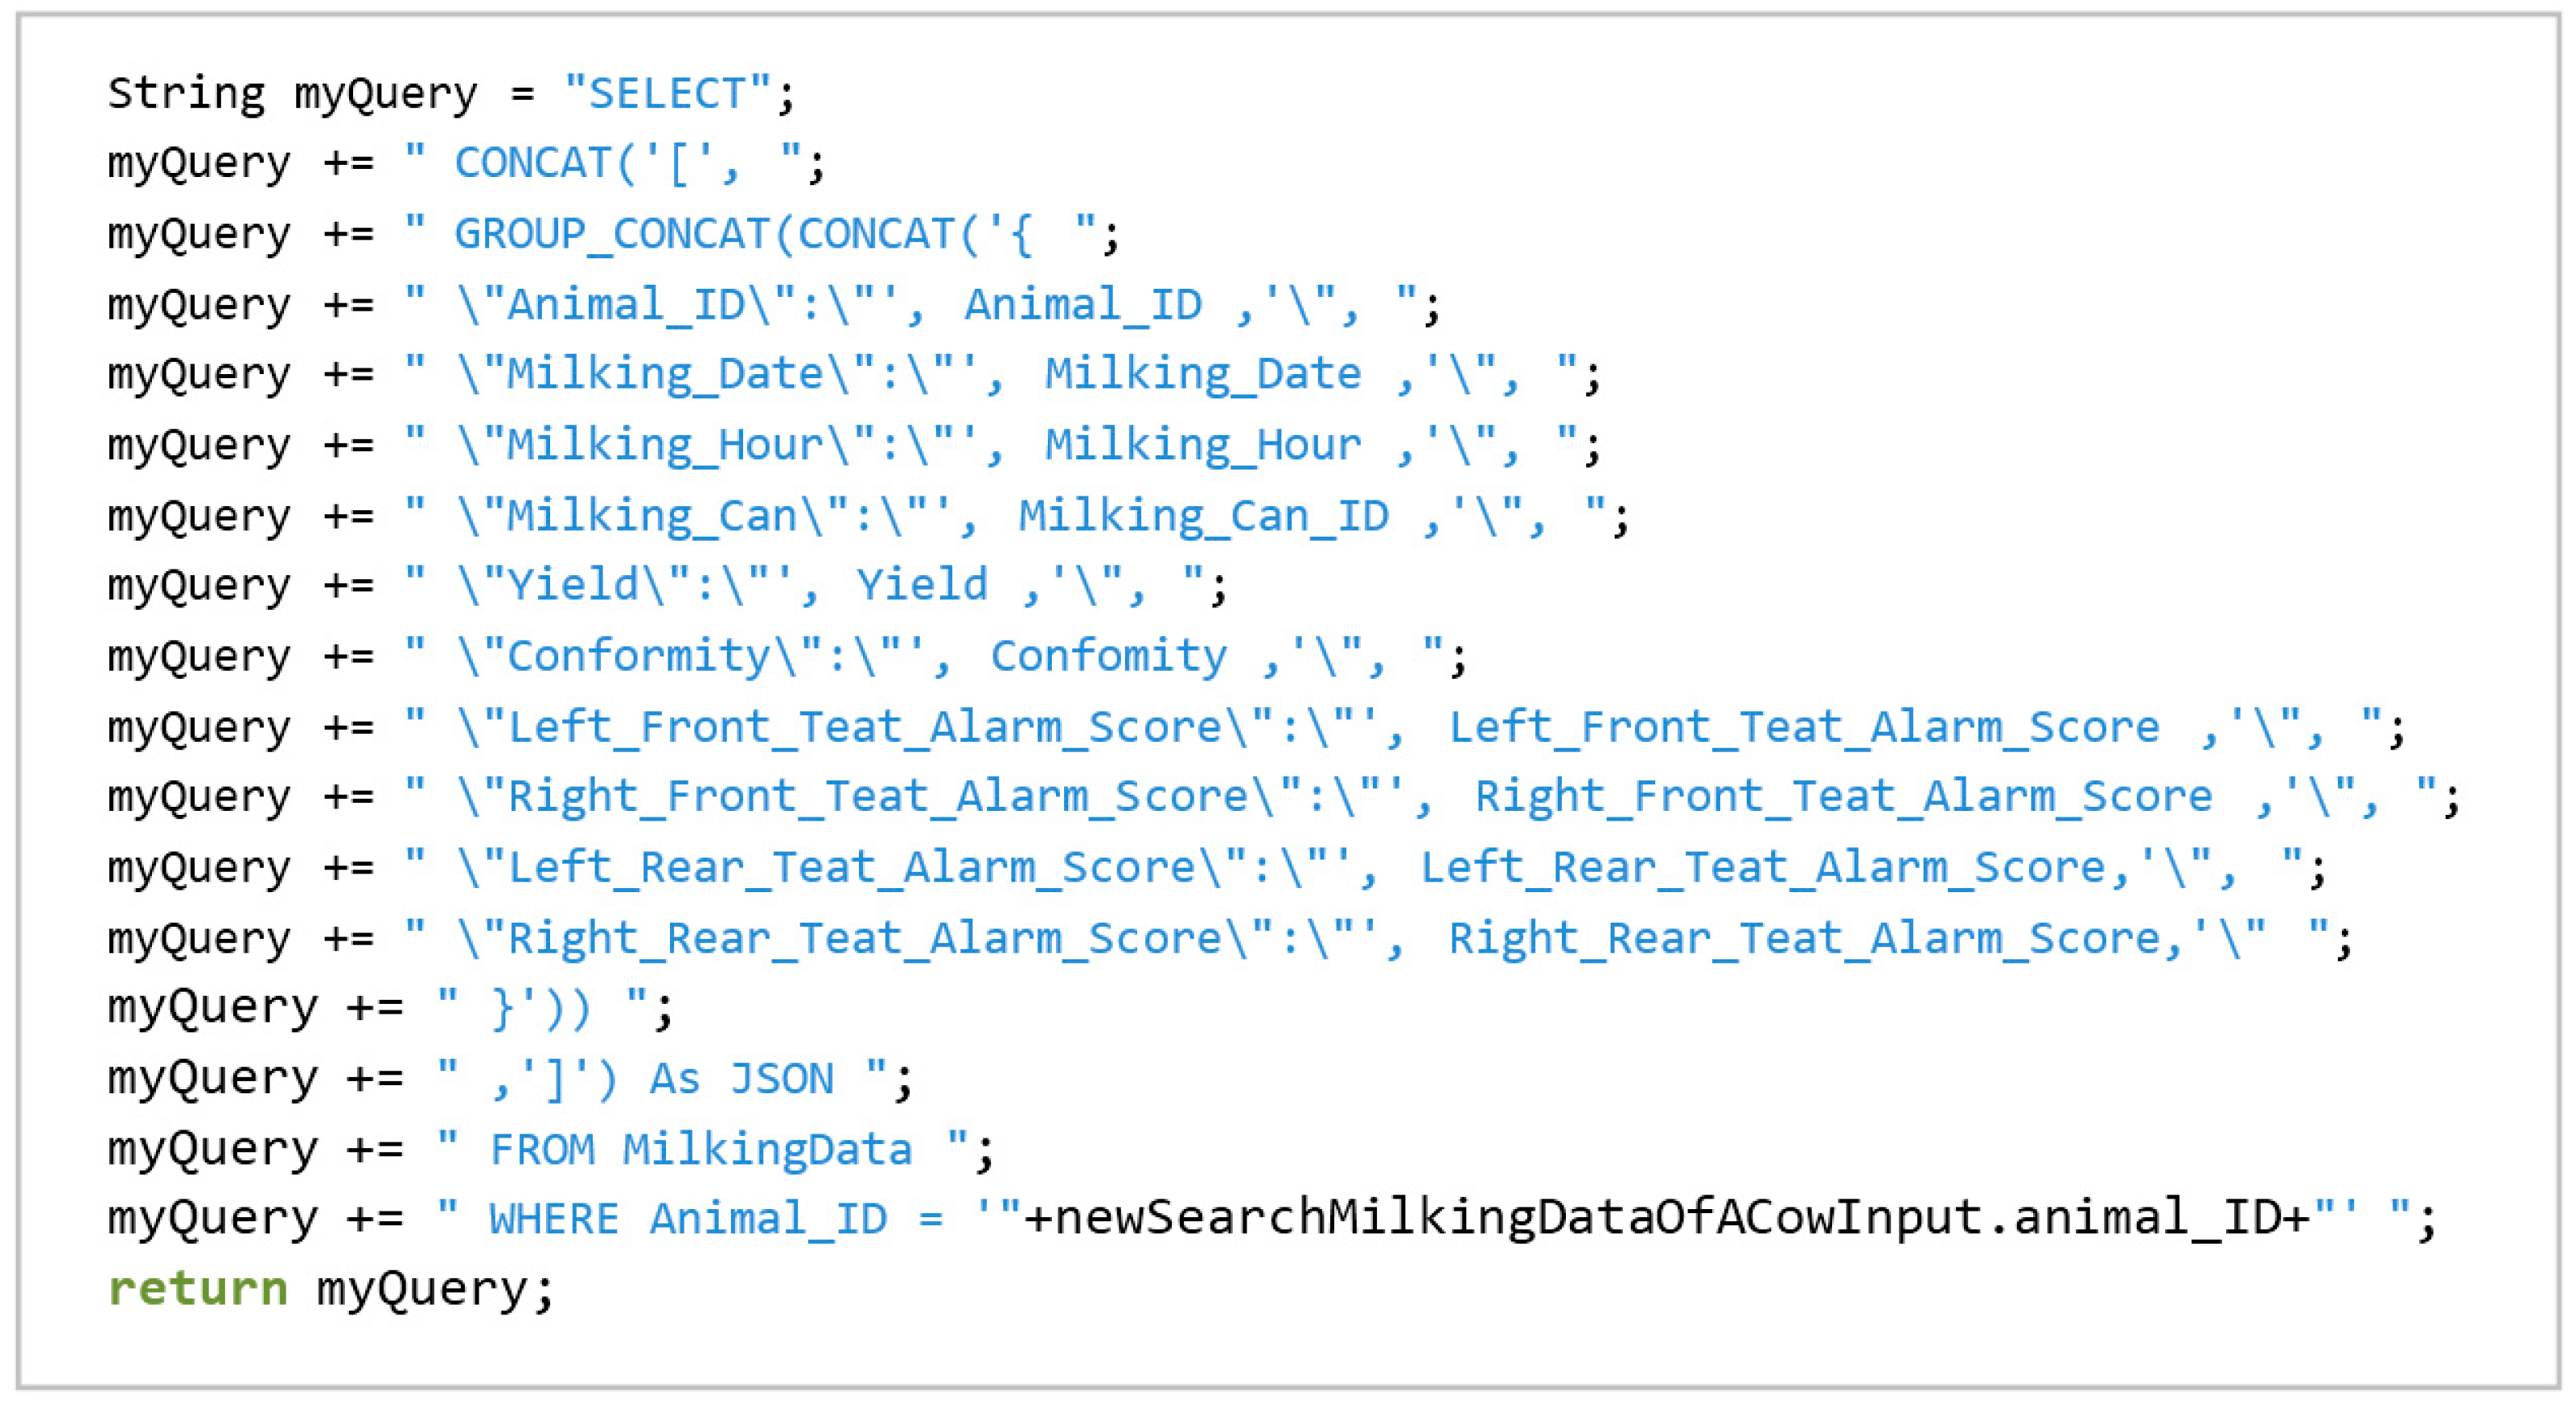
Figure 15. As it is shown in the figure, the result of the query is provided in a JavaScript object notation format (JSON) and it is returned as a java object “java.sql.ResultSet” to the business processes engine in order to be stored as a “process variable”. When the result of the database query is available at process level, the business processes engine uses it to display the information requested on the screen of the user. All these software activities are repeated every time that a user makes a query, generating a new “case” of the same process for each query performed. In the same time, each instance of the process (i.e., each “case”) is automatically closed by the business processes engine when a defined time is elapsed.
Another structure of the business process is shown in
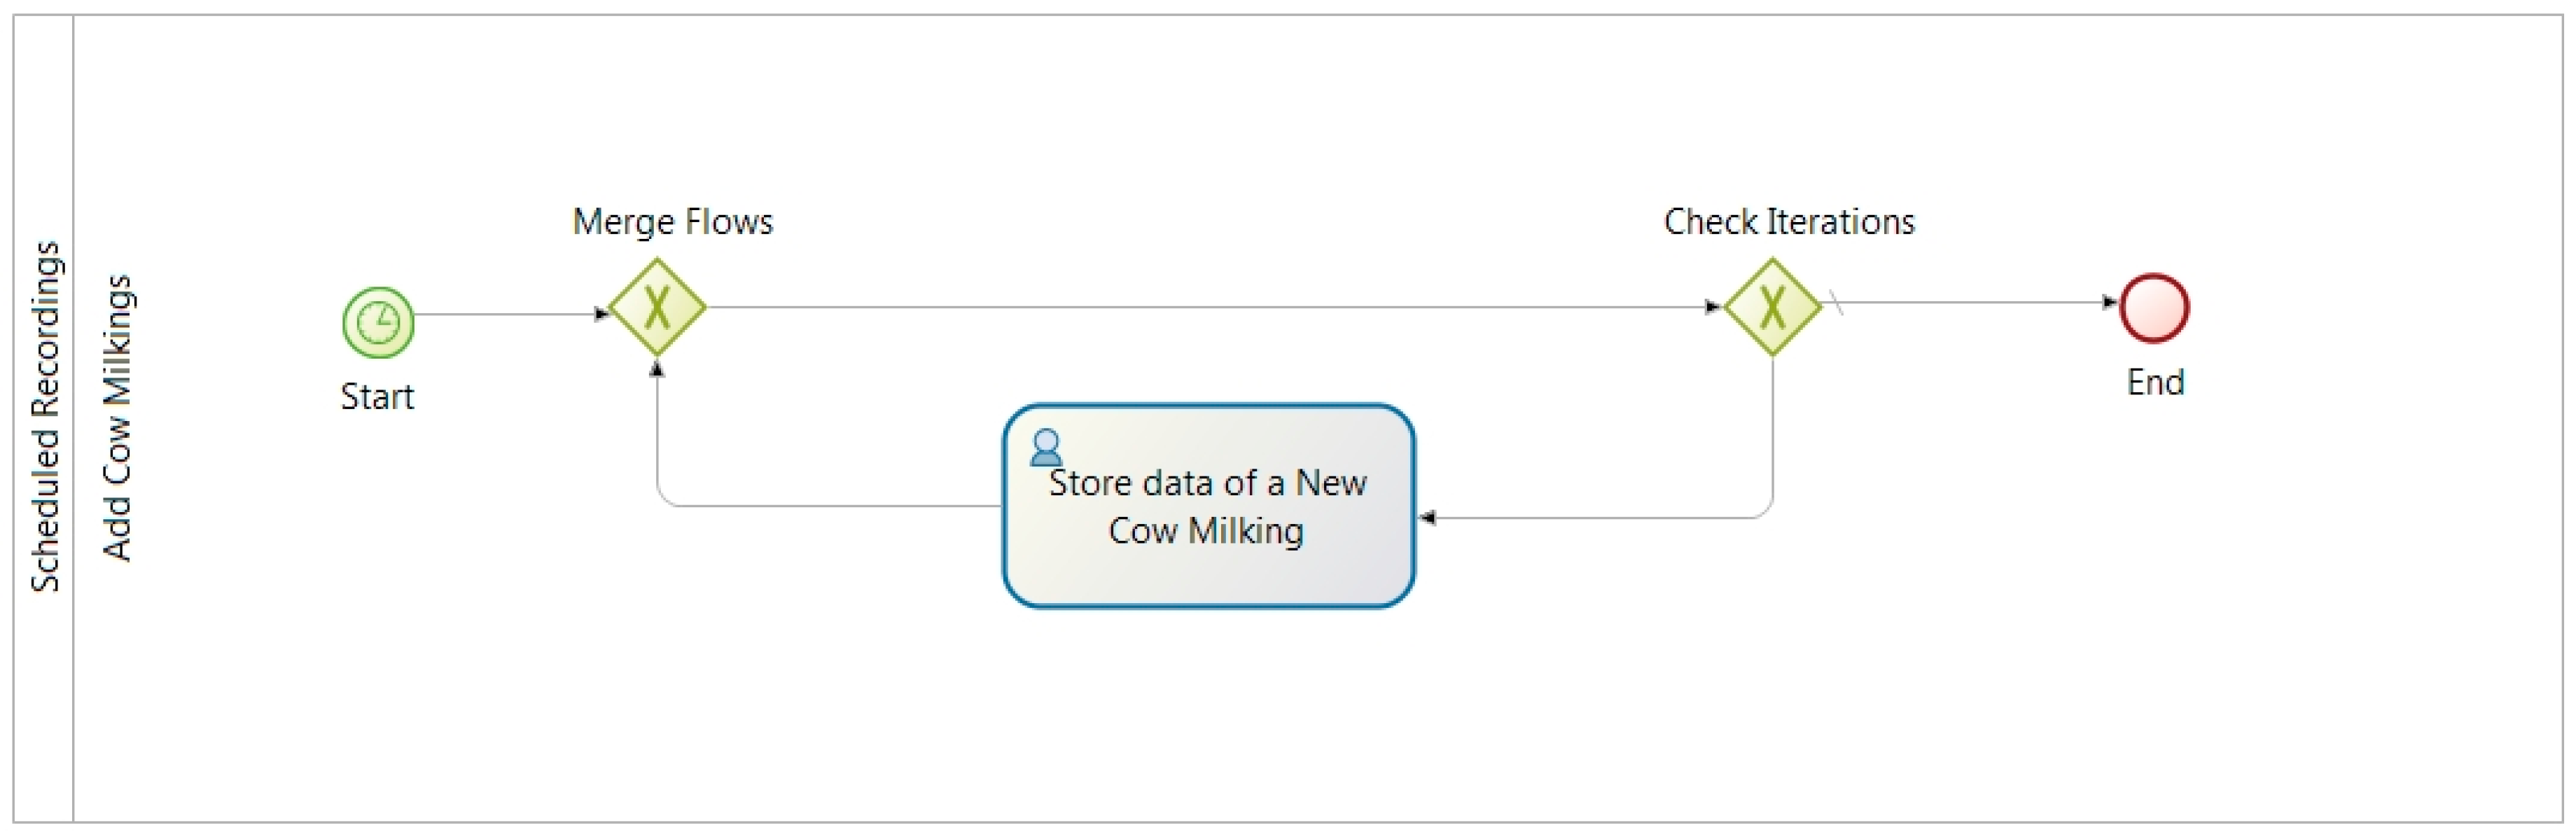
Figure 16. This process is used by the software application to store milking data after the end of a milking procedure. The start of this process is automatically provided by the system and scheduled two times a day, before each milking session. After the start of the process, the workflow is merged by an “exclusive” gateway and redirected to a gateway that makes a check on a condition imposed. This condition is set up at the beginning of the process considering the number of cows in the herd of the farm. When the number of iterations performed is lower than the herd size, the workflow reaches a human task: “Store data of a new cow milking”. With this task, a milker can record a set of milking data that belongs to a cow. At the same time, a process variable for the counting of performed iterations is updated. After this step, the workflow comes back to the first “exclusive” gateway, to be merged, and it is redirected to another gateway to check the exit condition. When the number of performed cycles are equal to the herd size (i.e., number of milking data sets = number of cows of the herd) the workflow uses the default flow provided by the gateway “Check iteration”. As a result, the process ends.
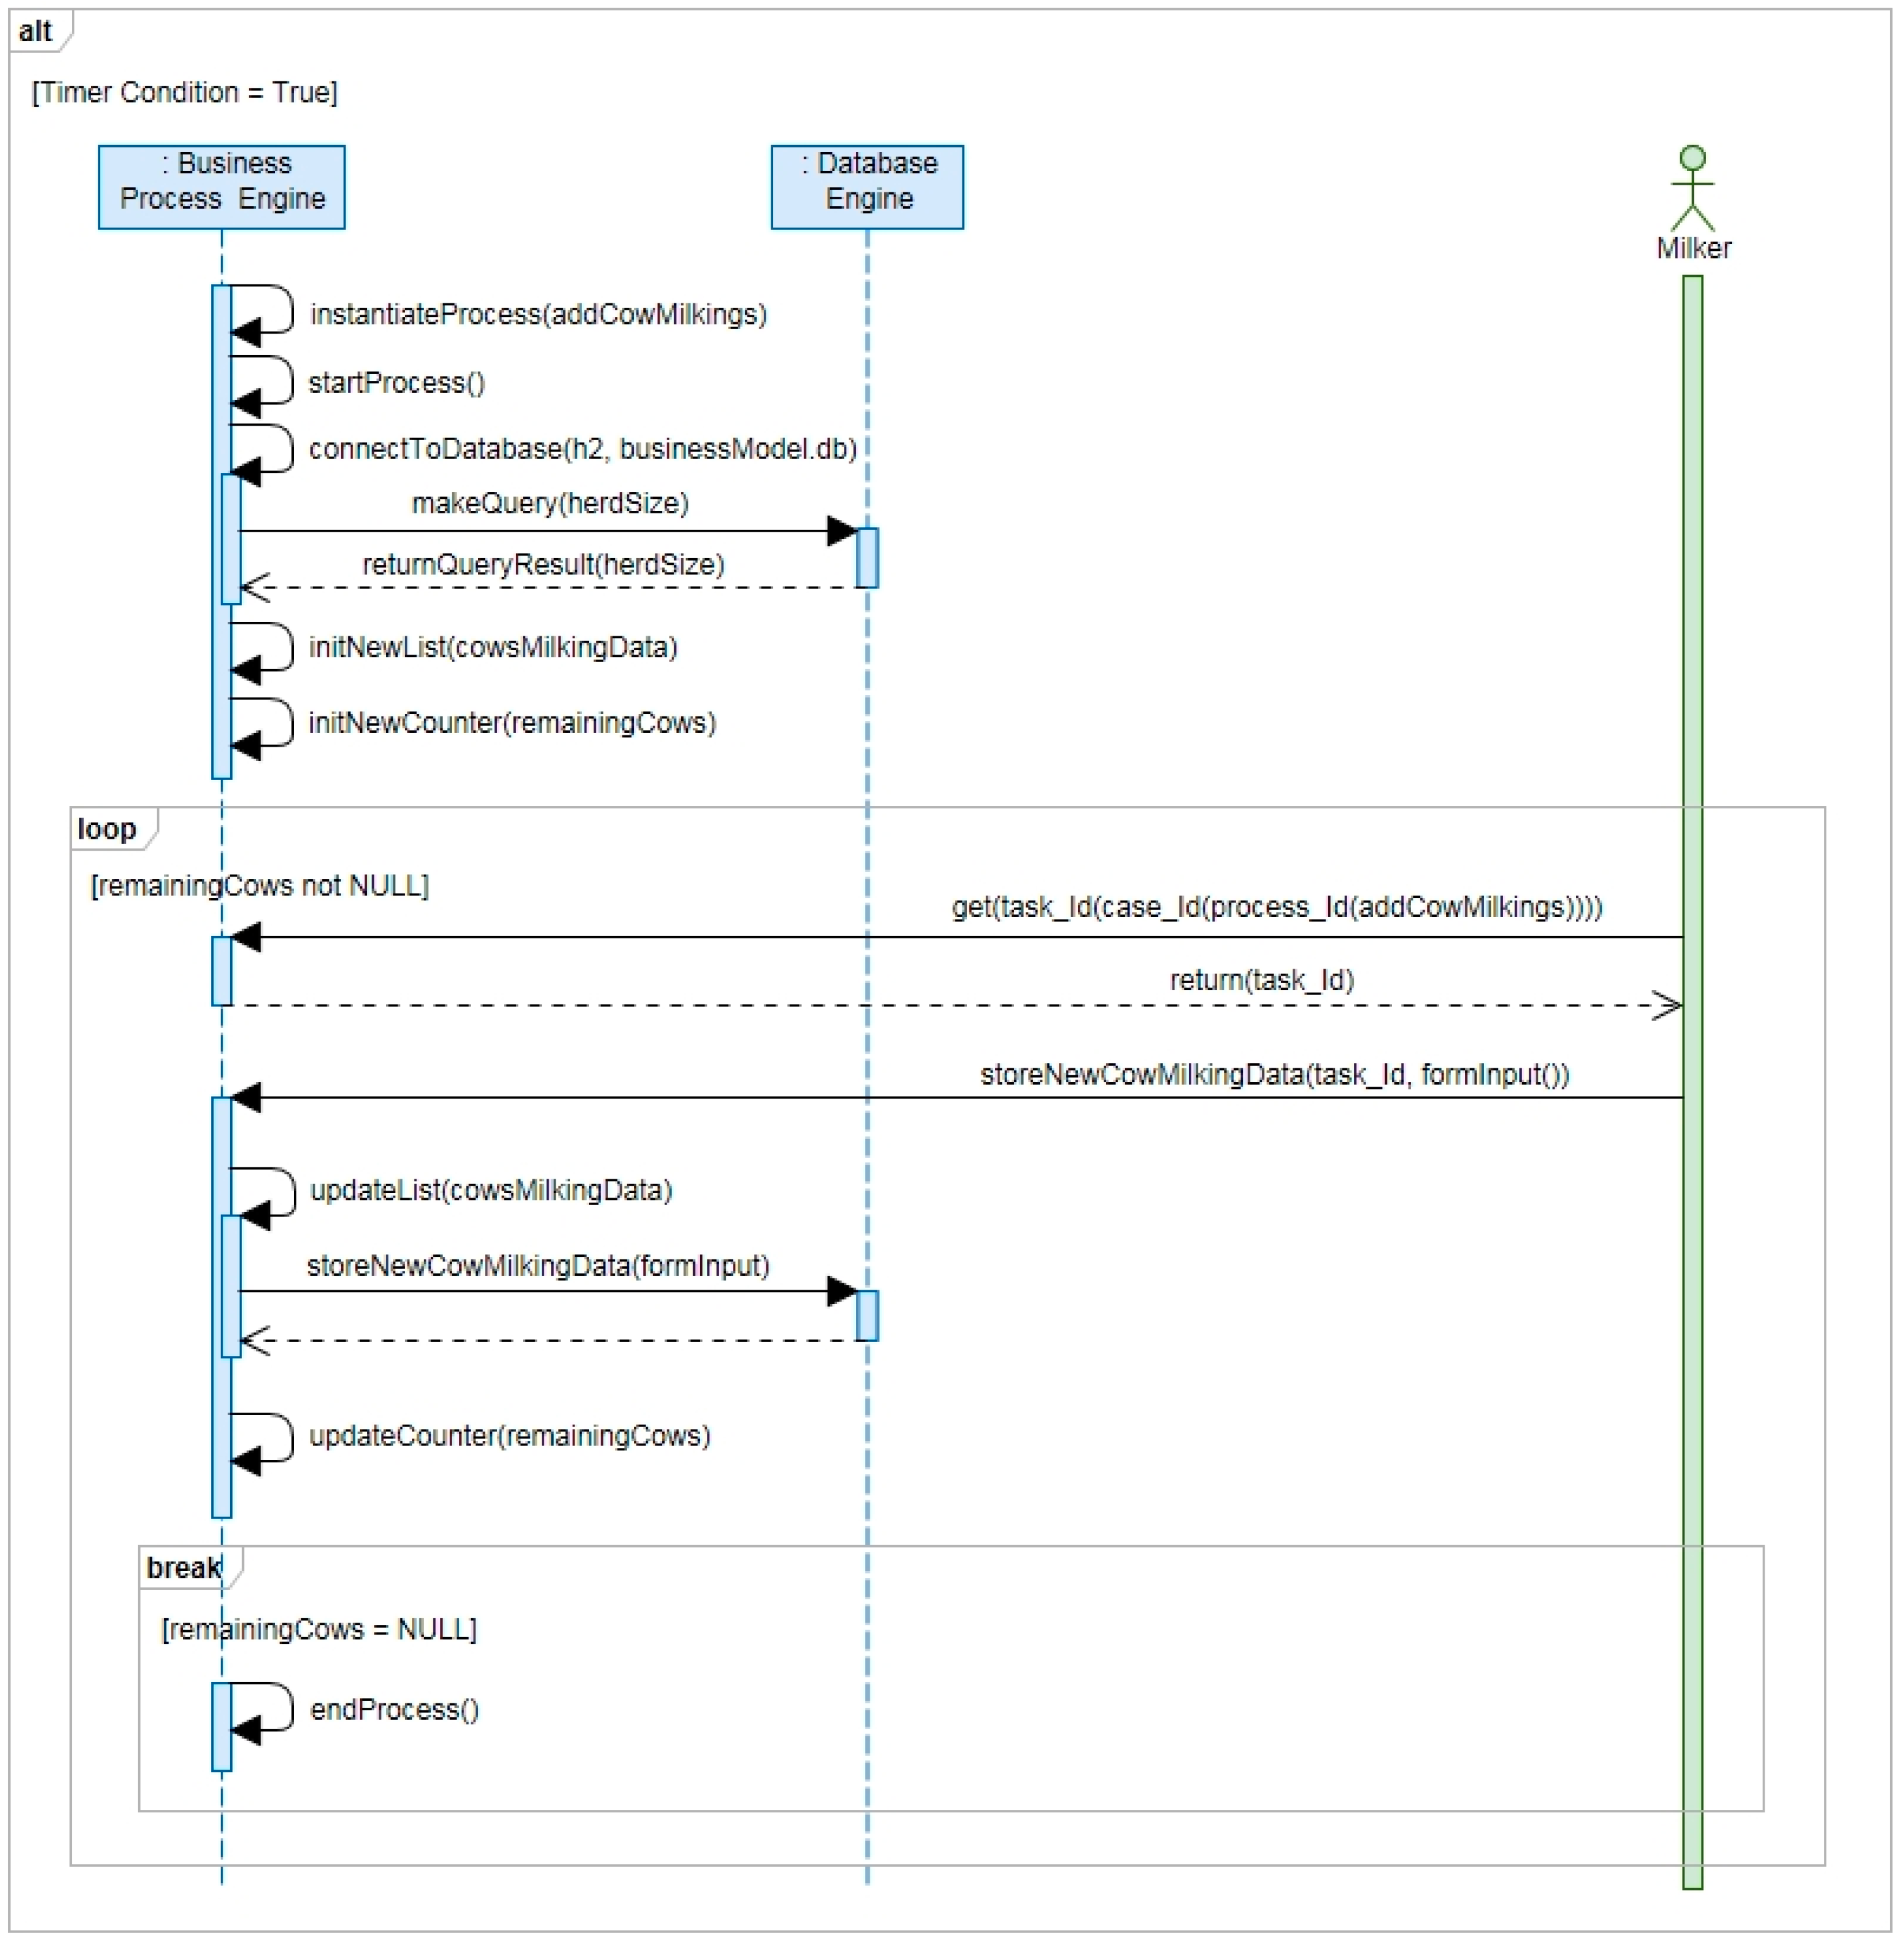
Activities required by this business process are described also in the activity diagram of
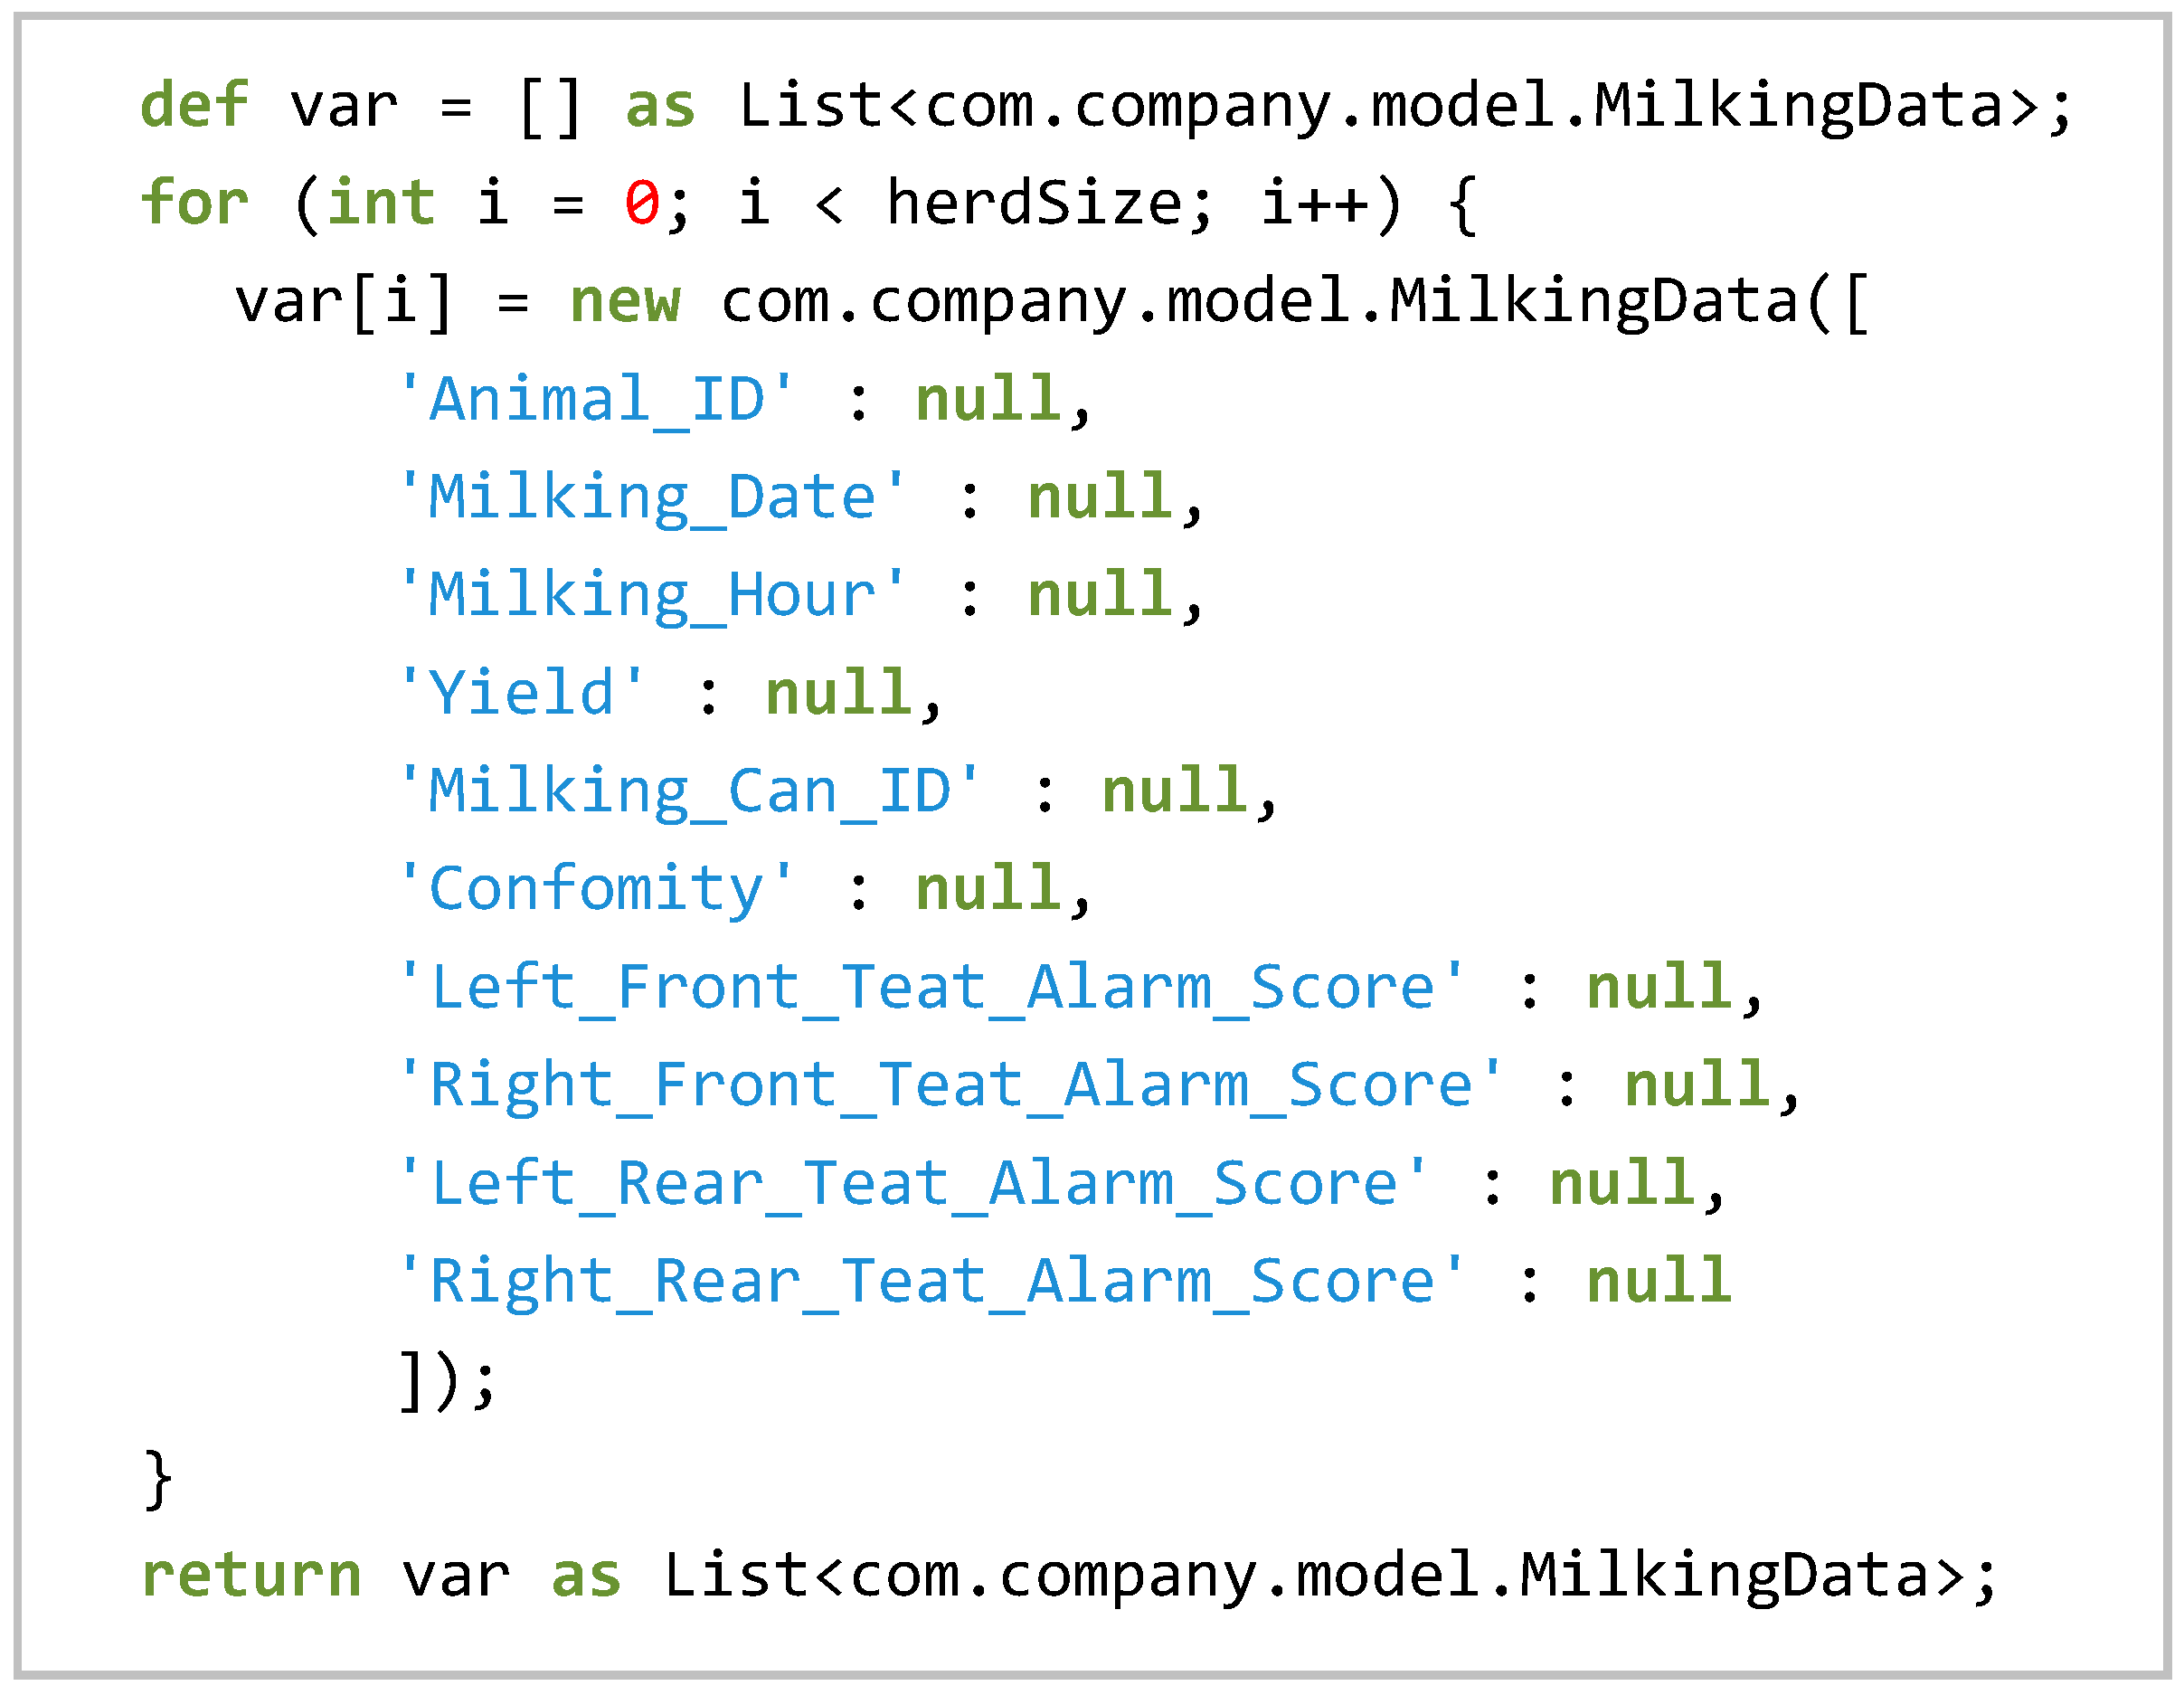
Figure 17. As shown in the diagram, the process (“Add milking data”) is automatically instantiated (and started) by the business processes engine when a temporal condition is verified (i.e., two times a day before the start of milking procedures). To each case (i.e., an instance of a process), an incremental ID is assigned following the order of instantiation. When each process starts, the business processes engine retrieves the required data (i.e., the herd size) through a dedicated database connector. The same parameters, reported above, are used to configure this software connector. The query built, instead, is different because it has a different target: to return and count the number of records stored in a specific database table (called “Cows”). When the result of the database query is available at process level, two variables are created and initialized: a process variable called “remainingCows” and a business variable “cowsMilkingData” defined as a list of business objects “MilkingData”. The Groovy script for the initialization of this business variable is reported in
Figure 18. When a milker accesses the application to insert milking data, the web page displayed on the screen uses a sequence of calls to specific representational state transfer (REST) application programming interfaces (API). Through these calls, executed over the HTTP protocol, the software application can access to the process workflow and retrieve the process ID (knowing its name), the case ID (from a list of open cases that belong to a process characterized by a specific ID), and a task ID (from a list of pending tasks that belong to the same case, of a defined process, that have been assigned to a specific user, or group of users). When all these data are retrieved, the user can send to the business processes engine a set of new milking data. This sequence of activities are performed, by the software application, until some milking data are missing. When milking data of all cows of the herd have been stored in the database (i.e., the process variable “remainingCow” is equal to zero), the corresponding case is automatically closed.
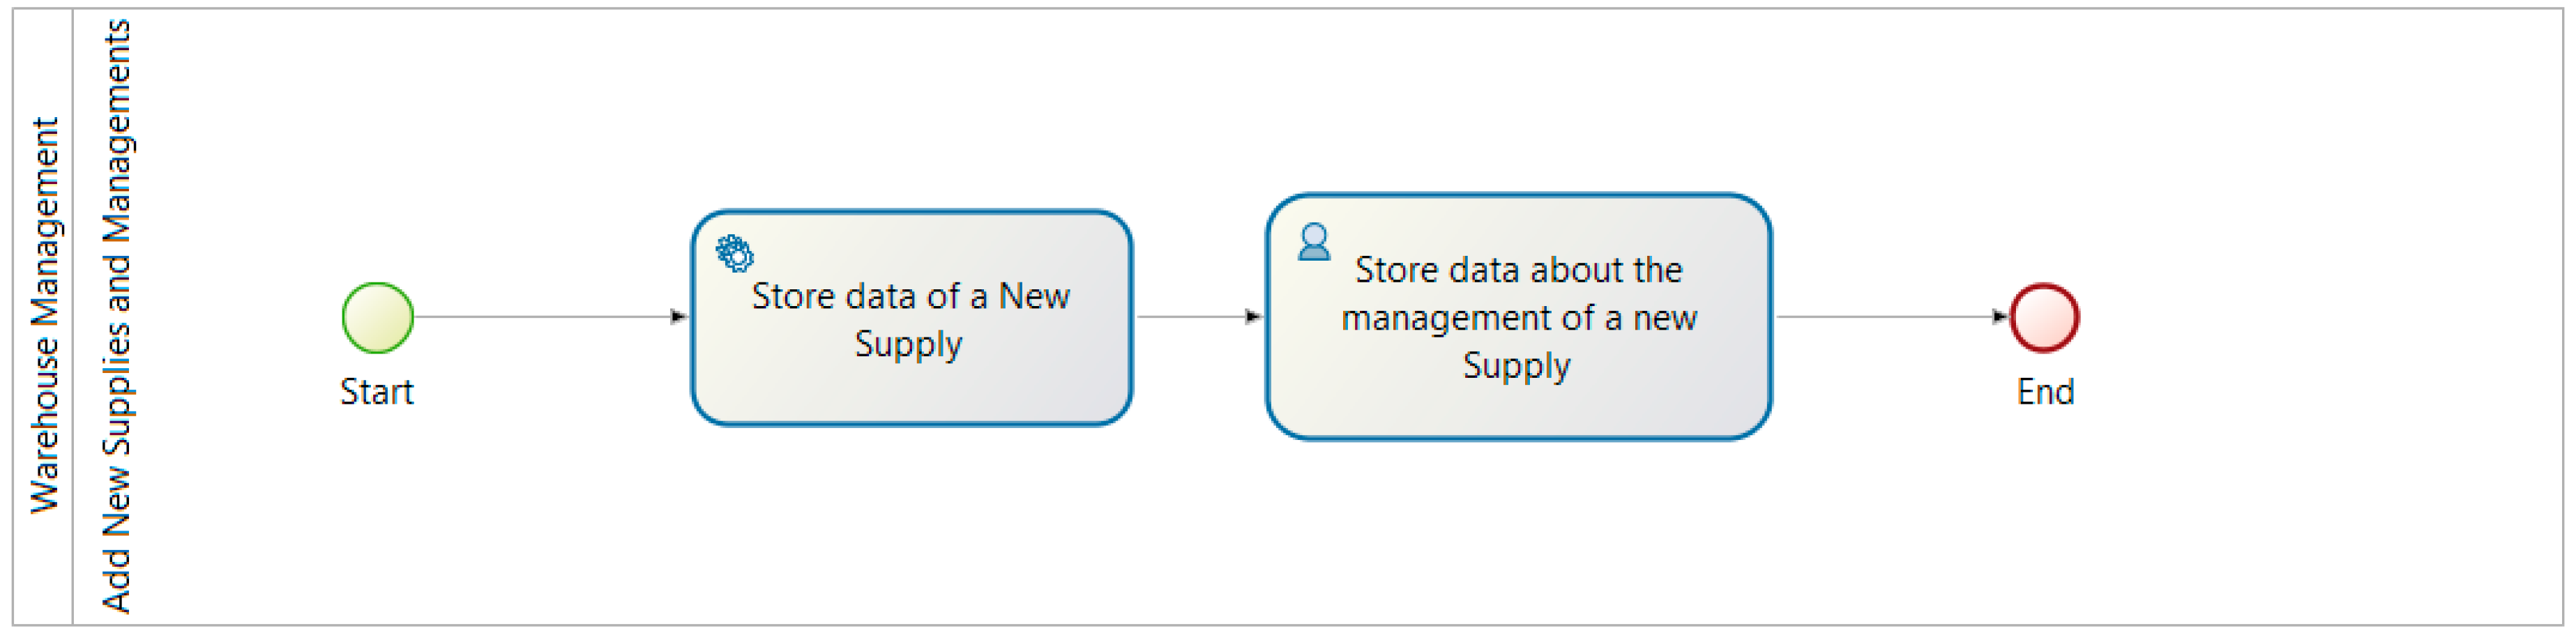
Figure 19 shows a business process that requires the collaboration of users from different groups. The O3-Farm application uses this process to manage the warehousing of a new supply. The process starts when a manager submits a set of inputs by a dedicated instantiation form. The first task of the process is a “service task” that stores the submitted data. The workflow continues with a “human task” assigned to a user of the group “employees”. With this task, an employee of the farm can record in the software application which is the sector warehouse where the supply has been stored. When this task is carried out, the process can be concluded.
Activities performed by this business process are reported also in the activity diagram of
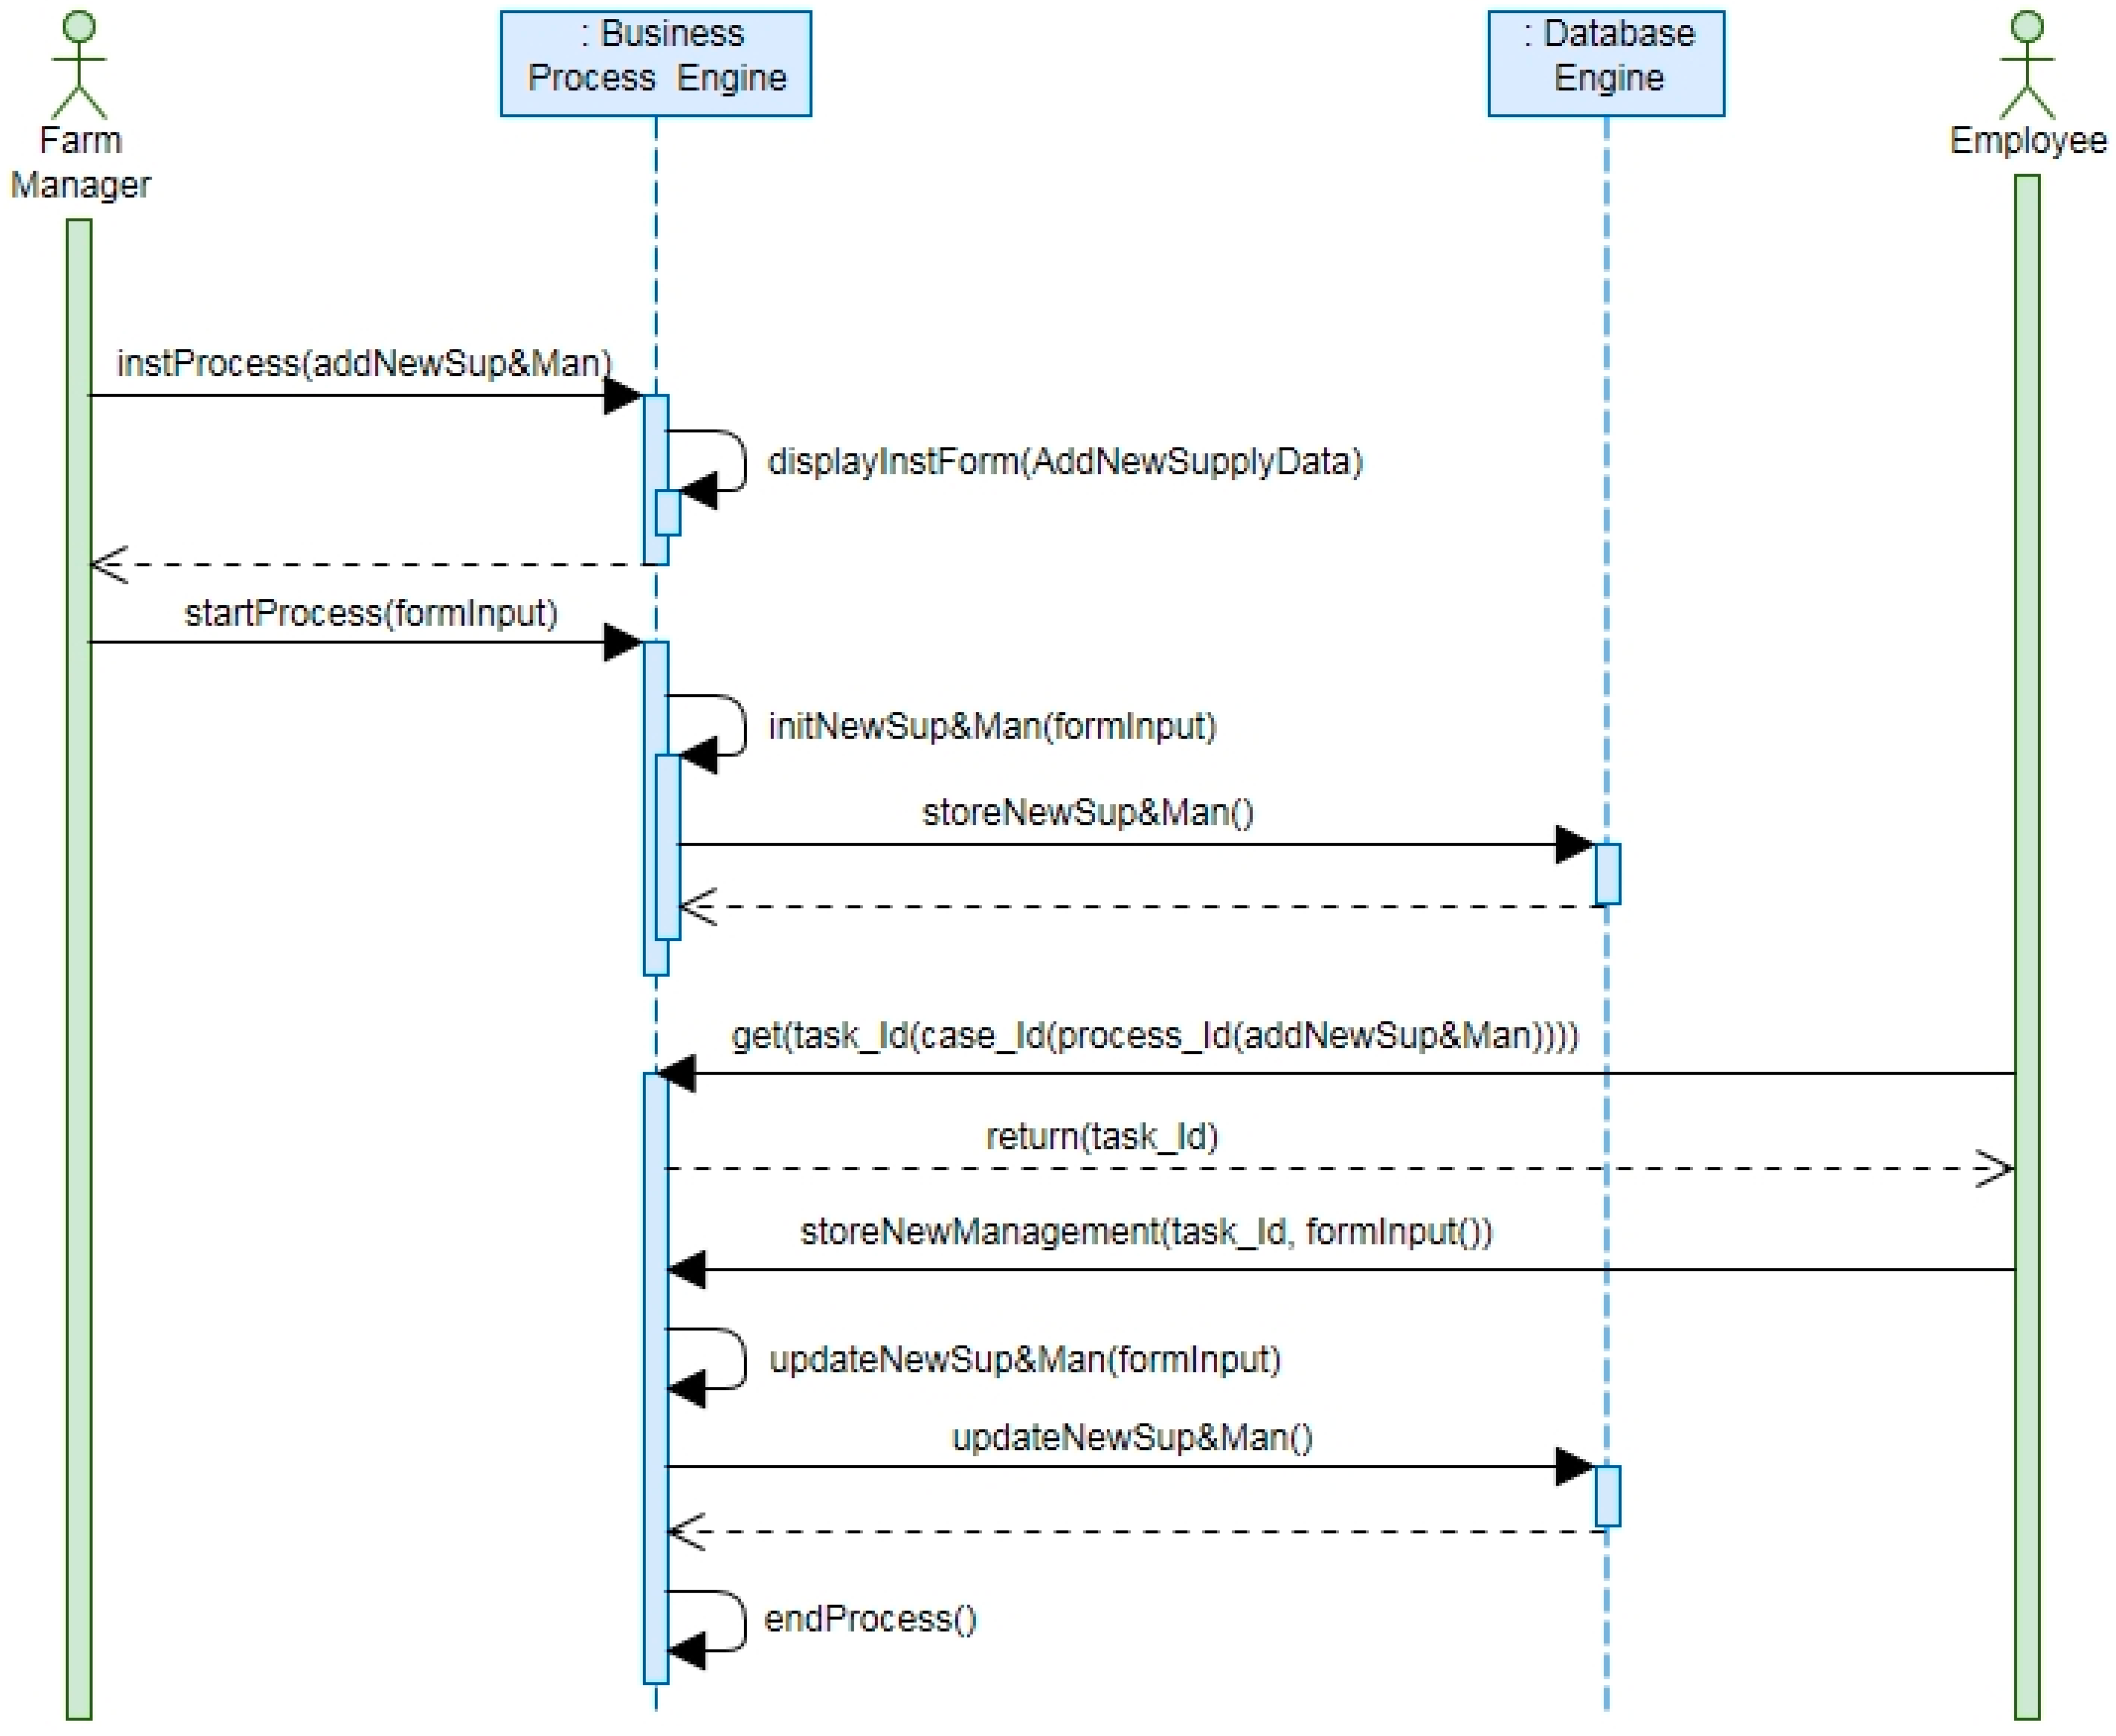
Figure 20. As shown by the diagram, the process (“Warehouse Management”) requires an asynchronous collaboration of two users of different groups (managers and employees). A new case of the process is opened by a manager when he/she submits a set of inputs (related to a new supply of a food). When a case is opened, a new task is created and assigned to a user that has, in the organization, the role of “employee”. To execute its task, the employee must retrieve the corresponding ID from the business processes engine. This activity is automatically performed by the web page displayed on its screen using a sequence of REST APIs provided by the business processes engine over the HTTP protocol. When these data are retrieved from the system, the employee can store a set of new data and, therefore, this allows the business processes engine to close the corresponding instance of the process.
3.4. Database Layout
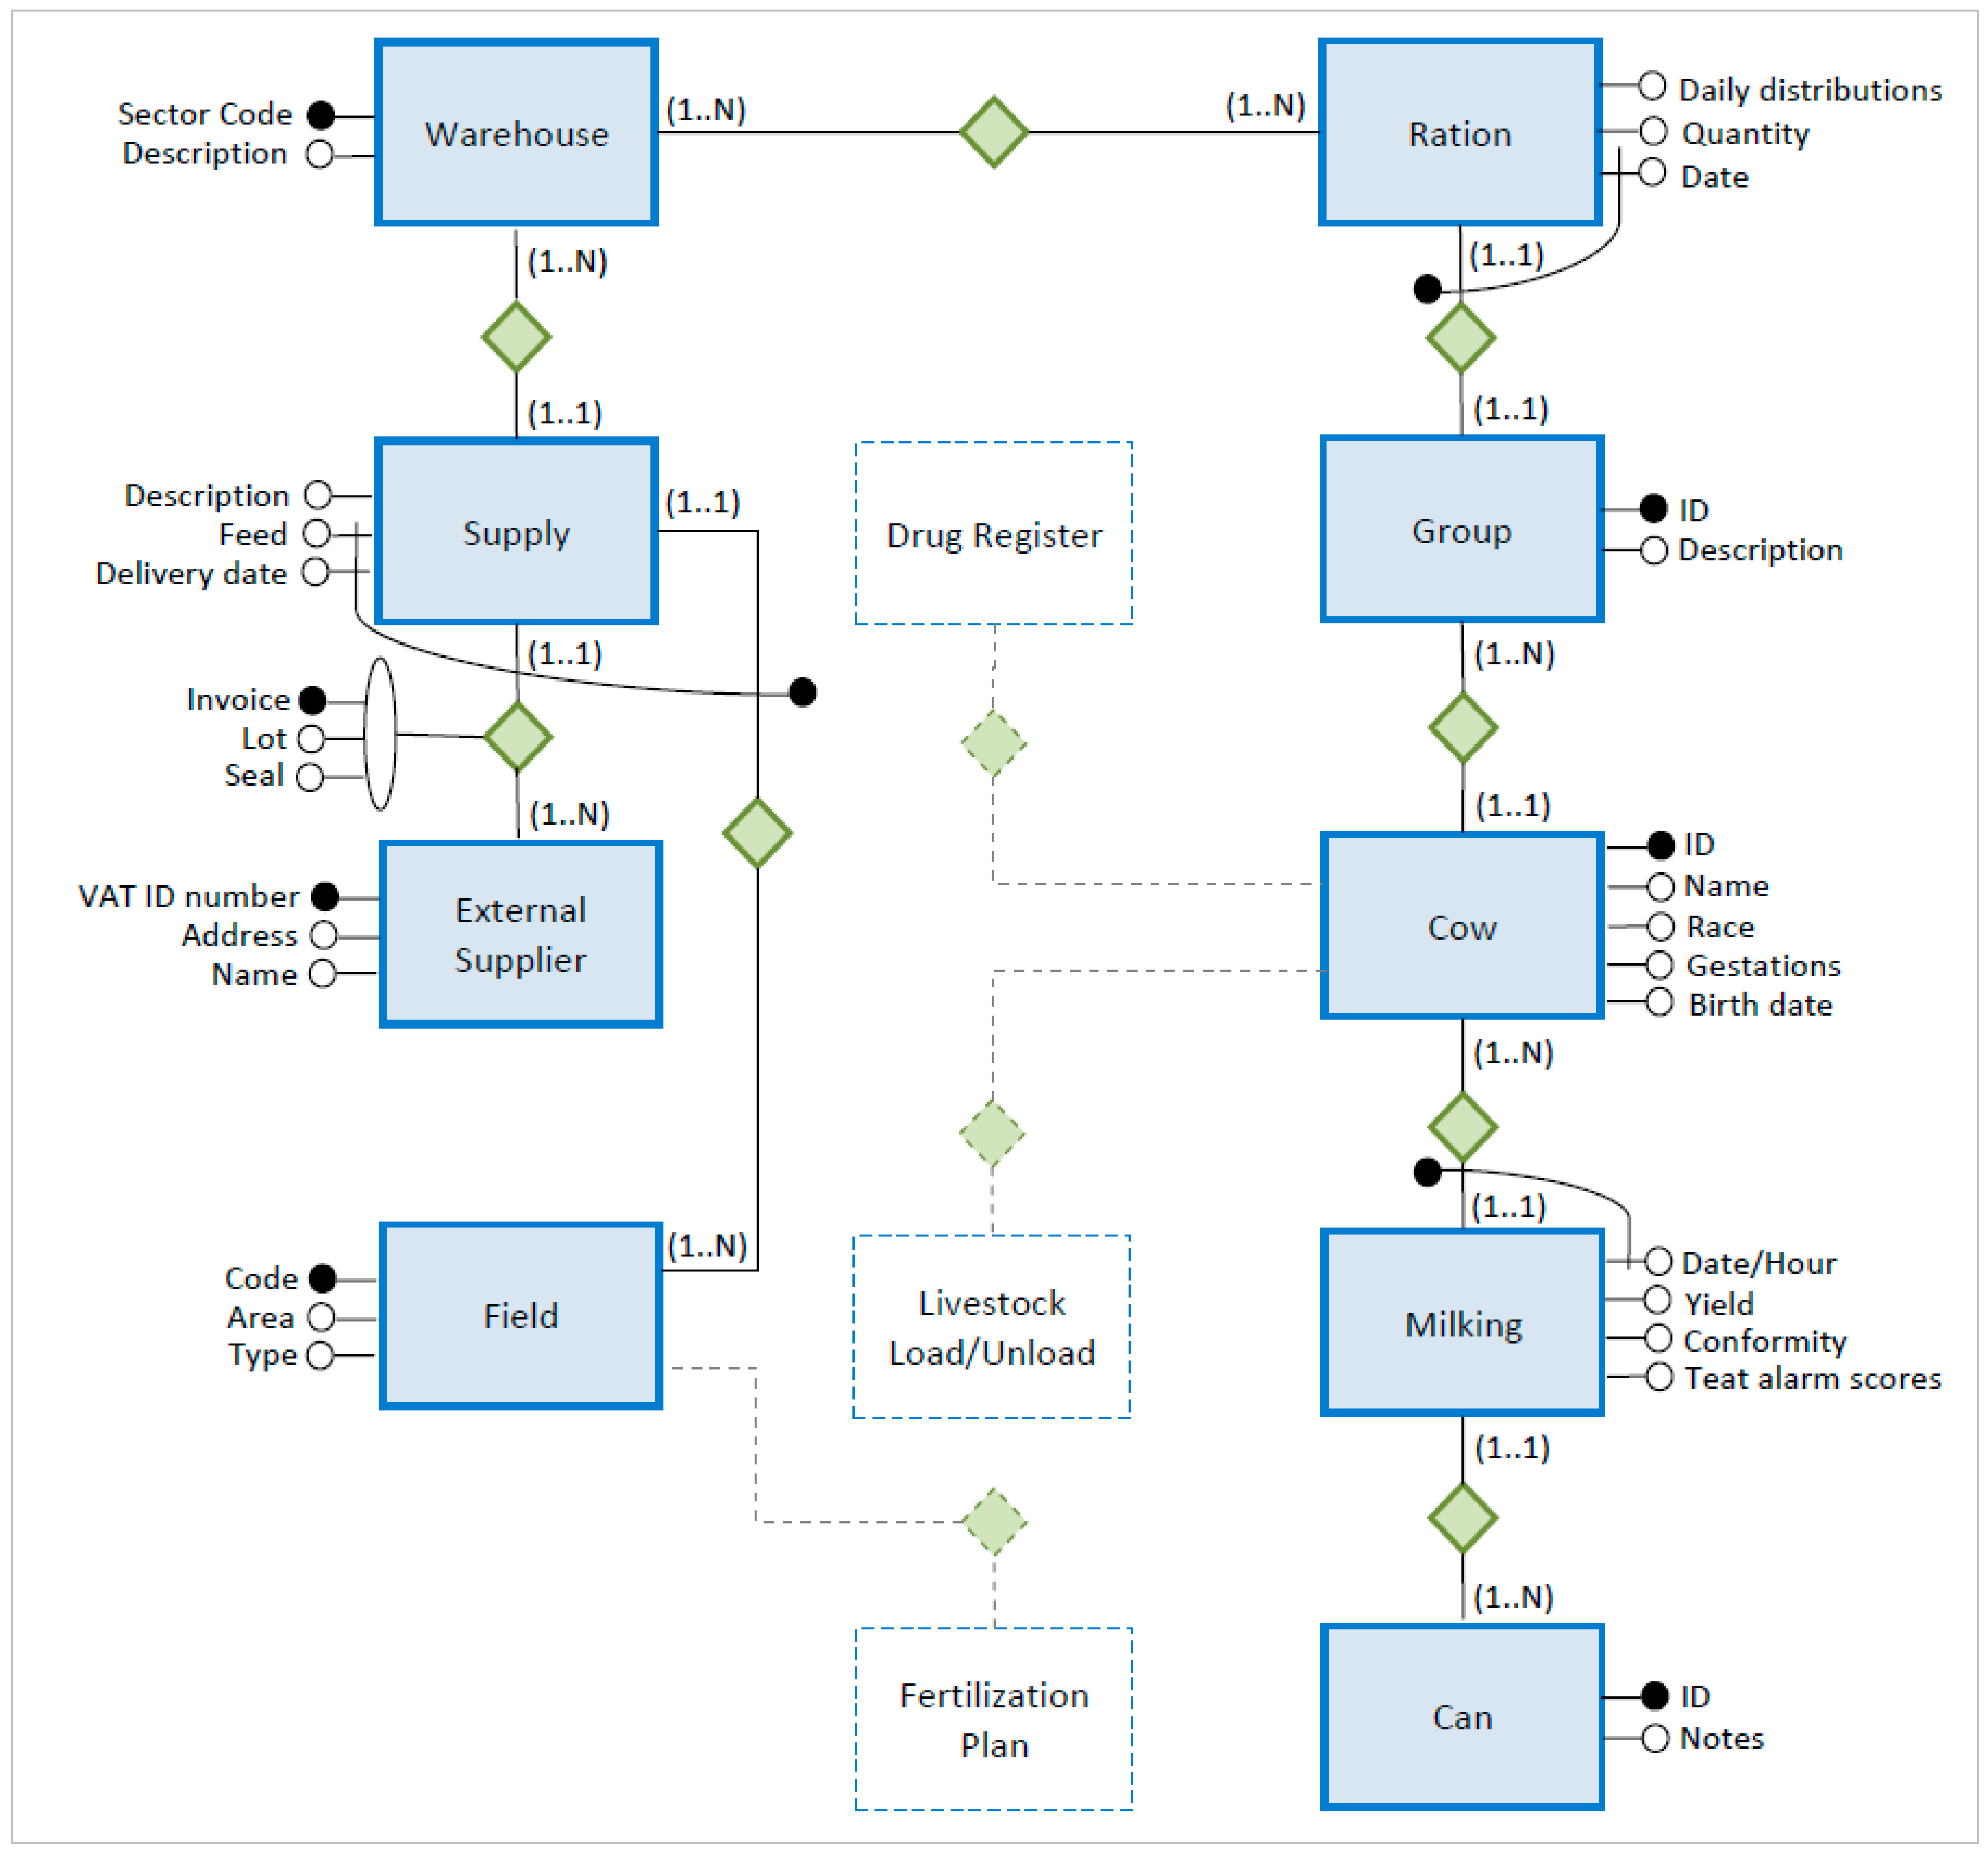
The database layout, used in the O3-Farm application, can be described by the entity-relationship diagram (ERD) reported in
Figure 21. In the diagram: rectangles show the entities of the model. Rhombuses describe the relationships between entities and small circles display the attributes of entities or relationships. Numbers surrounded by round brackets describe the cardinality of relationships between entities, and black colored circles show the primary keys of the database.
The ERD explains how the database provides the traceability between the supplies that enter in the farm and what can be an output, namely, a can of milk. This is the smallest lot of milk that can be identified. It is modeled as an instance of the entity “Can” that has a one-to-many relationship with the entity “Milking” in order to collect data about the milk yields that were used to fill it. Each instance of the entity “Milking” has a one-to-one relationship with instances of the entities: “Cow”, “Group” and “Ration”. With this data structure, each milk yield can be linked to the supplies used to feed the cows that were milked. With the entities “External Supplier” and “Field”, the database can store information about the suppliers and by their relationships with the entity “Supply”, it is able to connect them to the farm outputs.
The ERD also shows, with dotted lines, possible relationships with external data sources that are generally available because they are requested by law or national regulations. Many times, they are paper registers that cannot be integrated with a software application. However, linking them to the data structure of the O3-Farm, full management of the farm could be achieved.
On the basis of the data structure shown in
Figure 21, a business data model has been developed and used in the O3-Farm software application.
3.5. Software Tools Used
The O3-Farm application has been developed using the Bonita BPM software tool. The “Community” edition is open source and provides many tools for the development of BPM applications, such as: the “Studio”, the “User Interface (UI) Designer” and the “Portal”.
The Studio is the main tool for the development of business processes. It allows a complete business process to be designed by a graphical user interface. This tool permits the business data model of the whole project to be created and each business process to be set up defining: (1) its process variables, in terms of “Pool” or “Local” variables (i.e., with a task level scope); (2) inputs from users; (3) operations to perform on process variables during a case execution (basically through Java methods or Groovy scripts); (4) connectors to external resources (such as databases, ERP, SOAP web services, messaging systems, CMS, etc.) that can be used at the beginning or conclusion of a case; (5) who can initiate a process and/or perform specific tasks in terms of group of users or subset of filtered actors. Furthermore, the Studio allows the process to be validated and deploy to the “Processes Engine”.
The UI Designer, instead, is a tool for the development of web content. It is basically used for the design of custom pages and forms. It has a graphical user interface that allows developers to build contents using common web elements, such as: input fields, selects, checkboxes, buttons, links, text areas, tables, containers, etc. The tool permits to define variables, with a scope in the custom page or form, that can be used to handle business data (of processes, cases or specific tasks) or to contain structural information that determines how the web elements have to behave. Available types, for these variables, are: strings and JSON for static variables; REST API, JavaScript expressions, and URL parameters, for dynamic variables that are initialized when the page is loaded and updated every time that the page is reloaded or when their dependencies changes.
Another tool provided by the software suite is the Portal. This tool have two different profile: “user” and “administrator”. The administrator profile allows users to install and enable business processes; display data of opened and archived cases; show detailed information on pending, failed and done tasks; setup users, groups and roles of the business organization. Furthermore, this profile permits users to define web applications combining different software objects that can be uploaded as “Resources”, such as: custom pages, forms, layouts, graphical themes and possible REST API extensions. The user profile, instead, has operative functions. With this profile a user can view: (1) all the business processes that he/she could manually start; (2) a list of open cases; (3) detailed information about each case, such as the case ID, the process name, the stating date, the name of the actor that has started the case and if there are tasks that are waiting to be carried out; (4) a list of tasks that can be classified as “To do”, if not still assigned to a specific actor, or as “My tasks” or “Done Tasks”.
Finally, the Bonita BPM platform is completed by a business processes engine and a set of additional software tools. The engine has the responsibility to execute the business processes installed by the portal. Apache Tomcat, and the database engine H2, are instead the tools that allow software applications developed in a “local host” setup to be tested.
3.6. Web Technology Adopted
The O3-Farm application has been developed and tested using a PC and the following versions of software tools: Bonita BPM Community Edition 7.5.2. (Bonitasoft SA, Grenoble, France); Apache Tomcat 7.0 (Apache Software Foundation, Wakefield, MA, USA); H2 1.3.170; Java 8 (Oracle Corporation, Redwood City, CA, USA); Internet Explorer 11 (Microsoft, Redmond, WA, USA); Google Chrome 6.0 (Google Inc., Mountain View, CA, USA).
4. Validation
In order to validate the O3-Farm application from a user perspective, five professional farmers were involved in the study. To each of them, the main functionalities of the old and new version of the software application for the milk traceability, were explained. After a training period, they were asked to carry out a list of operations, such as: to insert a defined set of data or to perform a particular search in the archive. These operations were performed by users in both systems, in order to allow them to make comparisons between the two software applications. However, each operation was performed in both systems, alternating the order of the system used (i.e., first operation performed: before, in the old version of the software application, and after, in the O3-Farm application; second operation performed: before, in the O3-Farm application, and after, in the old version of the software application; for the remaining operations, the same alternation, as for the operations one and two, was followed). The complete list of operations performed by each user is reported below:
Add a new cow to the farm herd.
Add a new group of cows in the farm herd.
Add a new ration for a specific group of cows.
Add a new field to the farm.
Add a new supply.
Add a new warehouse management related to a supply.
Add a set of milking data for ten cows of the farm herd.
Retrieve milking data of a specific cow.
Retrieve milking data of a group of cows that have filled a specific can of milk.
Retrieve ration data of a specific group of cows.
The above reported operations were performed separately by each user. At the end of the testing phase, his/her perspective was recorded through a user survey. The questionnaire consisted of three sections to evaluate contents, quality and efficiency. Each answer to the questionnaire was rated as “disagree”, “neutral” or “agree”. Answers to the questionnaire are reported in
Table 1.
As reported in
Table 1, results show that the majority of the users agreed that the O3-Farm application provides all necessary data to trace milk yields (60% of the testers referring to farming data and 80% referring to milking data). As a consequence, it could implement the traceability of milk in the production cycle evaluated (for the 80% of the testers). Also data entry and data retrieval improved permitting a better traceability of milk yields when compared with the software application previously developed (for the 80% of the testers). At the same time, the O3-Farm application showed some new features that could bring an increase of the efficiency of the traceability of milk yields. In detail, possible advantages identified by users were: (1) the organization of farm activities as workflows (80% of the testers); (2) farm workflows that could be performed by different users (100% of the testers), with a data entry that could be carried out in different times and from any part of the farm (80% of the testers); (3) the availability of data that could be potentially shared with other partners of the production chain (60% of the testers).
5. Discussion
The O3-Farm was able to provide all features of the database application previously developed. It permitted users to store all required data and to retrieve them, when necessary. As a result, it allowed them to reach a complete traceability of milk in a context as described by the use-case adopted for this test.
At the same time, the O3-Farm application provided some new features that increased its value if compared with the database application previously developed. It was a “web oriented” software application, accessible by the internet network—with a common browser—from any part of the farm. It has a “responsive” graphical theme that allowed the use of any kind of internet device, also mobile. Data entry was shared between different groups of users, whose roles and responsibilities were well defined and organized in farm workflows. In this way, each task that involved more than one user could be done in different times, and in parallel when more instances of the same process were activated. As a result, a better efficiency of farm management was reached. Furthermore, data sharing was increased. This could permit a better integration of software applications, and control of the whole production chain, if other actors (of the production chain) would add or use data collected [
25].
In the development of the O3-Farm application, the BPM approach was followed. This paradigm allows users to split the functional layer from the implementation layer. This can improve the design of processes, and their organization as services, in order to increase the: integration, interoperability, and scalability of software applications. Nevertheless, as seen in this preliminary evaluation, the software development results in being more complex if compared to the development of a common database application. Every web page must be coded without supposing it to have an available server session. If a web page has the target to collect some data for a process, it must retrieve all necessary data in terms of: task ID, case ID, and/or process ID. This have to be done by a sequence of calls to the processes engine and to the existing instances (and variables) of a specific process. As a consequence, the coding of the web page results in being more complex and expensive in terms of programming time. Therefore, when this development approach is used, it is important to reach the right balance between the required development costs and the context of the software application that has to be developed. Nevertheless, it is clear that when this methodology is adopted, the final product is always more professional and technically robust.
However, the adoption of the BPM approach, in the development of FMIS, could facilitate the implementation of the FSE. This model has the target to make farm management systems more collaborative, scalable and also to identify a technical infrastructure where software applications, and/or services, could be used and shared. A way to reach this target is to improve the integration of software applications and make agricultural data more sharable. This result could be reached through a standardization of farm workflows, and farm data, by the collaboration of technical stakeholders, and international organizations, as done in similar contexts. For example, in order to reach a better integration of software applications for medical hospitals, different standards have been developed (Digital Imaging and Communications in Medicine, DICOM and Health Level Seven, HL7—[
26,
27]) and “technical frameworks”, that describe hospital workflows, have been written (Integrating the Healthcare Enterprise, IHE [
28]). These technical frameworks identify a subset of functional components of the healthcare enterprise, called “IHE Actors” [
15]. The frameworks specifies their interactions, in terms of a set of coordinated messages that can be sent or received on the basis of the standards already in use (i.e., DICOM and HL7). When specific messages are sent or received by an actor, it performs a transaction. More transactions can be organized in “integration profiles”. Each integration profile describes real-world scenarios or specific sets of capabilities of integrated systems [
15]. When a software house has a new product that implements one or more actors, it can test and declare its compatibility with the corresponding Technical Framework in order to prove its possible integration with other software applications. In the same time, when a hospital want to buy a new product, it can be sure that the new product will collaborate with the others software applications, already in use in the hospital, only considering its declaration of compatibility. In this scenario, the BPM approach could be a valid tool to reach a similar result. It could allow the description of a farm workflow, under a functional and technical point of view, through the use of a BPMN. Furthermore, using a software suite for the implementation of BPM diagrams, it could be a useful way for the development of software applications for the farm management, as suggested by the outcomes obtained in this preliminary evaluation. Thus, it could be considered as a way to promote a FSE model, considering its ability to use new processes, and/or services, that could be developed, and sold, by different software producers.


