Article

Seasonal Changes of Soil Quality Indicators in Selected Arid Cropping Systems

1
Plant and Environmental Sciences Department, New Mexico State University, P.O. Box 30003 MSC 3Q, Las Cruces, NM 88003, USA
2
Extension Plant Sciences Department, New Mexico State University, P.O. Box 30003 MSC 3AE, Las Cruces, NM 88003, USA
3
Economics, Applied Statistics & International Business Department, New Mexico State University, P.O. Box 30001 MSC 3CQ, Las Cruces, NM 88003, USA
*
Author to whom correspondence should be addressed.
Agriculture 2018, 8(8), 124; https://doi.org/10.3390/agriculture8080124
Submission received: 19 June 2018 / Revised: 26 July 2018 / Accepted: 6 August 2018 / Published: 9 August 2018

Abstract

:
Improving the soil quality in arid agro-ecosystems requires a greater understanding of how the time-of-sampling and management affect the soil measurements. We evaluated the selected soil quality indicators on samples collected at a 0–0.15 m depth, and at various sampling dates of the year, corresponding to the fall of 2015, winter of 2015/2016, spring of 2016, and the summer of 2016. The three crop management systems sampled included alfalfa (Medicago sativa), upland cotton (Gossypium hirsutum), and pecan (Carya illinoinensis). The soil properties measured included the wet aggregate stability (WAS), mean weight diameter of dry aggregates (MWD), dry aggregates greater than 2 mm (AGG >2 mm), dry aggregates less than 0.25 mm (AGG <0.25 mm), available water capacity (AWC), soil organic matter (SOM), permanganate oxidizable carbon (POXC), soil bulk density (BD), soil electrical conductivity (EC), pH, nitrate-nitrogen (NO3-N), extractable potassium (K), extractable phosphorus (P), calcium (Ca), magnesium (Mg), sodium adsorption ratio (SAR), and micronutrients (zinc, iron, copper, and manganese). Out of the 21 soil measurements, 15 varied significantly with the time-of-sampling within a year, although there were no consistent trends in variability. However, only a few measurements differed significantly with the crop management practices tested. Wet aggregate stability, MWD, AWC, and BD were significantly higher in the summer, while POXC and SOM were significantly higher in the fall and winter, respectively. Soil quality indicators such as NO3-N, K, and P decreased significantly during the spring. This study shows that the seasonal variability of the soil measurements can be significant in the arid agro-ecosystems, with the magnitude of variation depending on the measurement type. The soil managers in the region need to account for this variability, in order to be able to assess the changes in the soil quality. Also, because of the variability that can occur across the different sampling dates within a year, it is advisable to sample during the same period every year, for a consistent interpretation of the directional changes of the soil quality indicators.

1. Introduction

Soil quality is a crucial component in assessing land sustainability practices in ecosystems [1]. The concept of soil quality is rapidly developing and it involves the study of soil responses to management practices, as well as its resilience to natural forces. Doran and Zeiss [2] defined soil quality as “the ability of soil to function as a vital living system, within ecosystems and land-use boundaries, to sustain plant and animal productivity, maintain or enhance water and air quality, and promote plant and animal health.” Soil quality integrates the inherent properties often associated with soil forming factors, as well as the dynamic properties resulting from human-driven management decisions [3]. Soil quality indicates the ability of soil to function effectively and continuously in the present and in the future [4].
Soil functions as the major source for food and fiber production, and interrelates and/or interacts with the surrounding environment. Thus, the enhancement and preservation of the soil quality in arid and semi-arid regions is critical for sustaining land productivity under different land uses and management [5]. Seasonal variability in the soil functions and conditions are due to factors such as climate pattern, land use, cropping sequences, and farming systems [6]. Arid and semi-arid regions are characterized by low precipitation rates of 100–250 and 250–500 mm year−1, respectively, and the development and formation of soils in these regions is affected by water shortage, daily temperature variations, deflations by wind, and reduced microbial activities [7].
Sampling for soil quality assessment is crucial to the recommendation of management practices for the overall soil improvement. The chemical soil testing that growers are familiar with are often related to the application of optimal amounts of fertilizer for crop growth and development. In New Mexico, chemical soil sampling is usually done in the spring, just before the planting of the summer annual crops. In the case of winter cash crops, soil testing is done in the fall, just before the crop establishment. As soil quality extends beyond the chemical soil assessment, other measurements belonging to the soil physical and biological attributes need to be tested for the overall assessment of soil quality or soil health. However, there is no consensus regarding the time of the year that many of the soil physical and biological measurements should be tested.
Previous studies have shown the variability that could exist, as soil quality indicators are sampled during the different months of the year within a given growing season [8,9,10,11]. Moebius et al. [8] studied the temporal variations of many soil physical quality indicators within a season, in different tillage and crop rotation trials, and found that the indicators vary significantly with the sampling dates and in the different soil types. Piao et al. [11] studied the seasonal response of soil to microbial biomass carbon. They found an inverse relation between the soil microbial biomass carbon and the atmospheric temperature over one year of sampling. They also found that the microbial biomass carbon was the highest in winter and the lowest in the summer. Ryan et al. [10] studied the changes in the total soil organic matter, labile carbon, and microbial biomass carbon during the season. They found that the organic matter decreased from 1.48% in February to 1.15% in August after cropping. They also found that the labile carbon followed a similar pattern.
All of these studies show the uniqueness of the variability that can exist within or between seasons for multiple soil quality indicators (SQIs), and that the seasonal variation of the different indicators measured were of different magnitudes; while some indicators remained relatively stable during the year, others fluctuated significantly. This highlights the need to study the across-season variations of the potential SQIs within a given ecosystem and climatic zone, before a reliable soil quality assessment can be developed. The within-season variation may even become complicated by soil and crop management differences.
As a successful soil quality evaluation depends on the selection of suitable and reliable soil indicator measurements, it is crucial to assess the performance of the potential indicators, as they vary from season to season during the year, in order to help with identifying the sensitivity of the SQI and to develop an appropriate sampling strategy for the SQI assessment.
There is a research gap, particularly in the selection and performance of soil quality indicators in irrigated arid farmlands. These farmlands contribute significantly to agricultural production in the United States and worldwide. This study is a contribution towards understanding the across-season variations that could exist for multiple soil measurements under the irrigated arid farming systems.
The objectives of this study were as follows:
  • To evaluate the variations of the selected soil measurements as a function of the sampling dates that correspond to the fall, winter, spring, and summer, in an arid agro-ecosystem; and
  • To evaluate how three different cropping systems affect the variability of these soil measurements.

2. Materials and Methods

2.1. Study Site and Treatments

The study was conducted at the New Mexico State University Leyendecker Plant Science Research Center, located in southern New Mexico, United states of America (32°11′5″ N, 106°44′26″ W). The crop management practices chosen for the study and the corresponding soil types are presented in Table 1. The landform in all of the locations was flood plain, and the percent of calcium carbonate in the soil ranged from 2 to 10%.
The mean annual air temperature of the study region is 25 °C, with a mean maximum temperature of 35 °C in June, and a mean minimum temperature of −2.2 °C in January. The mean annual rainfall is about 250 mm. About 45% of the annual precipitation is concentrated within the monsoon period (July–September), while the rest of the precipitation is scattered from October to January.
Three crop production systems were sampled, including alfalfa (Medicago sativa) (multi-year field crop), upland cotton (Gossypium hirsutum) (an annual row crop), and pecan (Carya illinoinensis) (permanent tree crop). The alfalfa fields used in this study were in their third year of production. The alfalfa fields are harvested seven times in a year, and the harvested biomass is removed from the field as forage. The cotton fields used for this trial undergo yearly plowing, disking, and bed shaping before seeding. At the time of this study, the cotton fields had been growing continuous cotton for three years. The pecan fields were eight years old and in the fourth year of production at the time of this study. While the alfalfa and pecan fields were flood irrigated, the cotton field was furrow irrigated, and the irrigation frequency (around every three to four weeks) for each field was determined by the crop water demands, and was designed to minimize the moisture stress. Both the cotton and pecan fields receive synthetic fertilizer inputs of urea each year. In addition, the pecan fields also received chelated zinc applications. The cultural management practices, including tillage, irrigation, fertilization, and weed controlling, were based on the standard practices recommended by New Mexico State University.
A solution of 12% chelated zinc was applied yearly to the pecan orchards by foliar spray a total of four times per season, twice in April and twice in May, during the study period, at a rate of ~169 L ha−1 (~18 gallon/acre/application).
Nitrogen fertilizer applications took place in the cotton fields three times during the spring season (April, May, and June), including one time as dry (46–0–0) in late April at the rate of ~112 kg h−1 (100 pound/acre), and two times as liquid (32–0–0), with the irrigation at the rate of ~187 L ha−1 (20 gallon/acre/application) in May and June.
Intrepid Edge, an insecticide, was applied to the pecan fields in mid-May at a rate of about 0.8 L ha−1 (11 ounces/acre). Intensity, an herbicide, was applied to the cotton field in June at a rate of about 0.88 L ha−1 (12 ounces/acre).

2.2. Soil Sampling and Laboratory Analyses

The soils were collected from three locations and every location had three replicate fields of the three tested crop production systems, with the fields having soil textures of sandy loam and clay loam. The soil sampling took place in the fall (October 2015), winter (January 2016), spring (April 2016), and summer (July 2016). The April sampling in the cotton fields took place after tillage, but before planting, while the sampling in October took place just after the cotton harvest. Ten random soil samples (0–0.15 m) were collected per field using a standard soil auger to form a composite sample.
The samples collected from the field were air dried and analyzed for different laboratory measurements. The only measurement taken in the field was the soil bulk density (BD), measured by the soil core method at the surface depth (0–0.1 m), using the AMS soil core sampler (AMS Company, American Falls, ID, USA). The sampler core cup was driven into the soil by a slide hammer, and the moist weight of the soil was determined immediately, before drying the soil to a constant weight in the oven at 105 °C for 24 h. The bulk density was determined as the ratio of the dry weight of the soil to the soil volume (core cup volume) [13].
The laboratory measurements included the dry aggregate size distribution comprising three parameters, which are the mean weight diameter (MWD), aggregates 2–4 mm (AGG >2 mm), and aggregates less than 0.25 mm (AGG <0.25 mm), all of which were measured using a Tyler RX-29 Rotap sieve shaker (W.S. Tyler, Mentor, OH, USA). These measurements are related to wind erosion, which commonly occurs in the study region. The higher the MWD and AGG >2 mm, the less sediments are lost to wind erosion, while the higher the AGG <0.25 mm, the more sediments are lost to wind erosion [14]. Wet aggregate stability (WAS), which is an indicator of resistance to soil erosion by water, was measured using the Cornell Sprinkle Infiltrometer [15]. To measure WAS, the known weight of the soil aggregates are placed on a 2-mm sieve, and a simulated storm of known energy from the Cornell Sprinkle Infiltrometer was allowed to fall on the aggregates from a height of 0.6 m. The percentage of aggregates left unbroken after the storm, on top of the 2-mm sieve, is regarded as the WAS. The available water capacity (AWC) (moisture difference between 0.03 MPa and 1.5 MPa) was measured using the pressure plate apparatus method [16].
The soil samples that passed through a 2-mm sieve were used for the soil chemical analyses. The electrical conductivity (EC), pH, calcium (Ca), magnesium (Mg), and sodium (Na) were measured in the saturated paste extract [17]. The soil organic matter (SOM) was determined using Walkley–Black method [18], and the permanganate oxidizable carbon (POXC) was determined using the permanganate oxidation technique [19]. The POXC is a measure of labile carbon in the soil and it has been shown to be a very useful indicator of the soil quality in agricultural systems [20].
Nitrate nitrogen (NO3-N) was determined in a water extract (1:5, soil:water), using a cadmium reduction column [21]. The Olsen bicarbonate method was used to determine the extractable phosphorus (Olsen-P) [22], and the potassium content (K) was also determined in a water extract (1:5), using inductively coupled plasma spectroscopy [23]. Copper (Cu), iron (Fe), manganese (Mn), and zinc (Zn) were measured by using the Diethylenetriamine Pentaacetic Acid (DPTA) extraction [21]. The Sodium Adsorption Ratio (SAR) was calculated from the measurements of Ca, Mg, and Na in the saturated paste extract.

2.3. Statistical Analysis

The experimental design was a repeated measure within a randomized complete block design, with three replications. The statistical significance of the season (time of sampling) and crop management effects on different soil measurements were analyzed using the PROC GLM (general linear models) procedure in SAS (Statistical Analysis System) [24], and the means were separated by Duncan’s Multiple Range test. In addition, the coefficient of variation (CV), which is the ratio of standard deviation to the mean, was calculated for the measurements collected across the different sampling periods.

3. Results

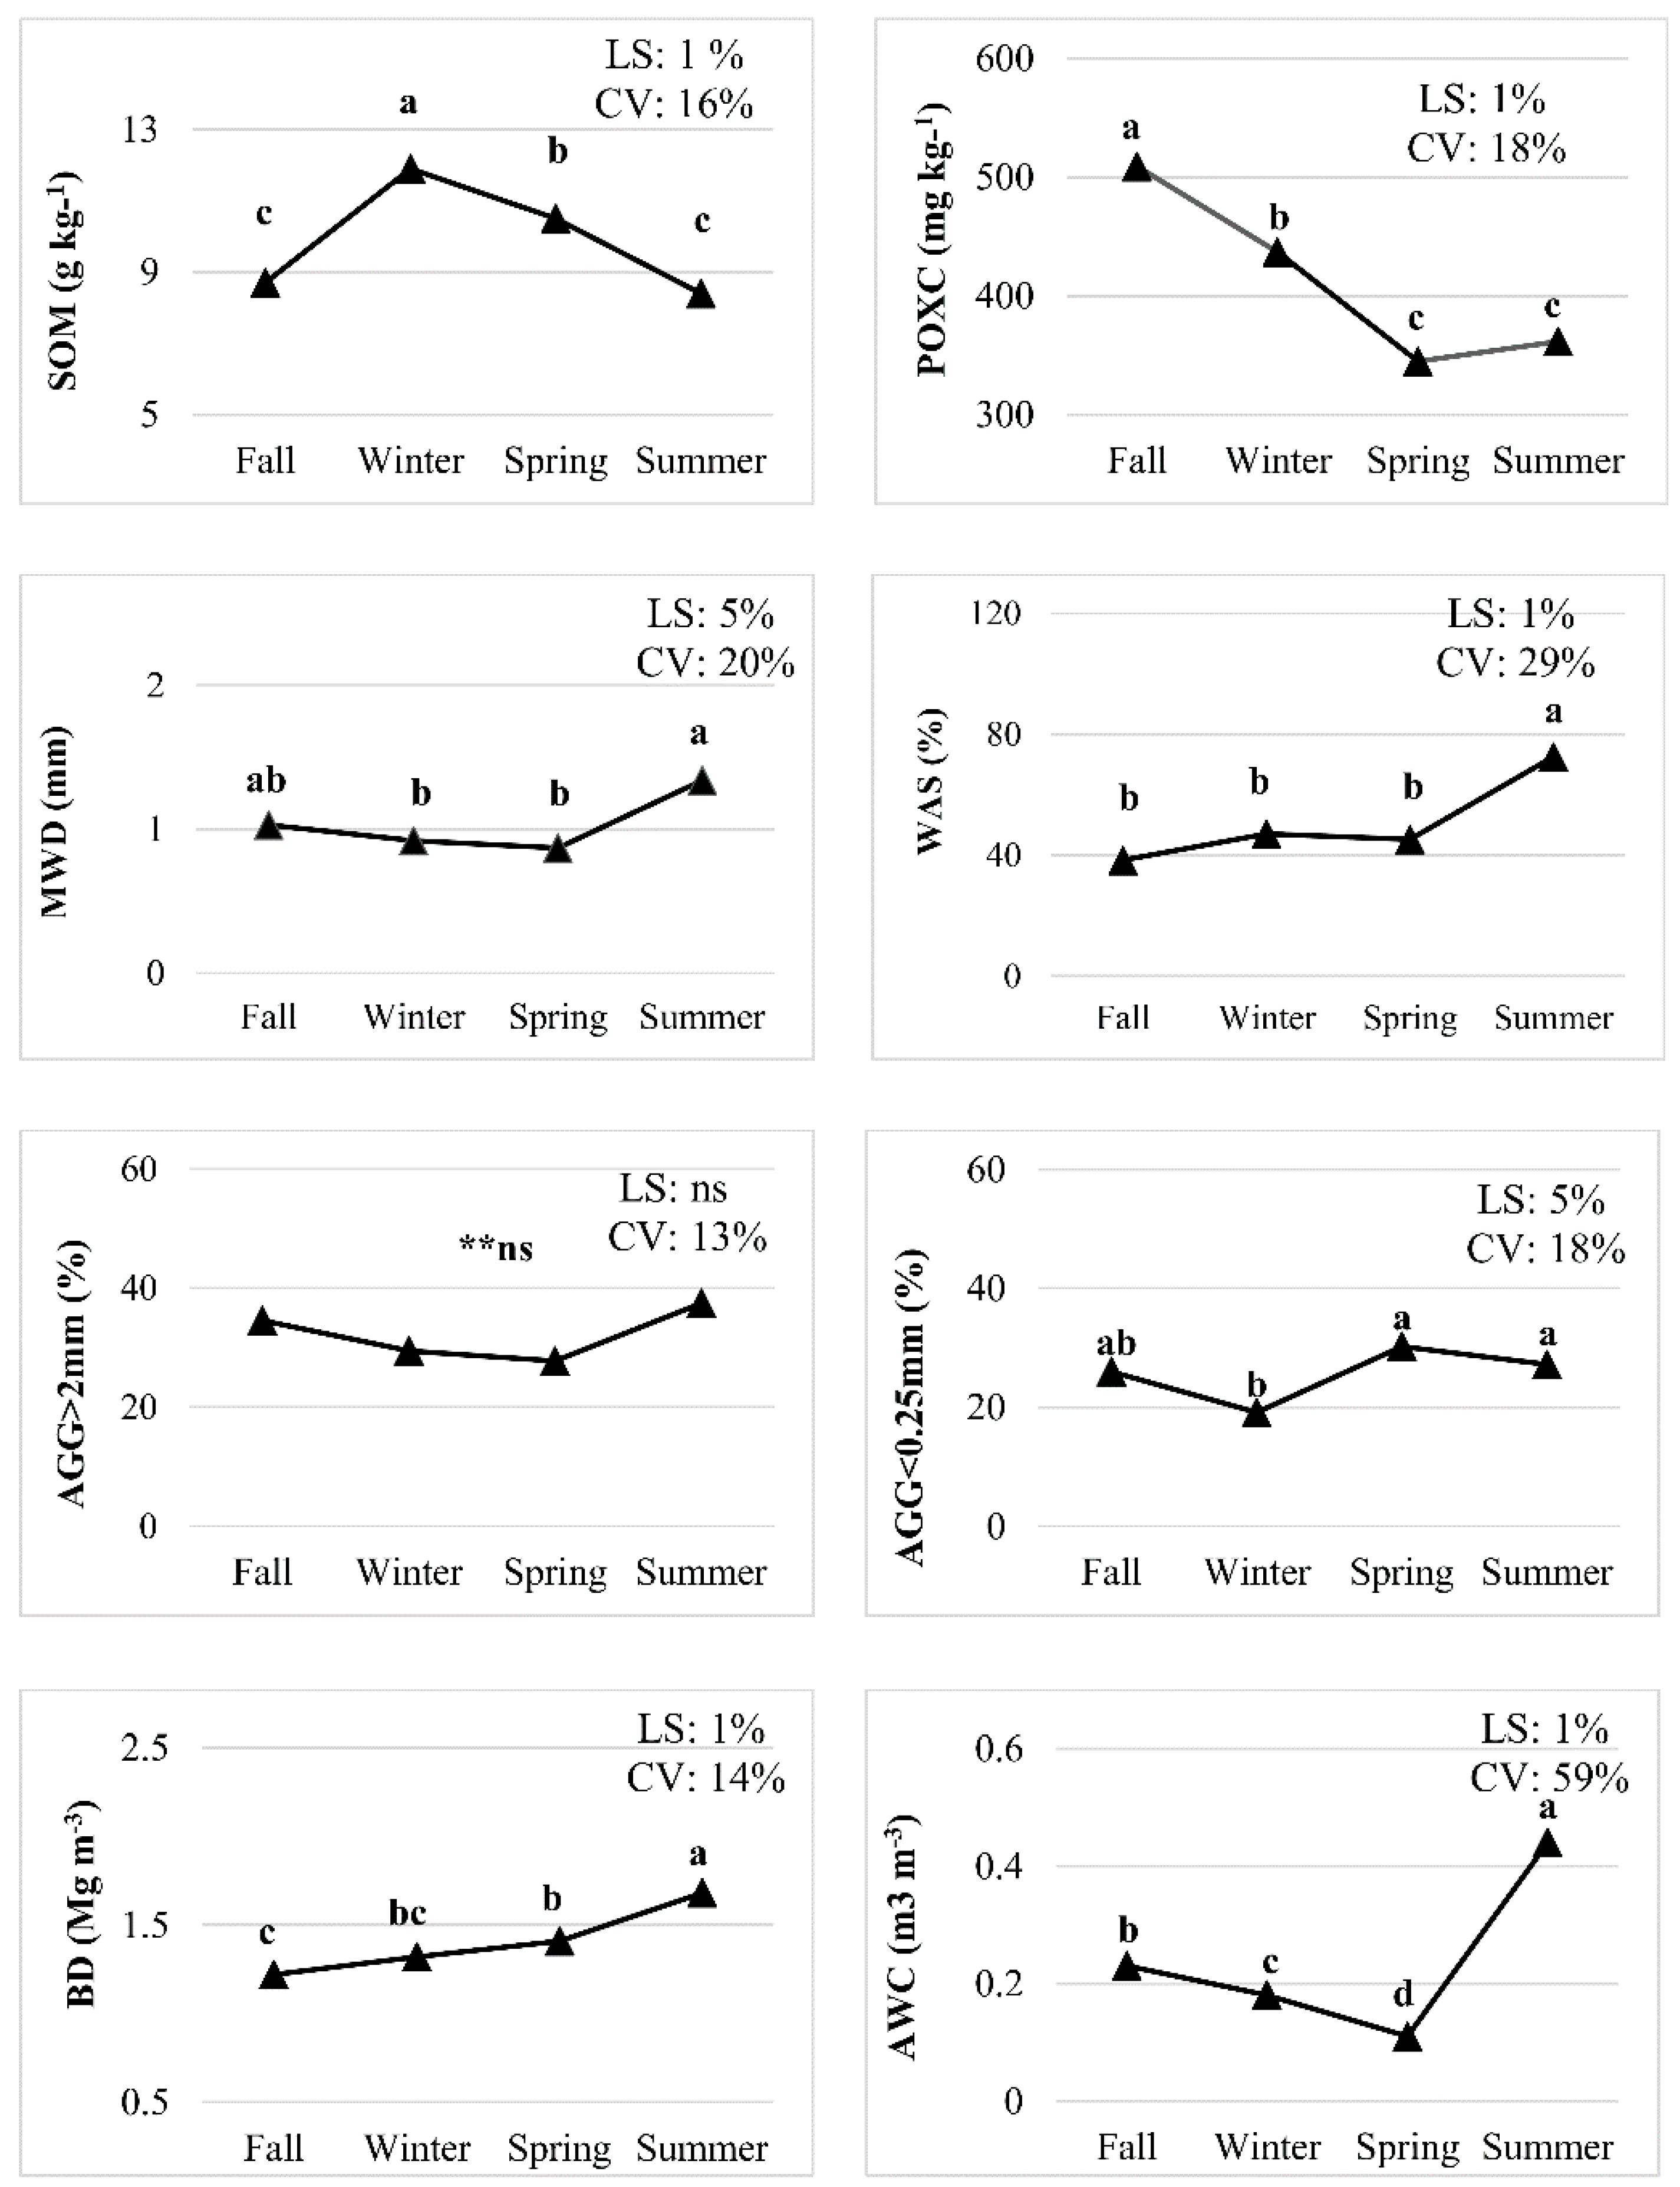
3.1. Sampling Season Effects

The sampling dates significantly affected 15 out of the 21 soil measurements (Figure 1, and Table 2 and Table 3). The magnitude of variability in the soil properties, as defined after Wilding and Drees [25], is as follows: low variability with CV ≤15%; moderate variability with CV >15% but <35%; and high variability with CV ≥35%.
Out of the 21 soil measurements assessed, 10 exhibited low variability (AGG >2 mm, BD, EC, SAR, pH, Mg, Ca, Na, P, and Fe); eight exhibited moderate variability (SOM, POXC, MWD, WAS, AGG <0.25 mm, Mn, and Cu); while three had a high variability (AWC, NO3-N, and Zn) across the sampling dates (Figure 1 and Table 3). The overall seasonal variability (CV) ranged from 0.9% for pH to 101% for Zn, and for most of the soil measurements, the variability was low to moderate.
The values of MWD and WAS were highest in the summer, while the AGG >2 mm was not significantly different between the sampling dates (Figure 1). The AGG <0.25 mm was significantly higher in the spring and summer than in the winter (Figure 1). The date of sampling significantly affected the AWC and BD, with these measurements having their highest values in the summer. The AWC had its lowest value in the spring, while the BD had its lowest value in the fall (Figure 1). The SOM was the highest in the winter (11.9 g kg−1) and lowest (8.4 g kg−1) in the summer (Figure 1). On the other hand, POXC was the highest in the fall (508.96 mg kg−1), and declined to 344.87 and 361.7 mg kg−1 in the spring and summer seasons, respectively (Figure 1). EC was not significantly affected by the seasons, while the SAR was slightly higher in the spring compared with the other seasons (Table 3).
The analysis of Olsen-P, K, and NO3-N was significantly affected by the sampling season, with the highest values measured in the fall (Table 2 and Table 3). However, the fall values of NO3-N and Olsen-P were not significantly different from the summer values (Table 3). The Ca concentration did not change with the seasons, while Mg and Na were highest in the spring (Table 3). Out of the four micronutrients measured (Fe, Zn, Mn, and Cu), only Zn and Cu exhibited a significant seasonal effect, having their highest values in the fall (Table 3).

3.2. Crop Management Effects

Crop management had significant effect (p-value = 0.05) on the selected soil chemical measurements, including EC, Na, Ca, Mg, Zn, NO3-N, and SAR (Table 2 and Table 4). The soil under the cotton production management generally had higher values for these soil chemical measurements, compared to the alfalfa and pecan. The AWC, WAS, and BD were not significantly different among the crop management practices (Table 4). The MWD and AGG >2 mm were similar among the three crop management systems (Table 4).
The interaction between the sampling dates and the crop management was not significant for most of the measurements, except for NO3-N (Table 5). For example, the amount of NO3-N in the soil of the planted cotton gave the highest values across the sampling dates and management practices (Table 4 and Table 5).

4. Discussion

4.1. Sampling Season Effects

The soil organic fractions are the most complex, but arguably the most important soil measurement or soil quality indicators in many agricultural systems [1]. The SOM and POXC, which are indicators of the soil organic carbon, were the highest in winter and fall, and may have accumulated because of a low soil temperature, lack of soil disturbance that would expose the organic matter to oxidation, and lower microbial activity resulting in less consumption of soil organic products for energy. This result is confirmed by other studies that have found a significantly higher SOM and microbial biomass carbon in winter compared with summer [10,11]. Although the decomposition rate is slower during this period, the enzyme and microbial activities in early fall, and the plant carbon inputs and litter chemistry in winter may have increased the soil’s carbon concentration [26,27,28].
The AWC followed the precipitation cycles in our study area, which were high in late summer, early fall, and lowest in spring. This pattern agrees with the study conducted by Garcia-montiel et al. [29], who indicated that the temporal dynamics in the soil water content follow seasonal cycles of precipitation, and that the water uptake is critical for a short period near the beginning of the rainy season.
The soil structure measurements presented by dry and wet aggregate parameters, including MWD, AGG <0.25 mm, and WAS, exhibited inter-seasonal variability and were highest for the summer season (July). These temporal changes may be due to a combination of increased temperature and microbial-plant root activities [14,26]. Mycorrhizae fungi and their hyphae have a symbiotic relationship with plant roots that could serve a vital role in the aggregation process. Cosentino et al. [30] reported that the influence of fungal biomass on soil aggregates was greater than the effect of total microbial biomass during wet and dry cycles. Incidentally, the summer period when these structural parameters are the highest, is the peak period when the crop canopy has been formed and the roots are actively growing within the soil. This implies that the soil will be more resistant to erosion from both the wind and water. However, the period of the highest wind erosion in the study region is in the spring, and the dry aggregate size distribution measurements (MWD and AGG <0.25 mm) indicate that the soils will be more susceptible to wind erosion during the spring than the summer, as shown by a lower MWD and a higher AGG <0.25 mm (Figure 1). From the observations made in the study area, highly erosive winds are very common during early to late spring [31,32], leading to dust contamination of the air and reduced visibility. The problem is exacerbated by the fact that many agricultural fields are normally left bare and unprotected in the spring, just after the tillage operations, resulting in huge amounts of sediments lost from the field [31,32]. Growing cover crops can provide ground protection during the period of high winds, and utilizing reduced tillage practices such as strip- or no-tillage could address some of the wind erosion problems in the study region.
The higher bulk density measured during the summer (Figure 1) could be partly due to farm traffic and the operation of field equipment during this time of the year. For the cotton plots, activities such as cultivation, pesticide sprays, and fertilizer side-dressing normally take place during the summer, and because of tractor tires and farm implements, the compaction of soil may be occurring in these fields. In the case of alfalfa, multiple harvests take place during the summer months, and this involves many passes of farm equipment and tractors across the fields. Such passes could significantly affect the soil density, as was observed in this study. Pecan orchards are also subject to farm traffic during the summer, for operations such as fertilization, cultivation, and chemical sprays. It is, however, worth noting that the soil appears to recover from the summer compaction in the fall and winter time, as shown by significantly lower bulk densities in the fall and winter (Figure 1). Other authors have observed significantly lower bulk densities in the fall, compared with the summer months [33,34]. Another reason for this seasonal variation in the soil bulk density could be explained by the seasonal soil organic matter dynamics. In this study, the period of lower bulk densities (fall and winter) coincides with the time when the soil organic carbon indicators (SOM and POXC) were the highest in the soil (Figure 1). Increased soil organic matter has been shown to decrease the compactibility of the soil [35,36].
The high values of primary nutrients (NO3-N, P, and K) found in the fall soil samples (Table 3) could be due to the reduction in the plant uptake and nutrient requirements by fall. Additionally, the mineralization occurring towards the end of the growing season may have led to an accumulation of nutrients in the surface soil. The mineralization of the organic materials to inorganic forms is associated with the release of NO3-N, P, K, and most of the micronutrients, and is related to season and management [37].

4.2. Crop Management Effects

The crops grown in this study were multi-year field alfalfa, an annual cotton row crop and a permanent pecan crop. In all of the cropping systems, the estimated EC values were less than 3 dS m−1, but were significantly different between the crop types. The salt amounts were the highest in the planted cotton fields, consistent with other studies that indicated higher salt accumulation due to the effect of tillage and irrigation in the annual cropping systems [38]. This is especially noticeable with the increase in the use of the local saline well ground water for irrigation in southwestern New Mexico [39]. Although the EC of the cotton field was still far below the threshold for cotton to be affected by salinity, it may pose a long term problem, especially if the fields were to be rotated into other crops that have less salinity tolerance than cotton. Salt accumulation is extremely important in the Southwestern United States’ soils, and it can vary over time due to land management, soil type, and climatic conditions.
The only interaction effect found in this study was for NO3-N (Table 5). Our experimental results indicated that cotton had the highest average soil NO3-N, which was more than two times compared to alfalfa, and four times compared to pecan. The intensification of row crops such as cotton and corn in the arid Southwestern United States has driven an increased application of N fertilizers for successful crop growth. However, caution has to be exercised in order to prevent the overapplication of nitrogen fertilizers, which can lead to contamination of the ground water. This could be a potential problem in the fields with cotton management, which had very high NO3-N of 42 mg kg−1 in the fall after the cotton harvest (Table 5). This NO3-N level in the cotton fields remaining after harvest is sufficient for the growth of many crops, without the need for supplementary nitrogen fertilizer in the study region [40]. The soil NO3-N reduced to 12 mg kg−1 in the spring, indicating that most of the NO3-N has been lost before the next season’s planting. In such a system as this, a cover crop can have a significant impact on nutrient cycling, by using the extra NO3-N left in the soil, which can then be made available for the succeeding cash crop after the termination of the cover crop and incorporation into the soil.
The chelated zinc application in the pecan fields could have been responsible for the high variability of zinc. The climatic data showed that the temporal seasonal characteristics of the area featured a high temperature in the summer and, the main precipitation in the late summer and fall seasons.

4.3. Implications of This Study

This study was conducted to assess the effects of the seasonal changes on the soil properties or SQIs. A major finding from this study is that the soil quality indicators can vary with the time of sampling, with some indicator values showing a high variability between sampling dates. Therefore, due to this variability of the SQIs observed between the sampling dates, it is advisable for the farmers and producers to establish a standard time of sampling and to consistently sample during the same time period every year, for consistency in the soil test results’ interpretation. Sampling at different times of the year will increase the SQI variability and reduce the usefulness of comparing the results between years, thus making it difficult to track the directional changes in the SQIs. An integrated approach to soil quality assessment and management will result in an increased crop productivity and greater biological diversity, which will ultimately provide economic and environmental benefits and the more efficient land management of arid regions [41].
In addition, soil measurements that are highly variable during the season would be unsuitable as indicators of soil quality [11]. Some of the most variable indicators in this study, including NO3-N and Zn (CV of 47% and 101% respectively), are measurements that were significantly impacted by the application of fertilizers, especially in cotton and pecans. While those nutrient elements are necessary for crop growth and development, they do not serve as useful indicators of soil quality directional change, as they fluctuate wildly based on the amount and timing of applied amendments. For the directional assessment of soil quality, indicators are needed that reflect the consistent response to management over time. Many soil physical and biological measurements belong to this category in contrast to the soil chemical nutrients that can easily be influenced by the addition of chemical amendments. A lack of acknowledging the importance of physical and biological soil attributes has led to the intense degradation of many agricultural soils. Many farmers consider application of fertilizers for crop production as a quick fix for soil deficiencies. Using a fertilizer-only approach to soil management, without attending to other soil attributes, often leads to a cycle of soil degradation that can have a significant effect on long-term productivity and the environment.
Farming practices significantly influence soil quality, and proper management strategies for soil quality are needed for sustainable crop production in arid environments. Soils of a high quality will support specific management goals over the long-term, and such goals could include agronomic crop production associated with high yields, the economic goal associated with minimizing input cost on the farm, and the environmental goals associated with protecting water and air quality [41]. Although soil quality is a much broader concept, the emphasis in this study was from an agricultural perspective, with the goal to identify SQIs that will be useful in developing a long-term strategy. Careful management of soil quality will enhance the ecosystem capacity to provide essential services.

5. Conclusions

The soil quality in the Southwestern United States was studied by sampling at different dates corresponding to the four seasons of the year (winter, spring, summer, and fall), and from three cropping systems. The results showed a significant effect of crop management only on a few soil quality measurements, while the effect of the sampling season was significant for 15 out of the 21 soil measurements. Most of the soil measurements that were assessed exhibited low to moderate variability, while a few had a high variability between the sampling seasons. The measurements exhibiting a high variability present a challenge for estimating the directional changes in the soil quality, as the fluctuations in their values between the sampling dates can act as a confounding factor. For most of the chemical measurements, the sampling time is often dependent on when the soil amendments are to be applied to the crops being grown in the field. However, for the physical and biological measurements, which rely more on management-induced changes, sampling should occur at approximately the same time of the year, in order to capture the long-term changes.

Author Contributions

Conceptualization, M.O., O.J.I., A.L.U. and S.J.G.; Methodology, M.O., O.J.I. and A.L.U.; Formal Analysis, D.V.; Investigation, M.O.; Writing-Original Draft Preparation, M.O.; Writing-Review & Editing, all coauthors; Supervision, O.J.I. and A.L.U.; Project Administration, O.J.I. and A.L.U.; Funding Acquisition, O.J.I. and A.L.U.

Funding

This work was funded by the New Mexico Agriculture Experiment Station and the USDA-Hatch grant.

Acknowledgments

We thank the lab groups of Idowu and Ulery for the assistance provided during field sampling and laboratory analyses. We also want to thank Barbara Hunter for helping with soil chemical analyses.

Conflicts of Interest

The authors declare no conflict of interest. The funders had no role in the design of the study; in the collection, analyses, or interpretation of data; in the writing of the manuscript, and in the decision to publish the results.

References

  1. Carter, M.R. Soil quality for sustainable land management: Organic matter and aggregation interactions that maintain soil functions. Agron. J. 2002, 94, 38–47. [Google Scholar] [CrossRef]
  2. Doran, J.W.; Zeiss, M.R. Soil health and sustainability: Managing the biotic component of soil quality. Appl. Soil Ecol. 2000, 15, 3–11. [Google Scholar] [CrossRef]
  3. Karlen, D.L.; Andrews, S.S.; Doran, J.W. Soil quality: Current concepts and applications. Adv. Agron. 2001, 74, 1–40. [Google Scholar]
  4. Doran, J.W.; Parkin, T.B. Defining and Assessing Soil Quality. In Special Publication; Doran, J.W., Coleman, D.C., Bezdicek, D.F., Steward, B.A., Eds.; Soil Science Society of America: Madison, WI, USA, 1994. [Google Scholar] [Green Version]
  5. Unger, P.W.; Stewart, B.A.; Parr, J.F.; Singh, R.P. Crop residue management and tillage methods for conserving soil and water in semi-arid regions. Soil Tillage Res. 1991, 20, 219–240. [Google Scholar] [CrossRef]
  6. Rabbi, S.M.F.; Roy, B.R.; Miah, M.M.; Amin, M.S.; Khandakar, T. Spatial variability of physical soil quality index of an agricultural field. Appl. Environ. Soil Sci. 2014, 2014, 379012. [Google Scholar] [CrossRef]
  7. Verheye, W.H. Land Use, Land Cover and Soil Sciences—Volume IV; EOLSS Publisher: Abu Dhabi, UAE, 2009. [Google Scholar]
  8. Moebius, B.N.; van Es, H.M.; Schindelbeck, R.R.; Idowu, O.J.; Clune, D.J.; Thies, J.E. Evaluation of laboratory-measured soil properties as indicators of soil physical quality. Soil Sci. 2007, 172, 895–912. [Google Scholar] [CrossRef]
  9. Jiang, P.K.; Xu, Q.F.; Xu, Z.H.; Cao, Z.H. Seasonal changes in soil labile organic carbon pools within a phyllostachys praecox stand under high rate fertilization and winter mulch in subtropical China. For. Ecol. Manag. 2006, 236, 30–36. [Google Scholar] [CrossRef]
  10. Ryan, J.; Masri, S.; Singh, M. Seasonal changes in soil organic matter and biomass and labile forms of carbon as influenced by crop rotations. Commun. Soil Sci. Plant Anal. 2009, 40, 188–199. [Google Scholar] [CrossRef]
  11. Piao, H.C.; Hong, Y.T.; Yuan, Z.Y. Seasonal changes of microbial biomass carbon related to climatic factors in soils from karst areas of southwest China. Biol. Fertil. Soils 2000, 30, 294–297. [Google Scholar] [CrossRef]
  12. Soil Survey Staff. Keys to Soil Taxonomy, 8th ed.; United States of Agriculture: Washington, DC, USA, 1998.
  13. Blake, G.R. Bulk Density in Methods of Soil Analysis. In Physical and Mineralogical Methods; American Society of Agronomy: Madison, WI, USA, 1965; pp. 374–390. [Google Scholar]
  14. Idowu, O.J.; Kircher, P. Soil quality of semi-arid conservation reserve program lands in eastern New Mexico. Arid Land Res. Manag. 2016, 30, 153–165. [Google Scholar] [CrossRef]
  15. Ogden, C.B.; van Es, H.M.; Schindelbeck, R.R. Miniature rain simulator for field measurement of soil infiltration. Soil Sci. Soc. Am. J. 1997, 61, 1041–1043. [Google Scholar] [CrossRef]
  16. Kłute, A. Water Retention: Laboratory Methods. In Methods of Soil Analysis. Part 1: Physical and Mineralogical Methods; Klute, A., Ed.; American Society of Agronomy: Madison, WI, USA, 1986; Volume 9, pp. 635–662. [Google Scholar]
  17. Richards, L.A. Diagnosis and Improvement of Saline and Alkali Soils; US Government Printing Office: Washington, DC, USA, 1954.
  18. Nelson, D.W.; Sommers, L.E. Total Carbon, Organic Carbon, and Organic Matter. In Methods of Soil Analysis. Part 3. Chemical Methods; Sparks, D.L., Ed.; Soil Science Society of America: Madison, WI, USA, 1996; pp. 961–1010. [Google Scholar]
  19. Weil, R.R.; Islam, K.R.; Stine, M.A.; Gruver, J.B.; Samson-Liebig, S.E. Estimating active carbon for soil quality assessment: A simplified method for laboratory and field use. Am. J. Altern. Agric. 2003, 18, 3–17. [Google Scholar] [Green Version]
  20. Culman, S.W.; Snapp, S.S.; Freeman, M.A.; Schipanski, M.E.; Beniston, J.; Lal, R.; Drinkwater, L.E.; Franzluebbers, A.J.; Glover, J.D.; Grandy, A.S.; et al. Permanganate oxidizable carbon reflects a processed soil fraction that is sensitive to management. Soil Sci. Soc. Am. J. 2012, 76, 494–504. [Google Scholar] [CrossRef]
  21. Ludwick, A.E.; Reuss, J.O. Guide to Fertilizer Recommendations in Colorado; Colorado State University: Fort Collins, CO, USA, 1974. [Google Scholar]
  22. Olsen, S.R.; Cole, C.V.; Watanabe, F.S.; Dean, L.A. Estimation of Available Phosphorus in Soils by Extraction with Sodium Bicarbonate; United States Department of Agriculture: Washington, DC, USA, 1954.
  23. Cihacek, L.J. Interpreting Soil Analysis. Cooperative Extension Service Guide a-126; New Mexico State University Publicationl Office: Las Cruces, NM, USA, 1983. [Google Scholar]
  24. SAS Institute. SAS User’s Guide: Statistics; SAS Institute Inc.: Cary, NC, USA, 2004. [Google Scholar]
  25. Wilding, L.; Drees, L. Spatial variability: A pedologist’s viewpoint Chapter 1. In Diversity of Soils in the Tropics; American Society Agronomy: Madison, WI, USA, 1987; pp. 1–12. [Google Scholar]
  26. Zhao, Q.; Zeng, D.; Fan, Z.; Yu, Z.; Hu, Y.; Zhang, J. Forest ecology and management seasonal variations in phosphorus fractions in semiarid sandy soils under different vegetation types. For. Ecol. Manag. 2009, 258, 1376–1382. [Google Scholar] [CrossRef]
  27. Eviner, T.V.; Chapin, I.F.S.; Vaughn, C.E. Seasonal variations in plant species effects on soil N and P dynamics. Ecology 2006, 87, 974–986. [Google Scholar] [CrossRef]
  28. Perrott, K.; Sarathchandra, S.; Waller, J. Seasonal storage and release of phosphorus and potassium by organic matter and the microbial biomass in a high producing pastoral soil. Aust. J. Soil Res. 1990, 28, 593–608. [Google Scholar] [CrossRef]
  29. Garcia-montiel, D.C.; Coe, M.T.; Ferreira, J.N.; Oriental, E.; Silva, E.M.; Davidson, E.A. Estimating seasonal changes in volumetric soil water content at landscape scales in a savanna ecosystem using two-dimensional resistivity profiling. Earth Interact. 2008, 12, 1–25. [Google Scholar] [CrossRef]
  30. Cosentino, D.; Chenu, C.; Le Bissonnais, Y. Aggregate stability and microbial community dynamics under drying-wetting cycles in a silt loam soil. Soil Biol. Biochem. 2006, 38, 2053–2062. [Google Scholar] [CrossRef]
  31. Li, J.; Okin, G.S.; Epstein, H.E. Effects of enhanced wind erosion on surface soil texture and characteristics of windblown sediments. Biogeosciences 2009, 114. [Google Scholar] [CrossRef] [Green Version]
  32. Gibbens, R.P.; Tromble, J.M.; Hennessy, J.T.; Cardenas, M. Soil movement in mesquite dunelands and former grasslands of southern New Mexico from 1933 to 1980. J. Range Manag. 1983, 36, 145–148. [Google Scholar] [CrossRef]
  33. Hu, W.; Shao, M.A.; Si, B.C. Seasonal changes in surface bulk density and saturated hydraulic conductivity of natural landscapes. Eur. J. Soil Sci. 2012, 63, 820–830. [Google Scholar] [CrossRef]
  34. Moraa, J.; Lázarob, R. Seasonal changes in bulk density under semiarid patchy vegetation: The soil beats. Geoderma 2014, 235, 30–38. [Google Scholar] [CrossRef]
  35. Soane, B.D. The role of organic matter in soil compactibility: A review of some practical aspects. Soil Tillage Res. 1990, 16, 179–201. [Google Scholar] [CrossRef]
  36. Thomas, G.W.; Haszler, G.R.; Blevins, R.L. The effects of organic matter and tillage on maximum compactability. In Proceedings of the Southern Conservation Tillage Conference for Sustainable Agriculture, Starkville, MS, USA, 26–28 June 1995; pp. 34–36. [Google Scholar]
  37. Epstein, H.E.; Burke, I.C.; Lauenroth, W.K. Regional patterns of decomposition and primary production rates in the US great plains. Ecology 2002, 83, 320–327. [Google Scholar]
  38. Rajak, D.; Manjunatha, M.; Rajkumar, G.; Hebbaraa, M.; Minhas, P. Comparative effects of drip and furrow irrigation on the yield and water productivity of cotton (Gossypium hirsutum L.) in a saline and waterlogged vertisol. Agric. Water Manag. 2006, 83, 30–36. [Google Scholar] [CrossRef]
  39. Baath, G.S.; Shukla, M.K.; Steiner, R. Irrigation water salinity influences at various growth stages of capsicum annuum. Agric. Water Manag. 2016, 179, 246–253. [Google Scholar] [CrossRef]
  40. Flynn, R. Interpreting Soil Tests: Unlock the Secrets of Your Soil; New Mexico State University Cooperative Extension: Las Cruces, NM, USA, 2015; Volume 676, pp. 1–12. [Google Scholar]
  41. Ulery, A.; Tugel, A. Farming in New Mexico: Soil quality and productivity maintenance. N. M. J. Sci. 1999, 39, 86–108. [Google Scholar]
Figure 1. Variations of selected soil quality indicator measurements over four seasons. CV—coefficient of variability; LS—level of significance; BD—bulk density; AWC—available water capacity; AGG—aggregates. Means within the line with the same letter are not significantly different at p-value ≤ 0.05.
Agriculture 08 00124 g001
Table 1. Crop management practices, soil taxonomic class, and soil texture of the sampled fields at the New Mexico State University (NMSU) Leyendecker Plant Science Center in southern New Mexico, USA.
Experimental BlocksCropsSoil Taxonomic Class *Surface Soil Texture
Block IAlfalfaThermic Typic TorripsammentsSandy loam
Cotton
Pecan
Block IIAlfalfaThermic Vertic TorrifluventsClay loam
Cotton
Pecan
Block IIIAlfalfaThermic Vertic TorrifluventsClay loam
Cotton
Pecan
* Soil classification according to USDA (United States Department of Agriculture) [12].
Table 2. ANOVA results of treatment effects and their interaction for soil measurements.
Soil MeasurementsCrop ManagementSampling DateSampling Date x Crop Management
MWD ns*ns
WAS ns***ns
AGG > 2 mm nsnsns
AGG < 0.25 mm ns*ns
AWC ns***ns
BD ns***ns
pHns*ns
EC *nsns
SOM ns***ns
NO3-N ****
K ns***ns
P ns*ns
Zn ****ns
Mnnsnsns
Fe nsnsns
Cu ns*ns
Mg *nsns
Ca *nsns
Na **ns
SAR***ns
POXC ns***ns
* p-value = 0.05, ** p-value = 0.01, *** p-value = 0.001; ns— not significant. Crop management (df) = 2; season (df) = 3; season x crop management (df) = 6. MWD—mean weight diameter; BD—bulk density; AWC—available water capacity; AGG—aggregates; WAS—wet aggregate stability; EC—electrical conductivity; SOM—soil organic matter; SAR—sodium adsorption ratio; POXC—permanganate oxidizable carbon.
Table 3. Mean separation and coefficient of variation of soil chemical measurements at different sampling dates.
Soil MeasurementsFallWinterSpringSummer* LS** CV
EC (dS m−1)1.911.691.982.01 ns7.6%
pH7.15 b 7.29 a7.29 a7.23 ab5%0.9%
Mg (mg kg−1)31.62 ab29.43 b38.67 a34.05 ab1%11.9%
Ca (mg kg−1)186.97165.13204.81203.21ns9.7%
Na (mg kg−1)189.52 b184.23 b244.95 a202.40 b1%13.4%
SAR3.24 b3.30 b3.89 a3.31 b1%8.9%
NO3-N (mg kg−1)20.65 a8.54 b7.52 b15.68 a1%47.4%
P (mg kg−1)10.20 a9.69 a7.89 b9.23 ab5%10.7%
K (mg kg−1)34.89 a30.04 b21.66 c27.60 b1%19.3%
Fe (mg kg−1)3.784.284.343.60ns9.2%
Zn (mg kg−1)7.63 a2.62 b1.09 b1.01 b5%101%
Mn (mg kg−1)3.572.792.163.19ns20.6%
Cu (mg kg−1)1.38 a0.95 b1.27 a1.19 ab5%15.2%
means within a row followed by the same letter are not significantly different. * LS—level of significance; ns—not significant; ** CV—coefficient of variability; EC—electrical conductivity; Mg—magnesium; CA—calcium; Na—sodium; SAR—sodium adsorption ratio; NO3-N—nitrate nitrogen; P—phosphorus; K—extractable potassium; Fe—iron; Zn—zinc; Mn—manganese; Cu—copper.
Table 4. Mean separation of the measured soil indicators as a function of crop management.
Soil MeasurementsAlfalfaCottonPecan
MWD (mm) 1.051.041.02
WAS (%)56.6649.4546.35
AGG >2 mm (%)32.0932.1232.71
AGG <0.25 mm (%)23.0128.7125.18
AWC (m3 m−3)0.260.230.23
BD (Mg m−3)1.391.301.47
pH7.107.257.33
EC (dS m−1)1.21b2.82 a1.68 a
SOM (g kg−1)12.19.18.5
NO3-N (mg kg−1)10.23 ab23.45 a5.62 b
K (mg kg−1)23.2630.8231.56
P (mg kg−1)8.888.7810.11
Zn (mg kg−1)1.84 b5.62 a4.30 a
Mn (mg kg−1)3.403.152.24
Fe (mg kg−1)4.353.584.07
Cu (mg kg−1)1.291.191.11
Mg (mg kg−1)23.10 b49.98 a27.72 b
Ca (mg kg−1)128.86 b296.59 a144.69 b
Na (mg kg−1)112.93 b309.35 a193.66 ab
SAR2.28 b4.25 a3.78 a
POXC (mg kg−1)417.82411.37410.18
Means within a row followed by the same letter are not significantly different at p-value ≤ 0.05.
Table 5. Nitrate nitrogen as a function of crop management practices and sampling dates.
Crop ManagementNitrate Nitrogen (mg kg−1)
WinterSpringSummerFall
Alfalfa9 Bb8 Ba13 Ab11 Bb
Cotton14 Ca12 Ca25 Ba42 Aa
Pecan2 Bc3 Bb8 Ac9 Ab
A, B, and —means within a row followed by the same letter are not significantly different at p-value ≤ 0.05; a, b, c—means within a column followed by the same letter are not significantly different at p-value ≤ 0.05.

