The Impact of Human Error in the Use of Agricultural Tractors: A Case Study Research in Vineyard Cultivation in Italy


1
Department of Mechanical and Aerospace Engineering, “Sapienza”—University of Rome, via Eudossiana 18, 00184 Rome, Italy
2
Department of Rural Development, Ministry of Agriculture, Food and Fishery, DISR III, via XX Settembre 20, 00187 Rome, Italy
3
Department of Chemical Engineering Materials and Environment, “Sapienza”—University of Rome, via Eudossiana 18, 00184 Rome, Italy
4
National Institute for Insurance against Accidents at Work (INAIL), Via Fontana Candida 1, 00078 Monte Porzio Catone (RM), Italy
*
Author to whom correspondence should be addressed.
Agriculture 2018, 8(6), 82; https://doi.org/10.3390/agriculture8060082
Submission received: 6 May 2018
/
Revised: 8 June 2018
/
Accepted: 8 June 2018
/
Published: 11 June 2018
Abstract
:Recently, standards and regulations concerning occupational safety have become more and more rigorous. Nevertheless, the number of accidents and victims has not decreased significantly, as reported by official statistics. In Italy, the agricultural sector is certainly one of the most affected by this situation, especially taking into account the occurrence of serious injuries and fatalities related to the use of tractors. The main reasons for such a situation can be ascribed to the peculiarities of agricultural operations. Therefore, when analyzing the root causes of agricultural accidents, a user-centered approach is needed in order to make the development of health and safety interventions easier and more effective. Based on this, the present paper proposes a practical case study research focused on integrating the factor of human error into the risk assessment procedures of agricultural activities in vineyard cultivation. Such an approach allowed us to consider the impact of human error—while performing work activities (e.g., the use of a tractor)—on hazards and related hazardous events in a thorough manner. The proposed approach represents a novelty in the sector of the safety assessment of agricultural activities, providing a first valuable basis for further analysis and implementation by researchers and practitioners.
1. Introduction
The growing awareness of the importance of safety in the agricultural and forestry activities is supported by a continuous improvement of standards and regulations concerning both occupational and work equipment safety [1]. Nevertheless, the number of accidents and victims in this sector is still significant, and agriculture is recognized as being among the most dangerous industries [2,3,4]. The main reasons for such a situation can be ascribed to the peculiarities of agricultural operations. In fact, the different typologies of activities carried out by the same operators, the use of obsolete machinery and equipment, the continuous change of workplaces, and the simultaneous use of the working site by different operators, are all elements that can make the task of assessing and managing risk excessively complex [5,6]. In addition, weather conditions and unpredictable work schedules during seasonal production periods present further uncertainty in risk assessment model inputs [7]. Accordingly, Kim et al. [8] underlined the complexity of finding the root causes of agricultural accidents, and highlighted the need to implement a user-centered approach to making the development of health and safety interventions more effective. In line with this, numerous studies have highlighted that most accidents are due to unsafe work conditions and operators’ behavior [9,10,11].
Hence, a more detailed study of operators’ behavior while performing work activities needs to be addressed in order to properly analyze risk factors, and consequently, adopt effective preventive and protective measures [12,13,14]. In other words, a human-centered approach should be adopted to take into account human behaviors performed in work situations [15], as well as all the activities related to the use of a work equipment, considering foreseeable errors during its operation [16,17]. As a matter of fact, of human error is one of the major causes of accidents [18,19]. With the words “human error” we consider the error types classified by Reason [20]: slips and lapses (i.e., execution errors due to attentional or memory failures, respectively); mistakes (i.e., diagnostic and decision-making failures); and violations (i.e., intentional and unintentional deviations from accepted procedures, standards and rules) [21,22,23,24].
In particular, while half the accidents in agriculture occur when operating machinery [25], two-thirds of them are influenced by haste, fatigue, and stress [9]. Consequently, a proactive and thorough approach aimed at effectively performing hazard identification and risk reduction should be implemented [26,27].
To be more precise, risk assessment should consider the mutual influences that might arise among the different risks and the related potential effects, since carrying out risk assessment in a sequential manner (i.e., cause-effect analysis) is insufficient, given the complexity of these interactions [28]. Moreover, the lack of data on accidents in the agricultural field complicates the implementation of commonly-used risk assessment methods [29]. On the other hand, a human-centered approach is needed, since “safety is, above all, behavioral and individual”, to use the words of Llory [30]. In a practical context, this is particularly important when analyzing the risks of working activities related to the use of a machinery or work equipment [29,30,31,32,33,34,35,36].
To deal with these issues, several studies have recommended the use of the Quality Function Deployment (QFD) method [37] as a means of performing hazard analysis and risk assessment of working tasks in a holistic manner [18,38,39]. Its application in the agricultural field is also reported [28,40], to some extent. Nevertheless, these studies do not provide a detailed analysis of the human factors related to potential risks, providing little information on how human interaction with agricultural working tasks might lead to incidents.
In order to address these issues, the present study aims at investigating operators’ behavior, examining how a specific working activity is carried out, the task steps, the equipment used, and the relationships between these factors, with the goal of integrating risk analysis with information useful for error prediction strategies.
In more detail, the proposed approach integrates the QFD method with the following tools, which were classified as error prediction techniques by Lyons [41]:
Such an approach has been verified through a case study concerning vineyard cultivation in collaboration with a company operating in the central part of Italy.
The remainder of the paper is structured as follows: in the next section, background and motivations are discussed. In Section 3, our research approach is described, while Section 4 illustrates the case study. Section 5 discusses the achieved results, and Section 6 concludes the paper by addressing further research work.
2. Background and Motivations
As mentioned, the number of accidents in agriculture is consistently high at a global level [8,13,44,45]. In the EU, agriculture is considered a high-risk industry; together with manufacturing, construction, and transportation, it accounted for about 15% of all fatal accidents at work, as reported by official statistics [46].
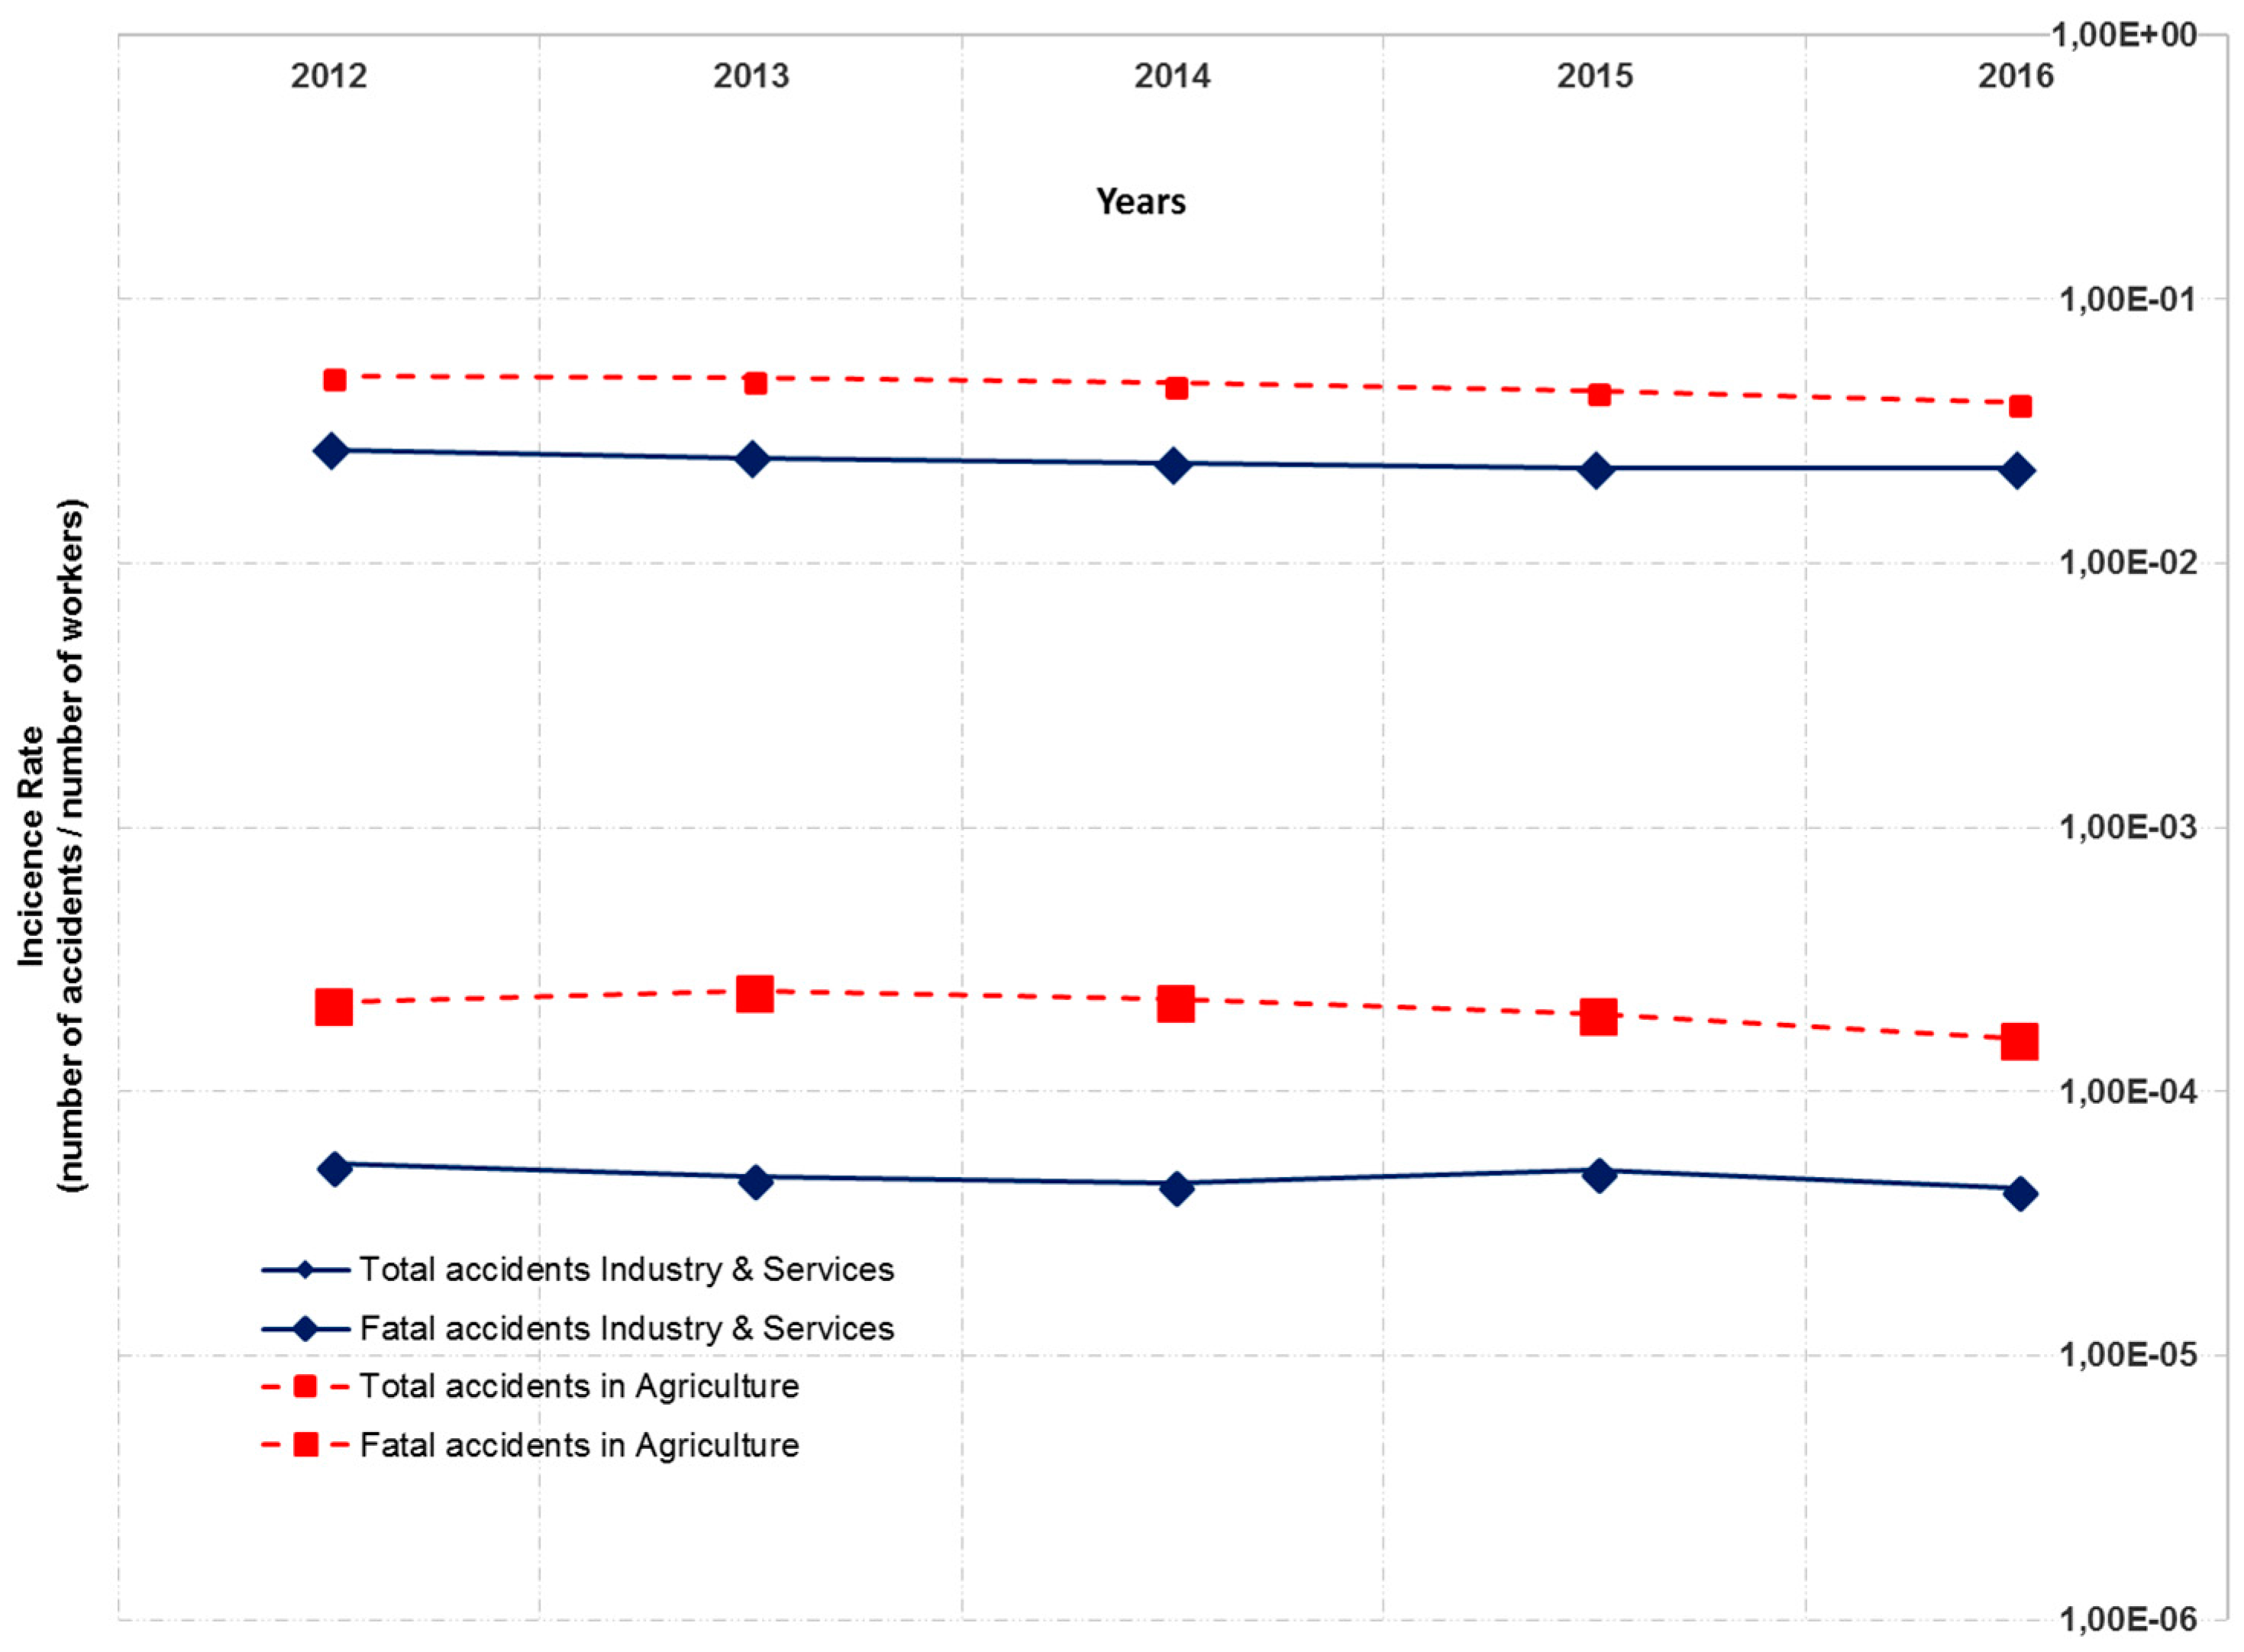
In Italy, the occurrence of fatalities in this sector is also significant [47]. Official statistics [48] which consider regularly employed workers show that in recent years, in spite of a slight reduction, more than 100 people lost their lives. In particular, Figure 1 shows the trend of the incidence rate (i.e., the number of accidents in relation to the number of employed workers) in agriculture (broken lines), compared with accidents in the industry and service sectors (solid lines) in the period from 2012–2016 [48,49]. The upper lines indicate the trend of total accidents, while the bottom lines denote the trend of fatal accidents.
Furthermore, the official statistics only consider accidents that occurred to regularly employed workers; if we take into account temporary or part-time workers in addition to the regular ones, self-employed workers and the so-called “hobbyists” (i.e., people running agricultural activities during their spare time or after retirement), the rate of accidents is higher. For instance, considering the data collected by the special Observatory issued by the National Institute for Insurance against Accidents at Work (INAIL) to monitor such a phenomenon, it clearly emerges how dangerous agricultural activities are, and how relevant the number of fatal accidents involving the use of tractors is (Table 1).
A more detailed analysis focused on the latter aspect, brought to light that this type of accident, is related to different activities, such as ripping, harvesting, pesticide application, or when the tractor is used as a power unit [28]. The types of events that led to fatalities are summarized in Table 2 [50,51].
In light of this high rate of accidents, the agriculture sector is considered a high-risk industry, e.g., similarly to the construction sector, which presents comparable characteristics [52,53]. Consequently, occupational safety laws and regulations are stricter than in other working contexts, for example, as far as the rules related to mandatory training of workers and machinery operators are concerned [54].
Nevertheless, while much research has investigated the adoption of a human-centered safety management approaches in different sectors [30,55,56,57,58], few studies have analyzed the problems related to the safe use of agricultural and forestry machinery considering the human behavior standpoint. For instance, Cividino et al. [59] considering the type of accidents occurring in the Friuli Venezia Giulia region (North-East of Italy), highlighted the fact that one of the main reasons for accidents related to the use of tractors is the high percentage of non-compliance with laws and regulations concerning safety issues, which users tend to consider as safe equipment. Görücü et al. [60] focused on the drivers’ perception and accuracy in estimating the tilt angles when riding a tractor across slopes, since side overturns are among the most common and dangerous types of tractor accidents. Similarly, Caffaro et al. [61] investigated the risk perception of elder farmers, providing useful insights for improving the safety level of this category of operators. Houshyar and Houshyar [62] highlighted the lack of a proper perception of safety issues among tractor drivers in Iran. Other studies [63,64] have investigated the role of proper pictograms on agricultural machinery: a consistent insight from these research works highlights the fact that, by developing familiarity with the machine through routine upkeep and inspection, the operator can increase his/her knowledge of the potential safety hazards and related pictorials. A human-centered approach was applied by Cutini et al. [47] in order to design an effective usage manual for agricultural machinery. They stressed the importance of user support in selecting the topics to include in the manual, as well as in assessing its usability.
A more specific study by Irwin and Poots [65] investigated the non-technical-skills that farmers might use to ensure effective and safe performance at work. In particular, the authors demonstrated how psychosocial factors, such as stress, fatigue, time pressure, and poor awareness of situations, can also have an impact on the safe use of machinery, as the latter was recognized as being among the most hazardous activities by the interviewed people. Accordingly, in a further study [66], they argued that, on the one hand, unsafe behaviors could be linked to poor situation awareness, as opposed to intentional violations. On the other hand, operators that ignore their work environment are more inclined to take shortcuts or violate the rules on a regular basis. Nevertheless, although the above-mentioned studies provide remarkable research insights concerning operator risk perception and safety attitudes, the occurrence of errors from a safety management point of view still appears to be underestimated. In fact, to the authors’ knowledge, the practical inclusion of aspects related to human error in risk assessment procedures for agricultural activities has only partially been taken into account.
Hence, the present paper aims at reducing such inadequacies, proposing a practical case study research focused on the integration of human factor considerations within a risk assessment procedure for agricultural activities. In other words, to deal with these issues, the following research question can be raised: How should we consider, in an effective and thorough manner, the impact of human error while performing working activities (e.g., the use of a tractor) on hazards and related hazardous events?
With the aim of providing an answer to this research question, the present study proposes a risk assessment procedure based on the use of the QFD method to better address the mutual relationships among working tasks, hazards, and possible risks, thus augmenting the benefits of our method by means of the integration of human error prediction techniques, such as HTA and HEART.
3. Materials and Methods
In this section, a description of the methods and techniques used is provided, focusing on the proposed risk assessment methodology.
3.1. Quality Function Deployment
The Quality Function Deployment (QFD) method [37] is a well-known tool [40,67,68], used in design and management contexts to address the requirements of stakeholders (the “Voice of Customer”) in terms of their technical characteristics. At the core of the method is the so-called “House of Quality” (HoQ), whose innermost part is represented by the relationship matrix (Figure 2).
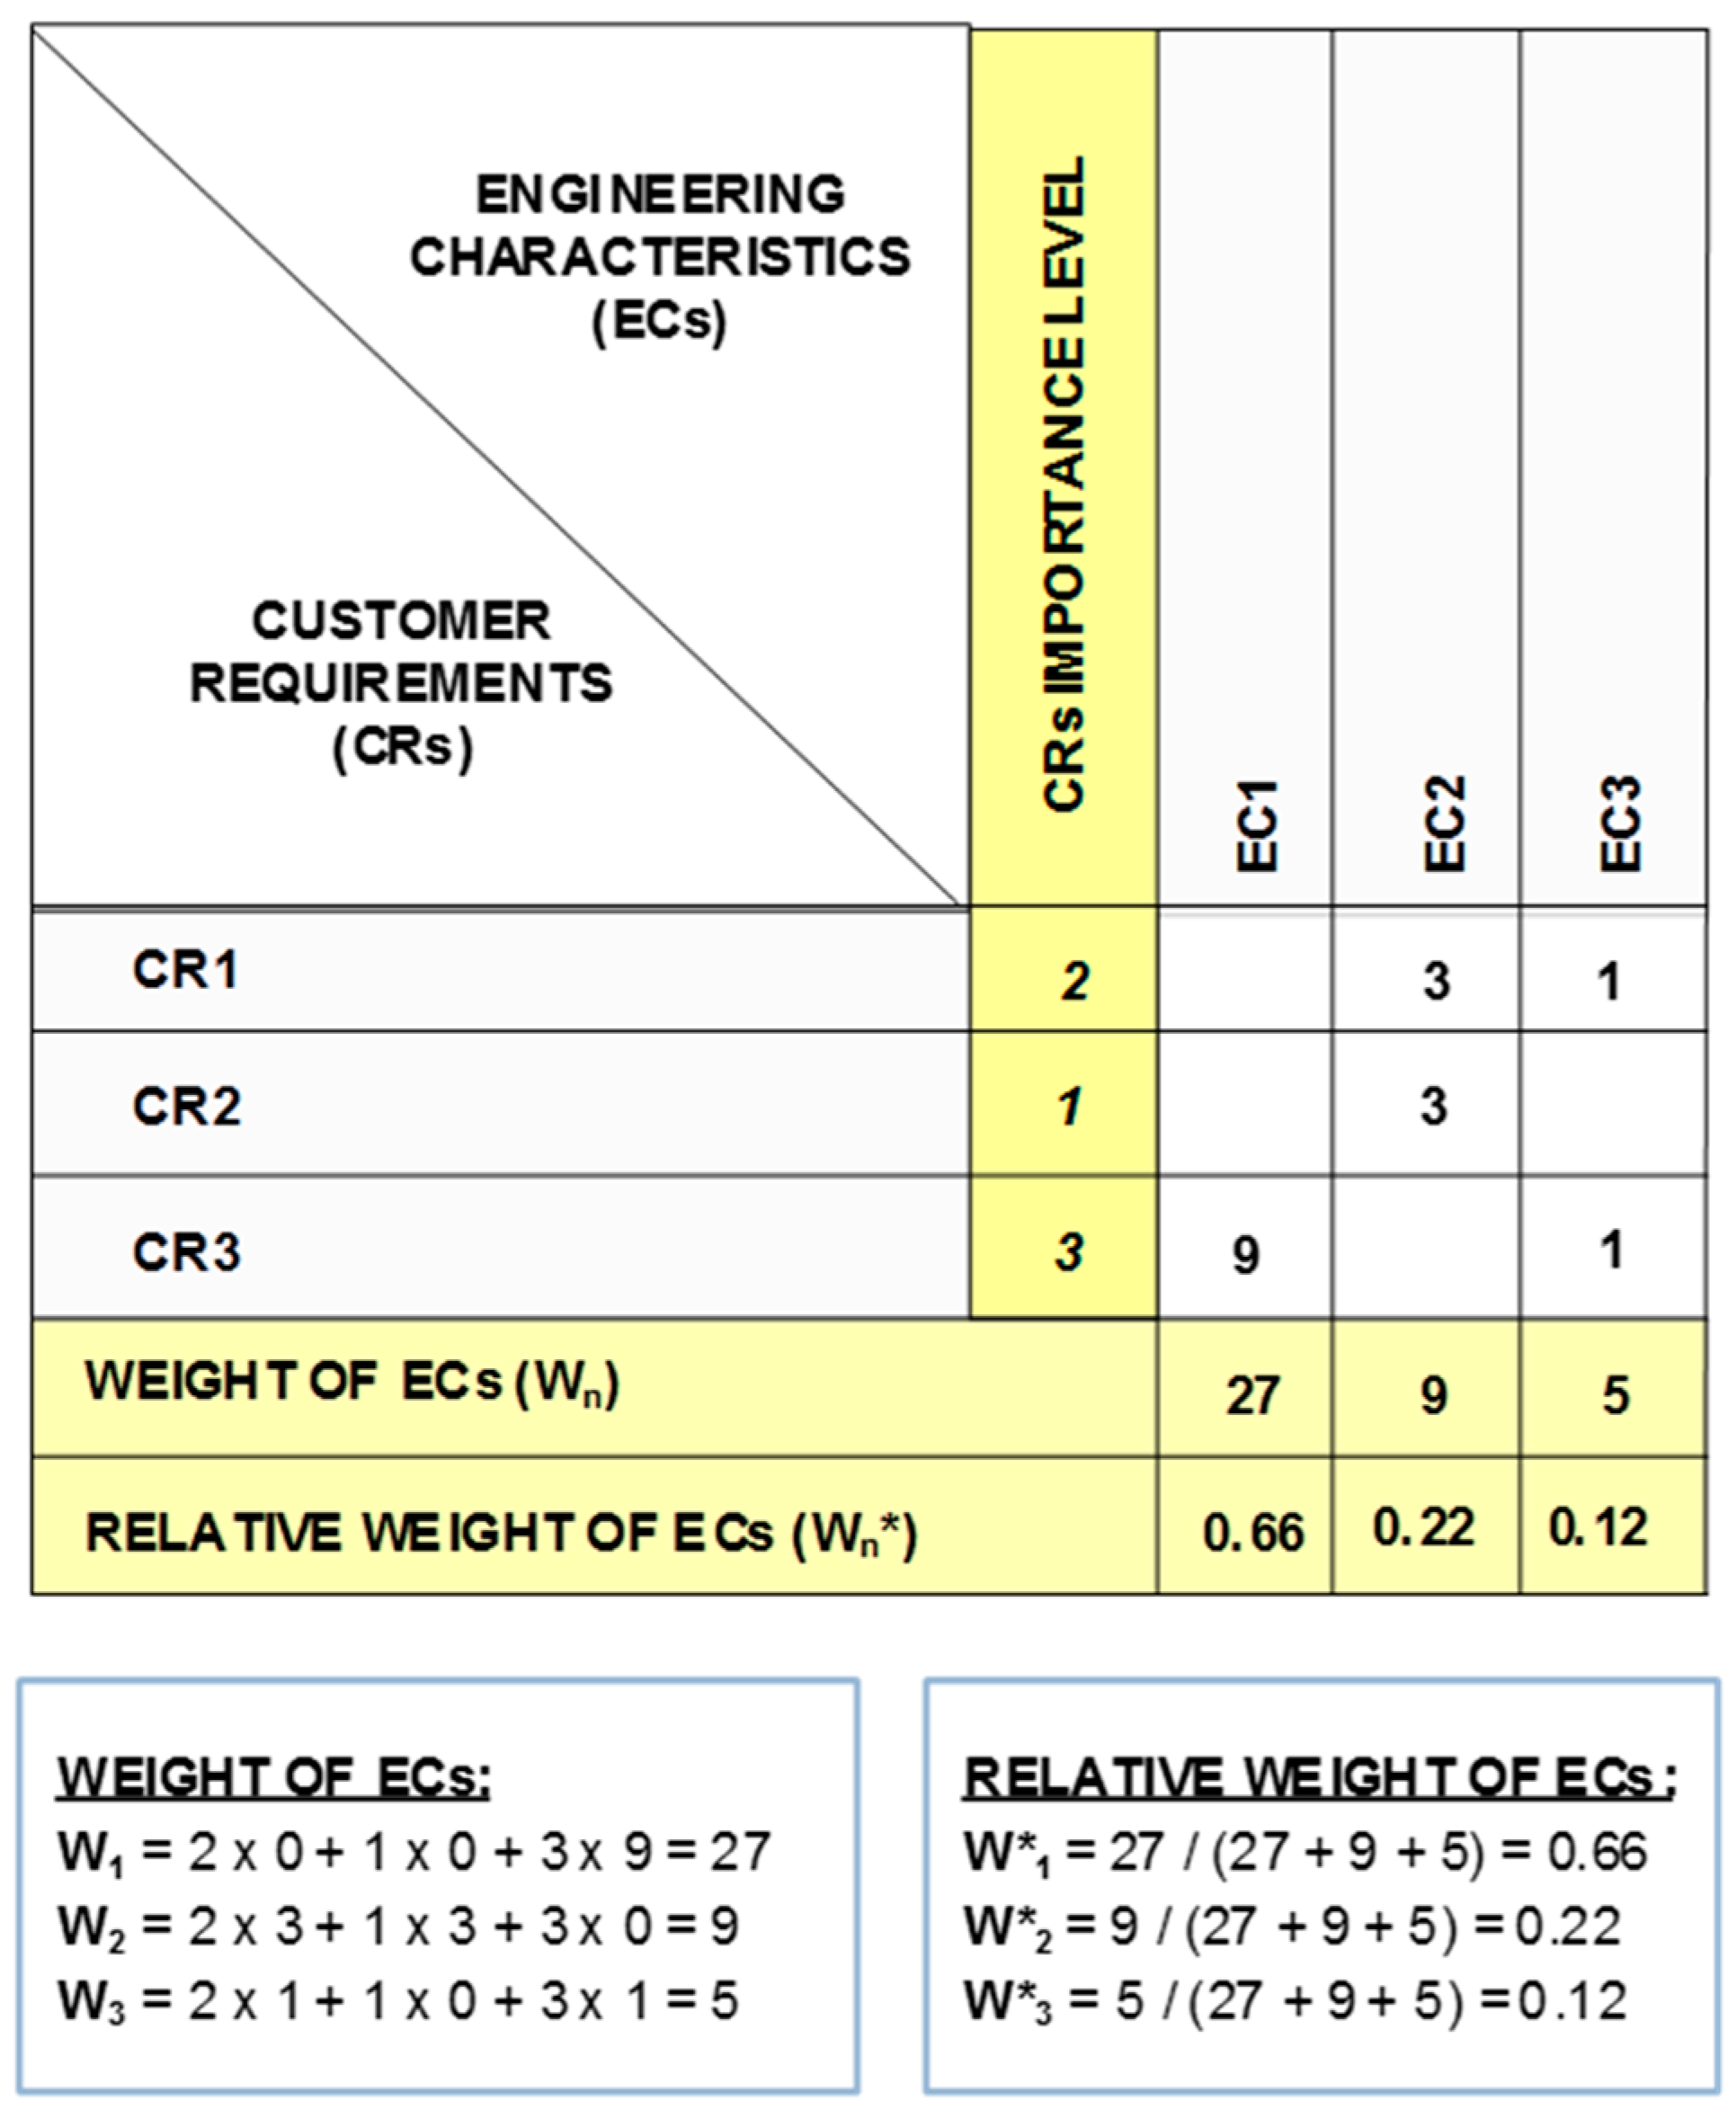
In more detail, HoQ links customer needs and expectations (the Customer Requirements (CRs)) to appropriate technical attributes (the Engineering Characteristics (ECs)) by means of a 1-3-9 score, where 1 represents a low relationship, 3 a medium relationship, and 9 a strong relationship (while a null value means no-relationship), as schematized in Figure 3. The final output is represented by the weight of ECs, as well as their relative (normalized) weight; this consequently provides grounds for their assessment and prioritization [69]. It is worth noting that in traditional HoQ, the importance level of CRs is expressed by means of a score from 1 (low importance) to 5 (high importance).
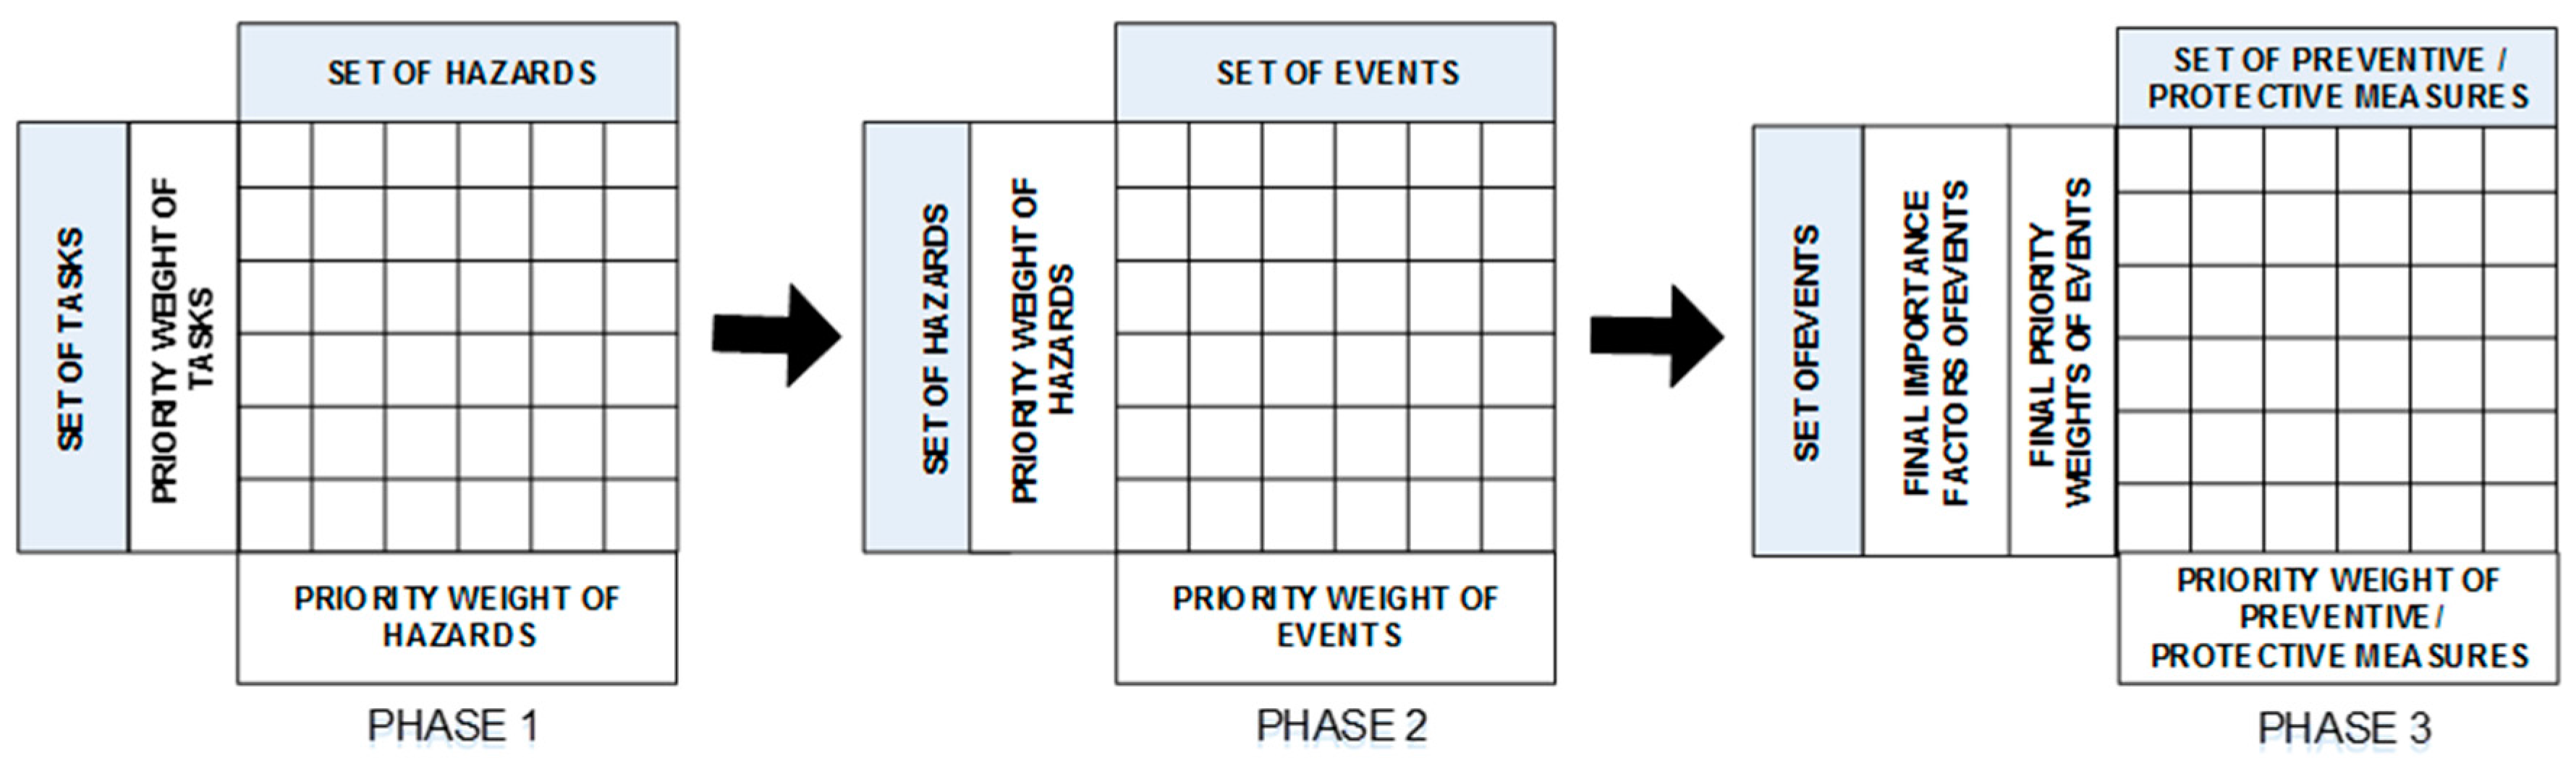
Based on this, different models of QFD have been proposed, starting from the simplest four-phase model [70], where each step is characterized by a specific House of Quality (HoQ). Several studies addressed the use of QFD in safety research [38,39,71]. In particular, the approach proposed by Bas [39] consists of a three-phase method aimed at assessing the relationships among tasks and hazards, hazards and events, and events compared with preventive and protective measures (Figure 4).
This framework presents a useful procedure for risk assessment: in fact, starting from the working tasks, it provides an analysis and evaluation of the impact that a certain hazard can have on different types of events, as well as the effect that a preventive/protective measure can have on more than one hazardous event.
3.2. Hierarchical Task Analysis
The Hierarchical Task Analysis (HTA) technique [72] consists of breaking down working tasks into more detailed subtasks and elementary tasks, structured in a hierarchical manner [41]. This “tree-shaped” structure allows engineers and managers to better plan how to carry out sub-tasks and elementary tasks, in order to properly satisfy the fulfilment of higher-level tasks, taking into account the tasks sequence. As noted by Shepherd [42], although elementary tasks are not necessarily complex in themselves, the higher-level task is complex, since it consists of interrelated elementary tasks. Analyzing where the frequency of events can affect human performance, potential errors can be captured by HTA and classified, e.g., in inter-step (when the operator fails to execute an elementary task or re-arrange its sequence) and intra-step (the failure of an operator to correctly execute an individual elementary task) errors [73]. To maximize the benefits of this technique, a set of generic error modes is needed [74].
3.3. The Human Error Assessment and Reduction Technique
Associating error probabilities with generic tasks, the Human Error Assessment and Reduction Technique (HEART) allows their quantitative evaluation against Error Producing Conditions (EPCs) [43]. In more detail, nine types of generic tasks are identified and associated with nominal human unreliability values P0 (Table 3).
Accordingly, the method distinguishes a set of EPCs that affect task performances (Table 4) by means of the following equations:
where, P represents the human error probability index, P0 is the nominal human unreliability value (from Table 3), and PFi represents the Performance Factor of the i-th activity. EPCi is the Error Promoting Condition (derived from Table 4), while Api represents the proportion assessment factor, i.e., the evaluation of the proportion of each EPCi that exists in the task being assessed. The latter parameter ranges from 0 to 1, depending on the extent to which the effect of the EPCs deviate from the ideal value of 1 [75]. For instance, if engineers evaluate that about 40 percent of the full effect of inexperience is likely to be present (i.e., the operator is not completely inexperienced) a value of 0.4 in the Equation (2) is assigned.
3.4. The Proposed Methodology
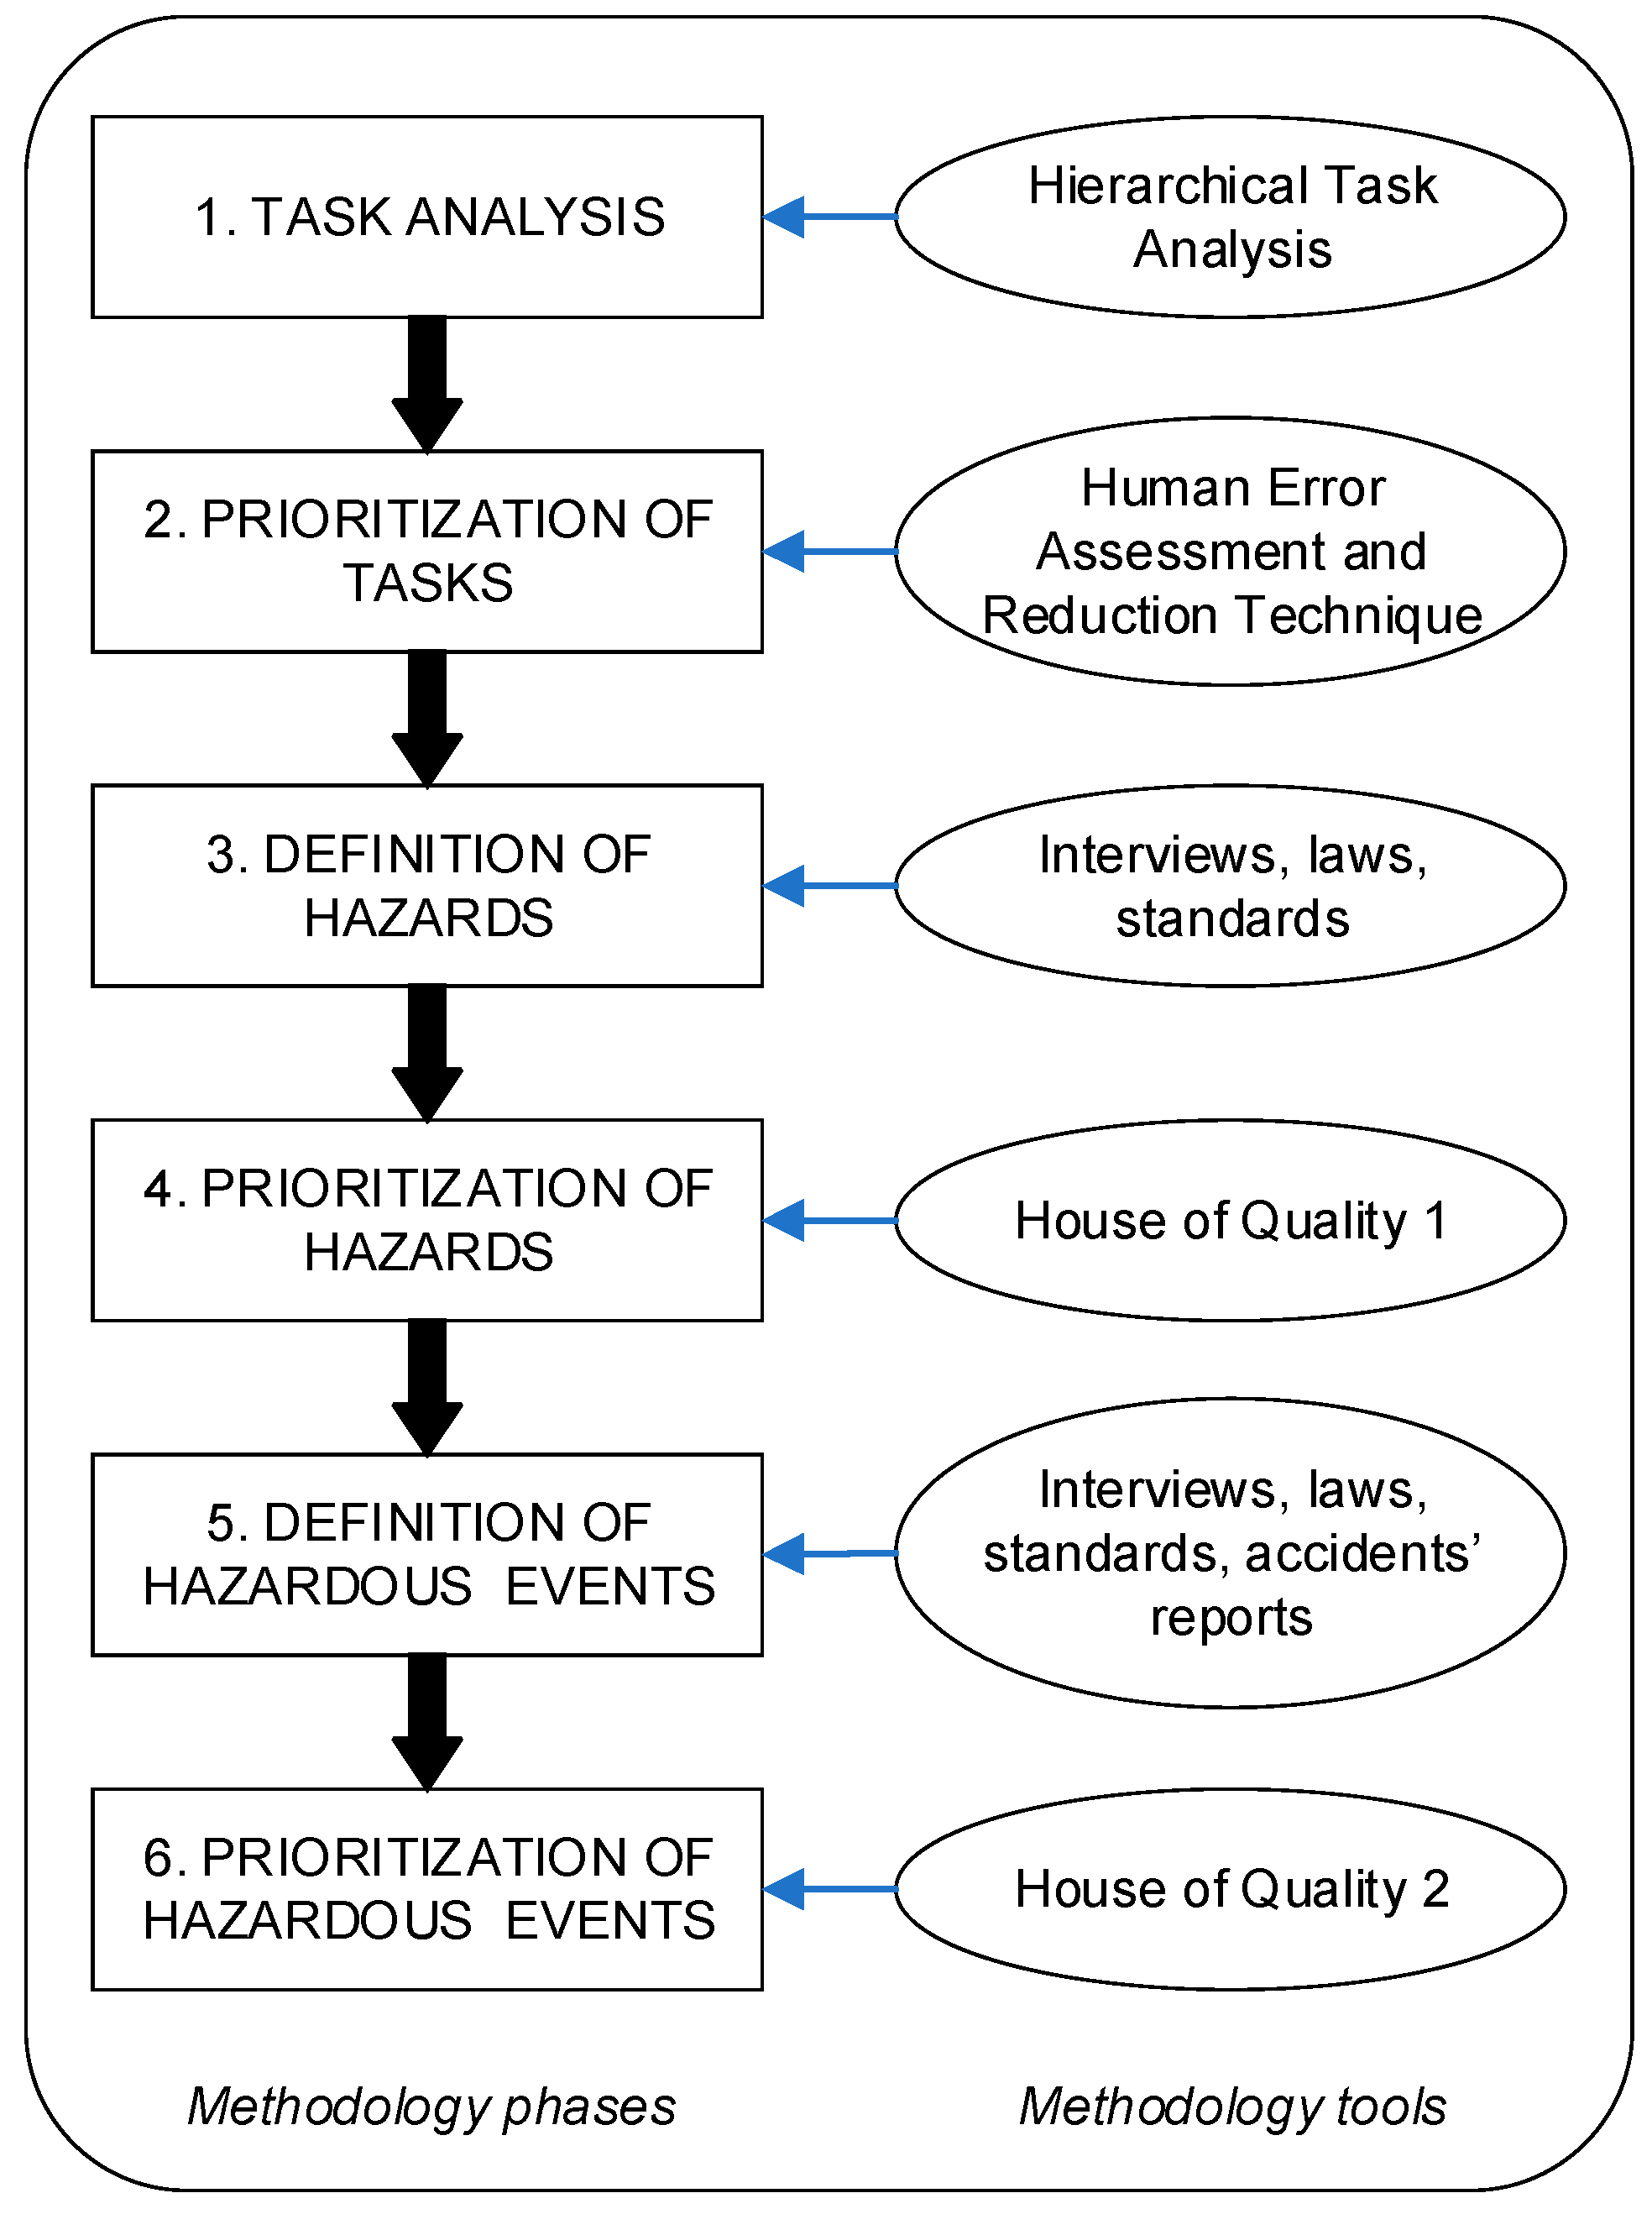
Based on the above considerations, a risk assessment methodology was implemented, with the goal of including human error considerations in the hazard analysis of agriculture working tasks related to the use of machinery (Figure 5).
The general framework of the proposed methodology is based on the use of the QFD method, adapting the approach proposed by Bas [39] to a two-phase procedure, each of which is characterized by the implementation of a HoQ aimed at the prioritization of hazards (HoQ1) and hazardous events (HoQ2). In more detail, the methodology is articulated in the following steps:
1. Task analysis.
The specific activities related to a general task are considered: for instance, if the analysis concerns the use of a tractor, all the work situations related to its use in a specific context should be considered, including the setting operations and equipment connection (e.g., the presence on the tractor of an atomizer or tillage tools).
For this purpose, the HTA method can be used, distinguishing among (Figure 6): general tasks (e.g., use of a tractor in vineyard cultivation), sub-tasks (e.g., preparation of the equipment, mobility, cultivation, and equipment maintenance and cleaning), elementary tasks (e.g., driving position access, connection of working tools and implements, tillage, etc.), and specific activities (e.g., getting in/out from the tractor’s cabin/seat, attaching milling, ripping implements, ripping, milling, spraying fertilizers, etc.).
2. Prioritization of the tasks.
The level of importance of each elementary task/specific activity is evaluated by means of the HEART method, based on the results of semi-structured questionnaires and interviews with operators.
3. Definition of the hazards.
Hazard types related to working tasks are defined, taking into account not only requirements provided by laws and standards, but also the results of the interviews with the operators (e.g., experiences of near-misses), as well as information provided by experts (e.g., guidelines and best practices).
4. Prioritization of the hazards.
The data collected in the previous steps are implemented in the first HoQ, where the tasks represent the “Whats”, the hazards are the “Hows”, while the importance level of the tasks is inputted considering their prioritization at the level of elementary tasks (step 2). It has to be noted that, in the traditional HoQ, the score used in the relationship matrix is based on a 0-1-3-9 scale (0 = no relationship; 1 = weak relationship; 3 = medium relationship; 9 = strong relationship) [38], while different types of scales can be used depending on the context of the study [70]. In this study, to be coherent, we decided to follow the assessment score proposed by Bas [39]: the relationships between tasks and hazards are evaluated by means of a 0-3-9 scale (0 = no relationship; 3 = medium relationship; 9 = strong relationship). The output of this step is represented by hazard prioritization.
5. Definition of hazardous events.
In order to define the possible events related to the hazards highlighted in the previous stages, the analysis of accidents and near-misses, as well as the suggestions provided by standards and guidelines, need to be considered.
6. Prioritization of the events.
As in previous steps, the implementation of the second HoQ allows engineers to evaluate the relationships between hazards (the “Whats”) and events (the “Hows”) by means of a 0-3-9 scale (0 = no relationship; 3 = medium relationship; 9 = strong relationship). As far as the importance level of the hazards, the results provided by step 4 are used. The final output of this step is represented by the prioritization of the possible events that might lead to an accident during the use of a tractor, taking into account the human error probability.
4. Case Study
The validity of the proposed approach was tested in collaboration with two companies that operate in vineyard cultivation: approximately 5 hectares for company A, and 3 hectares for company B, in hilly areas (200 m a.m.s.l. (above mean sea level) and 350 m a.m.s.l. respectively). In more detail, the focus group that was interviewed was composed of two managers (with more than 10 years’ experience in this sector) and 5 operators (3 for company A and 2 for company B, with more than 5 years’ experience with tractors). We selected these two companies for the following reasons. They represent a typical example of companies operating in the Italian agricultural sector, which is mainly founded on SMEs (Small and Medium-sized Enterprises) characterized by a very small number of employees [76]. Moreover, vineyard cultivation is very diffused in Italy; hence, these types of companies can be considered as a representative sample of the national context. In addition, it is worth noting that these two companies were also selected from among others, as they use similar types of machinery. In fact, both companies use narrow-track tractors equipped with a front-mounted reclining ROPS (Roll-Over Protective Structure), while the equipment attached to the tractors consisted of the following machinery:
- Mulcher/shredder
- Rotary tiller
- Atomizer
- Trailer
It is worth noting that, in order to reduce a possible bias, the interviews with each member of the above-mentioned focus group were carried out separately. Similarly, the responses to the semi-structured questionnaires were kept anonymous.
4.1. Task Analysis
The analysis of tasks was carried out using the HTA method (Section 3.2). The results of this analysis are summarized in Table 5.
4.2. Prioritization of Tasks
The assessment of the tasks was carried out by means of the HEART method, as explained in Section 3.3. The first step consisted of an evaluation of the Performance Factors: i.e., considering the activity 1.2.1., “Three-point hitch attachment”, the following types of possible EPCs were considered, taking into account the responses provided by focus group members:
- Poor system/human user interface (EPC n. 6)
- Technique unlearning/one which requires the application of an opposing philosophy (EPC n. 9)
- Mismatch between perceived and actual risk (EPC n. 12)
- Inexperience (e.g., newly qualified but not an expert) (EPC n. 15)
An example of the evaluation is reported in Table 6.
Accordingly, the assessment of the human error probability index (P) is reported in Table 7.
4.3. Definition of Hazards
The hazards related to the examined tasks were defined considering both data concerning accident reports and the requirements of laws and regulations. The final result of this step is summarized in Table 8.
4.4. Prioritization of Hazards
In this stage, the first HoQ is implemented, where the “Whats” are represented by the tasks (Section 4.1) and the “Hows” by the hazards defined in the previous step. As far as the fulfilment of the relationship matrix is concerned, the members of the focus group were asked to evaluate the relationships using a 0-3-9 scale, as explained in Section 3.4. As for the importance level of tasks, data obtained in Section 4.2 were considered, taking into account the human error probability of each elementary task.
In detail, when the elementary task consists of several activities, the highest value of the human error probability is considered. For example, for the elementary task 1.2., “Attachment of the equipment”, the score related to the activity 1.2.2., “PTO attachment”, was considered. The obtained results allowed us to evaluate the level of importance of the hazards relative to the tasks and the human error probability associated with the latter (Figure 7).
4.5. Definition of the Hazardous Events
The hazardous events and situations related with both the tasks and hazards examined in the previous steps were defined considering safety laws and standards, data concerning accident reports, and the interviews with the members of the focus group. Following a bottom-up approach [77], the list of the main events that can lead to harm is reported in Table 9.
4.6. Prioritization of the Events
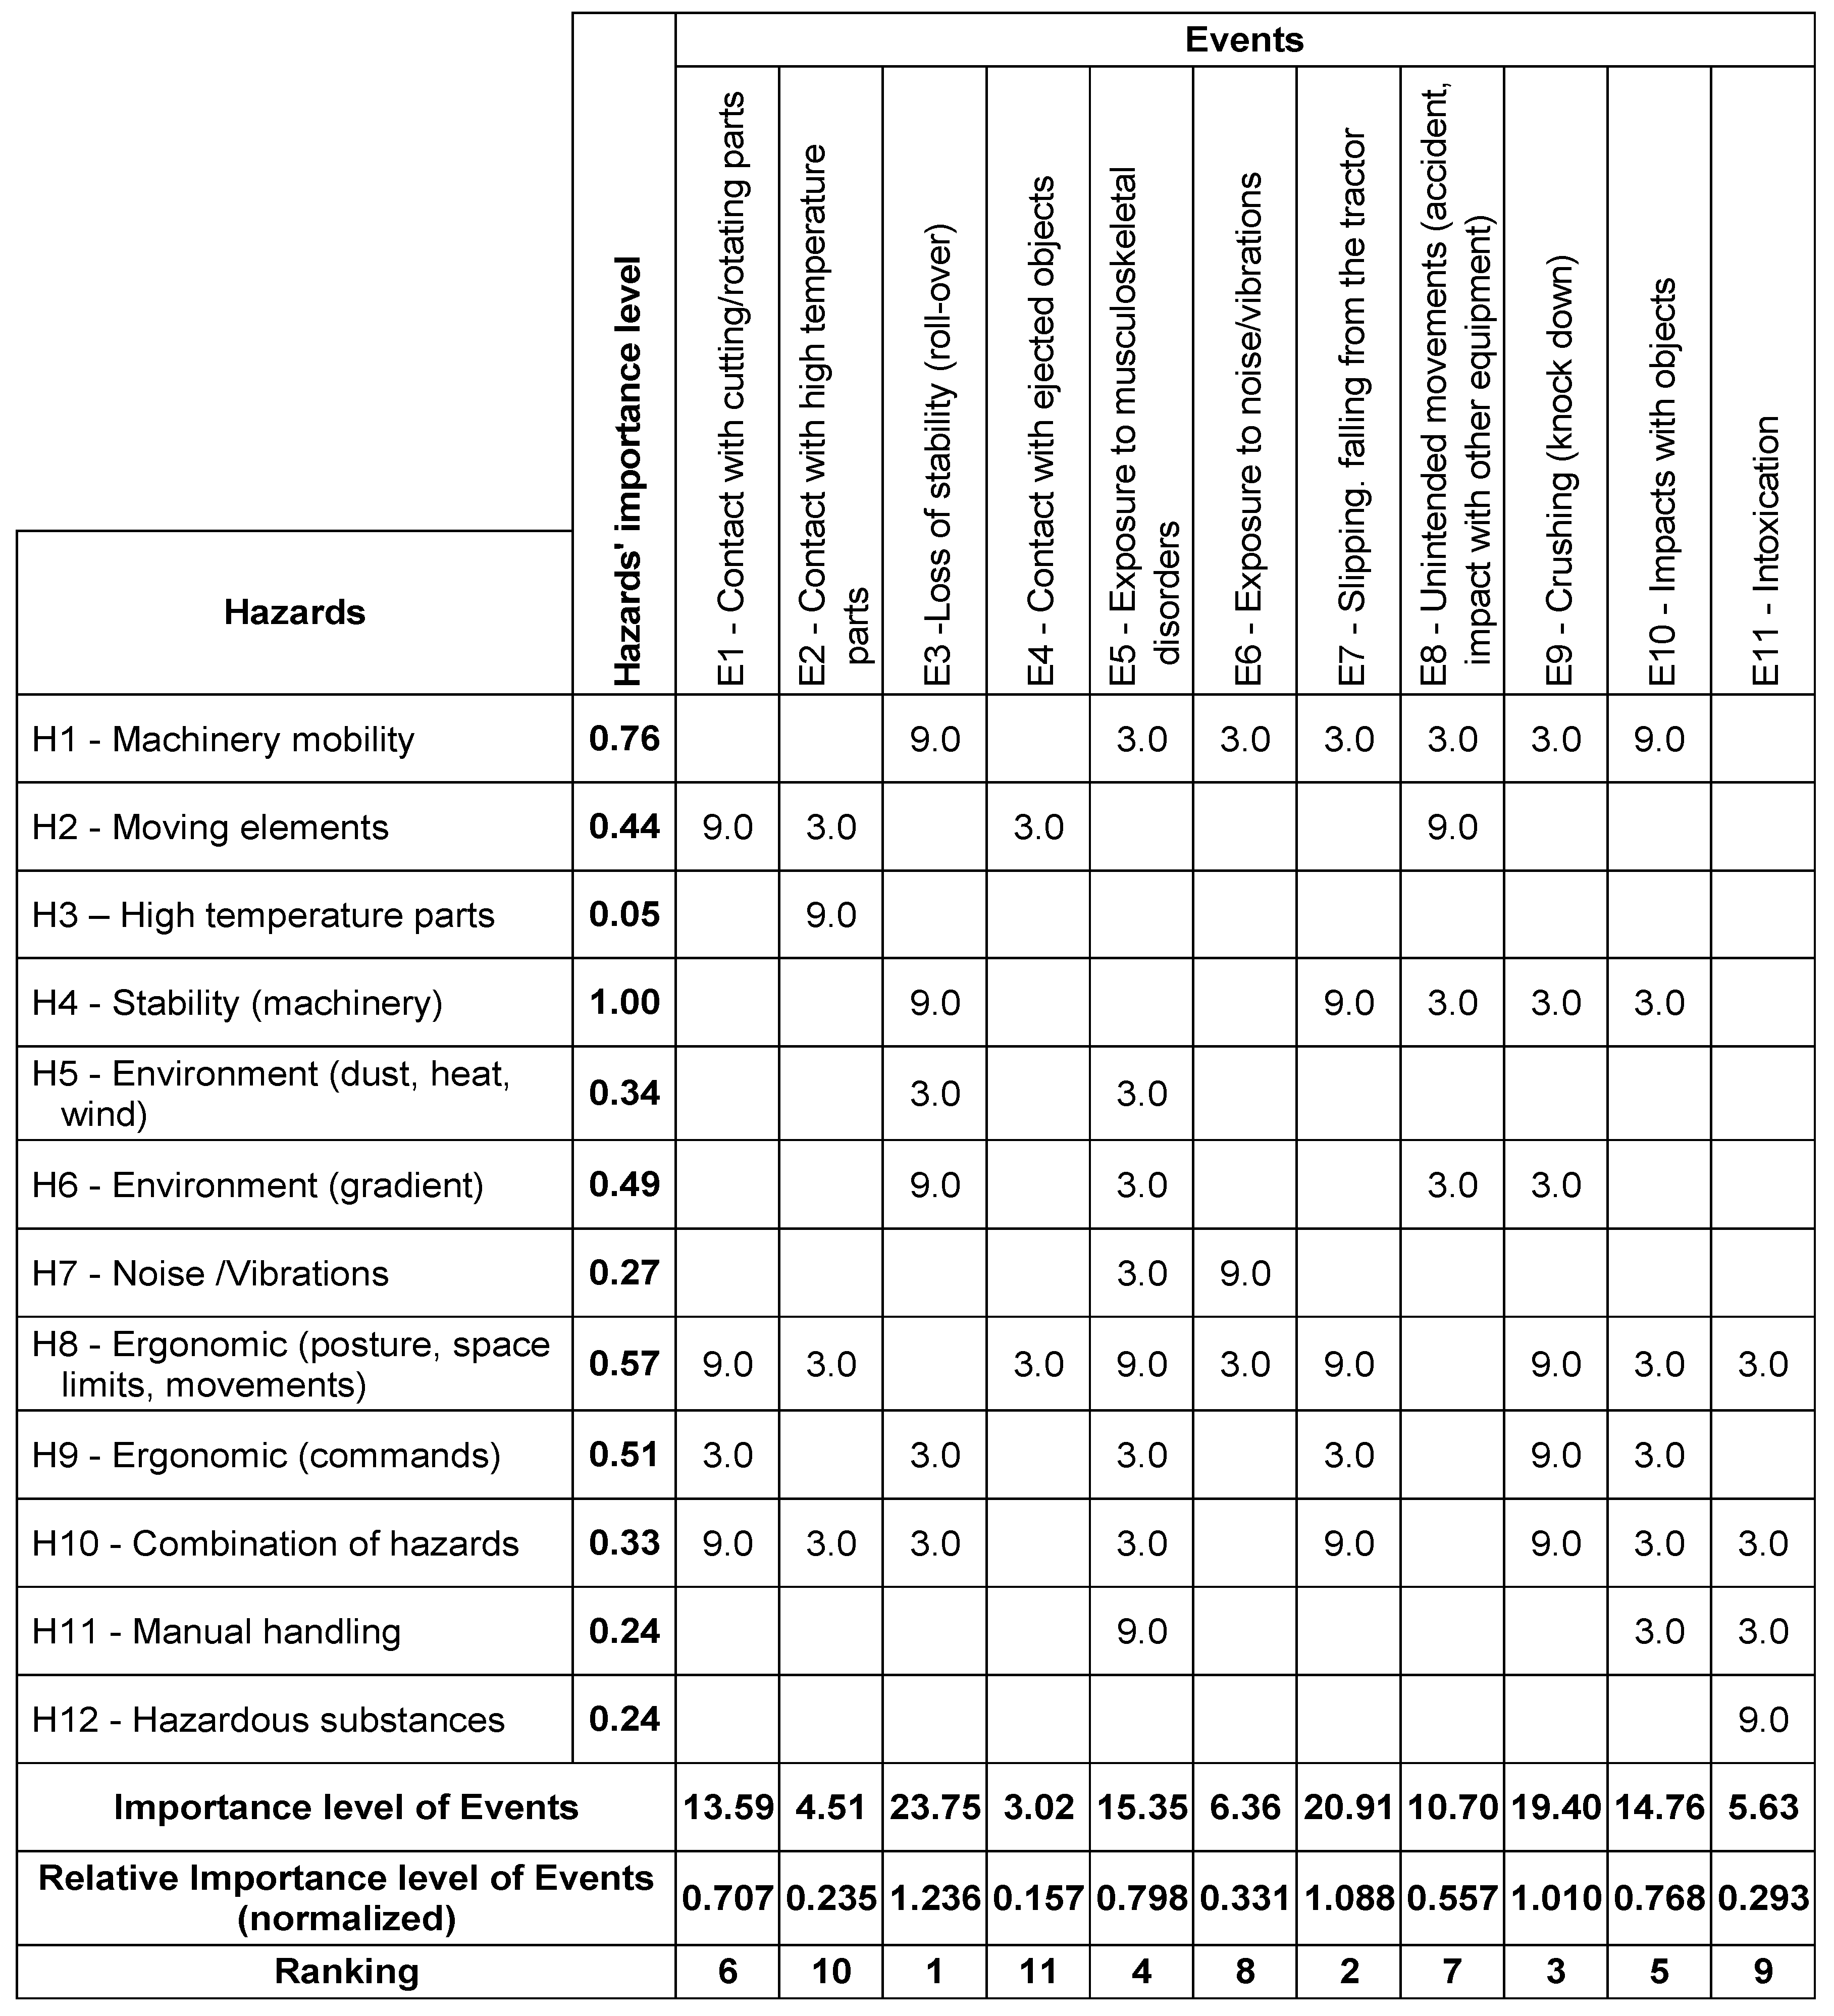
In this stage, the second HoQ was implemented, where the “Whats” are represented by the hazards, and the “Hows” by the events defined in the previous steps. As far as the fulfilment of the relationship matrix is concerned, the members of the focus group were asked to evaluate the relationships using a 0-3-9 scale, as explained in Section 3.4. The obtained results allowed us to evaluate the level of importance of hazardous events (Figure 8).
5. Discussion of Results
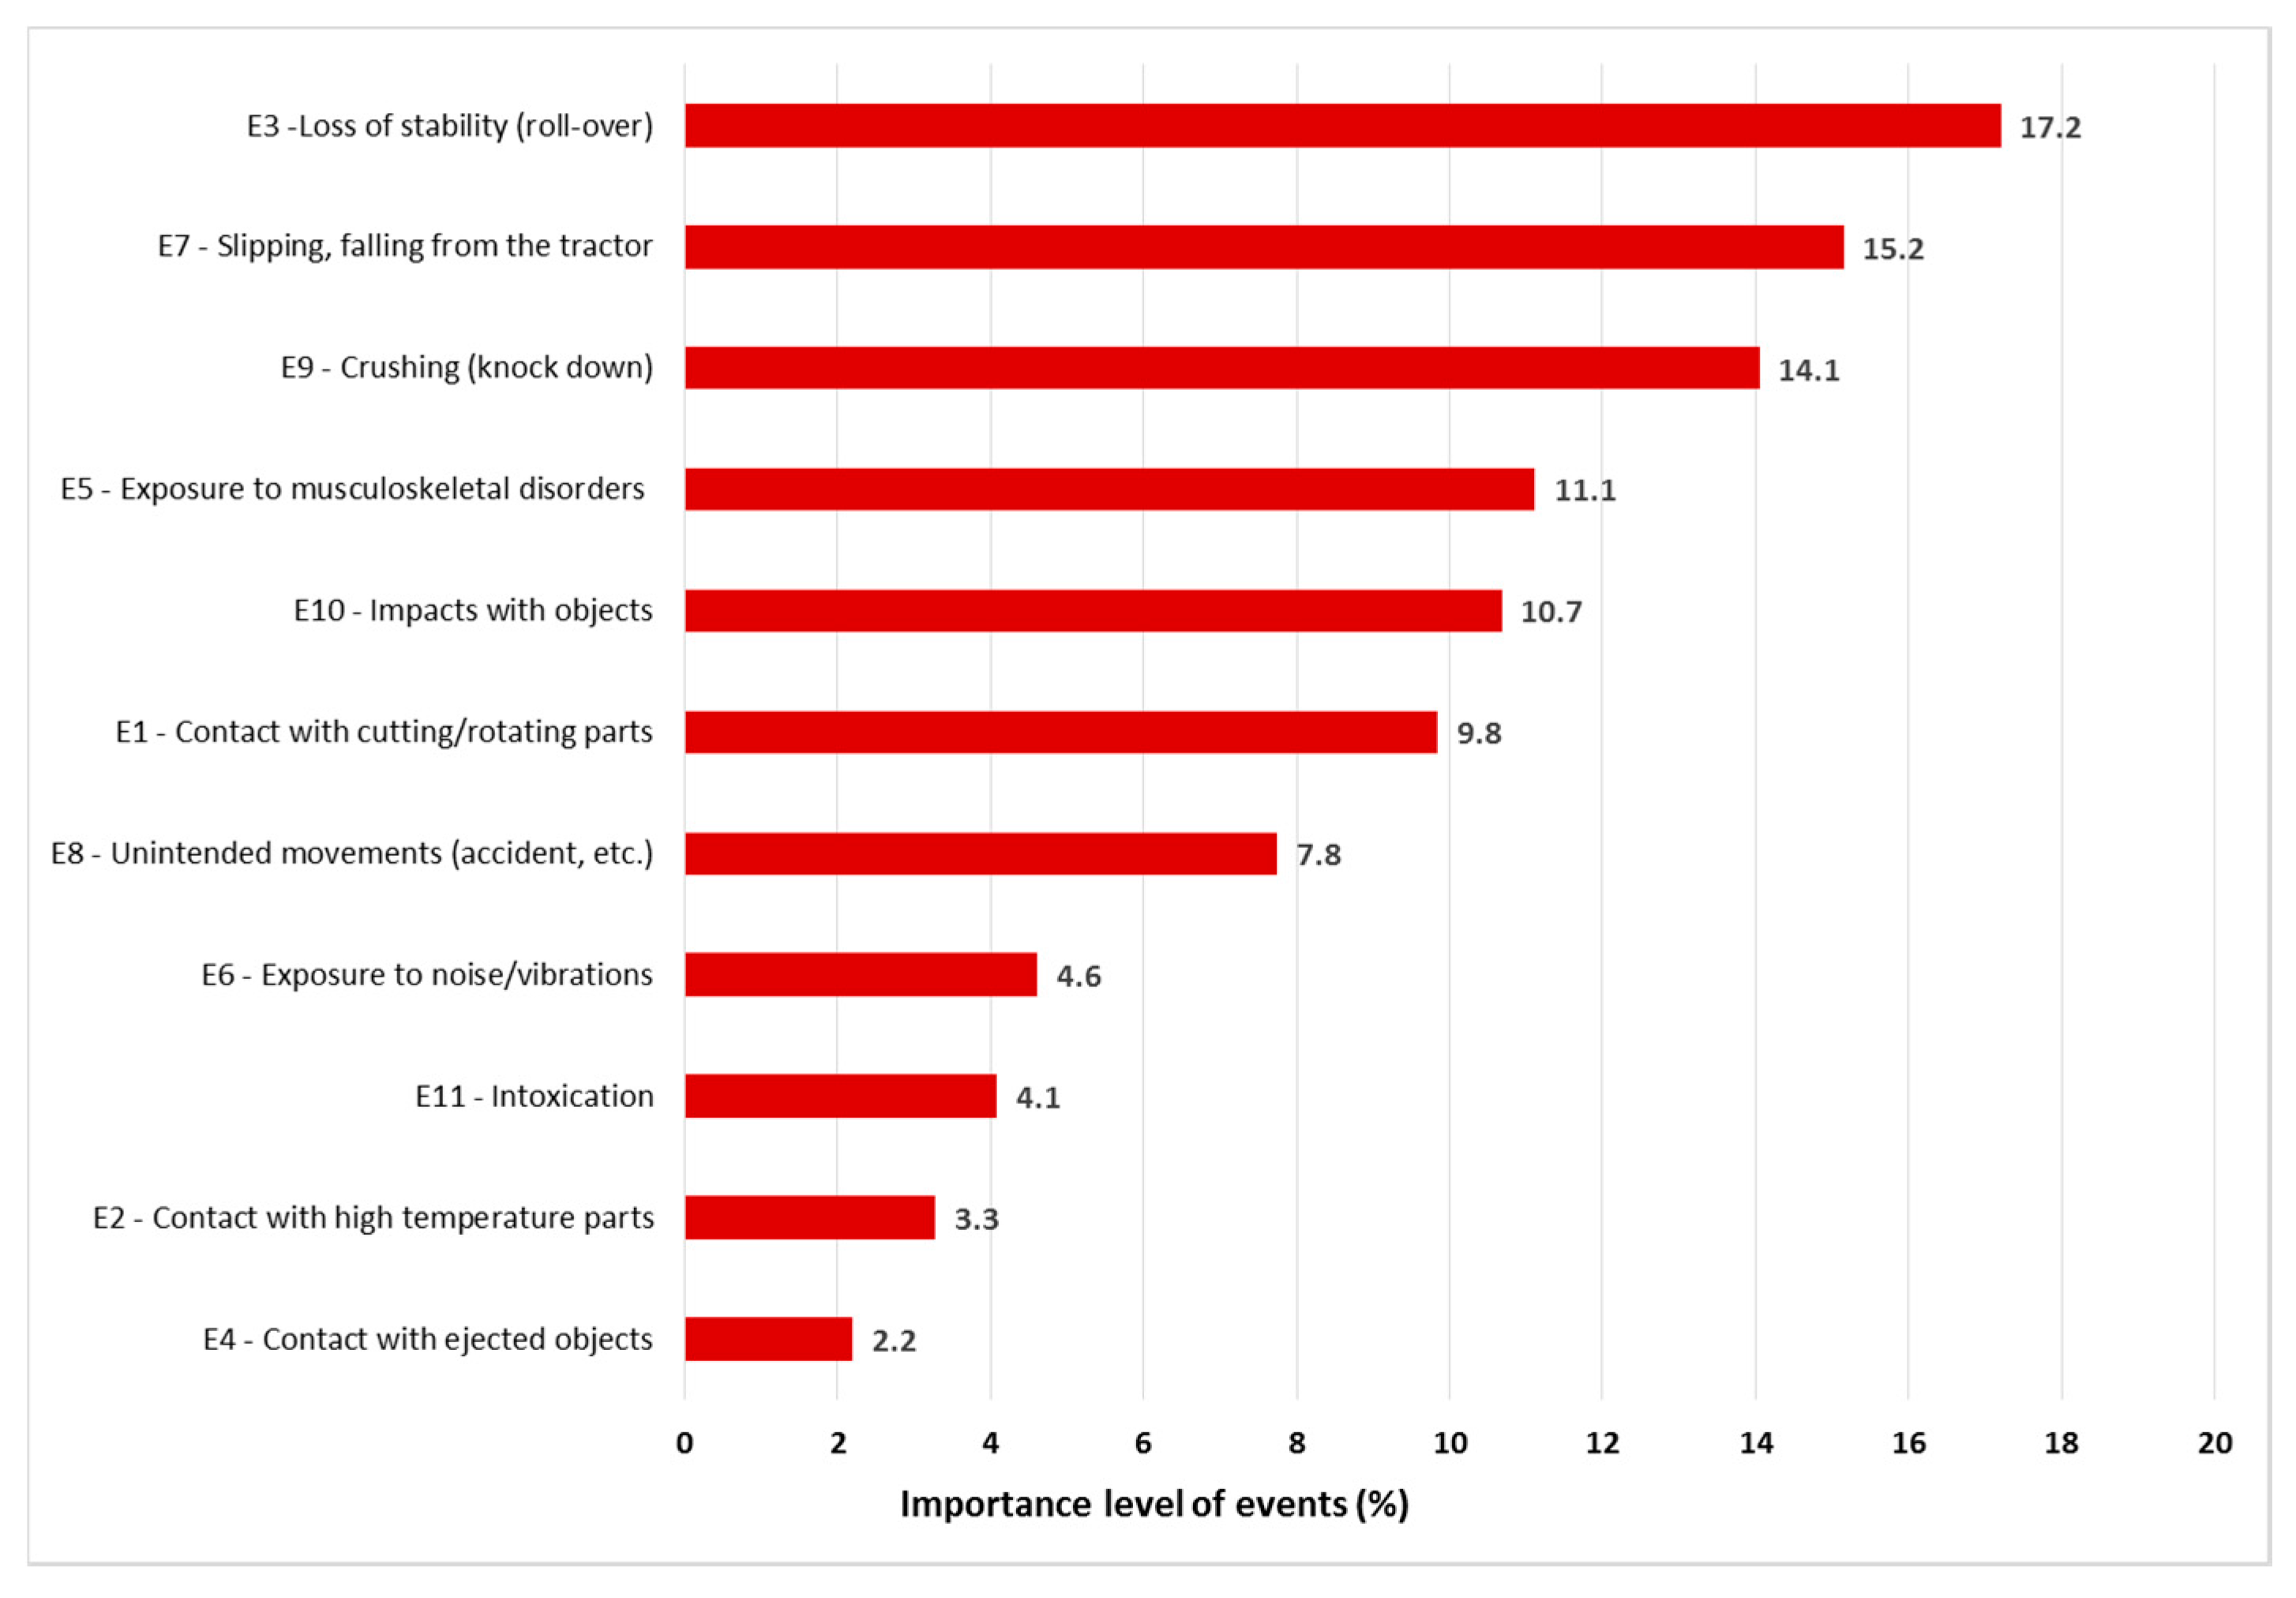
The results obtained from the case study can be summarized in the following figures, where the overall priorities of hazard types (Figure 9) and events (Figure 10) are shown.
As far as hazard types are concerned, the assessment shows that the stability of the machinery (i.e., the tractor and equipment) and its mobility represent the most relevant source of danger when operating in vineyards. Beside this output, which is in line with accident statistics, it is worth noting that problems related to ergonomic issues are also quite significant when considering the effects of human reliability. This agrees with research findings provided by Hagel et al. [78].
In addition, some interesting findings can be observed when analyzing the level of importance of hazardous events. In fact, the most relevant hazardous event is the loss of stability of the machinery (which might lead to tractor rollover), which is mainly due to the fact that the operator often does not correctly use the reclining ROPS. Hence, the analysis of the human error probability index stresses the need for further research aimed at providing solutions to this type of hazardous situation, such as the study of compact ROPS, or automated systems to activate it independently of the behavior of the operator, corroborating the research clues provided by Mayrhofer et al. [25] and Colantoni et al. [54].
The second most important type of event concerns the possibility of slipping and/or falling from the tractor. This aspect is quite relevant, since it is related to a type of accident that is usually underestimated when performing risk assessment activities, as well as in the official reports on accidents. Slipping or falling from the tractor usually lead to scrapes, lacerations, or contusions, that in most of cases have non-severe consequences for the operator. Consequently, this type of injury is rarely reported, as it normally requires only a few days to recover from. Nevertheless, the occurrence of such incidents is quite common, as was shown from the interviews; the operators frequently get on/out of the tractor, even when it is running, during field work.
On the one hand, the relevance of this type of accident is in line with findings by other studies of different sectors. For example, Shibuya et al. [79] pointed out that slips and trips represent a contributing factor for occupational accidents among truck drivers. On the other hand, it is worth noting that the peculiarities of agricultural activities make this type of human error more significant than in other sectors. Hence, this type of accident needs to be better addressed when implementing preventive and protective measures for tractor users. For example, to prevent this type of behavior, specific training, as well as the use of pictorials and other means of communication should be provided. While from the machinery safety point of view, proper handles, and the use of systems to detect the presence of the driver on board, can also contribute to reducing the occurrence of these types of problems. Therefore, the results of the present study could potentially serve to address company managers, not only in properly improving operator training and information, but also in implementing technical solutions which are able to reduce the risks related to incorrect behavior [80].
As far as the assessment of the human error probability is concerned, this study brought to light the low perception and poor awareness of safety issues among the workers, especially when dealing with tractors. This was consistent with the findings provided by [41,70]. This also reinforces the notion that small companies are not interested in innovative and safer features on their machinery, as pointed out by Cavallo et al. [81].
From a methodological viewpoint, the results achieved by the proposed procedure highlight the benefits of the cause-effect assessment allowed by the HoQ. In fact, in this way it is possible to consider the hazards related to the different activities of a generic working task, such as the use of a tractor, in a more detailed and effective manner.
Moreover, the integration of human error analyses within such a bottom-up approach represents a novelty in the sector of safety assessment for agricultural activities, providing a first valuable basis for further analysis and implementation by researchers and practitioners.
Besides these positive aspects, some limitations of the present study need to be discussed. Firstly, the focus group’s characteristics could be improved in order to augment the consistency of the study outputs, e.g., increasing the number of both companies involved and the users interviewed. In addition, focus group in-depth discussions could bring about a clearer exploration [82,83].
Secondly, to augment the quality of data provided by the proposed methodology, supporting techniques, such as the Analytic Hierarchy Process (AHP), and the fuzzy could be used, especially for elements concerning QFD logic [67,68,84,85]. Nevertheless, this might require additional computational efforts, while the results of the proposed methodology should be used in qualitative terms, i.e., as a guideline for choosing priority items [86].
Finally, it is worth noting that, due to the nature of the study, which is a case study research, caution is required in generalizing the findings beyond the sample and industry concerned [87]; that said, the use of a case-study as a research tool for exploratory investigations, and to generate new understandings, has been recognized by several authors (e.g., in [88,89]). Moreover, the implementation of the proposed approach through the use of hands-on software can extend its usability to inexperienced audiences [90,91,92].
6. Conclusions
This study proposes a novel approach to carrying out hazard analysis, taking into account the impact of human reliability during agricultural work. The improvement of safety conditions should not rely on compliance with normative requirements only, but should also consider how farmers usually behave [33,93]. In order to verify the feasibility of such an approach, it was applied to a case study of the use of narrow-track tractors in vineyards. Practical results highlighted the relevance of ergonomic issues when assessing the hazardous situations related to the specific activities performed by the operators, and stressed their incorrect behavior when dealing with work equipment.
The present research work is an exploratory study aimed at making a first attempt to address the analysis of hazards in agricultural activities from a human-centered perspective. As such, although the achieved results corroborate existing studies on health and safety in agriculture, their generalization needs to be augmented by further studies.
Author Contributions
Conceptualization, M.F., M.L., D.P. and N.H.; Methodology, M.F., M.L., D.P. and N.H.; Validation, M.F., M.L., D.P. and N.H.; Writing-Original Draft Preparation, M.F., M.L., D.P. and N.H.; Writing-Review & Editing, M.F., M.L., D.P. and N.H.
Funding
This research received no external funding.
Conflicts of Interest
The authors declare no conflict of interest.
References
- Cecchini, M.; Monarca, D.; Laurendi, V.; Puri, D.; Cossio, F. Mechatronic Solutions for the Safety of Workers Involved in the Use of Manure Spreader. Agriculture 2017, 7, 95. [Google Scholar] [CrossRef]
- Griffin, P.J. Farming—A Hazardous Occupation—How to Improve Health & Safety? Safety and Health in Agriculture. Committee on Agriculture and Rural Development. 2013. Available online: http://www.europarl.europa.eu/document/activities/cont/201303/20130321ATT63633/20130321ATT63633EN.pdf (accessed on 28 January 2018).
- Das, B. Agricultural work related injuries among the farmers of West Bengal, India. Int. J. Inj. Control Saf. Promot. 2014, 21, 205–215. [Google Scholar] [CrossRef] [PubMed]
- OSHA. Available online: https://www.osha.gov/dsg/topics/agriculturaloperations/ (accessed on 28 January 2018).
- Fargnoli, M.; Vita, L.; Gattamelata, D.; Laurendi, V.; Tronci, M. A reverse engineering approach to enhance machinery design for safety. In DS 70, Proceedings of the DESIGN 2012, the 12th International Design Conference, Dubrovnik, Croatia, 21–24 May 2012; Marjanovic, D., Storga, M., Pavkovic, N., Bojcetic, N., Eds.; International Design Conference: Dubrovnik, Croatia, 2012; pp. 627–636. ISBN 978-953-7738-17-4. [Google Scholar]
- Cecchini, M.; Cossio, F.; Marucci, A.; Monarca, D.; Colantoni, A.; Petrelli, M.; Allegrini, E. Survey on the status of enforcement of European directives on health and safety at work in some Italian farms. J. Food Agric. Environ. 2013, 11, 595–600. [Google Scholar] [CrossRef]
- Ericson, C.A. Hazard Analysis Techniques for System Safety; John Wiley & Sons: Hoboken, NJ, USA, 2015; pp. 124–144. [Google Scholar]
- Kim, H.; Lee, K.; Räsänen, K. Agricultural injuries in Korea and errors in systems of safety. Ann. Agric. Environ. Med. 2016, 23, 432–436. [Google Scholar] [CrossRef] [PubMed] [Green Version]
- Rautiainen, R.H.; Lange, J.L.; Hodne, C.J.; Schneiders, S.; Donham, K.J. Injuries in the Iowa certified safe farm study. J. Agric. Saf. Health 2004, 10, 51–63. [Google Scholar] [CrossRef] [PubMed]
- Fargnoli, M.; Laurendi, V.; Tronci, M. Design for safety in agricultural machinery. In DS 60, Proceedings of the DESIGN 2010, the 11th International Design Conference, Dubrovnik, Croatia, 17–20 May 2010; Marjanovic, D., Storga, M., Pavkovic, N., Bojcetic, N., Eds.; International Design Conference: Dubrovnik, Croatia, 2010; pp. 701–710. ISBN 978-953-7738-03-7. [Google Scholar]
- Taattola, K.; Rautiainen, R.H.; Karttunen, J.P.; Suutarinen, J.; Viluksela, M.K.; Louhelainen, K.; Mäittälä, J. Risk factors for occupational injuries among full-time farmers in Finland. J. Agric. Saf. Health 2012, 18, 83–93. [Google Scholar] [CrossRef] [PubMed]
- Rautiainen, R.H.; Ledolter, J.; Donham, K.J.; Ohsfeldt, R.L.; Zwerling, C. Risk factors for serious injury in Finnish agriculture. Am. J. Ind. Med. 2009, 52, 419–428. [Google Scholar] [CrossRef] [PubMed]
- Kogler, R.; Quendler, E.; Boxberger, J. Analysis of occupational accidents with agricultural machinery in the period 2008–2010 in Austria. Saf. Sci. 2015, 72, 319–328. [Google Scholar] [CrossRef]
- Kogler, R.; Quendler, E.; Boxberger, J. Occupational accidents with agricultural machinery in Austria. J. Agromed. 2016, 21, 61–70. [Google Scholar] [CrossRef] [PubMed]
- Karwowski, W. Ergonomics and human factors: The paradigms for science, engineering, design, technology and management of human-compatible systems. Ergonomic 2005, 48, 436–463. [Google Scholar] [CrossRef] [PubMed]
- Houssin, R.; Sun, H.; Gardoni, M. A behavioural design approach to improving mechanical system design with integration of use conditions. Int. J. Des. Innov. Res. 2010, 5, 1–24. [Google Scholar]
- Sadeghi, L.; Dantan, J.Y.; Mathieu, L.; Siadat, A.; Aghelinejad, M.M. A design approach for safety based on Product-Service Systems and Function–Behavior–Structure. CIRP J. Manuf. Sci. Technol. 2017, 9, 44–56. [Google Scholar] [CrossRef]
- Tiwari, P.S.; Gite, L.P.; Dubey, A.K.; Kot, L.S. Agricultural injuries in Central India: Nature, magnitude, and economic impact. J. Agric. Saf. Health 2002, 8, 95–111. [Google Scholar] [CrossRef] [PubMed]
- Suutarinen, J. Management as a risk factor for farm injuries. J. Agric. Saf. Health 2004, 10, 39–50. [Google Scholar] [CrossRef] [PubMed]
- Reason, J. Human Error; Cambridge University Press: Cambridge, UK, 1990. [Google Scholar] [CrossRef]
- Alper, S.J.; Karsh, B.T. A systematic review of safety violations in industry. Accid. Anal. Prev. 2009, 41, 739–754. [Google Scholar] [CrossRef] [PubMed]
- Kirwan, B. Human error identification in human reliability assessment. Part 1: Overview of approaches. Appl. Ergon. 1992, 23, 299–318. [Google Scholar] [CrossRef]
- Reason, J. Human error: Models and management. BMJ Br. Med. J. 2000, 320, 768. [Google Scholar] [CrossRef]
- Salmon, P.M.; Lenné, M.G.; Stanton, N.A.; Jenkins, D.P.; Walker, G.H. Managing error on the open road: The contribution of human error models and methods. Saf. Sci. 2010, 48, 1225–1235. [Google Scholar] [CrossRef]
- Mayrhofer, H.; Quendler, E.; Boxberger, J. Prevention aspects for avoiding rollover incidents together for tractors, self-propelled harvesting and material handling machinery. Agric. Eng. Int. CIGR J. 2014, 16, 59–69. [Google Scholar]
- Myers, M.L.; Cole, H.P.; Westneat, C. Injury severity related to overturn characteristics of tractors. J. Saf. Res. 2009, 40, 165–170. [Google Scholar] [CrossRef] [PubMed]
- Donham, K.J.; Thelin, A. Prevention of Illness and Injury in Agriculture. In Agricultural Medicine: Rural Occupational and Environmental Health, Safety, and Prevention; John Wiley & Sons: Hoboken, NJ, USA, 2016; pp. 503–550. [Google Scholar] [CrossRef]
- Lombardi, M.; Fargnoli, M. Prioritization of hazards by means of a QFD-based procedure. Int. J. Saf. Secur. Eng. 2018, 8, 342–353. [Google Scholar] [CrossRef]
- Schwab, C.V.; Mosher, G.A.; Ryan, S.J. Agricultural worker injury comparative risk assessment methodology: Assessing corn and biofuel switchgrass production systems. J. Agric. Saf. Health 2017, 23, 219–235. [Google Scholar] [CrossRef]
- Llory, M. Human-and work-centred safety: Keys to a new conception of management. Ergonomics 1997, 40, 1148–1158. [Google Scholar] [CrossRef]
- Hale, A.; Kirwan, B.; Kjellén, U. Safe by design: Where are we now? Saf. Sci. 2007, 45, 305–327. [Google Scholar] [CrossRef]
- Rausand, M.; Utne, I.B. Product safety–Principles and practices in a life cycle perspective. Saf. Sci. 2009, 47, 939–947. [Google Scholar] [CrossRef]
- Narasimhan, G.; Crowe, T.G.; Peng, Y.; Hagel, L.; Dosman, J.; Pickett, W. A task-based analysis of machinery entanglement injuries among Western Canadian farmers. J. Agromed. 2011, 16, 261–270. [Google Scholar] [CrossRef] [PubMed]
- Aneziris, O.N.; Papazoglou, I.A.; Konstandinidou, M.; Baksteen, H.; Mud, M.; Damen, M.; Bellamy, L.J.; Oh, J. Quantification of occupational risk owing to contact with moving parts of machines. Saf. Sci. 2013, 51, 382–396. [Google Scholar] [CrossRef]
- Sadeghi, L.; Dantan, J.Y.; Siadat, A.; Marsot, J. Design for human safety in manufacturing systems: Applications of design theories, methodologies, tools and techniques. J. Eng. Des. 2016, 27, 844–877. [Google Scholar] [CrossRef]
- Fargnoli, M.; Lombardi, M.; Haber, N.; Guadagno, F. Hazard Function Deployment: A QFD based tool for the assessment of working tasks—A practical study in the construction industry. Int. J. Occup. Saf. Ergon. 2018. [Google Scholar] [CrossRef] [PubMed]
- Akao, Y. Quality Function Deployment: Integrating Customer Requirements into Product Design, 1st ed.; Productivity Press: Boston, MA, USA, 1990; ISBN 978-0915299416. [Google Scholar]
- Liu, H.T.; Tsai, Y.L. A fuzzy risk assessment approach for occupational hazards in the construction industry. Saf. Sci. 2012, 50, 1067–1078. [Google Scholar] [CrossRef]
- Bas, E. An integrated quality function deployment and capital budgeting methodology for occupational safety and health as a systems thinking approach: The case of the construction industry. Accid. Anal. Prev. 2014, 68, 42–56. [Google Scholar] [CrossRef] [PubMed]
- Fargnoli, M.; Sakao, T. Uncovering differences and similarities among quality function deployment-based methods in Design for X: Benchmarking in different domains. Qual. Eng. 2017, 29, 690–712. [Google Scholar] [CrossRef]
- Lyons, M. Towards a framework to select techniques for error prediction: Supporting novice users in the healthcare sector. Appl. Ergon. 2009, 40, 379–395. [Google Scholar] [CrossRef] [PubMed]
- Shepherd, A. HTA as a framework for task analysis. Ergonomics 1998, 41, 1537–1552. [Google Scholar] [CrossRef] [PubMed]
- Williams, J.C.; Bell, J.L. Consolidation of the error producing conditions used in the Human Error Assessment and Reduction Technique (HEART). Saf. Reliab. 2015, 35, 26–76. [Google Scholar] [CrossRef]
- Kumar, A.; Varghese, M.; Mohan, D. Equipment-related injuries in agriculture: An international perspective. Inj. Control Saf. Promot. 2000, 7, 175–186. [Google Scholar] [CrossRef]
- Kumar, G.P.; Dewangan, K.N. Agricultural accidents in north eastern region of India. Saf. Sci. 2009, 47, 199–205. [Google Scholar] [CrossRef]
- Eurostat, Accidents at Work Statistics. Available online: http://ec.europa.eu/eurostat/statistics-explained/index.php?title=Accidents_at_work_statistics (accessed on 28 January 2018).
- Cutini, M.; Forte, G.; Maietta, M.; Mazzenga, M.; Mastrangelo, S.; Bisaglia, C. Safety-Critical Manuals for Agricultural Tractor Drivers: A Method to Improve Their Usability. Agriculture 2017, 7, 67. [Google Scholar] [CrossRef]
- INAIL (National Institute for Insurance against Accidents at Work), Banca Dati Statistica (Accidents at Work Statistics). Available online: https://www.inail.it/cs/internet/attivita/dati-e-statistiche/banca--dati-statistica.html (accessed on 28 January 2018).
- ISTAT, Italian National Statisitical Institute. Census Databases. Available online: http://dati.istat.it/?lang=en&SubSessionId=1d3b21b6-90c5-47cb-ab41-3ecd6540ad52&themetreeid=-200 (accessed on 28 January 2018).
- INAIL (National Institute for Insurance against Accidents at Work), Reports on Accidents in Agriculture. Available online: https://www.inail.it/cs/internet/comunicazione/news-ed-eventi/news/ucm_184691_news_ultimato_il_report_annua.html (accessed on 28 January 2018).
- Laurendi, V. La Sicurezza Delle Macchine Agricole: Dati Infortunistici e Interventi di Prevenzione Dell’inail. 2017. Available online: http://ergolab.altervista.org/blog/wp-content/uploads/2017/10/Laurendi-SD17.pdf (accessed on 28 January 2018).
- Fargnoli, M.; De Minicis, M.; Di Gravio, G. Knowledge Management integration in Occupational Health and Safety systems in the construction industry. Int. J. Prod. Dev. 2011, 14, 165–185. [Google Scholar] [CrossRef]
- Pillay, M. Accident causation, prevention and safety management: A review of the state-of-the-art. Procedia Manuf. 2015, 3, 1838–1845. [Google Scholar] [CrossRef]
- Colantoni, A.; Monarca, D.; Laurendi, V.; Villarini, M.; Gambella, F.; Cecchini, M. Smart Machines, Remote Sensing, Precision Farming, Processes, Mechatronic, Materials and Policies for Safety and Health Aspects. Agriculture 2018, 8, 47. [Google Scholar] [CrossRef]
- Gulliksen, J.; Göransson, B.; Boivie, I.; Blomkvist, S.; Persson, J.; Cajander, Å. Key principles for user-centred systems design. Behav. Inf. Technol. 2003, 22, 397–409. [Google Scholar] [CrossRef] [Green Version]
- Horberry, T.; Larsson, T.J.; Johnston, I.; Lambert, J. Forklift safety, traffic engineering and intelligent transport systems: A case study. Appl. Ergon. 2004, 35, 575–581. [Google Scholar] [CrossRef] [PubMed]
- Kotzé, M.; Steyn, L. The role of psychological factors in workplace safety. Ergonomics 2013, 56, 1928–1939. [Google Scholar] [CrossRef] [PubMed]
- Castillo-Rosa, J.; Suárez-Cebador, M.; Rubio-Romero, J.C.; Aguado, J.A. Personal factors and consequences of electrical occupational accidents in the primary, secondary and tertiary sectors. Saf. Sci. 2017, 91, 286–297. [Google Scholar] [CrossRef]
- Cividino, S.R.S.; Pergher, G.; Zucchiatti, N.; Gubiani, R. Agricultural Health and Safety Survey in Friuli Venezia Giulia. Agriculture 2018, 8, 9. [Google Scholar] [CrossRef]
- Görücü, S.; Cavallo, E.; Murphy, D.J. Perceptions of Tilt Angles of an Agricultural Tractor. J. Agromed. 2014, 19, 5–14. [Google Scholar] [CrossRef] [PubMed]
- Caffaro, F.; Lundqvist, P.; Micheletti Cremasco, M.; Nilsson, K.; Pinzke, S.; Cavallo, E. Machinery-related perceived risks and safety attitudes in senior Swedish farmers. J. Agromed. 2018, 23, 78–91. [Google Scholar] [CrossRef] [PubMed]
- Houshyar, E.; Houshyar, M. Tractor safety and related injuries in Iranian farms. Saf. Sci. 2018, 103, 88–93. [Google Scholar] [CrossRef]
- Caffaro, F.; Cavallo, E. Comprehension of safety pictograms affixed to agricultural machinery: A survey of users. J. Saf. Res. 2015, 55, 151–158. [Google Scholar] [CrossRef] [PubMed]
- Caffaro, F.; Mirisola, A.; Cavallo, E. Safety signs on agricultural machinery: Pictorials do not always successfully convey their messages to target users. Appl. Ergon. 2017, 58, 156–166. [Google Scholar] [CrossRef] [PubMed]
- Irwin, A.; Poots, J. The human factor in agriculture: An interview study to identify farmers’ non-technical skills. Saf. Sci. 2015, 74, 114–121. [Google Scholar] [CrossRef]
- Irwin, A.; Poots, J. Predictors of attitudes towards non-technical skills in farming. J. Agromed. 2018, 8, 60–69. [Google Scholar] [CrossRef] [PubMed]
- Carnevalli, J.A.; Miguel, P.A.C. Review, analysis and classification of the literature on QFD-Types of research, difficulties and benefits. Int. J. Prod. Econ. 2008, 114, 737–754. [Google Scholar] [CrossRef]
- Vinayak, K.; Kodali, R. Benchmarking the quality function deployment models. Benchmarking Int. J. 2013, 20, 825–854. [Google Scholar] [CrossRef]
- Haber, N.; Fargnoli, M.; Sakao, T. Integrating QFD for product-service systems with the Kano model and fuzzy AHP. Total Qual. Manag. Bus. Excell. 2018. [Google Scholar] [CrossRef]
- ReVelle, J.B.; Moran, J.W.; Cox, C.A. The QFD Handbook; John Wiley and Sons, Inc.: Hoboken, NJ, USA, 1998; ISBN 978-0-471-17381-6. [Google Scholar]
- Marsot, J. QFD: A methodological tool for integration of ergonomics at the design stage. Appl. Ergon. 2005, 36, 185–192. [Google Scholar] [CrossRef] [PubMed]
- Stanton, N.A. Hierarchical task analysis: Developments, applications, and extensions. Appl. Ergon. 2006, 37, 55–79. [Google Scholar] [CrossRef] [PubMed] [Green Version]
- Al-Hakim, L.; Maiping, T.; Sevdalis, N. Applying hierarchical task analysis to improving the patient positioning for direct lateral interbody fusion in spinal surgery. Appl. Ergon. 2014, 45, 955–966. [Google Scholar] [CrossRef] [PubMed]
- Stanton, N.A.; Salmon, P.; Harris, D.; Marshall, A.; Demagalski, J.; Young, M.S.; Waldmann, T.; Dekker, S. Predicting pilot error: Testing a new methodology and a multi-methods and analysts approach. Appl. Ergon. 2009, 40, 464–471. [Google Scholar] [CrossRef] [PubMed]
- Embrey, D. Qualitative and quantitative evaluation of human error in risk assessment. In Human Factors for Engineers; Sandom, C., Harvey, R.S., Eds.; IET: Hearts, UK, 2004; pp. 151–202. ISBN 0863413293. [Google Scholar]
- Cividino, S.R.S.; Pergher, G.; Gubiani, R.; Moreschi, C.; Da Broi, U.; Vello, M.; Rinaldi, F. Definition of a Methodology for Gradual and Sustainable Safety Improvements on Farms and Its Preliminary Applications. Agriculture 2018, 8, 7. [Google Scholar] [CrossRef]
- International Organization for Standardization (ISO). Safety of Machinery—Risk Assessment—Part 2: Practical Guidance and Examples of Methods; ISO/TR 14121-2:2012; International Organization for Standardization: Geneva, Switzerland, 2012. [Google Scholar]
- Hagel, L.; King, N.; Dosman, J.A.; Lawson, J.; Trask, C.; Pickett, W. Profiling the safety environment on Saskatchewan farms. Saf. Sci. 2016, 82, 103–110. [Google Scholar] [CrossRef]
- Shibuya, H.; Cleal, B.; Kines, P. Hazard scenarios of truck drivers’ occupational accidents on and around trucks during loading and unloading. Accid. Anal. Prev. 2010, 42, 19–29. [Google Scholar] [CrossRef] [PubMed]
- Dźwiarek, M. An analysis of accidents caused by improper functioning of machine control systems. Int. J. Occup. Saf. Ergon. 2004, 10, 129–136. [Google Scholar] [CrossRef] [PubMed]
- Cavallo, E.; Ferrari, E.; Bollani, L.; Coccia, M. Attitudes and behaviour of adopters of technological innovations in agricultural tractors: A case study in Italian agricultural system. Agric. Syst. 2014, 130, 44–54. [Google Scholar] [CrossRef]
- Kontio, J.; Lehtola, L.; Bragge, J. Using the focus group method in software engineering: Obtaining practitioner and user experiences. In Proceedings of the International Symposium on Empirical Software Engineering (ISESE), Redondo Beach, CA, USA, 19–20 August 2004; IEEE: Piscataway Township, NJ, USA, 2004; pp. 271–280. [Google Scholar] [CrossRef]
- Rosenberg, A.; McDonagh-Philp, D. Focus groups to support the industrial/product designer: A review based on current literature and designers’ feedback. Appl. Ergon. 2002, 33, 27–38. [Google Scholar] [CrossRef]
- Patriarca, R.; Di Gravio, G.; Mancini, M.; Costantino, F. Change management in the ATM system: Integrating information in the preliminary system safety assessment. Int. J. Appl. Decis. Sci. 2016, 9, 121–138. [Google Scholar] [CrossRef]
- Aminbakhsh, S.; Gunduz, M.; Sonmez, R. Safety risk assessment using analytic hierarchy process (AHP) during planning and budgeting of construction projects. J. Saf. Res. 2013, 46, 99–105. [Google Scholar] [CrossRef] [PubMed]
- Burke, E.; Kloeber, J.M., Jr.; Deckro, R.F. Using and abusing QFD scores. Qual. Eng. 2002, 15, 9–21. [Google Scholar] [CrossRef]
- Alam, I.; Perry, C. A customer-oriented new service development process. J. Serv. Mark. 2002, 16, 515–534. [Google Scholar] [CrossRef]
- Voss, C.; Tsikriktsis, N.; Frohlich, M. Case research in operations management. Int. J. Oper. Prod. Manag. 2002, 22, 195–219. [Google Scholar] [CrossRef] [Green Version]
- Yin, R.K. Case Study Research: Design and Methods, 4th ed.; Sage: Thousand Oaks, CA, USA, 2008; ISBN 1412960991. [Google Scholar]
- Carr, V.; Tah, J.H.M. A fuzzy approach to construction project risk assessment and analysis: Construction project risk management system. Adv. Eng. Softw. 2001, 32, 847–857. [Google Scholar] [CrossRef]
- Fargnoli, M.; De Minicis, M.; Di Gravio, G. Occupational health and safety improvement throughout knowledge management. In Proceedings of the TMCE 2010, Ancona, Italy, 12–16 April 2010; pp. 1085–1096, ISBN 978-905155060-3. [Google Scholar]
- Gunduz, M.; Laitinen, H. A 10-step safety management framework for construction small and medium-sized enterprises. Int. J. Occup. Saf. Ergon. 2017, 23, 353–359. [Google Scholar] [CrossRef] [PubMed]
- Caffaro, F.; Roccato, M.; Micheletti Cremasco, M.; Cavallo, E. Falls From Agricultural Machinery: Risk Factors Related to Work Experience, Worked Hours, and Operators’ Behavior. Hum. Factors 2018, 60, 20–30. [Google Scholar] [CrossRef] [PubMed]
Figure 1.
Incidence rate of accidents in agriculture in Italy from 2012 to 2016.

Figure 2.
Scheme of the traditional House of Quality (HoQ).
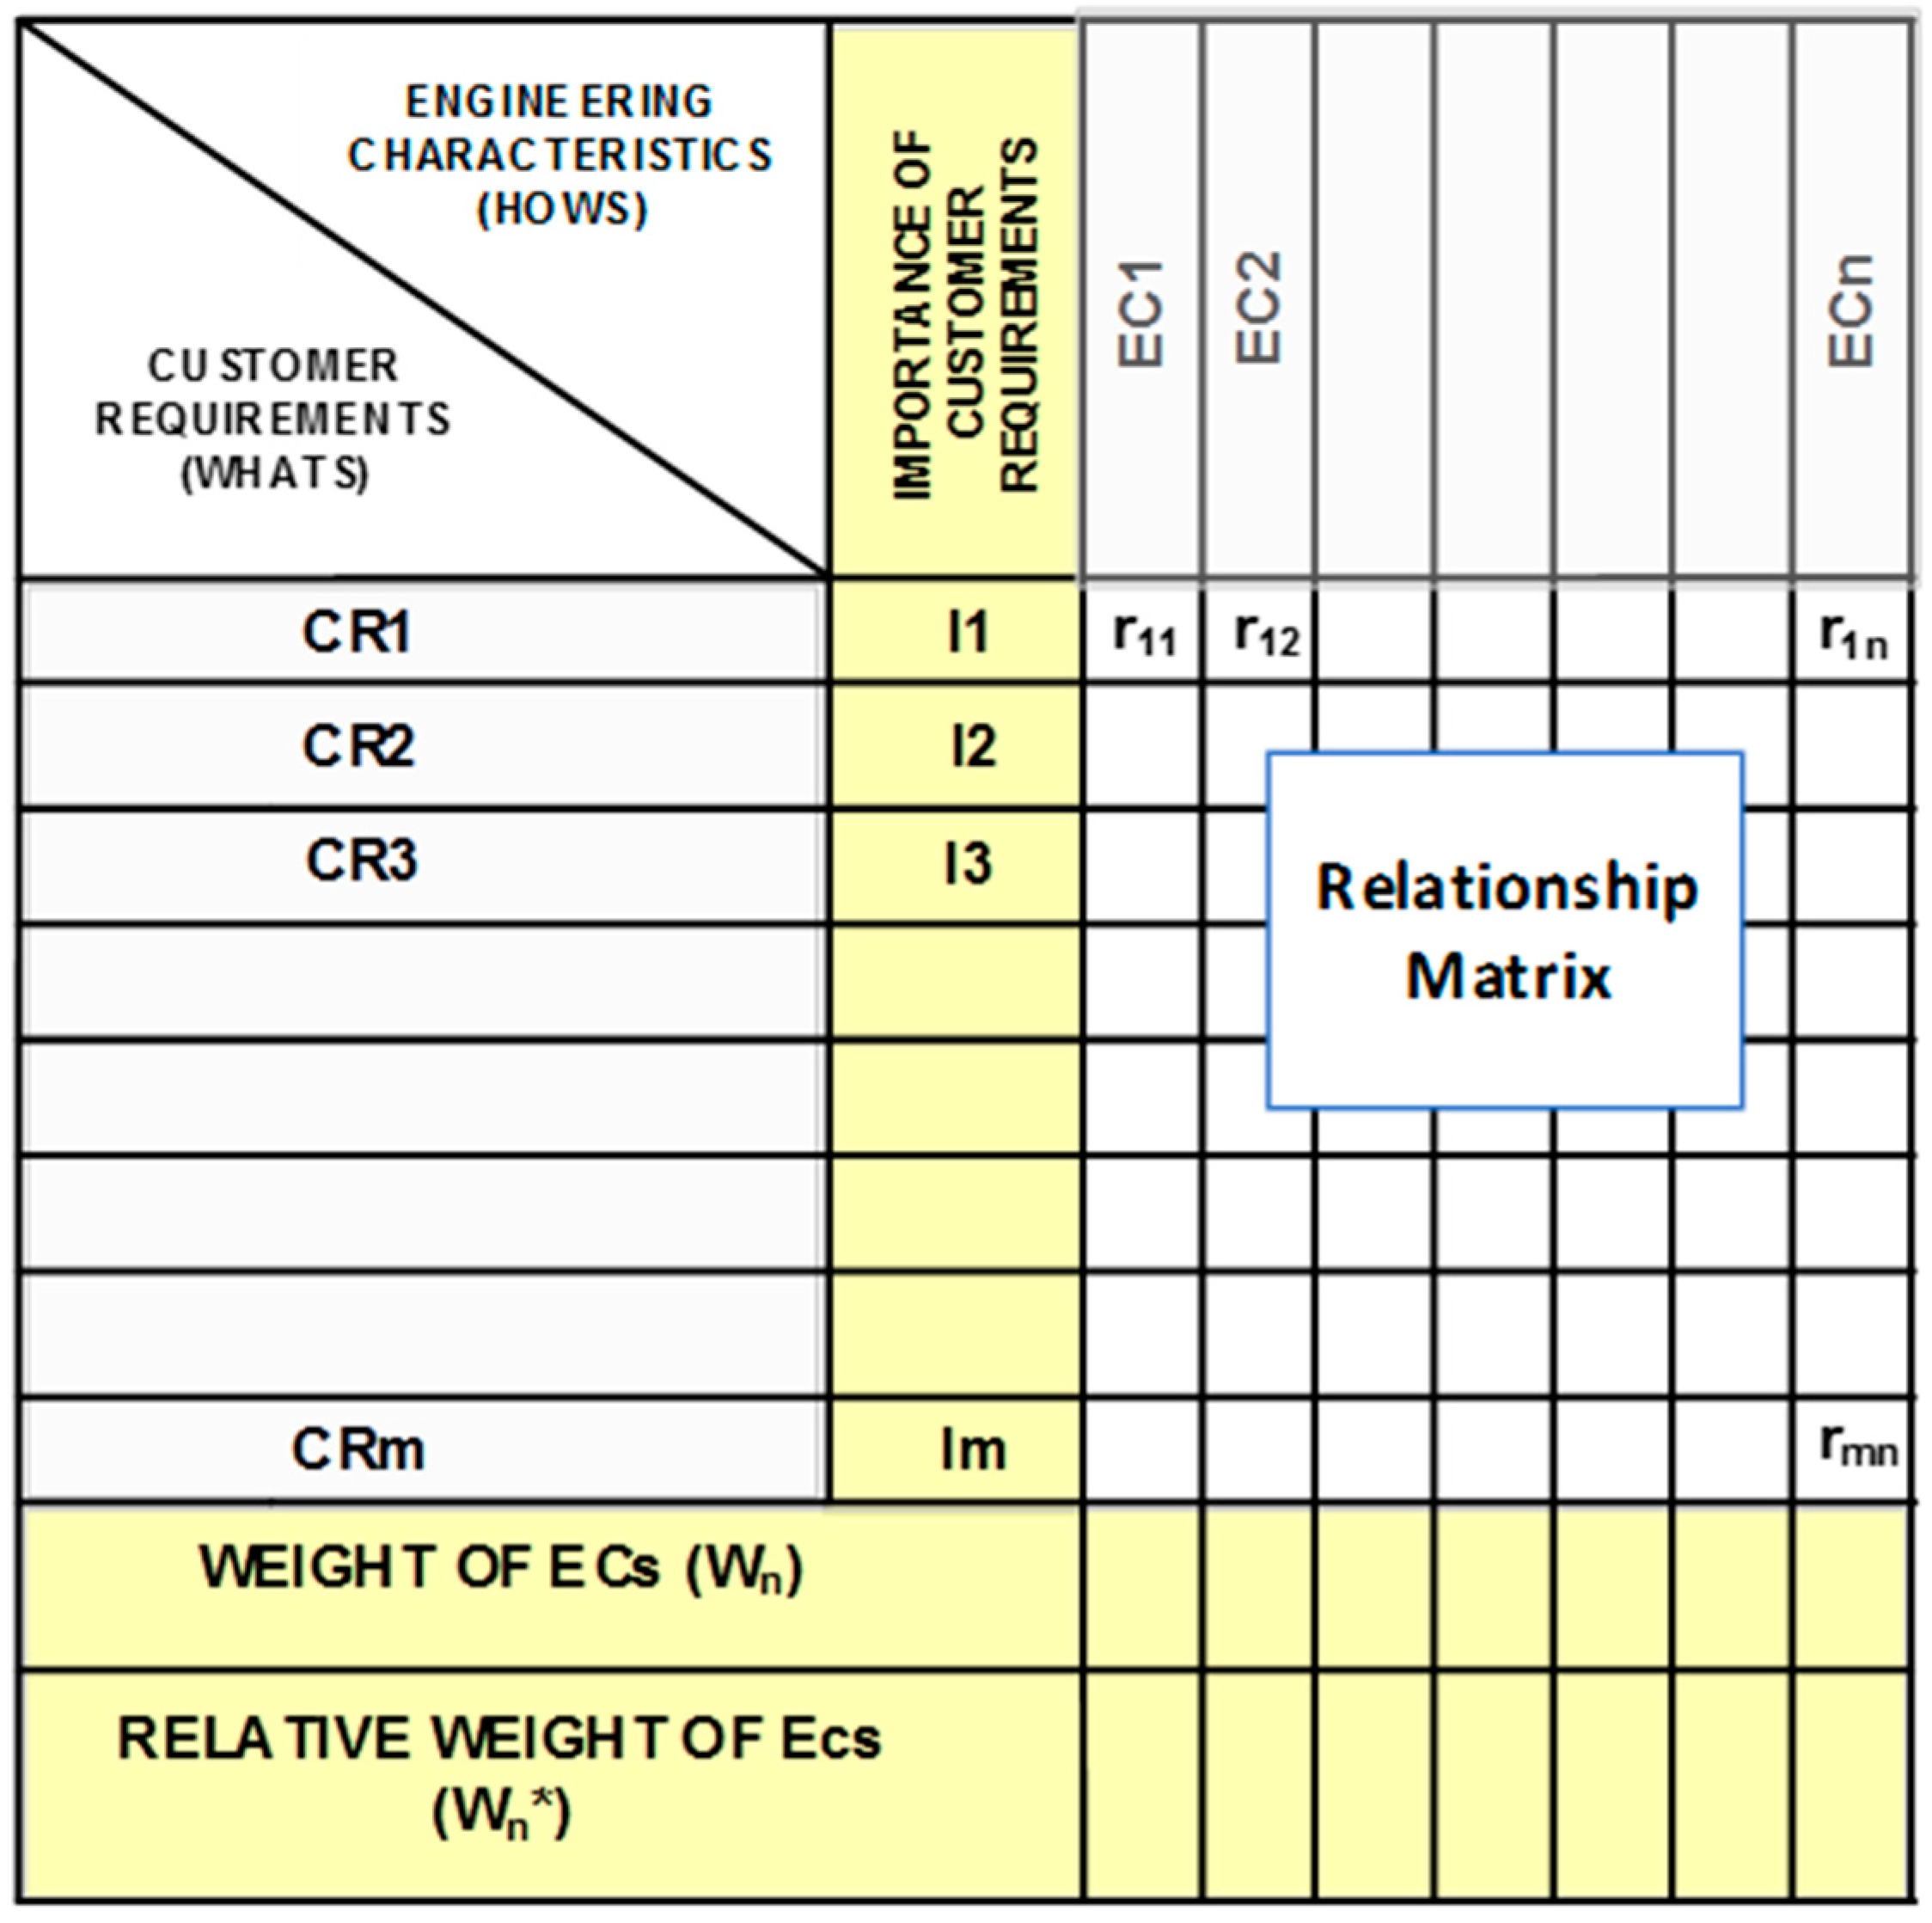
Figure 3.
Example of the computational mechanism of the House of Quality (HoQ).

Figure 4.
Scheme of the approach proposed by Bas [39].
Figure 4.
Scheme of the approach proposed by Bas [39].

Figure 5.
Scheme of the proposed methodology.

Figure 6.
Scheme of the Hierarchical Task Analysis (HTA) method.
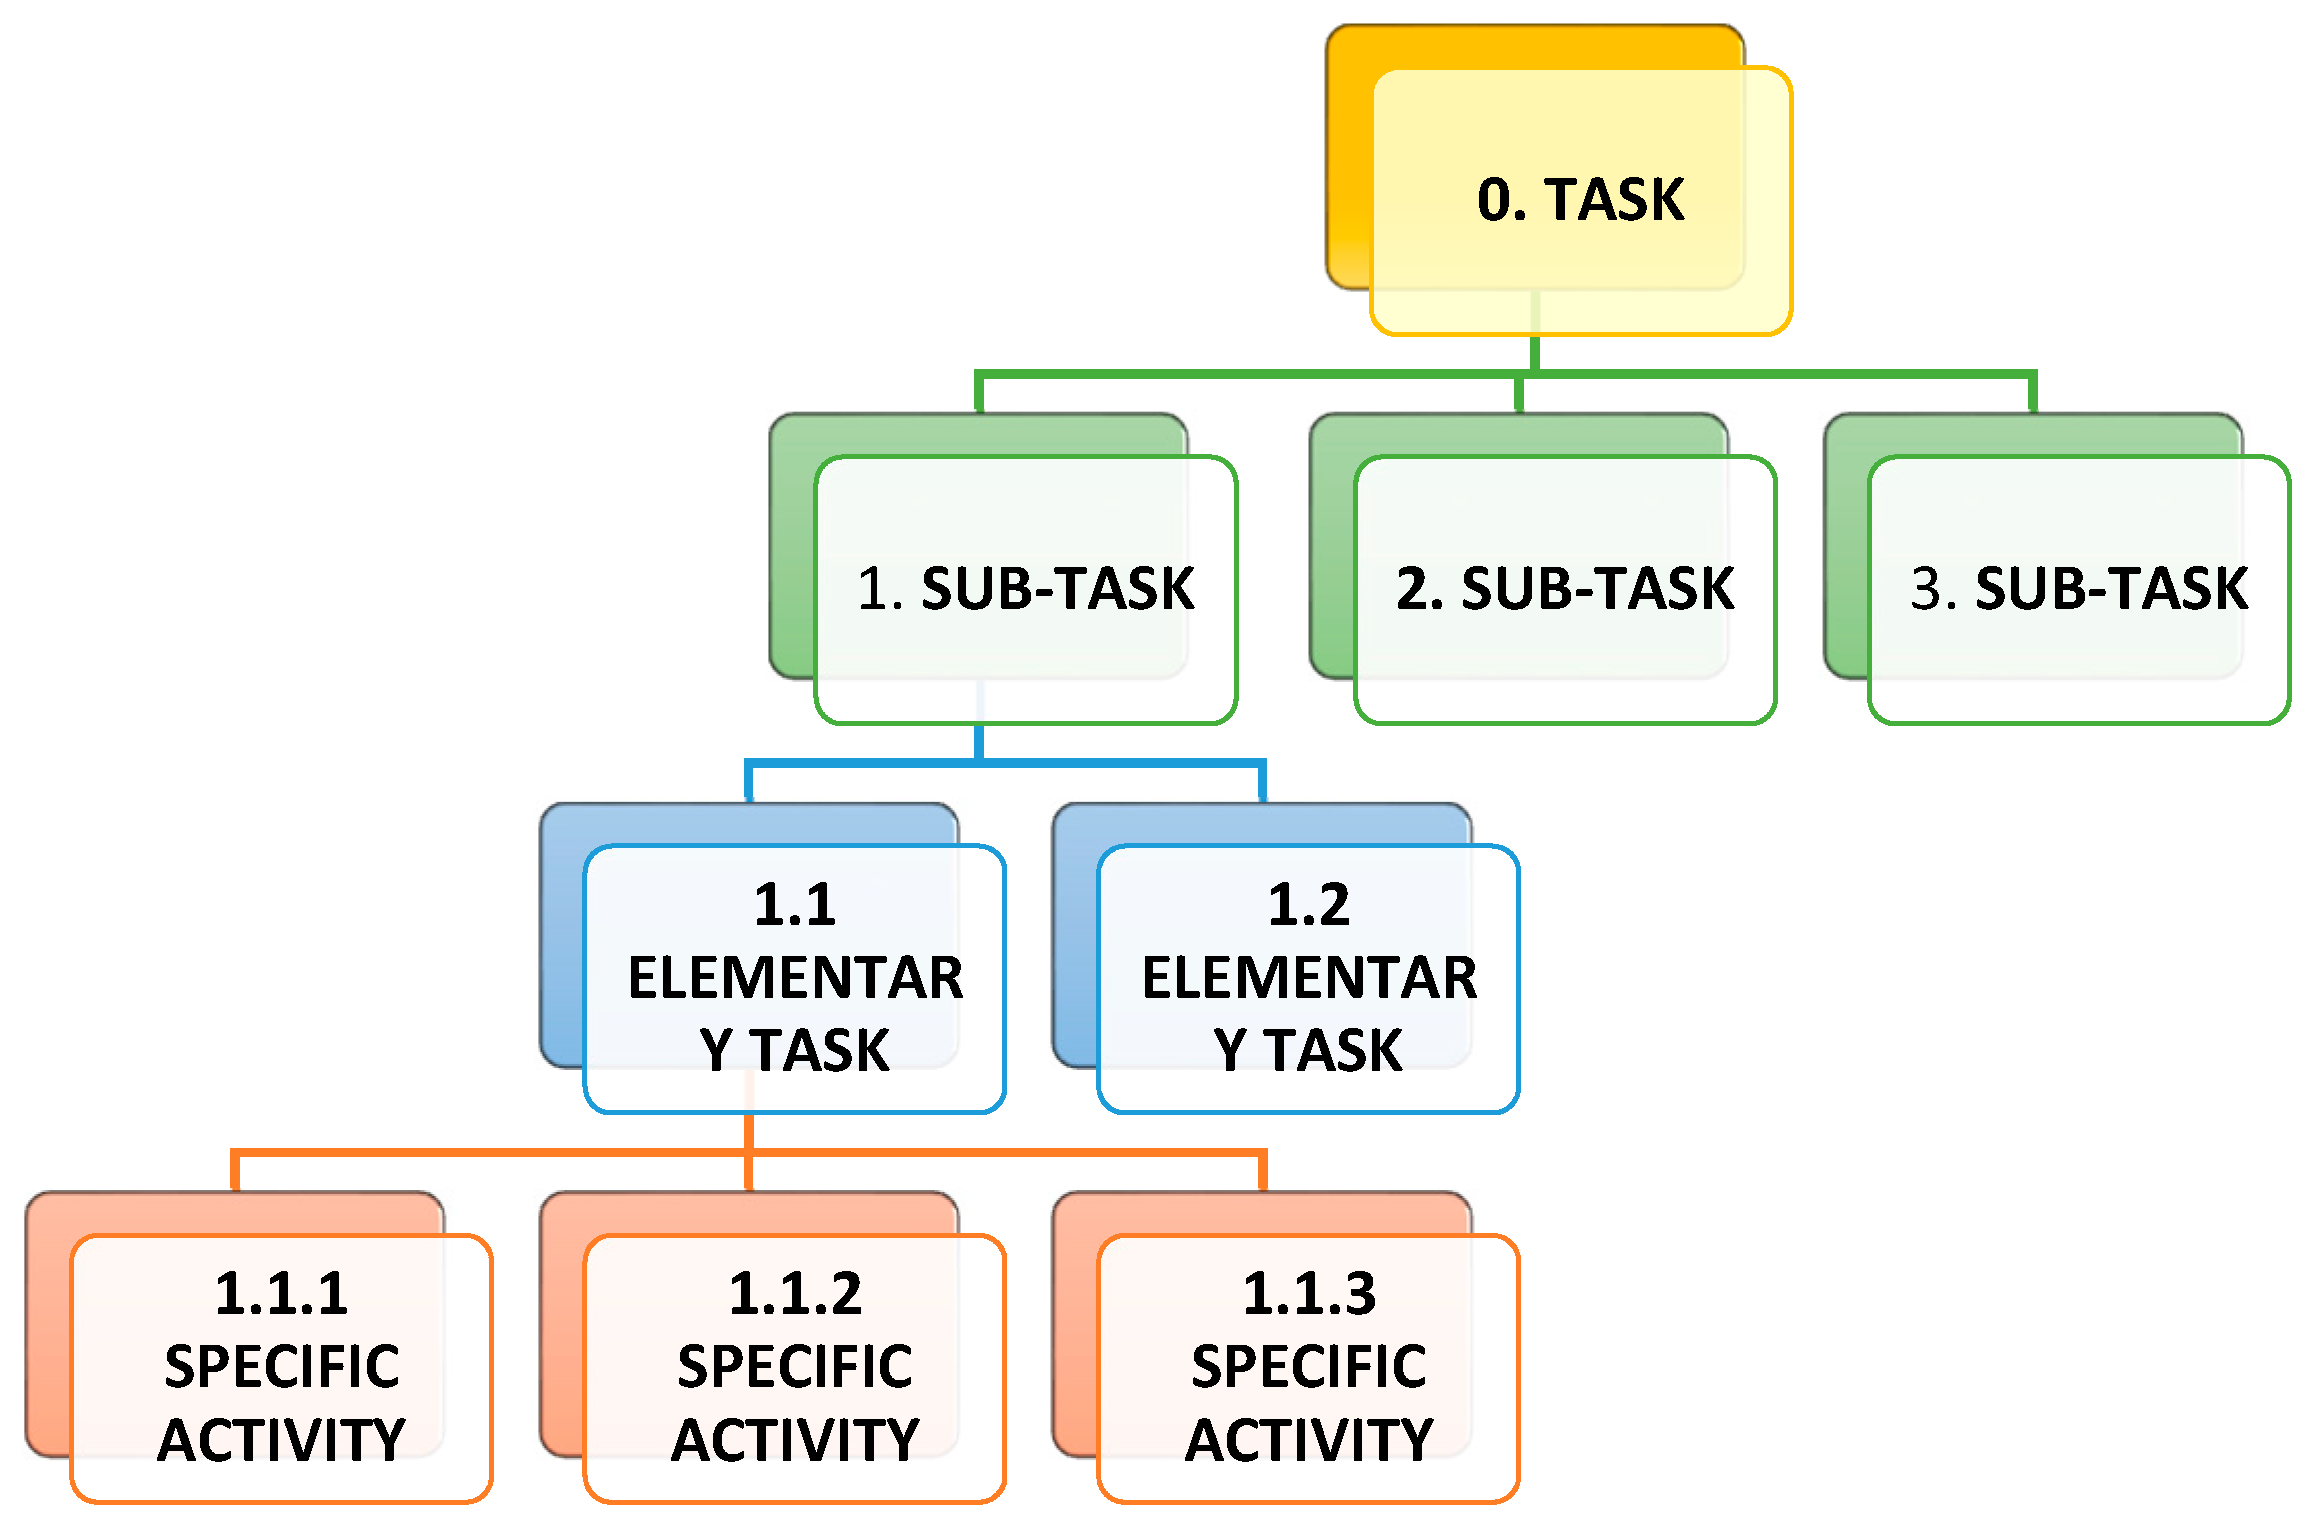
Figure 7.
HoQ1: assessment of the relationships between tasks and hazards.
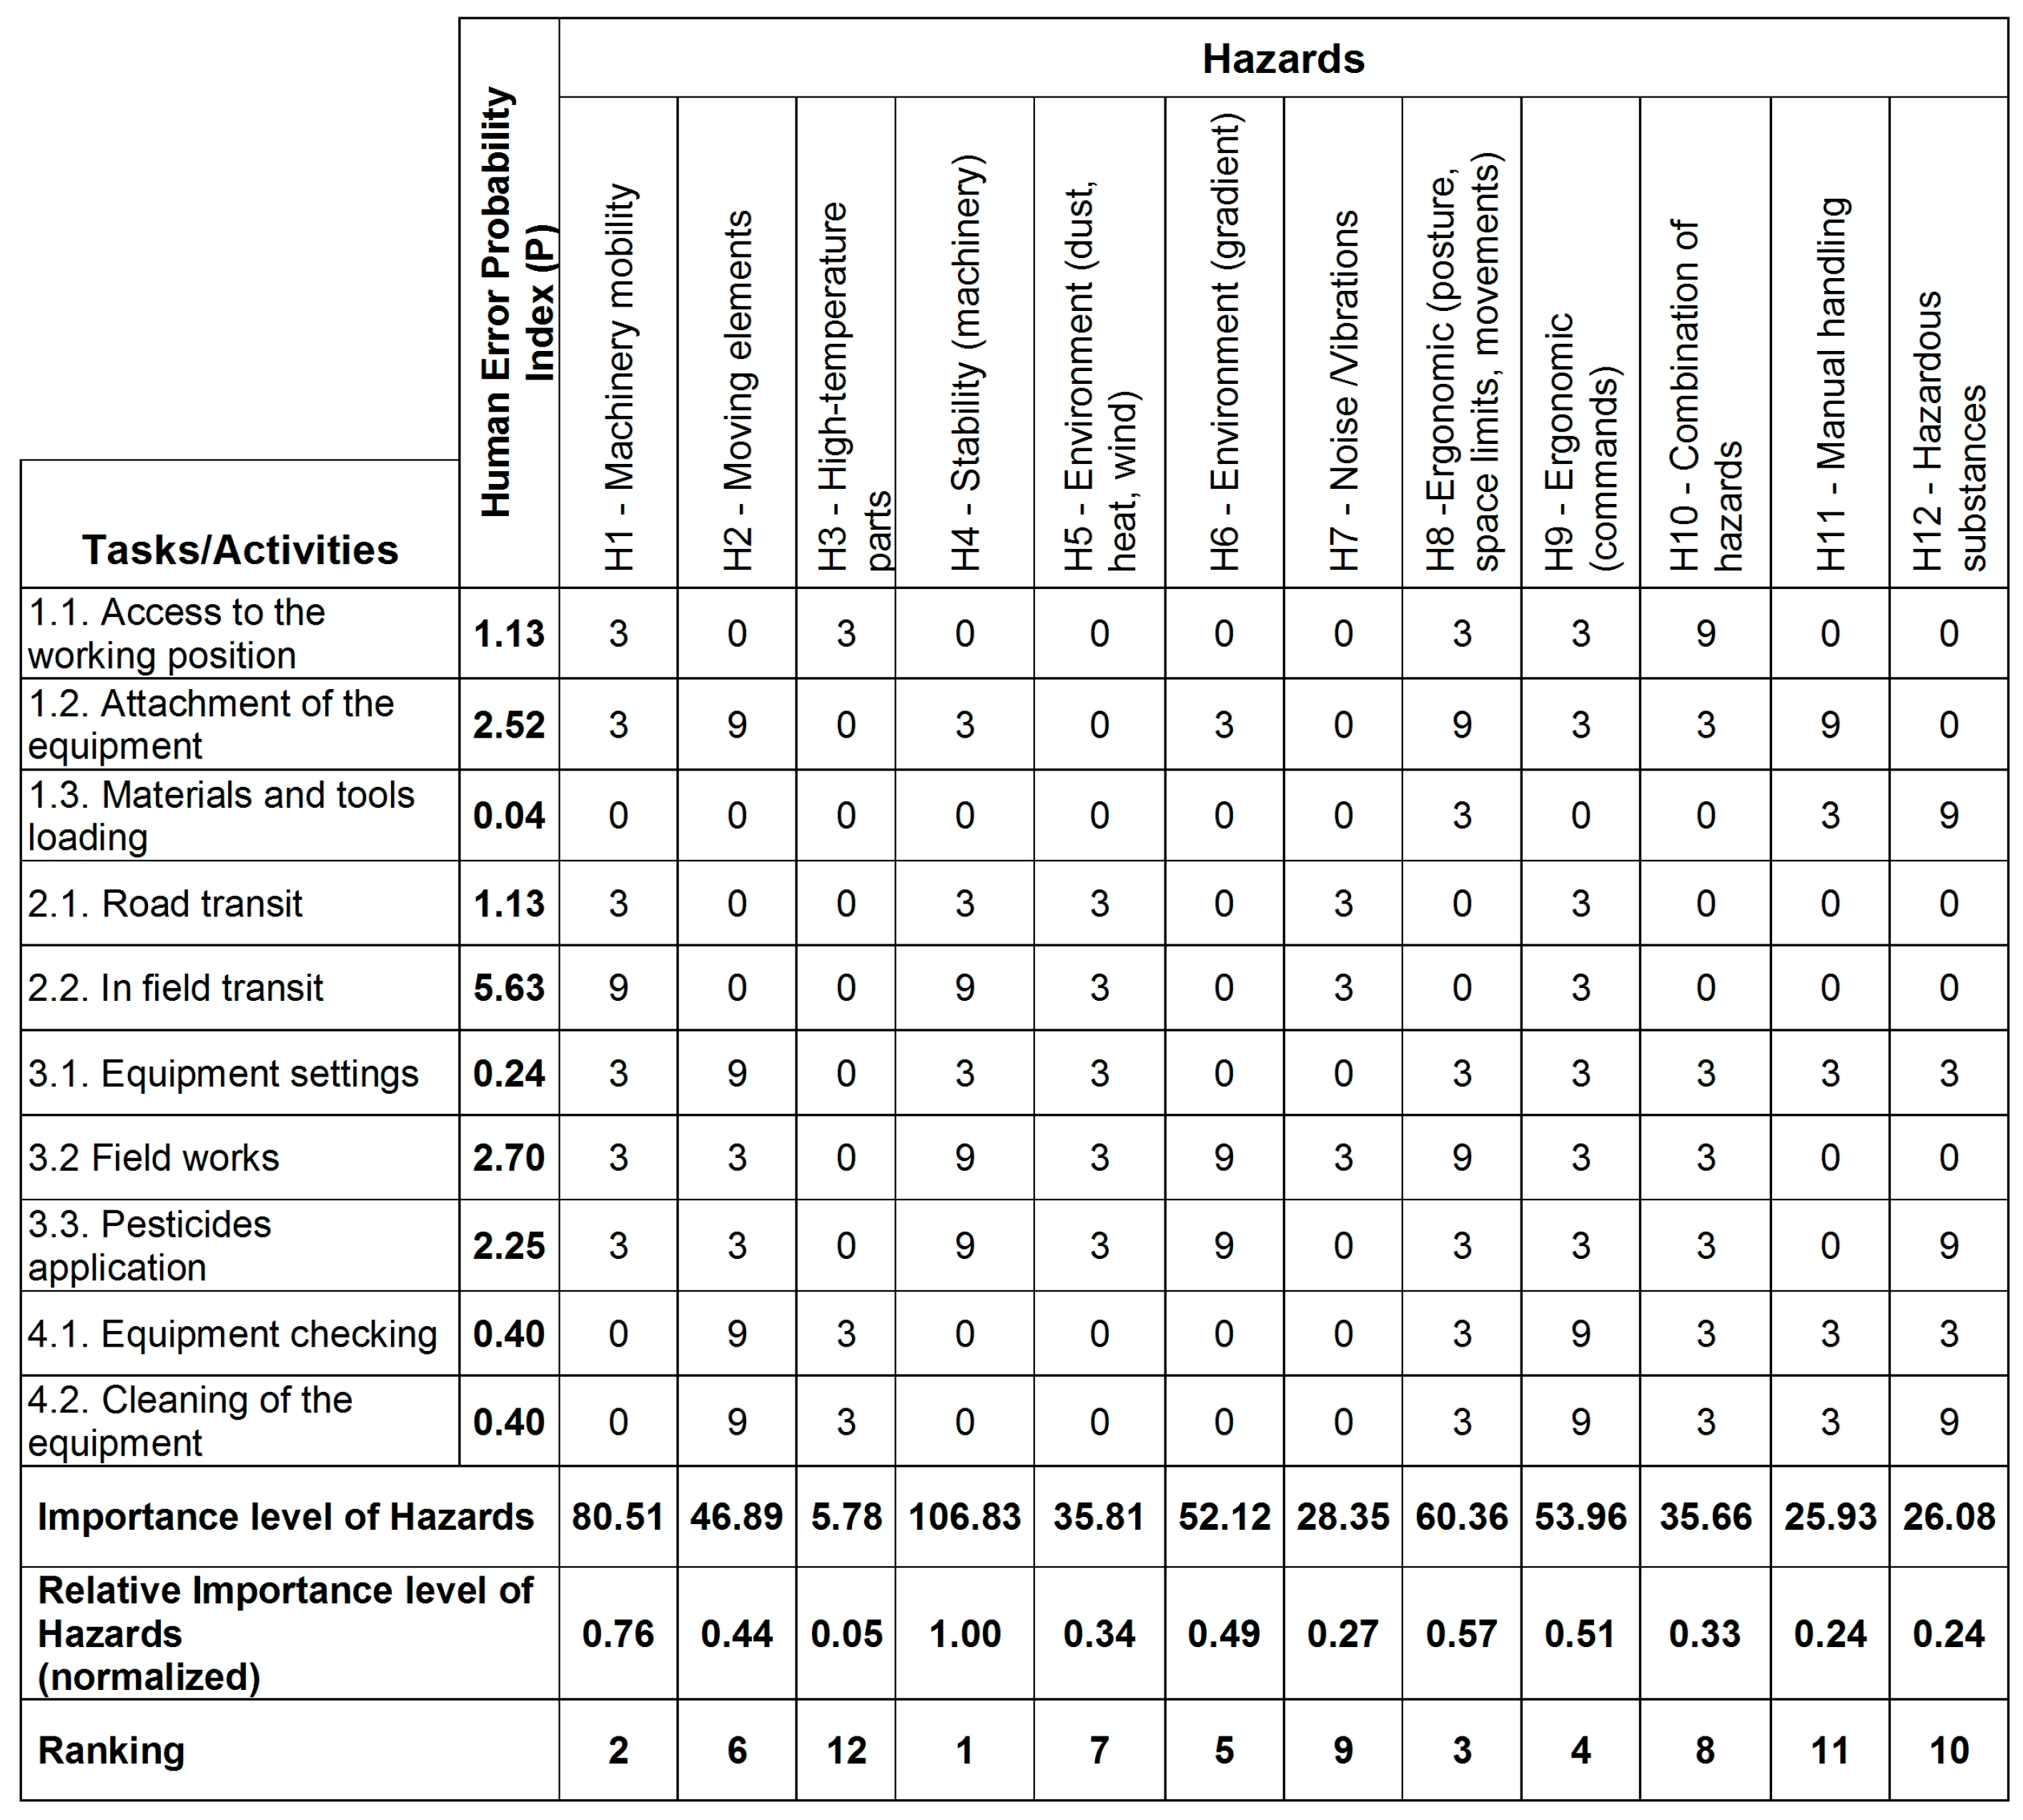
Figure 8.
HoQ2: assessment of the relationships between hazards and hazardous events.

Figure 9.
Level of importance of hazards (%).
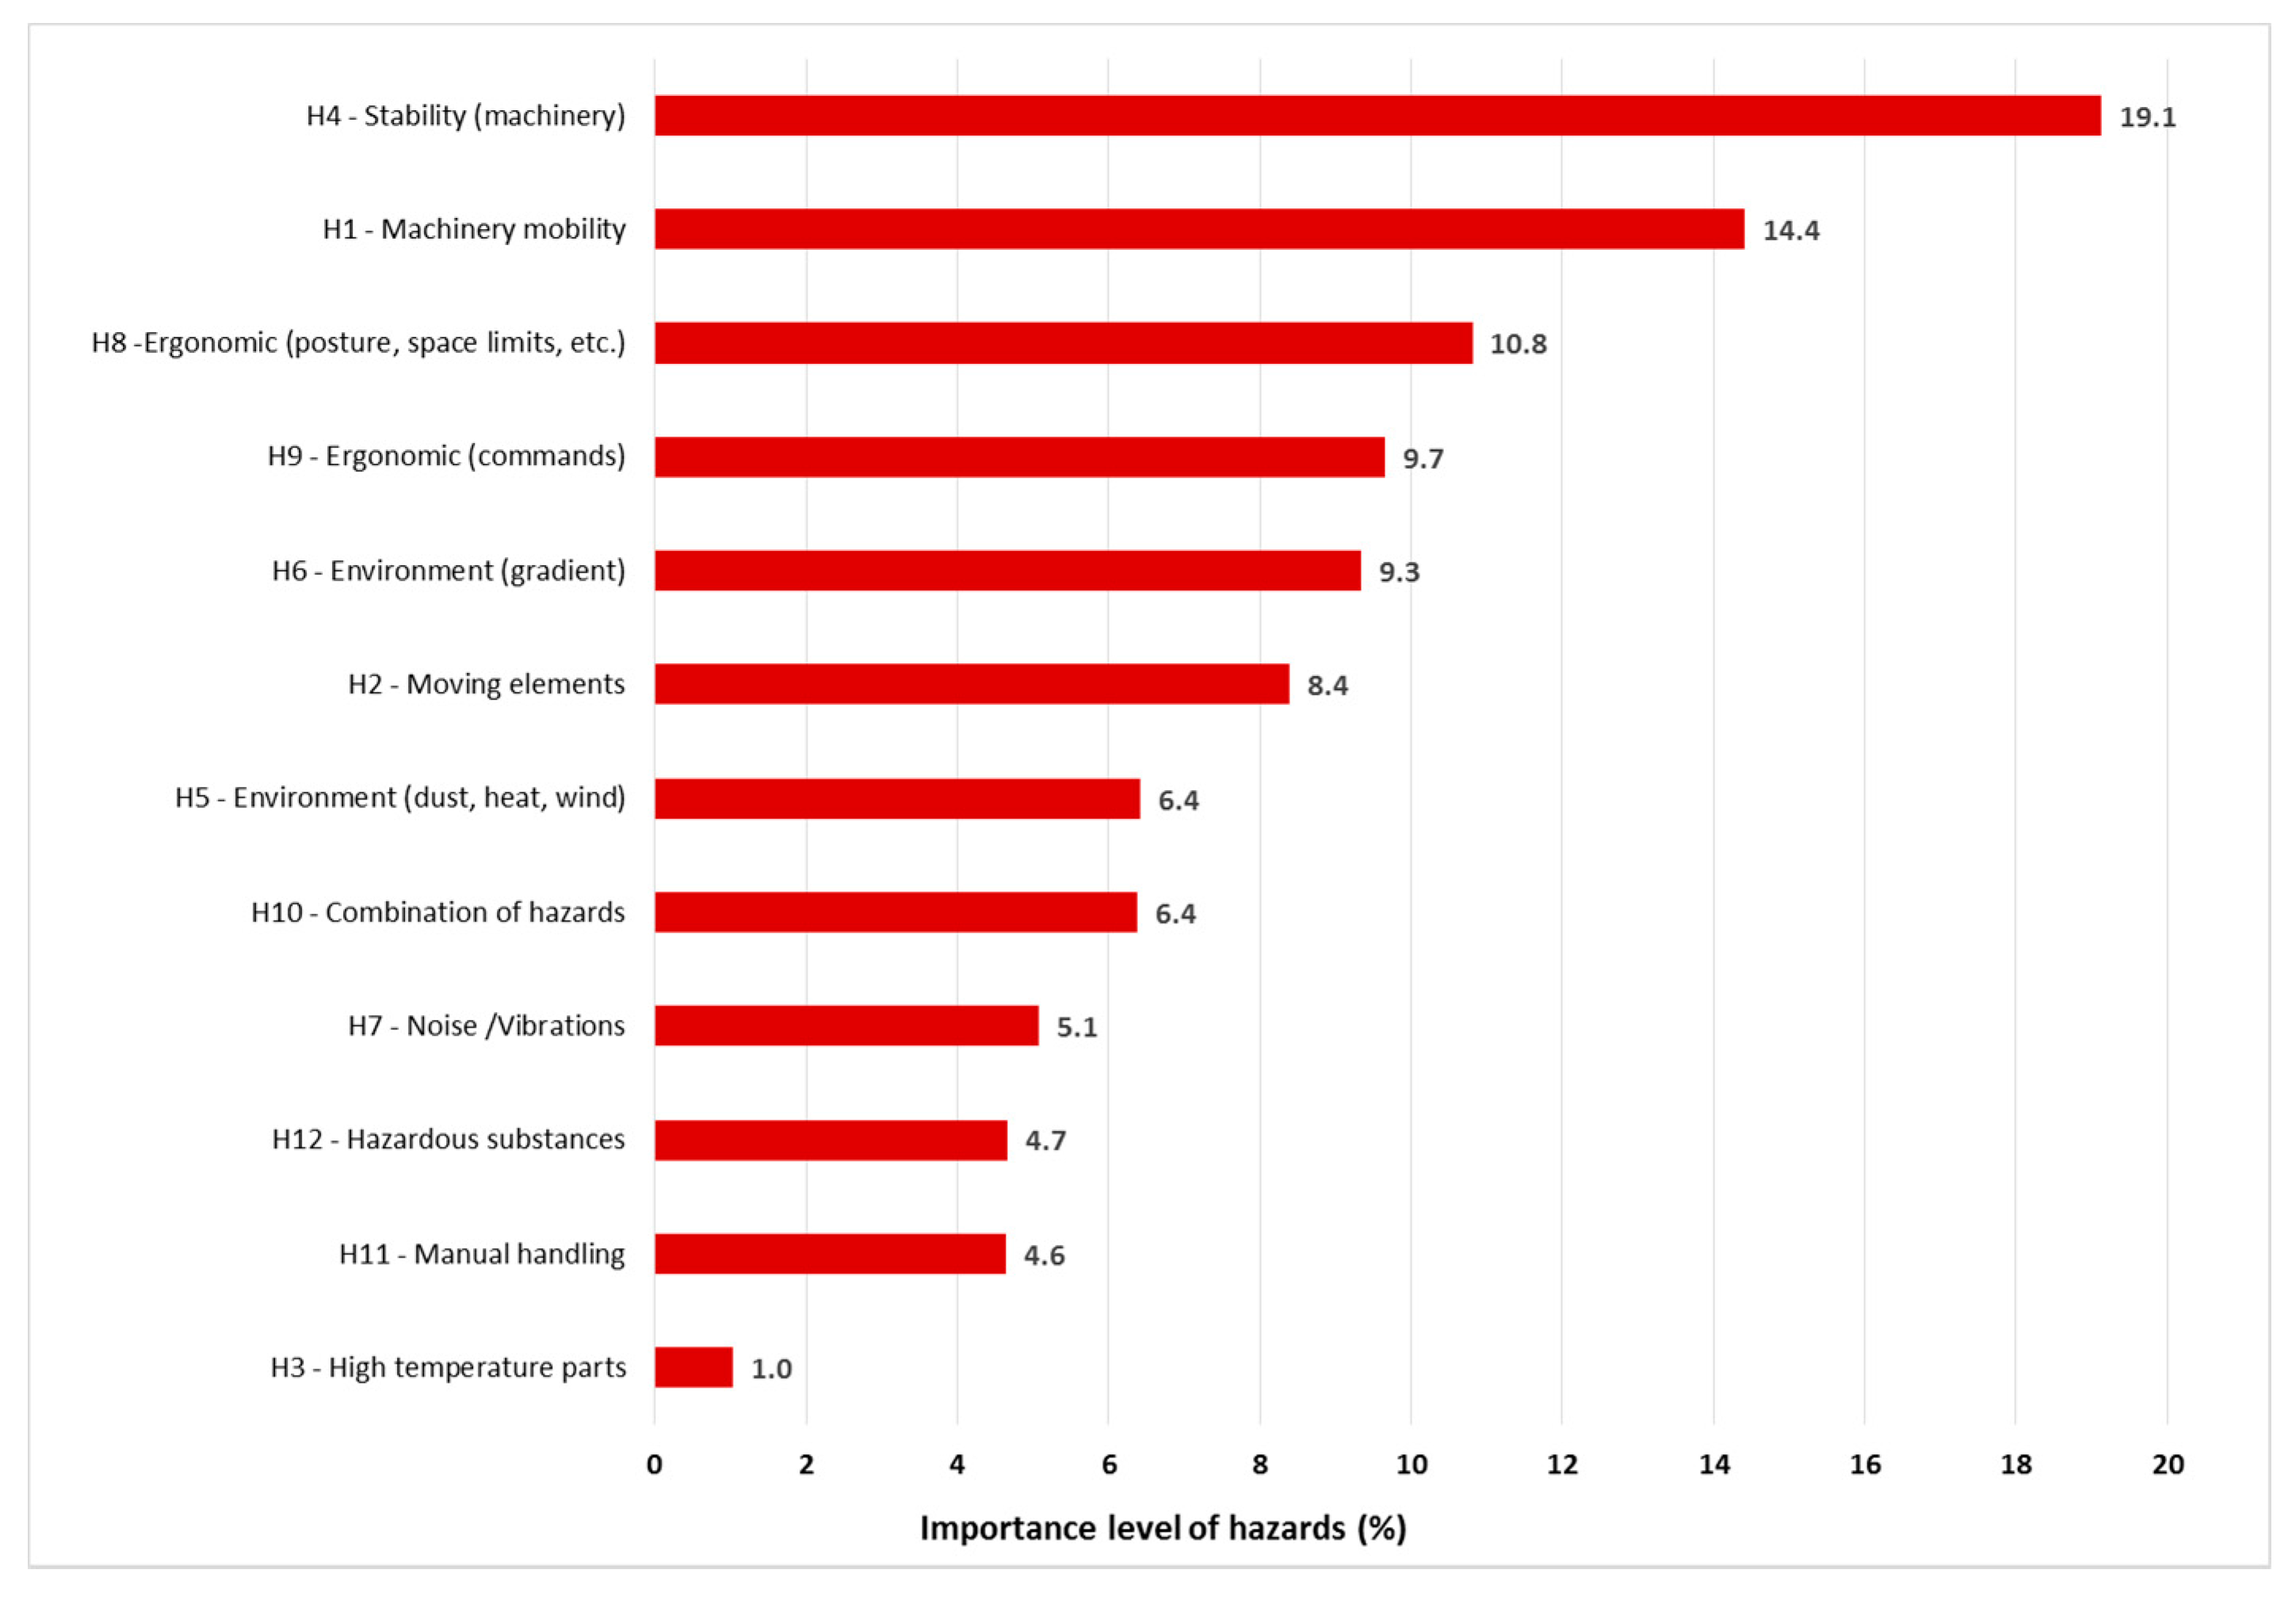
Figure 10.
Level of importance of hazardous events (%).


| Year | Fatal Accidents in Agriculture | Fatal Accident Involving Tractors | Percentage of Fatal Accident Involving Tractors |
|---|---|---|---|
| 2013 | 199 | 121 | 60.8% |
| 2014 | 189 | 121 | 64.0% |
| 2015 | 205 | 137 | 66.8% |
| 2016 | 197 | 114 | 69.5% |
Table 2.
Types of fatal accidents involving tractors.
| Type | 2010 | 2011 | 2012 | 2013 | 2014 | 2015 | 2016 |
|---|---|---|---|---|---|---|---|
| Roll-over | 116 | 80 | 85 | 89 | 100 | 106 | 90 |
| Running-over | 9 | 13 | 7 | 13 | 9 | 15 | 9 |
| Falling | 8 | 11 | 6 | 7 | 10 | 10 | 8 |
| Collision | 0 | 5 | 7 | 3 | 0 | 4 | 1 |
| Others | 2 | 18 | 8 | 9 | 2 | 2 | 6 |
| Total | 135 | 127 | 111 | 121 | 121 | 137 | 114 |
Table 3.
Values of the nominal human unreliability (P0) according to Embrey [75].
Table 3.
Values of the nominal human unreliability (P0) according to Embrey [75].
| Generic Task/Activity | P0 | |
|---|---|---|
| A | Totally unfamiliar, performed at speed with no real idea of likely consequences | 0.55 |
| B | Shift/restore system to new or original state on a single attempt without supervisor procedure | 0.26 |
| C | Complex task requiring a high level of comprehension and skill | 0.16 |
| D | Fairly simple task performed rapidly or given scant attention | 0.09 |
| E | Routine, highly practiced, rapid task involving a relatively low level of skill | 0.02 |
| F | Restore or shift system to original or new state following procedures with some checking | 0.003 |
| G | Completely familiar, highly practiced, routine task, highly trained and experienced person, totally aware of implications of failure with time to correct the potential error but without the benefit of significant job aids | 0.0004 |
| H | Respond correctly to the system command even when there is an augmented or an automated supervisory system providing an accurate interpretation of the system state | 0.000002 |
| M | Miscellaneous tasks/activities for which no description can be found | 0.03 |
Table 4.
Values of the Error-Promoting Conditions (EPCs) according to Embrey [75].
Table 4.
Values of the Error-Promoting Conditions (EPCs) according to Embrey [75].
| n. | Error-Promoting Conditions (EPCs) | Value |
|---|---|---|
| 1 | Unfamiliarity with novel or infrequent situation which is potentially important | 17 |
| 2 | Shortage of time for error detection or correction | 11 |
| 3 | Noisy/confused signals | 10 |
| 4 | A means of suppressing or overriding information | 9 |
| 5 | No means of conveying spatial or functional information to human operator | 9 |
| 6 | Poor system/human user interface | 8 |
| 7 | No obvious means of reversing an unintended action | 8 |
| 8 | Information overload | 6 |
| 9 | Technique unlearning/one which requires application of opposing philosophy | 6 |
| 10 | Transfer knowledge from one task to another | 5 |
| 11 | Ambiguity in required performance standard | 5 |
| 12 | Mismatch between perceived and actual risk | 4 |
| 13 | Poor, ambiguous or ill-matched feedback | 4 |
| 14 | No clear/direct/timely confirmation of intended action from system | 4 |
| 15 | Inexperience (newly qualified but not an expert) | 3 |
| 16 | Poor instructions or procedures | 3 |
| 17 | Little or no independent checking or testing of output | 3 |
| 18 | No diversity of information input for veracity checks | 2.5 |
Table 5.
Hierarchical classification of working tasks and activities.
| Sub-Tasks | Elementary Tasks | Specific Activities |
|---|---|---|
| 1. Preparation | 1.1. Access to the working position | 1.1.1. Getting on |
| 1.1.2. Starting | ||
| 1.1.3. Getting out | ||
| 1.2. Attachment of the equipment | 1.2.1. Power Take Off (PTO) attachment | |
| 1.2.2. Three-point hitch attachment | ||
| 1.3. Materials and tools loading | ||
| 2. Transportation | 2.1. Road transit | |
| 2.2. In field transit | ||
| 3. Fieldworks | 3.1. Equipment settings | |
| 3.2. Field works | 3.2.1. Extra line works | |
| 3.2.2. Intra-lines works | ||
| 3.3. Pesticides application | 3.3.1. Pesticides handling | |
| 3.3.2. Pesticides mixing | ||
| 3.3.3. Pesticides spraying | ||
| 4. Maintenance | 4.1. Equipment checking | |
| 4.2. Cleaning of the equipment |
Table 6.
Performance factor assessment by means of the HEART method (excerpt).
| Task/Activity | EPCs Number | PFi = {(EPCi − 1) ×Api + 1} | ||
|---|---|---|---|---|
| … | … | … | … | … |
| 1.2.1 | Three-point hitch attachment | 6 | ((8 − 1) × 0.5) + 1 = 4.5 | 78.75 |
| 9 | ((6 − 1) × 0.5) + 1 = 3.5 | |||
| 12 | ((4 − 1) × 0.5) + 1 = 2.5 | |||
| 15 | ((3 − 1) × 0.5) + 1 = 2 | |||
| 1.2.2 | PTO attachment | 6 | ((8 − 1) × 0.5) + 1 = 4.5 | 157.75 |
| 9 | ((6 − 1) × 0.5) + 1 = 3.5 | |||
| 12 | ((4 − 1) × 0.5) + 1 = 2.5 | |||
| 15 | ((3 − 1) × 0.5) + 1 = 2 | |||
| 17 | ((3 − 1) × 0.5) + 1 = 2 | |||
| 1.3.1 | Materials and tools loading | 10 | ((5 − 1) × 0.5)+ 1 = 3 | 12 |
| 15 | ((3 − 1) × 0.5) + 1 = 2 | |||
| 16 | ((3 − 1) × 0.5) + 1 = 2 | |||
| 2.1.1 | Road transit | 6 | ((8 − 1) × 0.5) + 1 = 4.5 | 56.25 |
| 12 | ((4 − 1) × 0.5) + 1 = 2.5 | |||
| 14 | ((4 − 1) × 0.5) + 1 = 2.5 | |||
| 15 | ((3 − 1) × 0.5) + 1 = 2 | |||
| 2.1.2 | In field transit | 5 | ((9 − 1) × 0.5) + 1= 5 | 281.25 |
| 6 | ((8 − 1) × 0.5) + 1 = 4.5 | |||
| 12 | ((4 − 1) × 0.5) + 1 = 2.5 | |||
| 13 | ((4 − 1) × 0.5) + 1 = 2.5 | |||
| 16 | ((3 − 1) × 0.5) + 1 = 2 | |||
| 3.1. | Equipment settings | 6 | ((8 − 1) × 0.5) + 1 = 4.5 | 78.75 |
| 9 | ((6 − 1) × 0.5) + 1 = 3.5 | |||
| 12 | ((4 − 1) × 0.5) + 1 = 2.5 | |||
| 15 | ((3 − 1) × 0.5) + 1 = 2 | |||
| 3.2.1 | Extra-lines works | 6 | ((8 − 1) × 0.5) + 1 = 4.5 | 56.25 |
| 12 | ((4 − 1) × 0.5) + 1 = 2.5 | |||
| 13 | ((4 − 1) × 0.5) + 1 = 2.5 | |||
| 16 | ((3 − 1) × 0.5) + 1 = 2 | |||
| 3.2.2 | Intra-lines works | 6 | ((8 − 1) × 0.5) + 1 = 4.5 | 11.25 |
| 13 | ((4 − 1) × 0.5) + 1 = 2.5 | |||
| 3.3.1 | Pesticides handling | 6 | ((8 − 1) × 0.5) + 1 = 4.5 | 11.25 |
| 12 | ((4 − 1) × 0.5) + 1 = 2.5 | |||
| …. | …. | …. | …. | …. |
Note: Api = proportion assessment factor; EPCs = error producing conditions; EPCi = i-th error producing condition; PFi = performance factor of the i-th activity.
Table 7.
Values of the human error probability index (P).
| Tasks/Activities | P0 | Πi PFi | P |
|---|---|---|---|
| 1.1.1. Getting on board | 0.02 | 45 | 0.900 |
| 1.1.2. Starting | 0.02 | 11.25 | 0.225 |
| 1.1.3. Getting out | 0.02 | 56.25 | 1.125 |
| 1.2.1. Three-point hitch attachment | 0.016 | 78.75 | 1.260 |
| 1.2.2. PTO attachment | 0.016 | 157.75 | 2.524 |
| 1.3. Materials and tools loading | 0.003 | 12 | 0.036 |
| 2.1. Road transit | 0.02 | 56.25 | 1.125 |
| 2.2. In field transit | 0.02 | 281.25 | 5.625 |
| 3.1. Equipment settings | 0.003 | 78.75 | 0.236 |
| 3.2.1. Intra-lines works | 0.02 | 11.25 | 0.225 |
| 3.2.2. Extra line operations | 0.02 | 135 | 2.700 |
| 3.3.1. Pesticides handling | 0.003 | 56.25 | 0.169 |
| 3.3.2. Pesticides mixing | 0.003 | 11.25 | 0.034 |
| 3.3.3. Pesticides spraying | 0.02 | 112.5 | 2.250 |
| 4.1. Equipment checking | 0.02 | 20 | 0.4 |
| 4.2. Cleaning of the equipment | 0.02 | 20 | 0.4 |
Note: P0 = nominal human unreliability value; P = human error probability index; PFi = performance factor of the i-th activity.
Table 8.
List of Hazards.
| Hazard Code | Type of Hazard |
|---|---|
| H1 | Machinery mobility |
| H2 | Moving elements |
| H3 | High-temperature parts |
| H4 | Stability (machinery) |
| H5 | Environment (dust, heat, wind) |
| H6 | Environment (gradient) |
| H7 | Noise/Vibrations |
| H8 | Ergonomic (posture, space limits, movements) |
| H9 | Ergonomic (commands) |
| H10 | Combination of hazards |
| H11 | Manual handling |
| H12 | Hazardous substances |
Table 9.
List of the hazardous events.
| Event Code | Event |
|---|---|
| E1 | Contact with cutting/rotating parts |
| E2 | Contact with high-temperature parts |
| E3 | Loss of stability (roll-over) |
| E4 | Contact with ejected objects |
| E5 | Exposure to musculoskeletal disorders |
| E6 | Exposure to noise/vibrations |
| E7 | Slipping, falling from the tractor |
| E8 | Unintended movements (collision, impact with other vehicles) |
| E9 | Crushing (running over/ knockdown of the operator or other people) |
| E10 | Impacts with objects |
| E11 | Intoxication |
© 2018 by the authors. Licensee MDPI, Basel, Switzerland. This article is an open access article distributed under the terms and conditions of the Creative Commons Attribution (CC BY) license (http://creativecommons.org/licenses/by/4.0/).
Share and Cite
MDPI and ACS Style
Fargnoli, M.; Lombardi, M.; Haber, N.; Puri, D. The Impact of Human Error in the Use of Agricultural Tractors: A Case Study Research in Vineyard Cultivation in Italy. Agriculture 2018, 8, 82. https://doi.org/10.3390/agriculture8060082
AMA Style
Fargnoli M, Lombardi M, Haber N, Puri D. The Impact of Human Error in the Use of Agricultural Tractors: A Case Study Research in Vineyard Cultivation in Italy. Agriculture. 2018; 8(6):82. https://doi.org/10.3390/agriculture8060082
Chicago/Turabian StyleFargnoli, Mario, Mara Lombardi, Nicolas Haber, and Daniele Puri. 2018. "The Impact of Human Error in the Use of Agricultural Tractors: A Case Study Research in Vineyard Cultivation in Italy" Agriculture 8, no. 6: 82. https://doi.org/10.3390/agriculture8060082
Note that from the first issue of 2016, this journal uses article numbers instead of page numbers. See further details here.