Article

Limited Seed and Seed Yield Response of Calendula to Applied Nitrogen Does Not Justify Risk of Environmental Damage from High Urea Application Rates

USDA-Agricultural Research Service-North Central Soil Conservation Research Laboratory, Morris, MN 56267, USA
*
Author to whom correspondence should be addressed.
Agriculture 2018, 8(3), 40; https://doi.org/10.3390/agriculture8030040
Submission received: 20 February 2018 / Revised: 2 March 2018 / Accepted: 9 March 2018 / Published: 13 March 2018

Abstract

:
Calendula (Calendula officinalis L.) seed, due to its high calendic acid content, is recognized as a potential environmentally safe substitute for volatile organic compounds. Agronomic guidelines for nitrogen (N) management to produce calendula seed oil on a commercial scale are limited. Post-harvest soil N has the potential to move off-farm and contribute to water quality degradation (e.g., hypoxia in the Gulf of Mexico). Establishing N management guidelines should consider agronomic response and potential environmental risk. Calendula seed and oil yield, oil content, harvest index, N use, seed N use efficiency, oil N use efficiency, agronomic efficiency, vegetative growth, and the amount of residual soil-N following harvest response to five urea N rates (0, 34, 67, 134, and 202 kg N ha−1) were assessed in a replicated field study repeated for two growing seasons. Seed yield increased with N rate, but because of the low N conversion efficiency, there appeared to be minimal yield gains in applying N beyond 34 kg ha−1. The lowest amount of soil-N left underutilized in the soil was predicted to occur at 39 kg N ha−1 and was adequate for seed and seed oil commercial calendula production on a Mollisol in the Northern Midwest United States.

1. Introduction

Calendula (Calendula officinalis L.), also known as pot marigold, belongs to the plant family Asteraceae, which historically has served worldwide as a summer annual flowering-ornamental plant. Calendula contains numerous compounds with demonstrated pharmacological activity [1]. Generally, calendula seeds have an oil content of about 160–210 g kg−1 [2,3]. Calendula seed-oil is a rich source of calendic acid (C18:3 ∆8trans, 10trans, 12cis), a highly oxidative conjugated fatty acid that can serve as a replacement for certain volatile organic compounds as a drying agent in several industrial chemicals such as paints, inks, coatings, and adhesives [4,5]. Calendula oil can be a substitute for tung oil [6], which is produced commercially primarily in Southeast Asia from the tung tree (Aleurites fordii Hemsl.). An advantage that calendula has over tung is that it can be conventionally cultivated as a crop over a much broader range of environments. Calendula originated from the Mediterranean region [7] and is well adapted to growing in a wide range of environments, including the northern temperate zone of the USA [3,8].
Calendula has a long history of being cultivated in Europe primarily for pharmaceutical use [9]; however, since about the late 1990s, in the United States and elsewhere, considerable interest has focused on developing it as an oilseed feedstock for industrial purposes [3,10,11]. Agronomic management guidelines for commercial production targeting industrial uses of the seed oil are inadequate because information has been focused on materials other than seed yield [12]. A grower’s guide developed by Froment et al. [13], based on field work in the UK and the Netherlands, recommends a range of N fertilization from 50 to 100 kg ha−1. Król [14] demonstrated that, when field-grown calendula in Lublin Poland was fertilized with 0–160 kg N ha−1, a significant increase in both vegetative and reproductive (dry inflorescences) material occurred between 0 and 80 kg ha−1, but no significant gains were observed at higher levels of amended N. Others [15,16] reported modest positive responses in calendula seed yield up to 90–100 kg ha−1 of amended N. Under environment-controlled conditions, Johnson and Gesch (2013) demonstrated that calendula had a modest response to soil N fertilization; calendula followed a quadratic response to soil-amended N, with reproductive dry matter optimized at a level equivalent to about 130 kg ha−1. In a field study conducted in Iran under irrigation, Moosavi et al. [17] found a significant increase in calendula reproductive material up to 120 kg ha−1 of amended N. For large-scale oil seed production, N-fertilizer rates should be optimized for maximum oil yield and minimum environmental risks. Most of the literature has focused on flower components, or seed biomass but not oil production, so this basic agronomic information is needed before large-scale commercial production of calendula is practical. In addition, the limited literature on calendula response to N fertilizer has not included reports of residual soil–N at the end of the growing season.
Inadequate nitrogen can lower potential yield, leading to a lower economic return. However, over fertilization can lead to negative economic and environmental consequences. The overuse of N fertilizers in agriculture has been cited as a source of air and water pollution [18]. The release of reactive nitrogen (e.g., nitrate) into the Mississippi watershed from agricultural lands has long been recognized as a contributor to the hypoxia in the Gulf of Mexico [19,20]. Despite long-standing goals to reduce nutrient loads, the “dead zone” size measured in 2017 exceeded the five-year average (https://www.epa.gov/ms-htf/northern-gulf-mexico-hypoxic-zone). Modeling scenarios highlighted the need to improve nitrogen removal efficiency, since residual soil N has the potential to move off-farm entering watersheds. Several indices of nutrient use efficiency have been established to evaluate the efficiency of nutrient application on the agronomically desirable product(s) [21,22,23]. Nitrogen remaining in the soil at the end of the growing season represents an unused input and a potential environmental pollution risk.
Managing N-fertility for crop production can vary with soil type and climatic conditions. Mollisols are common across the Northern Corn Belt region of the USA [24] where the climate is characterized as continental mid-latitude with cold winters and warm summers [25]. Research to establish N-fertilizer recommendations needs to consider agronomic response and to measure soil residual N to evaluate environmental risks. As calendula is developed as an industrial oil seed crop in the Northern Corn Belt, USA, N-fertilizer recommendations are needed, which may be transferable to other areas with similar soils and climate.
It was hypothesized that a recommended fertilizer rate for maximum agronomic yield would differ from the recommended rate for minimum environmental risk. The objectives of this study were to (1) evaluate the effects of N rates on biomass, seed, and oil yield; (2) determine calendula’s efficiency to acquire and utilize N; and (3) measure residual soil N after crop harvest as an indicator of potential environmental risk.

2. Materials and Methods

2.1. Study Sites and Experimental Design

To assess plant biomass, seed and oil yield response to N fertilizer (urea) application, a replicated plot study was conducted during the 2014 and 2015 growing seasons at Swan Lake Research Farm in West Central Minnesota (elevation 344 m, 45°35′ N, 95°54′ W). Each year the plots were located on different field areas with Barnes soil (fine-loamy, mixed, superactive, frigid Calcic Hapludoll). The soil organic C in the surface 30 cm in the Barnes soil on the research farm averages 25 g kg−1 soil [26]. Each year, the experiment was arranged in a randomized complete block design, consisting of five nitrogen rates (0, 34, 67, 134, and 202 kg N ha−1) established in four blocks (replications), which resulted in 20 (3 m × 4.6 m) plots. The farm site is equipped with a weather station that records maximum and minimum air temperature using a shielded thermistor at 2 m and precipitation with a tipping bucket rain gauge [27] Climate 1980–2010 normals are from the University of Minnesota West Central Research and Outreach Center [28]. Monthly precipitation normals are 72, 102, 99, 85, and 74 mm for May, June, July, August, and September, respectively. Minimum and maximum air temperature normals expressed as °C were 7.4 and 20.2 in May, 13.1 and 25.0 in June, 15.3 and 27.3 in July, 13.7 and 26.4 in August, and 8.3 and 21.7 in September.

2.2. Agronomic Practices and Fertilizer Treatments

During the year preceding the N rate study, the experimental sites were managed to reduce any carry over effects from previous crops or fertilizer by growing sorghum/Sudan grass (Sorghum bicolor × Sorghum bicolor var. sudanense) without N fertilizer. The entire targeted site was planted with this grass, which was sown into 38 cm rows at a planting rate of 502,000 plants ha−1. The grass was cut and biomass removed twice during the growing season. The nitrate plus ammonium in the experimental sites before fertilizing averaged 28 and 31 kg N ha−1 in 2014 and 2015, respectively.
A pre-emergence herbicide, trifluralin (α,α,α-Trifluoro-2,6-dinitro-N,N-dipropyl-p-toluidine), at 2.34 L ha−1 was applied at the time of seedbed preparation. Each year, the entire study site was tilled with a field cultivator once and harrowed twice to prepare an even seedbed. Prior to tillage, all plots received 33.6 kg ha−1 of super (triple) phosphate (P2O5) 0-44-0. Just before sowing, urea was applied with a small hand spreader to achieve N-rates of 0, 34, 67, 134, and 202 kg N ha−1. The fertilizer was incorporated at the time the plots were harrowed.
Calendula was sown at 13.5 kg ha−1 on 28 May 2014 and 21 May 2015 into 19 cm spaced rows using a no-till drill (model 3P1006NT, Great Plains, Salina, KS, USA). Three days prior to harvesting with a plot combine, calendula was treated with a desiccant, diquot dibromide [6,7-dihydrodipyrido(1,2-a:2′,1′-c) pyrazinediium dibromide] at 11.7 mL L−1 with 6.25 mL L−1 crop oil. Harvest occurred on 18 September 2014 and on 1 September 2015.

2.3. Seed and Seed Oil Yield

Seed yields are reported as dry seed mass (kg ha−1). Seed oil content was measured by pulsed nuclear magnetic resonance (Bruker Minispec mq10, Bruker, The Woodlands, TX, USA) on approximately 5 g of seed from each treatment replication using previously described methods [29] after calibrating the instrument with known quantities of pure calendula oil. According to AOCS Method 2-75, seed samples were first dried at 130 °C for 4 h and cooled in a desiccator for 15 min before oil content was measured.

2.4. Plant and Soil Sample Measurements and Analysis

Stand counts were determined by counting the number of plants in one meter of row within the harvested area of each plot. In 2014, plant stands were counted four times (11, 18, 23, and 30 June), whereas they were taken twice in 2015 (10 and 16 June). The populations reported are based on the final date counted in each year.
To calculate shoot-to-root ratio, roots and corresponding aboveground biomass were sampled when plants transitioned from vegetative to reproductive growth (i.e., initial flowering). Calendula root and shoot samples were collected on 21 July 2014 and 15 July 2015 from two (0.381 m2) areas in each plot. Shoots were cut off at soil level. Root were sampled by taking a soil sample within the crop row and between rows using a 6.5 cm inner diameter tipped hydraulic probe to a depth of 60 cm. As a result, there were four cores taken in each plot. Soil cores were sectioned to 0–30 and 30–60 cm intervals to provide an estimate of root mass and root mass density. Soil cores were stored at 4 °C in plastic bags until roots could be hand-washed from the soil as previously described by Johnson and Gesch [30], as a modification of the method used by Smucker et al. [31]. Root and shoots were dried in a forced air oven at 65 °C to constant mass before dry biomass was determined.
Plant biomass and harvest index were determined by collecting aboveground biomass just before plants were desiccated for harvest from a 0.19 m2 quadrant. Plant samples were collected as described above. Seed mass was determined by hand-threshing these samples. Harvest index was calculated by dividing hand-threshed dry seed biomass by total aboveground dry biomass.
Three separate soil sampling events occurred annually. First, the nitrate plus ammonium level in the 0–60 cm range was measured before urea was applied. The second measurement was taken prior to planting, but after fertilizer was applied. Soil samples were taken from each plot (4 cm diameter core) in the spring (4 June 2014 and 27 May 2015) to a depth of 60 cm and divided into 0–15, 15–30, and 30–60 cm. The third set was collected on 22 September 2014 and 2 September 2015 after harvest to provide a measure of residual N, using the same sampling protocol used prior to planting. Duplicates of each sampling core were taken and each was dried to a constant mass, one at 105 °C for bulk density and the other at 37 °C for nutrient analysis.
Dried plant material from the biomass samples was ground to pass through a 0.425 mm screen. Carbon and N content were determined by combustion using a LECO TRU SPEC CN analyzer (LECO Corporation, St. Joseph, MI, USA). Prior to chemical analysis, visible roots and plant residue were removed, samples were ground using a hammer mill, followed by a ball mill (Frisch Pulvesette 5, Idar-Oberstein, Germany). Total soil C and N were determined by combustion as described for the plant material and inorganic C as described by Wagner et al. [32]. Soil nitrate and ammonium ion concentrations extracted with 1 M potassium chloride [33] were determined using a LACHAT QuickChem 8500 Series 2 (Lachat Instruments, Loveland, CO, USA). As recommended for alkaline soils, available P was determined using a colorimetric assay (wavelength 660 nm) of soil extracted using Olsen P extractant (0.5 M sodium bicarbonate solution) [34]. Potassium extracted from soil with 1 N ammonium acetate was quantified by flame emission with an Atomic Absorption spectrophotometer (wavelength 760 nm) [35].

2.5. N Use Efficiency and Statistical Analysis

Like other researchers [21,22,23], we calculated several indices of how efficiently N was taken up and subsequently converted to seed or oil biomass. Seed N use (Equation (1)) reflects the effectiveness of calendula to convert the nitrogen taken up into seed biomass [21], while seed N (Equation (2)) and oil N (Equation (3)) use efficiencies reflect the effectiveness to produce an agronomically desirable product per unit of applied fertilizer [22,23]. Agronomic efficiency [23] compares yield of an unfertilized control to yield with the application of N fertilizer (Equation (4)).
Seed   N   use   ( kg   kg 1 ) = Dry   seed   yield / Seed   N   uptake
Seed   N   use   efficency   ( kg   kg 1 ) = Dry   seed   yield / N   applied
Oil   N   use   efficency   ( kg   kg 1 ) = Oil   yield /   N   applied
Agronomic   N   efficency   ( Δ kg   ) =   ( Dry   seed   yield With   N   Dry   seed   yield No   N ) / N   applied
Measured parameters were analyzed for linear and quadratic response to the continuous variable N fertilizer rate using PROC REG in SAS/STAT software version 9.4 (SAS Institute, Cary, NC, USA) [36]. The quadratic function is presented because the quadratic coefficients allowed calculating the corresponding inflection point, which represents the maximum fertilizer response. Agronomic year to year variability is expected due to weather; thus, the response to fertilize using data from both years is of more value for determining recommendation rates. Therefore, regression equations reflect individual data from both years. The overall goal was to determine the response to fertilizer rate; years are considered a random effect. Annual averages and standard errors are presented to visualize data variability. Post-hoc comparisons among specific N rate treatments over the two years was done using LSMEANS PDIFF within a general linear model (PROC GLM). Comparisons are considered statistically significant at a p value of ≤0.05. Figures were produced using SigmaPlot for Windows version 12.5 Build 12.5.038 (Systat Software, Inc., San Jose, CA, USA).

3. Results

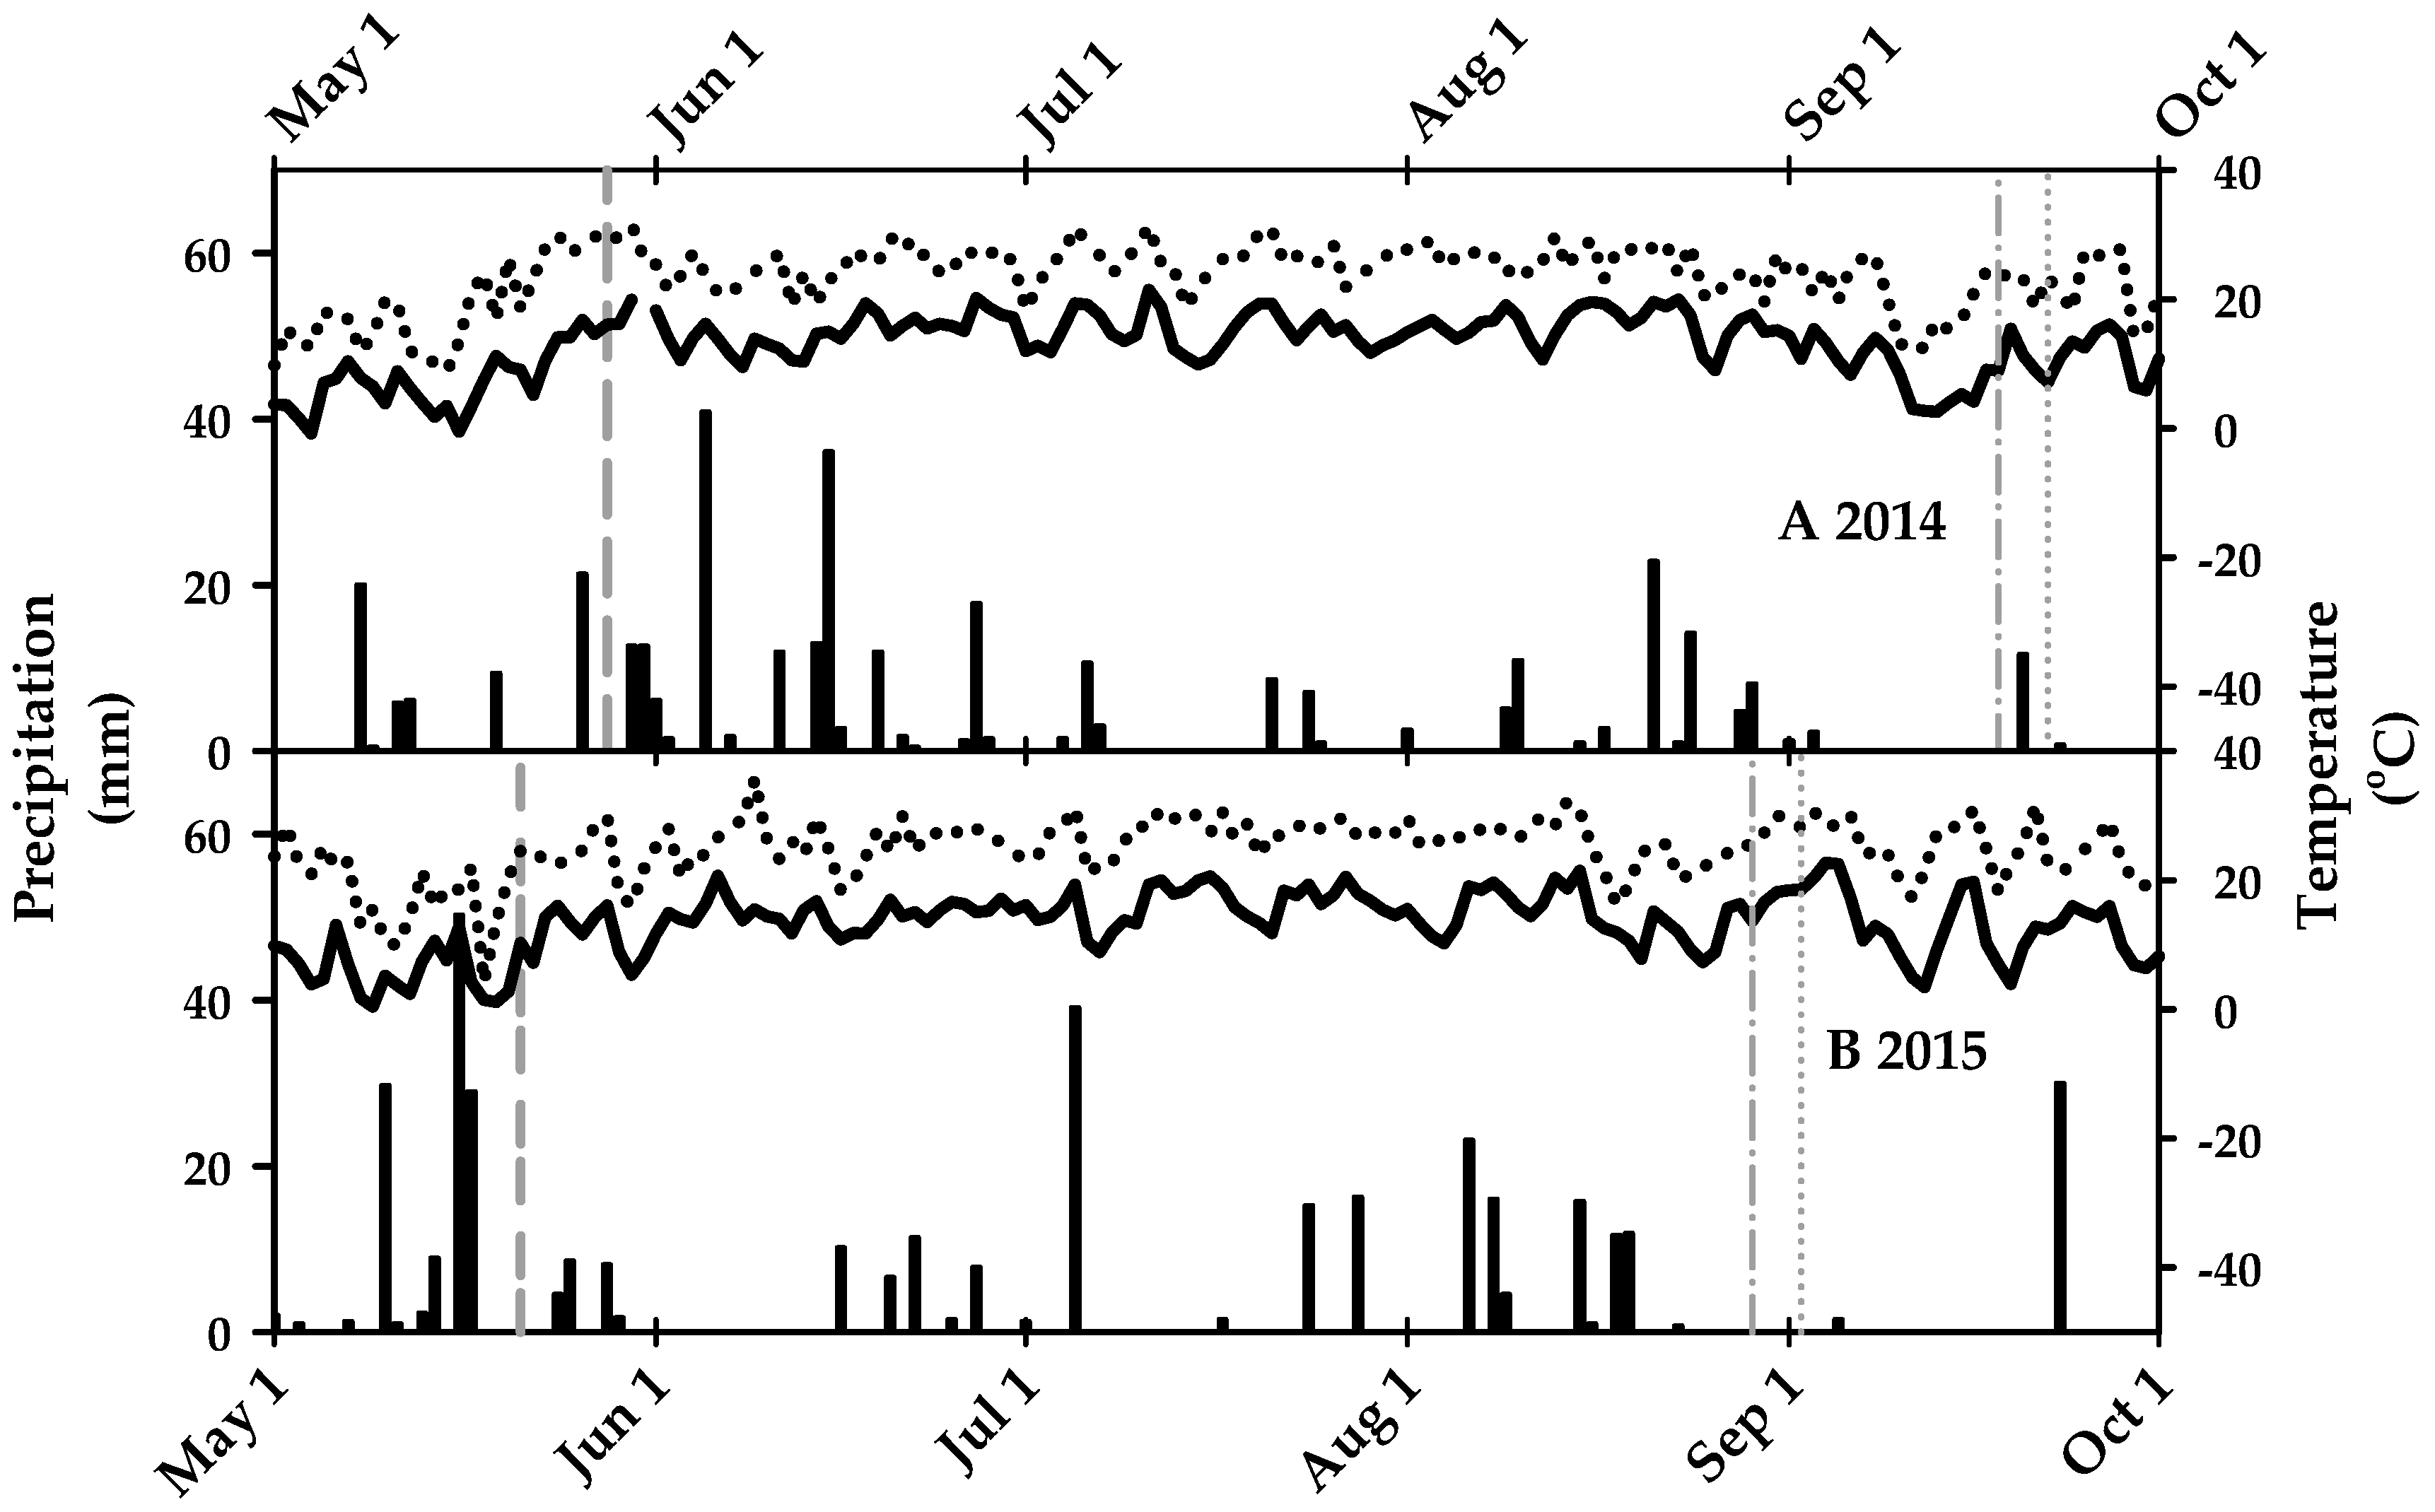
3.1. Growing Season Conditions

Accumulated growing season precipitation from May through September was comparable between years at 360 mm in 2014 and 378 mm in 2015, although slightly lower that the longer normal (Figure 1). However, distribution of precipitation varied. In 2014, June was the wettest month (149 mm), while in 2015 the greatest amount of precipitation occurred in May (149 mm). In 2014, September (16.5 mm) and July (32.5 mm) were the driest months, while in 2015 the driest month was in June (38 mm). Growing season average mean temperatures were 18.2 and 19.0 °C in 2014 and 2015, respectively.

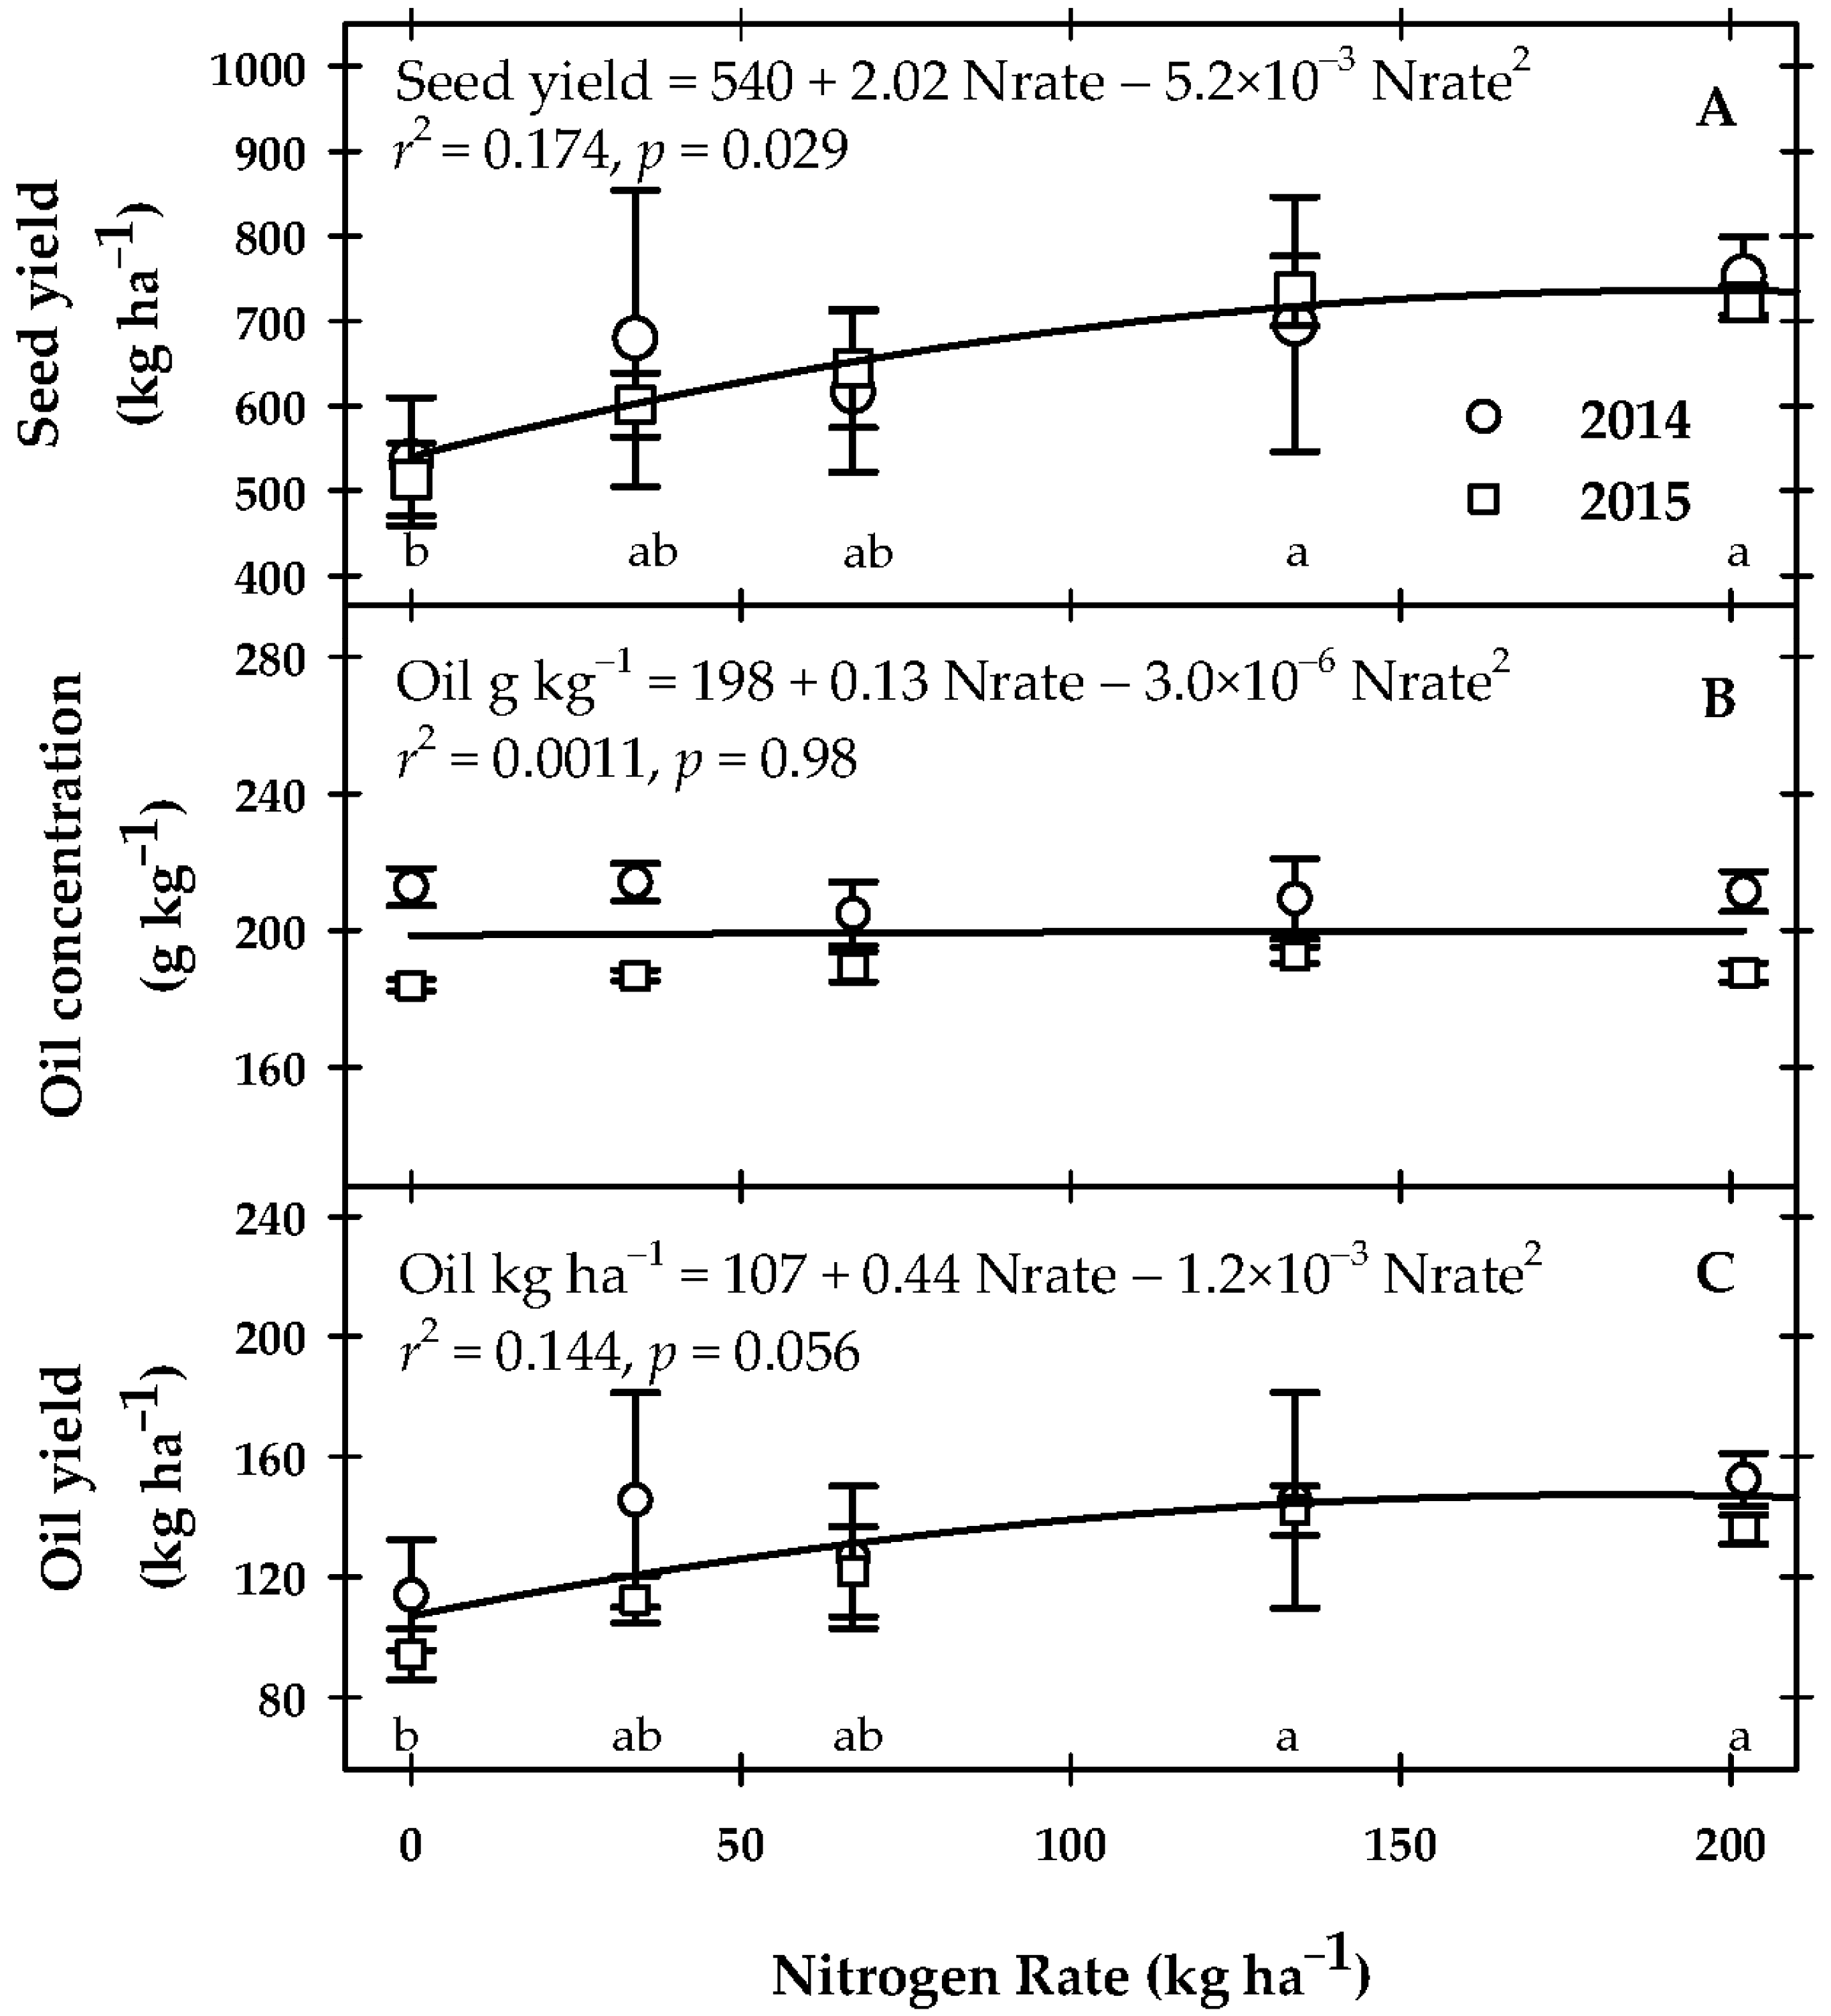
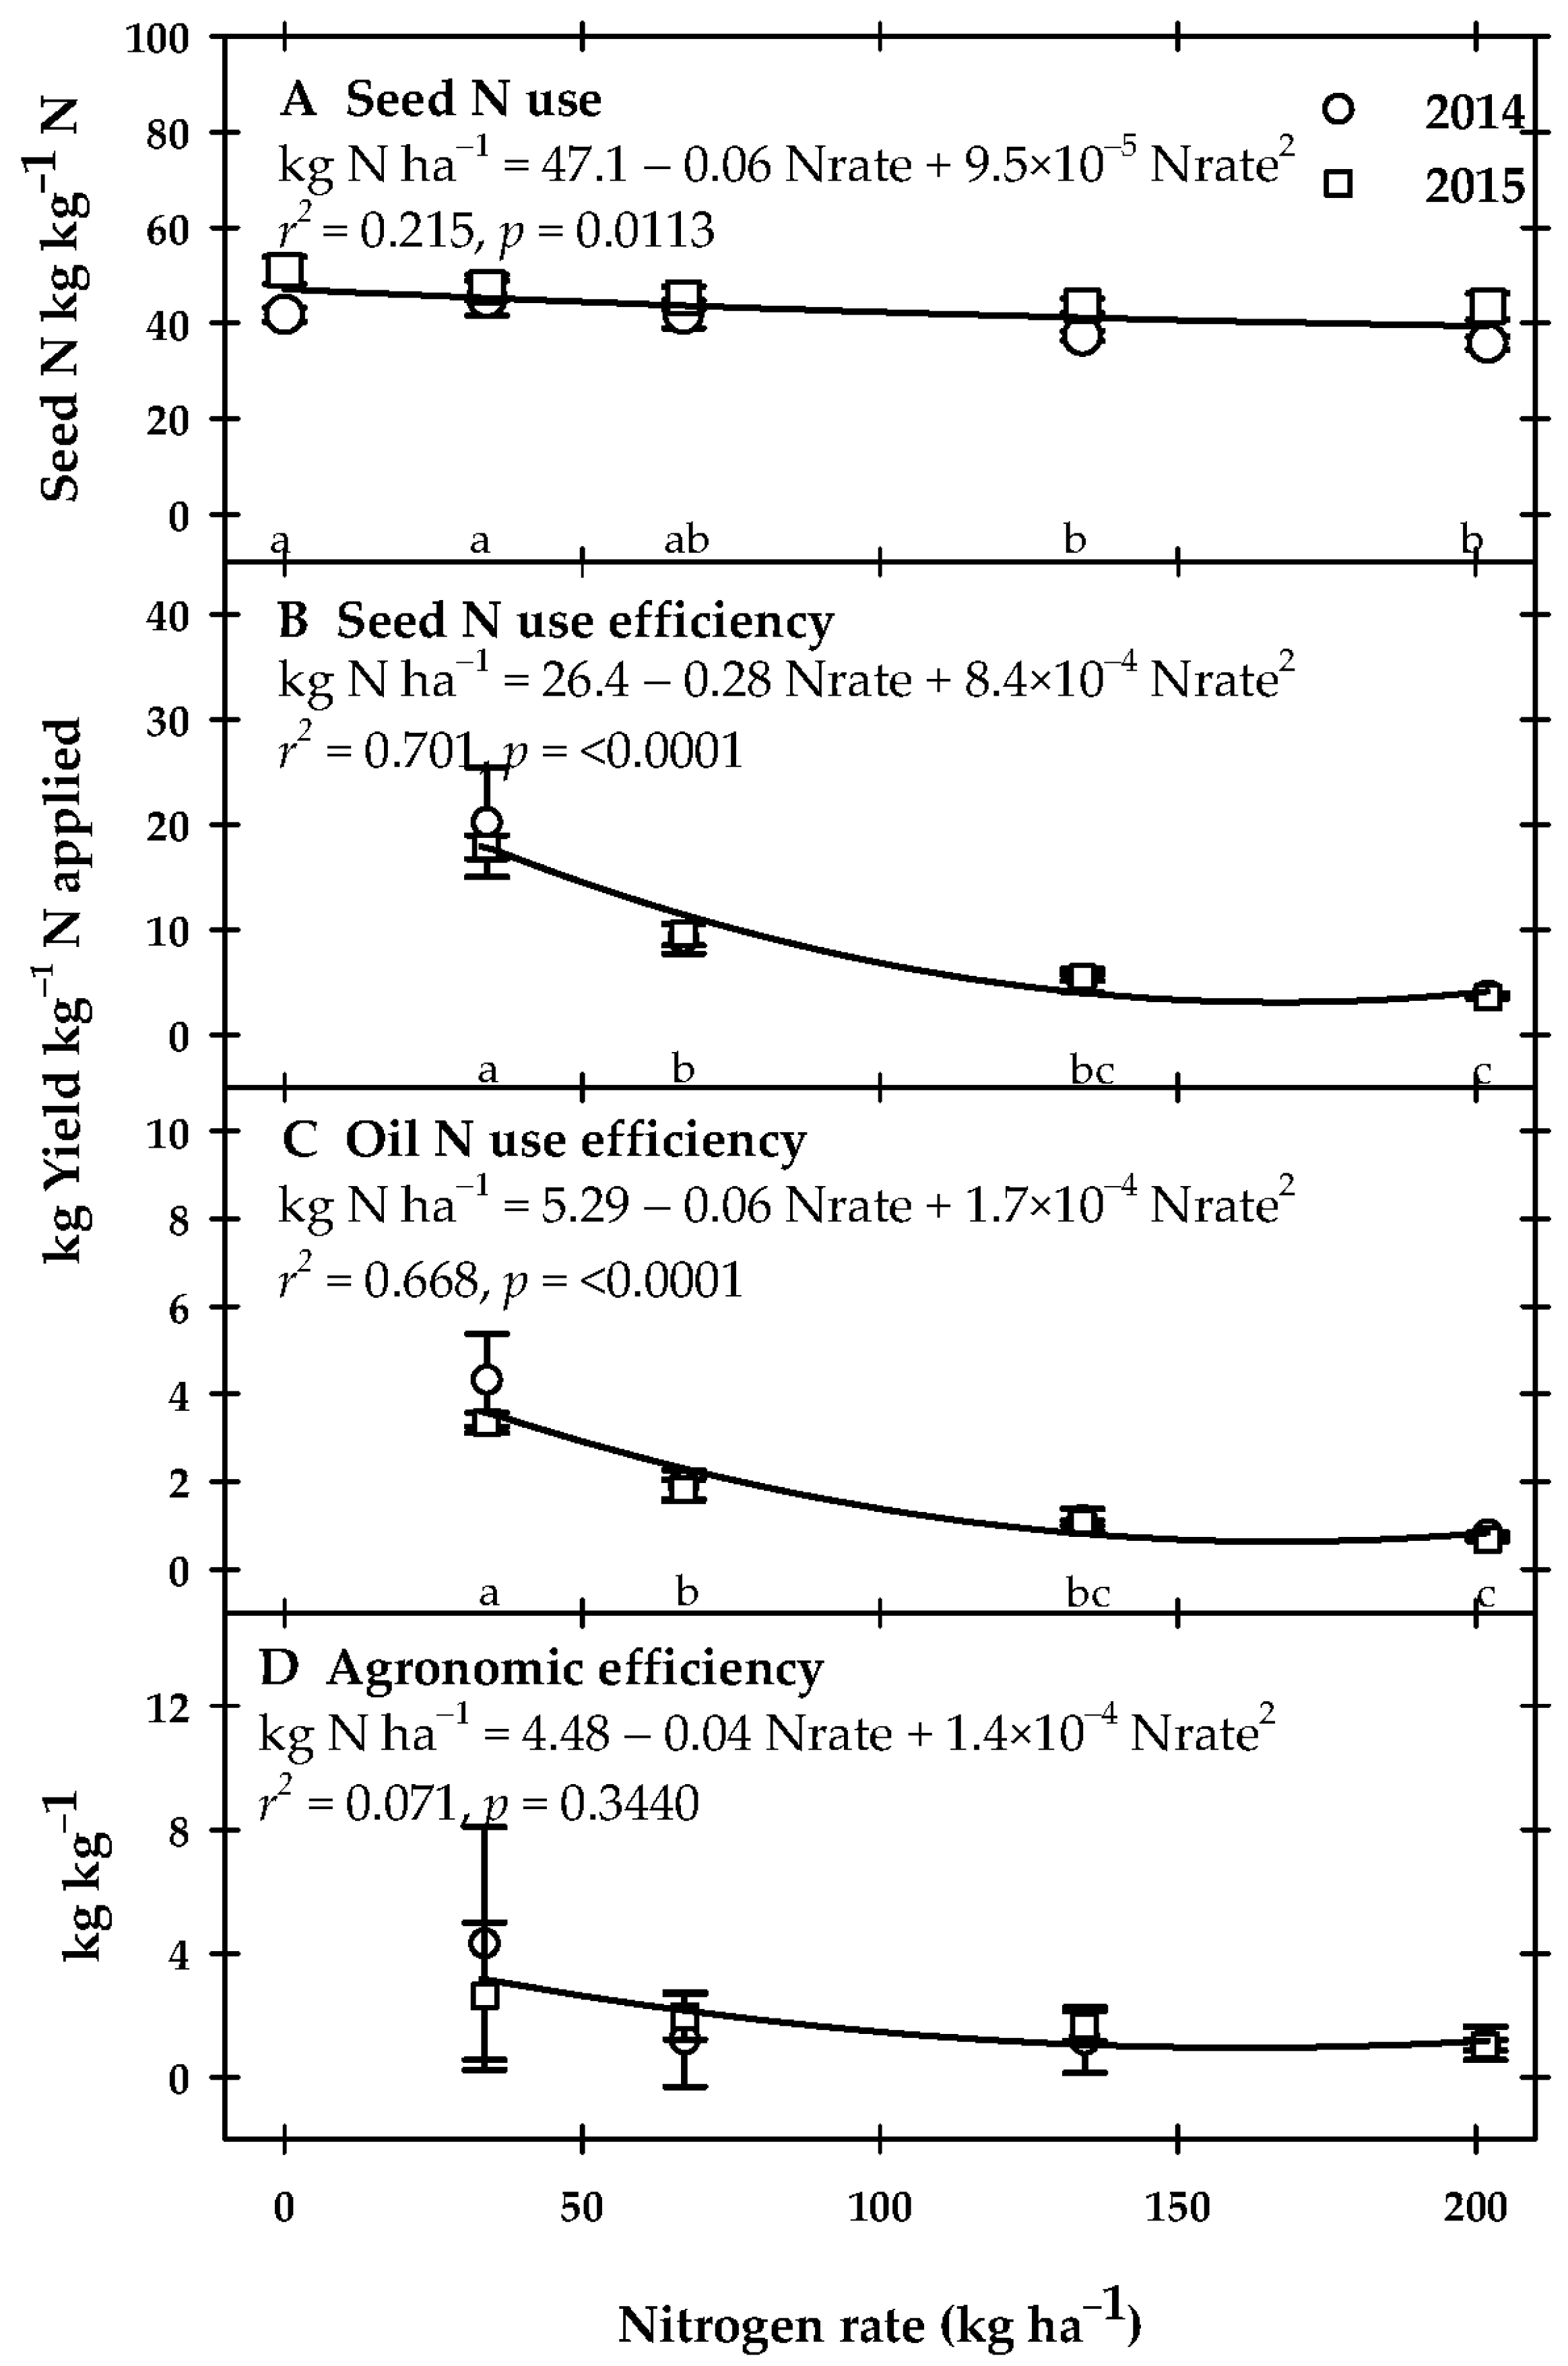
3.2. Yield and N-Use Efficiency

Seed yield could be fit with a quadratic function (r2 = 0.174, p = 0.029) (Figure 2A) or a linear function (seed yield = 0.96 Nrate + 566; r2 = 0.159, p = 0.011), suggesting that the seed responded weakly to N applications. Means and standard error for each year are presented, while regression is based on data from both years (n = 40). The 0 kg N ha−1 rate had an average dry seed yield of 524 kg ha−1, while dry seed yield increased to 738 kg ha−1 at the highest N rate (202 kg N ha−1). The coefficients provide the means to calculate the inflection points of a quadratic function that corresponds to the theoretical optimum N rate. Based on the quadratic function describing the N response over these two growing seasons, the maximum seed yield was calculated to occur at 194 kg N ha−1 with a corresponding predicted seed yield of 736 kg ha−1. Seed oil concentration did not respond to N application, averaging 192 ± 0.25 g kg−1 over the two growing seasons (Figure 2B). Seed oil yield showed a quadratic response to N rate (r2 = 0.144, p = 0.056) (Figure 2C), but the linear function was not significant (r2 = 0.129, p = 0.23). The 0 kg N ha−1 treatment had an average seed oil yield of 105 kg ha−1 and an average seed oil yield increased to 147 kg ha−1 at the highest N rate (202 kg N ha−1). Based on the quadratic function describing the N response over these two growing seasons, the predicted maximum oil yield (147 kg ha−1) is calculated to occur at 183 kg N ha−1. However, since the dry seed and oil seed yield response was weak, this method may overestimate maximum response; especially considering that mean separation comparison suggests that the 134 and 202 kg N ha−1 differed from the control, but differences were not noted among the N rates. The lack of differences among N rates implies little return per additional unit of fertilizer added.
The quadratic function was significant for seed N use (r2 = 0.215, p = 0.0113), seed N use efficiency (r2 = 0.701, p < 0.0001), and oil N use efficiency (r2 = 0.668, p < 0.0001), but not for agronomic efficiency (r2 = 0.071, p = 0.3440) (Figure 3). Seed N use was similar among the 0, 34, and 67 kg N ha−1 rates, and among the 67, 134, and 202 kg N ha−1 rates, while the lowest two rates had higher seed N use compared to the highest two N rates. Mean comparisons found that greatest seed N use efficiency and oil N use occurred at the 34 kg N ha−1 rate and decreased precipitously at higher rates. The linear function was also significant for several of these parameters (seed N use = 46.6 − 0.038 Nrate, r2 = 0.211, p = 0.001), (seed N use efficiency = 18.3 − 0.0828 Nrate; r2 = 0.576, p < 0.0001), and (oil N use efficiency = 3.67 − 0.016 Nrate; r2 = 0.551, p < 0.0001), but not for agronomic efficiency (r2 = 0.055, p = 0.195). A quadratic function did not significantly describe agronomic efficiency, but it could be described by a power function (agronomic efficiency = 27.54 (Nrate)−0.623, r2 = 0.901). Harvest index remained constant over all N rates with an overall average of 0.126 ± 0.005.

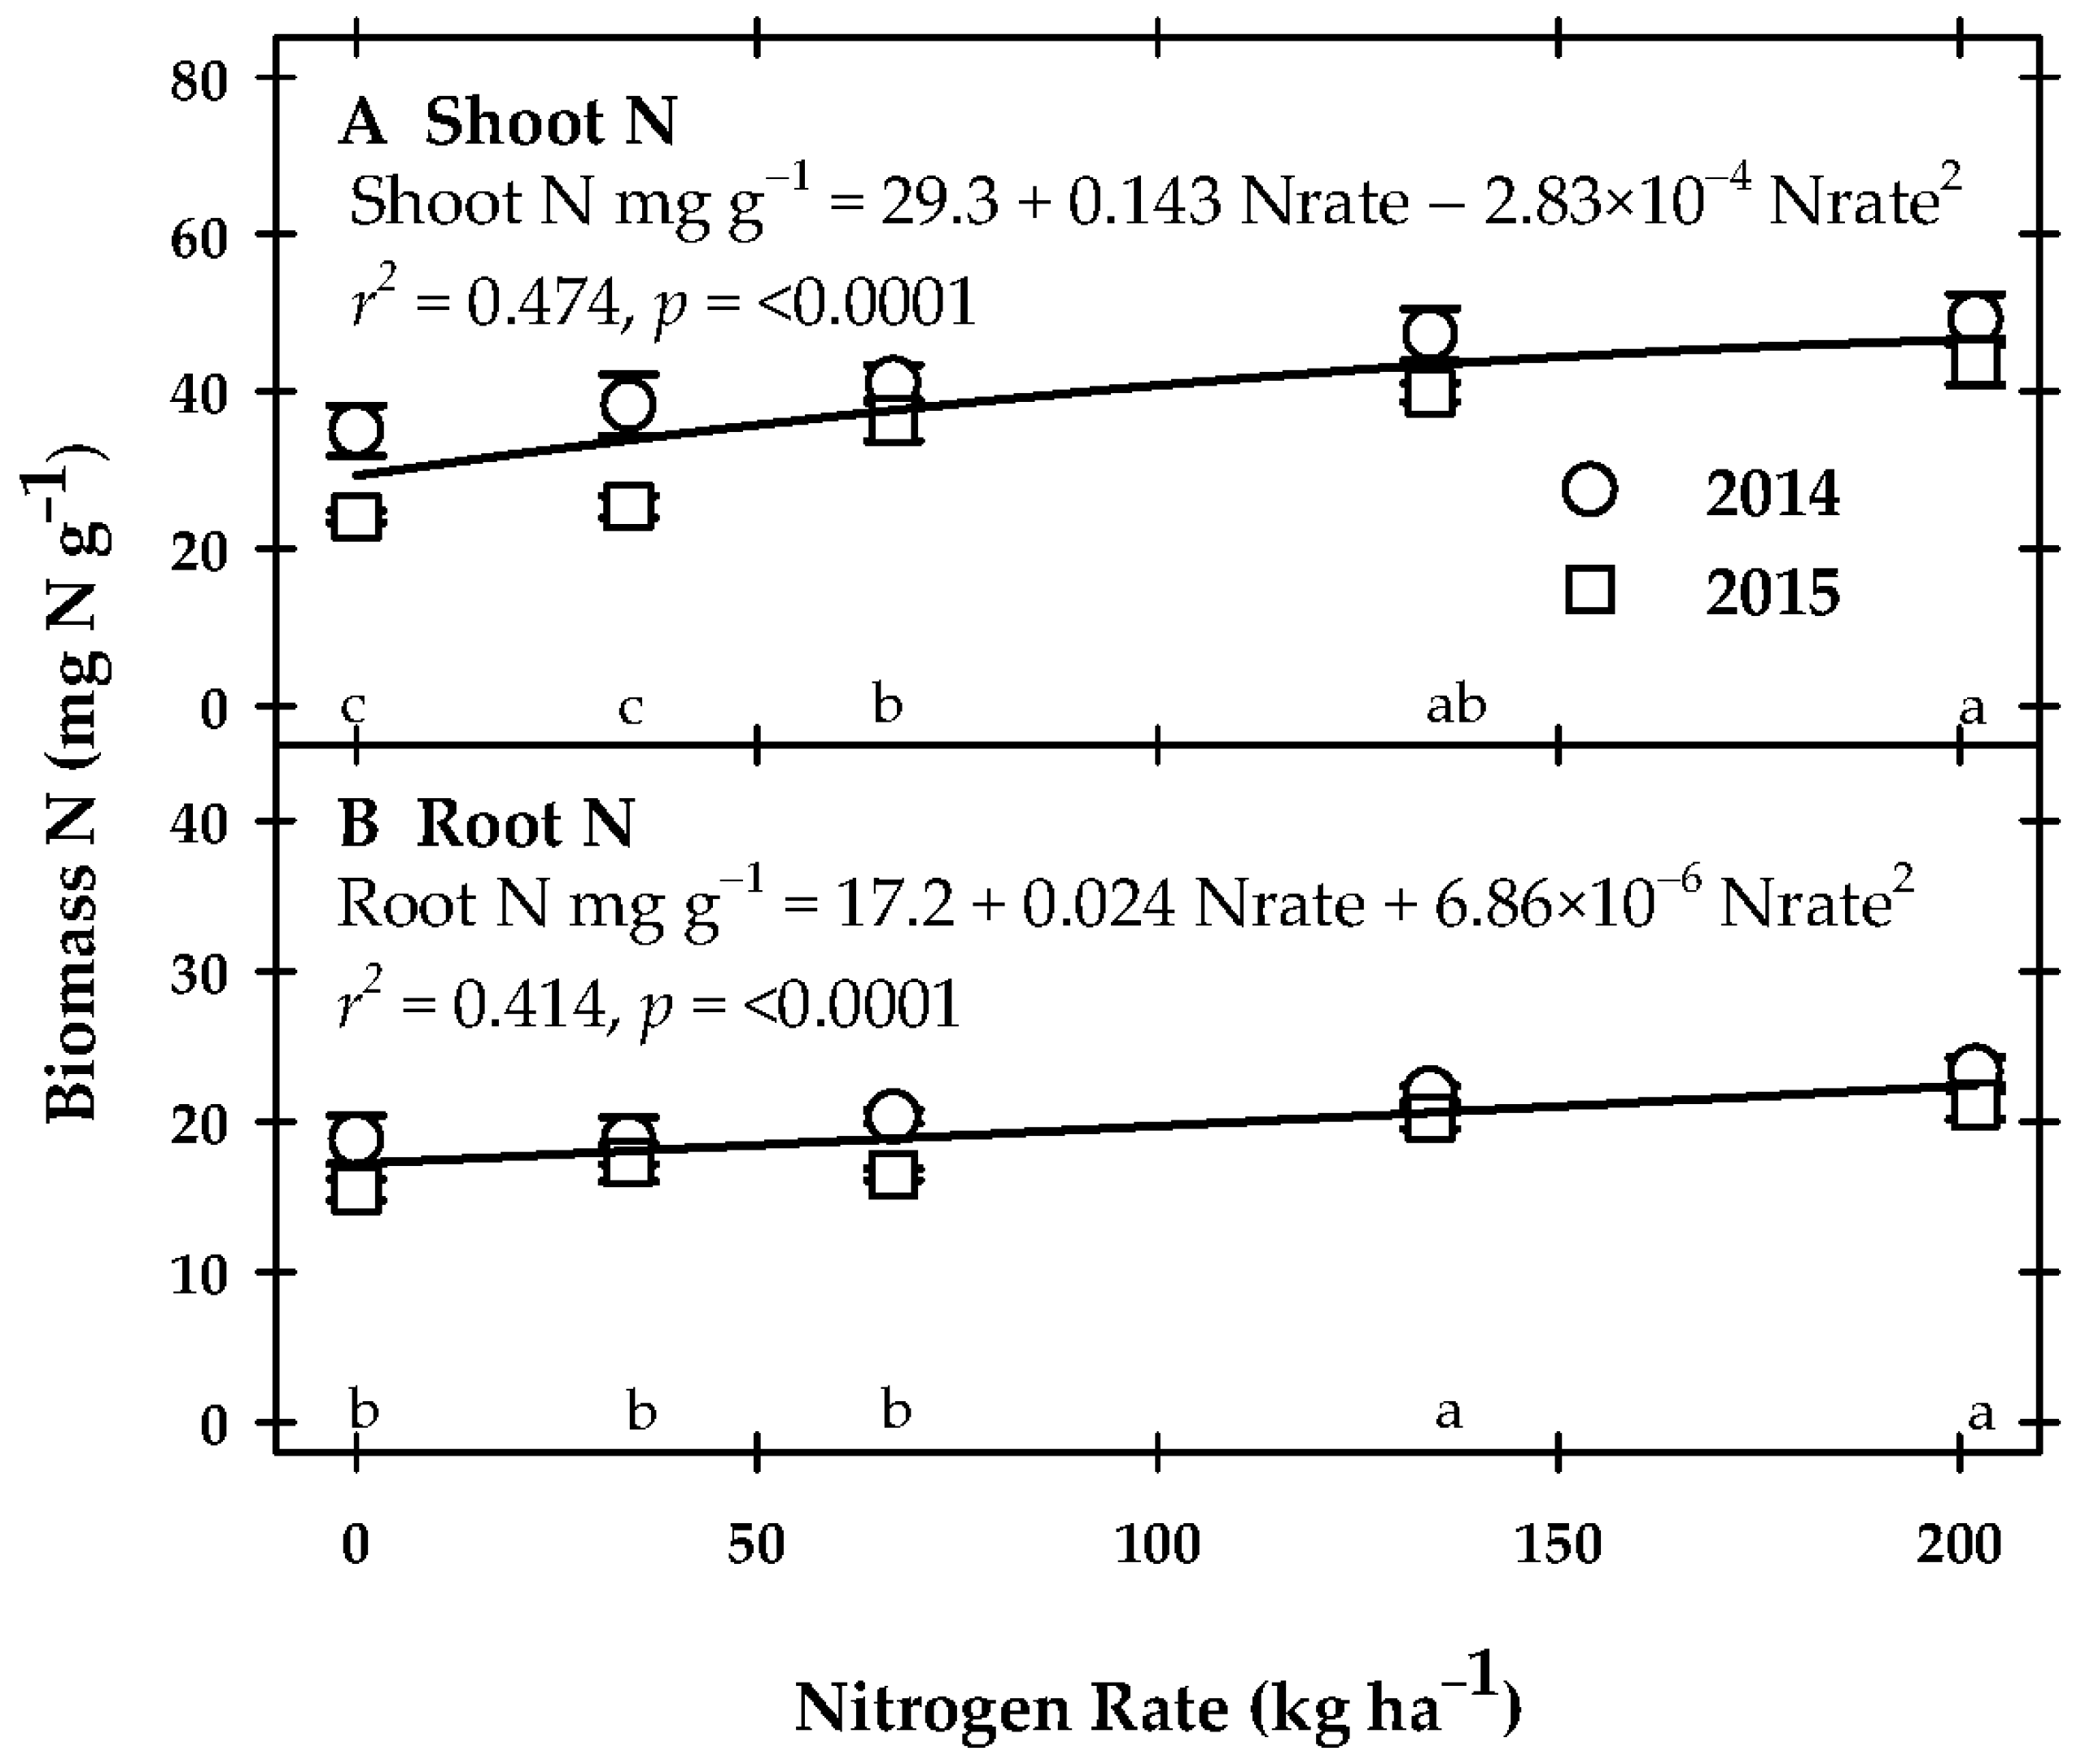
3.3. Vegetative Parameter Response

Calendula plant stands did not respond to N rate, and similar stands were achieved both years, averaging 871,000 ± 69,300 plants ha−1. Shoot and root biomass N concentrations were significantly described by quadratic function (Figure 4). A linear function could be used to describe biomass N response (shoot biomass N = 30.8 + 0.0846 Nrate, r2 = 0.458; p < 0.0001; root biomass N = 17.1 + 0.0258 Nrate, r2 = 0.414; p < 0.0001). Mean comparisons suggested that shoot N concentration was lower at N rates of 0 and 34 kg N ha−1 compared to the three other N rates. Root tissue N concentration at the three lower N rates were similar and significantly less than the root N concentration at 134 and 202 kg N ha−1 rates. Greater tissue N concentration did not translate to additional shoot biomass (2030 ± 1120 kg ha−1) nor root biomass (2010 ± 593 kg ha−1), so the root-to-shoot ratio (1.34 ± 0.86) was not impacted. The lack of growth response to N rate is consistent with weak seed and seed oil yield responses. Furthermore, this indicates that calendula takes up the additional N but is inefficient at utilizing it to produce more biomass or agronomic product.

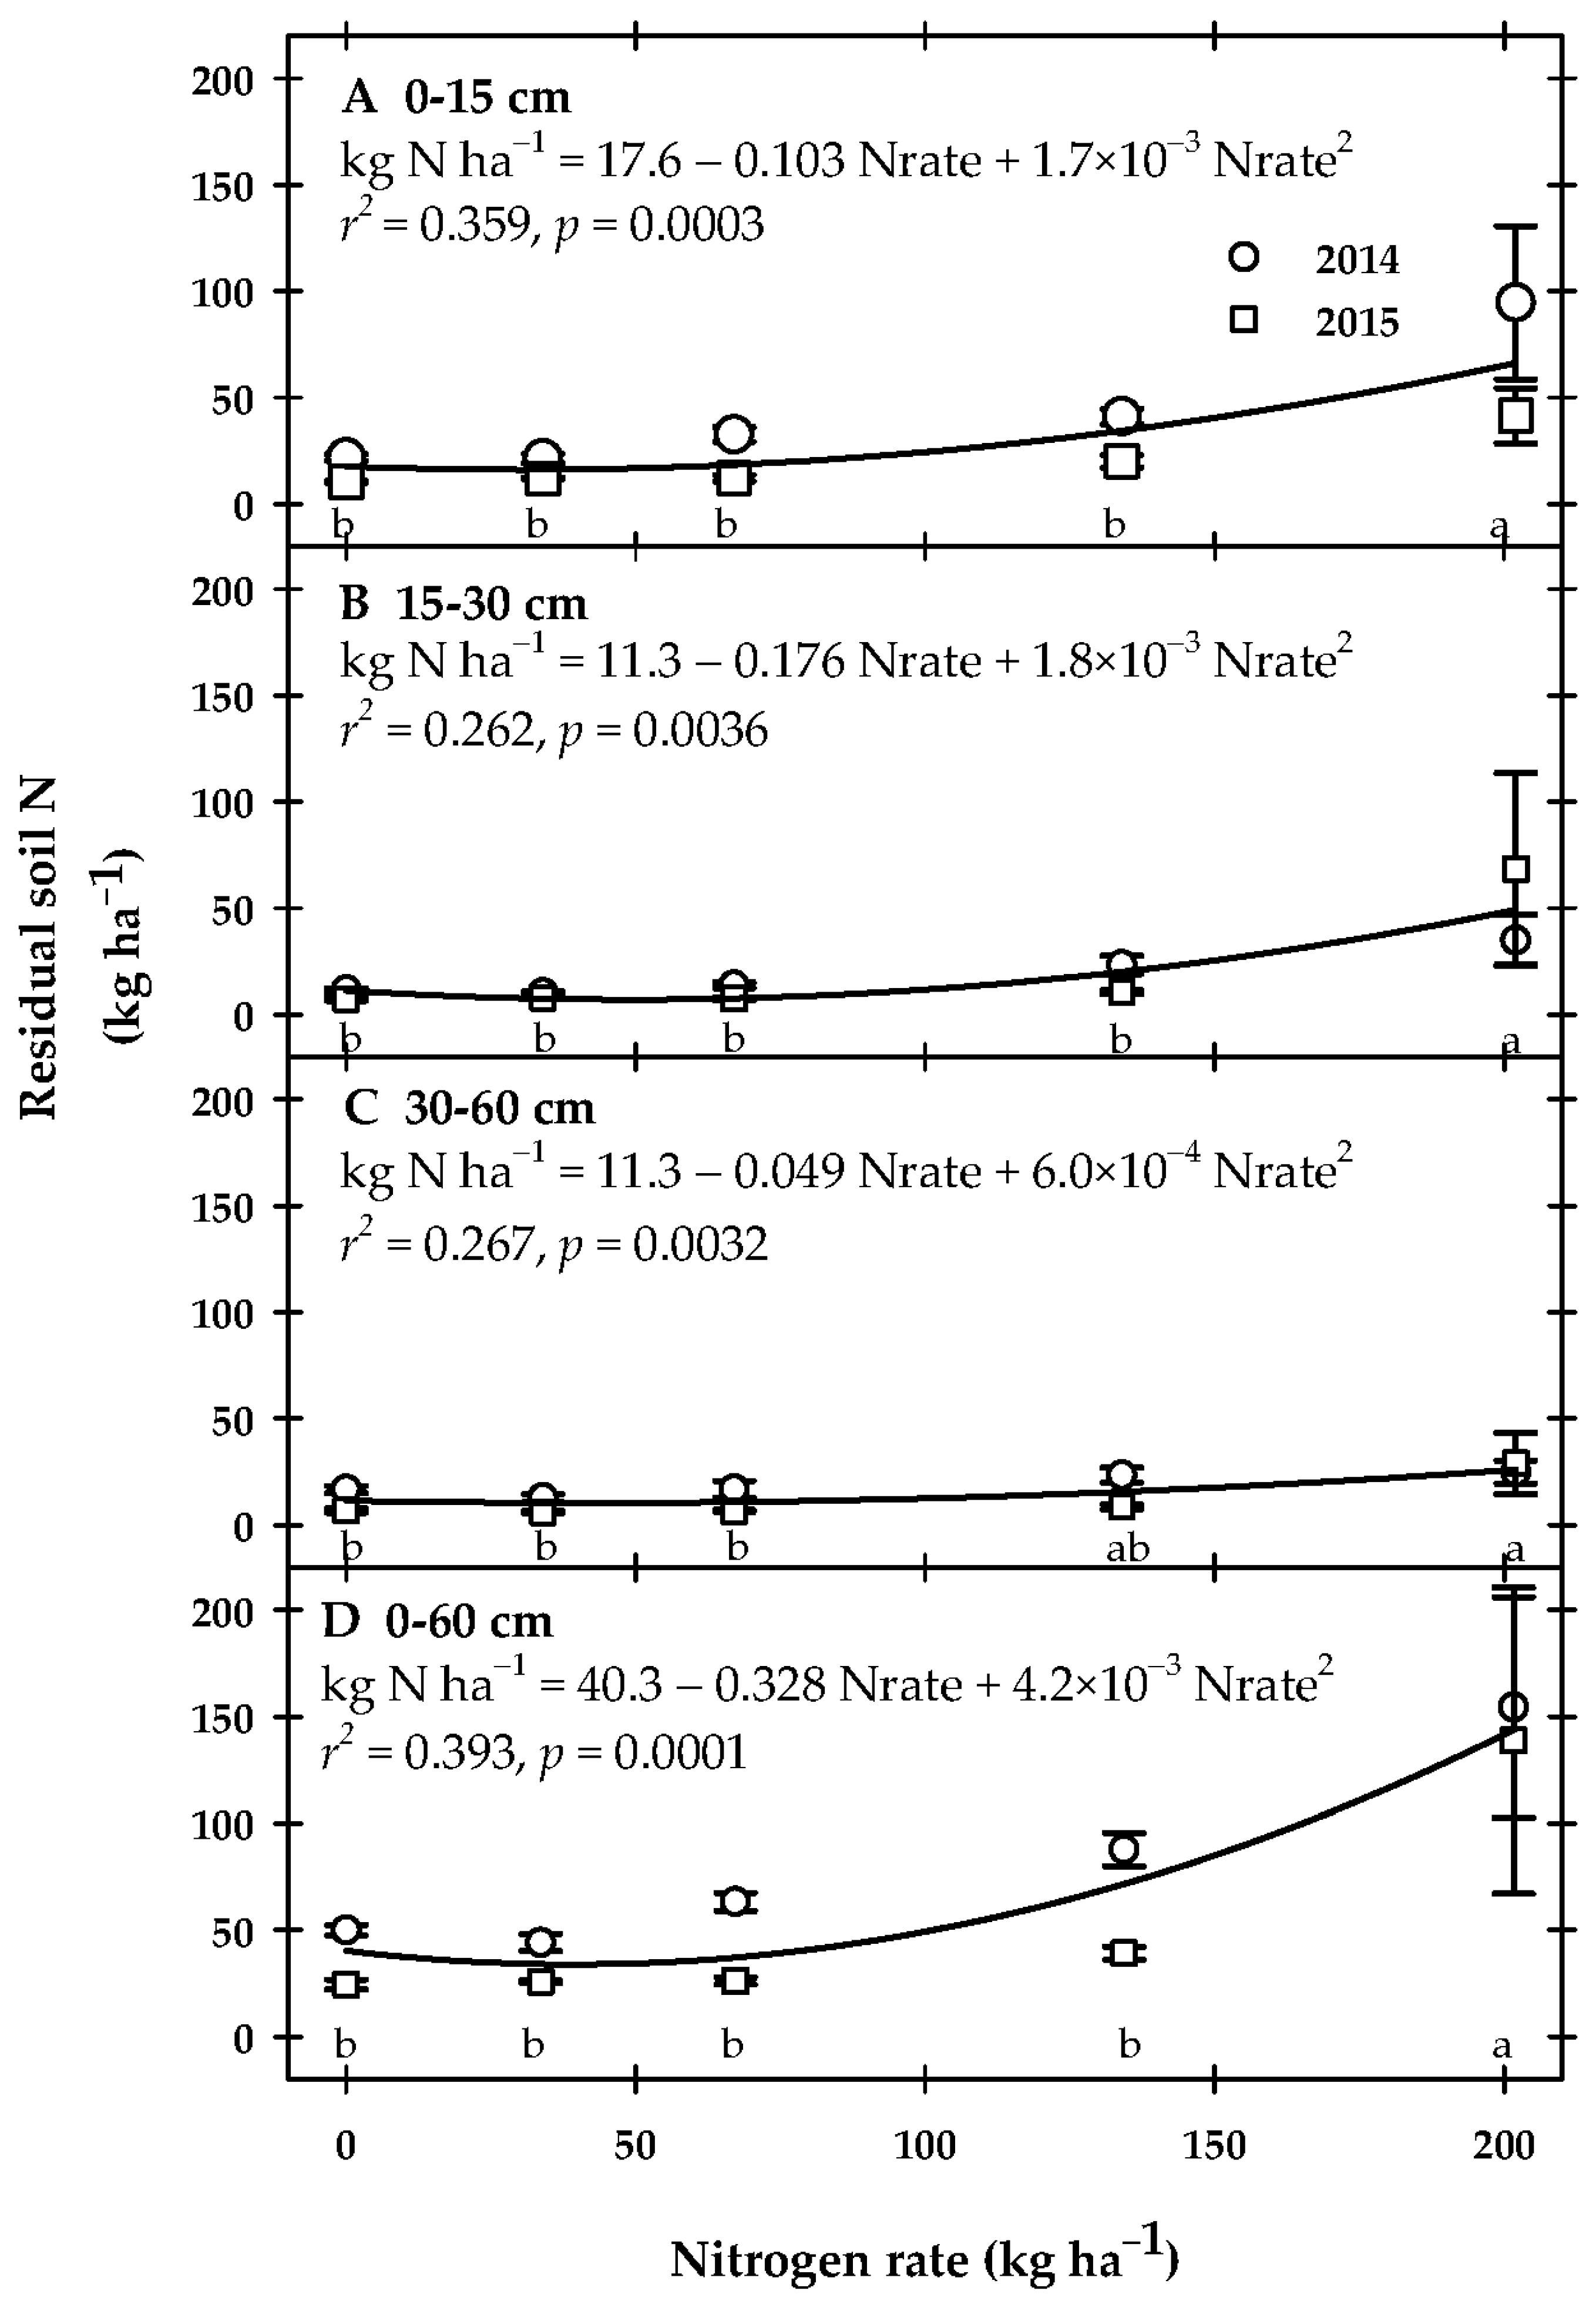
3.4. Post-Harvest Residual Soil N

The amount of soil residual N following harvest at 0–15, 15–30, 30–60, and for 0–60 cm could be described by either a linear or quadratic function; however, only the quadratic functions are shown (Figure 5) because these functions were used to calculate the point at which the N rate caused the least residual soil N. The linear functions were soil kg N ha−1 = 9.17 + 0.247 Nrate, r2 = 0.311, p = 0.0002 at 0–15 cm; soil kg N ha−1 = 2.26 + 0.198 Nrate, r2 = 0.207, p = 0.003 at 15–30 cm; soil kg N ha−1 = 8.26 + 0.078 Nrate, r2 = 0.222, p = 0.002 at 30–60 cm; and soil kg N ha−1= 19.7 + 0.523 Nrate, r2 = 0.327, p = 0.0001 at 0–60 cm. At all profile intervals, mean comparisons found that the 202 kg N ha−1 fertilizer rate had more soil residual N compared to other N rates. At the 202 kg N ha−1 rate, 150 kg ha−1 was measured in the soil 0–60 cm soil profile (Figure 5D), with most of the N detected in the 0–15 cm (Figure 5A) and 15–30 cm (Figure 5B) soil increments. The quadratic equation predicted lowest residual N would occur at fertilizer rates of 30, 49, and 41 kg N ha−1 in the 0–15, 15–30, and 30–60 cm intervals, respectively. For the 0–60 cm profile, the minimum residual soil N of 34 kg ha−1 was predicted to occur at a fertilizer rate of 39 kg N-applied ha−1.

4. Discussion

In a greenhouse pot study with about 37 kg N ha−1 in the potting mix before fertilizer was added, maximum calendula capitula biomass occurred at the equivalent of a fertilizer rate of 169 kg N ha−1 [30]. Slightly less than the 194 kg N ha−1 fertilizer rates for maximum seed and 183 kg N ha−1 rate for oil yield were calculated in this study. Samoon and Kirad [37] reported the greatest seed yield (115 kg ha−1) at a fertilization rate of 150 kg N ha−1 for an ornamental calendula variety on a sandy soil with a baseline of about 5 kg N ha−1. They also reported that, although this fertilizer rate (150 kg N ha−1) provided the greatest seed yield, the efficiency to utilize the N to produce additional yield was very low. On a silt loam with a baseline soil N of 2.3 kg N ha−1 calendula seed yield did not respond strongly to N application [14]. The current study was conducted on Barnes clay loam soil with an initial soil N of about 30 kg N ha−1, and based on the change in soil N in the control plots about 40 kg ha−1 of N was mineralized over the course of the growing season, implying that the soil could provide some of the N needed to support the calendula. Mineralization of soil N is expected to influence the amount of N fertilizer required to support crop production. In general, as more N can be derived from mineralization, the amount of fertilizer N increases [38]. Mineralization is complex; it is impacted by the quality of residue inputs, temperature, moisture, interaction with the current crop, the addition of fertilizer, and the type of fertilizer [38,39]. Recommendation for fertilizer rates reflect the climatic and soil conditions where they were established. As such, these N rate recommendations may serve as an initial guide for expected response but they need to be checked and modified for local conditions prior to adoption.
Based on three indices of N use efficiency measured in the present study (seed N use efficiency, oil N use efficiency, and agronomic efficiency), there appears to be minimal gains in N use efficiency beyond a fertilizer rate of 34 kg N ha−1. The lowest residual soil-N at the end of the growing season was calculated to occur at a fertilizer rate of 39 kg N ha−1, predicted to yield 738 kg seed ha−1 and 124 kg ha−1 seed oil. At this N rate and using the corresponding quadratic response functions for seed yield and seed-oil, those yields are predicted to be about only 15% less than the yield calculated using the N rate of 194 and 183 kg N ha−1, respectively, for maximum seed and seed oil yield, but using 78–79% less fertilizer. Applying N at the rate for maximum yield assuming a price of $313.31 Mg−1 (http://www.farmersco-op.coop/pages/custom.php?id=21023), it would cost $0.083 kg−1 seed and $0.39 kg−1 seed oil, compared to a cost of $0.021 kg−1 seed and $0.099 kg−1 seed oil if urea was applied at 39 kg N ha−1, to minimize residual soil N, which is a four-fold increase in cost per unit yield. Thus, exceeding about 39 kg N ha−1 fertilizer application results in greater cost per unit yield and increases the potential residual soil N.
At the end of the season, about 150 kg N ha−1 was measured in the soil profile at the 202 N kg ha−1 rate, which, assuming a background mineralization of 37 kg N ha−1 from the control, corresponds to 50% of the N applied being unused. Nitrogen remaining in the soil profile at the end of the growing season is at risk of becoming an environmental liability instead of an agronomic asset [18]. In the present study, growing season precipitation was 71 and 53 mm below the 431 mm 30-year average (https://www.ncdc.noaa.gov/cdo-web/datatools/normals) in 2014 and 2015, respectively. In 2014, September precipitation (16.5 mm) was low compared to the 74 mm 30-year average for the same month (https://www.ncdc.noaa.gov/cdo-web/datatools/normals). As a result, N not taken up by growing plants remained near the soil surface instead of moving deeper into the profile, likely because of little downward water flow during dry conditions. In humid climates, excess N can move with water into ground water supplies or through artificial or natural drainage to surface water. Alternatively, N can move with eroding soil into waterways. Regardless of the pathway, displaced reactive N may cause water quality (e.g., hypoxia) and human health issues. Nitrogen in excess of plant demand can result in the release of nitrous oxide [40], which has long been recognized as a potent greenhouse gas [41]. Prudent N management provides environment benefits and avoids ineffective use of valuable fertilizer inputs.
Plant utilization of fertilizer includes nutrient uptake. Calendula appeared to effectively acquire N as evidenced by the increase in tissue concentration in the roots and shoot. However, calendula did not convert the additional N into shoot, root, or reproductive biomass implying a low utilization efficiency. Seed N use declined with N application, implying reduced return on investment consistent with very increased cost per unit seed as calculated above.
This study conducted on a Barnes clay loam, a Mollisol in the Northern Midwest United States demonstrated that calendula, especially calendula seed and oil production, responded weakly to nitrogen application. Based on indices of nitrogen use efficiency, yields, and residual soil N, it may be reasonable either to apply no nitrogen or to limit application to about 39 kg N ha−1. This study strongly supports the need to consider parameters other than just agronomic maximum yield (i.e., residual soil N and cost per unit yield) in determining fertilizer recommendation. Recommendation for urea fertilizer rates reflect the soil properties and climatic conditions of the Midwest United States. The general principles that calendula responds weakly to urea application and that environmental and economic criteria need to be considered to determine N recommendation rates are transferable to other regions and soils as local rate recommendations are modified for local conditions.

Acknowledgments

All funding and publication costs for this study were provided by the United States Department of Agriculture—Agricultural Research Service. The authors thank G. Amundson, D. J. Boots, and C. Rollofson for their technical assistance in the field and sample preparation, J. Hanson for chemical analyses, C. Hennen and S. Larson for agronomic operations. J. Zaharick and B. Burmeister for proof-reading manuscript.

Author Contributions

Jane Johnson, Russ Gesch, and Nancy Barbour conceived, designed, and performed the experiments, Jane Johnson and Nancy Barbour analyzed the data, Jane Johnson wrote the paper, with contributions and revisions from Russ Gesch and Nancy Barbour.

Conflicts of Interest

The authors declare no conflict of interest.

Disclaimer

The use of trade, firm, or corporation names in this publication is for the information and convenience of the reader. Such use does not constitute an official endorsement or approval by the United States Department of Agriculture or the Agricultural Research Service of any product or service to the exclusion of others that may be suitable. The United States Department of Agriculture is an equal opportunity employer.

References

  1. Muley, B.P.; Khadabadi, S.S.; Banarase, N.B. Phytochemical Constituents and Pharmacological Activities of Calendula officinalis Linn (Asteraceae): A Review. Trop. J. Pharm. Res. 2009, 8, 455–465. [Google Scholar] [CrossRef]
  2. Meir zu Beerentrup, H.; Röbbelen, G. Calendula and Coriandrum—New Potential Oilcrops for Industrial Uses. Fett Wiss. Technol. 1987, 89, 227–230. [Google Scholar] [CrossRef]
  3. Gesch, R.W. Growth and Yield Response of Calendula (Calendula officinalis) to Sowing Date in the Northern US. Ind. Crops Prod. 2013, 45, 248–252. [Google Scholar] [CrossRef]
  4. Muuse, B.G.; Cuperus, F.P.; Derksen, J.T.P. Composition and Physical Properties of Oils from New Oilseed Crops. Ind. Crops Prod. 1992, 1, 57–65. [Google Scholar] [CrossRef]
  5. Breemhaar, H.G.; Bouman, A. Harvesting and Cleaning Calendula officinalis, a New Arable Oilseed Crop for Industrial Application. Ind. Crops Prod. 1995, 4, 255–260. [Google Scholar] [CrossRef]
  6. Biermann, U.; Butte, W.; Holtgrefe, R.; Feder, W.; Metzger, J.O. Esters of Calendula Oil and Tung Oil as Reactive Diluents for Alkyd Resins. Eur. J. Lipid Sci. Technol. 2010, 112, 103–109. [Google Scholar] [CrossRef]
  7. Earle, F.R.; Miklojajczak, K.L.; Wolf, I.A. Search for New Industrial Oils: X Seed-Oils of Calendulae. J. Am. Oil Chem. Soc. 1964, 41, 345–347. [Google Scholar] [CrossRef]
  8. Joly, R.; Forcella, F.; Peterson, D.; Eklund, J. Planting Depth for Oilseed Calendula. Ind. Crops Prod. 2013, 42, 133–136. [Google Scholar] [CrossRef]
  9. Martin, R.J.; Deo, B. Effect of Plant Population on Calendula (Calendula officinalis L.). N. Z. J. Crop Hortic. Sci. 2000, 28, 37–44. [Google Scholar] [CrossRef]
  10. Cromack, H.T.H.; Smith, J.M. Calendula officinalis—Production Potential and Crop Agronomy in Southern England. Ind. Crops Prod. 1998, 7, 223–229. [Google Scholar] [CrossRef]
  11. Van Loo, E.N. (Ed.) Biotechnology and Conventional Breeding of Oil Crops for Industrial Use. In Proceedings of the Ctvo-Net: Chemical-Technical Utilization of Vegetable Oils, Bon, Germany, 20–21 June 2000. [Google Scholar]
  12. Zanetti, F.; Monti, A.; Berti, M.T. Challenges and Opportunities for New Industrial Oilseed Crops in Eu-27: A Review. Ind. Crops Prod. 2013, 50, 580–595. [Google Scholar] [CrossRef]
  13. Froment, M.; Mastebroek, D.; van Gorp, K. A Growers Manual for Calendula officinalis L.; Royal CEBECO Group: Rotterdam, The Netherlands; ADAS Bridgets Research Centre: Winchester, UK; Plant Research International: Wageningen, The Netherlands, 2003.
  14. Król, B. Yield and the Chemical Composition of Flower Heads of Pot Marigold (Calendula officinalis L. Cv. Orange King) Depending on Nitrogen Fertilization. Acta Sci. Pol. Hortorum Cultus 2011, 10, 235–243. [Google Scholar]
  15. Rahmani, N.; Daneshian, J.; Farahani, H.A.; Taherkhani, T. Evaluation of Nitrogenous Fertilizer Influence on Oil Variations of Calendula (Calendula officinalis L.) under Drought Stress Conditions. J. Med. Plants Res. 2011, 5, 696–701. [Google Scholar]
  16. Shakib, A.K.; Nejad, A.R.; Khalighi, A. Changes in Seed and Oil Yield of Calendula officinalis L. As Affected by Different Levels of Nitrogen and Plant Density. Res. Crops 2010, 11, 728–732. [Google Scholar]
  17. Moosavi, S.G.; Seghatoleslami, M.; Fazeli, M.; Jouyban, Z.; Ansarinia, E. Effect of Water Deficit Stress and Nitrogen Fertilizer on Flower Yield and Yield Components of Marigold (Calendula officinalis L.). Int. J. Biosci. 2014, 4, 42–49. [Google Scholar]
  18. Robertson, R.G.; Vitousek, P.M. Nitrogen in Agriculture: Balancing the Cost of an Essential Resource. Annu. Rev. Environ. Resour. 2009, 34, 97–125. [Google Scholar] [CrossRef]
  19. McCrackin, M.L.; Harrison, J.A.; Cooter, E.J.; Dennis, R.L.; Compton, J.E. Alternative Futures of Dissolved Inorganic Nitrogen Export from the Mississippi River Basin: Influence of Crop Management, Atmospheric Deposition, and Population Growth. Biogeochemistry 2017, 133, 263–277. [Google Scholar] [CrossRef]
  20. United States Environmental Protection Agency. Mississippi River/Gulf of Mexico Hypoxia Task Force. Available online: https://www.epa.gov/ms-htf (accessed on 2 March 2018).
  21. Moll, R.H.; Kamprath, E.J.; Jackson, W.A. Analysis and Interpretation of Factors Which Contribute to Efficiency of Nitrogen Utilization. Agron. J. 1982, 74, 562–564. [Google Scholar] [CrossRef]
  22. Ciampitti, I.A.; Vyn, T.J. A Comprehensive Study of Plant Density Consequences on Nitrogen Uptake Dynamics of Maize Plants from Vegetative to Reproductive Stages. Field Crops Res. 2011, 121, 2–18. [Google Scholar] [CrossRef]
  23. Woli, K.P.; Boyer, M.J.; Elmore, R.W.; Sawyer, J.E.; Abendroth, L.J.; Barker, D.W. Corn Era Hybrid Response to Nitrogen Fertilization. Agron. J. 2016, 108, 495–508. [Google Scholar] [CrossRef]
  24. USDA-Natural Resources Conservation Service. Soil Organic Carbon Map. Available online: https://www.nrcs.usda.gov/wps/portal/nrcs/detail/soils/use/?cid=nrcs142p2_054018 (accessed on 30 November 2017).
  25. Kottek, M.; Grieser, J.; Beck, C.; Rudolf, B.; Rubel, F. World Map of the Köppen-Geiger Climate Classification Updated. Meteorologische Zeitschrift 2006, 15, 259–263. [Google Scholar] [CrossRef]
  26. Johnson, J.M.F.; Strock, J.S.; Tallaksen, J.E.; Reese, M. Corn Stover Harvest Changes Soil Hydrology and Soil Aggregation. Soil Tillage Res. 2016, 161, 106–115. [Google Scholar] [CrossRef]
  27. United States Department of Agriculture Agricultural Research Service. Weather Data from Swan Lake Research Farm. Available online: https://www.ars.usda.gov/midwest-area/morris-mn/soil-management-research/docs/weather/ (accessed 10 March 2018).
  28. Arguez, A.; Durre, I.; Applequist, S.; Squires, M.; Vose, R.; Yin, X.; Bilotta, R. Noaa‘s U.S. Climate Normals (1981–2010). [Morris West Central Research and Outreach Center MN US, Station Ghcnd:Usc00215638]. NOAA National Centers for Environmental Information, doi:10.7289/V5PN93JP. Available online: https://data.nodc.noaa.gov/cgi-bin/iso?id=gov.noaa.ncdc:C00824 (accessed on 10 March 2018).
  29. Gesch, R.W.; Cermak, S.C.; Isbell, T.A.; Forcella, F. Seed Yield and Oil Content of Cuphea as Affected by Harvest Date. Agron. J. 2005, 97, 817–822. [Google Scholar] [CrossRef]
  30. Johnson, J.M.F.; Gesch, R.W. Calendula and Camelina Response to Nitrogen Fertility. Ind. Crops Prod. 2013, 43, 684–691. [Google Scholar] [CrossRef]
  31. Smucker, A.J.M.; McBurney, S.L.; Srivastava, A.K. Quantitative Separation of Roots from Compacted Soil Profiles by Hydropneumatic Elutriation Systems. Agron. J. 1982, 74, 500–503. [Google Scholar] [CrossRef]
  32. Wagner, S.W.; Hanson, J.D.; Olness, A.; Voorhees, W.B. A Volumetric Inorganic Carbon Analysis System. Soil Sci. Soc. Am. J. 1998, 62, 690–693. [Google Scholar] [CrossRef]
  33. Mulvaney, R. Nitrogen-Inorganic Forms. In Methods of Soil Analysis. Part 3. Chemical Methods; SSSA Book Series No. 5; Bartels, J.M., Ed.; Soil Science Society of America and American Society of Agronomy: Madison, WI, USA, 1996; pp. 1123–1184. [Google Scholar]
  34. Kuo, S. Phosphorus. In Methods of Soil Analysis. Part 3. Chemical Methods; SSSA Book Series No. 5; Bartels, J.M., Ed.; Soil Science Society of America and American Society of Agronomy: Madison, WI, USA, 1996; pp. 869–919. [Google Scholar]
  35. Helmke, P.A.; Sparks, D.L. Lithium, Sodium, Potassium, Rubidium, and Cesium. In Methods of Soil Analysis. Part 3. Chemical Methods; SSSA Book Series No. 5; Bartels, J.M., Ed.; Soil Science Society of America and American Society of Agronomy: Madison, WI, USA, 1996; pp. 551–574. [Google Scholar]
  36. SAS Institute. SAS System for Windows, Release 9.4; SAS Institute: Cary, NC, USA, 2012. [Google Scholar]
  37. Samoon, S.A.; Kirad, K.S. Effect of Nitrogen and Phosphorus on Seed Yield Parameters of Calendula (Calendula officinalis L.) Var. Touch of Red Mixture. Prog. Hortic. 2013, 45, 149–151. [Google Scholar]
  38. Carpenter-Boggs, L.; Pikul, J.L., Jr.; Vigil, M.F.; Riedell, W.E. Soil Nitrogen Mineralization Influenced by Crop Rotation and Nitrogen Fertilization. Soil Sci. Soc. Am. J. 2000, 64, 2038–2045. [Google Scholar] [CrossRef]
  39. Wysocki, D.J.; Chastain, T.G.; Schillinger, W.F.; Guy, S.O.; Karow, R.S. Camelina: Seed Yield Response to Applied Nitrogen and Sulfur. Field Crops Res. 2013, 145, 60–66. [Google Scholar] [CrossRef] [Green Version]
  40. McSwiney, C.P.; Robertson, G.P. Nonlinear Response of N2o Flux to Incremental Fertilizer Addition in a Continuous Maize (Zea mays L.) Cropping System. Glob. Chang. Biol. 2005, 11, 1712–1719. [Google Scholar] [CrossRef]
  41. Intergovernmental Panel on Climate Change. Intergovernmental Panel on Climate Change Wgi, Fourth Assessment Report, Climate Change 2007: The Physical Science Basis, Summary for Policymakers. Available online: http://www.ipcc.ch/pdf/assessment-report/ar4/syr/ar4_syr_spm.pdf (accessed on 18 December 2017).
Figure 1. May–September 2014 (A) and 2015 (B): precipitation (solid vertical bars), daily maximum temperature (black dotted line), daily minimum temperature (solid black line), planting date (gray vertical dashed line), harvest date (gray vertical dotted-dashed line), post-harvest soil sample date (gray vertical dotted line).
Agriculture 08 00040 g001
Figure 2. Calendula seed yield at 0% moisture (A), seed oil concentration (B), and oil yield (C) as a function of N fertilizer rate. Quadratic equations shown were calculated using regression analysis with data from both years (n = 40). Open circles represent 2014 and open squares represent 2015 treatment means with standard error bars (n = 4). Letters at the bottom of each graph denote the significance among N rates.
Agriculture 08 00040 g002
Figure 3. Calendula seed nitrogen (N) use (A), seed N use efficiency (B), oil N use efficiency (C), and agronomic efficiency (D). Quadratic equations shown were calculated using regression analysis with data from both years (n = 40). Open circles represent 2014 and open squares represent 2015 treatment means with standard error bars (n = 4). Letters at the bottom of each graph denote the significance among N rates.
Agriculture 08 00040 g003
Figure 4. Calendula shoot (A) and root (B) tissue N concentration of samples collected in July when plants were transitioning from vegetative to reproductive growth. Quadratic equations shown were calculated using regression analysis with data from both years (n = 40). Open circles represent 2014 and open squares represent 2015 treatment means with standard error bars (n = 4). Letters at the bottom of each graph denote the significance among N rates.
Agriculture 08 00040 g004
Figure 5. Residual soil N (kg N ha−1) at 0–15 (A), 15–30 (B), 30–60 (C), and 0–60 cm (D) profile intervals following calendula harvest in 2014 and 2015. Quadratic equations shown were calculated using regression analysis with data from both years (n = 40). Open circles represent 2014 and open squares represent 2015 treatment means with standard error bars (n = 4). Different letters at the bottom of each graph denote significance among N rates p ≤ 0.05.
Agriculture 08 00040 g005

