Article

Effect of Elemental Sulfur as Fertilizer Ingredient on the Mobilization of Iron from the Iron Pools of a Calcareous Soil Cultivated with Durum Wheat and the Crop’s Iron and Sulfur Nutrition

by
Dimitris L. Bouranis
1,*,
Styliani N. Chorianopoulou
1,
Miltiadis Margetis
1,
Georgios I. Saridis
2 and
Petros P. Sigalas
1
1
Plant Physiology Laboratory, Crop Science Department, Agricultural University of Athens, 75 Iera Odos, 11855 Athens, Greece
2
Botanical Institute, Cologne Biocenter, University of Cologne, D–50674 Cologne, Germany
*
Author to whom correspondence should be addressed.
Agriculture 2018, 8(2), 20; https://doi.org/10.3390/agriculture8020020
Submission received: 28 October 2017 / Revised: 26 January 2018 / Accepted: 29 January 2018 / Published: 1 February 2018
(This article belongs to the Special Issue Plant Nutrient Dynamics in Stressful Environments)

Abstract

:
The granules of conventional fertilizers have been enriched recently with 2% elemental sulfur (S0) via a binding material of organic nature and such fertilizers are suitable for large scale agriculture. In a previous work, we demonstrated that a durum wheat crop that received the enriched fertilization scheme (FBS0-crop) accumulated a higher amount of Fe compared to the durum wheat crop fertilized by the corresponding conventional fertilization scheme (F-crop). In this study, we investigated the effect of S0 on the contingent mobilization of iron from the iron pools of the calcareous field that affiliated the durum wheat crop and the corresponding effect on the crop’s iron nutrition and sulfur nutrition. A sequential extraction of Fe from root zone soil (rhizosoil) was applied and the fluctuations of these fractions during crop development were monitored. The fertilization with FBS0 at sowing affected the iron fractions of the rhizosoil towards iron mobilization, thus providing more iron to the crop, which apart from the iron nutrition fortified the crop’s sulfur nutrition, too. No iron was found as iron attached to carbonates of the rhizosoil. Fluctuations of the iron pool, bound or adsorbed to the organic matter, were exactly the opposite to those of the iron pool associated with the clay particles in both treatments, suggesting iron exchange between the two pools. Replenishment of the F-crop’s Fe content and a deficit in the FBS0-crop’s Fe content in the rhizosoil were found at the end of the cultivation period. Furthermore, the initiation of the fast stem elongation stage (day 125) constituted a turning point. Before day 125, the use of FBS0 increased the iron concentration in the main stems and this was an early fortification effect, followed by an increase in the organic S concentration. Following day 125, the FBS0-crop consisted of plants with higher main stems and less tillers. A late fortification effect was observed in the iron concentration of the main stems and their heads after the stage of complete flowering. Prior to harvesting in the FBS0-crop, all plant parts were heavier, with more iron and organic sulfur accumulated in these plant parts, and the obtained commercial yield of the FBS0-crop was higher by 27.3%.

1. Introduction

Sulfur (S) fertilizers with very different physical and chemical forms, have been developed to alleviate S deficiency, and they are distinguished by two categories: (1) S fertilizers containing sulfate forms, i.e., the directly available S chemical form for plant uptake and (2) S fertilizers containing non-sulfate forms [1]. The S content of the latter is not directly available for plant uptake and requires oxidative conversion to sulfate. Being effective in the rapid alleviation of crop S deficiency, sulfate S fertilizers are widely used [1]. The factors affecting the oxidation of elemental S (S0) in soils have been reviewed [2,3]. From the non-sulfate fertilizers, the ones based on S0 are still a challenge. S0 is an emerging fertilizer product and market, which apart from the S0 itself includes micronized granular S0, nitrogen and/or phosphate fertilizers enhanced/enriched with S0 and S0-coated fertilizers [4].
Recently, S0 has been attached successfully onto the surface of the granules of commercial fertilizers (F) via a binder (B) by Sulphur Hellas S.A., under the commercial name “Sulfogrow” (FBS0) [5] for use in large scale agriculture. The F granules act as a core, effectively covered by an amount of 2% (w/w) of S0 yellow dust. Does such a small amount of S0 contribute to the efficacy of the granules or is it negligible? In a previous work [6] on the nutritional dynamics of a durum wheat (Triticum durum, Poaceae) commercial crop during development, we reported that the FBS0-treated crop presented denser plantation with more robust plants in comparison to the conventional F-treated crop, whilst the accumulated amounts of iron per plant were found to be significantly increased at day 61 after sowing in the above ground crop part, comprising an early effect. After day 100, the accumulated dry mass per plant was twice that of the control and iron accumulation curves per plant were statistically higher than the control ones. It was suggested that the FBS0 product was more effective in comparison to its core fertilizer, as regards the examined parameters, i.e., the dry mass, sulfate, total sulfur, organic nitrogen, and iron concentrations in the above ground plant part, highlighting the fact that higher early mobilization of Fe coincided with a decrease in rhizosoil content of humic substances [6]. Given that the crop was established and developed on a calcareous soil, in which Fe availability is highly restricted due to Fe3+ precipitation and immobilization, the fact that the FBS0-crop’s plants accumulated greater amounts of Fe implies that soil reserves of Fe were of adequate amounts to support the enhanced growth of FBS0-crop’s plants and that they had been mobilized.
In calcareous soils, calcium carbonate buffers soil solution pH in the range 7.5–8.5 [7] and elevated bicarbonate concentration is present in the solution [8]. The solubility of Fe in well aerated soils is controlled by both the Fe oxides [9] and the pH of calcareous soils. The most soluble Fe oxide limits total soluble Fe concentration at around 10−10 M, much lower than that required (10−8 M) for optimal plant growth [10]. In addition, bicarbonate may hinder Fe uptake and its translocation in plants [11]. In calcareous soils Fe not only is little soluble [12,13,14], but usually the concentrations of soluble and exchangeable Fe are much lower than those necessary for adequate plant growth and plants have also developed mechanisms to make other forms of Fe available [13]. Most Fe in soil is in the ferric form. Being a Poaceae species, wheat follows the Strategy II to take up the ferric iron, by the action of phytosiderophores [15].
The aim of this work was to elaborate on the effect of S0 as a fertilizer ingredient on the mobilization of iron from the several iron pools of the calcareous field that affiliated the durum wheat crop. To this end, a fractionation scheme was adopted to distinguish the various fractions of rhizosoil iron, in order to depict the iron dynamics in the rhizosoil of FBS0-treated crop. The allocation of iron among the various pools within the rhizosoil was correlated with the allocation of iron in the main stem, the tillers, and the corresponding heads. Furthermore, given the strong relationship between iron and sulfur metabolisms, iron allocation in the above ground plant parts was studied in relation to the corresponding allocations of sulfate and organic (reduced) sulfur.

2. Materials and Methods

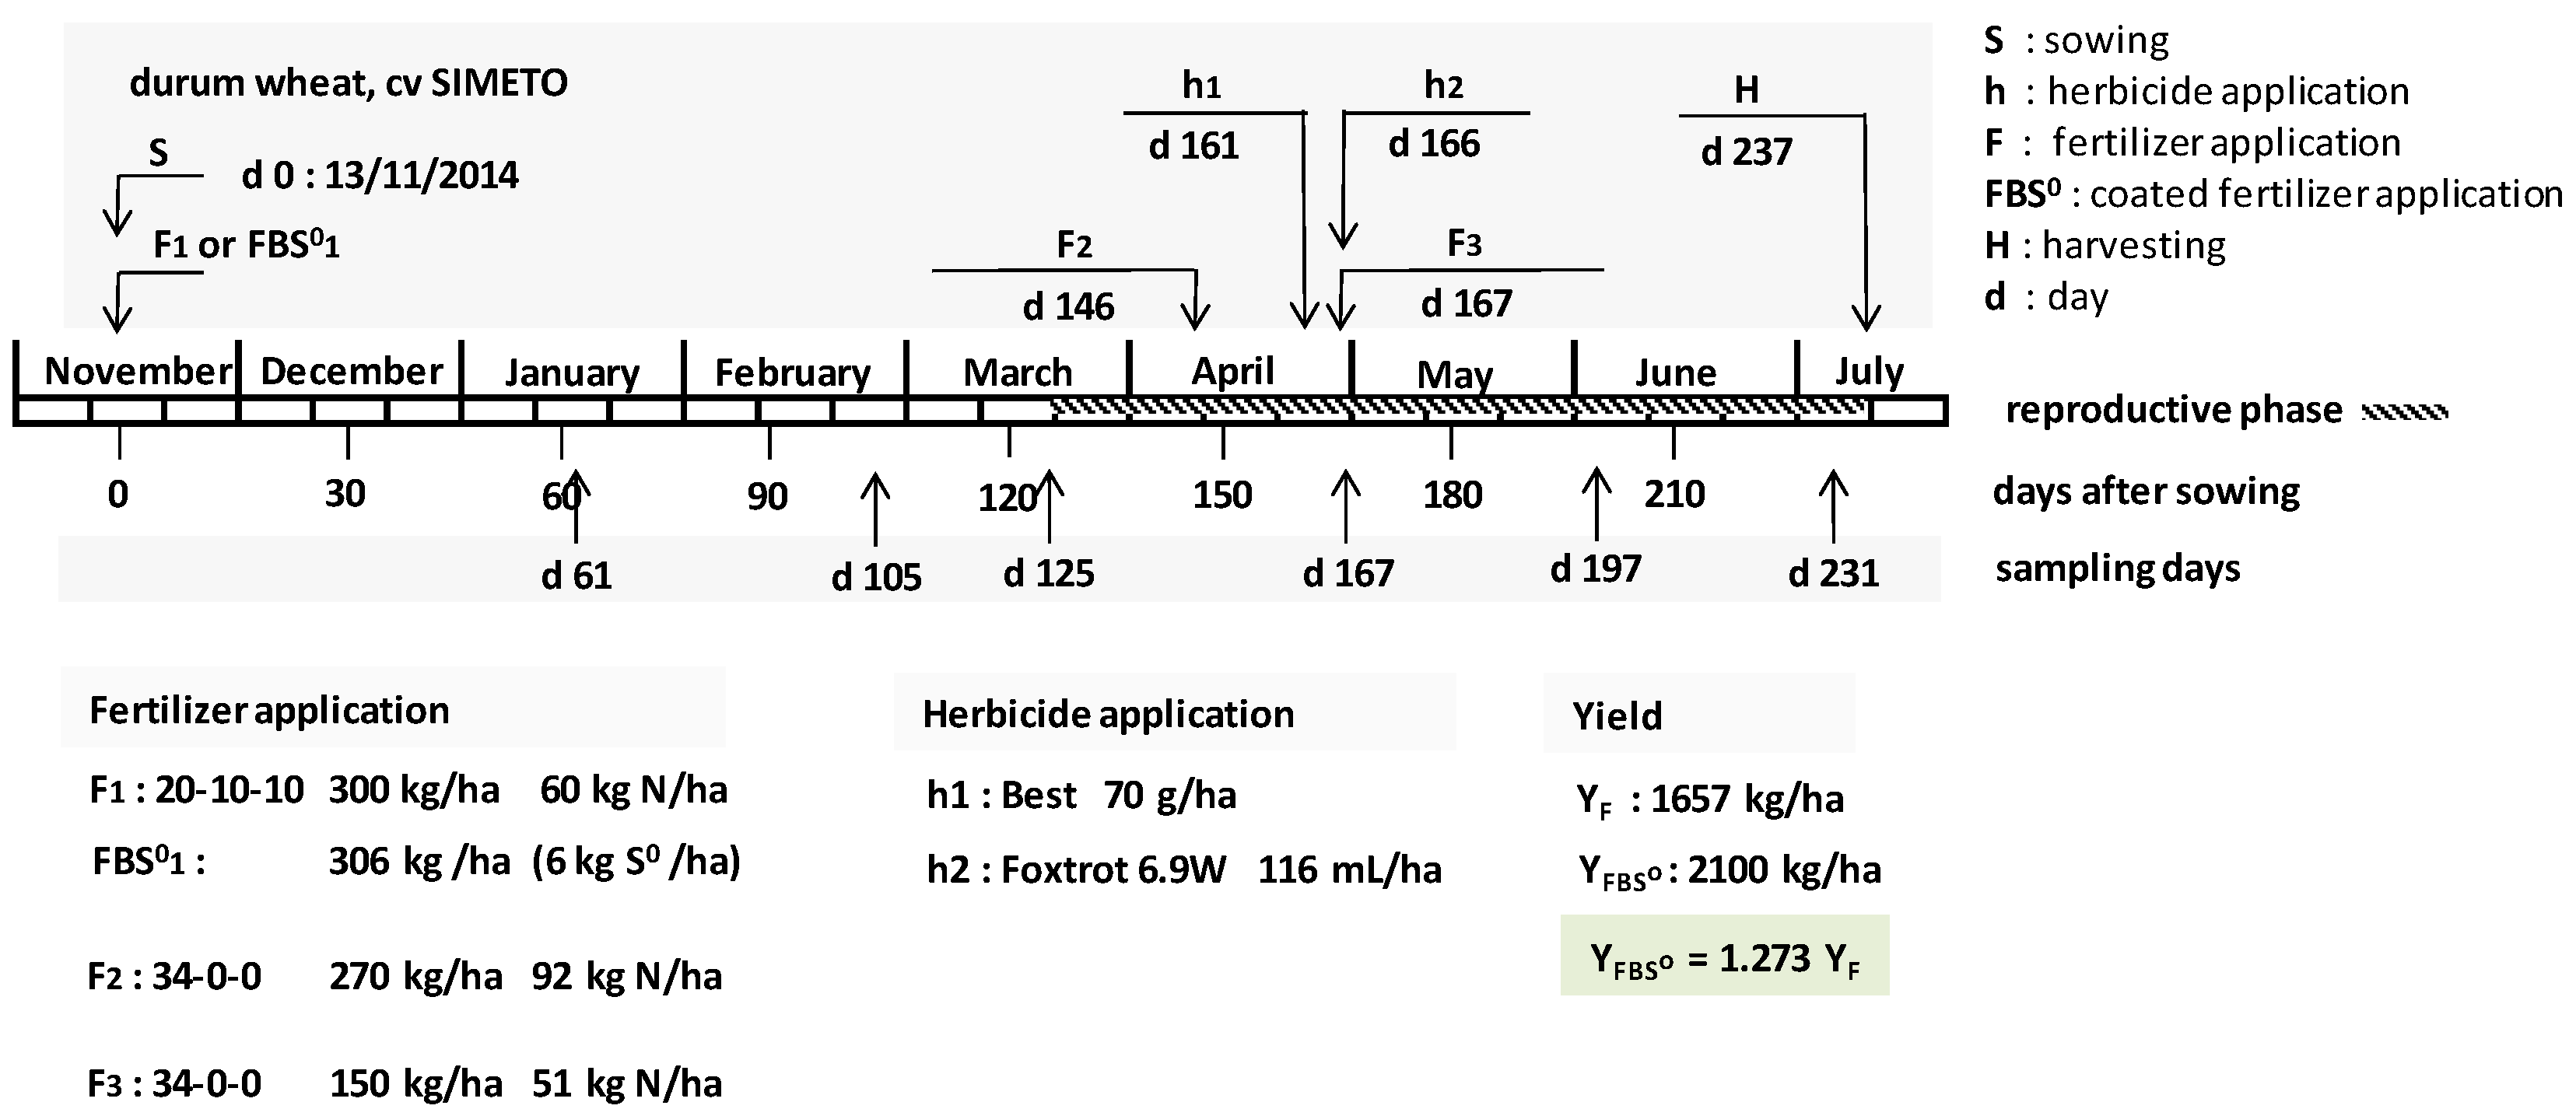
2.1. Experimental Field Trial

A durum wheat (Triticum durum, cv. SIMETO) commercial crop was established in Lefktra (latitude 38.25° N, longitude 23.18° E, 352 m a.s.l.) at Viotia county, central Greece, in a production field of 2.2 ha with calcareous soil. The area was divided into two parts of 1.1 ha each; one of them was subject to conventional F-treatment according to the local agricultural practices (F-crop), whilst the other one received the corresponding FBS0-treatment (FBS0-crop, Figure 1). In order to ensure comparable soil conditions, prior to crop establishment each area was arbitrarily divided into plots 15 m × 7 m (105 m2) each (105 plots in total). All 44 perimetric plots were excluded, whilst the internal 60 plots were grouped into five successive groups of 12 plots each. Within each group of plots, soil quality was tested in a random fashion by analyzing one composite sample per plot collected at the depth of ca 20 cm, until a set of (5 + 5) plots with comparable quality was secured, one plot within each group (Table 1). Then, for each of these plots, two more composite soil samples per plot were collected and analyzed. At each sampling day, sampling took place from the same plots.
Sowing day and fertilizer application took place in 13 November 2014 (day 0). The control crop was fertilized with a commercial 20-10-10 fertilizer (nitrogen was provided as ammonium sulfate, phosphorus as triple superphosphate, whilst potassium was provided as potassium sulfate) at a rate of 300 kg ha−1. The FBS0-treated crop received the equivalent fertilization with the corresponding “Sulfogrow” 20-10-10 commercial fertilizer at the same rate, carrying 2% S0 (306 kg ha−1). At days 146 and 167 after sowing, additional fertilizations with commercial ammonium nitrate fertilizer took place at the rates of 270 and 150 kg ha−1, respectively. At days 161 and 166 after sowing, herbicide applications took place at the rates of 70 g ha−1 (Best) and 1.1 L ha−1 (Foxtrot 6.9W), respectively. Both crops received no irrigation. For the determination of morphometric characteristics, 20 plants per plot were used. For the chemical analyses, at least five plants per plot were collected with their root system and the surrounding soil by means of a shovel. The excess of soil was removed by hand and the soil within the root system mass, i.e., the rhizosoil (RS), was collected. The above ground plant part was separated into the main stem, the accompanying tillers, and the corresponding heads, and the fluctuation dynamics of iron, sulfate and organic sulfur were monitored in each plant part during the crops’ development.

2.2. The Nature of the FBS0 Fertilizer Granules

According to the patent [5], the fertilizer granules are mixed initially with elemental sulfur in the form of dust at a percentage of 2% to 4% (w/w, S0: fertilizer’s granules). The mixture passes through a shower of fine droplets consisting of a 1:1 mixture of molasses and glycerol, which acts as the binding system, in such a way that the whole surface is exposed. The binder is added at a percentage of 0.4% to 1.2% (w/w, binder: fertilizer granules). Then, the mixture is led to a mixer, where the sticky S0 dust is evenly attached onto the sticky fertilizer granules, thus forming the final product FBS0.

2.3. Determinations of Soil Parameters

Determinations of pH, organic matter, CaCO3, NO3, P-Olsen, exchangeable potassium, Mn-DTPA (DTPA: diethylenetriaminepentaacetic acid), Cu-DTPA, Zn-DTPA, and humic substances content in the rhizosoil were performed according to the procedures described by Jones (1999) [16].

2.4. Preparation of Dry Mass Digests

Samples of the separated plant parts (main stems, tillers, heads) were oven-dried at 80 °C and ground to pass a 40-mesh screen using an analytical mill (IKA, model A10). Prior to iron analysis, samples were digested with hot H2SO4 and repeated additions of 30% H2O2 until the digestion was complete [17].

2.5. Rhizosoil Fractionation Scheme

Rhizosoil samples were fractionated with the modified version of the BCR-three step sequential extraction procedure, as described by Pueyo et al. (2008) [18].
Exchangeable and weak acid soluble fraction (1st fractionation step; 1st fraction): 1 g soil sample was extracted with 40 mL of 0.11 mol L−1 acetic acid solution by shaking in a mechanical, end-over-end shaker at 30 rpm at room temperature (20 °C) for 16 h. The extract was separated by centrifugation at 3000 rpm for 20 min, collected in polyethylene bottles and stored at 4 °C until analysis. The residue was washed by shaking for 15 min with 20 mL of doubly distilled water and then centrifuged, discarding the supernatant.
Reducible fraction (2nd fractionation step; 2nd fraction): 40 mL of 0.5 mol L−1 hydroxylammonium chloride solution was added to the residue from the 1st step, and the mixture was shaken at 3000 rpm at 22 °C for 16 h. The acidification of this reagent was by the addition of a 2.5% (v/v) HNO3 solution (prepared by weighing from a suitable concentrated solution). The extract was separated and the residue was washed as in the first step.
Oxidizable fraction (3rd fractionation step; 3rd fraction): 10 mL of 8.8 mol L−1 hydrogen peroxide solution was carefully added to the residue from the 2nd step. The mixture was digested for 1 h at 22 °C and for 1 h at 85 °C, and the volume was reduced to less than 3 mL. A second aliquot of 10 mL of H2O2 was added, the mixture was digested for 1 h at 85 °C, and the volume was reduced to about 1 mL. The residue was extracted with 50 mL of 1 mol L−1 ammonium acetate solution, adjusted to pH 2.0, at 3000 rpm and 22 °C for 16 h. The extract was separated and the residue was washed as in previous steps.
Residual fraction (4th fractionation step; 4th fraction): the residue from the 3rd step was digested with aqua regia. In this case, the amount of acid used to attack 1 g of sample was reduced to keep the same volume/mass ratio: 7.0 mL of HCl (37%) and 2.3 mL of HNO3 (70%) were added.
In the diluted dry mass (DM) digests or rhizosoil fraction extracts, Fe was determined by atomic absorption spectrophotometry (GBC, Model Avanta spectrophotometer, GBC Scientific Equipment PTY LTD, Dandenong, Victoria, Australia) [17].

2.6. Sulfate and Total Sulfur Determination in the DM of the Plant Parts

Sulfate concentration was determined by extracting the oven-dried samples with 2% (v/v) acetic acid aqueous solution and by analyzing by a turbidimetric method [19,20]. Total sulfur content was determined after dry ashing at 600 °C [21]. The ash was dissolved in 2% (v/v) acetic acid aqueous solution, filtered through Whatman No. 42 paper, and total sulfate was determined turbidimetrically [19,20]. The content of the organic sulfur (Sorg) was calculated by subtracting the total sulfate content from that of the total sulfur.

2.7. Statistical Analysis

The comparisons between the corresponding FBS0-crop and F-crop values in each case were submitted to t-test variance analysis with two-tailed distribution and two-sample equal variance, at p ≤ 5%. Where the differences between means of FBS0-crop and F-crop samples were statistically significant, the percentage of the relative change is provided in the text.

3. Results

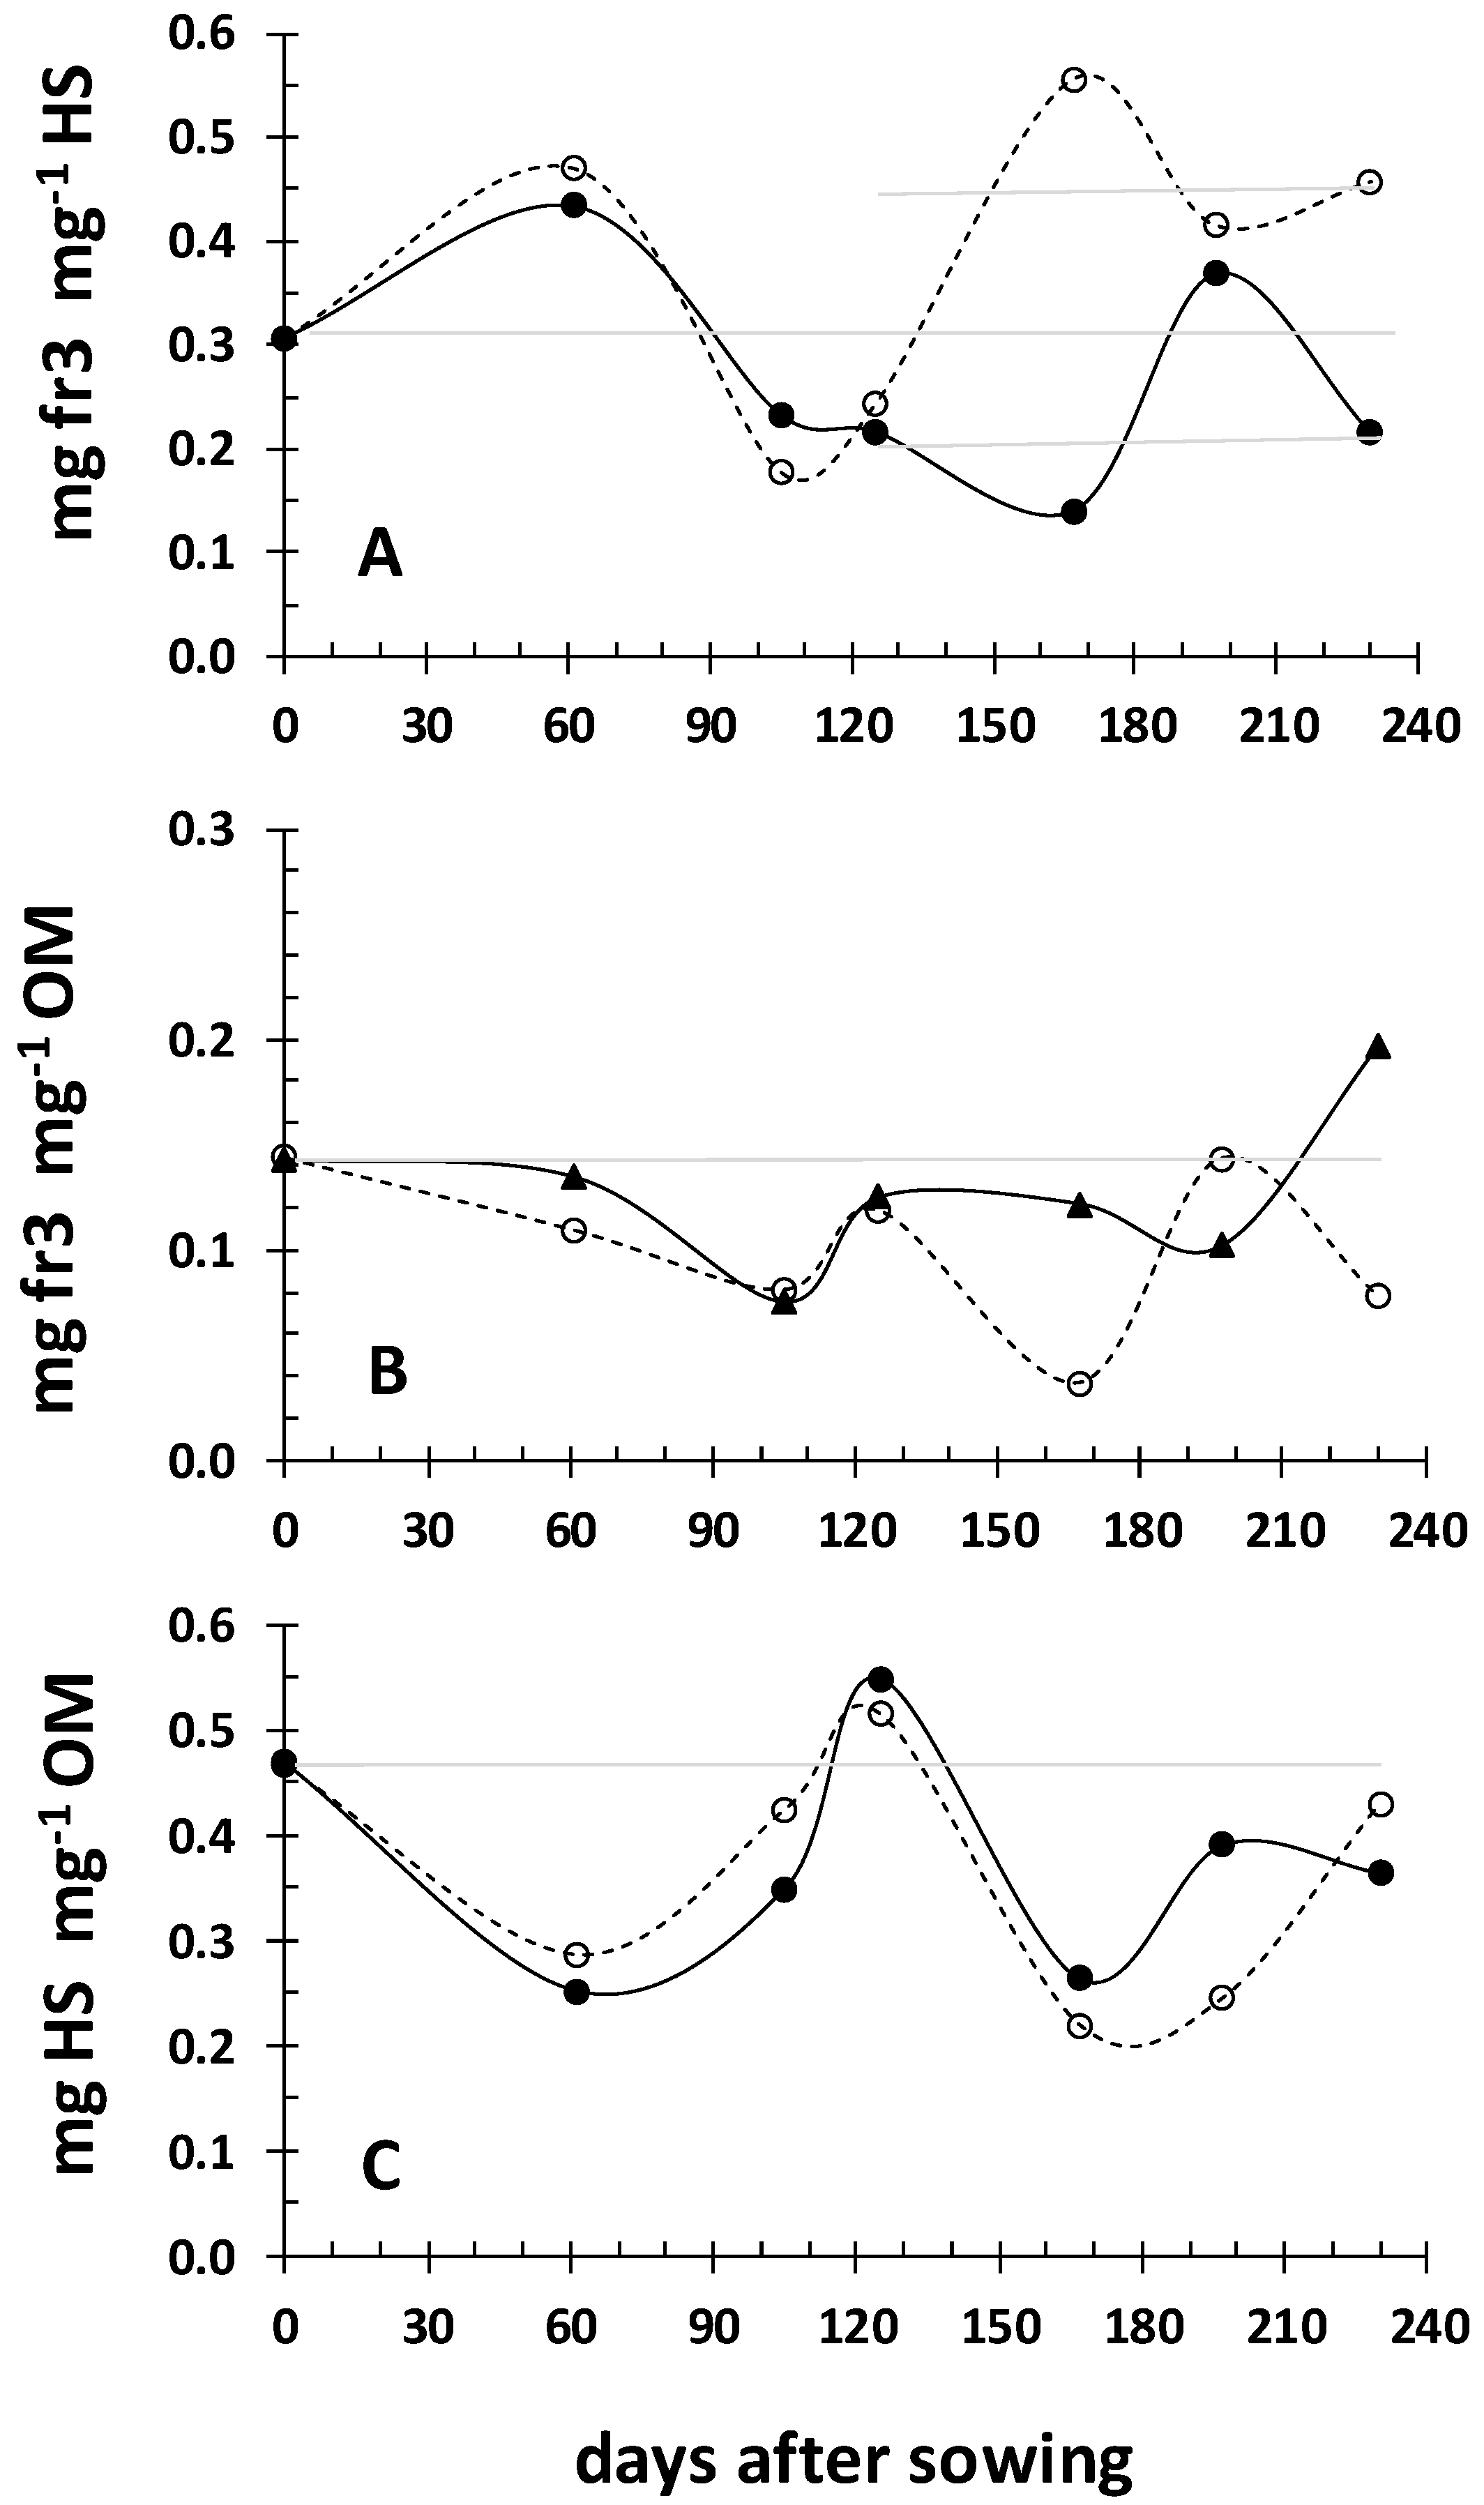
3.1. Dynamics of the Iron Fractions in Rhizosoil during the Crops’ Development

No iron was found as iron attached to carbonates of the rhizosoil (i.e., the exchangeable and weak acid soluble fraction; fr1) throughout the experiment. At sowing, the total extracted iron from the rhizosoil amounted to 8.3 mg g−1 RS, allocated by 11% as iron adsorbed on iron-manganese oxides (i.e., the reducible fraction; fr2), 16% as iron bound or adsorbed to the organic matter of RS (i.e., the oxidizable fraction; fr3), and 73% as iron associated with the clay particles (i.e., the residual fraction; fr4). In the F-crop the total extracted Fe started to lower at day 61, presented the lowest value at day 125 and then increased progressively, reaching the initial value at the end of the cultivation period. In the FBS0-crop, the lowest value appeared already on day 61 and then it increased and stabilized at a value of 6 mg g−1 RS, i.e., 72.3% of the initial, after day 105 onward (Figure 2A). Analyzing the percentage contribution of each fraction to the total extracted iron a different profile appeared in each treatment. In the F-crop (Figure 2B) the fluctuations of fr3 were the opposite of those of fr4. More specifically, fr4 decreased between days 105–167, then it increased till the end of the cultivation, whilst fr3 followed exactly the opposite course. The contribution of fr2 was a minor one and it could be considered as rather stable. In the FBS0-crop (Figure 2C), the percentage contributions of fr4 and fr3 fluctuated in an exactly opposite fashion, and the fluctuation pattern was different from that of the F-crop. In fact it appears that the percentage contributions of both Fe fractions oscillated around the initial values of 73% and 16% respectively. Again the contribution of fr2 was a minor one, it was at the same percentage (ca. 12%) of that of the F-crop and could be considered as stable, too. Regardless of the pattern, fluctuations of fr3 were exactly the opposite of those of fr4 in both treatments, suggesting iron exchange between the pool of iron bound or adsorbed to the organic matter and the pool of iron associated with the clay particles. Analyzing the fractions dynamics it seems that day125 was a turning point in the various fluctuation patterns.
Was there a role of humic substances (HS) in the fluctuations of fr3? The third fraction contains iron that is closely related to OM and HS are a functional component of the rhizosoil’s OM. The overall picture of the HS content’s fluctuation of the rhizosoil revealed an oscillation around the value of 4.4 mg HS g−1 RS [6]. The incorporated S0 did not affect the oscillation pattern. However, up to day 125 there was a tendency for lower HS content, and a tendency for higher HS content afterwards [6]. The fr3-to-HS ratio presented the same fluctuation pattern around 0.3 mg fr3 per mg HS up to day 125, and it differentiated thereafter (Figure 3A). In the FBS0-crop it followed the oscillation pattern of the HS content in the rhizosoil around the value of 0.5 mg fr3 per mg HS, whilst in the F-crop it followed the pattern exactly in reverse around the value of 0.2 mg fr3 per mg HS. Analyzing the patterns in relation to organic matter dynamics (Figure 3B,C), again day 125 was a turning point. Before day 125, in the FBS0-crop there was a tendency for less HS and more Fe per unit mass of organic matter, which reversed thereafter. In relation to the initial conditions, at the end of the crop: (i) The HS content per unit of RS was that of the initial one. (ii) The fr3:HS mass ratio increased (+48%) in the F-crop, whilst it decreased (−29%) in the FBS0-crop. (iii) The HS:OM mass ratio decreased in both the F-crop (−8.5%) and the FBS0-crop (−23%). (iv) The fr3:OM mass ratio increased (+43%) in the F-crop and decreased (−43%) in the FBS0-crop.

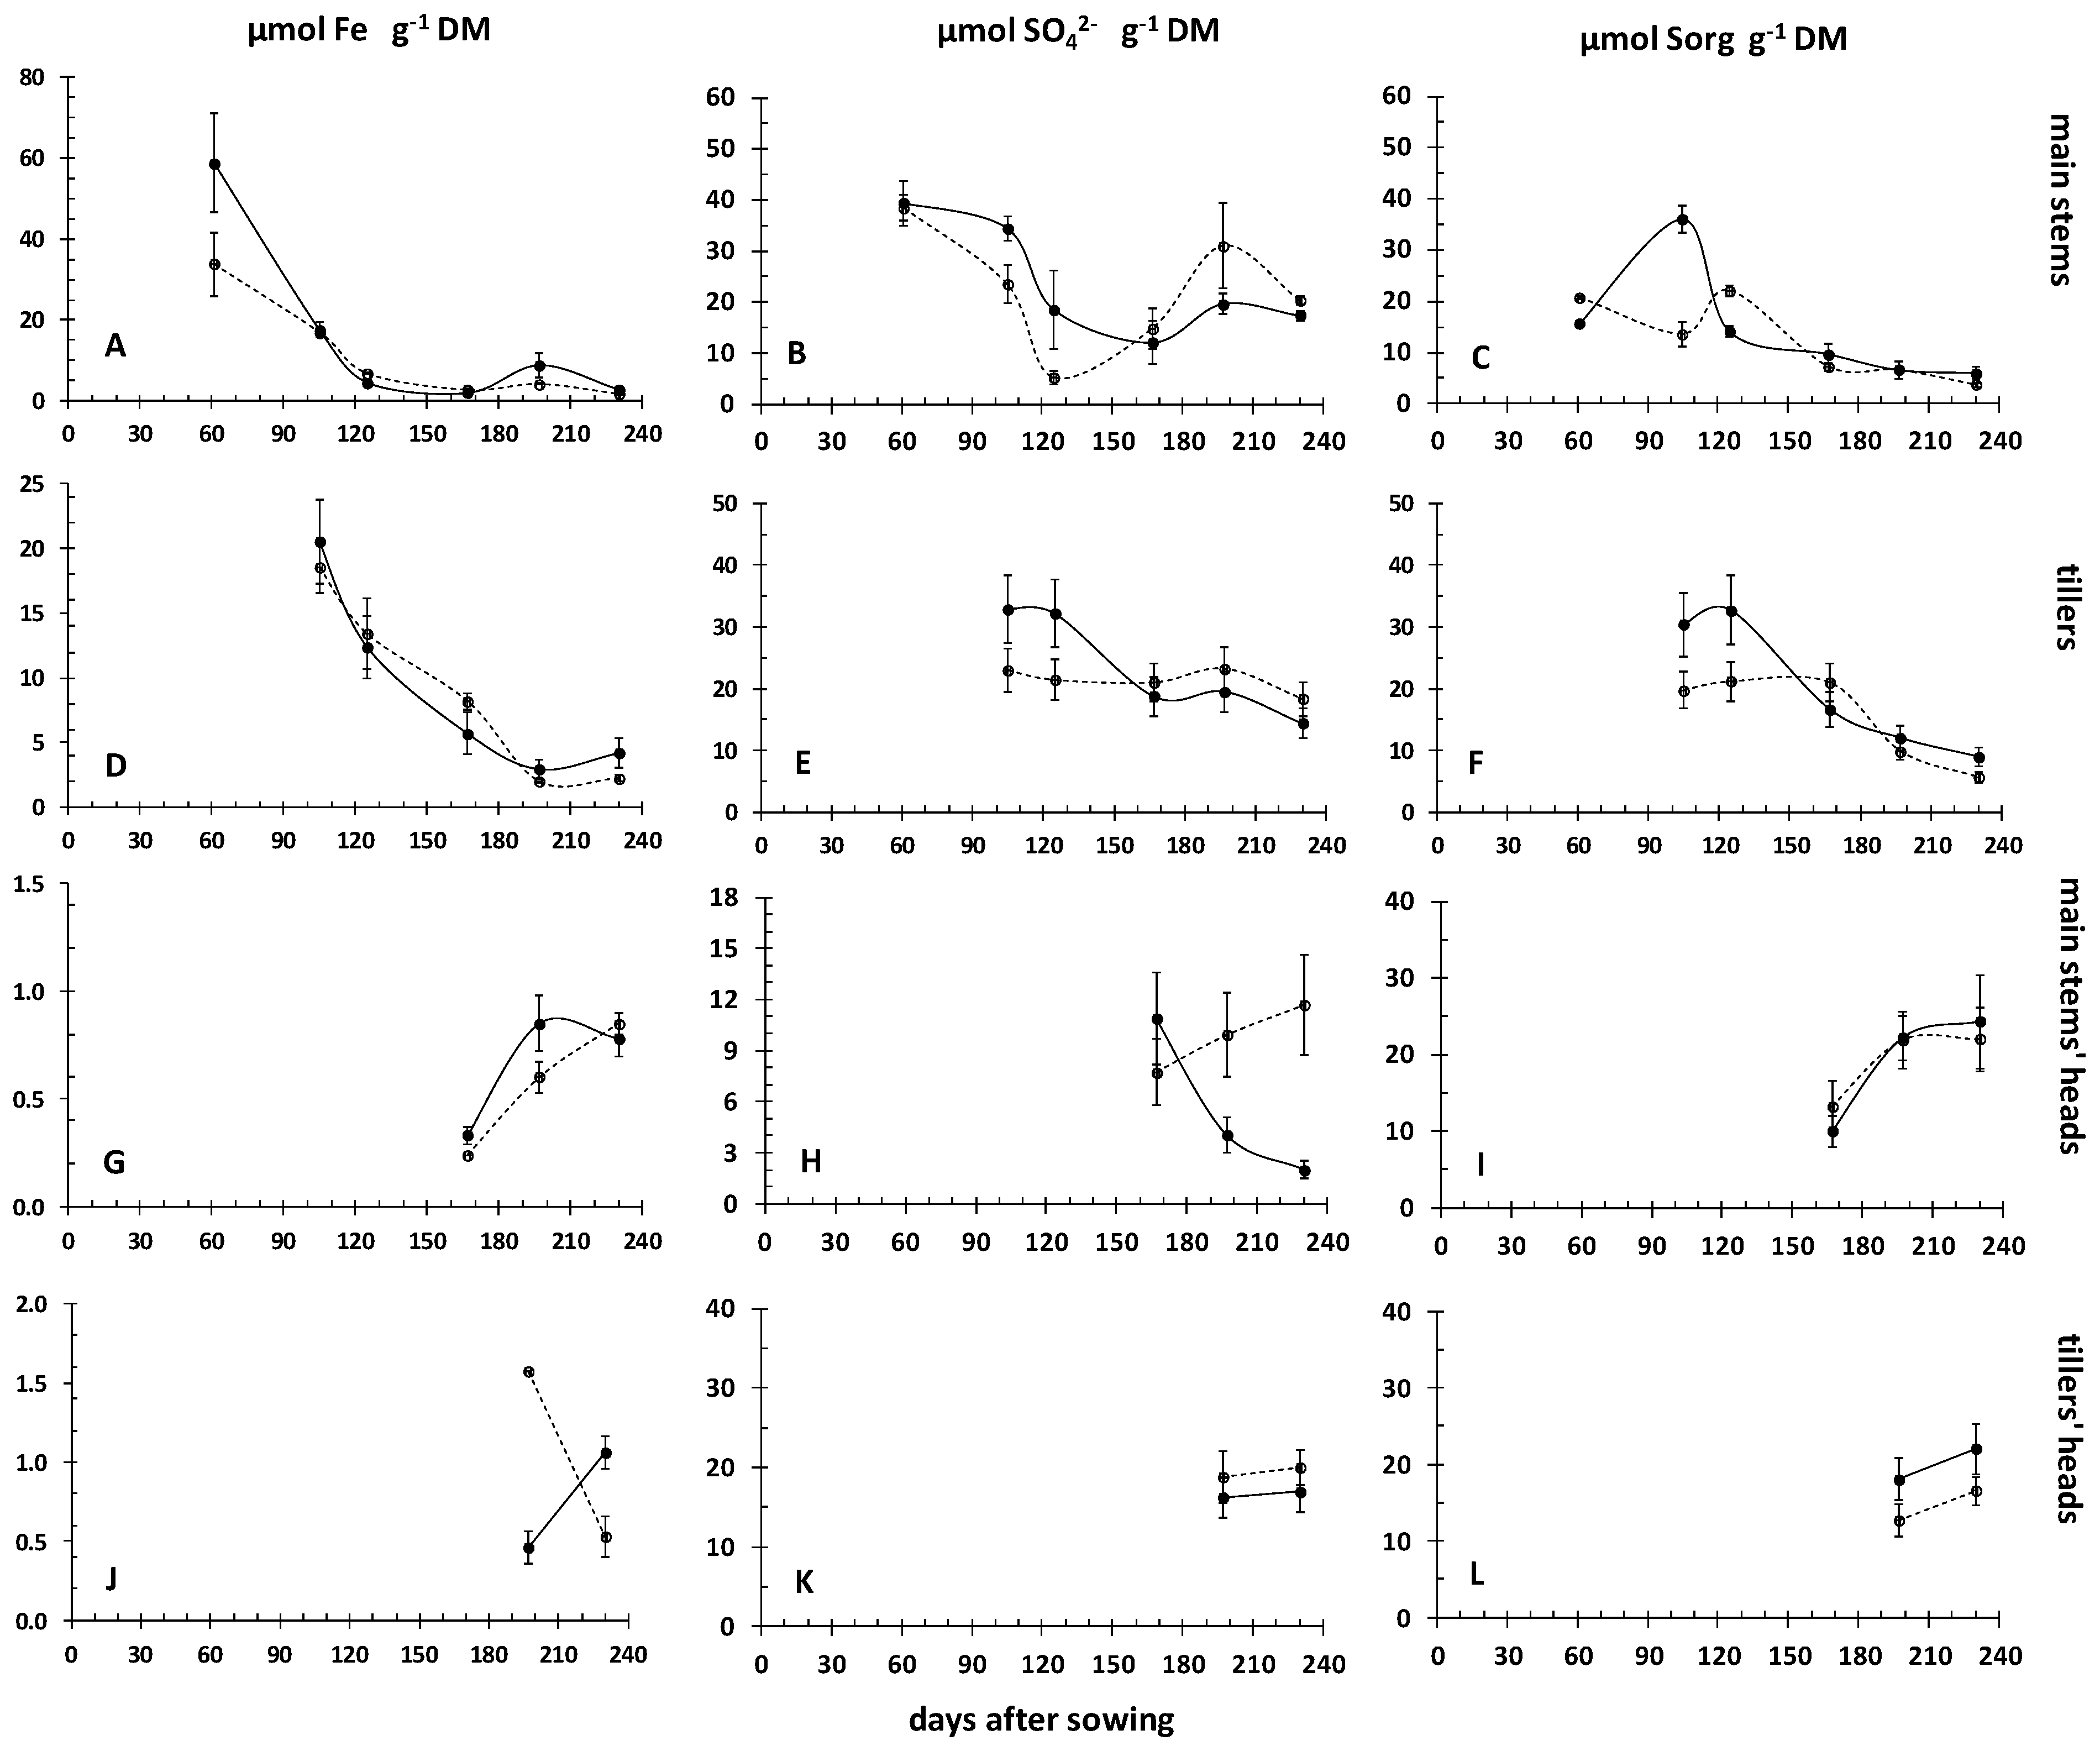
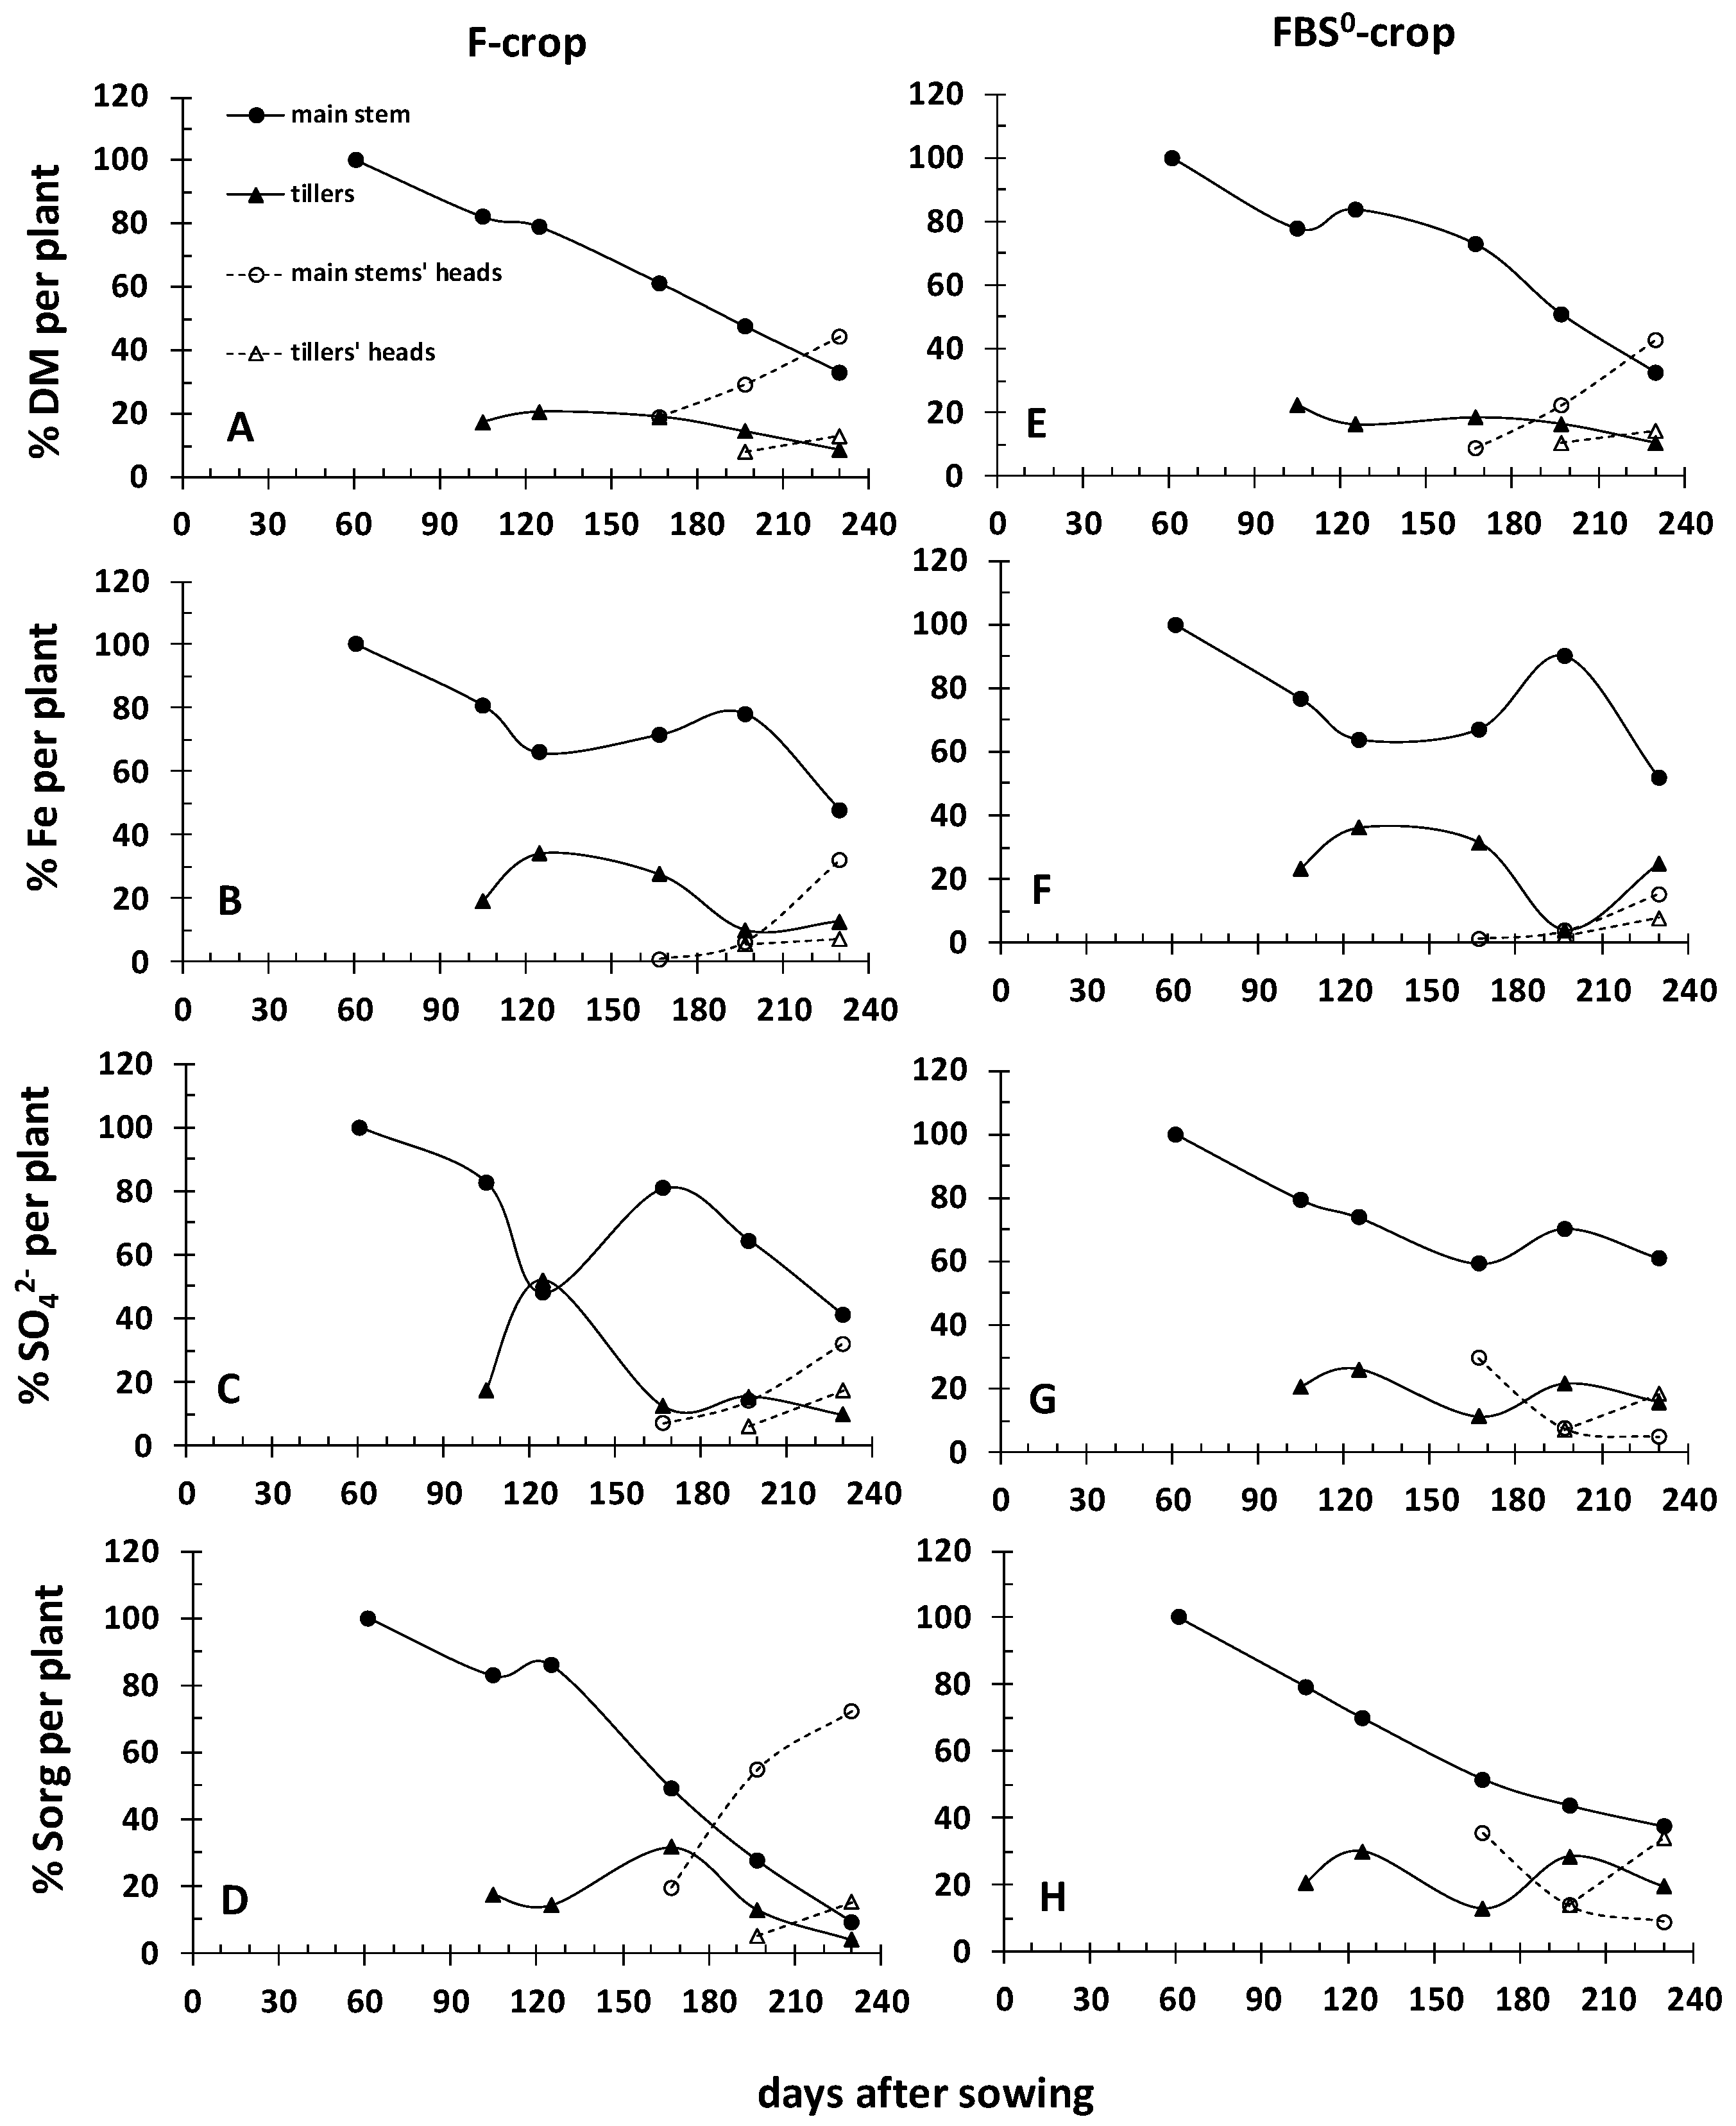
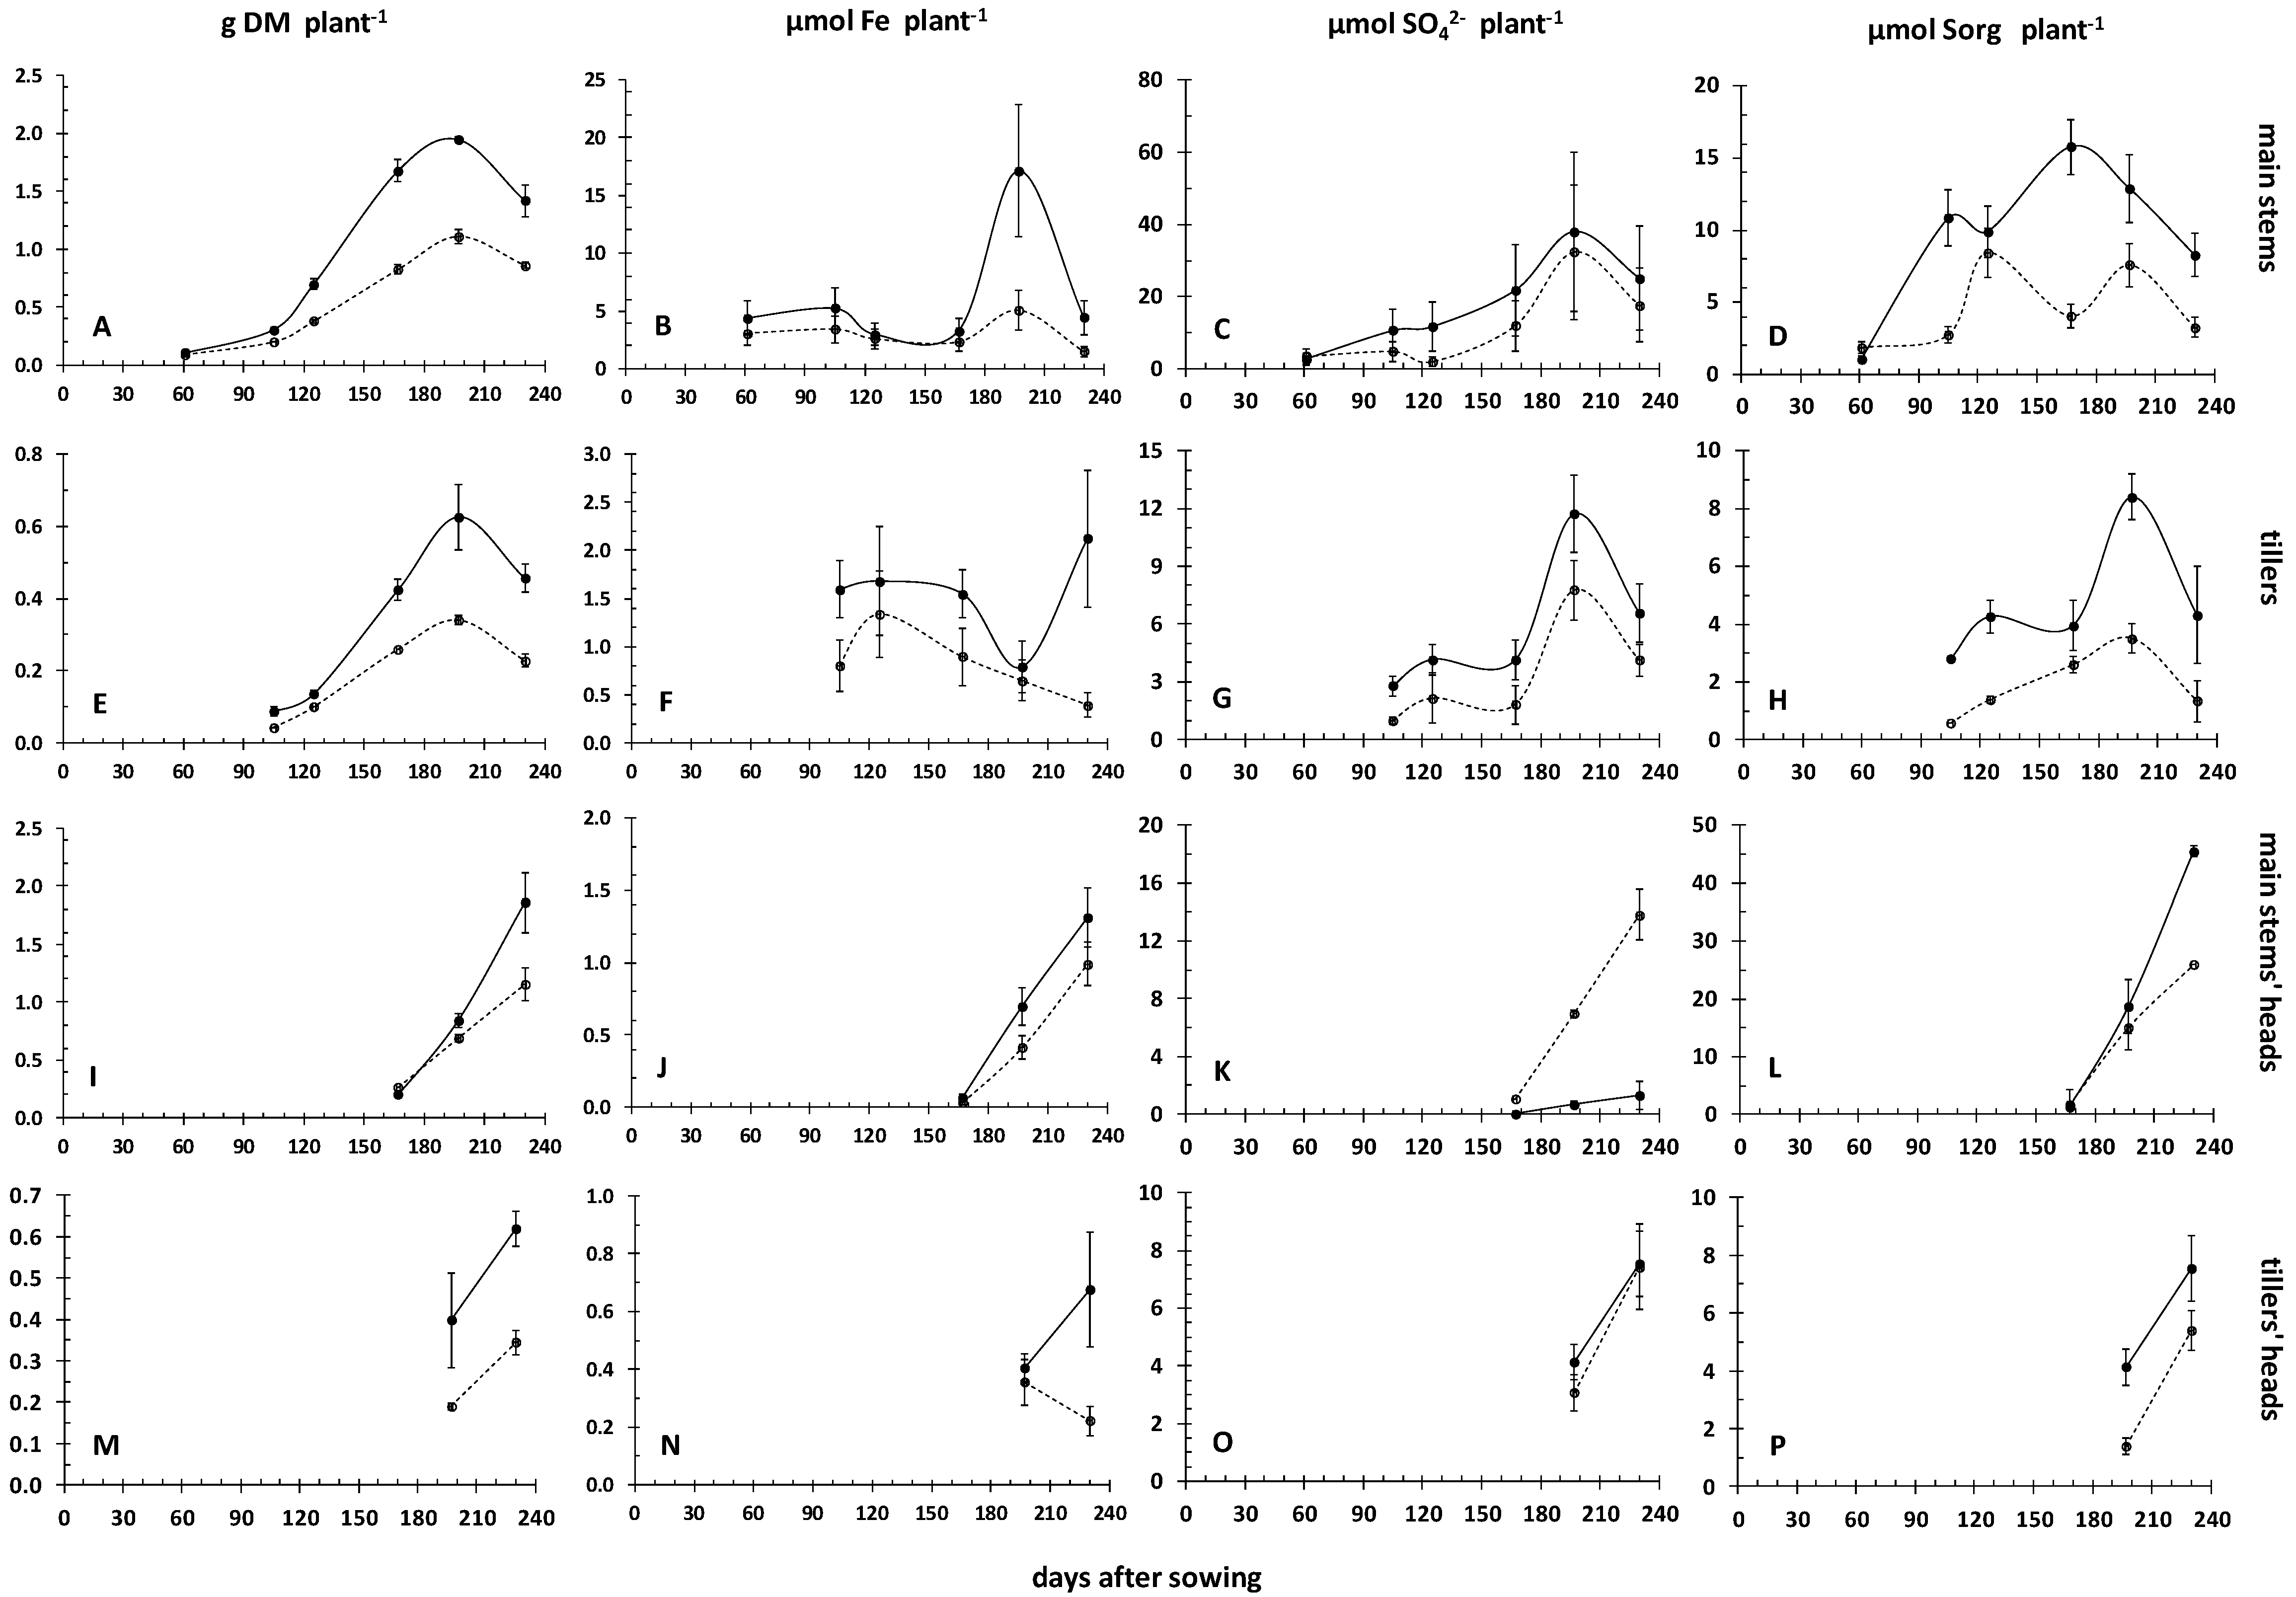
3.2. Dynamics of Iron and Sulfur Nutrition in the Crop’s above Ground Plant Parts during the Crops’ Development, in Relation to the Dynamics of Rhizosoil Iron Pools

At the initiation of the tillering stage (day 61) both crops presented the highest Fe concentration in the DM of the main stems. In the FBS0-crop in relation to F-crop, iron concentration was 3300 ppm, i.e., higher by 74% (Figure 4A), which resulted in higher accumulation of Fe in the above ground part (+42%, Figure 5B), because, in addition, dry mass per plant was higher (+18%, Figure 5A). Both sulfate concentration and accumulation remained unchanged (Figure 4B and Figure 5C). Organic sulfur concentration was lower (−24%, Figure 4C) and its accumulation lower (−37%, Figure 5D), too. Total extracted Fe from the rhizosoil presented its lowest value (54.5% of the initial iron content at sowing, Figure 2D). All fractions contributed to this loss by 16% (fr2), 28% (fr3), and 54% (fr4) (Figure 2C).
At the initiation of the main stem elongation (day 105), the plants of both crops carried seven leaves in the main stems and five leaves in the tillers. Iron concentration of the main stem (Figure 4A) was found significantly reduced in both treatments in such a way that iron accumulation was the same with that of day 61, indicating a dilution effect. Tillers carried the same iron concentration with the main stem (Figure 4D). In both crops the total extracted iron from the rhizosoil was 78% of that at sowing (Figure 2A). In the F-crop, 32% of the plants carried no tillers, i.e., there were main stems only, whilst 5% of them carried three or more tillers (Table 2). In the FBS0-crop, 44% of the plants carried no tillers and 16% 3+ tillers. Plants accumulated more dry mass in the main stems (+51.9%, Figure 5A) and in the tillers (+102.3%, Figure 5E). Relative to day 61, the total extracted iron from the rhizosoil increased (Figure 2A). The increase was due to increase of fr4 (+73%, Figure 2D), whilst fr3 remained unchanged (Figure 2E) and fr2 decreased further (−37%, Figure 2F). Sulfate concentration was higher in both the main stem (+42%, Figure 4B) and the tillers (+39%, Figure 4E), with a corresponding increase in sulfate accumulation per plant in both the main stem (+120%, Figure 5C) and the tillers (+180%, Figure 5G). Organic S concentration was higher in both the main stem (+157%, Figure 4C) and the tillers (+50%, Figure 4F). The same held true for organic S accumulation per plant in both the main stem (+66.7%, Figure 5D) and the tillers (+367%, Figure 5H).
At the stage of entering fast stem elongation (day 125), the plants of both crops carried eight leaves in the main stems and six leaves in the tillers. In the F-crop, 60% of the plants carried no tillers, and 7% three or more tillers. Between days 105 and 125 the main stem’s length increased at a rate of 0.18 cm per day. Per plant, dry mass was allocated by 18% in the tillers (Figure 6A). In the FBS0-crop, 50% of the plant carried no tillers, and 10% 3+ tillers. Between days 105 and 125 the main stem’s length increased with a rate of 0.31 cm per day which resulted in higher main stems (+34.5%). Per plant, dry mass was allocated by 22% in the tillers (Figure 6B). In relation to F-crop, plants were characterized by higher accumulation of dry mass in the main stems (+84.7%, Figure 5A) and in the tillers (+35.6%, Figure 5E). Iron concentration was less (−33.5%, Figure 4A) in the main stem and the same in the tillers (Figure 4D), which resulted in a decrease in accumulated iron per main stem (Figure 5B) due to further dilution and in no change in the accumulated iron per tiller (Figure 5F). Sulfate concentration was higher in both the main stem (+270%, Figure 4B) and the tillers (+45%, Figure 4E), which resulted in higher sulfate accumulation, too (+500%, Figure 5C; +50%, Figure 5G, respectively). Fr2 presented its lowest value (Figure 2F) and the other two fractions minor changes.
At the stage of the complete emergence of head on the main stem (day 167), the plants of both crops carried eleven leaves and heads in the main stems. Stem elongation started to retard, whilst the boot was just visibly swollen in the tillers. Prior to this stage and between days 146 and 167 two topdressing and two herbicide applications took place. Between days 125 and 167, in the F-crop the lengths of the main stems increased with a rate of 0.61 cm per day. Of the plants 63% carried no tillers, and 3% three or more tillers. Tillers were carrying nine or ten leaves. In the FBS0-crop the main stems lengths increased with a rate of 0.65 cm per day, which resulted in statistically higher main stems (+16.3%). Tillers were carrying five or six leaves. The 82% of the plants carried no tillers, and 2% three or more tillers. Plants had accumulated more dry mass in the main stems (+103.2%, Figure 5A), in the tillers (+63.1%, Figure 5E), and in the main stems’ heads (+36.7%, Figure 5I). In the tillers, iron concentration decreased to half (Figure 4D) relative to day 125 and it was less by 30.6% relative to F-crop. These changes kept the accumulated amount of iron higher in both the main stems (+41.2%, Figure 5B) and the tillers (+73.4%, Figure 5F). In the heads of the main stems, iron concentration was higher (+37.5%, Figure 4G), which resulted in more accumulated iron per head (+121.4%, Figure 5J). Fr4 was at the same concentration compared with day 125 (Figure 2D), fr3 presented its lowest value (Figure 2E), whilst fr2 kept increasing (Figure 2F) at the same rate as in F-crop. Sulfate concentration continued to lower in both the main stem (Figure 4B) and the tillers (Figure 4E), which resulted in statistically the same amount per plant in the main stem (Figure 5C) but higher in the tillers (Figure 5F). Organic S concentrations decreased in both the main stems (Figure 4C) and the tillers (Figure 4F), whilst organic S accumulation presented its highest value in the main stem (Figure 5D) and remained stable in the tillers (Figure 5H).
At the stage of complete flowering and the initiation of milk development (day 197), the plants carried 11 leaves and heads in the main stems of both crops, stem elongation ceased, and the tillers carried heads in both crops. In the F-crop, 57% of the plants carried no tillers, and 2% three or more tillers. In the FBS0-crop, 85% of the plants carried no tillers, and 1% three or more tillers. Main stems were higher by 17.4%. Plants presented more accumulated dry mass in the main stems (+75.2%, Figure 5A), in the tillers (+83.9%, Figure 5E), in the main stems’ heads (+22.4%, Figure 5I), and in the tillers’ heads (+109.1%, Figure 5M). The accumulated DM reached its peak in both the main stem and the tillers. In the FBS0-crop, iron concentration was higher in main stems (+111.3%, Figure 4A) and their heads (+41.7%, Figure 4G), as well as in the tillers (+9%, Figure 4D), and less in the tillers’ heads (−70.7%, Figure 4J). This resulted in a strong accumulation of iron in the main stem (+238%, Figure 5B), and in their heads (+70%, Figure 5J). However, in the tillers a strong dilution effect took place (Figure 5F), whilst in the tillers’ heads no change was observed (Figure 5N). Fr3 was twice that of day 167 (Figure 2E), whilst fr2 increased (Figure 2F), too. Sulfate concentrations were higher in the main stems (+63%, Figure 4B), and lower in the tillers (−17.4%, Figure 4E), the main stems’ heads (−59%, Figure 4H) and the tillers’ heads (−15.8%, Figure 4K), which translated into the same accumulations of sulfate in the main stems (Figure 5C) and the tillers’ heads (Figure 5O), higher accumulation in the tillers (+50%, Figure 5G), and a lower one in the main stems’ heads (−900%, Figure 5K). As regards the concentrations of organic sulfur, they were the same in the main stem (Figure 4C), the tillers (Figure 4F), and the main stem’s heads (Figure 4I), but higher in the tillers’ heads (+50%, Figure 4L). The corresponding accumulations were higher in the main stems (+71.1%, Figure 5D), the tillers (+140%, Figure 5H), and the tillers’ heads (+185.7%, Figure 5P), whilst the same in the main stem’s heads (Figure 5L).
At the stage of dough development (day 231), the accumulated DM decreased in both the main stem (Figure 5A) and the tillers (Figure 5E) of both crops due to loss of lower leaves. In contrast, heads still accumulated DM in both the main stems (Figure 5I) and the tillers (Figure 5M) of both crops. In the FBS0-treated crop the same pattern was observed: plants with more accumulated dry mass in the main stems (+64.5%), in the tillers (+100.1%), in the main stems’ heads (+61.4%), and in the tillers’ heads (+80.1%). In the FBS0-crop, relative to day 197 the iron concentration of the main stems decreased (Figure 4A), it was stabilized in the tillers (Figure 4D) and the main stems’ heads (Figure 4G), whilst it increased in the tillers’ heads (Figure 4J). As regards iron accumulation it decreased in the main stems (Figure 5B) and increased in the tillers (Figure 5F), tillers’ heads (Figure 5N) and main stems’ heads (Figure 5J). Sulfate and organic S concentrations did not change (Figure 4), with the exception of sulfate concentration in the main stem’s heads (−82.9%, Figure 4H).

3.3. FBS0 Fortified the Crop’s Iron and Sulfur Nutrition and Increased the Yield

The used durum wheat cultivar created up to three tillers; plants with four or more tillers were less than 1%. After day 167, in the F-crop the ratio of plants with main stems only stabilized to 60% (Table 2), whilst the rest of the plants with one or two tillers shared the same percentage contribution (20%). In the FBS0-crop the ratio of plants with main stems only stabilized to 85%, whilst the rest of the plants carried only one tiller stabilized to 13%. FBS0 decreased the tillers’ production.
Moreover, the aforementioned dynamics clearly show that the corresponding fluctuations of the rhizosoil’s iron did benefit the above ground plant parts in terms of dry mass, iron, sulfate, and organic sulfur nutrition. Prior to harvesting in the FBS0-crop, per plant all plant parts had accumulated more dry mass, i.e., they were heavier (main stems: +55%, tillers: +100%, main stems’ heads: +69%, tillers’ heads: +82%). In accordance, the obtained commercial yield of the FBS0-crop was higher by 27.3%.
More iron and organic sulfur accumulated in these plant parts, too. Iron fortification was observed in the main stems (+193%), in the tillers (+437%), in the main stems’ heads (+31%), and in the tillers’ heads (+250%). Organic sulfur fortification was found in the main stems (+191%), in the tillers (+231%), in the main stems’ heads (+75%), and in the tillers’ heads (+38%). As regards sulfate, it was higher in the main stems (+47%) and in the tillers (+58%). In the main stems’ heads it was less (−91%), and unchanged in the tillers’ heads.
The F-crop started with high iron and sulfate concentrations in the main stem. Then, Fe concentration decreased in parallel with sulfate concentration, whilst organic S concentration remained stable. Again, day 125 was a turning point. Thereafter, Fe and organic S concentrations remained low, whilst sulfate concentration increased significantly. In the tillers Fe concentration decreased, sulfate concentration remained stable, whilst organic S concentration started decreasing later on.
Therefore, the use of FBS0 exerted some fortification effects. Initially iron concentration was even higher (early fortification effect), quickly decreasing thereafter, sulfate concentration remained high and organic S concentration increased. This fortification effect was observed to a lesser extent in the F-crop at day 125. After day 125, all iron, sulfate, and organic S concentrations remained rather stable, fluctuating around a mean value with a ratio of 1:4:2 in the main stem and 1:5:2 in the tillers. A late fortification effect was observed in the iron concentration of the main stems and their heads after the stage of complete flowering within the examined parameters.
The percentage partitioning of iron, sulfate, and organic sulfur were altered (Figure 6). Among these alterations, the most prominent was that of sulfate at day 125 (Figure 6C), where more sulfate was partitioned to the tillers. On that day, the sulfate concentration in the main stems presented a characteristically low value (Figure 4B)

4. Discussion

The used FBS0 fertilizer in this work, apart from 2% S0, also contained sulfate as the accompanying anion of ammonium and potassium cations. Therefore, it constitutes a third category in addition to those distinguished by Jansen et al. (1986) [1], i.e., it contains both directly and non-directly available S for plant uptake. Furthermore, both molasses and glycerol are water soluble and can be used by soil microorganisms along with the elemental sulfur, thus sustaining microbial action around the granules.
In the rhizosoil, apart from the crop’s root systems, there are at least two more iron consumers, i.e., microbes and the root systems of the various weeds. In the case of the FBS0-crop, S0 increased the total amount of bacterial populations [22]. Therefore, apart from the phytosiderophores (PS) released by the durum wheat crop, more siderophore production, obviously of microbial origin, contributes to iron mobilization in the rhizosoil. On the other hand, both stategies of iron uptake are in action due to mixed root systems in the rhizosoil [14]. Being a graminaceous species, wheat utilizes Strategy II for iron uptake by the root system. It releases the phytosiderophore 2′-deoxymugineic acid (DMA) from roots, a chelating compound which is able to produce stable complexes with iron. Then the Fe-DMA complex is transported through the cell membrane [21]. There are only a few studies that have looked at PS concentrations in soil solution and release from soil-grown plants. It has been demonstrated [23] that carbon and energy investment into Fe acquisition under natural growth conditions is significantly smaller than previously derived from zero Fe-hydroponic studies. It has been reported that during the investigated period (21–47 days after germination), PS release initially exceeded Fe plant uptake 10-fold, but it significantly declined ca five weeks after germination [23]. PS released by strategy II plants are highly susceptible to microbial decomposition. However, to date very little is known about the fate of PS in soil. As regards the mineralization dynamics in the wheat rhizosphere and bulk soil of alkaline soils, between 40% and 65% of the DMA was either respired or incorporated into soil microbial biomass after 24 h, with the largest part of total incorporated DMA being recovered in gram negative bacteria [24]. Considering root growth dynamics, and taking into account that PS are mainly exuded from root tips, the significantly slower mineralization of DMA in bulk soil is of high ecological importance to enhance the Fe scavenging efficiency of PS released into the soil [24]. The adsorption and desorption of phytosiderophores by the soil solid phase has also been studied [25].
Another fact was that the FBS0-crop hosted less weeds, which definitely merits further investigation [6]. This most probably explains the reported statistically lower organic matter concentration in the FBS0-crop’s rhizosoil at day 197, twenty days after the second herbicide application [6]. The significant increase in the organic matter of the F-crop’s rhizosoil at that day seems to originate from the dead root system of the eliminated weeds. After the herbicide application, the dead root system of weeds was added to the already existing organic matter and the conventional F-crop showed much higher organic matter. This probably explains the replenishment of F-crop’s Fe content and the observed deficit of FBS0-crop’s Fe content in the rhizosoil at the end of the cultivation period.
The dynamics of HS content in the rhizosoil is another point which requires a further study. Humic substances are heterogeneous high-molecular-weight organic materials which are ubiquitous in the soil. In the present study, the rhizosoil environment was well oxygenated, i.e., not reduced. The interactions between the carbon, nitrogen, sulfur, and iron biogeochemical cycles in dynamic redox environments have been illustrated [26]. The findings of this work suggest that HS are involved in the affected processes in the rhizosoil and this may be due to the presence of elemental sulfur itself or to the various intermediates of the S biogeochemical cycle, as described in [26]. The aforementioned dynamics clearly depict that the addition of elemental sulfur as an ingredient of the fertilizer along with the initial fertilization differentiated the behavior of the rhizosoil’s examined parameters. The rhizosoil’s pH did not decrease [6]; instead the system behaved as buffer. Furthermore, the added FBS0 in a follow up field experiment increased the total microbial population, as well as promoting the activity of the sulfatase producing microbial populations in the rhizosoil of the studied commercial wheat crop grown on calcareous soil [22]. The amount of S0 provided with the fertilizer significantly enhanced the mobilization of the labile pool of sulfate esters in the organic matter of the soil. Therefore, apart from the sulfate added by the fertilizer at sowing, there was sulfate input, too, due to sulfatase activity, which suggests a sustained input of sulfate during crop development.
The developmental events during wheat growth and development are complex [27] and the developmental sequence of the generic winter wheat shoot apex for optimal conditions has been discussed in detail [28]. Furthermore, the characterization of the wheat leaf metabolome (including sulfate) during grain filling and under varied N-supply has been reported [29]. On the other hand, the interactions between iron nutrition and sulfur nutrition have received increasing attention. The finding that methionine is the sole percursor of mugineic acid [30] and the demonstration that the methionine cycle (or Yang cycle) in roots is one of the methionine sources [31] led Astolfi et al. [21,32,33] to further investigate the interactions between Fe nutrition and S nutrition, concluding that “the interaction can occur determining rapid adjustments of sulfate uptake and assimilation which conceivably lead to a re-distribution of reduced S pool. Fe availability might represent a signal able to modulate production and utilization of thiols at root level, where phytosiderophores are effectively synthesized” [32]. The iron nutrition of both crops was adequate. According to Mills and Jones [34], the sufficiency range for iron concentration in the top two leaves just before heading ranges between 10 ppm and 300 ppm for winter wheat collected from production fields. This held true for S nutrition, too, based on the detailed data of Reuter and Robinson plant analysis interpretation manual and the references therein for wheat [35].

5. Conclusions

The incorporation of 2% elemental sulfur as an ingredient of the applied fertilizer at sowing affected the iron fractions of the rhizosoil towards iron mobilization, thus providing more iron to the crop, which apart from the iron nutrition aspect fortified the crop’s sulfur nutrition, too. Summarizing the prominent facts, no iron was found as iron attached to carbonates of the rhizosoil. Fluctuations of the iron pool bound or adsorbed to the organic matter were exactly the opposite to those of the iron pool associated with the clay particles in both treatments, suggesting iron exchange between the two pools. Replenishment of the F-crop’s Fe content and a deficit in the FBS0-crop’s Fe content in the rhizosoil were found at the end of the cultivation period. The initiation of the fast stem elongation stage (day 125) marked a turning point. Before day 125, the use of FBS0 increased the iron concentration in the main stems and this was an early fortification effect, followed by an increase in the organic S concentration. After day 125, the FBS0-crop consisted of plants with higher main stems and less tillers. A late fortification effect was observed in the iron concentration of the main stems and their heads after the stage of complete flowering. Prior to harvesting in the FBS0-crop, all the plant’s parts were heavier, more iron and organic sulfur were accumulated in these plant parts, and the obtained commercial yield of the FBS0-crop was higher by 27.3%.

Acknowledgments

The authors are grateful to the greek fertilizer company Sulphur Hellas S.A. for providing the fertilizers and the consumables for chemical analyses, the farmer Panagiotis (Valvidas) Diamandis for applying the FBS0 product in his commercial crop, the agronomists Dimitris Petrakos, Harris Mavrogiannis, and Filippa Maniou for their help during sampling, and the three anonymous reviewers for their comments. The soil and plant samples of this study were collected by consent of the land owner.

Author Contributions

D.L.B. and S.N.C. conceived and designed the experiment, elaborated the research questions, analyzed the data, and wrote the article. M.M., G.I.S., and P.P.S. carried out the chemical analyses. D.L.B. carried out the field work with the contribution of P.P.S.

Conflicts of Interest

The authors declare no conflict of interest. The funding sponsor had no role in the design of the study; in the collection, analyses, or interpretation of data; in the writing of the manuscript, nor in the decision to publish the results.

Abbreviations

RSRhizosoil
OMOrganic matter
HSHumic substances
DMDry mass
frFraction
FGranular conventional fertilizer
S0Elemental sulfur
BBinder

References

  1. Janzen, H.H.; Bettany, J.R. Release of available sulfur from fertilizers. Can. J. Soil Sci. 1986, 66, 91–103. [Google Scholar] [CrossRef]
  2. Germida, J.J.; Jansen, H.H. Factors affecting the oxidation of elemental sulfur in soils. Fertil. Res. 1993, 35, 101–114. [Google Scholar] [CrossRef]
  3. Somani, L.L.; Totawat, K.L. Mined and industrial waste products capable of generating gypsum in soil. In Handbook of Soil Conditioners; Wallace, A., Terry, R.E., Eds.; Marcel Dekker, Inc.: New York, NY, USA, 1998; pp. 257–291. [Google Scholar]
  4. Messick, D. Agricultural Demand for Sulphur—The Challenges, The Future, In TFI-FITR’s Outlook and Technology Conference, Georgia, USA, 19 November 2014. Available online: http://www.firt.org/sites/default/files/TFI%20FIRT%20Outlook%20-%20Agricultural%20Demand%20for%20Sulphur%20-%20TSI.pdf (accessed on 28 October 2017).
  5. Benardos, D. Method for Coating Fertilizer Beads with Elemental Sulfur. U.S. Patent WO2017077350A, 11 May 2017. [Google Scholar]
  6. Chorianopoulou, S.N.; Saridis, G.I.; Sigalas, P.P.; Margetis, M.; Benardos, D.; Mavrogiannis, H.; Bouranis, D.L. The Application of S0-coated Fertilizer to Durum Wheat Crop. In Sulfur Metabolism in Higher Plants—Fundamental, Environmental and Agricultural Aspects; Proceedings of the International Plant Sulphur Workshop; De Kok, L.J., Rennenberg, H., Hawkesford, M.J., Eds.; Springer International Publishing: Cham, Switzerland, 2017; pp. 115–121. [Google Scholar]
  7. Lindsay, W.L.; Schwab, A.P. The chemistry of iron in soils and its availability to plants. J. Plant Nutr. 1982, 5, 821–840. [Google Scholar] [CrossRef]
  8. Lucena, J.J. Effects of bicarbonate, nitrate and other environmental factors on iron chlorosis. A review. J. Plant Nutr. 2000, 23, 1591–1606. [Google Scholar] [CrossRef]
  9. Lindsay, W.L. Iron oxide solubilisation by organic matter and its effect on iron availability. In Iron Nutrition and Interaction in Plants; Chen, Y., Hadar, Y., Eds.; Kluwer: Dordrecht, The Netherlands, 1991; pp. 29–36. [Google Scholar]
  10. Römheld, V.; Marschner, H. Mobilization of iron in the rizosphere of different plant species. In Advances in Plant Nutrition; Tinker, B., Laüchli, A., Eds.; Praeger Scientific: New York, NY, USA, 1986; pp. 155–204. [Google Scholar]
  11. Rodríguez-Lucena, P.; Tomasi, N.; Pinton, R.; Hernández-Apaolaza, L.; Lucena, J.J.; Cesco, S. Evaluation of 59Fe-lignosulfonates complexes as Fe-sources for plants. Plant Soil 2009, 325, 53–63. [Google Scholar] [CrossRef]
  12. Lindsay, W.L. Soil and plant relationships associated with iron deficiency with emphasis on nutrient interactions. J. Plant Nutr. 1984, 7, 489–500. [Google Scholar] [CrossRef]
  13. Tyler, G. Mineral nutrient limitations of calcifuge plants in phosphate sufficient limestone soil. Ann. Bot. 1996, 77, 649–656. [Google Scholar] [CrossRef]
  14. Zohlen, Α.; Tyler, G. Immobilization of tissue iron on calcareous soil: Differences between calcicole and calcifuge plants. Oikos 2000, 89, 95–106. [Google Scholar] [CrossRef]
  15. Broadley, M.; Brown, P.; Cakmak, I.; Rengel, Z.; Zhao, F. Function of Nutrients: Micronutrients. In Marschner’s Mineral Nutrition of Higher Plants; Marschner, P., Ed.; Academic Press: Cambridge, MA, USA, 2012; pp. 191–200. [Google Scholar]
  16. Jones, J.B., Jr. Soil Analysis Handbook of Reference Methods; CRC Press: Boca Raton, FL, USA, 1999; ISBN 9780849302053. [Google Scholar]
  17. Chorianopoulou, S.N.; Nikologiannis, S.; Gasparatos, D.; Bouranis, D.L. Relationships between iron, sulfur, nitrogen and phosphorus in lawns grown on a calcareous soil irrigated by slightly saline water. Fresenius Environ. Bull. 2017, 26, 1240–1246. [Google Scholar]
  18. Pueyo, M.; Mateu, J.; Rigol, A.; Vidal, M.; Lopez-Sanchez, J.F.; Rauret, G. Use of the modified BCR three-step sequential extraction procedure for the study of trace element dynamics in contaminated soils. Environ. Pollut. 2008, 152, 330–341. [Google Scholar] [CrossRef] [PubMed]
  19. Sörbo, B. Sulfate: Turbidimetric and nephelometric methods. In Methods in Enzymology: Sulfur and Sulfur Amino Acids; Jakoby, W.B., Griffith, O.W., Eds.; Academic Press, Inc.: New York, NY, USA, 1987. [Google Scholar]
  20. Miller, R.O. Extractable chloride, nitrate, orthophosphate, potassium, and sulfate sulfur in plant tissue: 2% acetic acid extraction. In Handbook of Reference Methods for Plant Analysis; Kalra, Y.P., Ed.; CRC Press LLC: Boca Raton, FL, USA, 1998; pp. 115–118. [Google Scholar]
  21. Astolfi, S.; Zuchi, S.; Passera, C.; Cesco, S. Does the sulfur assimilation pathway play a role in the response to Fe deficiency in maize (Zea mays L.) plants? J. Plant Nutr. 2003, 26, 2111–2121. [Google Scholar] [CrossRef]
  22. Chorianopoulou, S.N.; Venieraki, A.; Maniou, F.; Mavrogiannis, H.; Benardos, D.; Katinakis, P.; Bouranis, D.L. Sulfogrow®: A new type of plant biostimulant? In Proceedings of the 13th International Conference on Protection and Restoration of the Environment, Mykonos, Greece, 3–8 July 2016; pp. 733–738. [Google Scholar]
  23. Oburger, E.; Gruber, B.; Schindlegger, Y.; Schenkeveld, W.D.C.; Hann, S.; Kraemer, S.M.; Wenzel, W.W.; Puschenreiter, M. Root exudation of phytosiderophores from soil-grown wheat. New Phytol. 2014, 203, 1161–1174. [Google Scholar] [CrossRef] [PubMed]
  24. Oburger, E.; Gruber, B.; Wanek, W.; Watzinger, A.; Stanetty, C.; Schindlegger, Y.; Hann, S.; Schenkeveld, W.D.C.; Kraemer, S.M.; Puschenreiter, M. Microbial decomposition of 13C- labeled phytosiderophores in the rhizosphere of wheat: Mineralization dynamics and key microbial groups involved. Soil Biol. Biochem. 2016, 98, 196–207. [Google Scholar] [CrossRef]
  25. Walter, M.; Oburger, E.; Schindlegger, Y.; Hann, S.; Puschenreiter, M.; Kraemer, S.M.; Schenkeveld, W.D.C. Retention of phytosiderophores by the soil solid phase—Adsorption and desorption. Plant Soil 2016, 404, 85–97. [Google Scholar] [CrossRef] [PubMed]
  26. Li, Y.; Yu, S.; Strong, J.; Wang, H. Are the biogeochemical cycles of carbon, nitrogen, sulfur, and phosphorus driven by the “FeIII–FeII redox wheel” in dynamic redox environments? J. Soils Sediments 2012, 12, 683–693. [Google Scholar] [CrossRef]
  27. White, J.; Edwards, J. Wheat Growth and Development; Procrop; New South Wales, Department of Primary Industries: Orange, NSW, Australia, 2007. [Google Scholar]
  28. McMaster, G.S. Phytomers, phyllochrons, phenology and temperate cereal development. J. Agric. Sci. 2005, 143, 137–150. [Google Scholar] [CrossRef]
  29. Heyneke, E.; Watanabe, M.; Erban, A.; Duan, G.; Buchner, P.; Walther, D.; Kopka, J.; Hawkesford, M.; Hoefgen, R. Characterization of the wheat leaf metabolome during grain filling and under varied N-supply. Front. Plant Sci. 2017, 8, 2048. [Google Scholar] [CrossRef] [PubMed]
  30. Mori, S.; Nishizawa, N. Methionine as a dominant precursor of phytosiderophores in Graminea plants. Plant Cell Physiol. 1987, 28, 1081–1092. [Google Scholar]
  31. Ma, J.F.; Shinada, T.; Matsuda, C.; Kyosuke, N.J. Biosynthesis of phytosiderophores, mugineic acid, associated with methionine cycle. Biol. Chem. 1995, 270, 16549–16554. [Google Scholar] [CrossRef]
  32. Astolfi, S.; Zuchi, S.; Cesco, S.; Varanini, Z.; Pinton, R. Influence of iron nutrition on sulphur uptake and metabolism in maize (Zea mays L.) roots. Soil Sci. Plant Nutr. 2004, 50, 1079–1083. [Google Scholar] [CrossRef]
  33. Astolfi, S.; Zuchi, S.; Hubberten, M.-H.; Pinton, R.; Hoefgen, R. Supply of sulphur to S-deficient young barley seedlings restores their capability to cope with iron shortage. J. Exp. Bot. 2010, 61, 799–806. [Google Scholar] [CrossRef] [PubMed]
  34. Mills, H.A.; Jones, J.B., Jr. Plant Analysis Handbook II; MicroMacroPublishing, Inc.: Athens, GA, USA, 1996. [Google Scholar]
  35. Reuter, D.J.; Robinson, J.B. Plant Analysis, an Interpretation Manual, 2nd ed.; CSIRO Publishing: Clayton, Australia, 1997; pp. 244–245. [Google Scholar]
Figure 1. Overview of experimental work. On day 61 initiation of tillering took place. Stem elongation proceeded between days 105 to 146, whilst on day 197 the crop was in the process of grain filling.
Agriculture 08 00020 g001
Figure 2. The dynamics of iron pools in the rhizosoil during the crop’s development. The total extracted iron from the rhizosoil (RS; (A)), the percentage contribution of each fraction in the F-crop (B) and in the FBS0-crop (C), along with the iron contents of 4th (D), 3rd (E), and the 2nd (F) fraction.
Agriculture 08 00020 g002
Figure 3. The dynamics of the 3rd fraction content in relation to the contents of the organic matter (OM), and the humic substances (HS) in the rhizosoil during the development of the F-crop (open cycles; dashed line) and the FBS0-crop (full circles; solid line). (A) fr3-to-HS, (B) fr3-to-OM, and (C) HS-to-OM mass ratios.
Agriculture 08 00020 g003
Figure 4. Dynamics or iron (Fe: (A,D,G,J)), sulfate (SO42−: (B,E,H,K)), and organic sulfur (Sorg: (C,F,I,L)) concentrations in the main stems, the tillers, the main stems’ heads, and the tillers’ heads, respectively, during the development of the F-crop (open cycles; dashed line) and the FBS0-crop (full circles; solid line).
Agriculture 08 00020 g004
Figure 5. Dynamics of dry mass (DM: (A,E,I,M)), iron (Fe: (B,F,J,N)), sulfate (SO42−: (C,G,K,O)), and organic sulfur (Sorg: (D,H,L,P)) accumulations per plant, in the main stems, the tillers, the main stems’ heads, and the tillers’ heads, respectively, during the development of the F-crop (open cycles; dashed line) and the FBS0-crop (full circles; solid line).
Agriculture 08 00020 g005
Figure 6. Comparison of the percentage contribution of the accumulated dry mass (DM: (A,E)), iron (Fe: (B,F)), sulfate (SO42−: (C,G)), and organic sulfur (Sorg: (D,H)) per plant within the main stem, the tillers and their heads, in the F-crop and the FBS0-crop during development, respectively.
Agriculture 08 00020 g006
Table 1. Soil quality of the experimental fields.
FieldClayLoamSandClassCaCO3NO3-P-OlsenKexchMn-DTPACu-DTPAZn-DTPA
%%% %ppmppmppmppmppmppm
F-crop422830C13.110.5118.21707.511.741.1
FBS0-crop413128C16.711.6819.72407.841.50.92
F-crop: the crop that was subject to conventional fertilization (F-) treatment according to the local agricultural practices. FBS0-crop: the crop which received the corresponding FBS0-treatment. Kexch: soil exchangable potassium. DTPA: diethylenetriaminepentaacetic acid
Table 2. Tillering capacity and dynamics of the studied durum wheat variety, as affected by the applied fertilization schemes.
Days after Sowing
numberF-crop
of tillers105125167197
032606357
138221921
225111520
3+5732
FBS0-crop
105125167197
044508285
115201413
2252021
3+161021
F-crop: the crop that was subject to conventional fertilization (F-) treatment according to the local agricultural practices. FBS0-crop: the crop which received the corresponding FBS0-treatment.

