Nitrogen Use Efficiency and the Genetic Variation of Maize Expired Plant Variety Protection Germplasm


Department of Crop Sciences, University of Illinois, Urbana, IL 61801, USA
*
Author to whom correspondence should be addressed.
†
Current address: PR-445 Road, km 56.5, Limagrain, Londrina, PR 86115-000, Brazil.
‡
Current address: 718 Forest Park Blvd. Apt. D108, Oxnard, CA 93036, USA.
Agriculture 2018, 8(1), 3; https://doi.org/10.3390/agriculture8010003
Submission received: 3 November 2017
/
Revised: 19 December 2017
/
Accepted: 21 December 2017
/
Published: 1 January 2018
(This article belongs to the Special Issue Plant Nutrient Dynamics in Stressful Environments)
Abstract
:Nitrogen use efficiency (NUE) in maize (Zea mays L.) is an important trait to optimize yield with minimal input of nitrogen (N) fertilizer. Expired Plant Variety Protection (ex-PVP) Act-certified germplasm may be an important genetic resource for public breeding sectors. The objectives of this research were to evaluate the genetic variation of N-use traits and to characterize maize ex-PVP inbreds that are adapted to the U.S. Corn Belt for NUE performance. Eighty-nine ex-PVP inbreds (36 stiff stalk synthetic (SSS), and 53 non-stiff stalk synthetic (NSSS)) were genotyped using 26,769 single-nucleotide polymorphisms, then 263 single-cross maize hybrids derived from these inbreds were grown in eight environments from 2011 to 2015 at two N fertilizer rates (0 and 252 kg N ha−1) and three replications. Genetic utilization of inherent soil nitrogen and the yield response to N fertilizer were stable across environments and were highly correlated with yield under low and high N conditions, respectively. Cluster analysis identified inbreds with desirable NUE performance. However, only one inbred (PHK56) was ranked in the top 10% for yield under both N-stress and high N conditions. Broad-sense heritability across 12 different N-use traits varied from 0.11 to 0.77, but was not associated with breeding value accuracy. Nitrogen-stress tolerance was negatively correlated with the yield increase from N fertilizer.
1. Introduction
World-wide, producers used approximately 109 million tons of nitrogen (N) fertilizer in 2014 [1]. Of that amount, more than 5 million tons are used for maize (Zea mays L.) production in the United States (U.S.) [2]. Nitrogen is the mineral macronutrient required in the greatest amount by the maize crop, with uptake values being measured at 280 kg N ha−1 for a crop producing 14.4 Mg ha−1 of grain [3]. Although supplemental N fertilizer is often necessary to increase maize grain yield, N fertilizer consumption has remained constant in the U.S. for the last 20 years [1]. The maize yield increases observed, despite the constant N fertilizer consumption in the United States during the last two decades, were a result of both genetic improvement and better agronomic practices [4]. In contrast, in some regions, such as sub-Saharan Africa, limited N fertilizer use and soil availability prevent achieving yields that are similar to the United States [5]. The world population growth will require increased grain production, and therefore more N fertilizer efficiency will be necessary to meet the world’s demand [6]. Innovative agricultural technologies, such as new N fertilizer sources, precision agriculture, and crop genetic improvement will be important to increase nitrogen use efficiency in maize production [7].
Nitrogen use efficiency (NUE) is defined as the ratio of grain yield to N fertilizer that is supplied [8], and is the product of nitrogen uptake efficiency (NUpE, the ratio of the additional plant N content due to fertilizer N to the amount of fertilizer-applied N) and nitrogen utilization efficiency (NUtE, the ratio of yield increase to the difference in plant N content compared to those of an unfertilized crop). In addition, NUE is a complex phenotypic trait influenced by several plant physiological mechanisms [9]. Nitrogen uptake has been correlated to increased yield via many physiological factors, including: increased plant biomass, root architecture, photosynthesis, leaf area index, nitrate content, glutamine synthetase, Rubisco, PEP carboxylase, and asparagine [10,11,12,13]. Additionally, NUtE has been associated with factors, such as increased photosynthesis, remobilization, transport, and the balance of carbon and nitrogen assimilates, as well as kernel set, [14,15,16,17]. Since most maize breeding programs developed their germplasm under high soil N conditions, genetic selection for improved NUE is often ignored [18]. The genetic improvement of NUE in maize up to now was mainly achieved through indirect selection for increased hybrid yield performance. Nonetheless, large genotypic differences in maize NUE have been reported [18,19,20].
Over the past few decades, maize hybrids in North America have increased yield performance under both low and high N availability conditions [21], but the genetic gain of maize performance when grown under low N was almost twice the genetic gain found when hybrids were grown with high N fertility [20]. Genetic variation of NUE in maize has been attributed to hybrids expressing NUpE and NUtE at different levels [20,22]. These N-responsive traits contribute differently to NUE depending on the germplasm [23], the soil N status [7,9], and the progeny seed quality composition [19]. Using the Illinois Protein Strain collection, strain-hybrids with high seed protein concentration exhibited greater NUpE and lesser NUtE than the strain-hybrids with low seed protein concentration [20]. Phenotypic evaluation of NUpE and NUtE in a breeding population may be an important method to characterize and identify maize genotypes with desirable NUE performance [20,24]. Genetic improvement of NUE in U.S. germplasm using conventional or molecular breeding will require the simultaneous enhancement of both NUpE and NUtE. As a result, more research is needed to evaluate the genetic characteristics underlying NUE in the U.S. Corn Belt germplasm.
Since the U.S. Plant Variety Protection (PVP) Act was passed in 1970, which protects seed-bearing varieties for 20 years, plant breeders have been generating new genetic combinations using only the most elite material available, thereby decreasing the genetic diversity of commercial breeding programs in the U.S. [25]. Expired PVP Act-certified germplasm, named ex-PVP, are publically available and may represent an important genetic resource for both public and private breeding programs. Current U.S. maize germplasm has reduced allelic diversity; most of the current germplasm originated from only seven progenitor lines: B73, Mo17, PH207, PHG39, LH123Ht, LH82, and PH595 [26]. However, elite ex-PVP inbreds may be genetically diverse and an important genetic resource for maize breeding programs [27]. Although ex-PVP germplasm may not be integrated directly into a commercial breeding program, these genotypes can be used to originate new genetic combinations with desirable traits [28]. Up to now, little agronomic and quantitative breeding research has been done using a representative number of maize ex-PVP parental lines and hybrid combinations.
The objectives of this research were to characterize ex-PVP maize hybrids for N-use traits, evaluate the genetic variation and the phenotypic correlation of different N-responsive traits across different maize heterotic groups, and identify the parental lines and hybrid combinations with desirable NUE performance.
2. Materials and Methods
2.1. Germplasm and Genomic Data
A collection of 89 ex-PVP and two public maize inbreds, B73 and Mo17, were selected for this study (Table S1). All of the germplasm seed was obtained from the North Central Regional Plant Introduction Station (http://www.ars-grin.gov/npgs, verified 24 August 2016). Twelve ex-PVP inbreds were selected that contain the majority of allelic diversity encountered in current U.S. maize germplasm [27]. In addition, a random set of inbreds adapted to the U.S. Corn Belt with more recently expired PVP certificates from a selection of seed companies were included. Findings from these most recently-released ex-PVP lines may reveal the genetic diversity shifts observed during the past 20 years in germplasm usage by different breeding programs [29]. Overall, the ex-PVP collection used for this study contains genotypes that were released from 1972 to 2011, as developed by six different seed companies.
Leaf samples from all the inbreds (14-day old seedlings) were collected for DNA extraction using the CTAB protocol [30]. Inbreds were genotyped using the genotype-by-sequencing method [31] and two enzyme combinations were used to reduce genomic complexity: PstI-HF-Bfal and PstI-HF-HinP1I. The enzyme PstI-HF is considered a rare cutter, while HinP1I and BfaI are common cutters. These enzyme combinations were used to obtain adequate genome coverage. Sequenced data were obtained using an Illumina HiSeq2000 (W.M. Keck Center for Comparative and Functional Genomics, Urbana, IL, USA) and single-nucleotide-polymorphism (SNP) data were called using the GBS pipeline in TASSEL 3.0 [32]. Minor allele frequency cutoff was set to 10%, and SNPs with more than 50% missing data were removed. A total of 26,769 SNPs were used for the analyses.
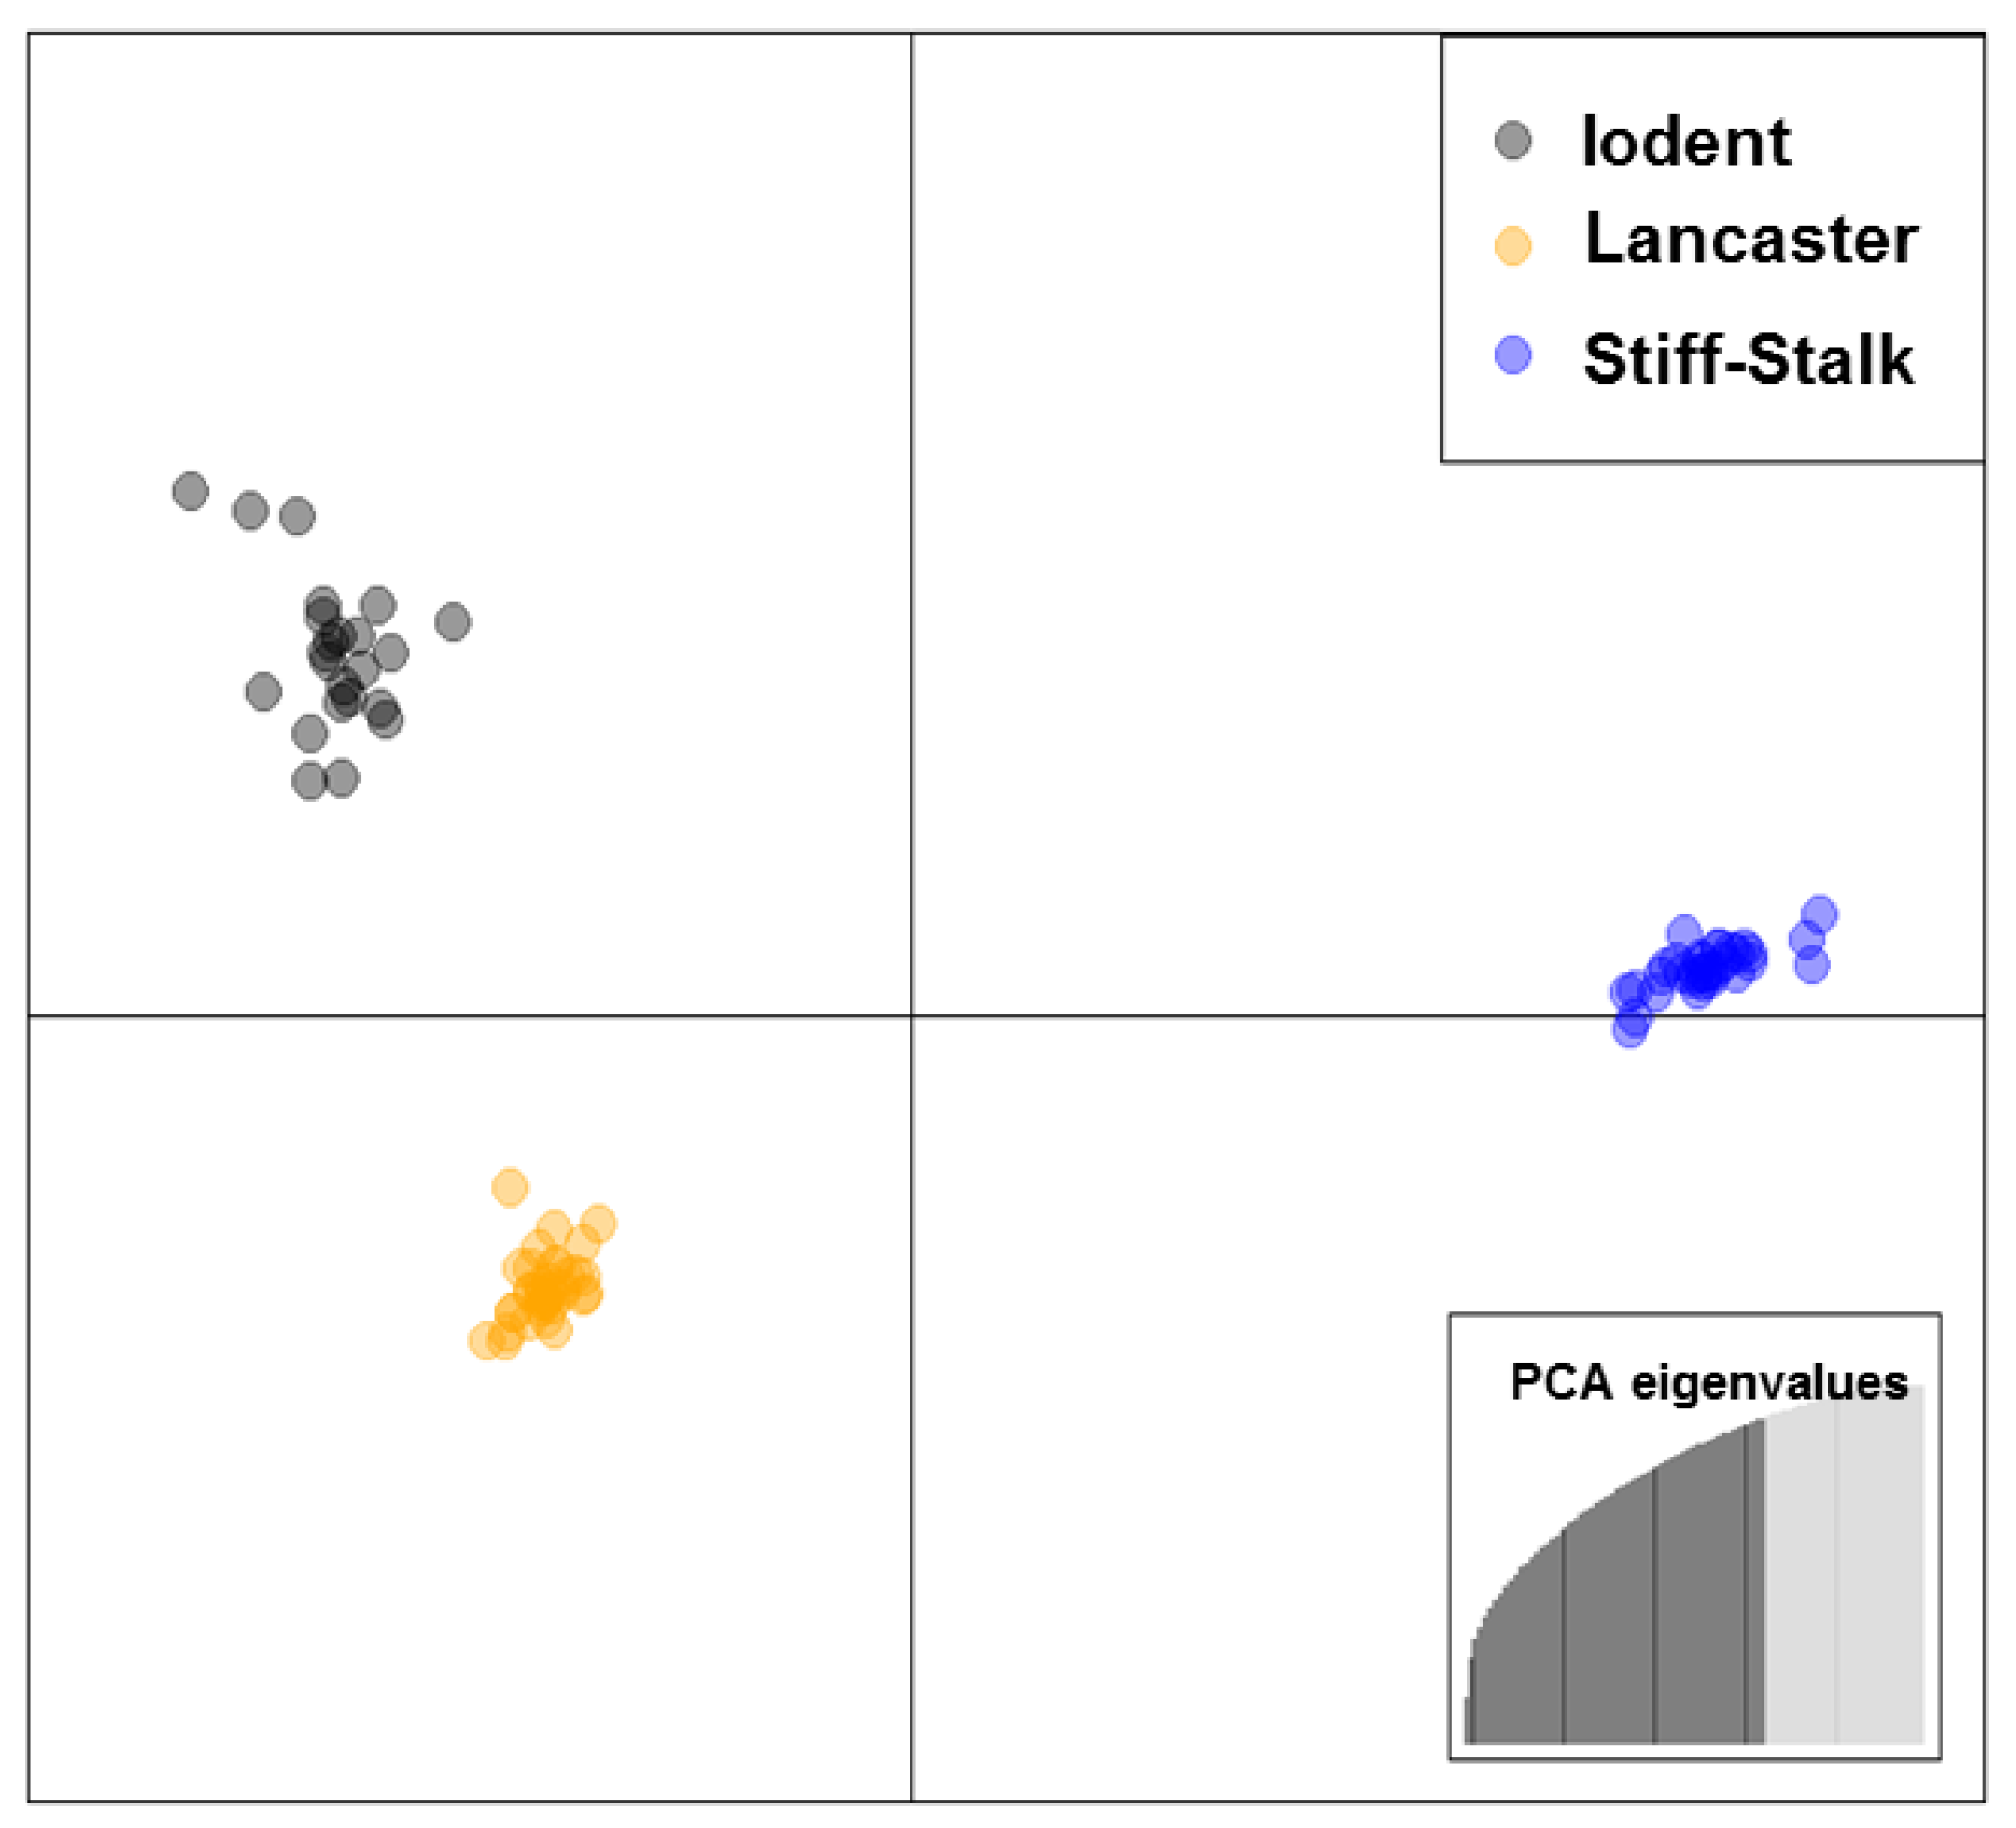
Discriminant analysis of principal components (DAPC) was performed for all of the inbred lines using the Adegenet package [33] in R Studio [34]. Since pedigrees from ex-PVP’s are often vague [26], DAPC is well suited to define genetic clusters in these situations [33]. Genotyping revealed that the ex-PVP germplasm used in this study was composed of 36 stiff-stalk synthetic (SSS) lines and 53 non-SSS (NSSS) lines; the latter of which included 19 lines from the Iodent sub-heterotic group, and 34 lines from the Lancaster sub-heterotic group (Figure 1). Knowledge of genetic relatedness between parental inbreds is fundamental for hybrid heterosis, due to dominance and epistatic effects [35]. Therefore, all of the single cross maize hybrids evaluated in this study were generated between SSS and NSSS parental lines.
Hybrid seed were created in an incomplete factorial design between SSS and NSSS inbred lines from 2011 to 2014 at Champaign, IL, USA. A total of 263 single cross maize hybrids that were derived from a random combination between SSS and NSSS parental lines were evaluated. On average, each SSS line was combined in 20 (range 3–57), and each NSSS line was combined in 13 (range 3–38) different hybrid combinations. A heatmap view of the incomplete factorial hybrid combination evaluated can be found online as Supplemental Figure S1.
2.2. Research Sites and Crop Management
Maize hybrids were grown in eight field environments from 2011 through 2015. Data from 2012 of the original experiment was excluded from the analysis due to severe drought stress. Research sites were planted in one environment at DeKalb, IL, USA (41°47′ N, 88°50′ W; 19 May 2014), five environments at Champaign, IL, USA (40°3′ N, 88°14′ W; 17 May 2011, 20 May 2013, 22 April 2014, 24 April 2015, and 19 May 2015), and two environments at Harrisburg, IL, USA (37°43′ N, 88°27′ W; 29 May 2013, and 23 May 2014). Soil types at the research sites were primarily Flanagan silt loam at DeKalb, IL, USA, Drummer silty clay loam at Champaign, IL, USA, and Patton silty clay loam at Harrisburg, IL, USA. The previous crop planted in each environment was soybean (Glycine max (L.) Merr.). The experiment was planted using a precision plot planter (SeedPro 360, ALMACO, Nevada, IA, USA) and plots were 5.6 m in length with 0.76 m row spacing and two rows in width. The target plant density was 79,000 plants ha−1. All seeds were treated with Maxim® XL fungicide (Fludioxonil and Mefenoxam at 0.07 mg active ingredient kernel−1; Syngenta Crop Protection, Greensburo, NC, USA), and Cruiser® 5FS insecticide (Thiamethoxam at 0.80 mg active ingredient kernel−1; Syngenta Crop Protection, Greensburo, NC, USA) to prevent early season disease and insect damage, respectively. In addition, Force 3G® insecticide (Tefluthrin 2,3,5,6-tetrafluoro-4-methylphenyl)methyl-(1α,3α)-(Z)-(±)-3-(2-chloro-3,3,3-trifluoro-1-propenyl)-2,2-dimethylcyclopropanecarboxylate; Syngenta Crop Protection, Greensburo, NC, USA) was applied at planting in-furrow (0.15 kg active ingredient ha−1) in order to control soil pests. Pre-emergence herbicide Lumax® EZ (mixture of S-Metolachlor, Atrazine, and Mesotrione; Syngenta Crop Protection, Greensburo, NC, USA) was applied at a rate of 7 L ha−1 to control early season weeds.
At maturity, plots were harvested with a two-row plot combine (SPC40, ALMACO, Nevada, IA, USA). Grain yield is reported as Mg ha−1 at 15.5% grain moisture. Grain protein concentrations were estimated from a representative grain subsample from each plot that was collected during harvest using near infrared transmittance (NIT) spectroscopy (Infratec 1241, FOSS, Eden Prairie, MN, USA).
2.3. Experimental Treatments and Design
The 263 single-cross maize hybrids were grown as part of a randomized complete block design, with three replications and two N fertilizer rates (0 and 252 kg N ha−1; designated low and high N, or −N and +N, respectively) in a split-plot arrangement. The main-plot was hybrid and the split-plot was N fertilizer rate. On average, 83 hybrids were tested in each environment (Supplemental Figure S1). Nitrogen stress tolerance was measured by yield of the check plot (0 kg N ha−1), while 252 kg N ha−1 was used to maximize the yield response to N from all of the hybrids, regardless of their yield potential. Nitrogen fertilizer was hand applied in a diffuse band as urea (46-0-0) during the V2 to V3 growth stages [36]. Nitrogen application dates were 17 June 2014 at DeKalb, IL, USA, 2 June 2011, 4 June 2013, 4 June 2014, 18 May 2015, and 10 June 2015 at Champaign, IL, USA, and 25 June 2013, and 13 June 2014 at Harrisburg, IL, USA.
2.4. Phenotype Measurements
Aboveground plant biomass from each plot was sampled at the R6 growth stage (physiological maturity), when the maximum biomass accumulation for maize is achieved [36]. Six representative plants (visual assessment) from each plot were sampled and separated into stover (leaf, stem, and husks) and ear (grain and cob). The sampling criteria established consisted of selecting two adjacent plants near one end of the plot (1.2 m along the length of the first row), two adjacent plants at the center of the plot (approximately 2.7 m from the origin), and two adjacent plants at the other end of the plot (approximately 4.1 m along the length of the second row). Whole stover fresh weight was determined before shredding in a brush chipper (Vermeer BC600XL; Vermeer Midwest, Goodfield, IL, USA). A representative subsample of the fresh shredded material was weighed and dried in a forced-draft oven (75 °C) for approximately five days. Total stover dry weight was calculated using the fresh stover weight and the moisture level of the shredded material. Individual plant dry total biomass (g plant−1) was the sum of the dry stover, cob, and grain weights (adjusted to 0% moisture). Dried stover samples were ground in a Wiley mill (Thomas Scientific, Swedesboro, NJ, USA) to pass a 20-mesh screen, and N concentration (g kg−1) was analyzed by using a combustion technique (EA1112 N-Protein analyzer; CE Elantech, Inc., Lakewood, NJ, USA). Grain protein concentration was estimated by multiplying N concentration by a factor of 6.25, and was abbreviated as Protein−N or Protein+N, from plants grown at 0 or 252 N ha−1, respectively). Stover N content (g N plant−1) was calculated by multiplying stover dry weight (g plant−1) by stover N concentration. Similarly, grain N content (g N plant−1) was calculated by multiplying grain dry weight (g plant−1) by grain N concentration. Individual plant N content (g N plant−1) was calculated as the sum of stover and grain N contents. Shelled grain weights from the ears sampled at R6 were combined with the remaining plot grain weight for yield determination.
In combination with grain yield and plant N content, NUE, N-uptake efficiency (NUpE), N-utilization efficiency (NUtE), harvest index (HI), and N-harvest index (NHI) were calculated according to Equations (1)–(7), with the expressed units shown:
in which Yield+N corresponds to grain yield (kg ha−1) at 252 kg N ha−1, Yield−N corresponds to grain yield at 0 kg N ha−1, NR is the N fertilizer rate (kg N, 252 kg N ha−1), PN represents the total plant N content (kg plant N ha–1) at 252 kg N ha−1 (PN+N) and at 0 kg N ha−1 (PN−N). In addition, genetic utilization (GU) (kg yield kg–1 plant N), which measures the physiological efficiency of plants to produce grain utilizing the plant N accumulated when grown without N fertilizer [18,19,20] was calculated according to Equation (8), with the expressed units shown:
in which PG−N is the individual plant grain mass (kg plant−1) at 0 kg N ha−1 and PN−N represents the total per plant N content (kg plant N) at physiological maturity derived from residual or mineralized soil N.
NUE = (Yield+N − Yield−N)/NR = (kg yield) (kg N)−1,
NUpE = (PN+N − PN−N)/NR = (kg plant N) (kg N)−1,
NUtE = (Yield+N − Yield−N)/(PN+N − PN−N) = (kg yield) (kg plant N)−1,
HI+N = (kg grain+N plant−1)/(kg dry weight+N plant−1) = kg kg–1,
HI−N = (kg grain−N plant−1)/(kg dry weight−N plant−1) = kg kg–1,
NHI+N = kg grainN+N/PN+N = (kg grain N) (kg plant N)–1,
NHI−N = kg grainN−N/PN−N = (kg grain N) (kg plant N)–1,
GU = PG−N/PN−N = (kg) (kg plant N)−1,
2.5. Statistical Analysis
Since there is a weak correlation between the performances of inbred parents and their hybrid progeny’s performance for NUE [37], the effects of general combining ability (GCA) and specific combining ability (SCA) of inbreds were evaluated using a random combination of ex-PVP hybrids. Moreover, the genetic variance and covariances between hybrids were calculated separately for each heterotic group [38]. Best linear unbiased predictions (BLUPs) were calculated for each phenotypic trait using the restricted maximum likelihood method to account for the unbalanced data. In addition, year-location combinations were considered environments. General and specific combining abilities were obtained in PROC MIXED SAS version 9.4 [39]. A linear model for an incomplete factorial design, according to Equation (9), was used:
where Yijklm is the mth observation of the klth hybrid in the jth block in the ith environment; µ is the grand mean, Ei is the random effect of ith environment (I = 1 to 8); Bj(i) is the random effect of jth block nested within the ith environment (j = 1 to 3); Sk is the GCA effect of kth SSS inbred (k = 1 to 36); Nl is the random GCA effect of lth NSSS inbred (l = 1 to 53); SNkl is the SCA effect of klth hybrid (kl = 1 to 522); ESik is the random environment by SSS interaction; ENil is the random environment by NSSS interaction; ESNikl is the random environment by hybrid interaction; and, εijklm is the random error term. Genotypic variance was calculated by multiplying the sum of the genetic variance components (SSS, NSSS, and hybrid) by two. Phenotypic variance was calculated as the sum of all the variance components, except for the variance component for block effect [40]. Broad-sense heritability was calculated as the ratio of genotypic and phenotypic variance. The estimated breeding value of each hybrid was calculated, according to Equation (10):
where EBVkl is the estimated breeding value of klth hybrid; µ is the grand mean; GCAk is the GCA effect of kth inbred; GCAl is the GCA effect of lth inbred; and, SCAkl is the SCA effect of klth hybrid. Estimated breeding value (EBV) measures the average effect of an individual’s genotypic value on the mean performance of its progeny [41] and is a widely-used measurement in maize breeding programs for the selection of superior genotypes.
Yijklm = μ + Ei + Bj(i) + Sk + Nl + SNkl + ESik + ENil + ESNikl + εijklm,
EBVkl = μ + GCAk + GCAl + SCAkl,
Pearson’s correlation coefficients were calculated in SAS version 9.4 [39] between the GCA’s of different N-use traits. Hierarchical cluster analysis was conducted on each heterotic group across different N-use traits, using the Euclidean method in R Studio [34]. The estimated breeding value (EBV) accuracy of the phenotypic traits was calculated according to Equation (11), [42]:
where SE is the standard error of the inbred GCA, F is the inbreeding coefficient of the individual (assumed to be zero), and σA2 is the additive variance component of the heterotic group (SSS or NSSS).
3. Results and Discussion
3.1. Phenotypic Variation of N-Use Traits
Yield under low N conditions (Yield−N) accounted for 54% of the yield that was produced by the hybrids under high N conditions (Yield+N) (Table 1). In addition, N fertilizer increased the mean harvest index (HI), the nitrogen harvest index (NHI), and the grain protein concentration. Average NUE, NUpE, NUtE, and GU values of 16.7 kg kgNfert−1, 0.43 kgplantN kgNfert−1, 41.8 kg kgplantN−1, and 59.0 kg kgplantN−1, respectively, are similar to other reports using U.S. Corn Belt germplasm [19,20]. Moreover, the additive effect distribution (range in GCA) of the two maize heterotic groups were similar for most N-use traits. In contrast, the NSSS group exhibited a greater additive effect range for NUE than the SSS group. The large additive effect variation that was observed among different N-use traits indicates that an opportunity exists for selecting maize genotypes with an improved NUE.
The relative importance of the genotypic and phenotypic variation to broad-sense heritability was dependent on the N-use trait and the N fertilizer rate (Table 1). Yield at high N exhibited greater genetic variance (within heterotic groups and hybrids) and environmental variance, but lower residual variance than Yield−N. Greater genetic variance under high N when compared to low N has also been documented previously [43,44]. Conversely, genetic and environmental variance for harvest index at low N (HI−N) were greater than at high N (HI+N). Additionally, the genotype by environment interaction was greater under high N for yield and grain protein concentration, but greater at low N for HI and NHI.
Broad-sense heritability (H2) ranged from 0.11 to 0.77 across phenotypic traits (Table 1), indicating a difference in additive and dominant effects among N-use traits (Table 1). Relatively large residual variances for Yield−N, HI−N, NHI at low N (NHI−N), NUpE, and NUtE resulted in low H2 of these traits. However, heritability was higher for GU than NUpE or NUtE. The large genotypic variance of GU found is consistent with previous studies [20].
Pearson’s pairwise correlations between the GCA effects of different N-use traits are presented in Table 2. Yield at high N is generally positively correlated with Yield−N, but the correlation tends to be less under greater N stress [22,45]. Similarly, in this study, the correlation between Yield+N and Yield−N was +0.31. Hybrid correlation coefficients between Yield+N and NUE, NUpE, and NUtE were +0.74, +0.64, and +0.44, respectively, which is in agreement with reports that these traits are frequently positively correlated [20,46]. On the other hand, Yield−N was positively correlated with HI−N, HI+N, NHI+N, and GU.
While significant genetic gains in maize yield have been documented over the past 60 years, the grain protein concentration has consistently decreased during the same period [47]. When averaged over hybrids and environments, grain protein concentration was negatively correlated to yield within each N fertilizer rate (Table 2). In addition, NUpE was positively correlated with grain protein concentration at low N (r = 0.22, p ≤ 0.05) and NUtE was negatively correlated with grain protein concentration at high N (Protein+N), (r = −0.47, p ≤ 0.001) (Table 2). This finding reinforces the concept of the inverse relationship of starch and protein in maize grain, with greater N utilization underlying a greater proportion of starch than protein accumulation in the grain. Under high N fertility conditions, NHI was positively correlated to Protein+N. Hybrids of the Illinois Protein-Strains germplasm, generating low or high grain protein concentration, exhibited the same overall NUE; while hybrids with high grain protein concentration exhibited high NUpE and NHI, and hybrids with low grain protein concentration exhibited high NUtE [19]. Therefore, maize hybrids with high NUpE may exhibit greater root development and N uptake, while hybrids with high NUtE will show more ability to utilize N for starch production.
Genetic improvements have increased maize yield under low and high N conditions, yet plant N uptake levels have only increased under high N [20]. As such, the genotypic correlations between N-use traits indicate that traits that are related to N fertilizer response (NUE, NUpE, and NUtE) are associated with yield performance under high N conditions, and traits related to the efficiency of nutrient or biomass partitioning to the grain (HI−N, HI+N, NHI+N, and GU) are associated with yield performance under N stress conditions. Although Yield−N and Yield+N are positively correlated, developing maize genotypes with high yield performance under high and low N conditions may be challenging, since the desirable traits for each of these N conditions are negatively correlated (HI, NHI, and GU vs. NUE, NUpE, and NUtE) (Table 2).
3.2. Genotype × Environment Interaction of N-Use Traits
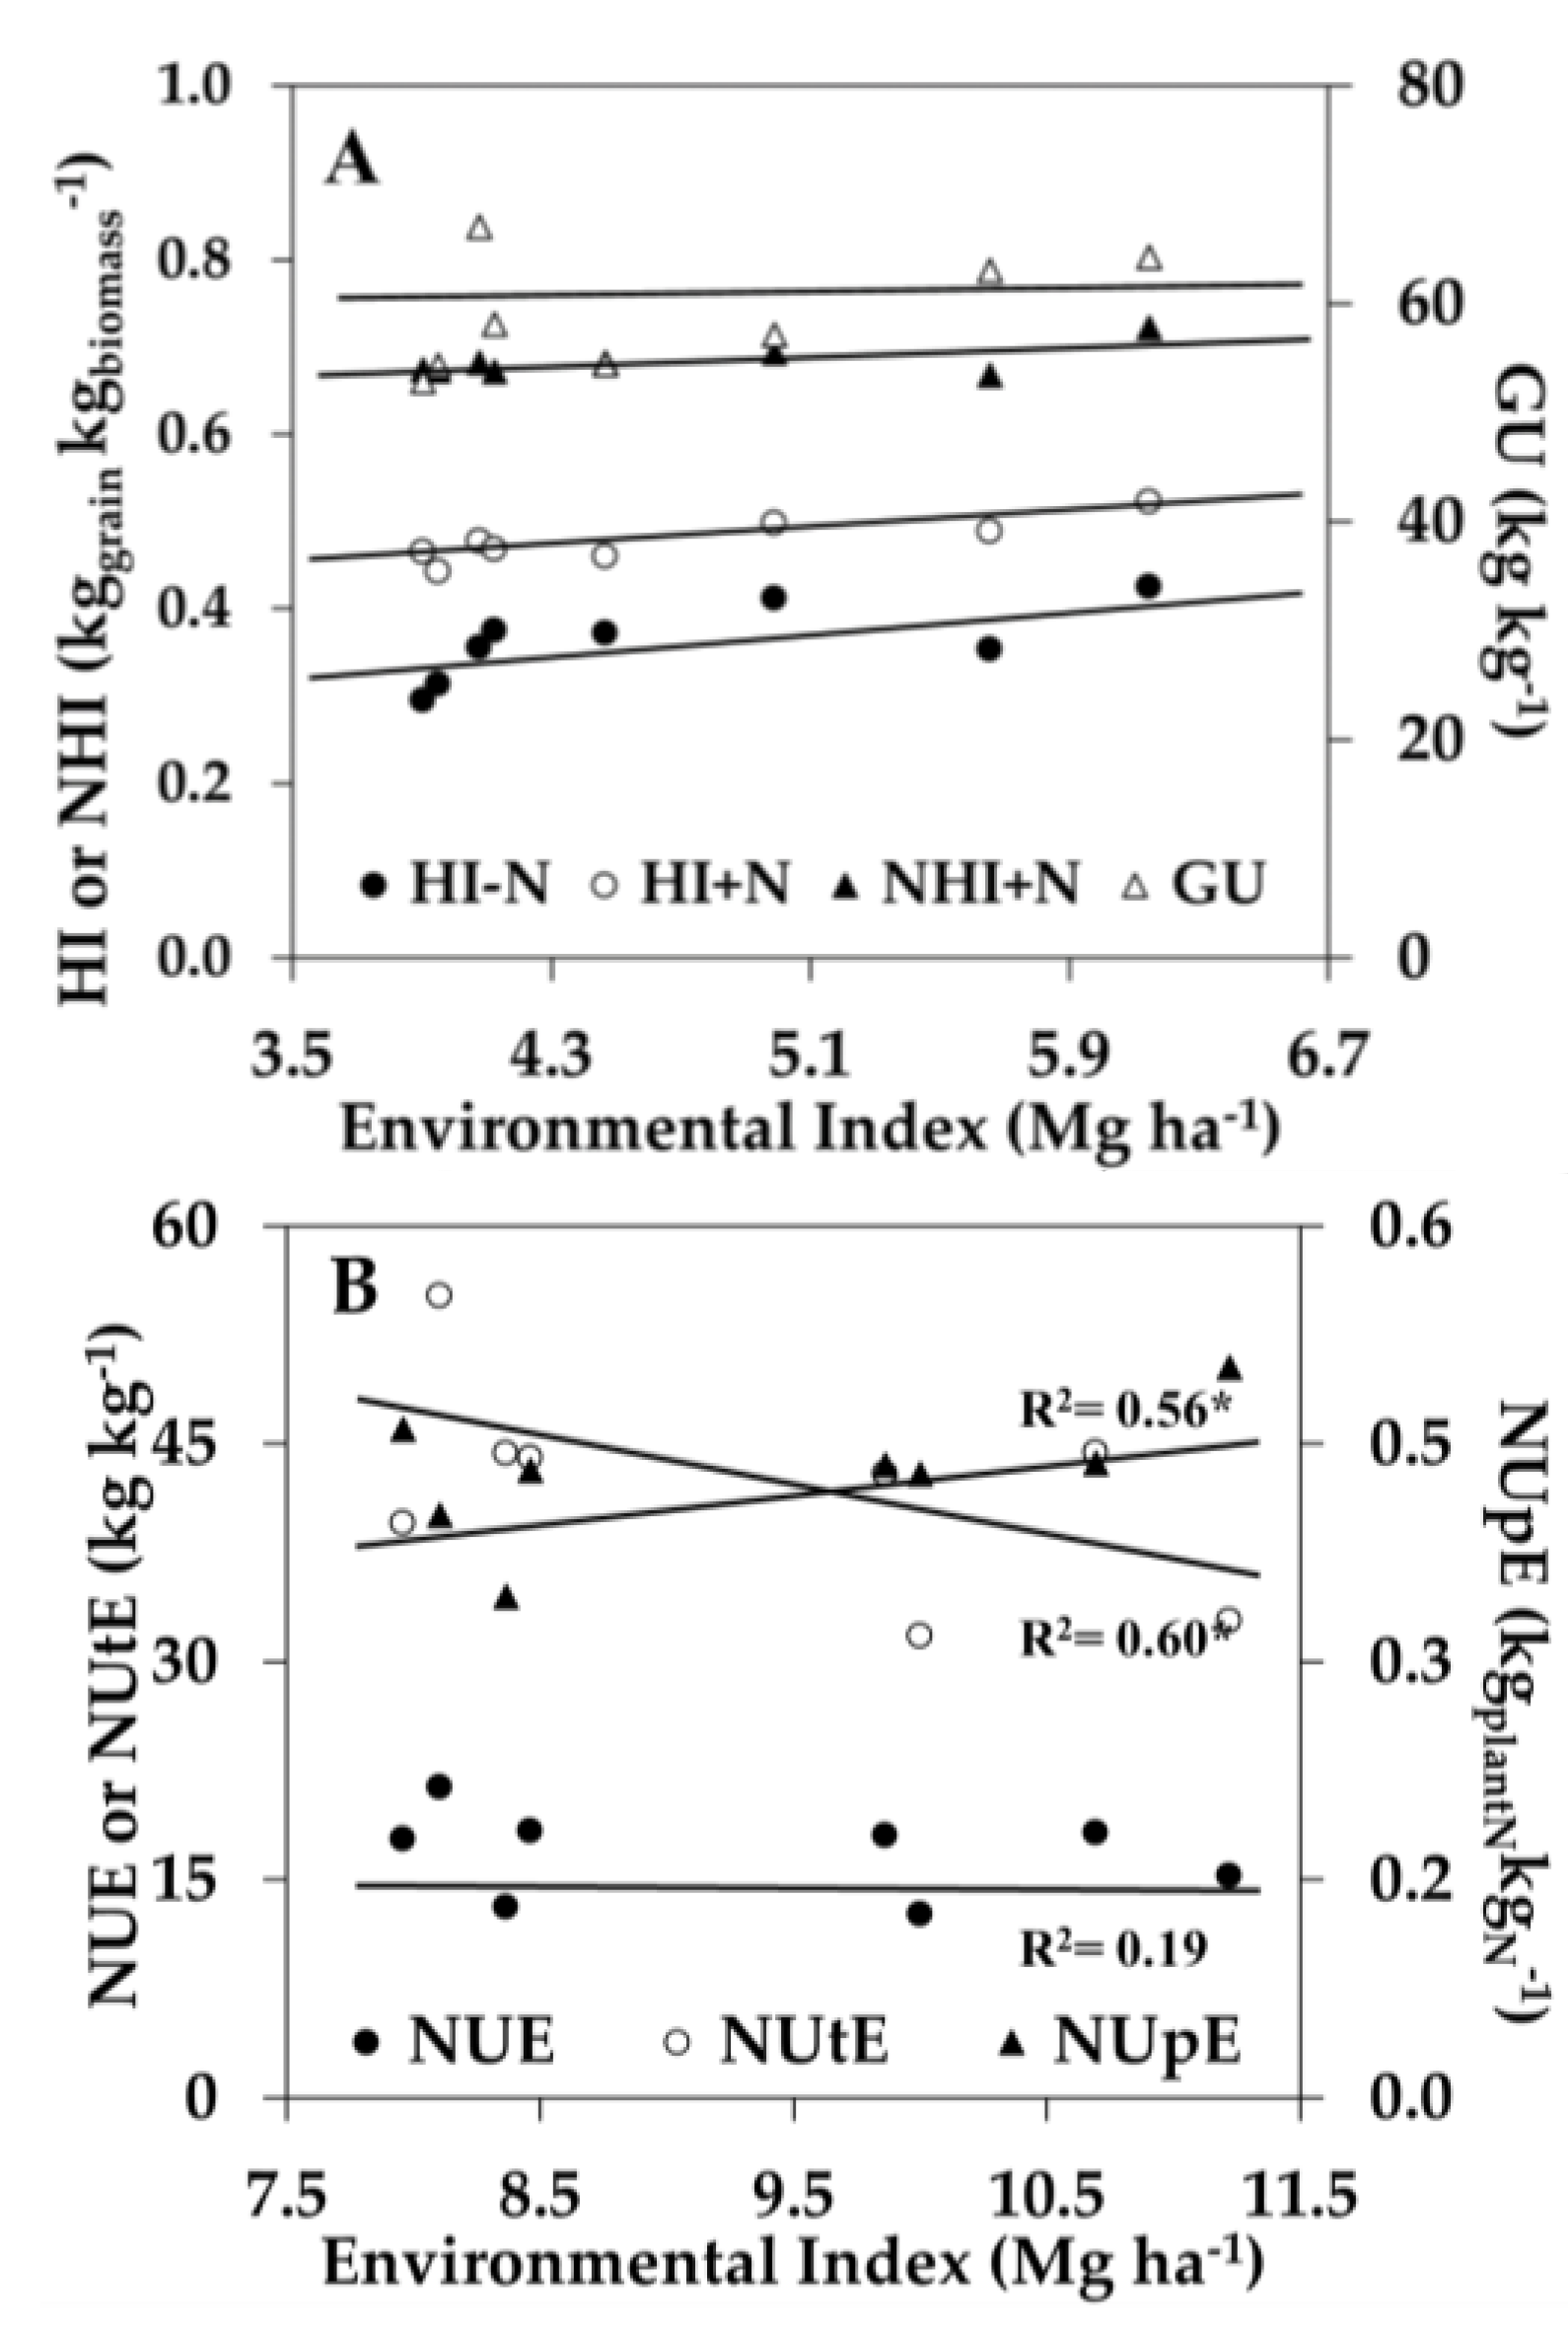
In addition to the genotypic correlation between traits, another major challenge for breeding programs is to model the effect of the genotype × environment interaction (G × E) on the desirable phenotypic traits [48]. While the genetic correlation of some N-use traits may be correlated to yield at low or high N conditions, their relationship might differ depending on other environmental conditions influencing yield. A way to compare the effect of an environment on yield is by measuring the average yield of multiple hybrids in each environment receiving similar crop management, termed the ‘environmental index’. Several studies have investigated the genetic variability of N-use traits across different N soil conditions [8,20,43,49], but few studies have investigated the effect of G × E on N-use traits. Therefore, regression analysis between an inbreds’ EBV at each environment (GCA + GCA × E + E) and the environmental index (E) was performed using the phenotypic traits that correlated to yield at low and high N conditions, respectively (Figure 2). Under low N conditions, GU was stable across environmental indices, and HI−N (0.04 kg kg−1/Mg ha−1), HI+N (0.02 kg kg−1/Mg ha−1), and NHI+N (0.02 kg kg−1/Mg ha−1) increased as the environmental index increased (Figure 2A). Under high N conditions, NUE was stable across environmental indices, while NUtE decreased (−3.60 kg kgplantN−1/Mg ha−1) and NUpE increased (+0.03 kgplantN kgNfert−1/Mg ha−1) as the environmental index increased (Figure 2B). The relationship between the G × E effect on N-use traits and the environmental index indicates the degree of trait dominance effects across different environmental yield conditions. A stable additive effect of NUE and GU across environmental indices is desirable for breeding selection in a wide range of environments.
3.3. Identification of Maize Genotypes with Improved NUE
Hybrid NUE performance is determined by the plant’s ability to take up nitrogen from the soil (NUpE), the physiological capacity to generate and partition N to the grain (HI and NHI), and the sink strength to set kernels and accumulate starch under high or low N conditions (NUtE and GU, respectively). Consequently, the aim of NUE breeding should be to integrate multiple desirable N-use traits into the same maize genotype. Hierarchical cluster analysis using the GCA effect of different phenotypic traits have categorized SSS (Group 1) and NSSS lines (Group 2) based on their NUE performance (Figure 3). Clusters within heterotic groups consisted of inbreds exhibiting correlated N-use traits (Table 3).
In the SSS cluster, groups 1A and 1B exhibited unique characteristics with the lowest Yield−N and the lowest Yield+N, respectively (Table 3). Group 1A also exhibited high grain protein concentration (under low and high N conditions), NUE, and NUpE, but the lowest GU within the SSS group. In contrast, groups 1B and 1C exhibited high Yield−N, but group 1B had the highest GU. Lastly, group 1D exhibited high Yield+N, NUE, and NUtE, while group 1E had an average performance for most of the N-use traits. In the NSSS cluster, groups 2A, 2B, and 2C exhibited higher HI and GU than groups 2D and 2E, but groups 2A and 2B had the lowest grain protein concentrations. Group 2A exhibited high Yield−N and Yield+N and the highest GU within the NSSS group. In contrast, group 2D presented high Yield+N and the lowest GU.
Across heterotic groups, only seven inbreds (78551S, B73, LH128, ICI740, PHK56, W8304, and W8555) ranked in the top 25% GCA for both Yield−N and Yield+N, and only one inbred (PHK56) ranked in the top 10% for high yield performance under both N conditions (data not shown). Inbred PHK56 was one of the most referenced lines in the U.S. Patent database, and it was derived from PHG35 (from recombination of PHG47 and Oh07-Midland) from the Oh43 background [25]. In addition, inbreds that are genetically related exhibited similar NUE performance (Figure 3). As such, inbreds Mo17 and LH51 (97% identical by descent from Mo17), which are important progenitors of the Lancaster germplasm [25], were categorized in the same cluster (group 2E). Likewise, inbred PH207 is the main founder of the Iodent heterotic group and is an ancestor of several Pioneer Hi-Bred inbreds such as PHG29 and PHG50 [25]. These inbreds exhibited high tolerance to N deficiency and high GU (Group 2C).
One breeding strategy for NUE improvement could be to utilize new inbred or hybrid combinations from the cluster groups with desirable N-use traits. Interestingly, group 2A was the only group exhibiting the combination of high Yield−N and Yield+N. Group 2A represents approximately 5% of all NSSS lines tested in this study and could be used as a potential genetic resource for the development of maize genotypes with an improved performance under high N or under N-stress conditions. Inbred combinations between groups 1C × 2A and 1D × 2D, in theory would produce single cross hybrids with high NUE performance under low and high N conditions, respectively.
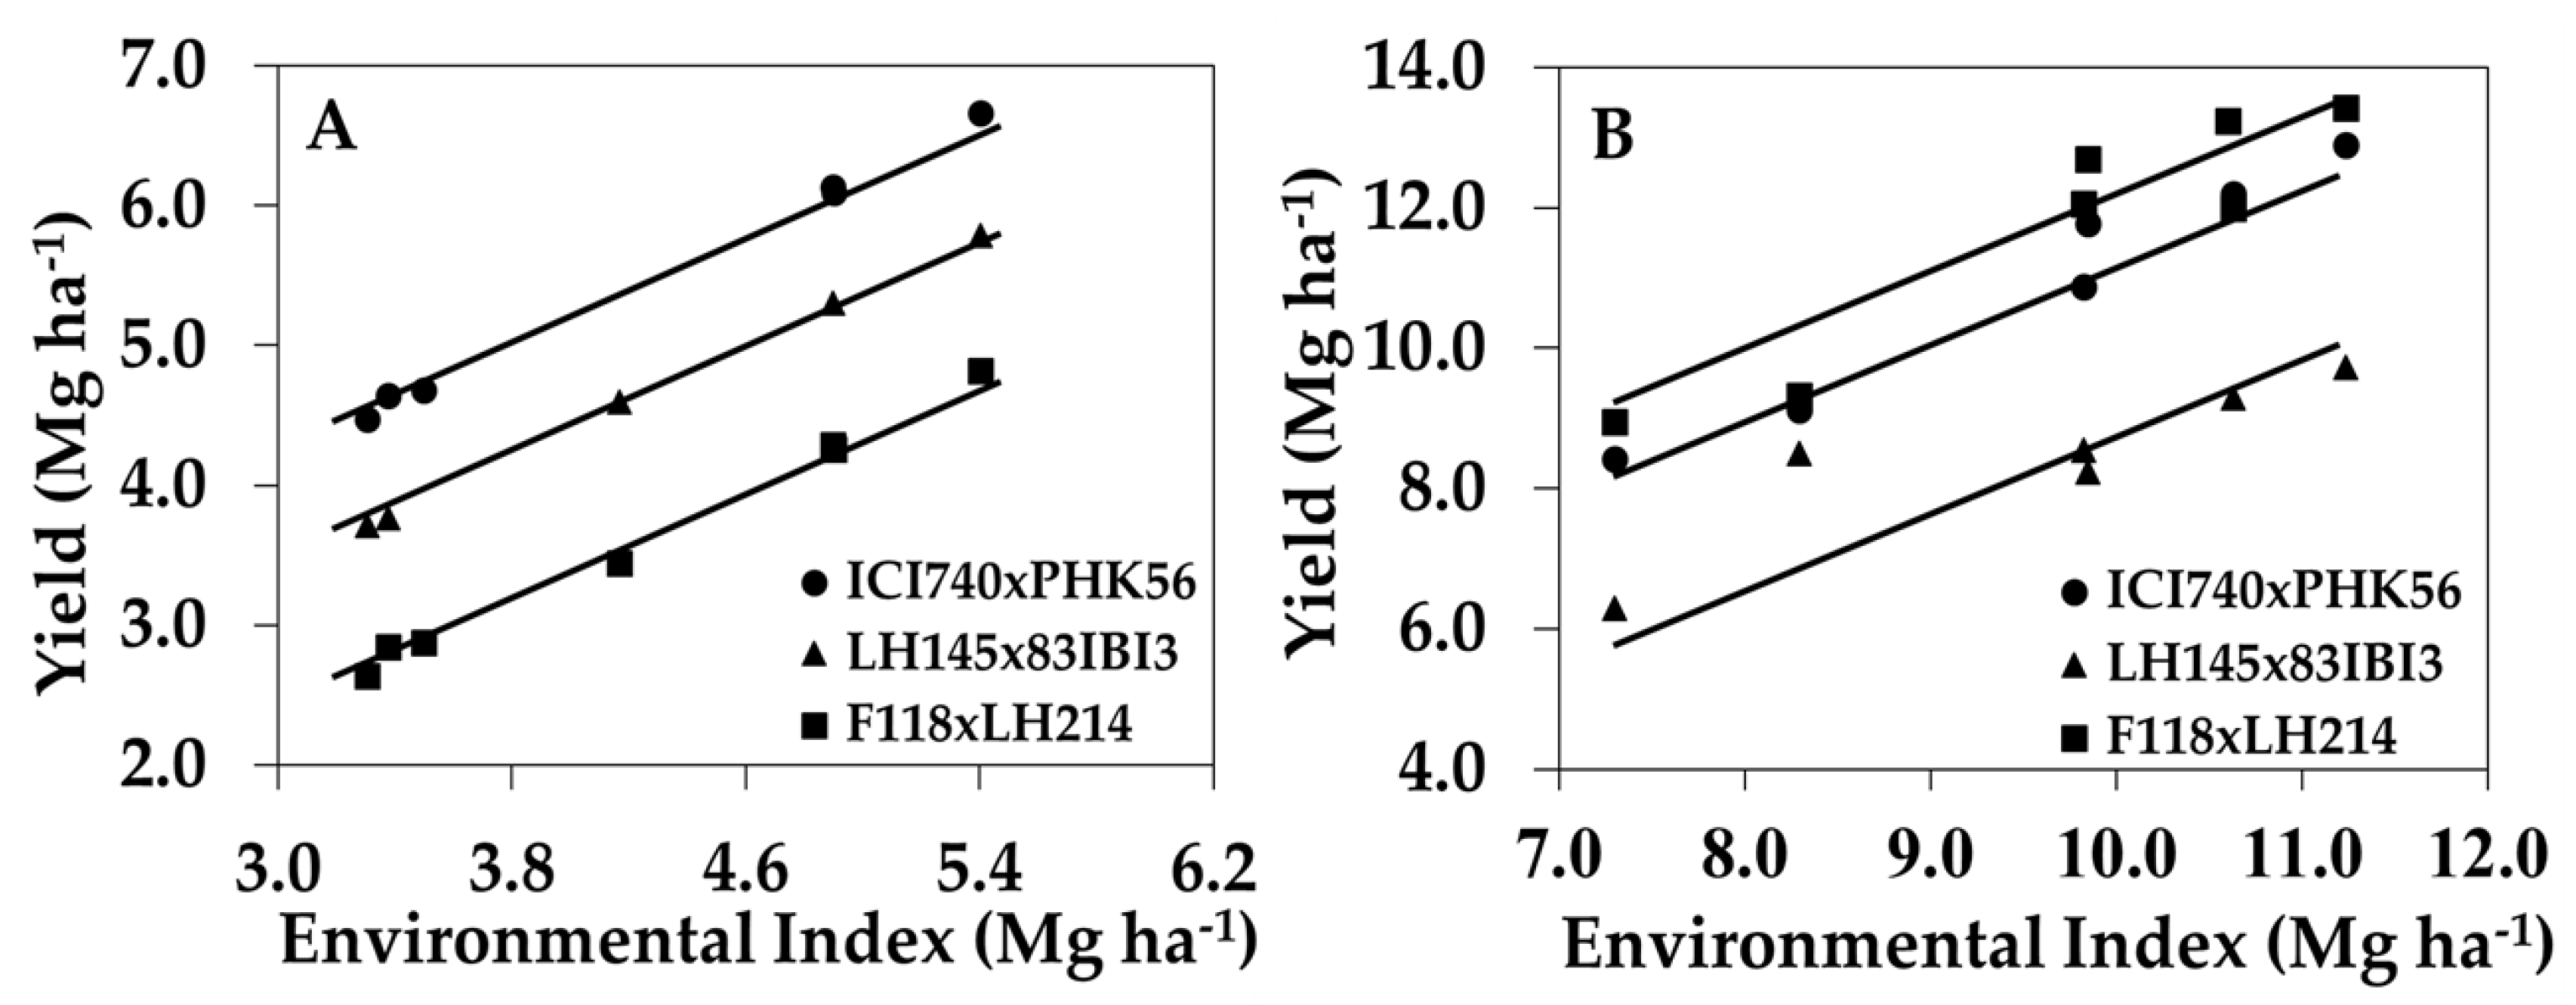
The identification of maize genotypes with high N-deficiency tolerance and/or high yield performance under sufficient soil N conditions is important for better hybrid placement and agronomic management positioning for maximum and efficient yields. Among the 263 hybrids that were evaluated, only 22 produced yields ranked in the top 25% for both Yield−N and Yield+N, and only five hybrids obtained yields ranked in the top 10% for both of the N conditions. Moreover, hybrid ICI740 × PHK56 (combination between groups 1C × 2A) exhibited high yield performance under low and high N conditions (Figure 4). This hybrid exhibited the highest average EBV for Yield−N (6.2 Mg ha−1) and the 9th highest EBV for Yield+N (10.3 Mg ha−1). Hybrid LH145×83IBI3 (groups 1B × 2C) exhibited high tolerance to N deficiency (Yield−N = 5.2 Mg ha−1), but low EBV for Yield+N (8.2 Mg ha−1). This hybrid also combined above average EBV for HI and GU, and below average EBV for NUE and NUtE. In contrast, hybrid F118 × LH214 (groups 1A × 2D) presented the highest average EBVs for Yield+N (11.1 Mg ha−1), NUE, and NUpE, but low EBV for Yield−N (4.4 Mg ha−1) and GU.
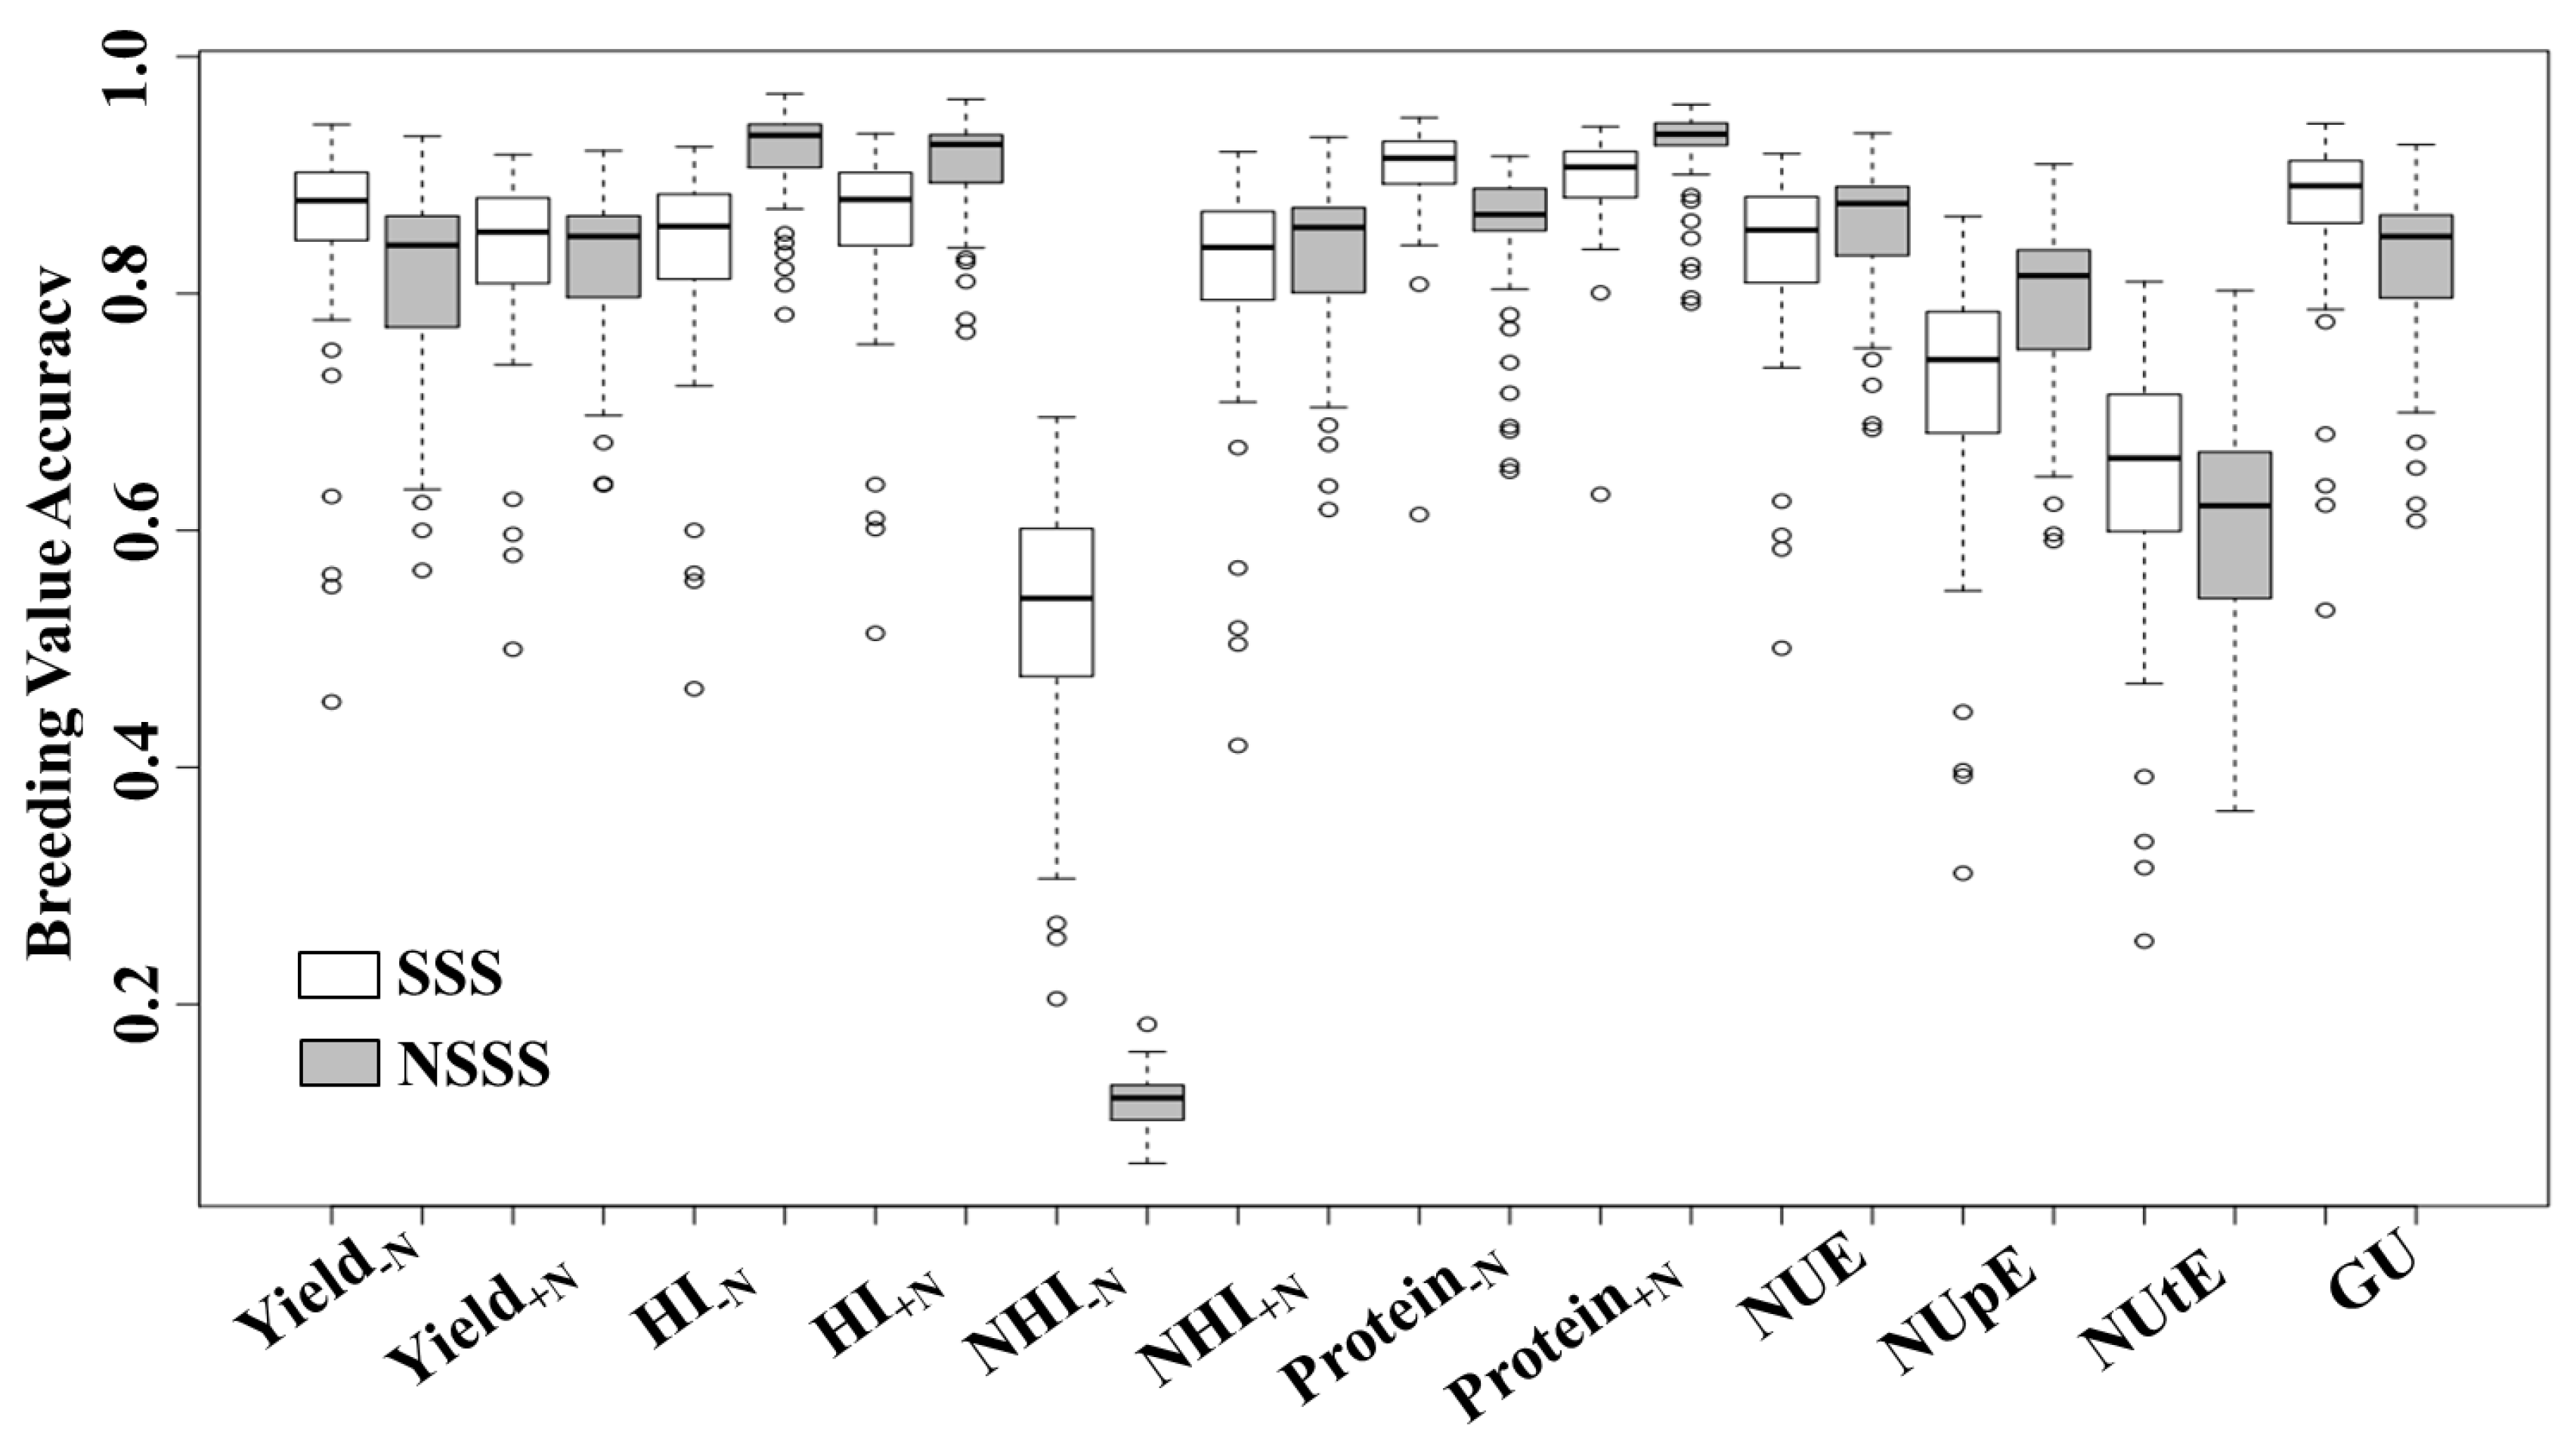
Estimated breeding value accuracy is an important method to compare the prediction reliability of desirable traits. Estimated breeding value accuracy ranged from 0.12 to 0.92, and, with the exception of NHI−N, EBV accuracies were similar among heterotic groups (Figure 5). While the majority of the inbreds exhibited high EBV accuracy, some of the genotypes did not. Skewness of EBV accuracy may be related to unbalanced data and genotypes with low yield stability across environments.
While precise estimates of H2 and EBV accuracy are a function of genetic and residual variance, there was no relationship between EBV accuracy averaged across heterotic groups and H2 (Table 1 and Figure 5). While the H2 for NUtE and NHI−N was both 0.11, their EBV accuracies were 0.61 and 0.28, respectively. Broad-sense heritability for Yield−N was almost 50% less than H2 for Yield+N. However, these traits presented similar EBV accuracy (approximately 0.82). Discrepancies between H2 and EBV accuracy can be associated with the genetic architecture of complex traits. Though large residual variance reduced the H2 of some phenotypic traits (e.g., Yield−N, NUpE, and NUtE), large additive variances increased their EBV accuracies.
4. Conclusions
Although 89 inbred lines were evaluated, there were certainly more ex-PVP lines available at the National Plant Germplasm System. Even so, this subset was able to display large genetic variation among ex-PVP lines for most N-use traits. The large range of broad-sense heritabilities that were found for phenotypic traits highlights the importance of accurate phenotypic selection under field conditions. In addition, differences in the stability of N-use traits across environments will have important implications for phenotypic selection. Genetic utilization and NUE were stable across environments and were highly correlated with yield under low and high N conditions, respectively. Hybrids with high N-deficiency tolerance or high yield response to N fertilizer were associated with different phenotypic traits, allowing for breeders to more easily select genotypes that would optimize yields in the respective expected situations. However, because of this dichotomy, less than 2% of the hybrids evaluated exhibited high yield performance under both low and high N conditions. Increasing yields worldwide will require a combination of developing hybrids that have tolerance to low-N situations, as well as hybrids that can take advantage of optimum conditions for a grower’s best crop production in their environment. Nitrogen use efficiency is the end result of highly polygenic and complex traits, therefore, deciding which traits are relevant can speed hybrid selection. Future genetic improvement of NUE will require effective integration between accurate field phenotyping and marker-assisted breeding strategies, such as genome-wide prediction and metabolic profiling studies.
Supplementary Materials
The following are available online at https://www.mdpi.com/2077-0472/8/1/3/s1, Table S1: Maize line name, year of release, heterotic group, and proprietary company name of Ex-Plant Variety Protection (PVP) inbreds used as parents in this study, Figure S1: Heatmap showing maize hybrid combinations between 36 stiff-stalk synthetic and 53 non-stiff-stalk synthetic lines developed with the corresponding number of environments tested over three locations in Illinois from 2011 to 2015.
Acknowledgments
This research was made possible with partial funding from the National Institute of Food and Agriculture project NC1200 “Regulation of Photosynthetic Processes” and the Illinois AES project 802-908. The authors wish to thank Juliann Seebauer for her assistance in manuscript preparation, and past and present staff of the crop physiology laboratory for their support.
Author Contributions
All authors contributed in the conception and development of the research. C.C.H. performed initial crossings and experiments. A.T.M. extended the analysis and wrote the paper.
Conflicts of Interest
The authors declare no conflicts of interest.
References
- FAOSTAT. Production. Food and Agricultural Organization of the United Nations, Statistics Division. 2014. Available online: http://faostat3.fao.org/home/E (accessed on 13 October 2017).
- USDA-NASS (USDA National Agricultural Statistics Service). National Statistics for Corn: Corn Grain—Yield, Measured in Bu/acre. Statistics by Subject; USDA-NASS: Washington, DC, USA, 2014. Available online: http://www.nass.usda.gov/Statistics_by_Subject/index.php (accessed on 14 February 2016).
- Bender, R.R.; Haegele, J.W.; Ruffo, M.L.; Below, F.E. Nutrient uptake, partitioning, and remobilization in modern, transgenic insect-protected maize hybrids. Agron. J. 2013, 105, 161–170. [Google Scholar] [CrossRef]
- Duvick, D.N. The contribution of breeding to yield advances in maize (Zea mays L.). Adv. Agron. 2005, 86, 83–145. [Google Scholar]
- Kihara, J.; Nziguheba, G.; Zingore, S.; Coulibaly, A.; Esilaba, A.; Kabambe, V.; Njoroge, S.; Palm, C.; Huising, J. Understanding variability in crop response to fertilizer and amendments in sub-Saharan Africa. Agric. Ecosyst. Environ. 2016, 229, 1–12. [Google Scholar] [CrossRef] [PubMed]
- Cassman, K.G.; Dobermann, A.; Walters, D.T. Agroecosystems, nitrogen-use efficiency, and nitrogen management. Ambio 2002, 31, 132–140. [Google Scholar] [CrossRef] [PubMed]
- Raun, W.R.; Johnson, G.V. Improving nitrogen use efficiency for cereal production. Agron. J. 1999, 91, 357–363. [Google Scholar] [CrossRef]
- Moll, R.H.; Kamprath, E.J.; Jackson, W.A. Analysis and interpretation of factors which contribute to efficiency of nitrogen utilization. Agron. J. 1982, 74, 562–564. [Google Scholar] [CrossRef]
- Moose, S.P.; Below, F.E. Biotechnology approaches to improving maize nitrogen use efficiency. In Molecular Genetic Approaches to Maize Improvement. Biotechnology in Agriculture and Forestry Series; Kriz, A.L., Larkins, B.A., Eds.; Springer: Berlin/Heidelberg, Germany, 2009; Volume 63, pp. 65–77. ISBN 978-3-540-68919-5. [Google Scholar]
- Uribelarrea, M.; Crafts-Brandner, S.J.; Below, F.E. Physiological N response of field-grown maize hybrids (Zea mays L.) with divergent yield potential and grain protein concentration. Plant Soil 2009, 316, 151–160. [Google Scholar] [CrossRef]
- Seebauer, J.R.; Moose, S.P.; Fabbri, B.J.; Crossland, L.D.; Below, F.E. Amino acid metabolism in maize earshoots. Implications for assimilate preconditioning and nitrogen signaling. Plant Physiol. 2004, 136, 4326–4334. [Google Scholar] [CrossRef] [PubMed]
- Hirel, B.; Bertin, P.; Quillere, I.; Bourdoncle, W.; Attagnant, C.; Dellay, C.; Gouy, A.; Cadiou, S.; Retaillau, C.; Falque, M.; et al. Towards a better understanding of the genetic and physiological basis for nitrogen use efficiency in maize. Plant Physiol. 2001, 125, 1258–1270. [Google Scholar] [CrossRef] [PubMed]
- Hammer, G.L.; Dong, Z.; McLean, G.; Doherty, A.; Messina, C.; Schussler, J.; Zinselmeier, C.; Paskiewicz, S.; Cooper, M. Can changes in canopy and/or root system architecture explain historical maize yield trends in the U.S. Corn Belt? Crop Sci. 2009, 49, 299–312. [Google Scholar] [CrossRef]
- Leach, K.A.; Tran, T.M.; Slewinski, T.L.; Meeley, R.B.; Braun, D.M. Sucrose transporter2 contributes to maize growth, development, and crop yield. J. Integr. Plant Biol. 2017, 59, 390–408. [Google Scholar] [CrossRef] [PubMed]
- Peng, Y.; Li, C.; Fritschi, F.B. Diurnal dynamics of maize leaf photosynthesis and carbohydrate concentrations in response to differential N availability. Environ. Exp. Bot. 2014, 99, 18–27. [Google Scholar] [CrossRef]
- Bihmidine, S.; Hunter, C.T., III; Johns, C.E.; Koch, K.E.; Braun, D.M. Regulation of assimilate import into sink organs: Update on molecular drivers of sink strength. Front. Plant Sci. 2013, 4, 177. [Google Scholar] [CrossRef] [PubMed]
- Weiland, R.T.; Ta, T.C. Allocation and retranslocation of N-15 by maize (Zea mays L.) hybrids under field conditions of low and high-N fertility. Aust. J. Plant Physiol. 1992, 19, 77–88. [Google Scholar] [CrossRef]
- Kamprath, E.J.; Moll, R.H.; Rodriguez, N. Effects of nitrogen fertilization and recurrent selection on performance of hybrid populations of corn. Agron. J. 1982, 74, 955–958. [Google Scholar] [CrossRef]
- Uribelarrea, M.; Moose, S.P.; Below, F.E. Divergent selection for grain protein affects nitrogen use in maize hybrids. Field Crop. Res. 2007, 100, 82–90. [Google Scholar] [CrossRef]
- Haegele, J.W.; Cook, K.A.; Nichols, D.M.; Below, F.E. Changes in nitrogen use traits associated with genetic improvement for grain yield of maize hybrids released in different decades. Crop Sci. 2013, 53, 1256–1268. [Google Scholar] [CrossRef]
- Tollenaar, M.; Nissanka, S.P.; Rajcan, I.; Bruulsema, T.W. Yield response of old and new corn hybrids to nitrogen. Better Crops. 1997, 81, 3–5. [Google Scholar]
- Presterl, T.; Groh, S.; Landbeck, M.; Seitz, G.; Schmidt, W.; Geiger, H.H. Nitrogen uptake and utilization efficiency of European maize hybrids developed under conditions of low and high nitrogen input. Plant Breed. 2002, 121, 480–486. [Google Scholar] [CrossRef]
- Gallais, A.; Coque, M. Genetic variation and selection for nitrogen use efficiency in maize: A synthesis. Maydica 2005, 50, 531–537. [Google Scholar]
- Laftte, H.R.; Edmeades, G.O. Stress tolerance in tropical maize is linked to constitutive changes in ear growth characteristics. Crop Sci. 1995, 35, 820–826. [Google Scholar] [CrossRef]
- Mikel, M.A.; Dudley, J.W. Evolution of North American dent corn from public to proprietary germplasm. Crop Sci. 2006, 46, 1193–1205. [Google Scholar] [CrossRef]
- Nelson, P.T.; Coles, N.D.; Holland, J.B.; Bubeck, D.M.; Smith, S.; Goodman, M.M. Molecular characterization of maize inbreds with expired US plant variety protection. Crop Sci. 2008, 48, 1673–1685. [Google Scholar] [CrossRef]
- Hauck, A.L.; Johnson, G.R.; Mikel, M.A.; Mahone, G.S.; Morales, A.J.; Rocheford, T.R.; Bohn, M.O. Generation means analysis of elite ex-plant variety protection commercial inbreds: A new public maize genetics resource. Crop Sci. 2014, 54, 174–189. [Google Scholar] [CrossRef]
- Bari, M.A.A.; Carena, M.J. Can expired proprietary maize (Zea mays L.) industry lines be useful for short-season breeding programs? II. Agronomic traits. Euphytica 2016, 207, 69–77. [Google Scholar] [CrossRef]
- Smith, J.S.C.; Duvick, D.N.; Smith, O.S.; Cooper, M.; Feng, L. Changes in pedigree backgrounds of Pioneer brand maize hybrids widely grown from 1930 to 1999. Crop Sci. 2004, 44, 1935–1946. [Google Scholar] [CrossRef]
- Doyle, J.J.; Doyle, J.L. A rapid DNA isolation procedure for small quantities of fresh leaf tissue. Phytochem. Bull. 1987, 19, 11–15. [Google Scholar]
- Elshire, R.J.; Glaubitz, J.C.; Sun, Q.; Poland, J.A.; Kawamoto, K.; Buckler, E.S.; Mitchell, S.E. A robust, simple genotyping-by-sequencing (GBS) approach for high diversity species. PLoS ONE 2011, 6. [Google Scholar] [CrossRef] [PubMed]
- Bradbury, P.J.; Zhang, Z.; Kroon, D.E.; Casstevens, T.M.; Ramdoss, Y.; Buckler, E.S. TASSEL: Software for association mapping of complex traits in diverse samples. Bioinformatics 2007, 23, 2633–2635. [Google Scholar] [CrossRef] [PubMed]
- Jombart, T.; Devillard, S.; Balloux, F. Discriminant analysis of principal components: A new method for the analysis of genetically structured populations. BMC Genet. 2010, 11, 94. [Google Scholar] [CrossRef] [PubMed]
- The R Project for Statistical Computing. Available online: http://www.r-project.org (accessed on 10 December 2016).
- Bernardo, R. Molecular markers and selection for complex traits in plants: Learning from the last 20 years. Crop Sci. 2008, 48, 1649–1664. [Google Scholar] [CrossRef]
- Ritchie, S.W.; Hanway, J.J.; Benson, G.O. How a Corn Plant Develops; Spec. Rep. No. 48; Iowa State University of Science and Technology Cooperative Extension Service: Ames, IA, USA, 1997. [Google Scholar]
- Betrán, F.J.; Beck, D.; Bänziger, M.; Edmeades, G.O. Genetic analysis of inbred and hybrid grain yield under stress and nonstress environments in tropical maize. Crop Sci. 2003, 43, 807–817. [Google Scholar] [CrossRef]
- Stuber, C.W.; Cockerham, C.C. Gene effects and variances in hybrid populations. Genetics 1966, 54, 1279–1286. [Google Scholar] [PubMed]
- SAS Institute. SAS 9.2 User’s Guide; SAS Institute: Cary, NC, USA, 2013. [Google Scholar]
- Holland, J.B.; Nyquist, W.E.; Cervantes-Martinez, C.T. Estimating and interpreting heritability for plant breeding: An update. Plant Breed. Rev. 2003, 22, 9–112. [Google Scholar]
- Falconer, D.S.; Mackay, T.F. Introduction to Quantitative Genetics, 4th ed.; Longman Technical: Essex, UK, 1996. [Google Scholar]
- Gilmour, A.; Cullis, B.; Welham, S.; Gogel, B.; Thompson, R. An efficient computing strategy for prediction in mixed linear models. Comput. Stat. Data Anal. 2004, 44, 571–586. [Google Scholar] [CrossRef]
- Brun, E.L.; Dudley, J.W. Nitrogen responses in the USA and Argentina of corn populations with different proportions of flint and dent germplasm. Crop Sci. 1989, 29, 565–569. [Google Scholar] [CrossRef]
- Trachsel, S.; Leyva, M.; Lopez, M.; Suarez, E.A.; Mendoza, A.; Montiel, N.G.; Macias, M.S.; Burgueno, J.; San Vicente, F. Identification of tropical maize germplasm with tolerance to drought, nitrogen deficiency, and combined heat and drought stresses. Crop Sci. 2016, 56, 3031–3045. [Google Scholar] [CrossRef]
- Bänziger, M.; Betrán, F.J.; Lafitte, H.R. Efficiency of high-nitrogen selection environments for improving maize for low-nitrogen target environments. Crop Sci. 1997, 37, 1110–1117. [Google Scholar] [CrossRef]
- Abe, A.; Menkir, A.; Moose, S.P.; Adetimirin, V.O.; Olaniyan, A.B. Genetic variation for nitrogen-use efficiency among selected tropical maize hybrids differing in grain yield potential. J. Crop Improv. 2012, 27, 31–52. [Google Scholar] [CrossRef]
- Duvick, D.N.; Cassman, K.G. Post-green revolution trends in yield potential of temperate maize in the northcentral United States. Crop Sci. 1999, 39, 1622–1630. [Google Scholar] [CrossRef]
- Van Eeuwijk, F.A.; Bustos-Korts, D.V.; Malosetti, M. What should students in plant breeding know about the statistical aspects of genotype × environment Interactions? Crop Sci. 2016, 56, 2119–2140. [Google Scholar] [CrossRef]
- Smiciklas, K.D.; Below, F.E. Influence of heterotic pattern on nitrogen use and yield of maize. Maydica 1990, 35, 209–213. [Google Scholar]
Figure 1.
Scatterplots of the discriminant analysis of principal components of 89 ex-Plant Variety Protection (ex-PVP) maize inbred lines. Scatterplot displays the first two components using 26,768 single nucleotide polymorphism markers. Heterotic groups are represented by different colors: Iodent (black), Lancaster (yellow), and Stiff-stalk synthetic (blue), and each dot represents an individual inbred line.

Figure 2.
Influence of N supply and environment on selected N-use traits. (A) Changes in harvest index at low and high N (HI−N and HI+N), N-harvest index at high N (NHI+N), and genetic utilization (GU) due to the environmental index for maize hybrids grown at low N (0 kg N ha−1); and (B) Changes in N-use efficiency (NUE), N-utilization efficiency (NUtE), and N-uptake efficiency (NUpE) due to the environmental index for maize hybrids grown with high N (252 kg N ha−1). Values shown for each phenotypic trait are averaged over all the hybrids grown in each of the eight environments from 2011 to 2015. * Indicates significant slopes at p ≤ 0.001.

Figure 3.
Hierarchical cluster analysis using different N-use traits of 36 stiff-stalk synthetic (SSS, Group 1) and 53 non-SSS (NSSS, Group 2) inbred lines. Clusters A, B, C, D, and E represent groups of inbreds with similar N-use trait performances. Clusters were generated using the inbreds’ GCA from 12 N-use traits. Inbred GCAs were calculated from 263 maize hybrids grown from 2011 to 2015 under low and high N conditions (0 and 252 kg N ha−1, respectively).
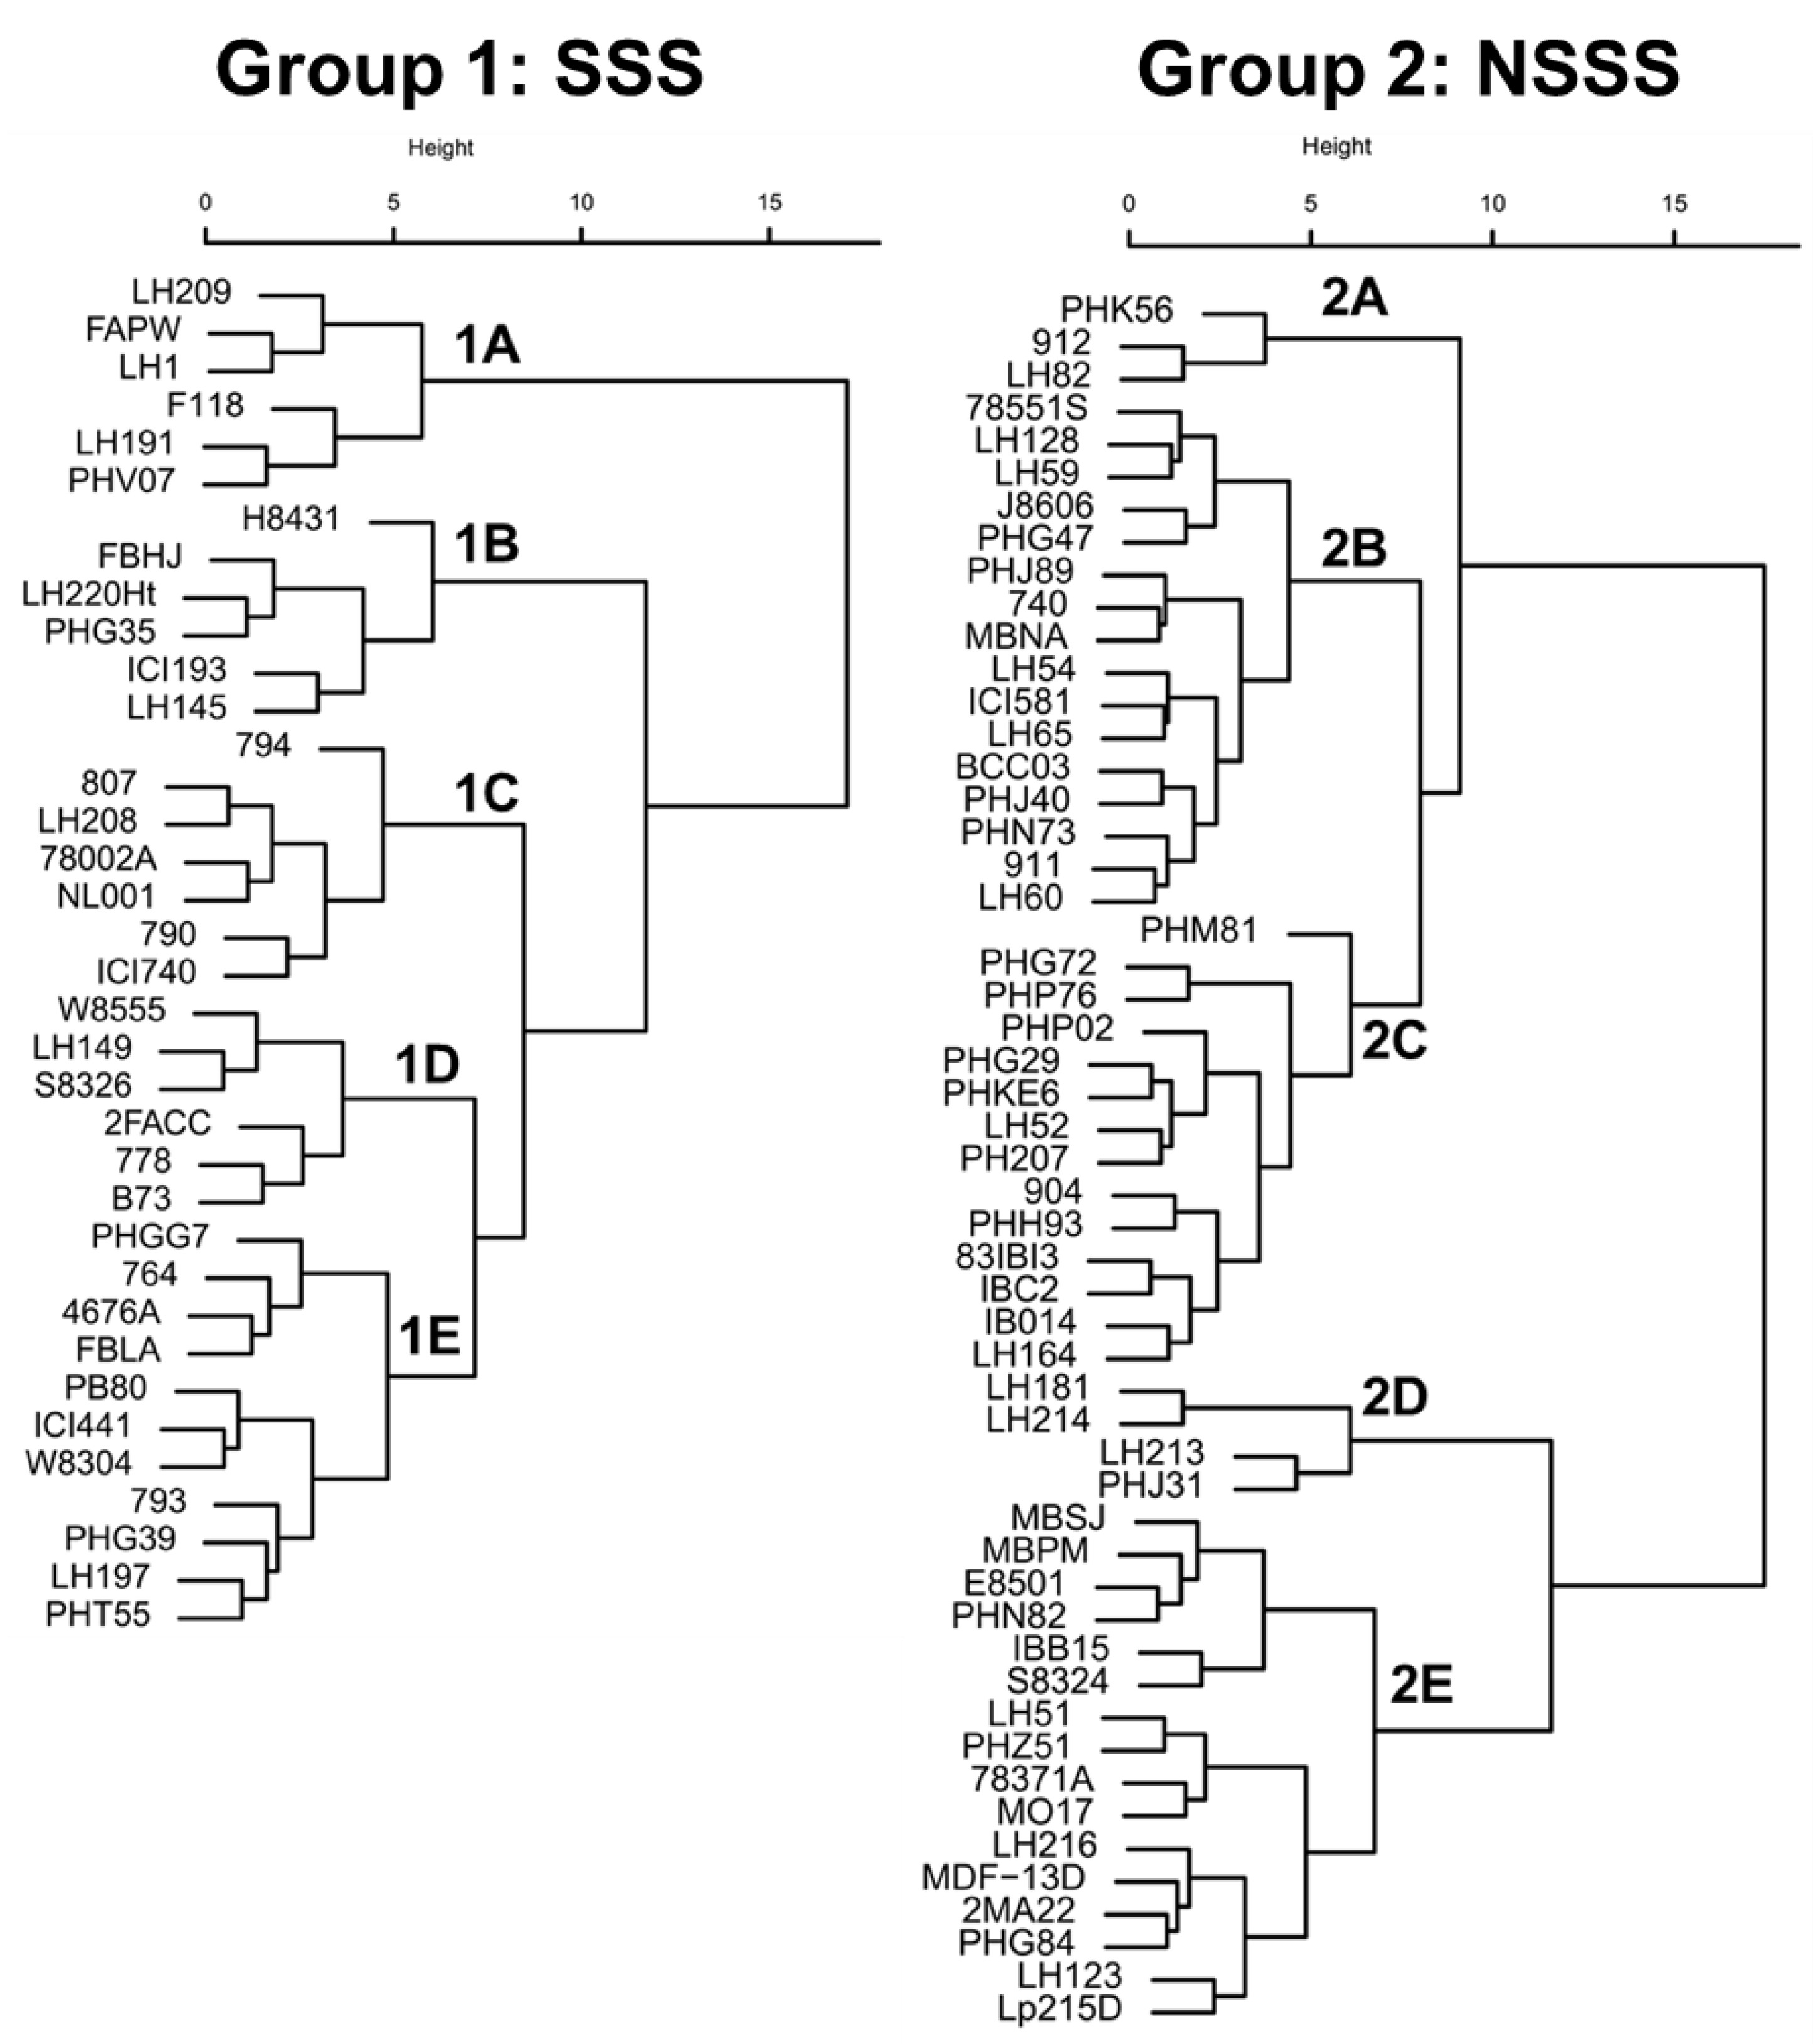
Figure 4.
Yield of select hybrids across environmental indices when grown with (A) low N (0 kg N ha−1), and (B) high N (252 kg N ha−1). Data values are the average yields within an environment for ICI740 × PHK56 (high tolerance to N-deficiency and high positive response to N fertilizer), LH145 × 83IBI3 (high tolerance to N-deficiency and low positive response to N fertilizer), and F118 × LH214 (low tolerance to N-deficiency and high positive response to N fertilizer).

Figure 5.
Box-plot of breeding value accuracies for yield at low and high N (Yield−N and Yield+N), harvest index at low and high N (HI−N and HI+N), N-harvest index at low and high N (NHI−N and NHI+N), grain protein concentration at low and high N (Protein−N and Protein+N), N-use efficiency (NUE), N-uptake efficiency (NUpE), N-utilization efficiency (NUtE), and genetic utilization (GU) in stiff-stalk synthetic (SSS) and non-stiff-stalk synthetic (NSSS) maize lines. Breeding value accuracy was estimated according to Equation (11). Values are based on the yield performance of 263 hybrids developed from these lines and grown in eight environments from 2011 to 2015 under low and high N conditions (0 and 252 kg N ha−1, respectively).


Table 1.
Mean estimates and range for yield at low N (Yield−N, Mg ha−1), yield at high N (Yield+N, Mg ha−1), harvest index at low N (HI−N, kg kg−1), harvest index at high N (HI+N, kg kg−1), N harvest index at low N (NHI−N, kggrainN kgplantN−1), N harvest index at high N (NHI+N, kggrainN kgplantN−1), grain protein concentration at low N (Protein−N, g kg−1), grain protein concentration at high N (Protein+N, g kg−1), N-use efficiency (NUE, kg kgNR−1), N-uptake efficiency (NUpE, kgplantN kgNR−1), N-utilization efficiency (NUtE, kg kgplantN−1), and genetic utilization (GU, kg kgplantN−1). Variance components for general and specific combining ability effects (GCA and SCA) were calculated using 36 stiff-stalk synthetic (SSS) and 53 non-SSS (NSSS) ex-PVP parental inbred lines across different N-use traits. Broad-sense heritability (H2) for each trait was estimated in eight environments under low and high N conditions (0 and 252 kg N ha−1, respectively).
| GCASSS † | GCANSSS | SCA | |||||||||
|---|---|---|---|---|---|---|---|---|---|---|---|
| Trait | Mean ± SE ‡ | Range Min./Max. | σ2SSS | Range Min./Max. | σ2NSSS | Range Min./Max. | σ2SCA | σ2E | σ2SCA×E | σ2R | H2 |
| Yield−N | 4.9 ± 0.19 | −0.7/0.7 | 0.13 | −0.8/0.5 | 0.12 | - | 0.00 | 0.70 | 0.01 | 1.31 | 0.31 |
| Yield+N | 9.1 ± 0.28 | −0.9/+0.9 | 0.25 | −1.2/0.9 | 0.32 | −0.2/+0.3 | 0.06 | 2.12 | 0.36 | 1.07 | 0.61 |
| HI−N | 0.36 ± 0.01 | −0.05/+0.09 | 6 × 10⁻⁴ | −0.10/+0.06 | 1 × 10⁻³ | −0.01/+0.01 | 1 × 10⁻⁴ | 2 × 10⁻³ | 3 × 10⁻⁴ | 4 × 10⁻³ | 0.63 |
| HI+N | 0.47 ± 0.01 | −0.02/+0.03 | 2 × 10⁻⁴ | −0.06/+0.03 | 4 × 10⁻⁴ | −0.01/+0.01 | 5 × 10⁻⁵ | 6 × 10⁻⁴ | 1 × 10⁻⁵ | 1 × 10⁻³ | 0.73 |
| NHI−N | 0.56 ± 0.01 | −0.01/+0.01 | 2 × 10⁻⁴ | −0.01/+0.01 | 1 × 10⁻⁵ | −0.03/+0.02 | 4 × 10⁻⁴ | 9 × 10⁻³ | 2 × 10⁻³ | 8 × 10⁻³ | 0.11 |
| NHI+N | 0.68 ± 0.01 | −0.04/+0.02 | 3 × 10⁻⁴ | −0.05/+0.03 | 5 × 10⁻⁴ | −0.02/+0.01 | 1 × 10⁻⁴ | 3 × 10⁻⁴ | 1 × 10⁻⁴ | 3 × 10⁻³ | 0.44 |
| Protein−N | 62 ± 1.3 | −6.1/+5.9 | 0.8 | −5.2/+5.4 | 0.8 | −3.2/+2.3 | 0.4 | 1.7 | 1.3 | 2.1 | 0.74 |
| Protein+N | 85 ± 1.3 | −3.8/+4.9 | 0.7 | −6.0/+4.6 | 1.3 | −2.5/+2.5 | 0.2 | 5.5 | 0.5 | 3.0 | 0.77 |
| NUE | 16.7 ± 1.14 | −3.6/+3.9 | 3.81 | −5.7/+5.2 | 5.50 | −0.95/+1.20 | 0.80 | 10.13 | 4.97 | 18.56 | 0.60 |
| NUpE | 0.43 ± 0.03 | −0.03/+0.05 | 6 × 10⁻⁴ | −0.08/+0.09 | 1 × 10⁻³ | −0.01/+0.42 | 2 × 10⁻⁴ | 2 × 10⁻³ | 1 × 10⁻³ | 0.01 | 0.27 |
| NUtE | 41.8 ± 1.79 | −3.4/+2.9 | 5.5 | −2.7/+4.2 | 5.2 | −0.58/+0.60 | 1.3 | 59.3 | 7.8 | 201.7 | 0.11 |
| GU | 59.0 ± 2.2 | −7.8/+8.9 | 17.8 | −9.9/+7.4 | 16.0 | −3.2/+2.9 | 5.5 | 29.1 | 7.8 | 88.7 | 0.58 |
† σ2SSS, σ2NSSS, σ2SCA, σ2E, σ2SCA×E, σ2R, represent variance components for stiff-stalk lines, non-stiff-stalk lines, hybrid, environment, hybrid × environment interaction, and residual effects, respectively (Equation (9)); ‡ SE, standard error of the mean; Min./Max., Minimum and maximum observed values compared to the respective means.
Table 2.
Pearsons’s pairwise correlations between the GCA effects of the N-use traits of yield at low N (Yield−N), yield at high N (Yield+N), harvest index at low N (HI−N), harvest index at high N (HI+N), N harvest index at low N (NHI−N), N harvest index at high N (NHI+N), grain protein concentration at low N (Protein−N), grain protein concentration at high N (Protein+N), N-use efficiency (NUE), N-uptake efficiency (NUpE), N-utilization efficiency (NUtE), and genetic utilization (GU) for 263 single-cross maize hybrids grown from 2011 to 2015 under low and high N conditions (0 and 252 kg N ha−1, respectively).
| Yield−N | Yield+N | HI−N | HI+N | NHI−N | NHI+N | Protein−N | Protein+N | NUE | NUpE | NUtE | |
|---|---|---|---|---|---|---|---|---|---|---|---|
| Yield+N | 0.31 ** | - | - | - | - | - | - | - | - | - | - |
| HI−N | 0.63 *** | −0.33 ** | - | - | - | - | - | - | - | - | - |
| HI+N | 0.49 *** | NS | 0.77 *** | - | - | - | - | - | - | - | - |
| NHI−N | NS | NS | NS | NS | - | - | - | - | - | - | - |
| NHI+N | 0.51 *** | NS | 0.65 *** | 0.78 *** | NS | - | - | - | - | - | - |
| Protein−N | −0.38 *** | −0.22 * | NS | NS | NS | NS | - | - | - | - | - |
| Protein+N | NS | −0.39 *** | NS | NS | NS | 0.37 *** | 0.73 *** | - | - | - | - |
| NUE | −0.33 ** | 0.74 *** | −0.73 *** | −0.42 *** | NS | −0.35 *** | NS | −0.26 * | - | - | - |
| NUpE | NS | 0.64 *** | −0.59 *** | −0.43 *** | NS | −0.27 * | 0.22 * | NS | 0.77 *** | - | - |
| NUtE | −0.29 * | 0.44 *** | −0.46 *** | NS | NS | −0.21 * | NS | −0.47 *** | 0.66 *** | NS | - |
| GU | 0.67 *** | NS | 0.82 *** | 0.59 *** | NS | 0.50 *** | −0.51 *** | NS | −0.59 *** | −0.48 *** | −0.32 ** |
* Signifcant at p ≤ 0.05. ** Signifcant at p ≤ 0.01. *** Signifcant at p ≤ 0.001.
Table 3.
Yield at low and high N (Yield−N and Yield+N), harvest index at low and high N (HI−N and HI+N), N-harvest index at low and high N (NHI−N and NHI+N), grain protein concentration at low and high N (Protein−N and Protein+N), N-use efficiency (NUE), N-uptake efficiency (NUpE), N-utilization efficiency (NUtE), and genetic utilization (GU) based on parental inbred cluster groups for the stiff-stalk synthetic lines (SSS, Groups 1A–1E) and non-stiff-stalk synthetic lines (NSSS, Groups 2A–2E). A total of 263 maize hybrids were grown from 2011 to 2015 under low and high N conditions (0 and 252 kg N ha−1, respectively).
| Group | N † | Yield | HI | NHI | Grain Protein | NUE | NUpE | NUtE | GU | ||||
|---|---|---|---|---|---|---|---|---|---|---|---|---|---|
| Low N | High N | Low N | High N | Low N | High N | Low N | High N | ||||||
| Mg ha−1 | kg kg−1 | kggrainN kgplantN−1 | g kg−1 | kg kgNfert.−1 | kgplantN kgNfert−1 | kg kgplantN−1 | kg kgplantN−1 | ||||||
| SSS | |||||||||||||
| 1A | 6 | 4.57 | 9.15 | 0.33 | 0.47 | 0.57 | 0.67 | 86.4 | 68.3 | 18.29 | 0.44 | 42.90 | 53.26 |
| 1B | 6 | 5.05 | 8.82 | 0.39 | 0.48 | 0.57 | 0.69 | 85.0 | 64.1 | 15.37 | 0.42 | 41.10 | 64.41 |
| 1C | 7 | 5.24 | 9.13 | 0.38 | 0.48 | 0.57 | 0.69 | 85.9 | 66.1 | 15.45 | 0.42 | 40.51 | 60.55 |
| 1D | 6 | 4.93 | 9.29 | 0.37 | 0.49 | 0.57 | 0.69 | 82.2 | 64.8 | 17.90 | 0.42 | 43.42 | 60.44 |
| 1E | 11 | 4.88 | 9.05 | 0.36 | 0.48 | 0.57 | 0.68 | 86.1 | 67.1 | 16.87 | 0.43 | 41.47 | 57.56 |
| LSD ‡ p ≤ 0.05 | 0.29 | 0.50 | 0.01 | 0.01 | 0.01 | 0.02 | 2.6 | 2.3 | 1.39 | 0.02 | 1.30 | 1.40 | |
| NSSS | |||||||||||||
| 2A | 3 | 5.31 | 9.32 | 0.42 | 0.50 | 0.57 | 0.70 | 83.5 | 64.0 | 16.21 | 0.40 | 42.70 | 64.92 |
| 2B | 16 | 5.02 | 9.17 | 0.37 | 0.48 | 0.57 | 0.69 | 83.3 | 65.0 | 16.71 | 0.42 | 42.22 | 60.18 |
| 2C | 14 | 5.08 | 8.74 | 0.40 | 0.49 | 0.57 | 0.70 | 88.1 | 67.2 | 14.85 | 0.42 | 40.22 | 61.26 |
| 2D | 4 | 4.31 | 9.52 | 0.29 | 0.45 | 0.57 | 0.66 | 86.3 | 69.1 | 21.11 | 0.48 | 43.75 | 51.91 |
| 2E | 16 | 4.78 | 9.18 | 0.34 | 0.47 | 0.57 | 0.67 | 84.5 | 66.1 | 17.47 | 0.44 | 42.06 | 56.65 |
| LSD p ≤ 0.05 | 0.21 | 0.52 | 0.02 | 0.02 | 0.00 | 0.02 | 3.2 | 2.3 | 1.38 | 0.03 | 1.05 | 1.47 | |
† N, number of ex-PVP inbreds categorized within each cluster group. ‡ LSD, Least significant difference was estimated from different cluster groups within each phenotypic trait.
© 2018 by the authors. Licensee MDPI, Basel, Switzerland. This article is an open access article distributed under the terms and conditions of the Creative Commons Attribution (CC BY) license (http://creativecommons.org/licenses/by/4.0/).
Share and Cite
MDPI and ACS Style
Mastrodomenico, A.T.; Hendrix, C.C.; Below, F.E. Nitrogen Use Efficiency and the Genetic Variation of Maize Expired Plant Variety Protection Germplasm. Agriculture 2018, 8, 3. https://doi.org/10.3390/agriculture8010003
AMA Style
Mastrodomenico AT, Hendrix CC, Below FE. Nitrogen Use Efficiency and the Genetic Variation of Maize Expired Plant Variety Protection Germplasm. Agriculture. 2018; 8(1):3. https://doi.org/10.3390/agriculture8010003
Chicago/Turabian StyleMastrodomenico, Adriano T., C. Cole Hendrix, and Frederick E. Below. 2018. "Nitrogen Use Efficiency and the Genetic Variation of Maize Expired Plant Variety Protection Germplasm" Agriculture 8, no. 1: 3. https://doi.org/10.3390/agriculture8010003
Note that from the first issue of 2016, this journal uses article numbers instead of page numbers. See further details here.