Article

Vertical Distribution of Structural Components in Corn Stover

by
Jane M. F. Johnson
1,*,
Douglas L. Karlen
2,
Garold L. Gresham
3,†,
Keri B. Cantrell
4,†,
David W. Archer
5,†,
Brian J. Wienhold
6,†,
Gary E. Varvel
6,†,
David A. Laird
7,†,
John Baker
8,†,
Tyson E. Ochsner
9,†,
Jeff M. Novak
4,†,
Ardell D. Halvorson
10,†,
Francisco Arriaga
11,†,
David T. Lightle
12,†,
Amber Hoover
3,†,
Rachel Emerson
3,† and
Nancy W. Barbour
1,†
1
USDA-Agricultural Research Service, North Central Soil Conservation Research Laboratory, 803 Iowa Avenue, Morris, MN 56267, USA
2
USDA-Agricultural Research Service, National Laboratory for Agriculture and the Environment, 2110 University Boulevard, Ames, IA 50011, USA
3
US-Department of Energy, Idaho National Laboratory, P.O. Box 1625, Idaho Falls, ID 83415-2025, USA
4
USDA-Agricultural Research Service, Coastal Plains Research Center, 2611 W. Lucas St., Florence, SC 29501, USA
5
USDA-Agricultural Research Service, Northern Great Plains Research Laboratory, P.O. Box 459, Mandan, ND 58554, USA
6
USDA-Agricultural Research Service, Agroecosystem Management Research Unit, 117 Keim Hall, Lincoln, NE 68583, USA
7
Department of Agronomy, Iowa State University, 2104 Agronomy Hall, Ames, IA 50011, USA
8
USDA-Agricultural Research Service, Soil and Water Management Research Unit, 439 Borlaug Hall, 1991 Upper Buford Circle, St. Paul, MN 55108, USA
9
Department of Plant and Soil Sciences, Oklahoma State University, 368 Agricultural Hall, Stillwater, OK 74078-6028, USA
10
USDA-Agricultural Research Service, 2150 Centre Ave., Bldg. D. Suite 100, Fort Collins, CO 80526, USA
11
Department of Soil Science, University of Wisconsin, 1525 Observatory Drive, Madison, WI 53706-1299, USA
12
CPESC #651, 105 Meadow Lane, Labadie, MO 63055, USA
*
Author to whom correspondence should be addressed.
These authors contributed equally to this work.
Agriculture 2014, 4(4), 274-287; https://doi.org/10.3390/agriculture4040274
Submission received: 26 September 2014 / Revised: 31 October 2014 / Accepted: 10 November 2014 / Published: 17 November 2014

Abstract

:
In the United States, corn (Zea mays L.) stover has been targeted for second generation fuel production and other bio-products. Our objective was to characterize sugar and structural composition as a function of vertical distribution of corn stover (leaves and stalk) that was sampled at physiological maturity and about three weeks later from multiple USA locations. A small subset of samples was assessed for thermochemical composition. Concentrations of lignin, glucan, and xylan were about 10% greater at grain harvest than at physiological maturity, but harvestable biomass was about 25% less due to stalk breakage. Gross heating density above the ear averaged 16.3 ± 0.40 MJ kg−1, but with an alkalinity measure of 0.83 g MJ−1, slagging is likely to occur during gasification. Assuming a stover harvest height of 10 cm, the estimated ethanol yield would be >2500 L ha−1, but it would be only 1000 L ha−1 if stover harvest was restricted to the material from above the primary ear. Vertical composition of corn stover is relatively uniform; thus, decision on cutting height may be driven by agronomic, economic and environmental considerations.

1. Introduction

In much of the United States, corn (Zea mays L.) is the most commonly grown and highest yielding crop. As grain yields per unit area have risen, there have been corresponding increases in the amount of non-grain biomass. The first use of this material must be to protect the soil from erosion and provide the raw material to build soil organic matter [1]. However, due to the dramatic increases in yield (i.e., >10 Mg ha−1), the sheer mass of non-grain biomass has created “residue management” problems for some producers. In response, the non-grain, aboveground corn biomass, referred to as stover, which includes leaves, husks, cobs and stalks, has been targeted as feedstock for second generation biofuel or bio-product production because of its relative abundance. In the USA, two companies are building commercial-scale cellulosic ethanol plants in conjunction with existing corn grain ethanol plants: (1) POET-DSM Advanced Biofuels, LLC; http://poetdsm.com/pr/construction-remains-on-schedule-for-project-liberty, near Emmetsburg, Iowa; and (2) DuPont Cellulosic Ethanol; http://biofuels.dupont.com/cellulosic-ethanol, near Nevada, Iowa. Both plants anticipate using just a fraction of the biomass produced within a 64 km (40-mile) radius to produce between 76 to 95 million L (20 to 25-million gallons) of ethanol per year.
Accurate estimates of stover composition, specifically the C5 and C6 polymer (i.e., cellulose and hemicellulose) concentrations are important because they provide the substrate for ethanol conversion. Knowing other constituents is important because the residual material following cellulosic fermentation can be further utilized for lipid synthesis [2] or for co-production of electricity [3]. For the thermochemical processes, including institutional-scale gasification [4], the heating value of stover is of more interest than its polymer composition. Information regarding stover composition is also important because in addition to potential industrial uses, crop residues also provide the raw material for building soil organic matter, with differential rates of decomposition being related to stover chemical composition [5,6].
A variety of approaches have been used to determine composition characteristics of corn stover with regard to ethanol production, energy content or digestibility for feedstock or decomposition in soil. Traditionally, digestibility was assessed for neutral-detergent and acid-detergent fractions [7]. Lorenz et al. [8] evaluated 49 grain and silage cultivars for glucan, xylan, lignin, hemicellulose, cellulose, and acid detergent lignin in stover and cob material using comparable wet chemical methods. Others compared the composition among specific cell tissue types (collenchyma, sclerenchyma and parenchyma) [9], specific fractions (i.e., leaf blade, sheaths and stems) [10], among organs (i.e., leaves, stems and roots) [6] or even coarse fractions (above ear, below ear and cob) [11] within a cultivar. The wet-chemistry methods, while long-used, are labor and time-intensive. Near-Infrared Spectroscopy (NIR), once calibrated, provides a high throughput alternative for compositional analysis facilitating comparison among a large number of samples, which has been applied in the characterization of lignocellulosic biomass (e.g., [12,13,14]).
This study utilized stover samples (leaves and stems) previously collected to characterize vertical biomass quantity and nutrient distribution [15,16]. The sampling scheme was intended to ascertain general relationships among stover parameters, but was not designed nor intended to examine causal relationships associated with location, soil resource, management practices, or hybrid selection. Previously we reported height distribution of corn stover mass and the relationship between harvest height and mass of stover returned to the field [16]. Furthermore, we quantified numerous nutrient (e.g., N, P, K, S, Mg, Ca, Fe, Mn, Zn, B, Cu) concentrations and potential removal as a function of cutting height and physiological maturity [15]. Our objective is to present FT-NIR characterization information as a function of vertical distribution at physiological maturity and grain harvest. In addition, estimates of potential ethanol yield as a function of cutting height will be estimated based on data from five United States locations.

2. Results and Discussion

Corn plants were sampled in 10-cm increments from the soil surface to the primary ear at both physiological maturity and grain harvest at five locations (Table 1). Due to hybrid, weather, and other management factors, ear height varied from 75 to 110 cm [16]. Since the original sampling design was intended to determine the effects of different harvest heights, fewer locations contributed plant tissue from increments above 70 cm than from below that arbitrary height. Only the Fort Collins and Lincoln locations had an ear height >100 cm, resulting in more 10-cm increments.
Table 1. Ancillary and descriptive data for the five U.S. locations from which corn plants were collected and analyzed for compositional analysis. Additional information was previously published [15,16].
LocationSoil and SeriesHybrid/Relative MaturityAverage Ear Height a (cm)Average Grain Yield a (Dry Mg·ha−1)Growth Stage Sampled
Physiological MaturityGrain Harvest
Fort Collins, COFort Collins clay loamPioneer 39B77BtLL/88 day11010.62YesYes
Lincoln, NEAksarben silty clay loamDeKalb 61-69/110 day10811.74YesYes
Mandan, NDTemvik-Wilton silt loamLegend LR9385RR/85 day776.55YesYes
Legend LR9779RR/77 day756.55YesYes
Morris, MNBarnes clay loamCropland 296TS MF-B7/92 day938.70YesYes
St. Paul, MNWaukegan silt loamDekalb DKC 50-20/100 day988.75YesYes
a [15].

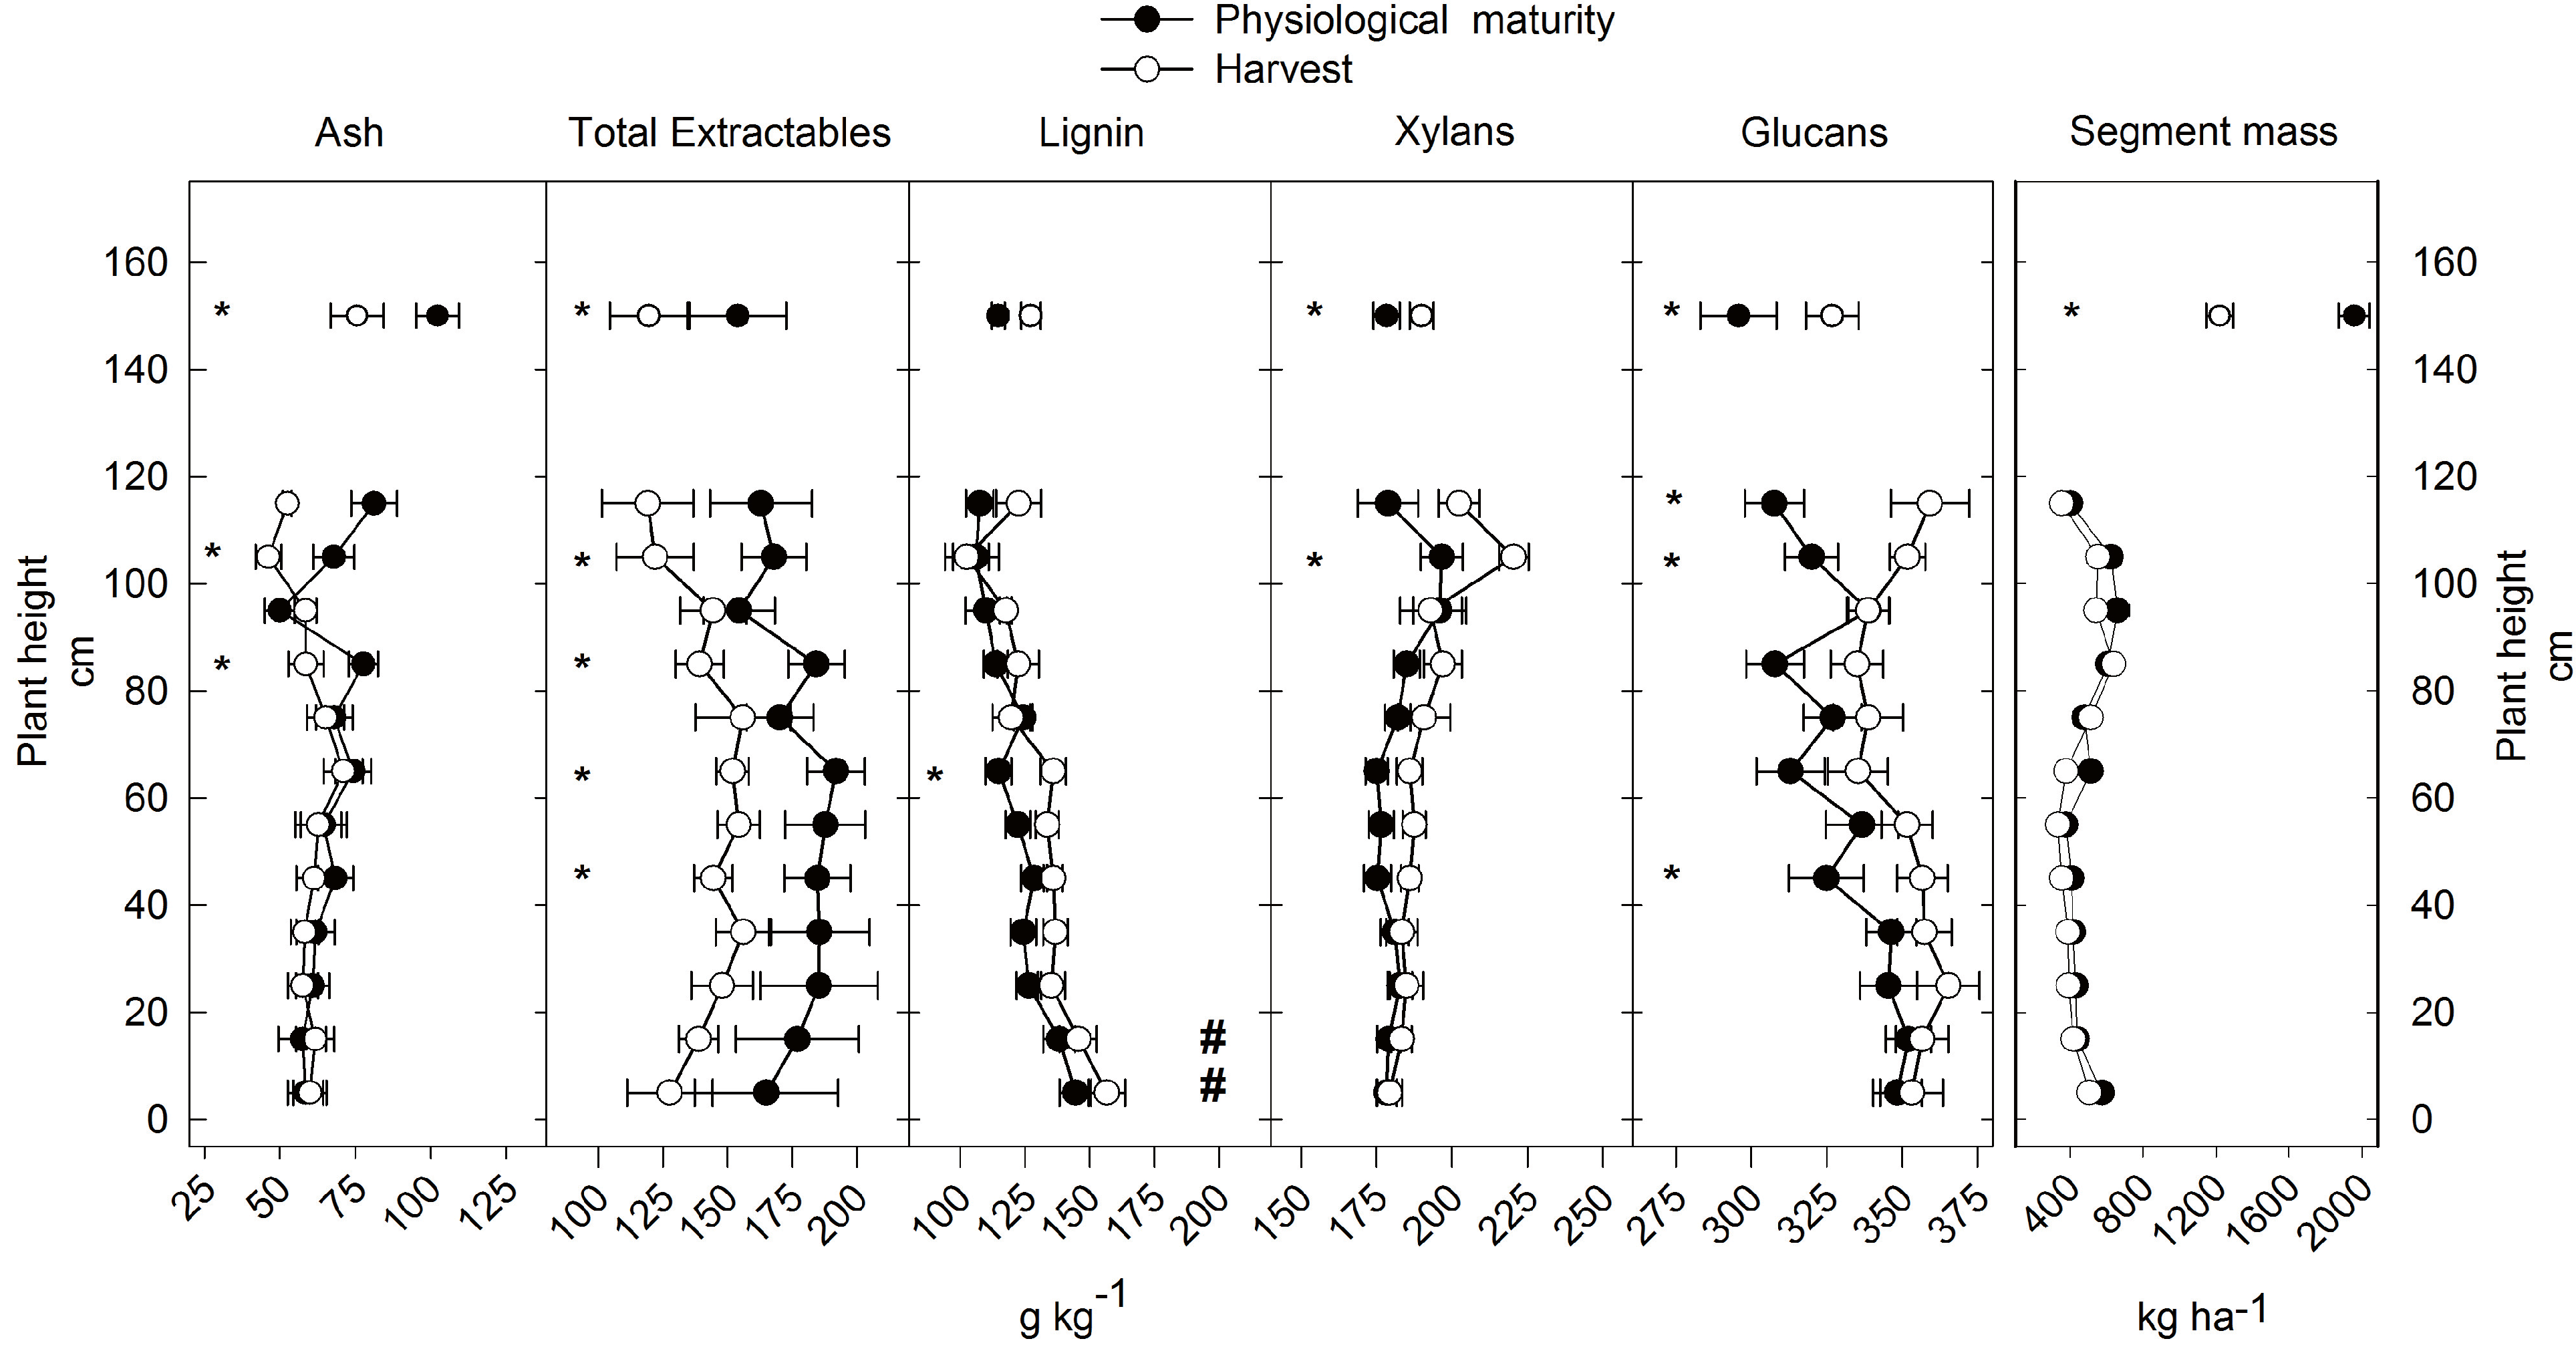
2.1. Corn Stover Composition

Ash and plant constituents within the 10-cm incremental samples and those representing tissue from above the primary ear collected at physiological maturity and grain harvest from the five locations are shown in Figure 1. Ash reflects mineral constituents within the plant tissue and soil contaminates except at three sample increments, as content was comparable at both sample dates, with overall averages of (70 g·kg−1) at physiological maturity and (62 g·kg−1) at grain harvest. Above the ear, ash content declined between sampling at physiological maturity compared to sampling at grain harvest, which likely was due to translocation or leaching of potassium and nitrate as the plants senesced.
For several increments, total extractables decreased between physiological maturity and grain harvest (Figure 1). The plant average for total extractable declined from 169 g·kg−1 at physiological maturity to 141 g·kg−1. Presumably, this is because total extractables include soluble sugars (e.g., glucose, sucrose) related to active photosynthesis. Vegetative plant organs would still be photosynthetically active at physiological maturity, but not at grain harvest. Comparison by segment lignin concentration only differed at about the 60–70 interval between the two harvest dates. Lignin concentration in the bottom two segments was significantly greater than the rest of the segments. Averaged over all segment lignin concentration was 132 g·kg−1 at grain harvest compared to 122 g·kg−1 physiological maturity. Xylan concentrations, which are five-carbon sugars, changed very little (4%) between the sample times with only two segments showing significant differences. Glucan concentration was greater at several intervals at grain harvest compared to physiological maturity. The overall average glucan concentration at grain harvest was 6% greater compare to sampling at physiological maturity. Segment mass was similar along the length of the plant and between sampling date. Wilhelm et al. [16] noted that the decline in above the ear biomass was caused by upper most portions breaking off the plant. Breakage impacts the amount and composition of harvestable stover.
Compositional characteristics reported in our current study (Figure 1) are similar to those reported by Johnson et al. [6] who used wet-lab methods to determine composition distribution of corn leaves and stems collected at physiological maturity. Soluble sugars (sucrose, glucose, and fructose) plus starch concentrations were about 35 g·kg−1 in leaves and 130 g·kg−1 in stems, which is slightly lower than the FT-NIR estimate of total extractables, which ranged from 155 to 192 g·kg−1 (Figure 1); the FT-NIR total extractable value also includes ethanol soluble constituents such as fats, waxes and chlorophyll. Acid soluble plus acid insoluble lignin was 98 g·kg−1 for leaves and 114 g·kg−1 for stems for wet chemical analysis, whereas total lignin predicted by FT-NIR among averaged about 120 g·kg−1 (Figure 1). Similar FT-NIR lignin values (116 g·kg−1) were reported among 49 corn cultivars [8], but values reported for corn grown in the southeastern USA were lower, ranging from 83 to 89 g·kg−1 [17]. Xylan and glucan concentrations (177 and 314 g·kg−1, respectively) shown in Figure 1 were similar to those reported by Lorenz et al. [8]. The similarity among FT-NIR results reported in this paper to wet-lab and other FT-NIR studies suggest that curves used by the National Renewable Energy Laboratory who provided this service, provide a reasonable approximation for these stover samples.
Figure 1. Corn stover composition (g·kg−1) determined by near-infra-red spectroscopy (NIR) and dry mass yield (kg·ha−1) within various 10-cm increments below the primary ear. Constituents in plant material above the ear are arbitrarily plotted at 150 cm rather than reflecting values at that plant height. Means averaged among five locations with the bars indicating one standard error (standard errors bars for segment mass obscured by symbol). The * symbol indicates significant differences between sample dates and the # symbol indicates differences in sample increment. p ≤ 0.05.
Agriculture 04 00274 g001
The most desirable composition of corn stover depends upon its targeted use. For example, if its use is for ethanol production, non-structural and structural carbohydrates that can be converted to fermentable sugars are the most important constituents. We estimated ethanol yield (L·Mg−1) using the US-DOE theoretical ethanol yield calculator [18]. Briefly, this conversion assumes “(1.11 units C6 sugar/unit of polymeric sugar or 1.136 units of C5 sugar/unit of C5 polymeric sugar) × (0.51 units of ethanol/units of sugar) and the specific gravity of ethanol at 20 °C.” This conversion assumes 100% efficiency, thus overestimates actual yield. Based on a mean carbohydrate (glucan + xylan) concentration above the ear at grain harvest (517 g·kg−1) would result in approximately 315 L·ethanol·Mg−1, which is within the range reported by Lorenz et al. [8].

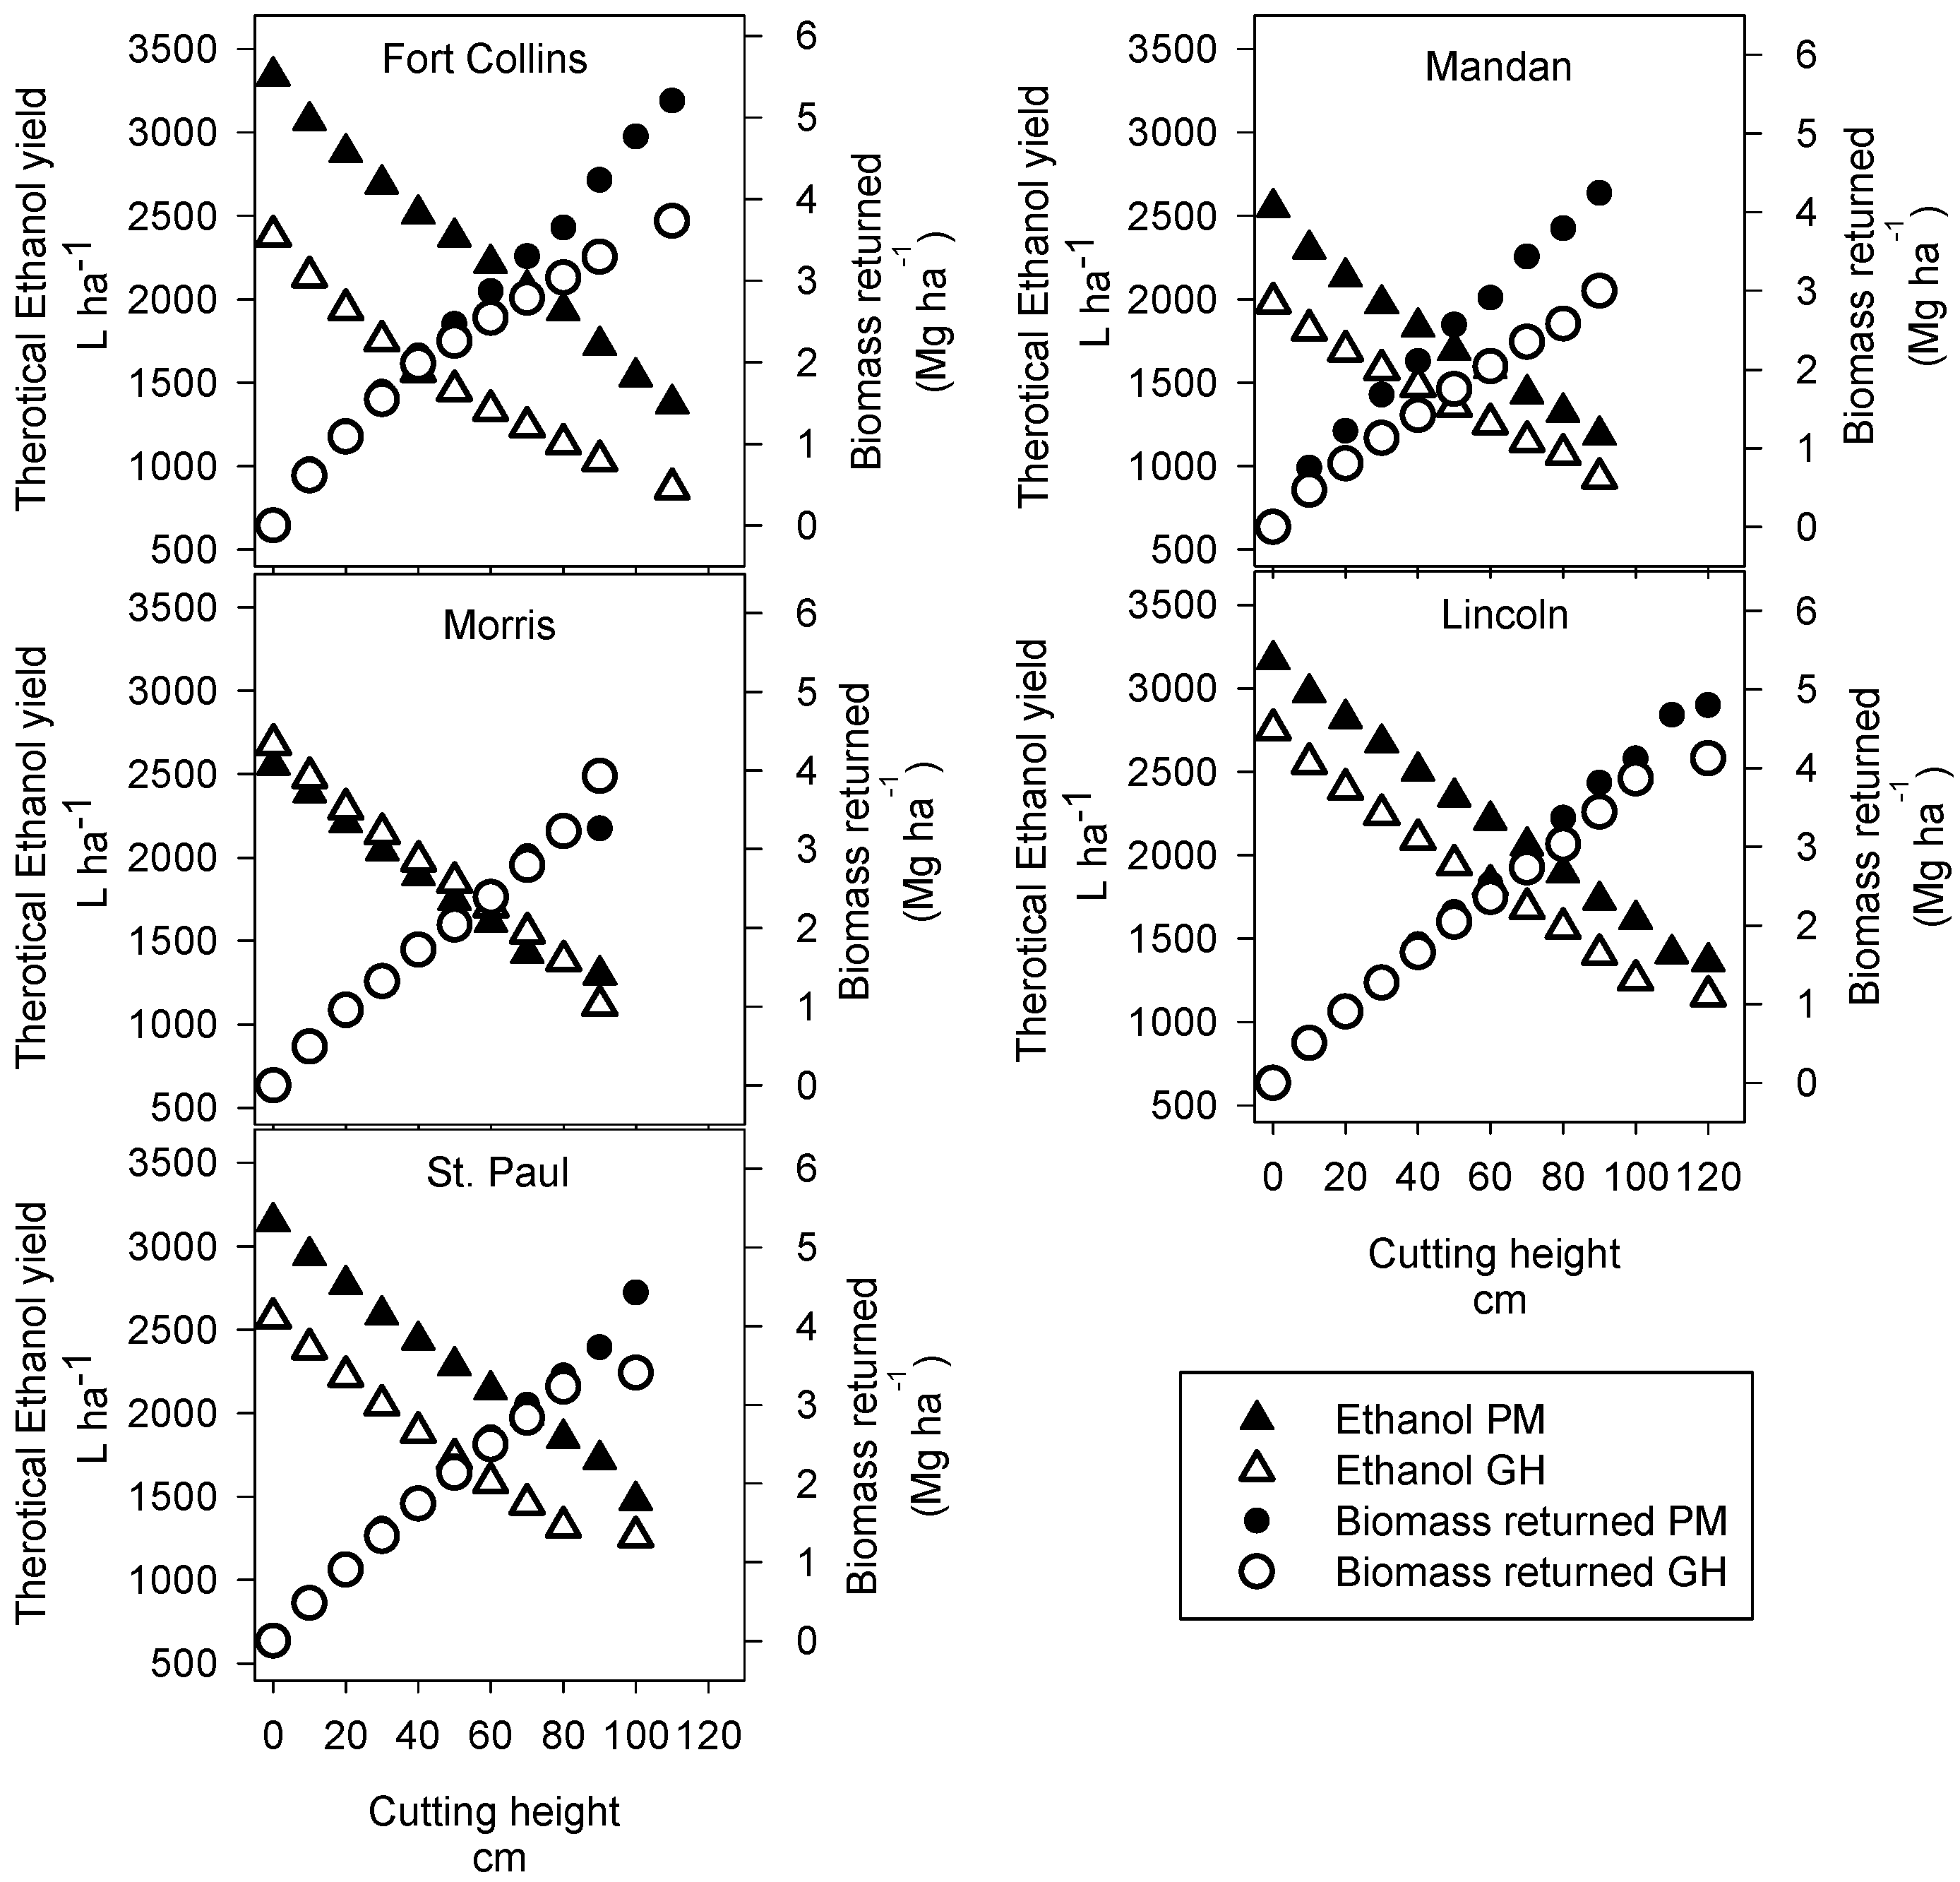
2.2. Theoretical Ethanol Yield

Potential ethanol yield is a function of mass and sugar concentration. The theoretical ethanol yield for individual segments was similar (data not shown). Stover mass produce is dependent upon location, hybrid, and growing season conditions. For illustrative purposes, the incremental dry biomass (Mg·ha−1) and theoretical ethanol-yield (L·ha−1) as a function of cutting height, was calculated for each of the five locations (Figure 2). Assuming all mechanically feasible stover were harvested (i.e., a cutting height of ~10 cm) and converted to ethanol yields were 2500 to nearly 3500 L·ha−1, which is of course a high estimate that neglects conversion efficiencies, but does allow relative comparisons. As expected, ethanol yield per area decreased as the cutting height is increased since it changed the mass harvested.
The biomass below the cutting height is assumed to be returned to the soil, but no attempt was made to quantify the amount remaining at the various sites after collecting the plant samples. This means a nominal amount of residue that was actually returned is not accounted for in our mass returned estimates. Furthermore, the potential contribution from cobs to either pool is omitted because they were not included in the FT-NIR analysis. The amount of harvestable biomass declined between physiological maturity and grain harvest due to stalk breakage or leaf loss [16]. Even if less biomass is harvested because of stalk and leaf loss, it is extremely unlikely that harvest would occur earlier since the gain in harvested biomass would not offset the cost incurred for drying the grain and/or stover.
The goal for sustainable second generation biofuel and/or bio-product industries is to harvest enough stover for an economical return without compromising soil health. The amount of stover returned represents the mass available for maintaining soil organic carbon and protecting the soil against the erosive forces of wind and water. Recently, 6.4 ± 2 Mg dry stover ha−1 (n = 34) was calculated to be the average minimum rate of stover including cob mass return required to maintain soil organic carbon [19]. As noted by Johnson et al. [19], this rate is useful for discussion but is not valid for making field level recommendations, due to soil, climate and other environmental considerations. If we assume 0.5 Mg ha−1 is returned because of mechanical limitations and that harvestable biomass lost between physiological maturity and grain harvest remains in the field, the amount of biomass returned for most of the locations in this study is less than 6 Mg ha−1 if the stover above the ear is harvested in a one-pass operation. Thus, based on soil carbon criteria, it is questionable if stover harvest can be recommended for any of these study locations. However, for the yields obtained in Iowa, we can assume an average theoretical ethanol yield of 315 L per·Mg−1 and a sustainable supply of 5 Mg ha−1 (2.2 tons acre−1) of stover from above the ear (excluding cobs) would produce 1575 L ethanol·ha−1 and still return >6 Mg stover ha−1 [16]. This provides a simplistic estimate is consistent with results from process-based models [20,21]. Although, not included in this example, cobs likely would be harvested because they have fewer mineral nutrients and provide a favorable feedstock for both fermentation and thermochemical conversion [15,22]. The high yield potential in Iowa makes it feasible to produce biofuels or bio products and to maintain soil organic matter. Potential corn yield is a contributing factor to why two of the first commercial ethanol facilities in the USA are being built in Iowa (http://poetdsm.com/pr/construction-remains-on-schedule-for-project-liberty; http://biofuels.dupont.com/cellulosic-ethanol); since it will allow them to meet their economic and environmental sustainability goals.
Commercial use of corn stover can be enhanced by increasing overall yield and targeted trait selection to improve feedstock quality. Comparisons among corn hybrids suggest that genetic variation exists, which could be tapped for increasing ethanol yield per unit area for example by altering lignin concentration [8]. The crop biomass or high lignin by-product of ethanol can be used as feedstock for thermochemical energy conversion into bio-oils, syngas, or electricity.
Figure 2. For illustrative proposes, theoretical yield (L·ha−1) at five locations biomass harvested assuming different cutting heights and the corresponding biomass retained in the field reported by Wilhelm et al. [16], excluding cob mass. Maximum cutting height varies among location based on average ear height at physiological maturity (PM) or grain harvest (GH) reported by Johnson et al. [15].
Agriculture 04 00274 g002

2.3. Thermochemical Feedstock Qualities

Thermochemical platforms include combustion, gasification, and pyrolysis. Desired feedstock qualities for these platforms are related to lignin concentration, volatile C, fixed C, ultimate elemental analysis, and heating density (HHV). Gross heating density did not vary appreciably among segments (data not shown) averaging 16.5 ± 0.25 MJ·kg−1 above the ear and similarly 16.9 ± 0.10 MJ·kg−1 below the ear (Table 2). Demirbas [23] proposed using proximate (Equation 1) or ultimate data (Equation 2) for calculating HHV.
HHV = 0.196 × percent fixed C + 14.119
HHV = (33.5[C%] + 142.3 [H%] − 15.4 [O%] − 14.5[N%]) × 0.01
Using our proximate data for above the ear (Table 2) predicted an HHV of 17.1 MJ·kg−1; whereas, estimating HHV from ultimate data was 16.0 MJ·kg−1. Estimates of HHV based on ultimate data better predicted the experimental HHV of our stover samples. The measured HHV values based on calorimeter analysis of our stover samples were about 10% lower than those reported for corn [23,24,25] or for perennial grasses [26].
Table 2. Descriptive statistics (mean and standard error) based on proximate, ultimate, and calorimeter analysis of a small subset of individual incremental stover samples, for above ear n = 22, below n = 76 average among locations described in Table 1.
ProximateUltimateCalorimeter
Volatile matterAshFixed CHCNOSHHV a
mg·kg−1MJ·kg−1
Above the Ear727 ± 6.971 ± 6.6150 ± 2.460 ± 0.32425 ± 2.87.67 ± 0.48435 ± 4.50.54 ± 0.0116.54 ± 0.25
Below the Ear728 ± 3.367 ± 2.1151 ± 2.061 ± 0.16430 ± 1.04.81 ± 0.25437 ± 1.50.37 ±0.0316.87 ± 0.10
a Higher heating value denotes HHV.
Energy yield is a function of HHV and biomass harvested. The HHV was relatively homogeneous relative to stover biomass; therefore, energy yield is proportional to the amount biomass harvested. Again using Mandan and Ames, biomass yield can vary by more than two-fold (<2 to 5 Mg·ha−1) [16] so assuming the 16.3 MJ·kg−1 HHV, corresponding energy yields can range from 32,600 to 81,500 MJ·ha−1. Energy density and energy yield are just two aspect of feedstock quality.
Other quality aspects include ash and mineral concentrations, which may be critical for other platforms such as gasification. For example, several cellulosic feedstock materials (e.g., corn stover, cobs, perennial grasses, and wood) were tested in community-scale bioenergy-gasification system located on the University of Minnesota Morris campus with a range of alkalinity (g·MJ−1) (<0.11 cobs, 0.32 perennial grasses to > 0.43 stover) [27]. Based on trials the University of Minnesota Morris, feedstock with alkalinity below 0.32 g·MJ−1 did not result in undesirable slagging, which was problematic for alkalinity values >0.43. Based on the on the K, Ca and Mg concentrations above (8.66, 2.9 and 2.0 g·kg−1, respectively) and below the ear (10.7, l.51 and 3.0 g·kg−1) at grain harvest [15], and HHV of 16.5 MJ kg−1 and 16.9 MJ·kg−1 above and below the ear, respectively, (Table 2) alkalinity ranged from 0.83 to 0.90 (g·MJ−1). Feedstock other than stover with lower risk for slagging is preferred for gasification. Indeed using cob material rather than stover is recommended from the standpoint of improved feedstock quality and of minimizing nutrient removal [15,28].

3. Experimental Section

In 2007, samples were collected from within existing corn studies at five locations (Fort Collins, CO, USA; Lincoln, NE, USA; Mandan, ND, USA; Morris, MN, USA; and St. Paul, MN, USA) [15,16] (Table 1). Each of these locations took stover samples at physiological maturity and about three-weeks later just before grain harvest. At each of these locations samples were collected within a 1.0 m2 area from two positions within a field or two plots resulting in within location replication. Briefly, corn plants were hand cut at the soil surface and subdivided into 10-cm increments to one 10-cm interval above the primary grain-containing ear. Each increments included stalk and any leaf material that originated within that portion of the stalk. The ears were removed, handled and dried separately prior to removing grain from the cob. Plant material from above the ear was kept as one subsample (above-ear). The 10-cm intervals from all plants collected with a given 1-m2 area were aggregated by segment. For example, the bottom 10-cm portion of six to ten plants represented one aggregated segment. All plant samples were oven-dried at 60 °C to a constant weight. Cob mass was determined after shelling the grain from each ear. However, compositional analysis excluded cobs.

3.1. Compositional Analysis—Fourier Transform Near-Infrared (FT-NIR) Spectroscopy

Stover samples were sent to the Biomass Compositional Analysis Laboratory, located within DOE’s National Renewable Energy Laboratory (NREL) in Golden, CO for analysis. Corn stover used for these analyses had a geometric mean diameter width (the particle size at 50% cumulative distribution) that was determined to be 0.456 mm with a geometric mean diameter standard deviation Equation (3) of 0.402 mm. The sphericity−1 ratio (a dimensionless measure of particle surface irregularities) Equation (4) and the aspect ratio (dimensionless value expressing the width to the length of the ellipsoid) Equation (5) was determined to be 1.990 (SD = 0.080) and 0.494 (SD = 0.001), respectively.
s g w = 1 2 ( Q 3 84 % Q 3 16 % )
S H P T = 4 π a p 2
Aspect Ratio = X c   m i n X F e   m a x
These characteristics were consistent with those associated with the 2007 corn stover standard, thus providing confidence in the NIR analysis (as particle size is a cause for variation in NIR analysis). Biomass Compositional Analysis Laboratory provided compositional analysis values predicted using (FT-NIR) spectroscopy partial-least squares (PLS) multivariate calibration models developed for corn stover. Their models were calibrated with compositional data from standard wet chemical procedures described in Sluiter et al. [29], and information on FT-NIR models developed at NREL is provided in Wolfrum and Sluiter [30]. Briefly, the NREL protocol included duplicate biomass sampled milled pass through a 2-mm sieve and dried at 40 °C. An Antaris II FT-NIR with an auto-sampler attachment and OMNIC software (Thermo Scientific, Waltham, MA, USA) was used to scan each duplicate sample 128 times and average the 128 scans into one spectrum. As recommended [31,32], sample predictions that had an uncertainty value generated by the Unscrambler software two times the RMSEC of the model were not used in this study. PLS models were developed in Unscrambler software (Camo Software Inc., Woodbridge, NJ, USA) to predict whole ash, total extractable (H2O + ethanol) components, lignin, glucan, and xylan on a percent dry weight basis. The models are not summative mass closure models.

3.2. Thermochemical Properties

A subset of 22 sample from above ear and 76 samples from below the ear were processed by the Idaho National Laboratory (INL) to determine thermochemical properties and energy density. Typically, six to ten, 10-cm segment samples were available to represent plants from the soil surface to the primary ear at each sampling date (Table 1) [16]. Samples received at INL were ground with a Retsch ZM 200 Ultra Centrifugal Mill (Retsch, Haan, Germany) to pass through a 0.2 mm screen and homogenized prior to conducting proximate, ultimate, and calorific analyses.
For proximate analysis (i.e., moisture, volatile, ash, and fixed carbon content), a LECO TGA701 Thermogravimetric Analyzer (St. Joseph, MI, USA) following ASTM D 5142-09 [33] was used. Briefly, samples were heated to 107 °C until a constant mass was reached under a 10 L·min−1 nitrogen flow to measure the moisture content. The temperature was then ramped to 950 °C for 7 min to determine volatiles. After cooling to 600 °C, the gas was switched to a flow of 3.5 L·min−1 of oxygen and then temperature was increased to 750 °C until a constant mass was reached for an ash measurement. Fixed carbon was determined by the weight loss between the volatile and ash measurements. Ultimate analysis, determining elemental C, H, N, and S concentrations, was performed using a LECO TruSpec CHN and S add-on module (St. Joseph, MI, USA) following ASTM D 5373-10 [34] and ASTM D 4239-10 [35], respectively. Oxygen was determined by difference [34]. Energy density or higher heating value was determined by a LECO AC600 Semi-Automatic Isoperibol Calorimeter (St. Joseph, MI, USA) following ASTM D5865-10 [36]. Measurements were reported on a dry mass basis.

3.3. Statistical Analysis

The study was not designed nor intended to be used for examining differences associated with location, soil resource, management practices and/or hybrid selection [15,16]. Rather the study was designed to provide information on vertical distribution of FT-NIR predicted concentrations of lignin, glucan, xylan, and total water and ethanol extractable solutes between plants harvested at physiological maturity and/or just prior to combine harvest at locations throughout the USA [15]. Each location provided materials from two sampling areas with a given field or plot scale replicate. In some instances plant samples from both replications (e.g., Mandan) were pooled to provide enough material for analyses. Comparison between sampling dates by segment interval was made using Proc GLM within SAS software, version 9.2 [37]. A comparison was made between the two growth stages for all segments using a Proc GLM. Comparison among the segments was made by harvest stage using Proc Mixed-with segment as a fixed repeated measure, with location and replication as random variables. For thermochemical properties, the dataset did not provide the rigor necessary to compare between sampling dates, only descriptive statistics are provided. Significance is reported when p ≤ 0.05.

4. Summary and Conclusions

Stover samples from five locations in the United States were used to assess the vertical distribution of compositional components in corn. Theoretical energy yield, either as L·ha−1 of ethanol or MJ·ha−1, was calculated as a function of amount of biomass available for harvest and energy density. Energy density for ethanol production, above and below the ear, was more variable than HHV. None-the-less, in both instances the primary determinate of energy yield is biomass production. Use of stover for gasification is hampered by the high Ca, Mg and K concentrations. However, returning stover to the soil provides the raw materials for sustaining soil organic matter, recycling nutrients and providing surface protection against erosive forces such as wind and water. Except for those areas where corn yields have become sufficiently high that residue management is a serious agronomic hindrance, the best use of stover may still be to return the material to the soil. This information can aid producers and industry in meeting sustainability goals.
Vertical composition of corn stover is relatively uniform; thus, decisions on cutting height may be driven by agronomic, economic and soil sustainability considerations.

Acknowledgments

We thank Beth Burmeister for proofreading, but take full responsibility for any errors. We acknowledge the efforts of students and technical staff for samplings and processing plant tissue samples. This study is a contribution of the USDA Agricultural Research Service Renewable Energy Assessment Project (now known as the Resilient Economic Agricultural Practices), funded in part by the Department of Energy “Office of Biomass Products” (now known as the Biomass Energy Technology Office) through a Sun Grant Initiative—award number DE-FC36-05GO85041.
Footnote: The use of trade, firm, or corporation names in this publication is for the information and convenience of the reader. Such use does not constitute an official endorsement or approval by the United States Department of Agriculture or the Agricultural Research Service of any product or service to the exclusion of others that may be suitable. USDA-ARS is an equal opportunity provider and employer.

Author Contributions

Wally W. Wilhelm (deceased) designed the original multi-state and plant sampling design. After Wilhelm’s untimely death in 2008; coordination, design and analysis of the data was shared by Jane Johnson and Douglas Karlen. Amber Hoover, Rachel Emerson and Garold Gresham conducted the thermochemical analysis and coordinated the FT-NIRS services from the NREL. All other authors contributed to collecting and providing samples from the various sites, contributed to the writing and provided editorial suggestions.

Conflicts of Interest

The authors declare no conflict of interest.

References

  1. Johnson, J.M.F.; Coleman, M.D.; Gesch, R.W.; Jaradat, A.A.; Mitchell, R.; Reicosky, D.C.; Wilhelm, W.W. Biomass-bioenergy crops in the united states: A changing paradigm. Amer J. Plant Sci. Biotechnol. 2007, 1, 1–28. [Google Scholar]
  2. Xie, H.; Shen, H.; Gong, Z.; Wang, Q.; Zhao, Z.K.; Bai, F. Enzymatic hydrolysates of corn stover pretreated by a n-methylpyrrolidone-ionic liquid solution for microbial lipid production. Green Chem. 2012, 14, 1202–1210. [Google Scholar] [CrossRef]
  3. Spatari, S.; Bagley, D.M.; MacLean, H.L. Life cycle evaluation of emerging lignocellulosic ethanol conversion technologies. Bioresour. Technol. 2010, 101, 654–667. [Google Scholar] [CrossRef] [PubMed]
  4. Archer, D.; Johnson, J. Evaluating local crop residue biomass supply: Economic and environmental impacts. BioEnergy Res. 2012, 5, 699–712. [Google Scholar] [CrossRef]
  5. Jaradat, A.A.; Johnson, J.M.-F.; Weyers, S.L.; Barbour, N.W. Determinants and prediction of carbon/nitrogen ratio in five diverse crop plants. Commun. Soil Sci. Plant Anal. 2009, 40, 2688–2711. [Google Scholar] [CrossRef]
  6. Johnson, J.M.F.; Barbour, N.W.; Weyers, S.L. Chemical composition of crop biomass impacts its decomposition. Soil Sci. Soc. Am. J. 2007, 71, 155–162. [Google Scholar] [CrossRef]
  7. Van Soest, P.J.; Wine, R.H. Determination of lignin and cellulose in acid-detergent fiber with permanganate. J. Off. Assoc. Anal. Chem. 1968, 51, 780–785. [Google Scholar]
  8. Lorenz, A.J.; Coors, J.G.; de Leon, N.; Wolfrum, E.J.; Hames, B.R.; Sluiter, A.D.; Weimer, P.J. Characterization, genetic variation, and combining ability of maize traits relevant to the production of cellulosic ethanol. Crop. Sci. 2009, 49, 85–98. [Google Scholar] [CrossRef]
  9. Bootsma, J.; Shanks, B. Hydrolysis characteristics of tissue fractions resulting from mechanical separation of corn stover. Appl. Biochem. Biotechnol. 2005, 125, 27–39. [Google Scholar] [CrossRef] [PubMed]
  10. Akin, D.; Morrison, W.H., III; Rigsby, L.; Barton, F., II; Himmelsbach, D.; Hicks, K. Corn stover fractions and bioenergy. Appl. Biochem. Biotechnol. 2006, 129, 104–116. [Google Scholar] [CrossRef]
  11. Hoskinson, R.L.; Karlen, D.L.; Birrell, S.J.; Radtke, C.W.; Wilhelm, W.W. Engineering, nutrient removal, and feedstock conversion evaluations of four corn stover harvest scenarios. Biomass Bioenerg. 2007, 31, 126–136. [Google Scholar] [CrossRef]
  12. Monono, E.M.; Haagenson, D.M.; Pryor, S.W. Developing and evaluating NIR calibration models for multi-species herbaceous perennials. Ind. Biotechnol. 2012, 8, 285–292. [Google Scholar] [CrossRef]
  13. Hou, S.; Li, L. Rapid characterization of woody biomass digestibility and chemical composition using near-infrared spectroscopy. J. Integr. Plant. Biol. 2011, 53, 166–175. [Google Scholar] [CrossRef] [PubMed]
  14. Liu, L.P.; Ye, X.P.; Womac, A.R.; Sokhansanj, S. Variability of biomass chemical composition and rapid analysis using FT-NIR techniques. Carbohydr. Polym. 2010, 81, 820–829. [Google Scholar] [CrossRef]
  15. Johnson, J.M.F.; Wilhelm, W.W.; Karlen, D.L.; Archer, D.W.; Wienhold, B.; Lightle, D.; Laird, D.A.; Baker, J.; Ochsner, T.E.; Novak, J.M.; et al. Nutrient removal as a function of corn stover cutting height and cob harvest. BioEnergy Res. 2010, 3, 342–352. [Google Scholar] [CrossRef]
  16. Wilhelm, W.W.; Johnson, J.M.F.; Lightle, D.T.; Karlen, D.L.; Novak, J.M.; Barbour, N.W.; Laird, D.A.; Baker, J.; Ochsner, T.E.; Halvorson, A.D.; et al. Vertical distribution of corn stover dry mass grown at several US locations. BioEnergy Res. 2011, 4, 11–21. [Google Scholar] [CrossRef]
  17. Mourtzinis, S.; Cantrell, K.B.; Arriaga, F.J.; Balkcom, K.S.; Novak, J.M.; Frederick, J.R.; Karlen, D.L. Distribution of structural carbohydrates in corn plants across the Southeastern USA. BioEnergy Res. 2014, 7, 551–558. [Google Scholar] [CrossRef]
  18. U.S. Department of Energy Bioenergy Technologies Office. Theoretical Ethanol Yield Calculator. Available online: http://www1.eere.energy.gov/bioenergy/printable_versions/ethanol_yield_calculator.html (accessed on 7 February 2014).
  19. Johnson, J.M.F.; Novak, J.M.; Varvel, G.E.; Stott, D.E.; Osborne, S.L.; Karlen, D.L.; Lamb, J.A.; Baker, J.; Adler, P.R. Crop residue mass needed to maintain soil organic carbon levels: Can it be determined? BioEnergy Res. 2014, 7, 481–490. [Google Scholar] [CrossRef]
  20. Bonner, I.J.; Muth, D.J., Jr.; Koch, J.B.; Karlen, D.L. Modeled impacts of cover crops and vegetative barriers on corn stover availability and soil quality. BioEnergy Res. 2014, 7, 576–589. [Google Scholar] [CrossRef]
  21. Muth, D.J.; Koch, J.B.; McCorkle, D.S.; Bryden, K.M. Modeling sustainable agricultural residue removal at the subfield scale. Agron. J. 2012, 104, 970–981. [Google Scholar] [CrossRef]
  22. Halvorson, A.D.; Johnson, J.M.F. Corn cob characteristics in irrigated central Great Plains studies. Agron. J. 2009, 101, 390–399. [Google Scholar] [CrossRef]
  23. Demirbas, A. Calculation of higher heating values of biomass fuels. Fuel 1997, 76, 431–434. [Google Scholar] [CrossRef]
  24. Tortosa Masiá, A.A.; Buhre, B.J.P.; Gupta, R.P.; Wall, T.F. Characterising ash of biomass and waste. Fuel Process. Technol. 2007, 88, 1071–1081. [Google Scholar] [CrossRef]
  25. Cantrell, K.B.; Novak, J.M.; Frederick, J.R.; Karlen, D.L.; Watts, D.W. Influence of corn residue harvest management on grain, stover, and energy yields. BioEnergy Res. 2014, 7, 590–597. [Google Scholar] [CrossRef]
  26. Johnson, J.M.F.; Gresham, G.L. Do yield and quality of big bluestem and switchgrass feedstock decline over winter? BioEnergy Res. 2014, 7, 68–77. [Google Scholar] [CrossRef]
  27. Biomass Gasification: A Comprehensive Demonstration of a Community Scale Biomass Energy System, USDA Final Report. Available online: http://renewables.morris.umn.edu/biomass/documents/USDA_Report/USDA_Main_Report.pdf (accessed on 12 November 2014).
  28. Yu, F.; Ruan, R.; Steele, P. Consecutive reaction model for the pyrolysis of corn cob. Trans. ASABE 2008, 51, 1023–1028. [Google Scholar] [CrossRef]
  29. Sluiter, J.B.; Ruiz, R.O.; Scarlata, C.J.; Sluiter, A.D.; Templeton, D.W. Compositional analysis of lignocellulosic feedstocks. 1. Review and description of methods. J. Agric. Food Chem. 2010, 58, 9043–9053. [Google Scholar] [CrossRef] [PubMed]
  30. Wolfrum, E.J.; Sluiter, A.D. Improved multivariate calibration models for corn stover feedstock and dilute-acid pretreated corn stover. Cellulose 2009, 16, 567–576. [Google Scholar] [CrossRef]
  31. De Vries, S.; Ter Braak, C.J.F. Prediction error in partial least squares regression: A critique on the deviation used in the Unscrambler. Chemom. Intell. Lab. Syst. 1995, 30, 239–245. [Google Scholar] [CrossRef]
  32. CAMO Software AS The Unscrambler appendices: Method references. Available online: http://www.camo.com/downloads/U9.6%20pdf%20manual/The%20Unscrambler%20Method%20References.pdf (accessed on 23 September 2014).
  33. American Society for Testing and Materials. Standard Test Method for Proximate Analysis of the Analysis Sample of Coal and Coke by Instrumental Procedures; ASTM International: West Conshohocken, PA, USA, 2010. [Google Scholar]
  34. American Society for Testing and Materials. Standard Test Methods for Instrumental Determination of Carbon, Hydrogen, and Nitrogen in Laboratory Samples of Coal and Coke; ASTM International: West Conshohocken, PA, USA, 2010. [Google Scholar]
  35. American Society for Testing and Materials. Standard Test Method for Sulfur in the Analysis Sample of Coal and Coke Using High-Temperature Tube Furnace Combustion; ASTM International: West Conshohocken, PA, USA, 2010. [Google Scholar]
  36. American Society for Testing and Materials. Standard Test Method for Gross Calorific Value of Coal and Coke; ASTM International: West Conshohocken, PA, USA, 2010. [Google Scholar]
  37. SAS Institute. SAS System for Windows, Release 9.2; SAS Institute: Cary, NC, USA, 2009. [Google Scholar]

