Article

Identification of Three Distinct Eggplant Subgroups within the Solanum aethiopicum Gilo Group from Côte d’Ivoire by Morpho-Agronomic Characterization

Laboratory of Genetics, Félix Houphouët Boigny University, 22 BP 582 Abidjan 22, Cote d'Ivoire
*
Author to whom correspondence should be addressed.
Deceased.
Agriculture 2014, 4(4), 260-273; https://doi.org/10.3390/agriculture4040260
Submission received: 10 July 2014 / Revised: 26 September 2014 / Accepted: 5 October 2014 / Published: 20 October 2014

Abstract

:
The Solanum aethiopicum Gilo group, described as homogeneous, shows a high diversity, at least at the morphological level. In Côte d’Ivoire, farmers distinguish three subgroups, named “N’Drowa”, “Klogbo” and “Gnangnan”, within this group. Data were obtained from 10 quantitative and 14 qualitative morpho-agronomic traits measured in 326 accessions of Gilo eggplants, at flowering and fruiting stages. Univariate and multivariate analyses allowed clearly clustering the studied accessions into the three subgroups. Fruit taste, leaf blade width, fruit diameter, leaf blade length, fruit weight, fruit color at commercial ripeness, petiole length, germination time, plant breadth, fruit position on the plant, fruit length and flowering time were, in decreasing order, the twelve most discriminating traits. Compared to the “Gnangnan” subgroup, the “N’Drowa” subgroup has smaller plant breadth and larger leaves. The fruits of this subgroup were mainly white at commercial ripeness, larger and sweeter. Most of the traits of the “Klogbo” subgroup were intermediate between those of the “N’Drowa” and “Gnangnan” subgroups. Our results could contribute to a better understanding of S. aethiopicum diversity and to the development of a core collection for African eggplant breeding.

1. Introduction

In West Africa, the scarlet eggplant, African eggplant, also known as garden eggplant (Solanum aethiopicum L.), is one of the most popular edible non-tuberiferous cultivated Solanum species [1,2,3,4]. The plant is grown as a leaf and fruit vegetable. Previous studies showed that the fruits of S. aethiopicum are interesting for their nutritional, organoleptic and medicinal features, such as high level of antioxidant compounds [5,6].
Moreover, the scarlet eggplant could be used to obtain benefits for other eggplants’ genetic improvement [5,7,8]. For example, S. aethiopicum is less susceptible to many pathogens, including fungi (Fusarium spp.), bacteria (Ralstonia solanacearum) [5,8] and root-knot nematodes (Meloidogyne spp.) [9].
For the best use of garden eggplant as a gene pool, in terms of an interesting source of morpho-agronomic characteristics and resistance to diseases, it is important to accurately identify African eggplants and/or their groups and the main traits that can be used to discriminate them. Thus, four groups were determined within the species S. aethiopicum, Aculeatum, Gilo, Kumba and Shum, based on morphological traits [10]. Each group has been selected primarily for desirable traits related to food or ornamental uses [2,11]. The Gilo group is characterized by large and edible fruits; glabrous and edible leaves characterize the Shum group; both large fruit and glabrous leaf characterize the Kumba group. The Aculeatum group, used as an ornamental plant, is characterized by large and ribbed fruit with prickly leaves.
We focus here on the Gilo group, which is the most important and largely cultivated in Sub-Saharan African countries and particularly in Côte d’Ivoire [12,13]. Plants of this group are predominantly self-pollinated, with a ploidy level of 2n = 24.
Although considered as a homogeneous and distinct group, the Gilo group seems to be composed of several types of eggplants that can be distinguished at least morphologically [2,10]. In Côte d’Ivoire, three subgroups are reported based on fruit shape, size and taste for this group, namely “N’Drowa”, “Klogbo” and “Gnangnan”. These three names are from the Akan ethnic group in Côte d’Ivoire. “N’Drowa” and “Klogbo” eggplants are cultivated plants, while “Gnangnan” is spontaneous. Fruits of “N’Drowa” and “Klogbo” are usually used in the preparation of ordinary soup and stew, while those of “Gnangnan”, with a bitter taste, are especially used in soup for people suffering from malaria.
Taking into account farmers’ opinions may be important support for eggplant improvement programs. Thus, a strategy, such as “farmers’ participatory selection” helps breeders identify farmer-valued traits that breeding programs should focus on (see Adeniji and Aloyce [14] for more details).
In this respect, the objective of this work was to assess, on the basis of the statistical analysis of quantitative and qualitative morpho-agronomic traits, the existence of three distinct eggplant subgroups within the S. aethiopicum Gilo group as described by farmers.

2. Materials and Methods

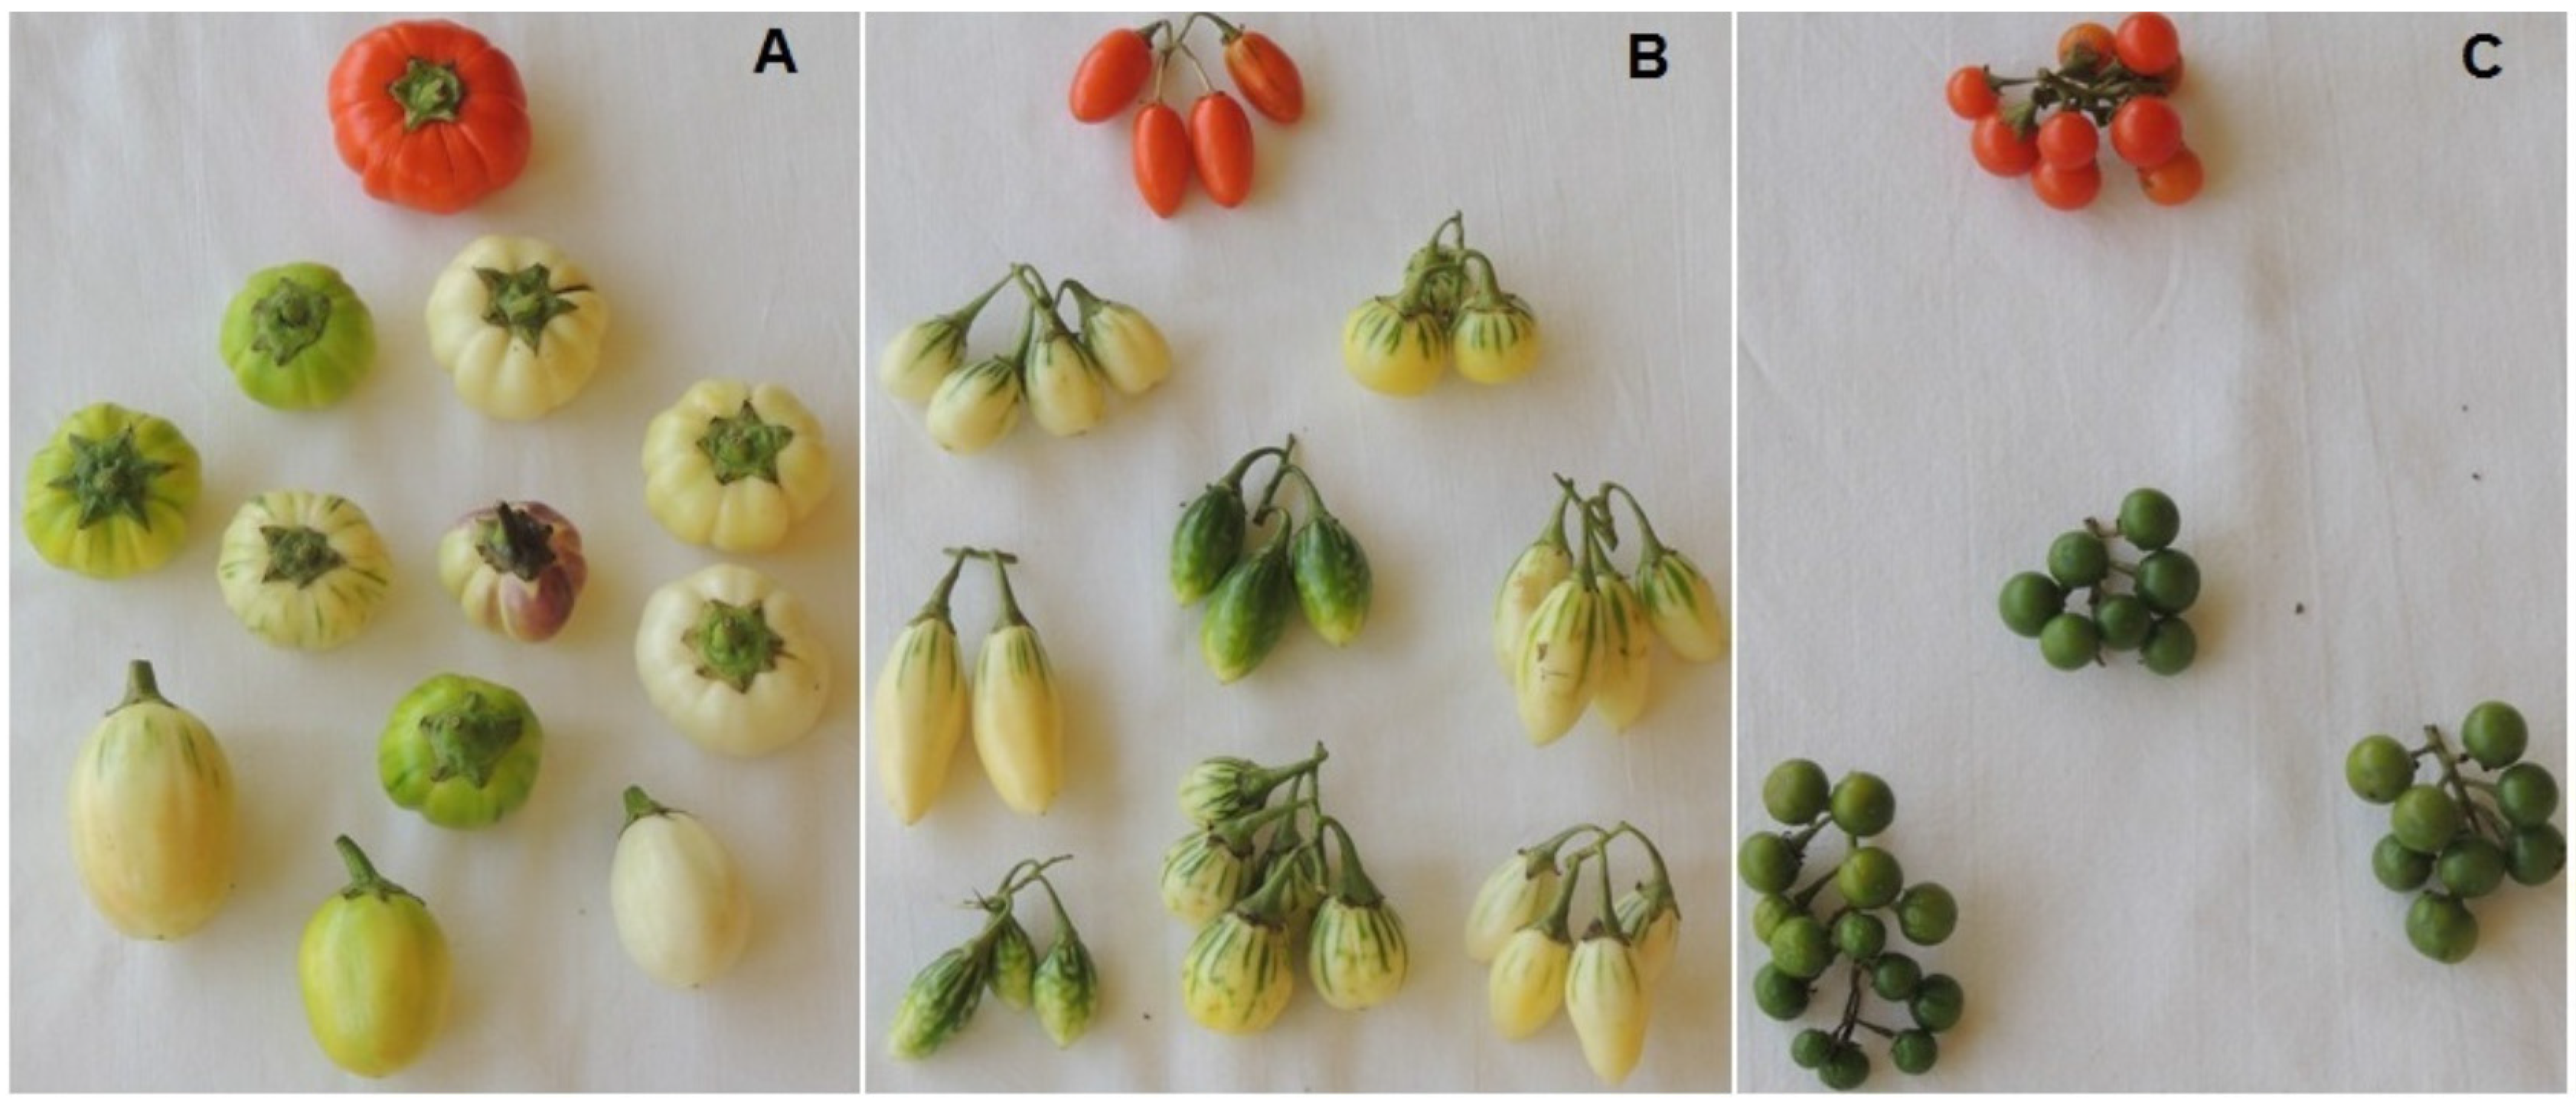
2.1. Plant Materials

Materials used in the present study consisted of seeds obtained from 326 eggplant accessions of the S. aethiopicum Gilo group. These accessions were sampled throughout Côte d’Ivoire by the Laboratory of Genetics of Félix Houphouët Boigny University and the Centre National de Recherche Agronomique (CNRA). According to the classification made by farmers, the 326 eggplant accessions were assigned as follows: 207 “N’Drowa”, 92 “Klogbo” and 27 “Gnangnan”.

2.2. Sowing and Growing Conditions

Experiments were carried out in the experimental stations of the Centre National de Recherche Agronomique at Adiopodoumé (5°20′12″ N, 4°7′57″ W). These experiments started in the dry season (October 1999–April 2000) and continued during the rainy season (May–September, 2000). The local climate characteristics were as follows: average monthly rainfall (1800 mm); day length (12 h); average temperature (27 °C).
Twenty seeds of each accession were individually germinated in black plastic bags containing compost that was previously sterilized at 120 °C. Sowing was carried out in a nursery for thirty to forty-five days. Following this period, seedlings at the 4-leaf stage were transplanted to the field. The 326 accessions were planted in a completely randomized design in a plot. Each accession was represented by a row of twenty plants. Plants were spaced 1 m apart within a row and 1.5 m apart between the rows.
Pests and associated diseases were treated using chemical products: SPIC (niclosamide, metaldehyde) was applied against snails in the nursery and the field. THIORAL (heptachlor, tetramethyl thiuram disulfide) was used against crickets. DECIS (deltamethrin) and MANATE (dithane M-22, manganese ethylene-1,2-bis-dithiocarbamate) were applied against fungi, every 8–10 days, up to 15 days before harvest. Commercial fertilizer urea and NPK (10-20-20) were applied (600 kg/ha) three weeks after seedlings transplantation. Plants were irrigated when necessary, and weeding of the plot was carried out several times.

2.3. Plants and Fruits Characterization

Ten quantitative morpho-agronomic traits were measured on individual plants and averaged to each of the 326 accessions. The same individual plants were characterized for 14 qualitative morpho-agronomic traits, and the general phenotypic trend was retained for each accession. The descriptors developed by the International Board for Genetic Resources [15] were used. Morpho-agronomic traits were measured at flowering and fruiting stages (Table 1). Apart from germination time, quantitative values of vegetative traits were measured twice, at the early flowering stage and after the first harvest. Petiole length, leaf blade width and leaf blade length were measured on 4 leaves per plant. The leaves were collected at mid-height of the plant, each from one of the four cardinal points. These measures were averaged over the 4 leaves. Qualitative scores of vegetative and floral traits were monitored at the first harvest and during flowering, respectively. Both quantitative and qualitative measures of fruit traits were monitored at the first harvest.
Table 1. Quantitative and qualitative morpho-agronomic traits studied.
TraitsTrait AbbreviationTrait Units/States
Quantitative Traits
Vegetative traits:
Germination timeGETMdays
Plant heightPTHGcm
Plant breadthPTBDcm
Petiole lengthPELGcm
Leaf blade widthLBWDcm
Leaf blade lengthLBLGcm
Floral traits:
Flowering timeFLTMdays
Fruit traits:
Fruit lengthFTLGcm
Fruit diameterFTDMcm
Fruit weightFTWGg
Qualitative Traits
Vegetative traits:
Plant shapePTSHlarge/bouquet/rangy
Stem pricklesSTPKpresent/absent
Stem colorSTCOgreen/purple/green-purple
Petiole colorPECOgreen/purple/green-purple
Leaf blade pricklesLBPKpresent/absent
Floral traits:
Corolla colorCOCOwhite/purple/white-purple
Fruit traits:
Fruit position on the plantFTPPstanding/intermediate/hanging
Fruit shapeFTSHelongated/globular/flattened
Fruit base shapeFTBSprotruded/rounded/depressed
Fruit apex shapeFTASpointed/less-pointed/rounded/depressed
Fruit pigmentation uniformityFTPUuniform/striated/ribbed/speckled
Fruit color at commercial ripenessFTCCgreen/pale-green/white/yellowish-green/purple/dark-green/ivory
Fruit color at physiologic ripenessFTCPred/orange-red
Fruit tasteFTTSsweet/slightly-bitter/bitter/very-bitter

2.4. Statistical Analysis

The generalized linear model (GLM) [16] was used for a univariate comparison of quantitative morpho-agronomic traits among the three subgroups, “N’Drowa”, “Klogbo” and “Gnangnan”, of the Solanum aethiopicum Gilo group. These traits were analyzed using a normal error. When subgroups were significantly different for a trait at p < 0.05, their means were separated using the Newman–Keuls post hoc test. The percentages of trait states were calculated for each qualitative trait within subgroups and compared among subgroups using a Fisher exact test. In addition, principal component analysis (PCA) was performed on standardized variables, to verify the total variation of multiple quantitative descriptors and to group accessions in relation to subgroups defined by the farmers. Correlations between quantitative traits, based on the Pearson’s correlation coefficient, were obtained from the output of the PCA.
Factor discriminant analysis (FDA), through the ascending stepwise method, was applied simultaneously to quantitative and qualitative traits to find out the most discriminating traits. This analysis was also performed to ascertain the classification of the studied accessions regarding the three subgroups. All statistical analyses were performed using the software, STATISTICA 7.1 (StatSoft, Paris, France).

3. Results

3.1. Univariate Differentiation of Subgroups within the Gilo Group

The ten quantitative morpho-agronomic traits showed significant differences among the three subgroups, “N’Drowa”, “Klogbo” and “Gnangnan”. Concerning vegetative traits, the “Gnangnan” subgroup had a higher plant height and plant breadth. Conversely, the “N’Drowa” subgroup showed higher petiole length, leaf blade width and leaf blade length compared to the other two subgroups (p < 0.001). The “N’Drowa” and “Klogbo” subgroups had shorter germination times than the “Gnangnan” subgroup (p < 0.001). However, the “Gnangnan” subgroup had a shorter flowering time compared to the other two subgroups (p = 0.011). Regarding fruit traits, the “N’Drowa” subgroup had longer, larger and heavier fruits than the “Klogbo” and “Gnangnan” subgroups (p < 0.001). Overall, the “Gnangnan” subgroup mostly showed opposite values to those of the “N’Drowa” subgroup. The “Klogbo” subgroup had intermediate trait values between those of the other two subgroups (Figure 1; Table 2).
Figure 1. Fruit samples of eggplant subgroups, “N’Drowa” (A), “Klogbo” (B) and “Gnangnan” (C), of the Gilo group of Solanum aethiopicum from Côte d’Ivoire.
Agriculture 04 00260 g001
Table 2. Mean values and standard deviation (± SD) for ten quantitative morpho-agronomic traits measured in 326 eggplant accessions belonging to the S. aethiopicum Gilo group. Accessions are grouped according to the three subgroups, “N’Drowa”, “Klogbo” and “Gnangnan”. Means within rows separated by different letters are significantly different at p-value < 0.05, according to the Newman–Keuls test.
Traits (Abbreviations, Units)N’DrowaKlogboGnangnanp-value
Plant height (PTHG, cm)116.27 a ± 1.70140.20 b ± 2.11154.23 c ± 3.90<0.001
Plant breadth (PTBD, cm)181.16 a ± 2.51212.83 b ± 2.85233.23 c ± 3.74<0.001
Petiole length (PELG, cm)7.57 c ± 0.095.97 b ± 0.064.56 a ± 0.18<0.001
Leaf blade width (LBWD, cm)18.15 c ± 0.1512.63 b ± 0.1610.07 a ± 0.29<0.001
Leaf blade length (LBLG, cm)26.02 c ± 0.1122.40 b ± 0.1518.73 a ± 0.45<0.001
Germination time (GETM, days)5.47 a ± 0.095.29 a ± 0.117.19 b ± 0.33<0.001
Flowering time (FLTM, days)78.02 b ± 0.3479.18 b ± 0.4075.85 a ± 0.600.011
Fruit length (FTLG, cm)3.72 c ± 0.072.75 b ± 0.111.14 a ± 0.05<0.001
Fruit diameter (FTDM, cm)4.27 c ± 0.072.33 b ± 0.061.11 a ± 0.04<0.001
Fruit weight (FTWG, g)35.98 c ± 2.058.10 b ± 0.610.93 a ± 0.09<0.001
Apart from stem prickles and leaf blade prickles, 12 of the 14 qualitative traits studied showed significant differences among the “N’Drowa”, “Klogbo” and “Gnangnan” subgroups (Fisher’s exact test; p < 0.01 in most cases). Concerning vegetative traits, for plant shape, accessions were mostly bouquet-shaped in the subgroups, “Klogbo” (90%), “N’Drowa” (89%) and “Gnangnan” (78%). The stem, petiole and corolla color was mostly green in the subgroups, “N’Drowa” (88%), “Klogbo” (79%) and “Gnangnan” (62%). Regarding fruit position on the plant, hanging fruits were predominant in the subgroups, “N’Drowa” (98%) and “Klogbo” (74%), while the “Gnangnan” subgroup was predominantly characterized by standing fruits (63%). Concerning fruit shape, “Gnangnan” fruits were all globular. Conversely, elongated (35%), flattened (12%) and globular (53%) fruits were observed in the “Klogbo” subgroup. The “N’Drowa” subgroup showed almost similar fruit shape variability with a majority (56%) of flattened fruits. “Gnangnan” and “Klogbo” fruits had mostly a rounded base and apex (100% and ≥53%, respectively) compared to fruits of “N’Drowa” that had, in the majority (55%), a depressed base and apex. For fruit pigmentation uniformity, high proportions of fruits with uniform pigmentation were found in “Gnangnan” (67%) and “N’Drowa” (59%) compared to “Klogbo” fruits, which showed a variability of pigmentation (37% ribbed, 35% uniform, 24% striated and 4% speckled). Fruit color at commercial ripeness was more frequently green (78%) in the “Gnangnan” subgroup and mostly white in the “Klogbo” and “N’Drowa” subgroups (51% and 53%, respectively). For fruit color at physiological ripeness, very high proportions of orange-red fruits were found in subgroups “Gnangnan” (100%), “Klogbo” (93%) and “N’Drowa” (83%). Fruit taste was predominantly bitter in the “Klogbo” and “Gnangnan” subgroups (74% and 96%, respectively) and sweet in the “N’Drowa” subgroup (64%).

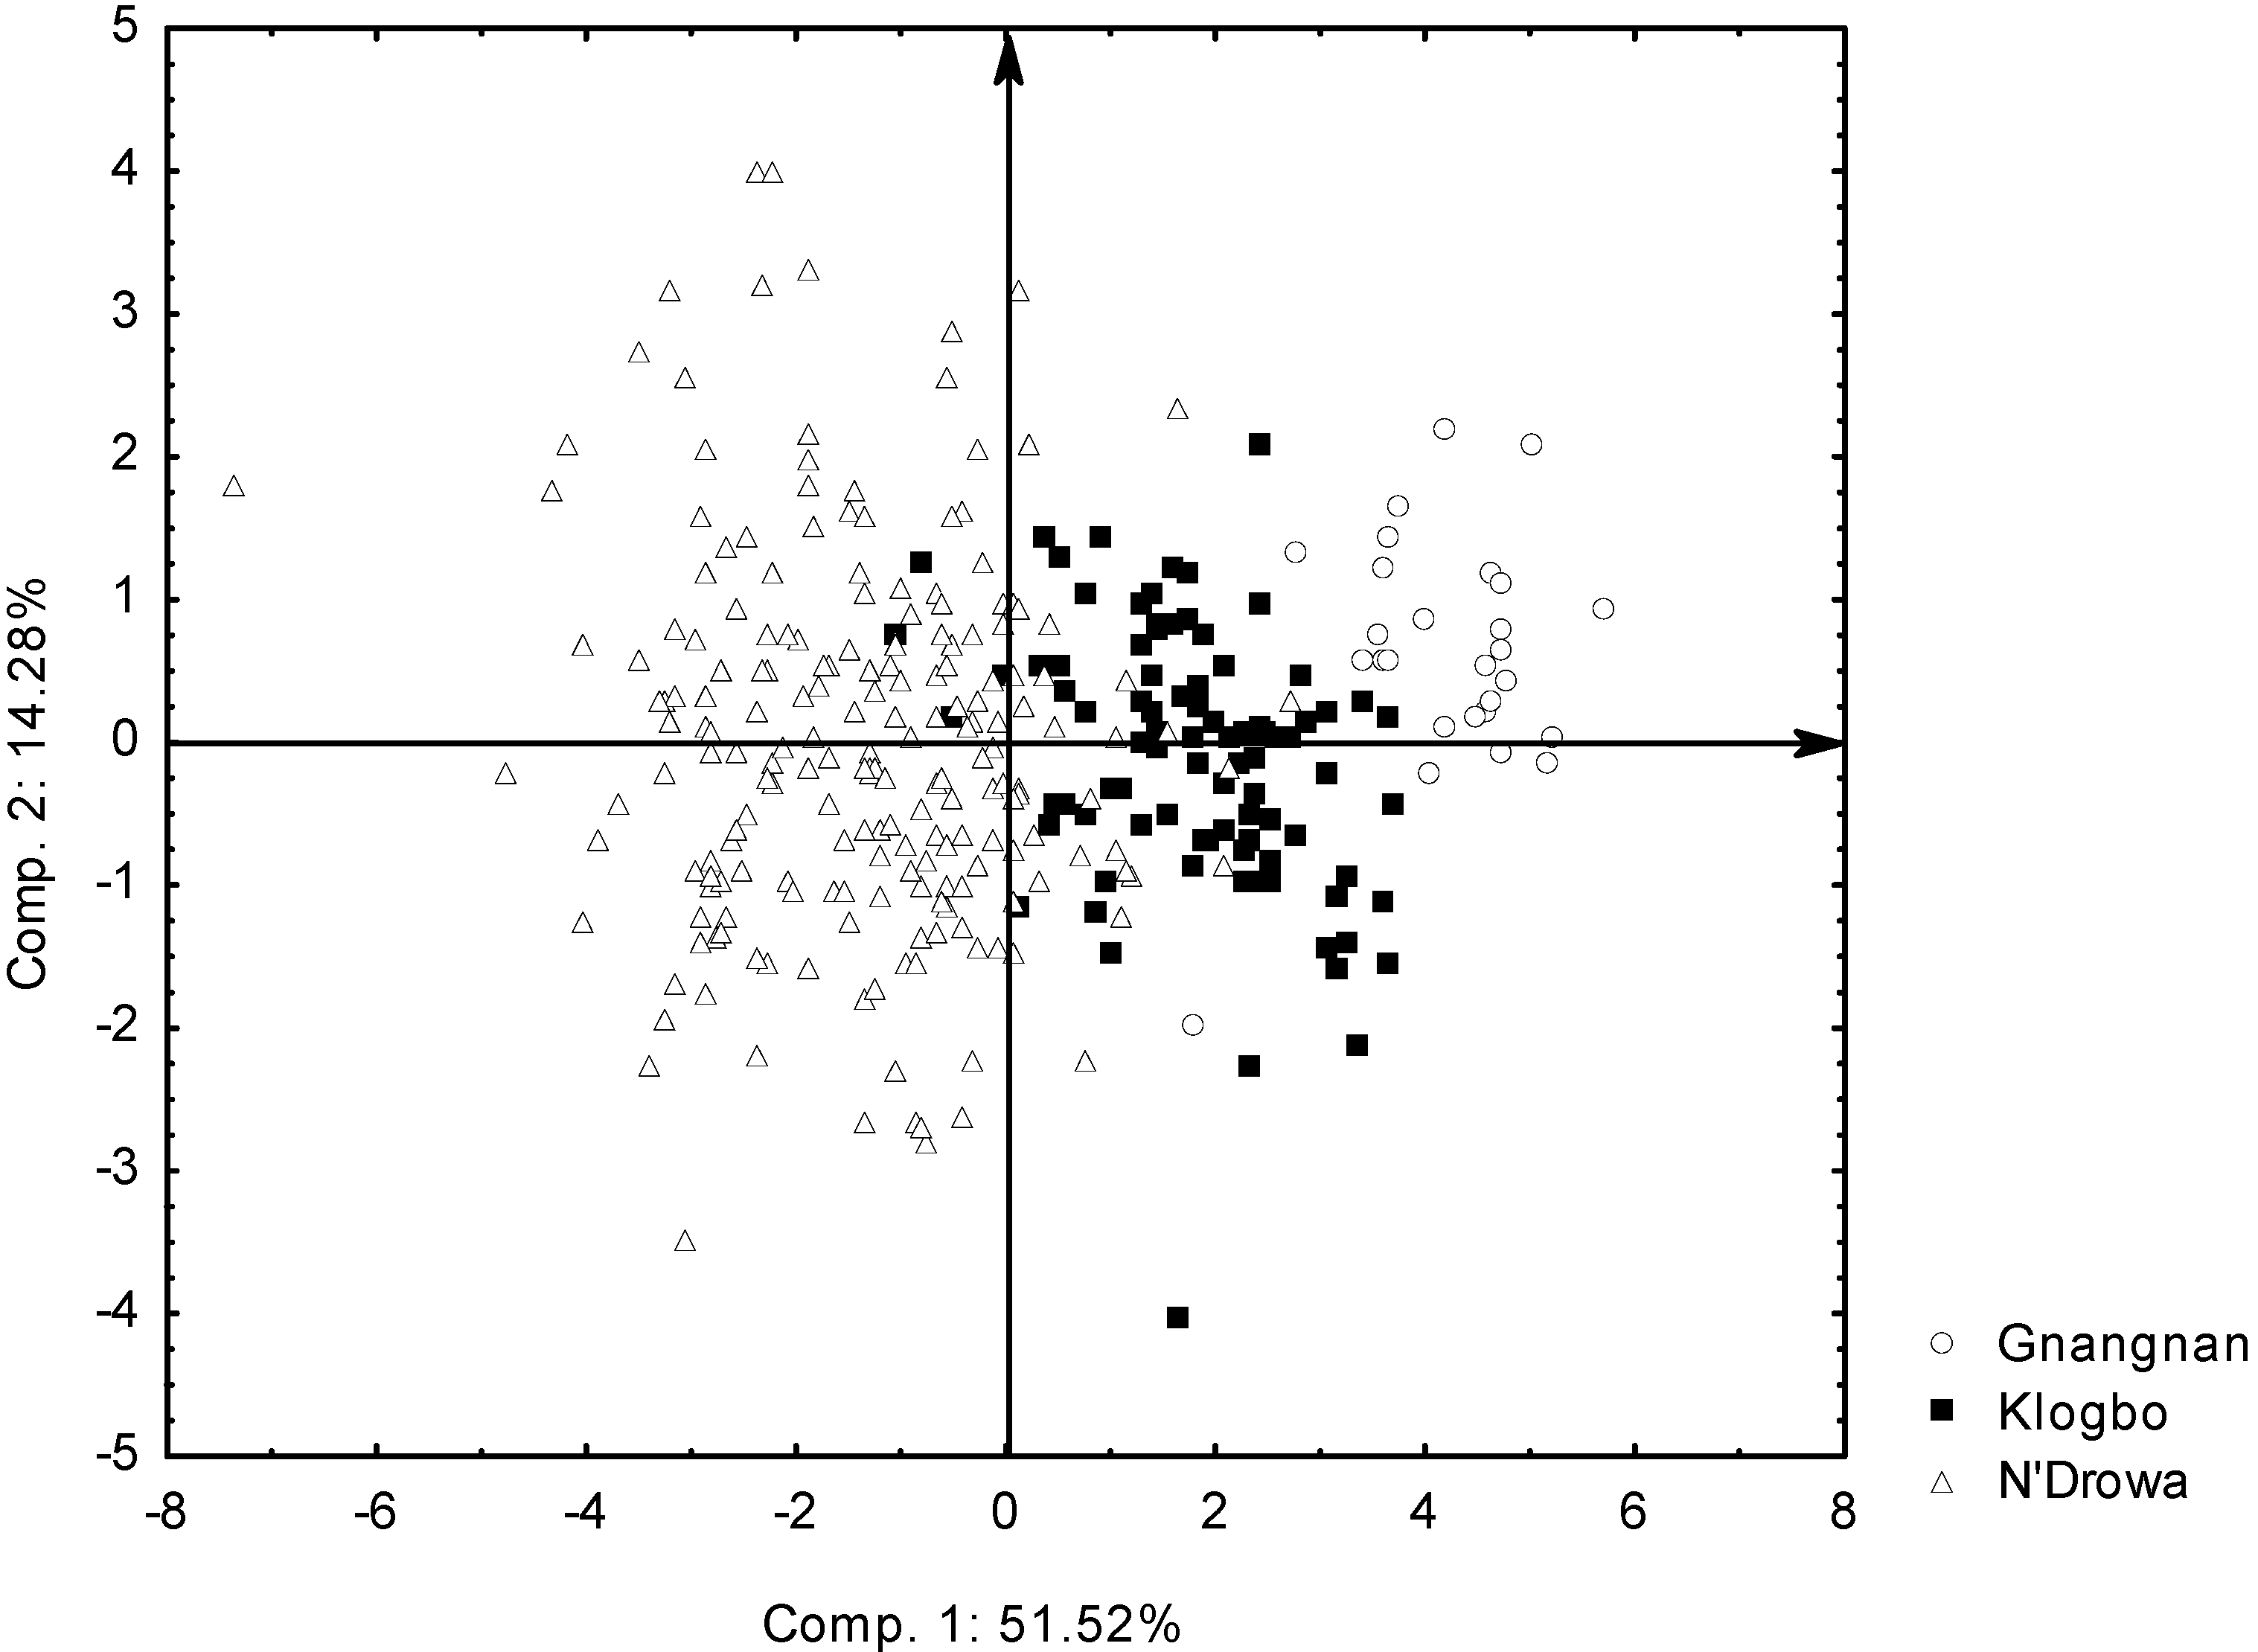
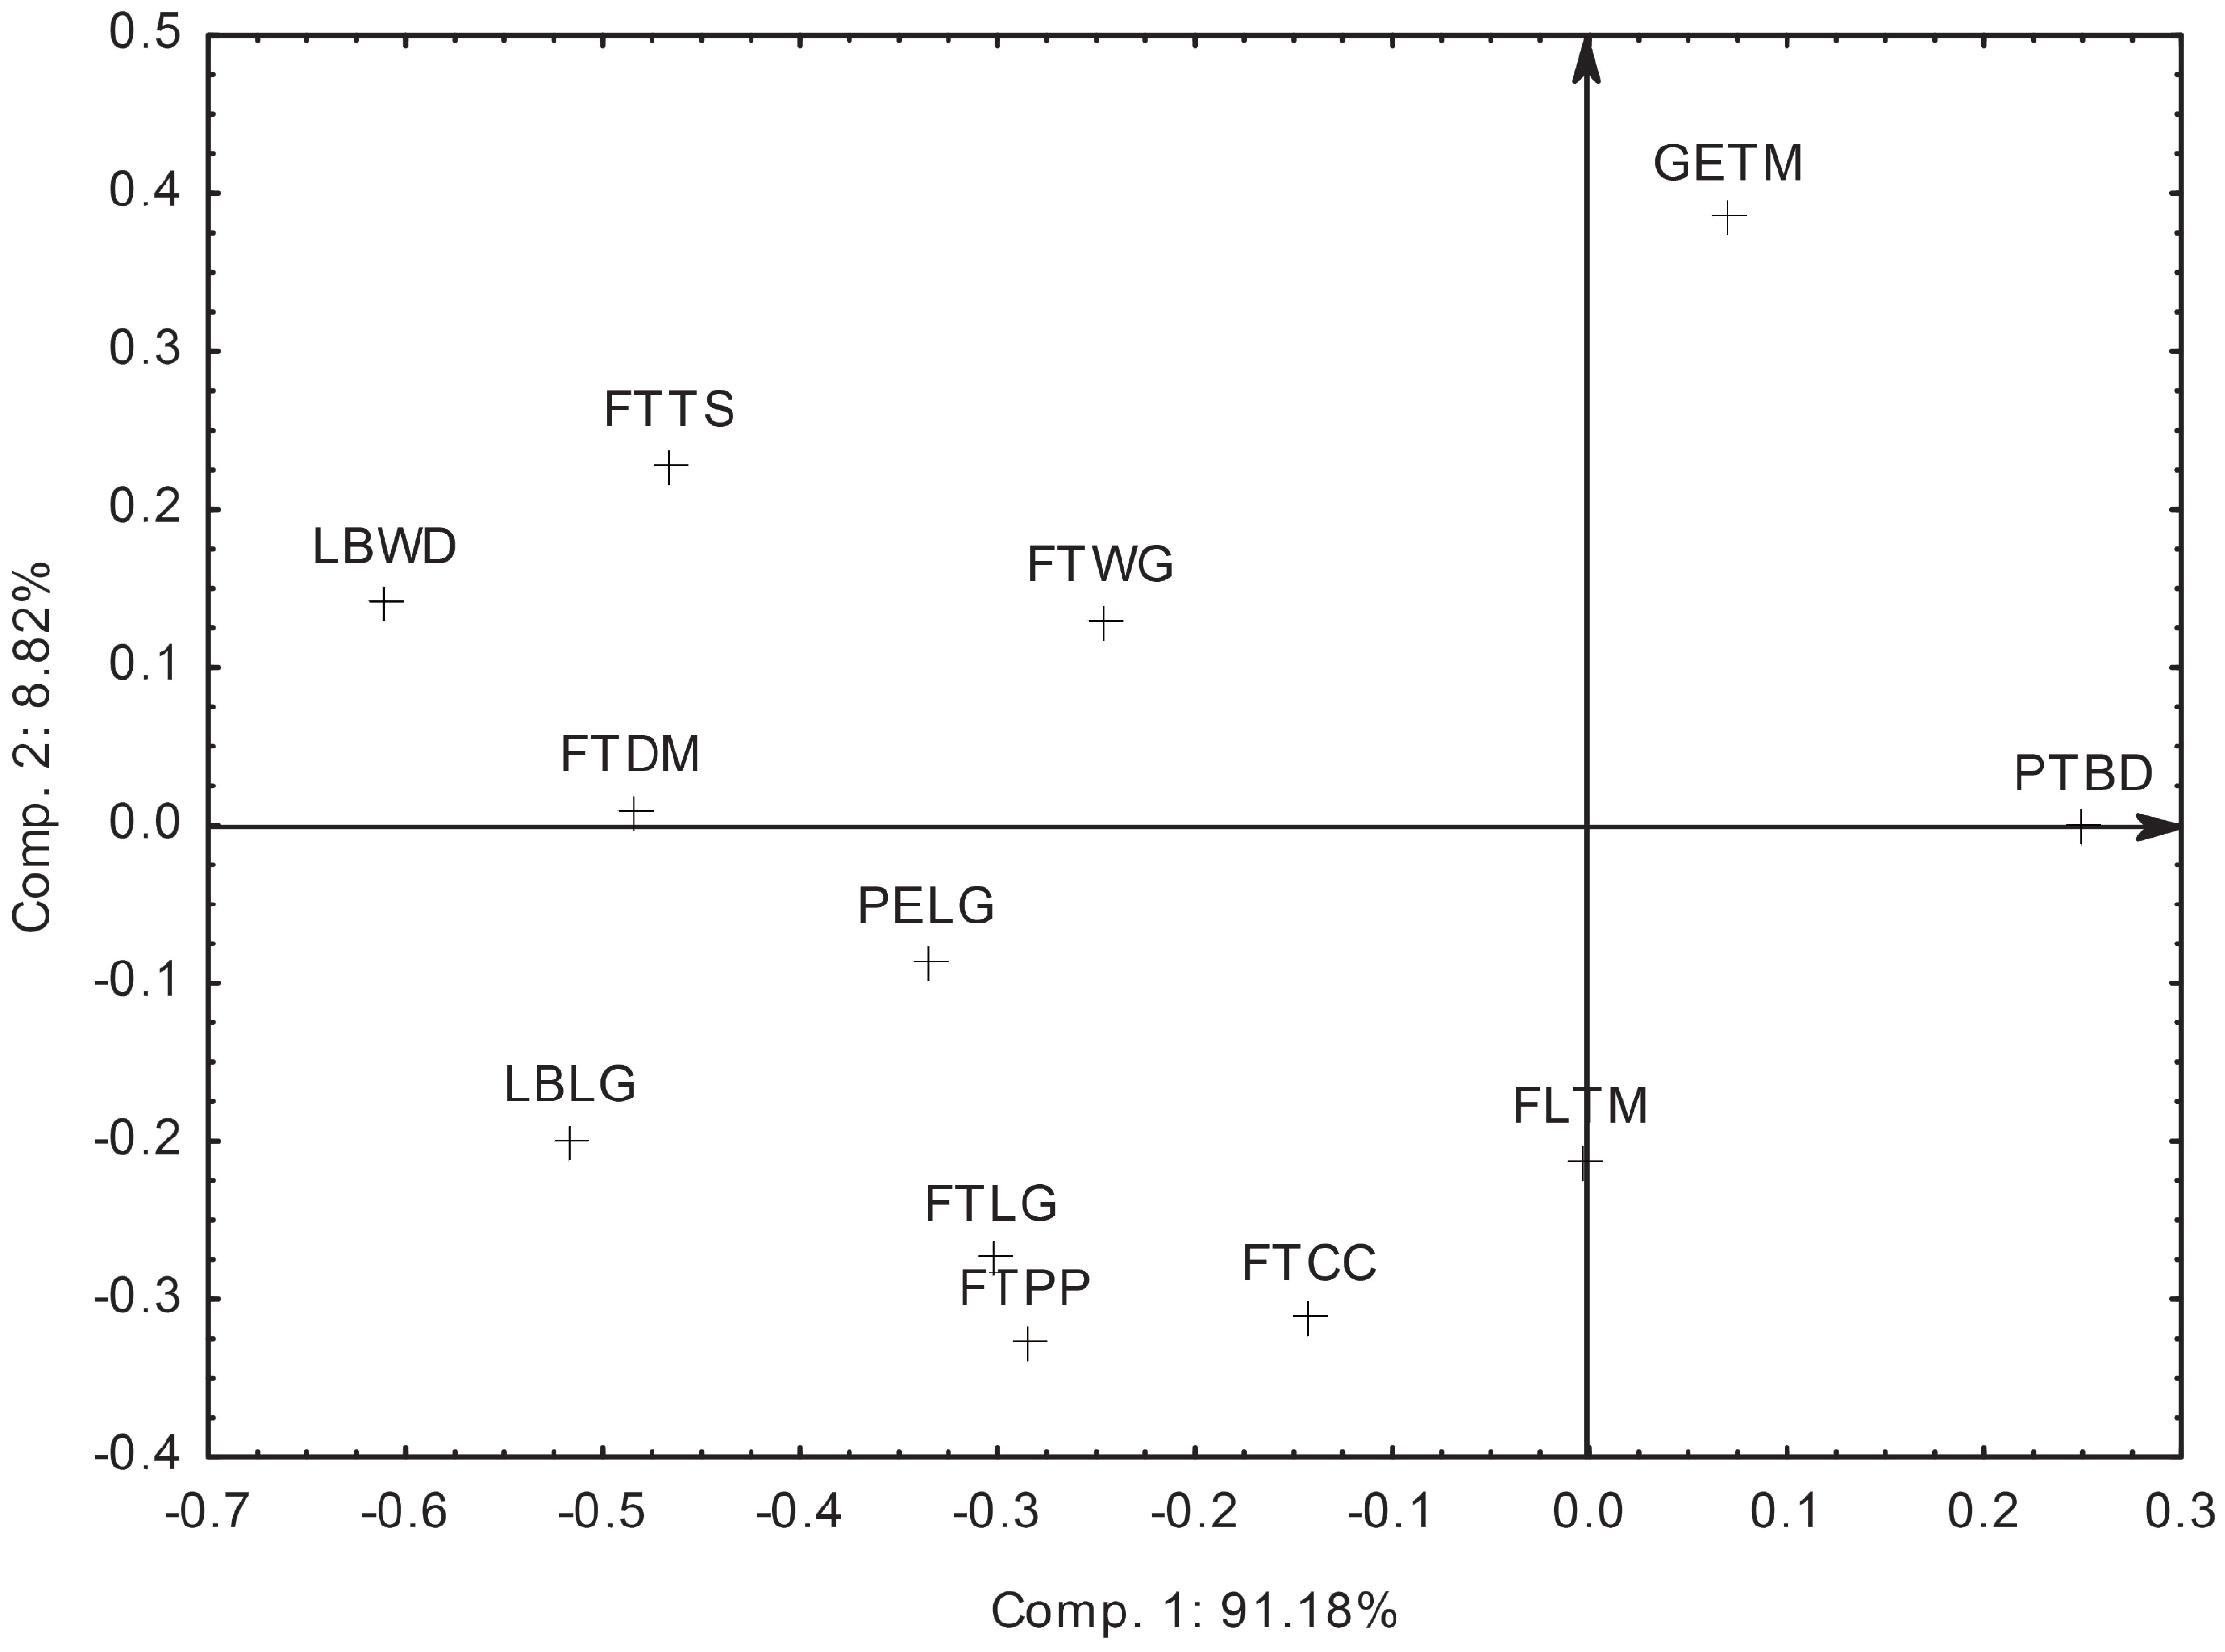
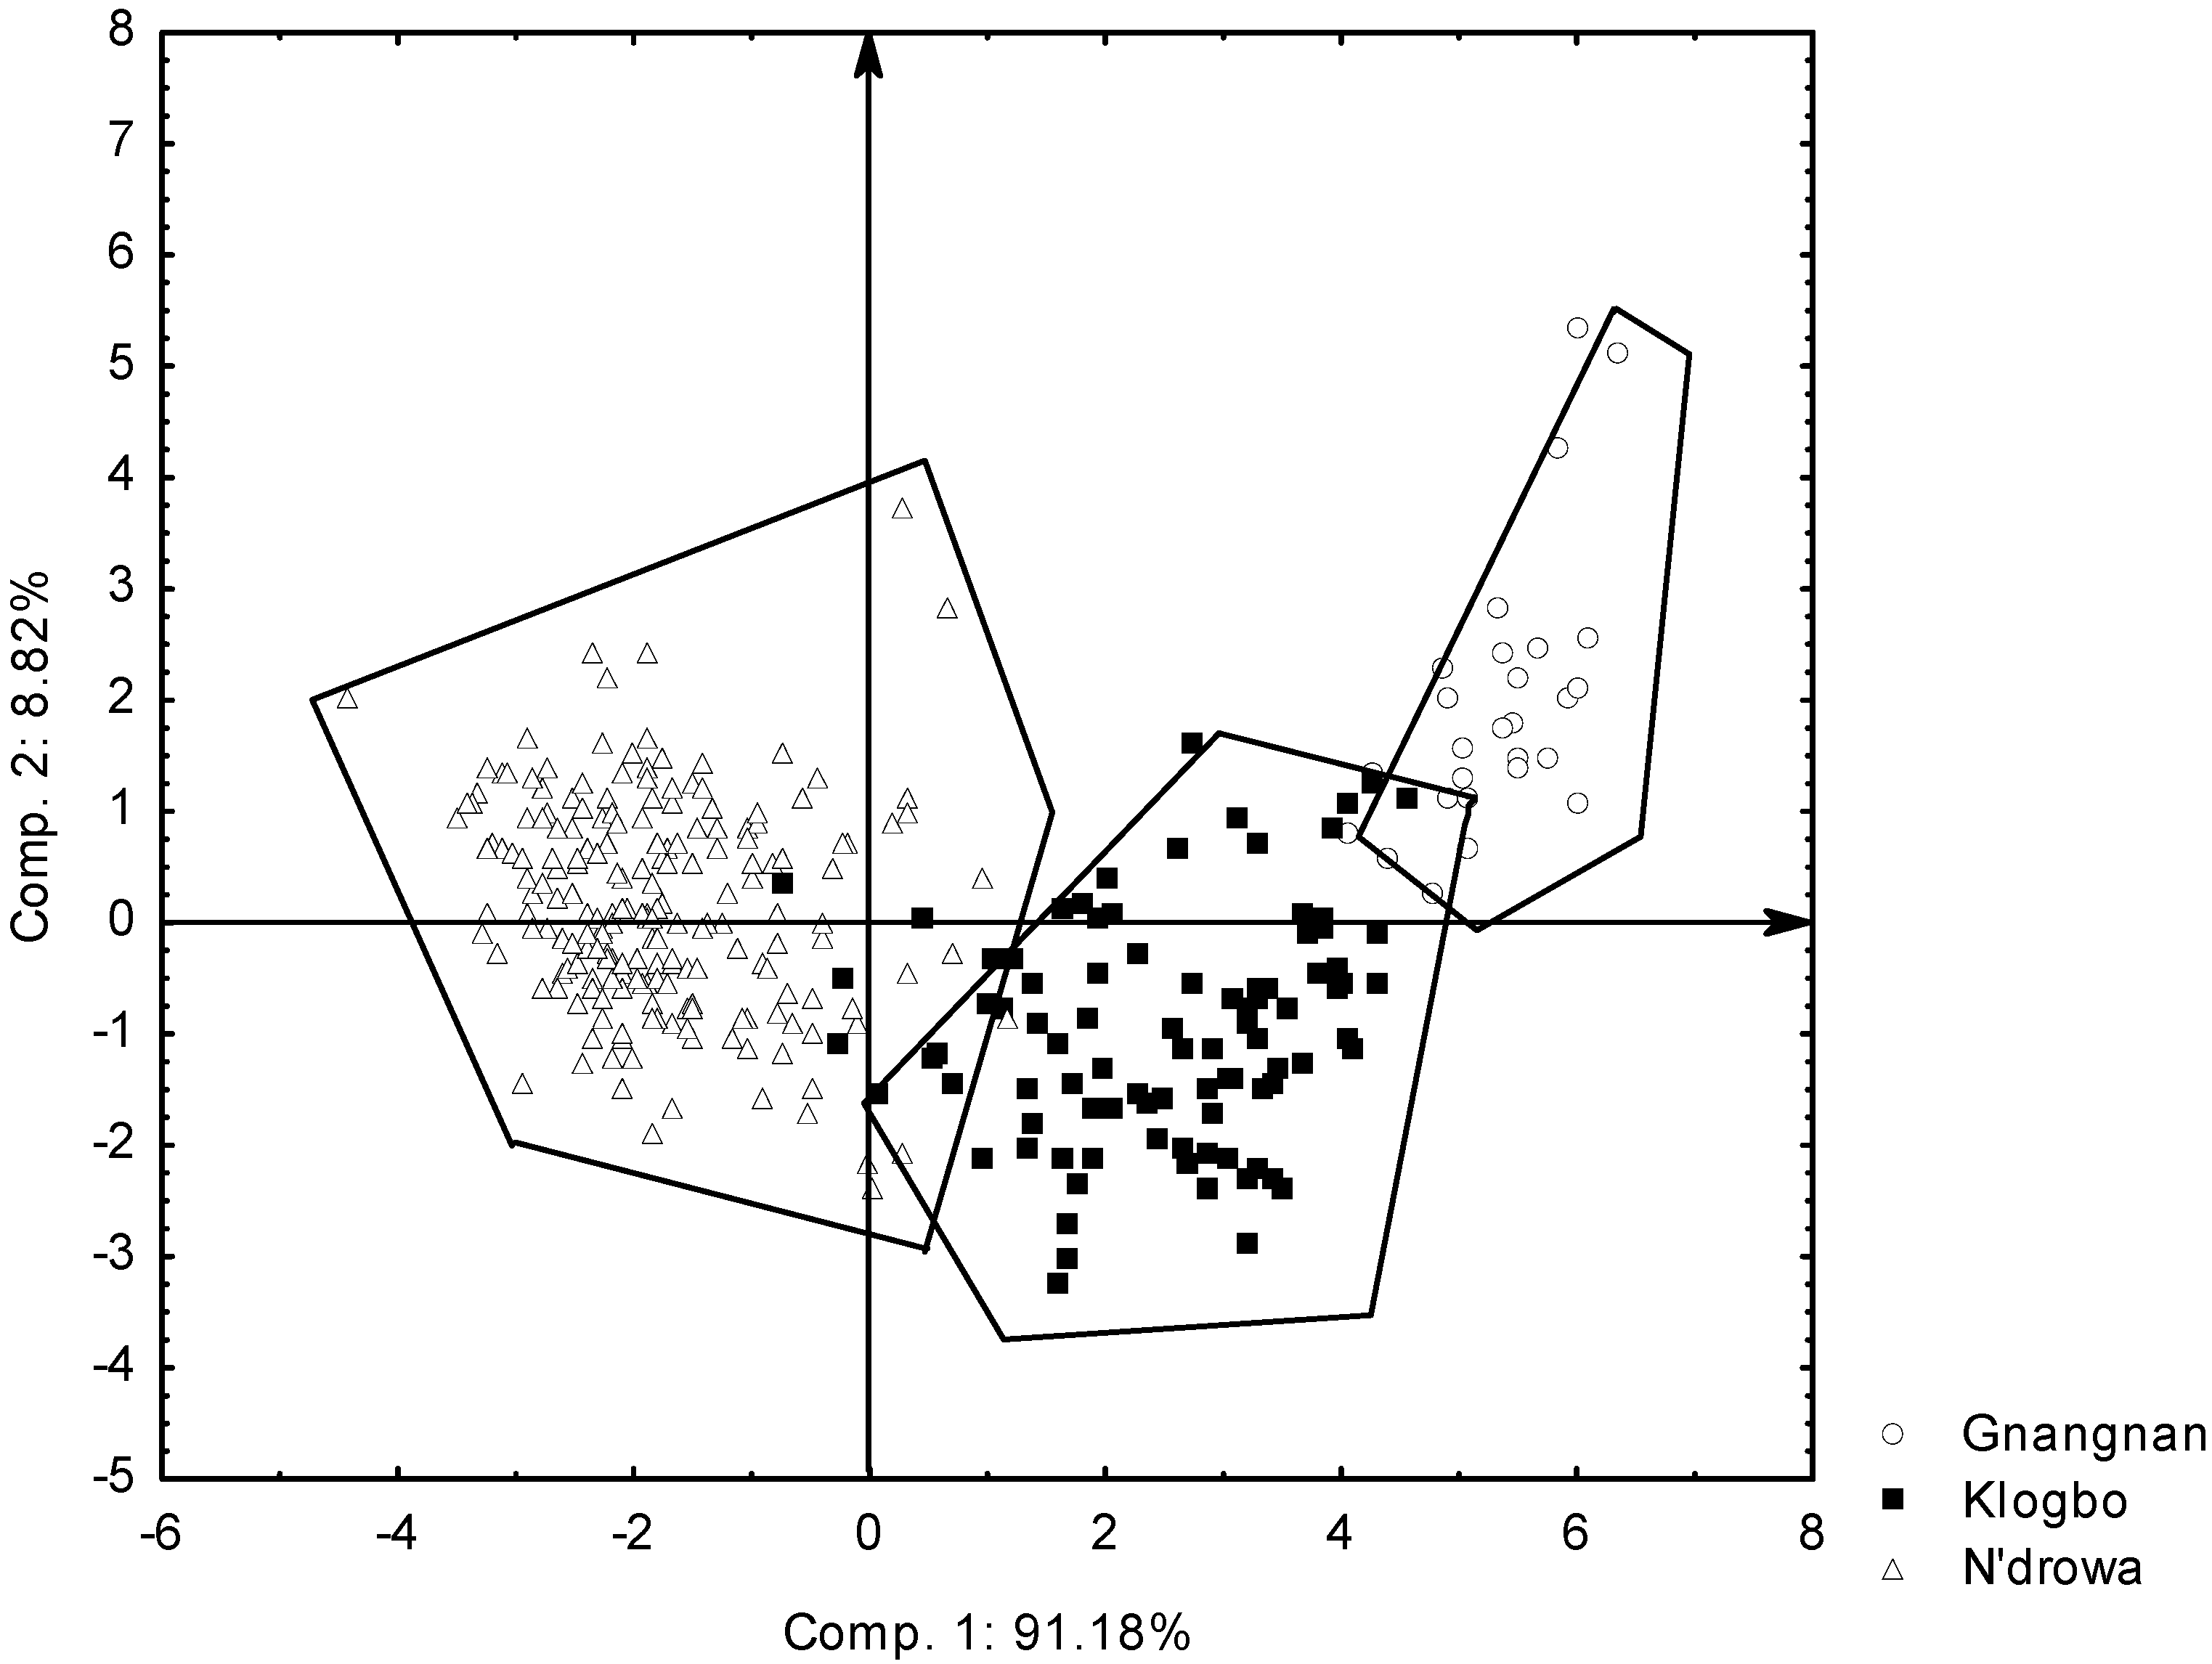
3.2. Multivariate Differentiation of Subgroups within the Gilo Group

To determine the integrated diversity of multiple descriptors, principal component analysis (PCA) was carried out, which allowed obtaining the first two principal components loadings and the contributions of each quantitative trait on these components (Table 3). The first two components (Component 1 and Component 2) explained 65.80% of the total variation. The first component accounted for 51.52% and the second for 14.28% of the total variation (Table 3). The first component was highly and negatively correlated with traits related to the leaf (petiole length, blade width and blade length) and to fruit (fruit length, fruit diameter and fruit weight). Traits having a higher negative correlation with the second component included plant height and plant breadth and flowering time (Table 3). These latter traits were positively correlated with each other (Table 4). Pairwise correlations among the ten quantitative traits were mostly significant. A strong positive correlation was detected between plant height and plant breadth (r = 0.94). Higher positive pairwise correlations were also detected among the six traits, petiole length, leaf blade width, leaf blade length, fruit length, fruit diameter and fruit weight (0.45 ≤ r ≤ 0.91). Negative correlations were mostly detected between traits measured on different organs or at different developmental stages (e.g., rPTHG-FTDM = −0.58; rPTBD-FTDM = −0.53; rGETM-FLTM = −0.36) (Table 4).
Table 3. Contributions of quantitative traits to principal components and eigenvalues, variation and cumulative variation computed for the first two principal components.
Traits (Abbreviations, Units)Contribution on Component 1Contribution on Component 2
Plant height (PTHG, cm)0.70−0.62
Plant breadth (PTBD, cm)0.67−0.61
Petiole length (PELG, cm)−0.78−0.39
Leaf blade width (LBWD), cm)−0.88−0.20
Leaf blade length (LBLG, cm)−0.87−0.31
Germination time (GETM, days)0.290.11
Flowering time (FLTM, days)0.08−0.58
Fruit length (FTLG, cm)−0.74−0.19
Fruit diameter (FTDM, cm)−0.92−0.01
Fruit weight (FTWG, g)−0.770.04
Eigenvalues5.1521.428
Variation (%)51.5214.28
Cumulative variation (%)51.5265.80
Table 4. Pairwise correlation estimates (Pearson’s correlation coefficient, r) among ten quantitative traits measured in 326 accessions of the Solanum aethiopicum Gilo group. ns refers to correlation coefficient r values not significantly different from zero at p < 0.05. Please see Table 3 for the abbreviations.
PTBDPELGLBWDLBLGFTLGFTDMFTWGGETMFLTM
PTHG0.94−0.30−0.48−0.42−0.38−0.58−0.440.280.21
PTBD−0.28−0.46−0.39−0.35−0.54−0.410.270.14
PELG0.810.850.560.630.45−0.15−0.01 ns
LBWD0.910.550.780.56−0.13−0.06 ns
LBLG0.610.740.52−0.18−0.0002 ns
FTLG0.650.60−0.210.03 ns
FTDM0.87−0.23−0.10 ns
FTWG−0.14−0.13
GETM−0.36
Projecting individual accessions on the first two components tended to generate three groups mostly along the first axis (Component 1). These groups could be easily identified as the “N’Drowa”, “Klogbo” and “Gnangnan” subgroups (Figure 2). Accessions belonging to the “N’Drowa” subgroup clustered in the left part of the diagram, while “Klogbo” and “Gnangnan” accessions clustered in the right part, indicating that accessions of the first subgroup had larger leaves and fruits than the other two. However, some accessions of the “N’Drowa” and “Klogbo” subgroups showed higher values of plant height and plant breadth (Figure 2).
Figure 2. Plot from principal component analysis (PCA) showing the spatial distribution of 326 accessions of the Solanum aethiopicum Gilo group in three subgroups, “N’Drowa”, “Klogbo” and “Gnangnan”, based on ten quantitative morpho-agronomic traits. Component 1 and Component 2 refer to the first component (X-axis) and the second component (Y-axis) of the PCA and accounting for 51.52% and 14.28% of the total variation, respectively.
Agriculture 04 00260 g002
Factor discriminant analysis (FDA) based on the whole 24 quantitative and qualitative traits studied indicated that only 12 (nine quantitative and three qualitative) of these traits contributed significantly to the discrimination of the three subgroups, “N’Drowa”, “Klogbo” and “Gnangnan”, within the Gilo group. In decreasing order of discrimination power (increasing order of values of Wilk’s partial Lambda associated with traits), fruit taste (FTTS) was the first variable contributing to subgroup discrimination, followed by leaf blade width (LBWD), fruit diameter (FTDM), leaf blade length (LBLG), fruit weight (FTWG), fruit color at commercial ripeness (FTCC), petiole length (PELG), germination time (GETM), plant breadth (PTBD), fruit position on the plant (FTPP), fruit length (FTLG) and flowering time (FLTM) (Table 5).
Factor discriminant analysis generated only two components explaining the total variation. The first component (Component 1) accounted for 91.18%, and the second component (Component 2) accounted for 8.82% of the total variation. Plotting the 12 most discriminating traits on the components indicated that FTTS, FTDM, FTLG, FTWG, PELG, LBWD and LBLG had a stronger negative correlation with Component 1 than with Component 2. These traits were positively correlated with each other and negatively correlated with PTBD. The latter trait had a stronger positive correlation with Component 1 than with Component 2. Traits having stronger correlations with Component 2 included GETM, in the upper part of the diagram, and FLTM, FTCC and FTPP, in the lower part of the diagram (Figure 3).
Table 5. Discriminating quantitative and qualitative traits obtained by the ascendant stepwise method of factor discriminant analysis. Wilk’s partial Lambda gives the discriminating power of a trait in the multivariate discriminative model (the higher the value of this parameter close to zero, the more its discriminative power is important). Excluding F was set to 0.00, so that a significant F at the 0.05 level, with a value greater than 0.00, allowed including the related trait in the multivariate discriminative model.
Traits (Abbreviations)Trait natureWilk’s Partial LambdaExcluding Fp-value
Fruit taste (FTTS)Qualitative0.73355.414<0.001
Leaf blade width (LBWD)Quantitative0.82532.304<0.001
Fruit diameter (FTDM)Quantitative0.90915.279<0.001
Leaf blade length (LBLG)Quantitative0.92212.860<0.001
Fruit weight (FTWG)Quantitative0.9429.427<0.001
Fruit color at commercial ripeness (FTCC)Qualitative0.9576.8040.001
Petiole length (PELG)Quantitative0.9586.6530.001
Germination time (GETM)Quantitative0.9625.9610.003
Plant breadth (PTBD)Quantitative0.9724.4370.013
Fruit position on the plant (FTPP)Qualitative0.9744.0450.018
Fruit length (FTLG)Quantitative0.9763.8420.022
Flowering time (FLTM)Quantitative0.9773.5680.029
Projecting individual accessions on the two components of factor discriminant analysis (FDA) clearly clustered them into three subgroups along the first component. These subgroups were identified as “N’Drowa”, “Klogbo” and “Gnangnan” (Figure 4), confirming the result found with principal component analysis. According to Figure 3 and Figure 4, along the first component, the “N’Drowa” and “Gnangnan” subgroups showed extreme and opposite characteristics. The “N’Drowa” subgroup had smaller plant breadth, larger leaves, larger fruits and sweet fruits. The “Gnangnan” subgroup had higher plant breadth, smaller leaves, smaller fruits and bitter fruits. The characteristics of the “Klogbo” subgroup were intermediate between those of the “N’Drowa” and “Gnangnan” subgroups (Figure 4). However, some accessions of the “Klogbo” subgroup were in the other two subgroups ranges. Considering the second component of FDA, in all “Gnangnan” accessions and in half of the “N’Drowa” accessions, germination and flowering times were higher and lower, respectively. Conversely, these traits were respectively lower and higher in most “Klogbo” accessions. In the “Gnangnan” subgroup, fruits were standing on the plant and green at commercial ripeness. In the “N’Drowa” and “Gnangnan” subgroups, fruits were mainly hanging on plants and white at commercial ripeness.
Figure 3. Plot of the two components generated by factor discriminant analysis (FDA) showing the spatial distribution of the 12 most discriminating traits (nine quantitative and three qualitative) measured in 326 accessions of the Solanum aethiopicum Gilo group. Please see Table 5 for the abbreviations. Comp. 1 and Comp. 2 refer to the first component (X-axis) and second component (Y-axis) of the FDA, accounting for 91.18% and 8.82% of the total variation, respectively.
Agriculture 04 00260 g003
Figure 4. Plot of the two components generated by factor discriminant analysis (FDA) showing the spatial distribution of 326 accessions of the Solanum aethiopicum Gilo group in three subgroups, “N’Drowa”, “Klogbo” and “Gnangnan”. Component 1 and Component 2 refer to the first component (X-axis) and second component (Y-axis) of the FDA, accounting for 91.18% and 8.82% of the total variation, respectively.
Agriculture 04 00260 g004

4. Discussion

In this study, statistical analyses of quantitative and qualitative morpho-agronomic traits were used for assessing the existence of three distinct eggplant subgroups within the S. aethiopicum Gilo group as described by farmers in Côte d’Ivoire. This experiment is the largest one made on the characterization of African eggplants.
According to Ivorian farmers’ description keys based on fruit shape, size and taste, the Gilo group is subdivided into three subgroups: “N’Drowa”, “Klogbo” and “Gnangnan”. Consistent with this point of view and according to scores of vegetative, floral and fruit traits, this study showed important differences among those subgroups. These results are different from those obtained by Lester and Niakan [10], who described the Gilo group as a homogeneous one. They suggested that the Gilo group is characterized by edible and large fruits (3–6 cm in diameter). It seems like Lester and Niakan [10] may have underestimated the morphological and genetic diversity within the Gilo group. In fact, the large fruit characteristic found in the Gilo group seems to correspond to that of the “N’Drowa” subgroup (4.27 ± 0.07 cm in diameter). Several other studies on the Gilo group [17,18,19] also seemed to be generally focused on the “N’Drowa” subgroup, since they described the same characteristics as Lester and Niakan [10]. The “N’Drowa” subgroup seems to be the most important and largely cultivated within the Gilo group. This was illustrated by the result of the sampling performed during this study (207 out of 326 accessions).
Univariate and multivariate (PCA) analyses of quantitative traits showed that “N’Drowa” accessions had clearly opposite values compared to those of the “Gnangnan” subgroup. Unlike the “N’Drowa” subgroup, the “Gnangnan” subgroup had higher plant height and plant breadth, smaller leaves and smaller fruits. This result suggests a stronger selection effect for higher stem and longer branches in the “Gnangnan” subgroup compared to the “N’Drowa” subgroup in which the selection effect for larger leaves and larger fruits may have occurred. This could also explain the standing position of most fruits on the plant in the “Gnangnan” subgroup compared to the “N’Drowa” subgroup. In this latter subgroup, fruits are generally hanging on the plant, probably due to their larger size and heavier weight. Selection on “Gnangnan” eggplants, spontaneous forms, can be essentially natural. “N’Drowa” and “Klogbo” eggplants, which are cultivated for fruit and leaf consumption [2], are likely under a higher man-made selection pressure, which may change their morphological features more quickly. This explanation was also suggested by Stedje and Bukenya-Ziraba [20] for the whole cultivated species of S. aethiopicum. Further studies should clarify the role of selection in the generation of these subgroups.
Factor discriminant analysis (FDA) clearly clustered the 326 scarlet eggplant accessions into three subgroups that were identified as “N’Drowa”, “Klogbo” and “Gnangnan”. In addition, fruit taste, leaf blade width, fruit diameter, leaf blade length, fruit weight, fruit color at commercial ripeness, petiole length, germination time, plant breadth, fruit position on the plant, fruit length and flowering time were the 12 most discriminating traits, in decreasing order of discrimination power. This result is consistent with those of a substantial number of studies on eggplants characterization [17,18,19,21,22]. The importance of these traits in subgroup differentiation may be related to their interest over several generations of artificial selection. Thus, in a participatory selection study, Adeniji and Aloyce [14] indicated that fruit taste, fruit shape, fruit size and fruit color at commercial ripeness were the descriptors mostly used by farmers for the selection of S. aethiopicum. That may explain the greatest discrimination power of fruit taste in this study. We found that the characteristics of the “Klogbo” subgroup were intermediate between those of the “N’Drowa” and “Gnangnan” subgroups. This result may be explained by the fact that the “Klogbo” subgroup may result from natural hybridization between individuals of the “N’Drowa” and “Gnangnan” subgroups. The identification of these three subgroups can be in agreement with previous results, indicating that the Gilo group displayed larger diversity compared to the Kumba and Aculeatum groups [19].

5. Conclusions

In conclusion, the S. aethiopicum Gilo group is subdivided into three subgroups: “N’Drowa”, “Klogbo” and “Gnangnan”, as indicated by farmers in Côte d’Ivoire. The “N’Drowa” subgroup is characterized by small plant height, small plant breadth, large leaves and large fruits. The fruits of this subgroup are sweet, hanging on the plant and white at commercial ripeness. High plant height, large plant breadth, small leaves and very small and bitter fruit characterized the “Gnangnan” subgroup. This subgroup is also characterized by fruits standing on the plant and having a green color at commercial ripeness. The characteristics of the “Klogbo” subgroup are intermediate between those of the “N’Drowa” and “Gnangnan” subgroups. Accurate identification of subgroups within the Gilo group using molecular makers could be helpful for eggplant improvement programs. For example, resistance to bacterial wilt disease caused by Ralstonia solanacearum has been reported in the S. aethiopicum Gilo group [7], but it is important to exactly know which of the three subgroups, “N’Drowa” and “Klogbo” (cultivated) and “Gnangnan” (spontaneous), actually displays resistance or the best resistance.

Acknowledgments

We are grateful to the managing staff of the Centre National de Recherche Agronomique (CNRA) for having made the experimental stations available. We thank the Dean and all of the staff of the Unité de Formation et de Recherche (UFR)-Biosciences of Félix Houphouët-Boigny University for administrative and technical support. We also thank Yao Youssouf for his significant technical help during eggplant sampling. This article is especially dedicated in memory of Eric Béli-Sika, who unfortunately lost his life just at the end of his PhD work based on this topic.

Author Contributions

Auguste Kouassi and Eric Béli-Sika conceived of and designed the study and performed the experiment and data analysis. Tah Yves-Nathan Tian-Bi performed thorough statistical analyses of data and contributed to writing and proofreading of the manuscript. Oulo Alla N’Nan, Abou B. Kouassi and Jean-Claude N’Zi contributed to writing and proofreading of the manuscript. Assanvo S.-P. N’Guetta and Bakary Tio-Touré worked as advisors during the conduction of experiments and data interpretation.

Conflicts of Interest

The authors declare no conflict of interest.

References

  1. Lester, R.N.; Hakiza, J.J.H.; Stavropoulos, N.; Teixeira, M.M. Variation patterns in the African scarlet eggplant, Solanum aethiopicum L. In Infraspecific Classification of Wild and Cultivated Plants; Styles, B.T., Ed.; Clarendon Press: Oxford, UK, 1986; pp. 283–307. [Google Scholar]
  2. Lester, R.N.; Jaeger, P.-M.L.; Bleijendall-Spierings, B.H.M.; Bleijendaal, H.P.O.; Holloway, H.L.O. African eggplants—A review of collection in West Africa. FAO/IBPGR Plant. Gen. Resour. Newsl. 1990, 81/82, 17–26. [Google Scholar]
  3. Daunay, M.C.; Lester, R.N.; Ano, G. Cultivated eggplants. In Tropical Plant Breeding; Charrirer, A., Jacquot, M., Hamon, S., Nicholas, D., Eds.; Oxford University Press: Oxford, UK, 2001; pp. 200–225. [Google Scholar]
  4. Sękara, A.; Cebula, S.; Kunicki, E. Cultivated eggplants–origin, breeding objectives and genetic resources, a review. Folia Hortic. 2007, 19, 97–114. [Google Scholar]
  5. Toppino, L.; Valè, G.; Rotino, G.L. Inheritance of Fusarium. wilt resistance introgressed from Solanum. aethiopicum Gilo. and Aculeatum. groups into cultivated eggplant (S. melongena) and development of associated PCR-based markers. Mol. Breed. 2008, 22, 237–250. [Google Scholar]
  6. Lim, T.K. Solanum. aethiopicum. In Edible Medicinal and Non-Medicinal Plants; Springer: Dordrecht, Netherlands, 2013; pp. 310–317. [Google Scholar]
  7. Collonnier, C.; Mulya, K.; Fock, I.; Mariska, I.; Servaes, A.; Vedel, F.; Siljak-Yakovlev, S.; Souvannavong, V.; Ducreux, G.; Sihachakr, D. Source of resistance against Ralstonia. solanacearum in fertile somatic hybrids of eggplant (Solanum. melongena L.) with Solanum. aethiopicum L. Plant. Sci. 2001, 160, 301–313. [Google Scholar]
  8. Rizza, F.; Mennella, G.; Collonnier, C.; Sihachakr, D.; Kashyap, V.; Rajam, M.V.; Prestera, M.; Rotino, G.L. Androgenic dihaploids from somatic hybrids between Solanum. melongena and S. aethiopicum group gilo as a source of resistance to Fusarium. oxysporum f. sp. melongenae. Plant Cell. Rep. 2002, 20, 1022–1032. [Google Scholar]
  9. Calvo-Asensio, I.; Prohens, J.; Gisbert, C. Vigor for in vitro Culture Traits in S. melongena × S. aethiopicum Hybrids with Potential as Rootstocks for Eggplant. Sci. World J. 2014, 2014, 1–8. [Google Scholar]
  10. Lester, R.N.; Niakan, L. Origin and domestication of the scarlet eggplant, Solanum aethiopicum, from S. anguivi in Africa. In Solanaceae: Biology and Systematics; D’Arcy, W.G., Ed.; Columbia University Press: New York, NY, USA, 1986; pp. 433–456. [Google Scholar]
  11. Lester, R.N. Taxonomy of scarlet eggplants, Solanum aethiopicum L. Acta Hortic. 1986, 182, 125–132. [Google Scholar]
  12. Nkansah, G.O. Some physiological features of African eggplant, Solanum. aethiopicum group “Gilo”. Sci. Hort. 2001, 90, 181–186. [Google Scholar]
  13. Schippers, R.R. African indigenous vegetables. In An Overview of the Cultivated Speciesrevised. Version on CD-ROM; Natural Resources International: Aylesford, UK, 2002. [Google Scholar]
  14. Adeniji, O.T.; Aloyce, A. Farmer’s Knowledge of Horticultural Traits and Participatory Selection of African Eggplant Varieties (Solanum. aethiopicum) in Tanzania. Tropicultura 2012, 30, 185–191. [Google Scholar]
  15. IBPGR. Descriptors for Eggplants; International Board for Plant Genetic Resources: Rome, Italy, 1990; pp. 1–60. [Google Scholar]
  16. Crawley, M.J. Statistics—An Introduction Using R; Wiley: New York, NY, USA, 2005. [Google Scholar]
  17. Sunseri, F.; Polignano, G.B.; Alba, V.; Lotti, C.; Bisignano, V.; Mennella, G.; Alessandro, A.D.; Bacchi, M.; Riccardi, P.; Fiore, M.C.; et al. Genetic diversity and characterization of African eggplant germplasm collection. Afr. J. Plant. Sci. 2010, 4, 231–241. [Google Scholar]
  18. Adeniji, O.T.; Kusolwa, P.; Reuben, S.W.O.M. Morphological descriptors and microsatellite diversity among scarlet eggplant groups. Afr. Crop. Sci. J. 2013, 21, 37–49. [Google Scholar]
  19. Plazas, M.; Andújar, I.; Vilanova, S.; Gramazio, P.; Herraiz, F.J.; Prohens, J. Conventional and phenomics characterization provides insight into the diversity and relationships of hypervariable scarlet (Solanum. aethiopicum L.) and gboma (S. macrocarpon L.) eggplant complexes. Front. Plant. Sci. 2014, 318, 1–13. [Google Scholar]
  20. Stedje, B.; Bukenya-Ziraba, R. RAPD variation in Solanumanguivi. Lam. and S. aethiopicum L. (Solanaceae) in Uganda. Euphytica 2003, 131, 293–297. [Google Scholar]
  21. Polignano, G.; Uggenti, P.; Bisignano, V.; Della Gatta, C. Genetic divergence analysis in eggplant (Solanum. melongena L.) and allied species. Genet. Res. Crop. Evol. 2010, 57, 171–181. [Google Scholar]
  22. Prohens, J.; Plazas, M.; Raigón, M.D.; Seguí-Simarro, J.M.; Stommel, J.R.; Vilanova, S. Characterization of interspecific hybrids and first backcross generations from crosses between two cultivated eggplants (Solanum. melongena and S. aethiopicum Kumba group) and implications for eggplant breeding. Euphytica 2012, 186, 517–538. [Google Scholar]

