The Effects of Birth Year, Age and Sex on Hemagglutination Inhibition Antibody Responses to Influenza Vaccination

 , ,
, ,
Abstract
:
1. Introduction
2. Materials and Methods
3. Results
3.1. Study Population
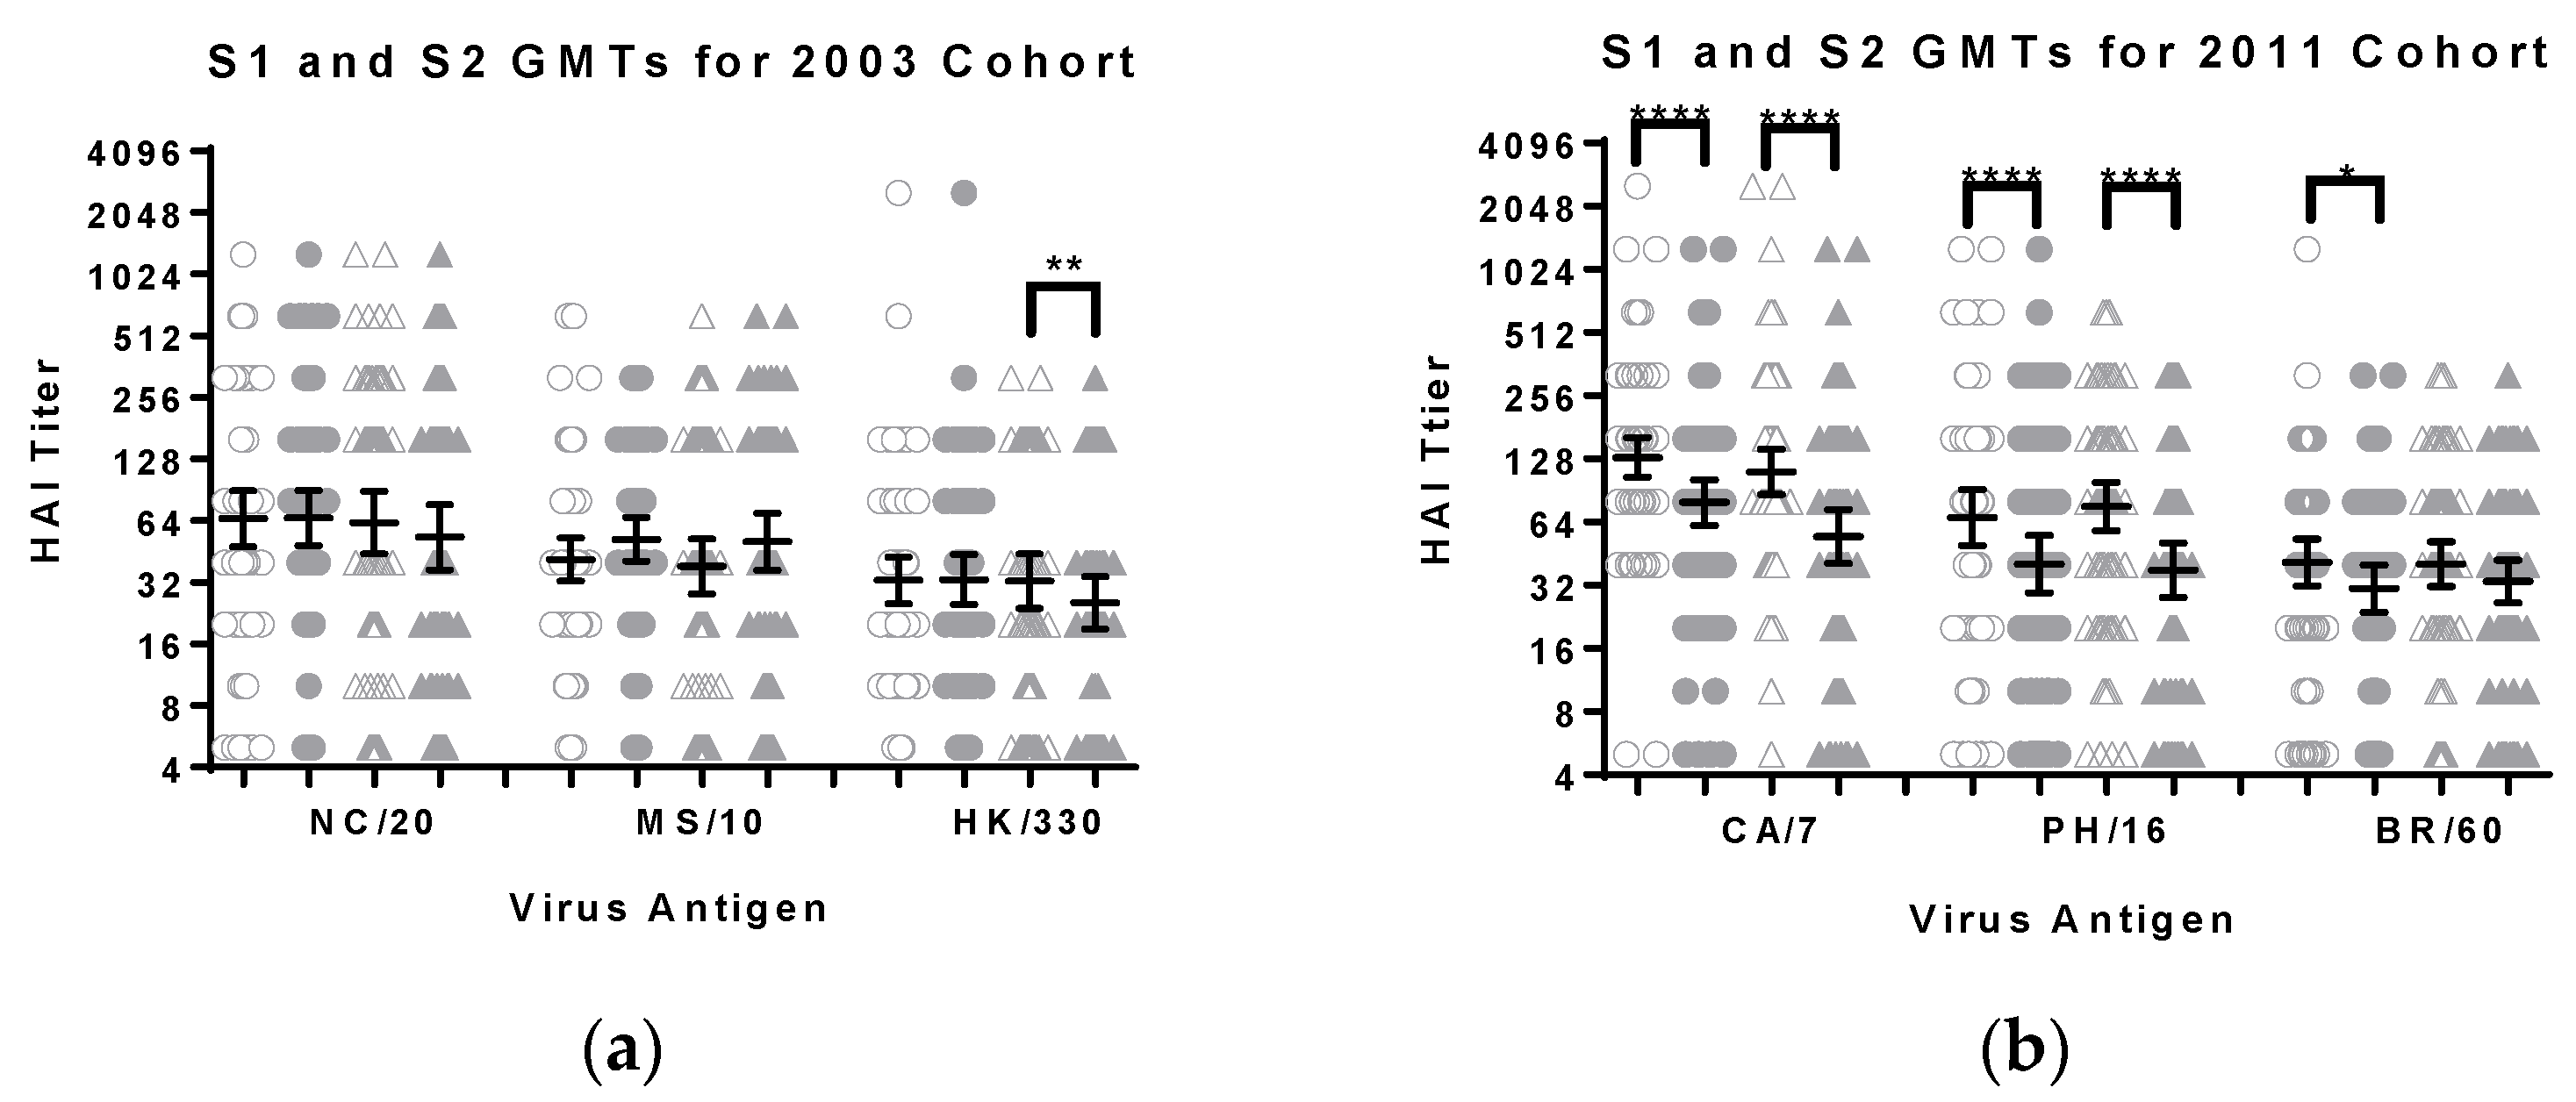
3.2. Comparison of HI Titers for Males and Females
3.3. Age
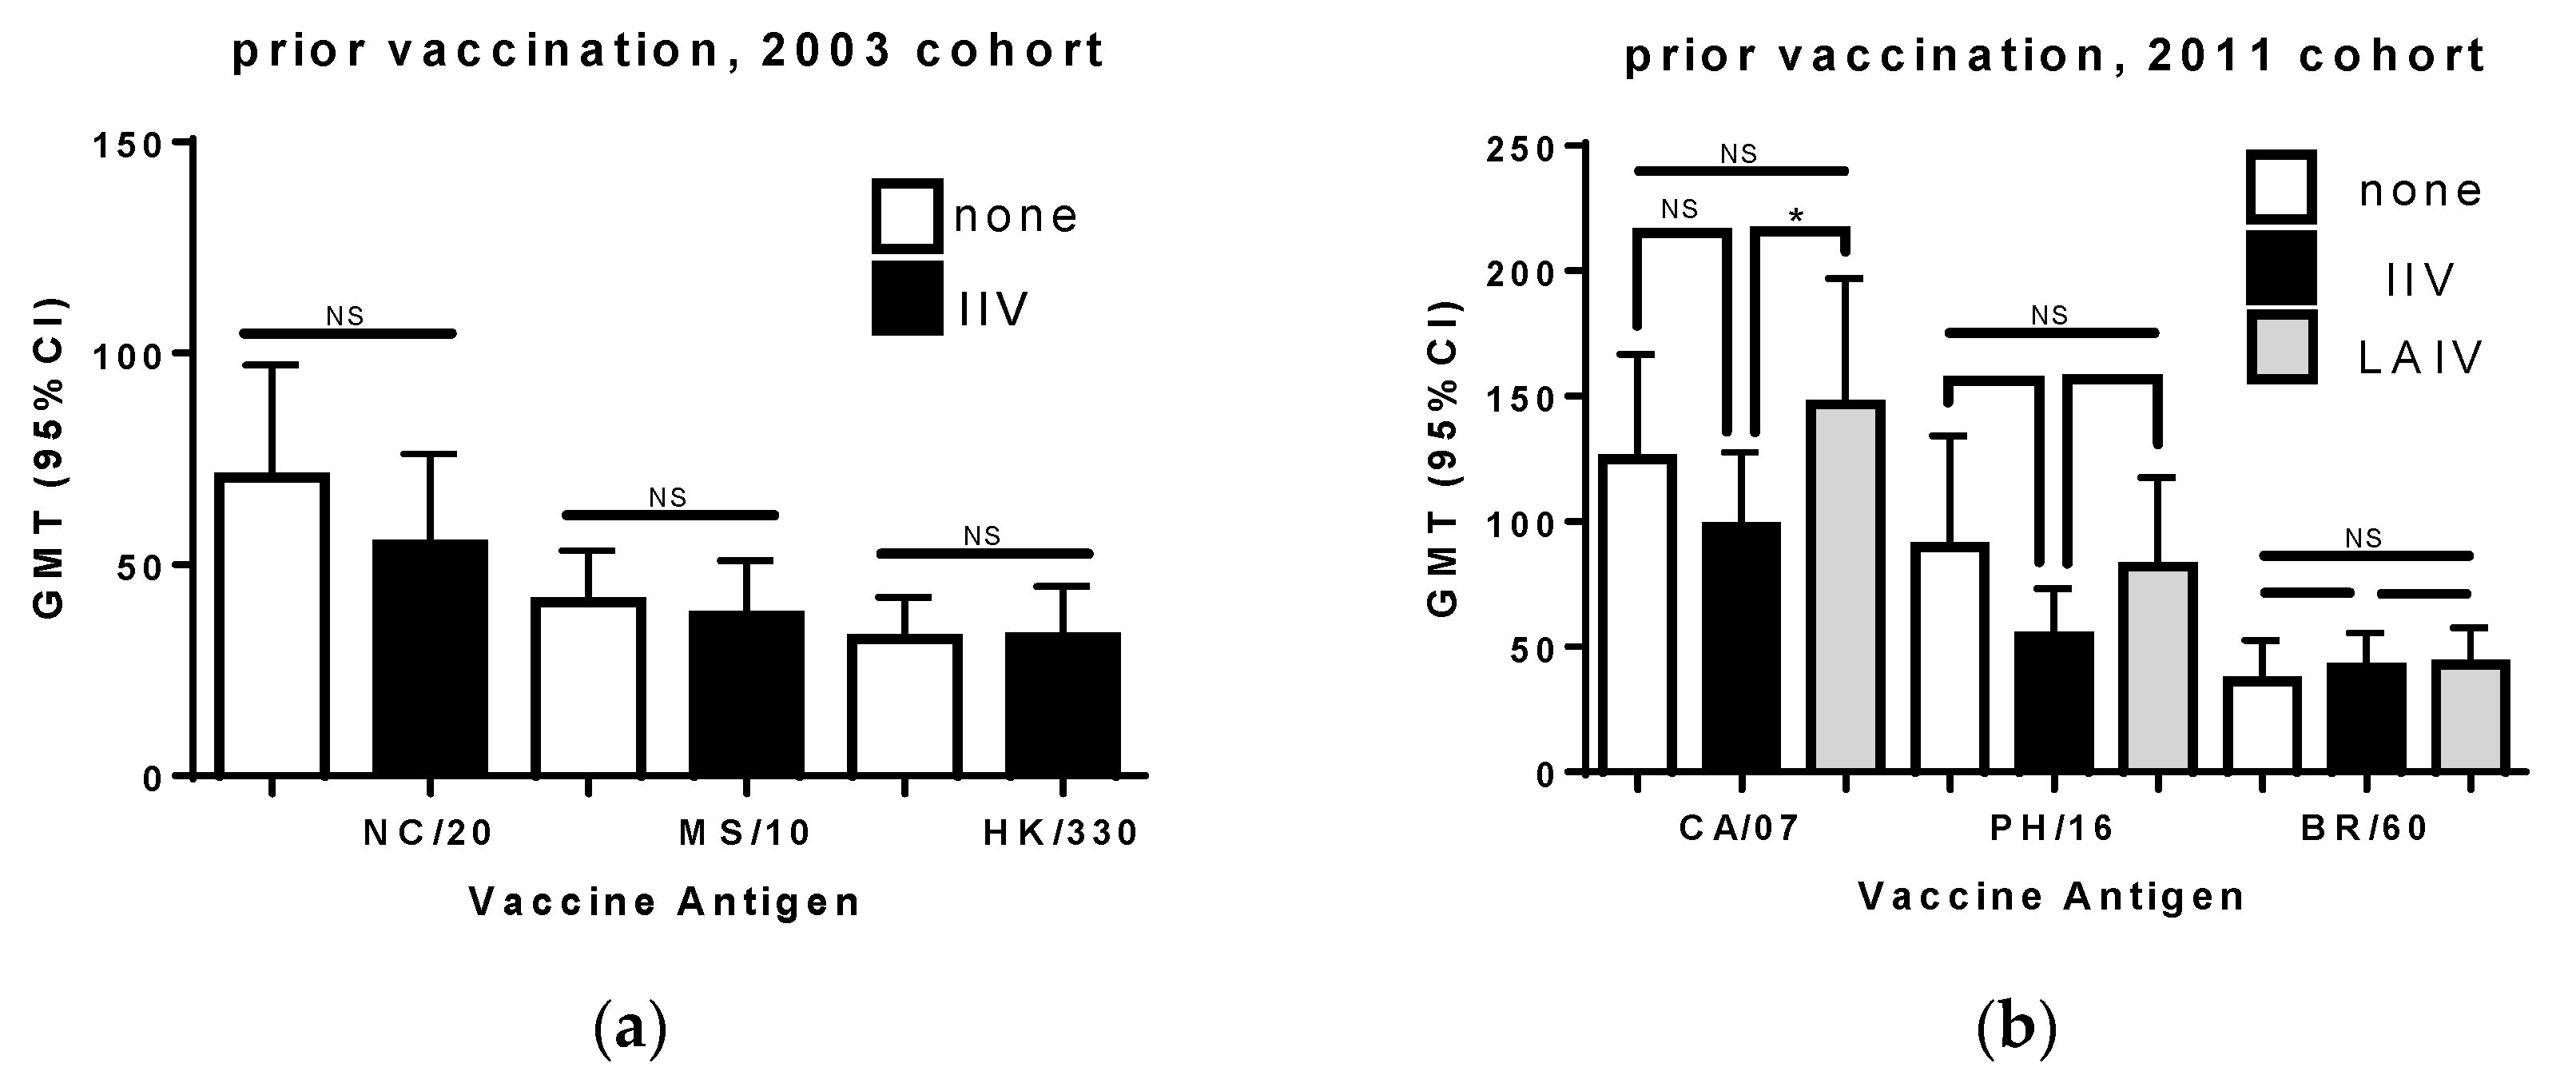
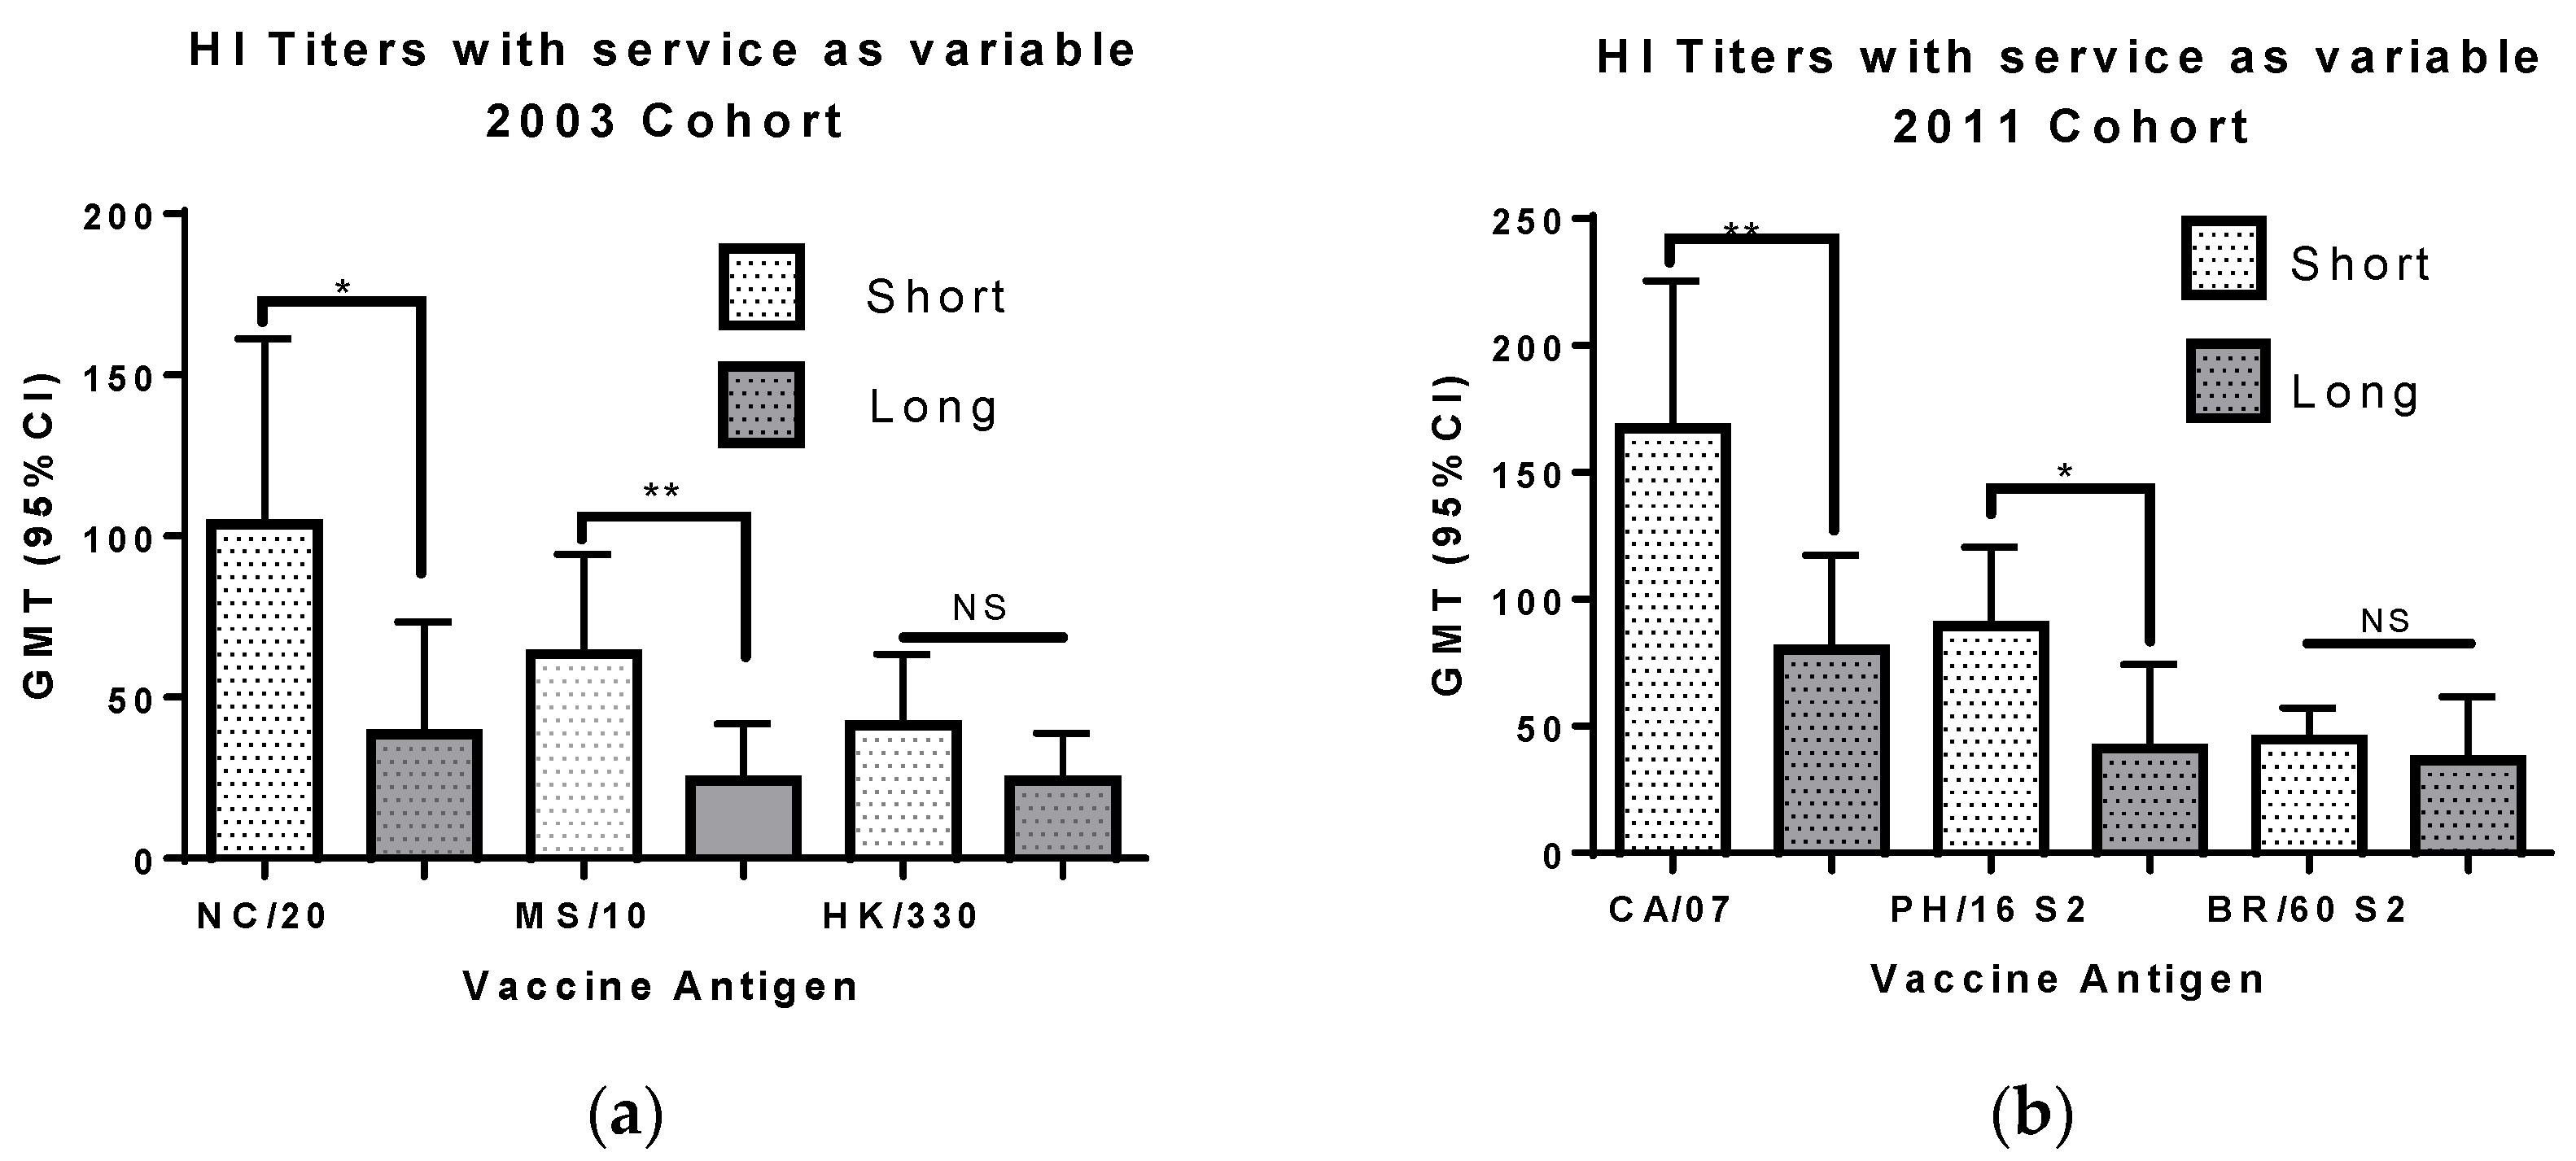
3.4. Prior Seasonal Vaccination
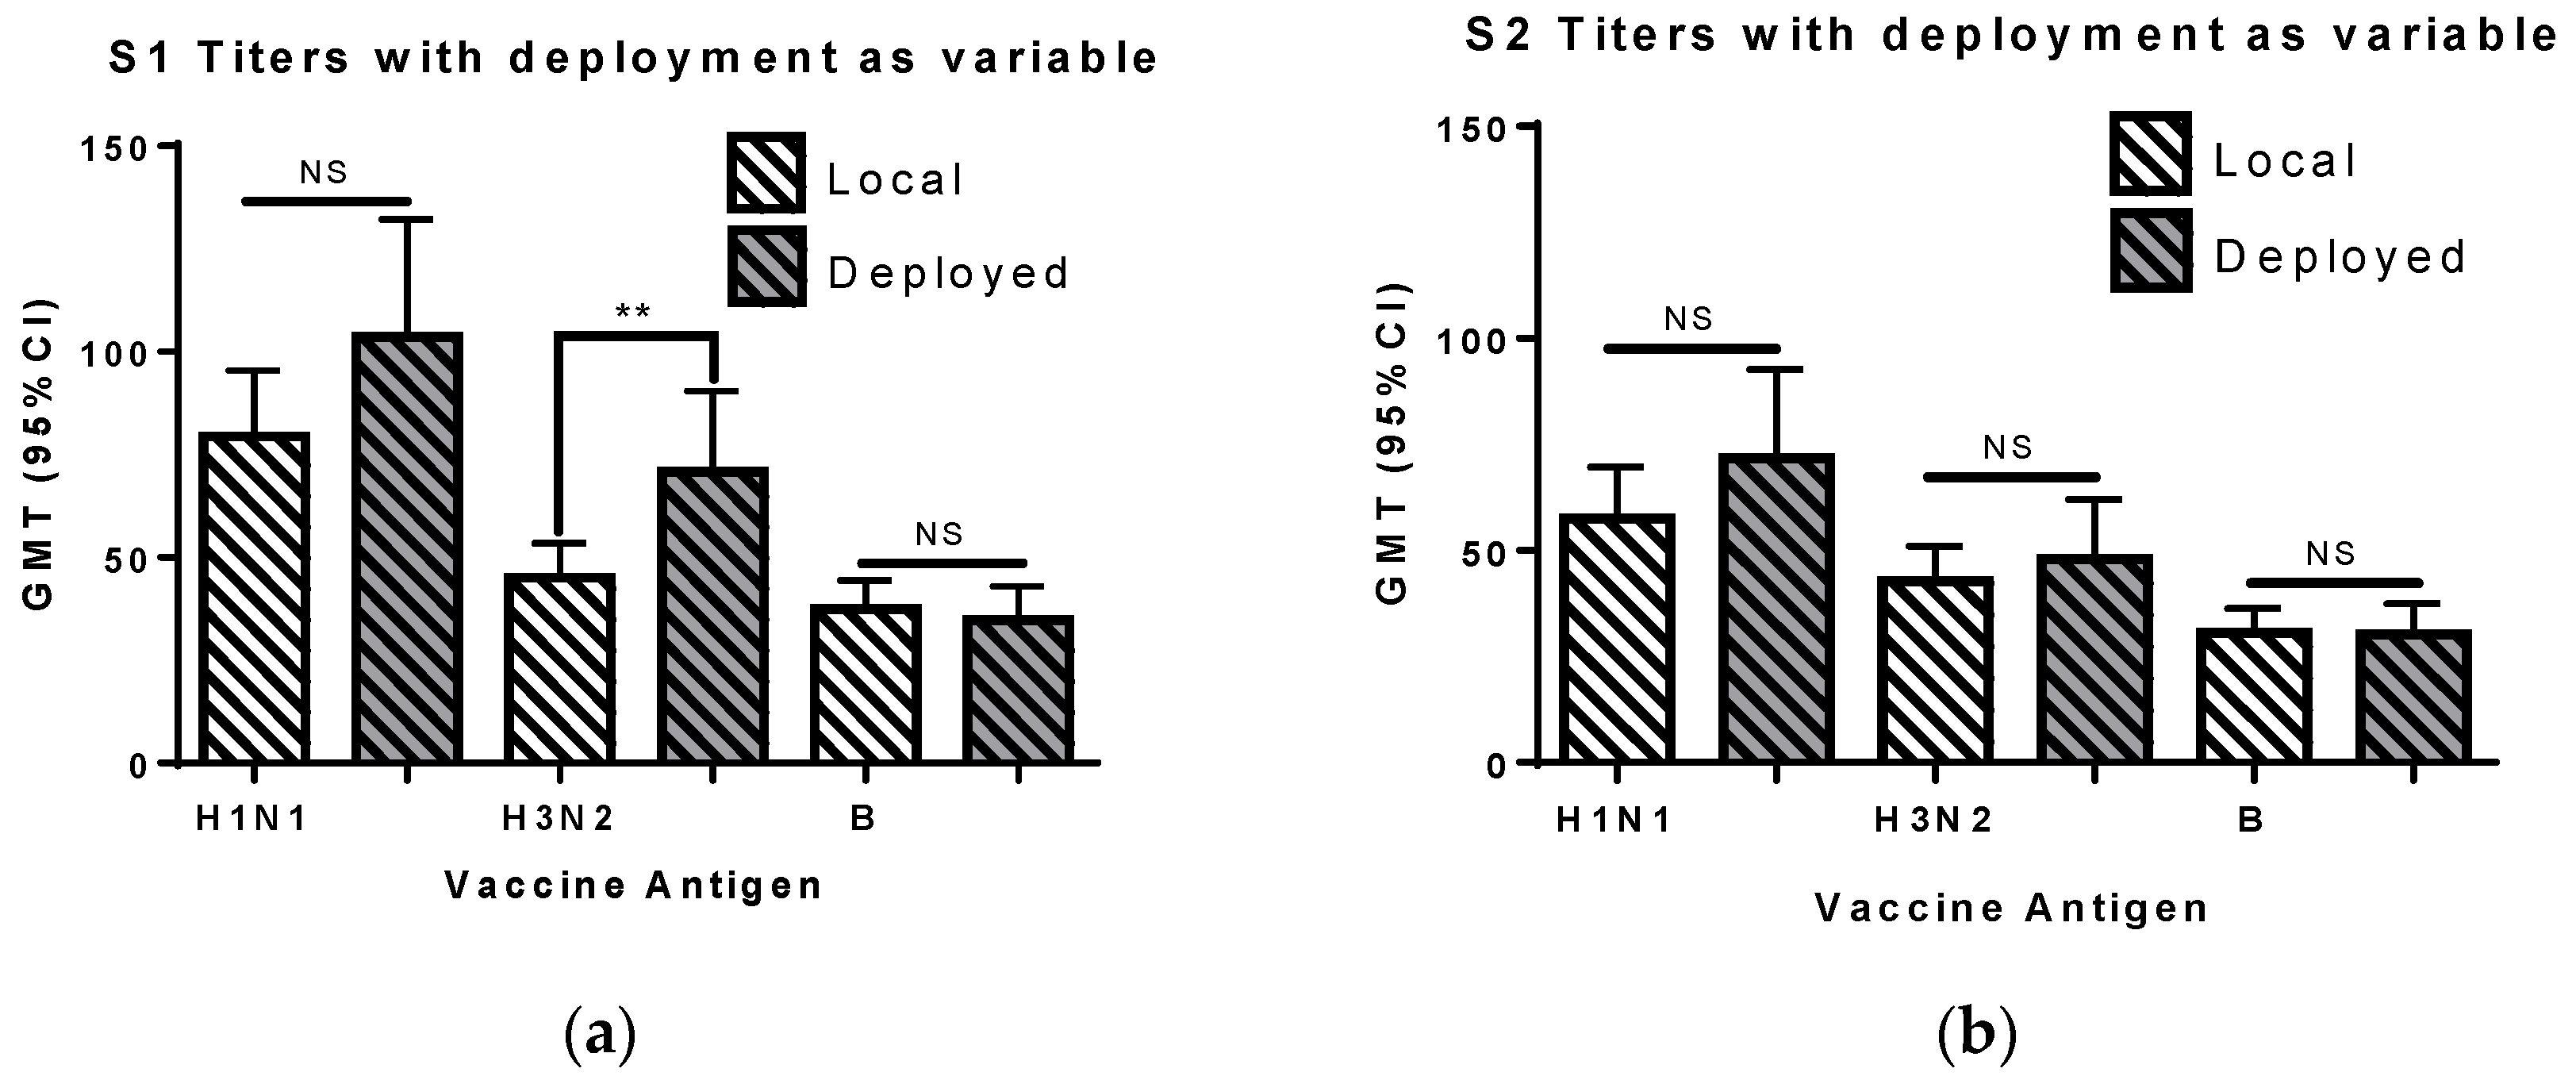
3.5. Deployment
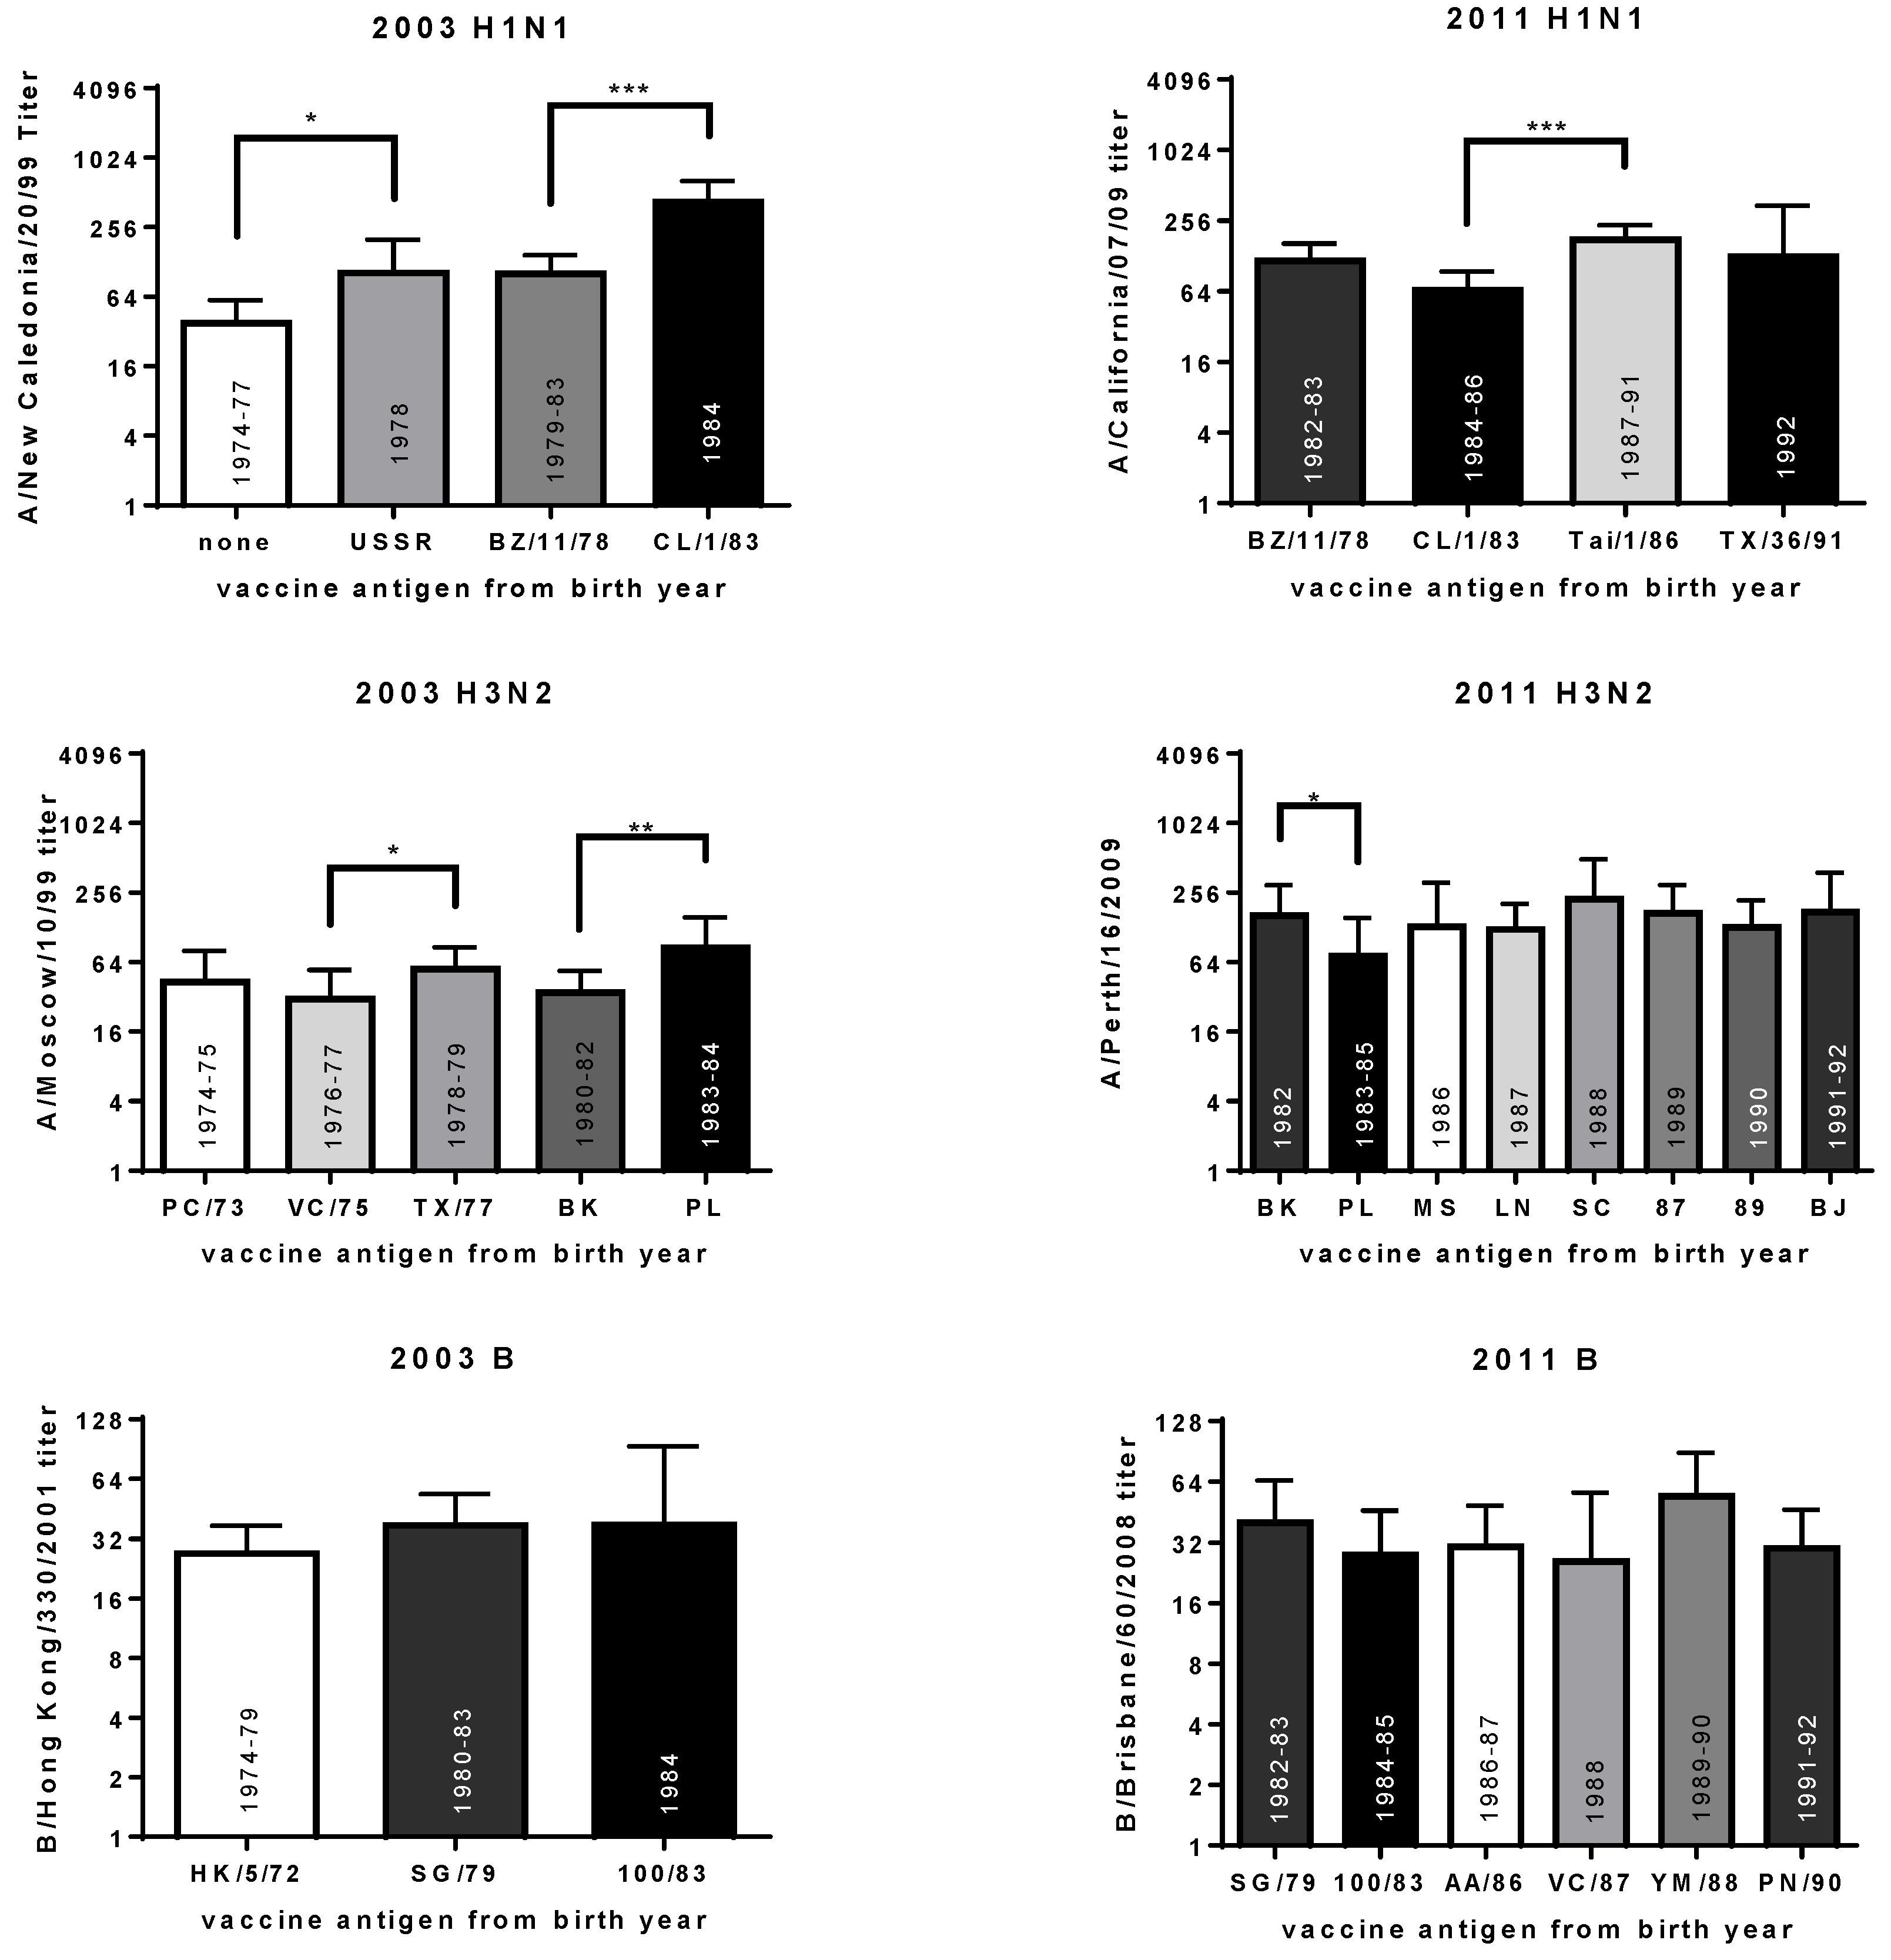
3.6. Year of Birth
4. Discussion
5. Conclusions
Supplementary Materials
Author Contributions
Funding
Acknowledgments
Conflicts of Interest
References
- Hobson, D.; Curry, R.L.; Beare, A.S.; Ward-Gardner, A. The role of serum haemagglutination-inhibiting antibody in protection against challenge infection with influenza A2 and B viruses. J. Hyg. (Lond.) 1972, 70, 767–777. [Google Scholar] [CrossRef] [PubMed]
- Coudeville, L.; Bailleux, F.; Riche, B.; Megas, F.; Andre, P.; Ecochard, R. Relationship between haemagglutination-inhibiting antibody titres and clinical protection against influenza: Development and application of a bayesian random-effects model. BMC Med. Res. Methodol. 2010, 10, 18. [Google Scholar] [CrossRef] [PubMed]
- Black, S.; Nicolay, U.; Vesikari, T.; Knuf, M.; Del Giudice, G.; Della Cioppa, G.; Tsai, T.; Clemens, R.; Rappuoli, R. Hemagglutination inhibition antibody titers as a correlate of protection for inactivated influenza vaccines in children. Pediatr. Infect. Dis. J. 2011, 30, 1081–1085. [Google Scholar] [CrossRef] [PubMed]
- Hannoun, C.; Megas, F.; Piercy, J. Immunogenicity and protective efficacy of influenza vaccination. Virus Res. 2004, 103, 133–138. [Google Scholar] [CrossRef] [PubMed] [Green Version]
- Petrie, J.G.; Ohmit, S.E.; Johnson, E.; Truscon, R.; Monto, A.S. Persistence of antibodies to influenza hemagglutinin and neuraminidase following one or two years of influenza vaccination. J. Infect. Dis. 2015, 212, 1914–1922. [Google Scholar] [CrossRef] [PubMed]
- Nabeshima, S.; Kashiwagi, K.; Murata, M.; Kanamoto, Y.; Furusyo, N.; Hayashi, J. Antibody response to influenza vaccine in adults vaccinated with identical vaccine strains in consecutive years. J. Med. Virol. 2007, 79, 320–325. [Google Scholar] [CrossRef] [PubMed]
- Ng, S.; Ip, D.K.; Fang, V.J.; Chan, K.H.; Chiu, S.S.; Leung, G.M.; Peiris, J.S.M.; Cowling, B.J. The effect of age and recent influenza vaccination history on the immunogenicity and efficacy of 2009–10 seasonal trivalent inactivated influenza vaccination in children. PLoS ONE 2013, 8, e59077. [Google Scholar] [CrossRef] [PubMed]
- Thompson, M.G.; Naleway, A.; Fry, A.M.; Ball, S.; Spencer, S.M.; Reynolds, S.; Bozeman, S.; Levine, M.; Katz, J.M.; Gaglani, M. Effects of repeated annual inactivated influenza vaccination among healthcare personnel on serum hemagglutinin inhibition antibody response to A/Perth/16/2009 (H3N2)-like virus during 2010–11. Vaccine 2016, 34, 981–988. [Google Scholar] [CrossRef] [PubMed]
- Nachbagauer, R.; Choi, A.; Izikson, R.; Cox, M.M.; Palese, P.; Krammer, F. Age Dependence and isotype specificity of influenza virus hemagglutinin stalk-reactive antibodies in humans. mBio 2016, 7, e01996-15. [Google Scholar] [CrossRef] [PubMed]
- Severson, J.J.; Richards, K.R.; Moran, J.J.; Hayney, M.S. Persistence of influenza vaccine-induced antibody in lung transplant patients and healthy individuals beyond the season. Hum. Vaccines Immunother. 2012, 8, 1850–1853. [Google Scholar] [CrossRef] [PubMed] [Green Version]
- Kitphati, R.; Pooruk, P.; Lerdsamran, H.; Poosuwan, S.; Louisirirotchanakul, S.; Auewarakul, P.; Chokphaibulkit, K.; Noisumdaeng, P.; Sawanpanyalert, P.; Puthavathana, P. Kinetics and longevity of antibody response to influenza A H5N1 virus infection in humans. Clin. Vaccine Immunol. 2009, 16, 978–981. [Google Scholar] [CrossRef] [PubMed]
- Kositanont, U.; Assantachai, P.; Wasi, C.; Puthavathana, P.; Praditsuwan, R. Kinetics of the antibody response to seasonal influenza vaccination among the elderly. Viral Immunol. 2012, 25, 471–476. [Google Scholar] [CrossRef] [PubMed]
- Mutsaerts, E.; Madhi, S.A.; Cutland, C.L.; Jones, S.; Hugo, A.; Trenor, S.; Treurnicht, F.K.; Klipstein-Grobusch, K.; Weinberg, A.; Nunes, M.C. Influenza vaccination of pregnant women protects them over two consecutive influenza seasons in a randomized controlled trial. Expert Rev. Vaccines 2016, 15, 1055–1062. [Google Scholar] [CrossRef] [PubMed] [Green Version]
- Valero-Pacheco, N.; Perez-Toledo, M.; Villasis-Keever, M.A.; Nunez-Valencia, A.; Bosco-Garate, I.; Lozano-Dubernard, B.; Lara-Puente, H.; Espitia, C.; Alpuche-Aranda, C.; Bonifaz, L.C.; et al. Antibody persistence in adults two years after vaccination with an H1N1 2009 pandemic influenza virus-like particle vaccine. PLoS ONE 2016, 11, e0150146. [Google Scholar] [CrossRef] [PubMed]
- Hsu, J.P.; Zhao, X.; Chen, M.I.; Cook, A.R.; Lee, V.; Lim, W.Y.; Tan, L.; Barr, I.G.; Jiang, L.; Tan, C.L.; et al. Rate of decline of antibody titers to pandemic influenza A (H1N1-2009) by hemagglutination inhibition and virus microneutralization assays in a cohort of seroconverting adults in Singapore. BMC Infect. Dis. 2014, 14, 414. [Google Scholar] [CrossRef] [PubMed]
- Ruiz-Palacios, G.M.; Leroux-Roels, G.; Beran, J.; Devaster, J.M.; Esen, M.; Launay, O.; McElhaney, J.E.; van Essen, G.A.; Benoit, A.; Claeys, C.; et al. Immunogenicity of AS03-adjuvanted and non-adjuvanted trivalent inactivated influenza vaccines in elderly adults: A Phase 3, randomized trial and post-hoc correlate of protection analysis. Hum. Vaccines Immunother. 2016, 12, 3043–3055. [Google Scholar] [CrossRef] [PubMed] [Green Version]
- Radin, J.M.; Hawksworth, A.W.; Myers, C.A.; Ricketts, M.N.; Hansen, E.A.; Brice, G.T. Influenza vaccine effectiveness: Maintained protection throughout the duration of influenza seasons 2010–2011 through 2013–2014. Vaccine 2016, 34, 3907–3912. [Google Scholar] [CrossRef] [PubMed]
- Puig-Barbera, J.; Mira-Iglesias, A.; Tortajada-Girbes, M.; Lopez-Labrador, F.X.; Librero-Lopez, J.; Diez-Domingo, J.; Carballido-Fernández, M.; Carratalá-Munuera, C.; Correcher-Medina, P.; Gil-Guillén, V.; et al. Waning protection of influenza vaccination during four influenza seasons, 2011/2012 to 2014/2015. Vaccine 2017, 35, 5799–5807. [Google Scholar] [CrossRef] [PubMed]
- Young, B.; Sadarangani, S.; Jiang, L.; Wilder-Smith, A.; Chen, M.I. The duration of influenza vaccine effectiveness: A systematic review, meta-analysis and meta-regression of test-negative design case-control studies. J. Infect. Dis. 2017. [Google Scholar] [CrossRef] [PubMed]
- Skowronski, D.M.; Chambers, C.; Sabaiduc, S.; De Serres, G.; Winter, A.L.; Dickinson, J.A.; Gubbay, J.B.; Drews, S.J.; Martineau, C.; Charest, H.; et al. Beyond antigenic match: Possible agent-host and immuno-epidemiological influences on influenza vaccine effectiveness during the 2015–2016 season in canada. J. Infect. Dis. 2017, 216, 1487–1500. [Google Scholar] [CrossRef] [PubMed]
- Giefing-Kroll, C.; Berger, P.; Lepperdinger, G.; Grubeck-Loebenstein, B. How sex and age affect immune responses, susceptibility to infections, and response to vaccination. Aging Cell 2015, 14, 309–321. [Google Scholar] [CrossRef] [PubMed] [Green Version]
- Plant, E.P.; Fredell, L.J.; Hatcher, B.A.; Li, X.; Chiang, M.J.; Kosikova, M.; Xie, H.; Zoueva, O.; Cost, A.A.; Ye, Z.; et al. Different repeat annual influenza vaccinations improve the antibody response to drifted influenza strains. Sci. Rep. 2017, 7, 5258. [Google Scholar] [CrossRef] [PubMed]
- Cobey, S.; Hensley, S.E. Immune history and influenza virus susceptibility. Curr. Opin. Virol. 2017, 22, 105–111. [Google Scholar] [CrossRef] [PubMed] [Green Version]
- Andrews, S.F.; Kaur, K.; Pauli, N.T.; Huang, M.; Huang, Y.; Wilson, P.C. High preexisting serological antibody levels correlate with diversification of the influenza vaccine response. J. Virol. 2015, 89, 3308–3317. [Google Scholar] [CrossRef] [PubMed]
- Fonville, J.M.; Wilks, S.H.; James, S.L.; Fox, A.; Ventresca, M.; Aban, M.; Xue, L.; Jones, T.C.; Le, N.M.H.; Pham, Q.T.; et al. Antibody landscapes after influenza virus infection or vaccination. Science 2014, 346, 996–1000. [Google Scholar] [CrossRef] [PubMed] [Green Version]
- Miller, M.S.; Gardner, T.J.; Krammer, F.; Aguado, L.C.; Tortorella, D.; Basler, C.F.; Palese, P. Neutralizing antibodies against previously encountered influenza virus strains increase over time: A longitudinal analysis. Sci. Transl. Med. 2013, 5, 198ra07. [Google Scholar] [CrossRef] [PubMed]
- Smith, D.J.; Forrest, S.; Ackley, D.H.; Perelson, A.S. Variable efficacy of repeated annual influenza vaccination. Proc. Natl. Acad. Sci. USA 1999, 96, 14001–14006. [Google Scholar] [CrossRef] [PubMed] [Green Version]
- Monto, A.S.; Malosh, R.E.; Petrie, J.G.; Martin, E.T. The doctrine of original antigenic sin: Separating good from evil. J. Infect. Dis. 2017, 215, 1782–1788. [Google Scholar] [CrossRef] [PubMed]
- Vatti, A.; Monsalve, D.M.; Pacheco, Y.; Chang, C.; Anaya, J.M.; Gershwin, M.E. Original antigenic sin: A comprehensive review. J. Autoimmun. 2017, 83, 12–21. [Google Scholar] [CrossRef] [PubMed]
- Paules, C.I.; Marston, H.D.; Eisinger, R.W.; Baltimore, D.; Fauci, A.S. The pathway to a universal influenza vaccine. Immunity 2017, 47, 599–603. [Google Scholar] [CrossRef] [PubMed]
- Pinheiro, J.; Bates, D.; DebRoy, S.; Sarkar, D. nlme: Linear and Nonlinear Mixed Effects Models, R Package Version 3.1-131.1. 2018 ed. Available online: https://cran.r-project.org/web/packages/nlme/index.html (accessed on 21 February 2018).
- Lee, J.; Boutz, D.R.; Chromikova, V.; Joyce, M.G.; Vollmers, C.; Leung, K.; Horton, A.P.; DeKosky, B.J.; Lee, C.H.; Lavinder, J.J.; et al. Molecular-level analysis of the serum antibody repertoire in young adults before and after seasonal influenza vaccination. Nat. Med. 2016, 22, 1456–1464. [Google Scholar] [CrossRef] [PubMed] [Green Version]
- Christian, L.M.; Beverly, C.; Mitchell, A.M.; Karlsson, E.; Porter, K.; Schultz-Cherry, S.; Ramilo, O. Effects of prior influenza virus vaccination on maternal antibody responses: Implications for achieving protection in the newborns. Vaccine 2017, 35, 5283–5290. [Google Scholar] [CrossRef] [PubMed]
- Sasaki, S.; He, X.S.; Holmes, T.H.; Dekker, C.L.; Kemble, G.W.; Arvin, A.M.; Greenberg, H.B. Influence of prior influenza vaccination on antibody and B-cell responses. PLoS ONE 2008, 3, e2975. [Google Scholar] [CrossRef] [PubMed]
- Levine, M.Z.; Martin, J.M.; Gross, F.L.; Jefferson, S.; Cole, K.S.; Archibald, C.A.; Nowalk, M.P.; Susick, M.; Moehling, K.; Spencer, S.; et al. Neutralizing antibody responses to antigenically drifted influenza A(H3N2) viruses among children and adolescents following 2014–2015 inactivated and live attenuated influenza vaccination. Clin. Vaccine Immunol. 2016, 23, 831–839. [Google Scholar] [CrossRef] [PubMed]
- Nunez, I.A.; Carlock, M.A.; Allen, J.D.; Owino, S.O.; Moehling, K.K.; Nowalk, P.; Susick, M.; Diagle, K.; Sweeney, K.; Mundle, S.; et al. Impact of age and pre-existing influenza immune responses in humans receiving split inactivated influenza vaccine on the induction of the breadth of antibodies to influenza a strains. PLoS ONE 2017, 12, e0185666. [Google Scholar] [CrossRef] [PubMed]
- Lessler, J.; Riley, S.; Read, J.M.; Wang, S.; Zhu, H.; Smith, G.J.D.; Guan, Y.; Jiang, C.Q.; Cummings, D.A.T. Evidence for antigenic seniority in influenza A (H3N2) antibody responses in southern China. PLoS Pathog. 2012, 8, e1002802. [Google Scholar] [CrossRef] [PubMed] [Green Version]
- Barker, W.H. Excess pneumonia and influenza associated hospitalization during influenza epidemics in the United States, 1970–78. Am. J. Public Health 1986, 76, 761–765. [Google Scholar] [CrossRef] [PubMed]
- Thompson, W.W.; Shay, D.K.; Weintraub, E.; Brammer, L.; Cox, N.; Anderson, L.J.; Fukuda, K. Mortality associated with influenza and respiratory syncytial virus in the United States. JAMA 2003, 289, 179–186. [Google Scholar] [CrossRef] [PubMed]
- Alling, D.W.; Blackwelder, W.C.; Stuart-Harris, C.H. A study of excess mortality during influenza epidemics in the United States, 1968–1976. Am. J. Epidemiol. 1981, 113, 30–43. [Google Scholar] [CrossRef] [PubMed]
- Lui, K.J.; Kendal, A.P. Impact of influenza epidemics on mortality in the United States from October 1972 to May 1985. Am. J. Public Health. 1987, 77, 712–716. [Google Scholar] [CrossRef] [PubMed]
- WHO Recommendations on the Composition of Influenza Virus Vaccines. Available online: http://www.who.int/influenza/vaccines/virus/recommendations/en/ (accessed on 6 March 2018).
- World Health Organization Recommendations for Composition of Influenza Vaccines. Available online: https://www.fludb.org/brc/vaccineRecommend.spg?decorator=influenza#1974-1975_Northern%20Hemisphere (accessed on 6 March 2018).
- Centers for Disease C Prevention. Update: Influenza activity--United States and worldwide, 2003-04 season, and composition of the 2004–05 influenza vaccine. MMWR Morb. Mortal. Wkly. Rep. 2004, 53, 547–552. [Google Scholar]
- Centers for Disease C Prevention. Update: Influenza activity—United States, 2011–12 season and composition of the 2012–13 influenza vaccine. MMWR Morb. Mortal. Wkly. Rep. 2012, 61, 414–420. [Google Scholar]
- Liu, K.A.; Mager, N.A. Women’s involvement in clinical trials: Historical perspective and future implications. Pharm. Pract. (Granada) 2016, 14, 708. [Google Scholar] [CrossRef] [PubMed]
- Ingersoll, M.A. Sex differences shape the response to infectious diseases. PLoS Pathog. 2017, 13, e1006688. [Google Scholar] [CrossRef] [PubMed]
- Sue, K. The science behind “man flu”. BMJ 2017, 359, j5560. [Google Scholar] [CrossRef] [PubMed]
- Engler, R.J.; Nelson, M.R.; Klote, M.M.; VanRaden, M.J.; Huang, C.Y.; Cox, N.J.; Klimov, A.; Keitel, W.A.; Nichol, K.L.; Carr, W.W.; et al. Half- vs full-dose trivalent inactivated influenza vaccine (2004–2005): Age, dose, and sex effects on immune responses. Arch. Intern. Med. 2008, 168, 2405–2414. [Google Scholar] [CrossRef] [PubMed]
- Falsey, A.R.; Treanor, J.J.; Tornieporth, N.; Capellan, J.; Gorse, G.J. Randomized, double-blind controlled phase 3 trial comparing the immunogenicity of high-dose and standard-dose influenza vaccine in adults 65 years of age and older. J. Infect. Dis. 2009, 200, 172–180. [Google Scholar] [CrossRef] [PubMed]
- Khurana, S.; Verma, N.; Talaat, K.R.; Karron, R.A.; Golding, H. Immune response following H1N1pdm09 vaccination: Differences in antibody repertoire and avidity in young adults and elderly populations stratified by age and gender. J. Infect. Dis. 2012, 205, 610–620. [Google Scholar] [CrossRef] [PubMed]
- Simell, B.; Nurkka, A.; Lahdenkari, M.; Givon-Lavi, N.; Kayhty, H.; Dagan, R.; Jokinen, J. Association of serotype-specific antibody concentrations and functional antibody titers with subsequent pneumococcal carriage in toddlers immunized with a 9-valent pneumococcal conjugate vaccine. Clin. Vaccine Immunol. 2012, 19, 96–99. [Google Scholar] [CrossRef] [PubMed]
- Fink, A.L.; Klein, S.L. Sex and gender impact immune responses to vaccines among the elderly. Physiology (Bethesda) 2015, 30, 408–416. [Google Scholar] [CrossRef] [PubMed]
- Gergen, P.J.; McQuillan, G.M.; Kiely, M.; Ezzati-Rice, T.M.; Sutter, R.W.; Virella, G. A population-based serologic survey of immunity to tetanus in the United States. N. Engl. J. Med. 1995, 332, 761–766. [Google Scholar] [CrossRef] [PubMed]
- Furman, D.; Hejblum, B.P.; Simon, N.; Jojic, V.; Dekker, C.L.; Thiebaut, R.; Tibshirani, R.J.; Davis, M.M. Systems analysis of sex differences reveals an immunosuppressive role for testosterone in the response to influenza vaccination. Proc. Natl. Acad. Sci. USA 2014, 111, 869–874. [Google Scholar] [CrossRef] [PubMed]
- Worobey, M.; Han, G.Z.; Rambaut, A. Genesis and pathogenesis of the 1918 pandemic H1N1 influenza A virus. Proc. Natl. Acad. Sci. USA 2014, 111, 8107–8112. [Google Scholar] [CrossRef] [PubMed] [Green Version]
- Lewnard, J.A.; Cobey, S. Immune history and influenza vaccine effectiveness. Vaccines 2018, 6. [Google Scholar] [CrossRef] [PubMed]
- Gagnon, A.; Acosta, E.; Hallman, S.; Bourbeau, R.; Dillon, L.Y.; Ouellette, N.; Earn, D.J.D.; Herring, D.A.; Inwood, K.; Madrenas, J.; et al. Pandemic paradox: Early life H2N2 pandemic influenza infection enhanced susceptibility to death during the 2009 H1N1 pandemic. mBio 2018, 9, e02091-17. [Google Scholar] [CrossRef] [PubMed]
- Skowronski, D.M.; Chambers, C.; De Serres, G.; Sabaiduc, S.; Winter, A.L.; Dickinson, J.A.; Gubbay, J.B.; Fonseca, K.; Drews, S.J.; Charest, H.; et al. Age-related differences in influenza B infection by lineage in a community-based sentinel system, 2010–2011 to 2015–2016, Canada. J. Infect. Dis. 2017, 216, 697–702. [Google Scholar] [CrossRef] [PubMed]
- Brodin, P.; Jojic, V.; Gao, T.; Bhattacharya, S.; Angel, C.J.; Furman, D.; Shen-Orr, S.; Dekker, C.L.; Swan, G.E.; Butte, A.J.; et al. Variation in the human immune system is largely driven by non-heritable influences. Cell 2015, 160, 37–47. [Google Scholar] [CrossRef] [PubMed]
- Belongia, E.A.; Skowronski, D.M.; McLean, H.Q.; Chambers, C.; Sundaram, M.E.; De Serres, G. Repeated annual influenza vaccination and vaccine effectiveness: Review of evidence. Expert Rev. Vaccines 2017, 16, 1–14. [Google Scholar] [CrossRef] [PubMed]
- Beyer, W.E.P.; Palache, A.M.; Boulfich, M.; Osterhaus, A. Rationale for two influenza B lineages in seasonal vaccines: A meta-regression study on immunogenicity and controlled field trials. Vaccine 2017, 35, 4167–4176. [Google Scholar] [CrossRef] [PubMed]
- Laurie, K.L.; Horman, W.; Carolan, L.A.; Chan, K.F.; Layton, D.; Bean, A.; Vijaykrishna, D.; Reading, P.C.; McCaw, J.M.; Barr, I.G. Evidence for viral interference and cross-reactive protective immunity between influenza B virus lineages. J. Infect. Dis. 2018, 217, 548–559. [Google Scholar] [CrossRef] [PubMed]
- Gross, P.A.; Denning, C.R.; Gaerlan, P.F.; Bonelli, J.; Bernius, M.; Dran, S.; Monk, G.; Vassallo, M.; Quinnan, G.V., Jr.; Levandowski, R.; et al. Annual influenza vaccination: Immune response in patients over 10 years. Vaccine 1996, 14, 1280–1284. [Google Scholar] [CrossRef]
- He, X.S.; Holmes, T.H.; Sanyal, M.; Albrecht, R.A.; Garcia-Sastre, A.; Dekker, C.L.; Davis, M.M.; Greenberg, H.B. Distinct patterns of B-cell activation and priming by natural influenza virus infection versus inactivated influenza vaccination. J. Infect. Dis. 2015, 211, 1051–1059. [Google Scholar] [CrossRef] [PubMed]
- Kang, E.K.; Eun, B.W.; Kim, N.H.; Lim, J.S.; Lee, J.A.; Kim, D.H. The priming effect of previous natural pandemic H1N1 infection on the immunogenicity to subsequent 2010–2011 influenza vaccination in children: A prospective cohort study. BMC Infect. Dis. 2016, 16, 438. [Google Scholar] [CrossRef] [PubMed]


| Cohort | Vaccine Strains | Years Vaccinated |
|---|---|---|
| 2003 | A/New Caledonia/20/1999 (H1N1), A/Moscow/10/1999 (H3N2), B/Hong Kong/330/2001 (Victoria) | 2003 |
| 2011 | A/California/7/2009 (pdmH1N1), A/Perth/16/2009 (H3N2), B/Brisbane/60/2008 (Victoria) | 2010 or 2011 |
| Antigen | Group | GMT (S1) | GMT (S2) | Number of Samples with Decline |
|---|---|---|---|---|
| A/New Caledonia/20/1999 (H1N1) | Men | 66 | 66 | 17 |
| Women | 63 | 53 | 30 | |
| A/Moscow/10/1999 (H3N2) | Men | 41 | 52 | 22 |
| Women | 38 | 51 | 20 | |
| B/Hong Kong/330/2001 (Victoria) | Men | 33 | 33 | 21 |
| Women | 32 | 25 ** | 24 |
| Antigen | Group | GMT (S1) | GMT (S2) | Number of Samples with Decline |
|---|---|---|---|---|
| A/California/07/2009 (pdmH1N1) | Men | 130 | 79 **** | 38 |
| Women | 111 | 55 **** | 50 | |
| A/Perth/16/2009 (H3N2) | Men | 67 | 40 **** | 41 |
| Women | 76 | 38 **** | 53 | |
| B/Brisbane/60/2008 (Victoria) | Men | 41 | 31 * | 32 |
| Women | 40 | 33 | 29 |
| Antigen | Group | S1 | p-Value | S2 | p-Value |
|---|---|---|---|---|---|
| A/New Caledonia/20/1999 (H1N1) | Men | −0.541 | <0.001 | −0.423 | <0.001 |
| Women | −0.482 | <0.001 | −0.483 | <0.001 | |
| A/Moscow/10/1999 (H3N2) | Men | −0.320 | 0.004 | −0.289 | 0.009 |
| Women | −0.183 | 0.105 | −0.127 | 0.261 | |
| B/Hong Kong/330/2001 (Victoria) | Men | −0.310 | 0.005 | −0.272 | 0.015 |
| Women | −0.009 | 0.940 | 0.059 | 0.604 | |
| A/California/07/2009 (pdmH1N1) | Men | −0.213 | 0.058 | −0.376 | <0.001 |
| Women | −0.105 | 0.354 | −0.160 | 0.156 | |
| A/Perth/16/2009 (H3N2) | Men | 0.012 | 0.915 | −0.129 | 0.252 |
| Women | −0.243 | 0.030 | −0.046 | 0.682 | |
| B/Brisbane/60/2008 (Victoria) | Men | 0.267 | 0.006 | 0.257 | 0.016 |
| Women | 0.027 | 0.809 | 0.236 | 0.035 |
| Year | H1N1 | H3N2 | B Virus |
|---|---|---|---|
| 1974–1975 | A/Port Chalmers/1/73 | B/Hong Kong/5/72 | |
| 1975–1976 | A/Port Chalmers/1/73 | B/Hong Kong/5/72 | |
| 1976–1977 | A/Victoria/3/75 | B/Hong Kong/5/72 | |
| 1977–1978 | A/Victoria/3/75 | B/Hong Kong/5/72 | |
| 1978–1979 | A/USSR/90/77 | A/Texas/1/77 | B/Hong Kong/5/72 |
| 1979–1980 | A/Brazil/11/78 | A/Texas/1/77 | B/Hong Kong/5/72 |
| 1980–1981 | A/Brazil/11/78 | A/Bangkok/1/79 | B/Singapore/222/79 |
| 1981–1982 | A/Brazil/11/78 | A/Bangkok/1/79 | B/Singapore/222/79 |
| 1982–1983 | A/Brazil/11/78 | A/Bangkok/1/79 | B/Singapore/222/79 |
| 1983–1984 | A/Brazil/11/78 | A/Philippines/2/82 | B/Singapore/222/79 |
| 1984–1985 | A/Chile/1/83 | A/Philippines/2/82 | B/USSR/100/83 |
| 1985–1986 | A/Chile/1/83 | A/Philippines/2/82 | B/USSR/100/83 |
| 1986–1987 | A/Chile/1/83 | A/Mississippi/1/85 | B/Ann Arbor/1/86 |
| 1987–1988 | A/Taiwan/1/86 | A/Leningrad/360/86 | B/Ann Arbor/1/86 |
| 1988–1989 | A/Taiwan/1/86 | A/Sichuan/2/87 | B/Victoria/2/87 |
| 1989–1990 | A/Taiwan/1/86 | A/Shanghai/11/87 | B/Yamagata/16/88 |
| 1990–1991 | A/Taiwan/1/86 | A/Shanghai/16/89 | B/Yamagata/16/88 |
| 1991–1992 | A/Taiwan/1/86 | A/Beijing/353/89 | B/Panama/45/90 |
| 1992–1993 | A/Texas/36/91 | A/Beijing/353/89 | B/Panama/45/90 |
| Year | Dominant Virus Type | References |
|---|---|---|
| 1973 | H3N2 | [38,40,41] |
| 1974 | H3N2 | [38,40,41] |
| 1975 | H3N2 | [38,40,41] |
| 1976 | H3N2 | [38,39,41] |
| 1977 | B (+25% H3N2) | [38,39,41] |
| 1978 | H3N2 (+16% H1N1) | [39,41] |
| 1979 | H1N1 | [39,41] |
| 1980 | B virus | [39,41] |
| 1981 | H3N2 (+22% H1N1) | [41] |
| 1982 | B virus (+24% H1N1) | [41]; MMWR 1982; 31(27): 375–379 |
| 1983 | H3N2 | [41]; MMWR 1983; 32(29): 373–377 |
| 1984 | H1N1 (+45% B virus) | [41]; MMWR 1984; 33(29): 417–421 |
| 1985 | H3N2 | [41]; MMWR 1985; 34(28): 440–444 |
| 1986 | B Virus (+24% H2N3) | [41]; MMWR 1986; 35(29): 475–479 |
| 1987 | H1N1 | [41]; MMWR 1988; 37(31): 466, 468–470, 475 |
| 1988 | H3N2 | [41]; MMWR 1988; 37(32): 497–503 |
| 1989 | B Virus (+44% H1N1) | [41]; MMWR 1989; 38(11): 183–185 |
| 1990 | H3N2 | [41]; MMWR 1990; 39(17): 293–296 |
| 1991 | B Virus | [41]; MMWR 1991; 40(14): 231–233, 239–240 |
| 1992 | H3N2 (+18% H1N1) | [41]; MMWR 1992; 41(18); 315–317, 323 |
| 1993 | B Virus | [41]; MMWR 1992; 41(18): 315–317, 323 |
© 2018 by the authors. Licensee MDPI, Basel, Switzerland. This article is an open access article distributed under the terms and conditions of the Creative Commons Attribution (CC BY) license (http://creativecommons.org/licenses/by/4.0/).
Share and Cite
Plant, E.P.; Eick-Cost, A.A.; Ezzeldin, H.; Sanchez, J.L.; Ye, Z.; Cooper, M.J. The Effects of Birth Year, Age and Sex on Hemagglutination Inhibition Antibody Responses to Influenza Vaccination. Vaccines 2018, 6, 39. https://doi.org/10.3390/vaccines6030039
Plant EP, Eick-Cost AA, Ezzeldin H, Sanchez JL, Ye Z, Cooper MJ. The Effects of Birth Year, Age and Sex on Hemagglutination Inhibition Antibody Responses to Influenza Vaccination. Vaccines. 2018; 6(3):39. https://doi.org/10.3390/vaccines6030039
Chicago/Turabian StylePlant, Ewan P., Angelia A. Eick-Cost, Hussein Ezzeldin, Jose L. Sanchez, Zhiping Ye, and Michael J. Cooper. 2018. "The Effects of Birth Year, Age and Sex on Hemagglutination Inhibition Antibody Responses to Influenza Vaccination" Vaccines 6, no. 3: 39. https://doi.org/10.3390/vaccines6030039