Determination of Reduced and Oxidized Coenzyme Q10 in Canine Plasma and Heart Tissue by HPLC-ECD: Comparison with LC-MS/MS Quantification


Abstract
:1. Introduction
2. Materials and Methods
2.1. Chemicals and Materials
2.2. Biological Samples
2.3. HPLC-ECD
2.4. LC-MS/MS
2.5. Optimization of Extraction Procedure
2.5.1. Plasma
2.5.2. Heart Tissue
2.6. Final Extraction Procedures
2.6.1. Plasma
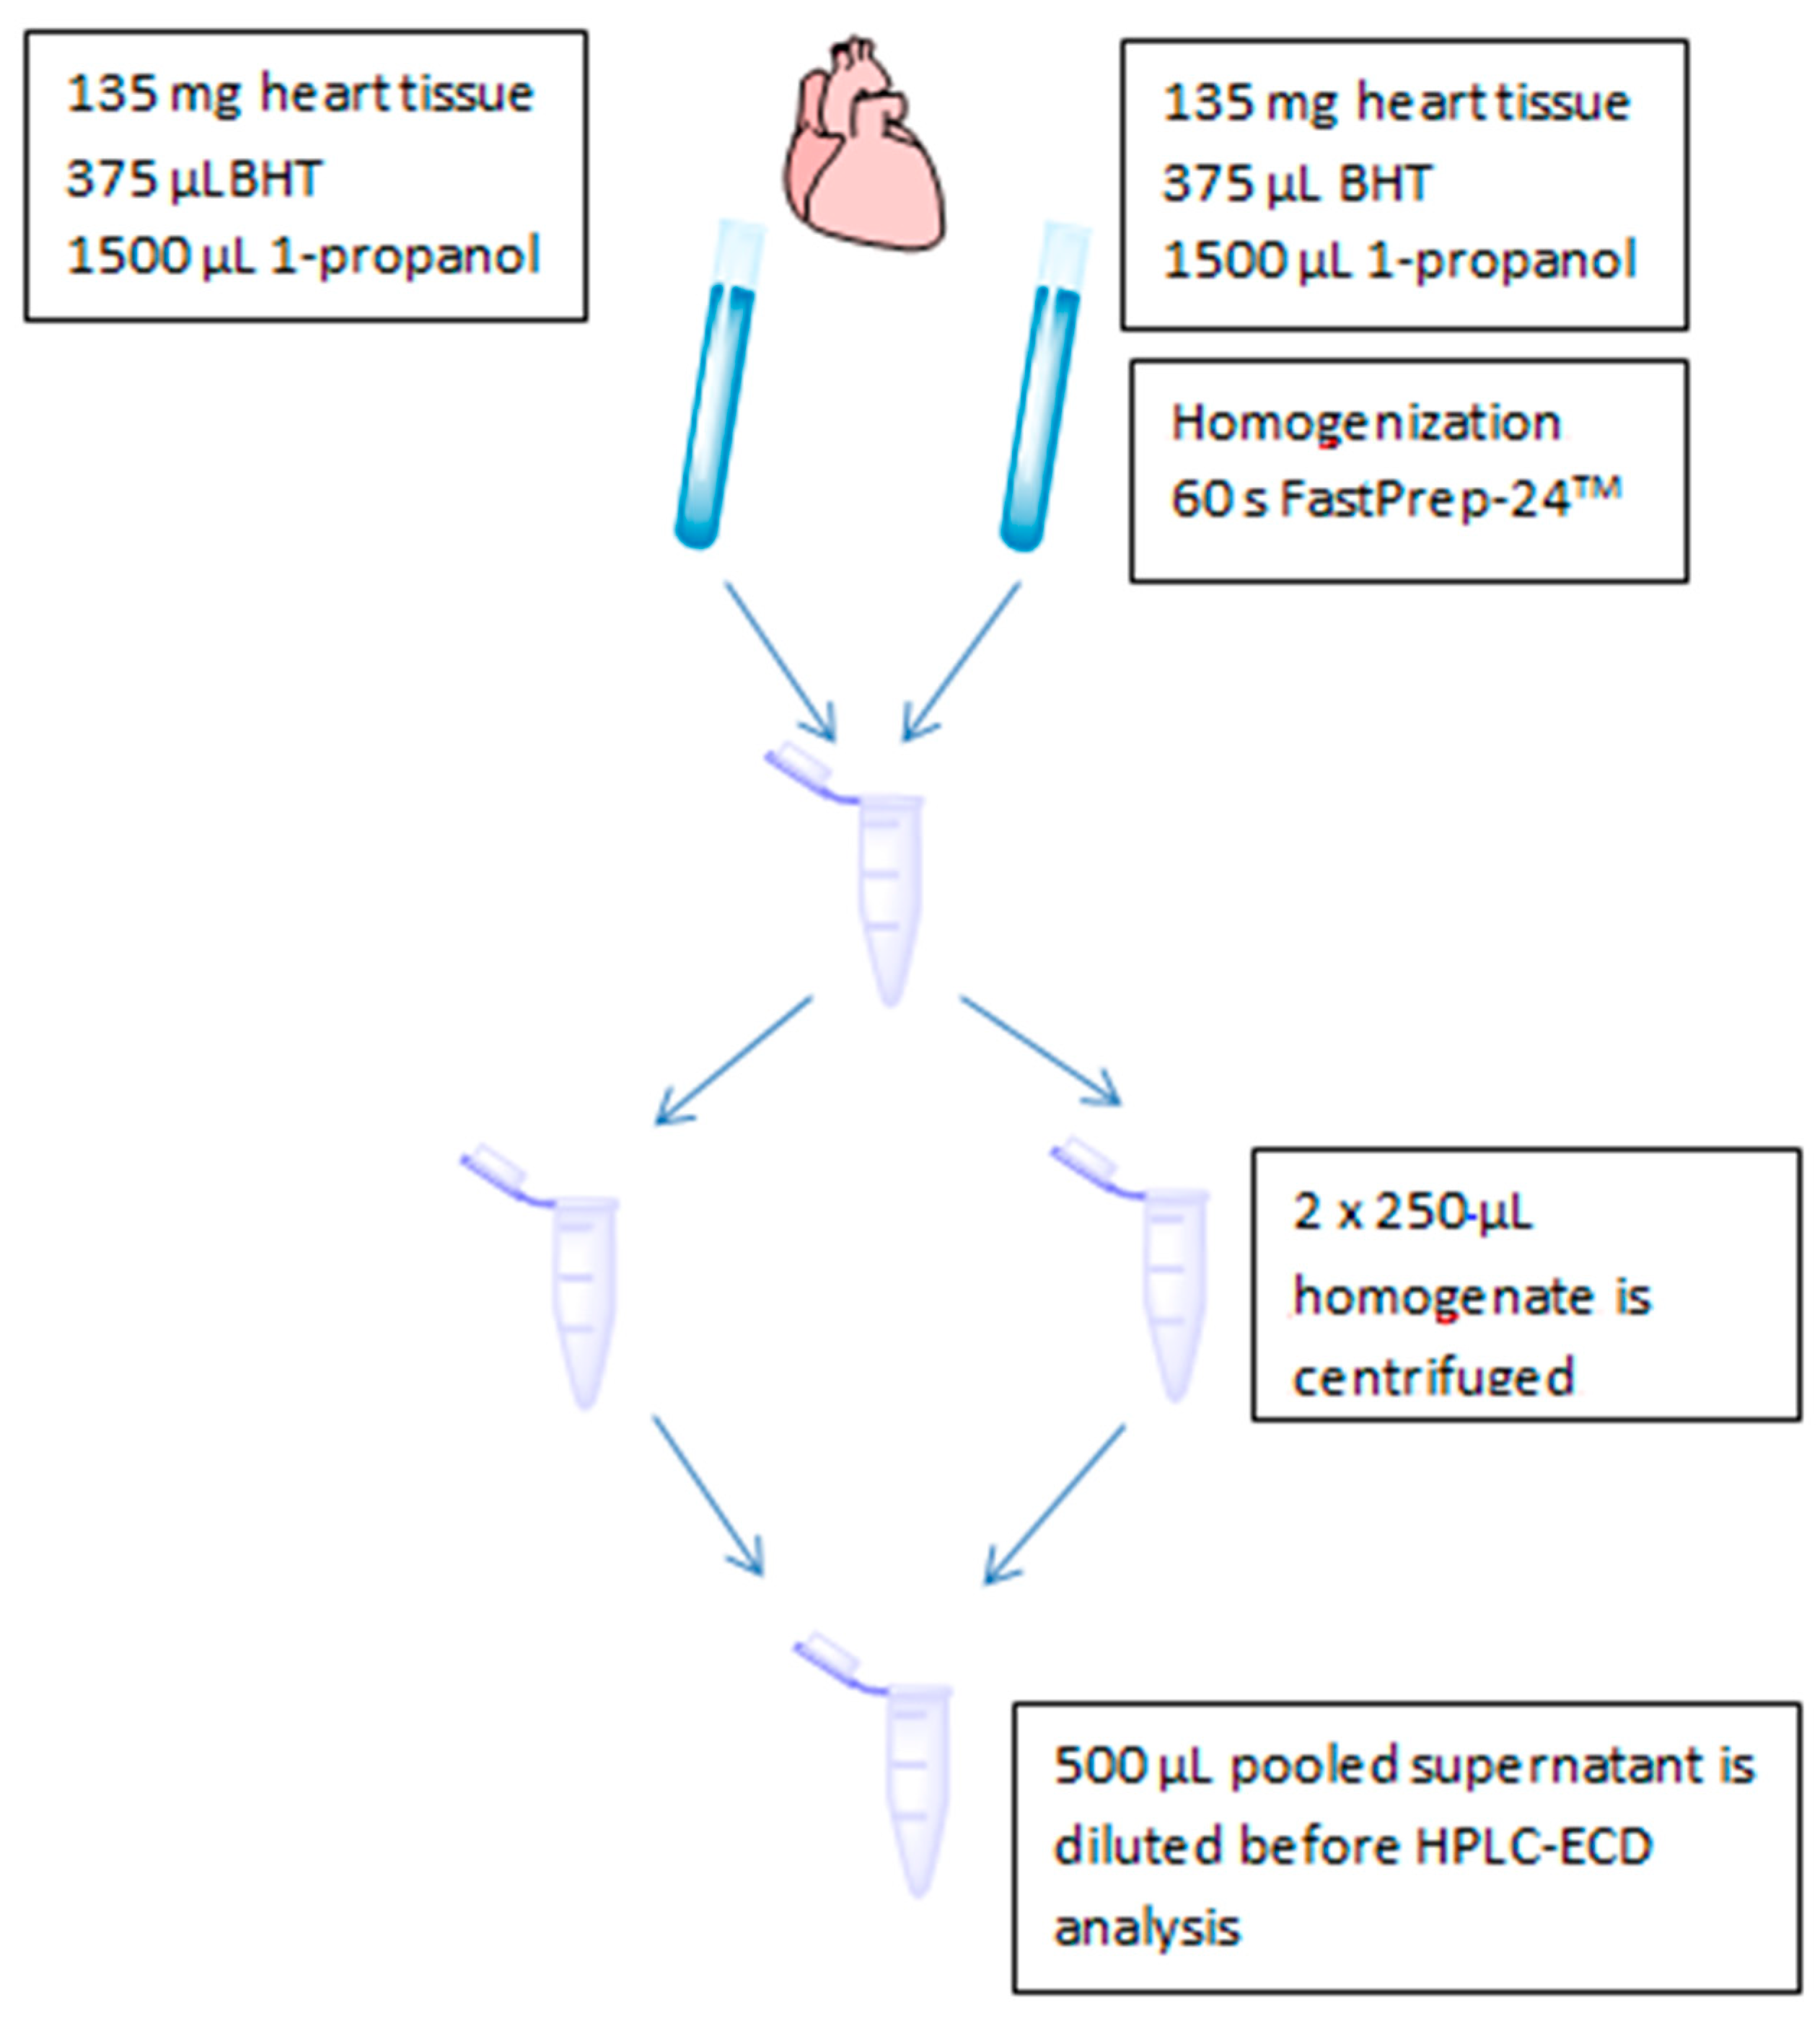
2.6.2. Heart Tissue
2.7. Validation of the HPLC-ECD Method
2.7.1. Calibration Curves and Sensitivity
2.7.2. Precision and Accuracy
2.7.3. Stability
2.7.4. Data Analysis
2.8. Comparison of HPLC-ECD with LC-MS/MS
3. Results
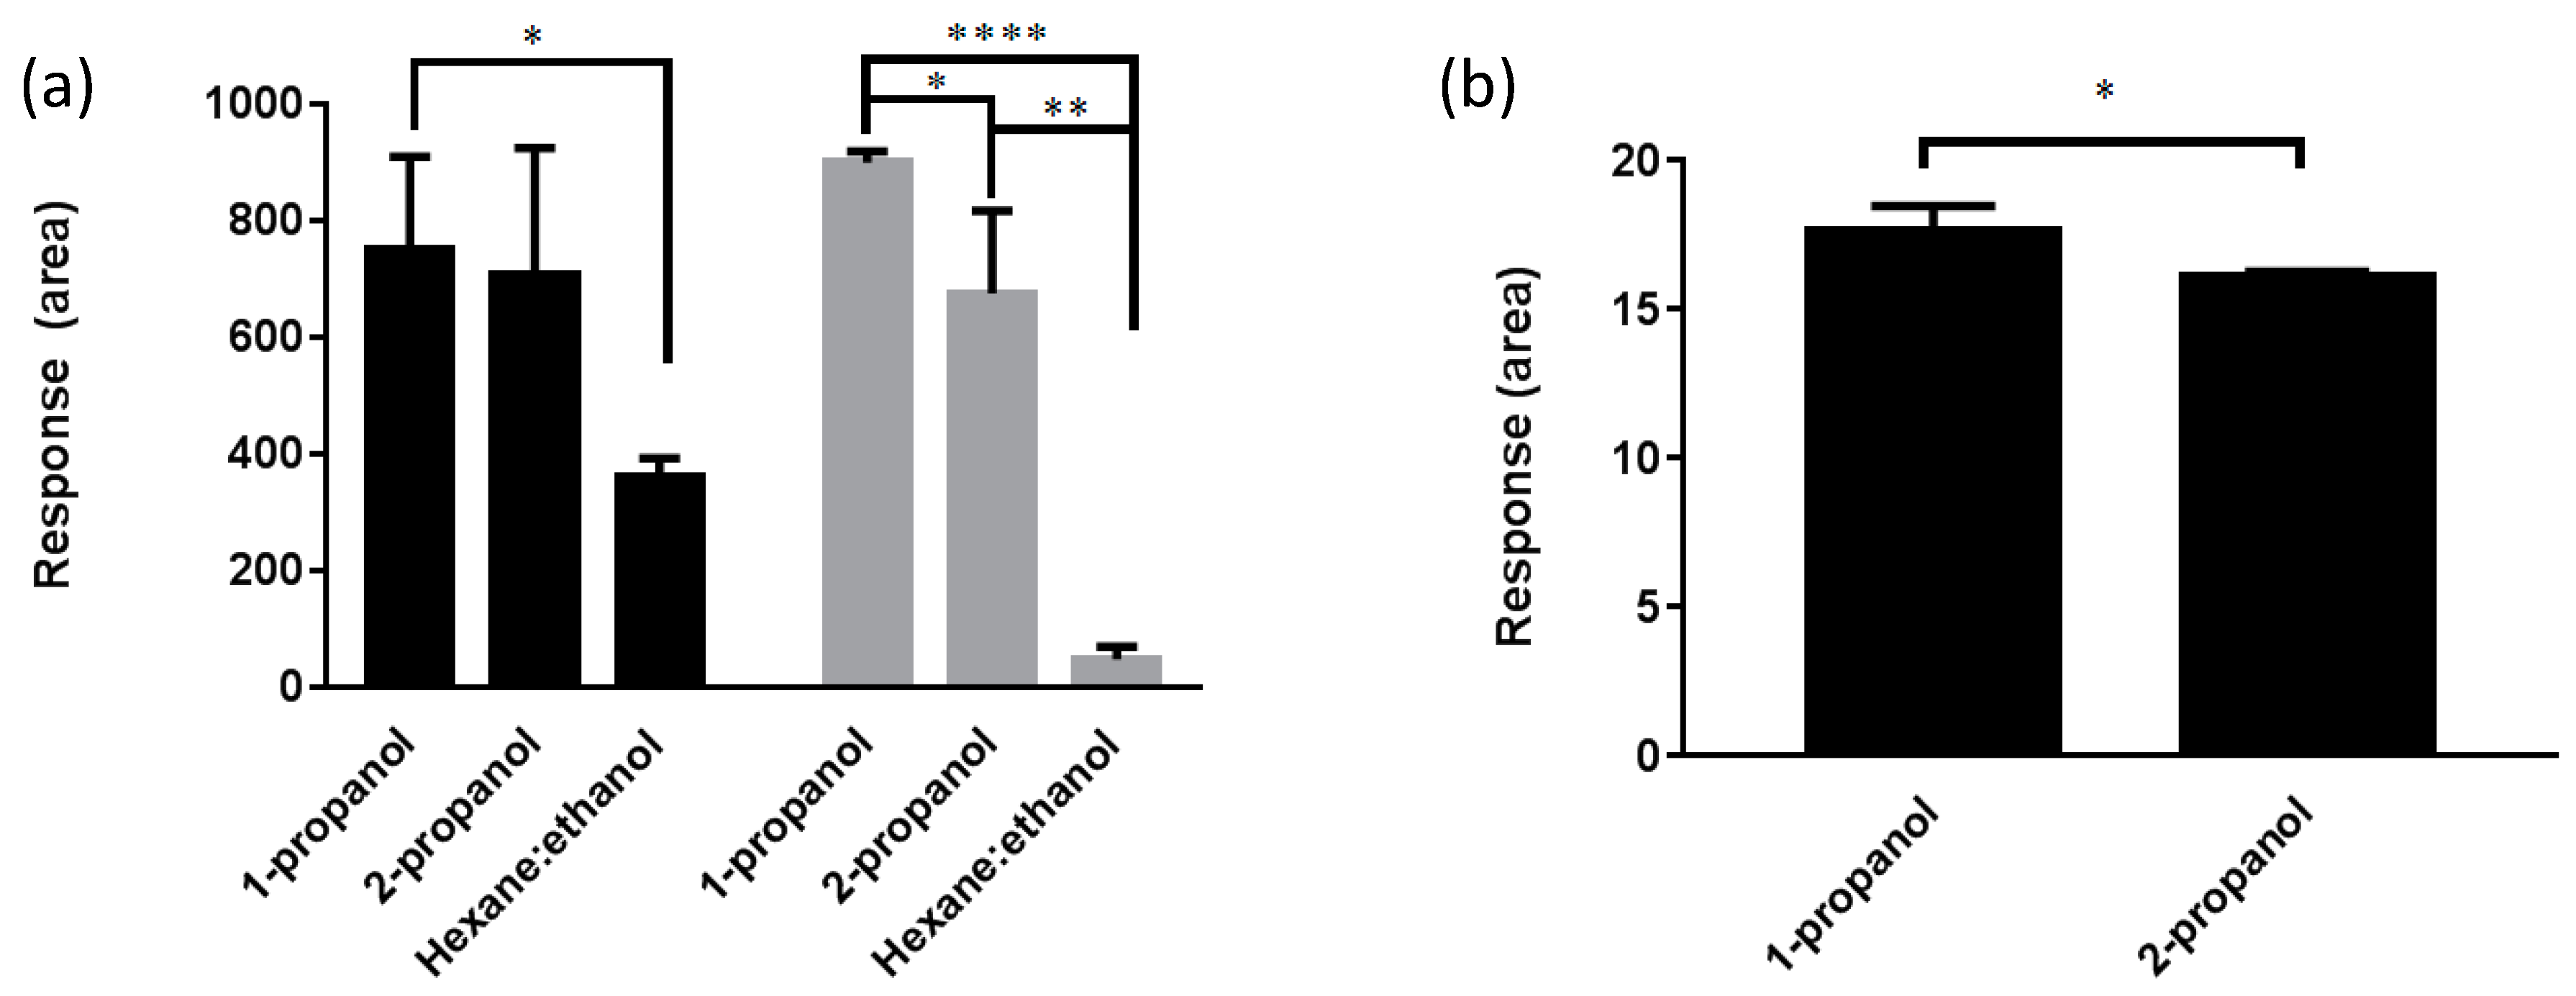
3.1. Extraction of Q10 from Canine Plasma and Heart Tissue
3.2. Validation of the HPLC-ECD Method
3.2.1. Linearity and Sensitivity
3.2.2. Precision and Accuracy
3.2.3. Stability
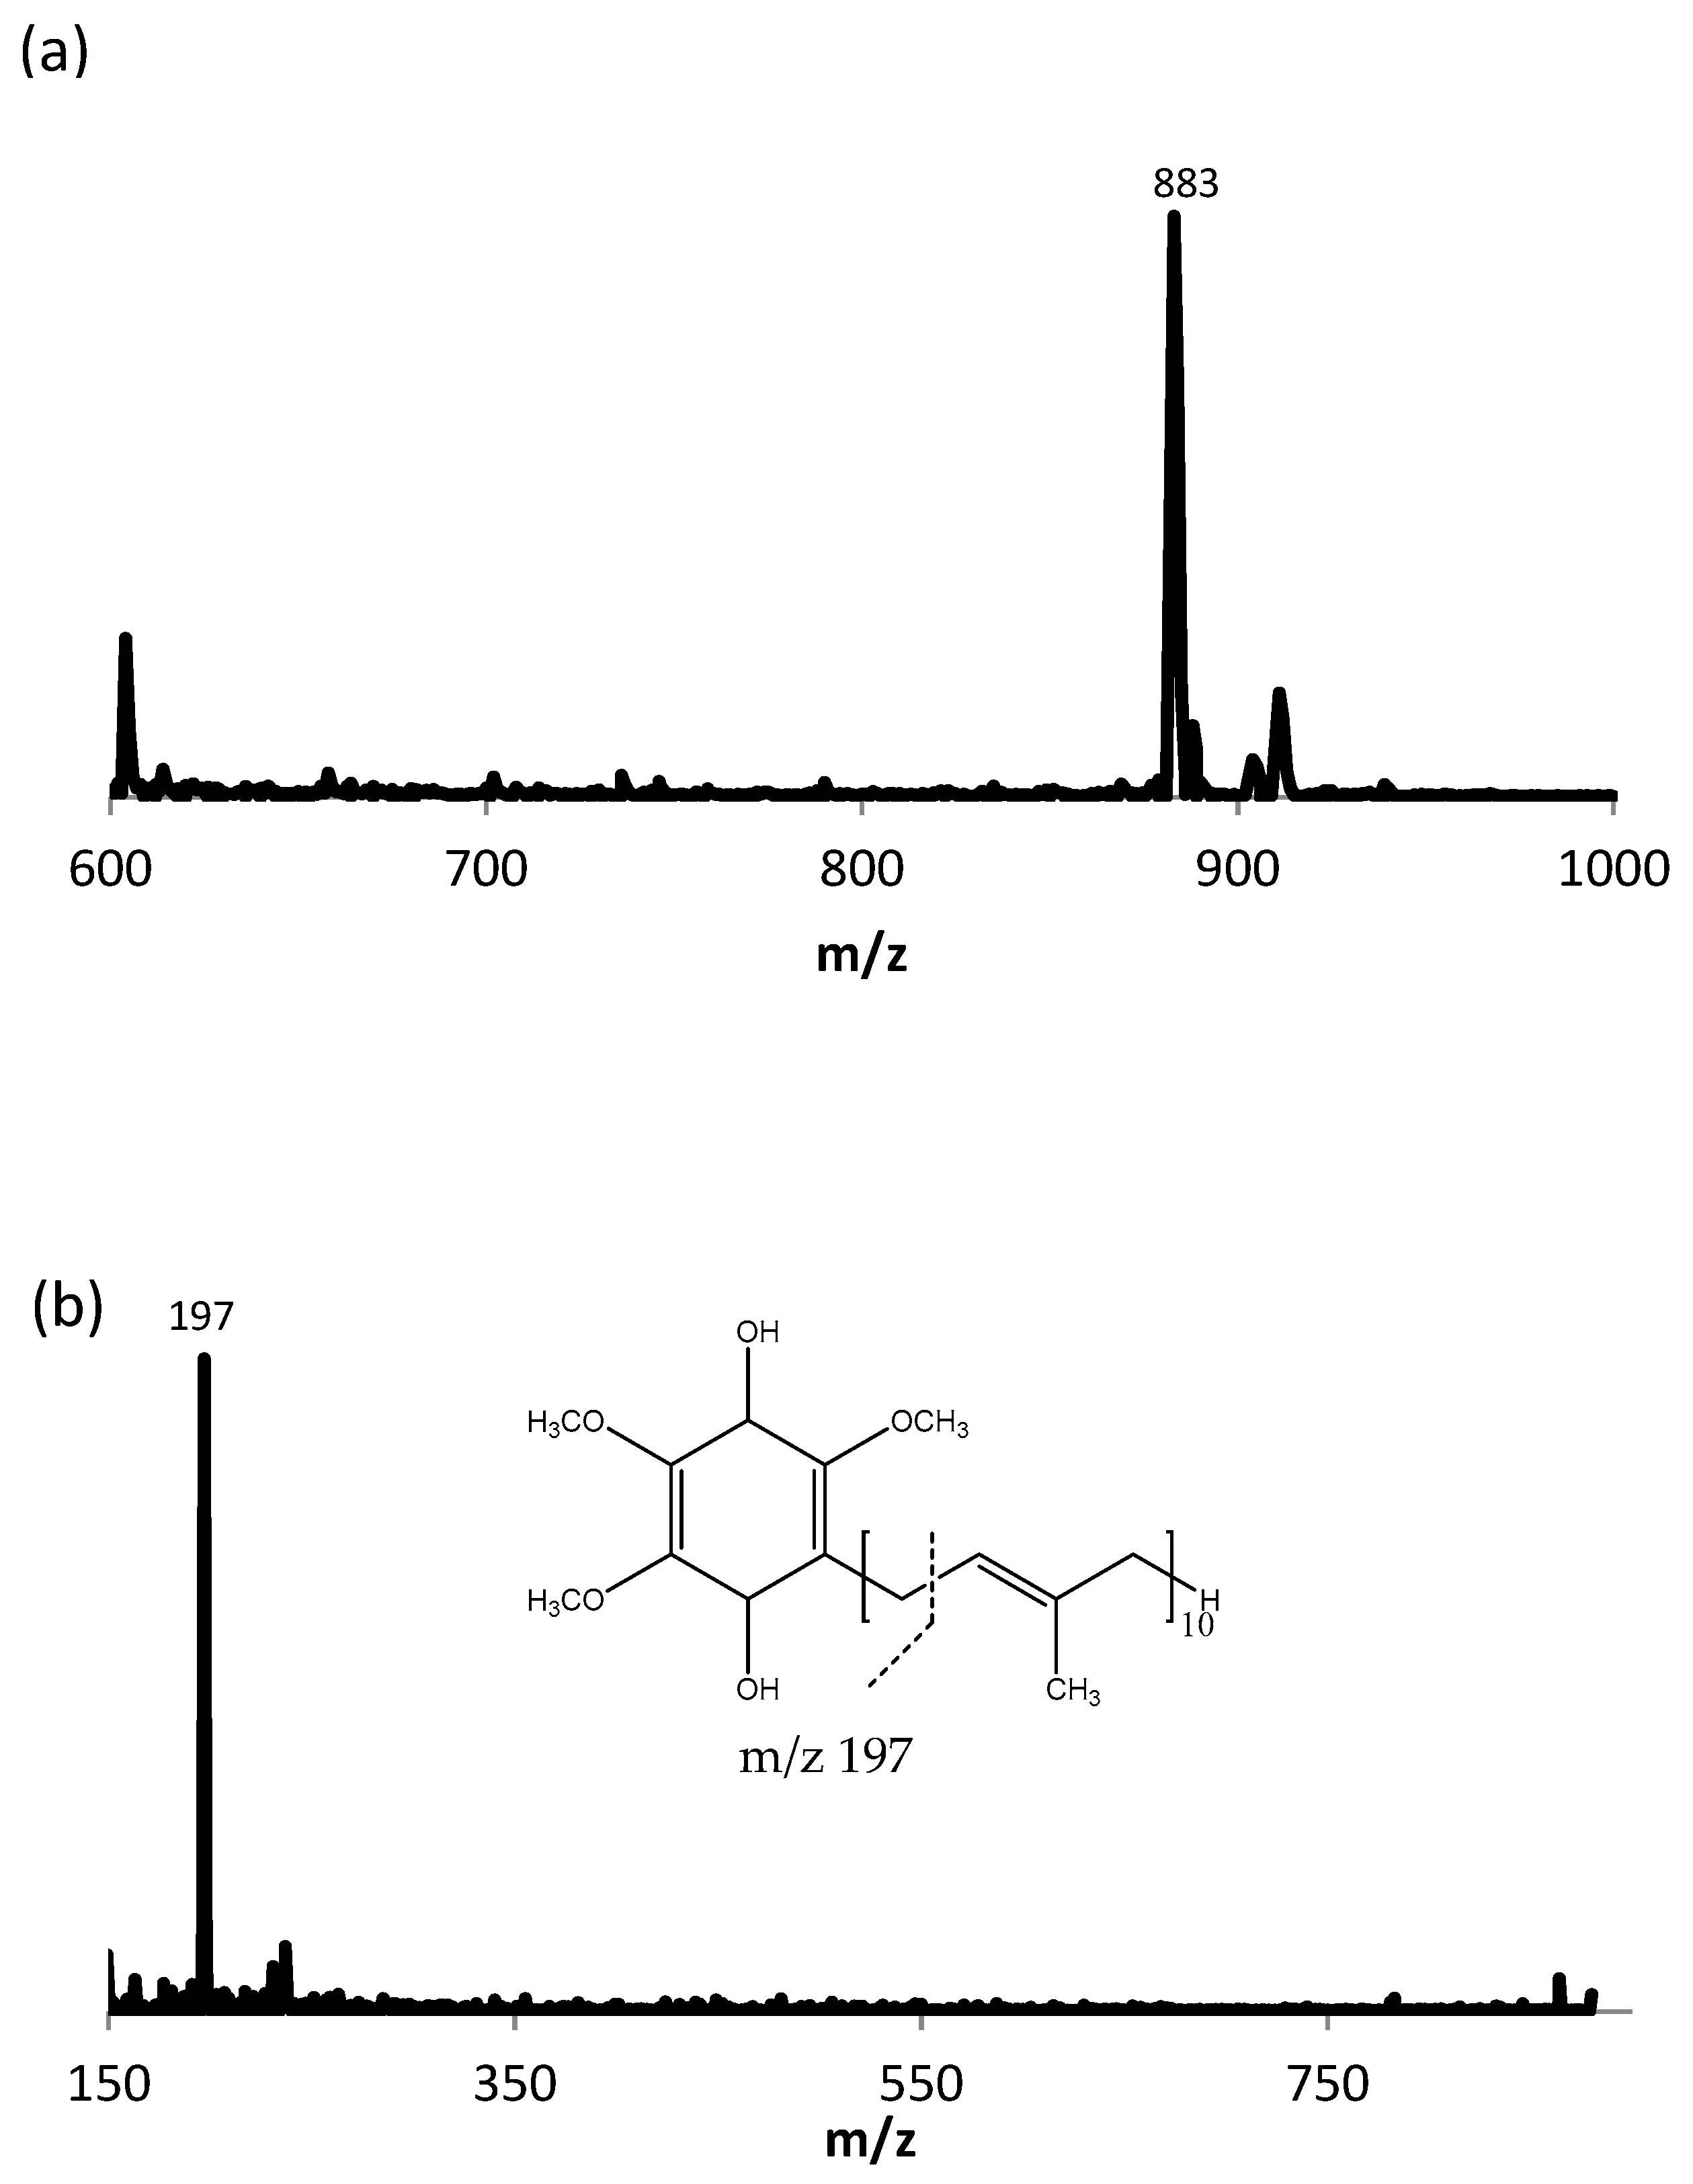
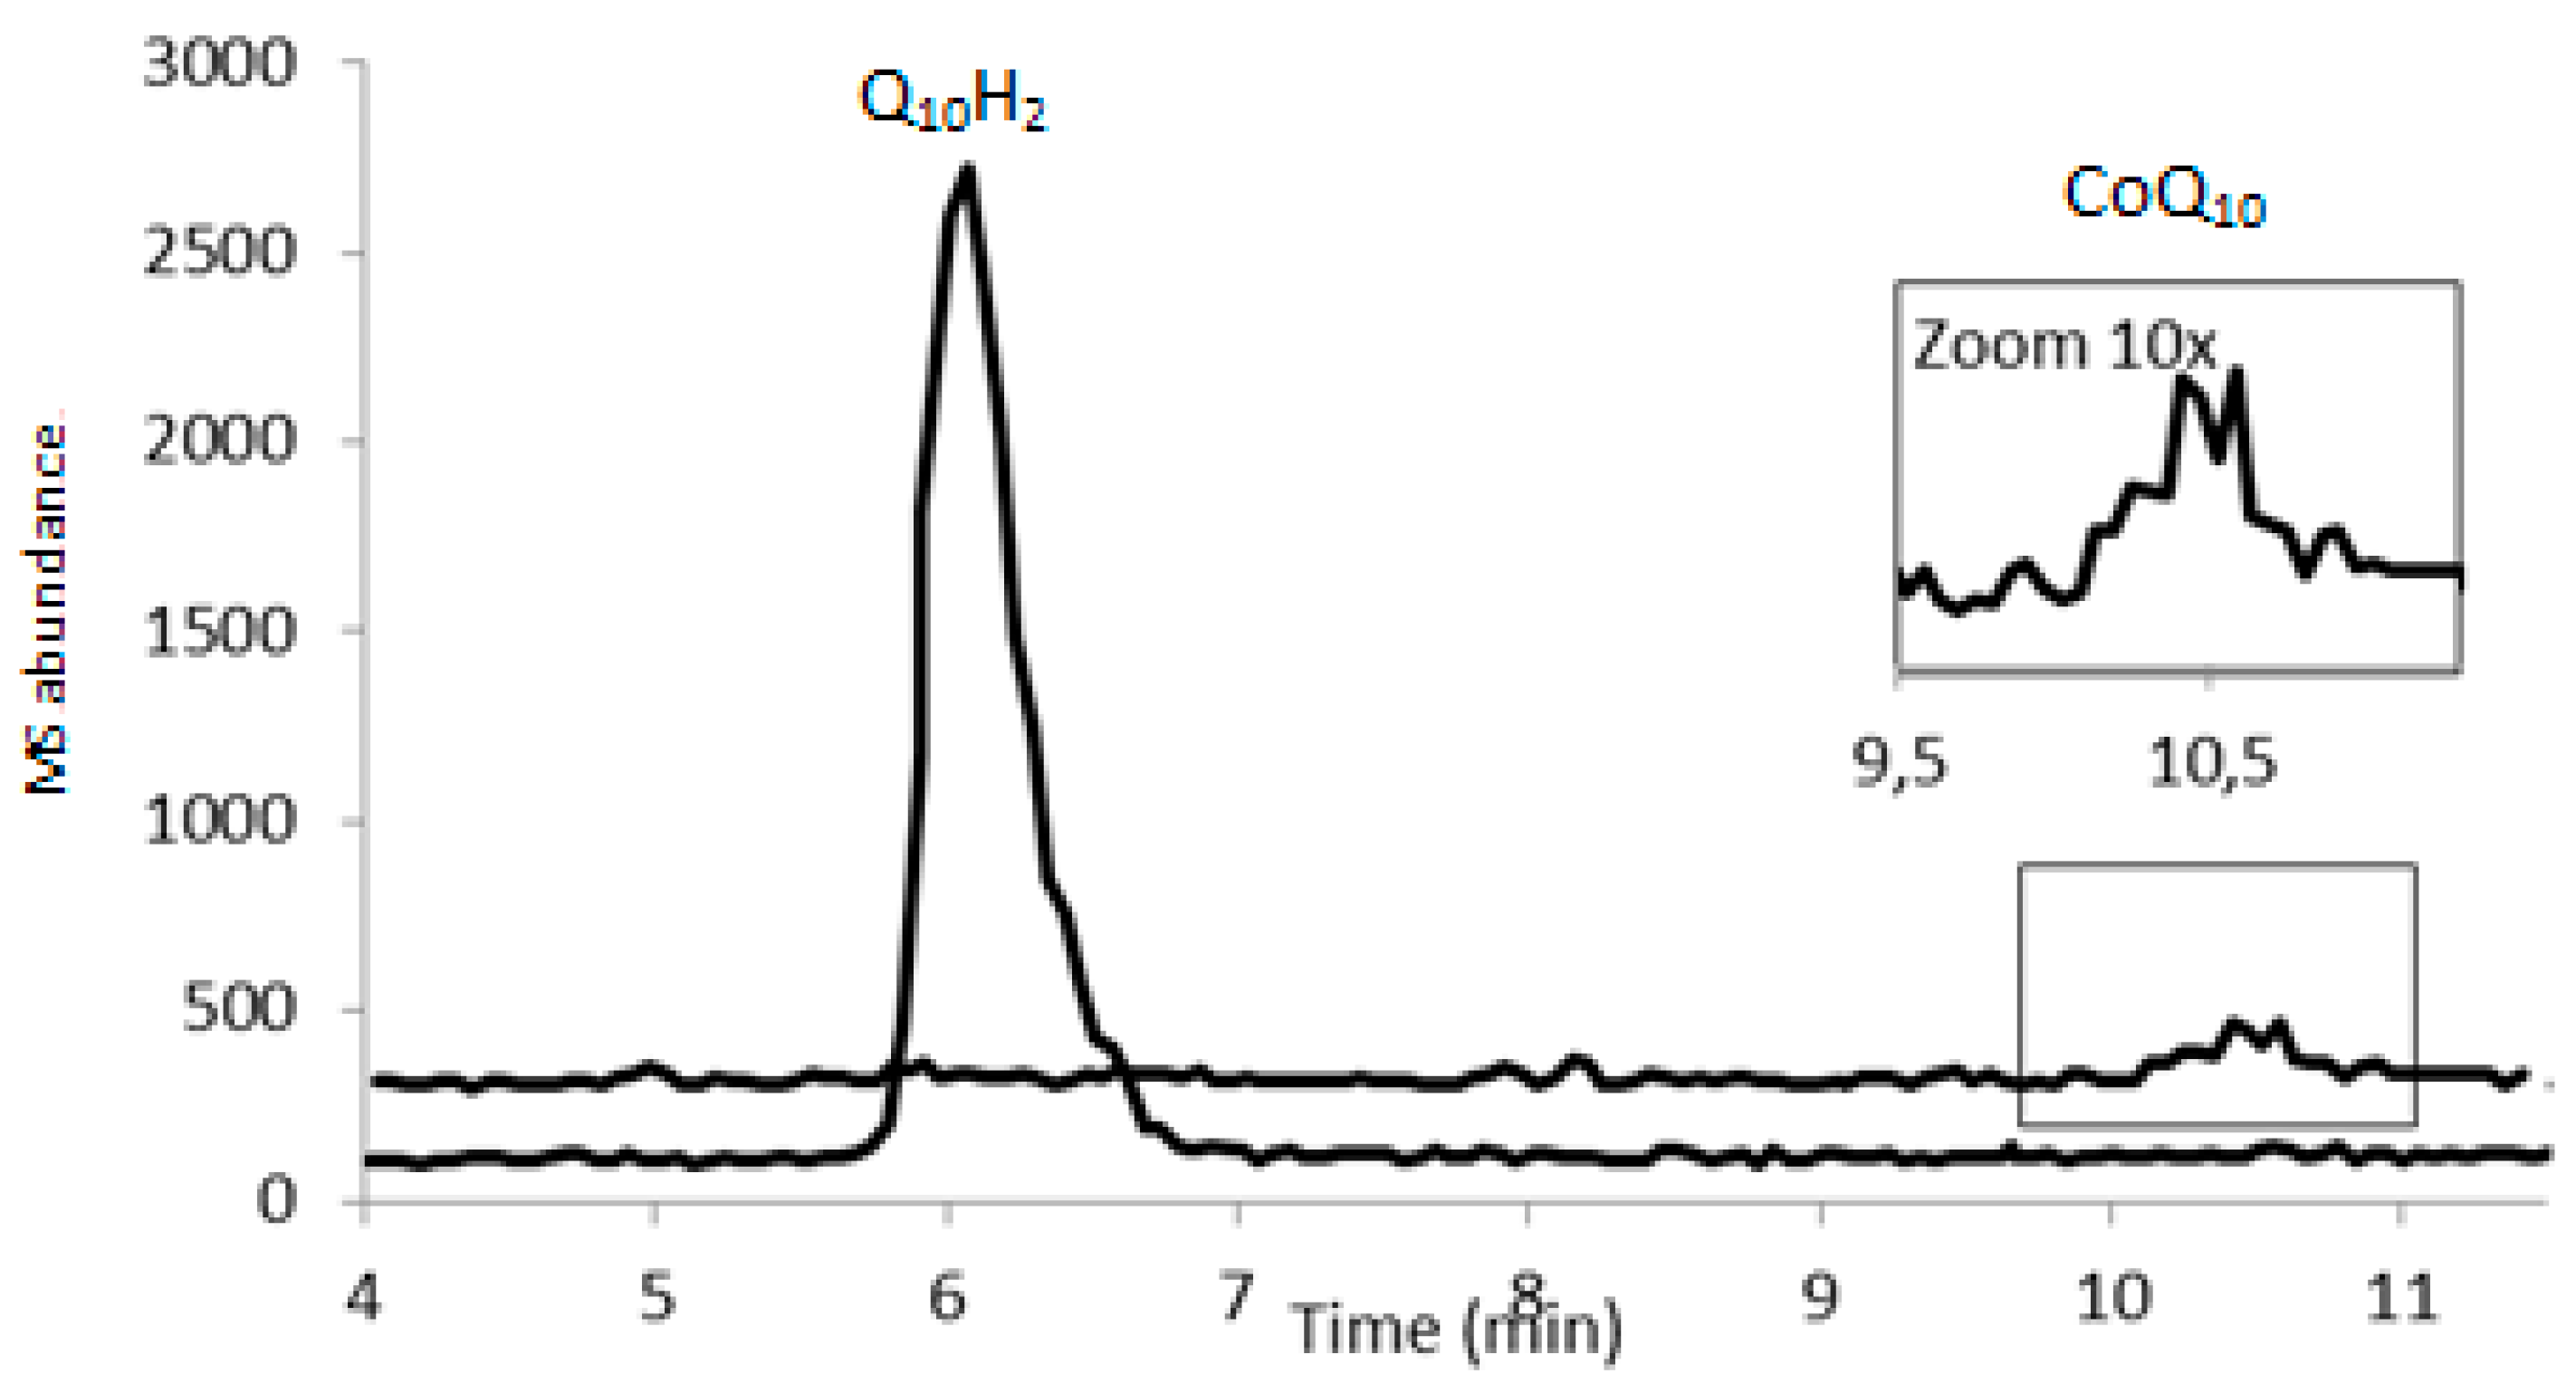
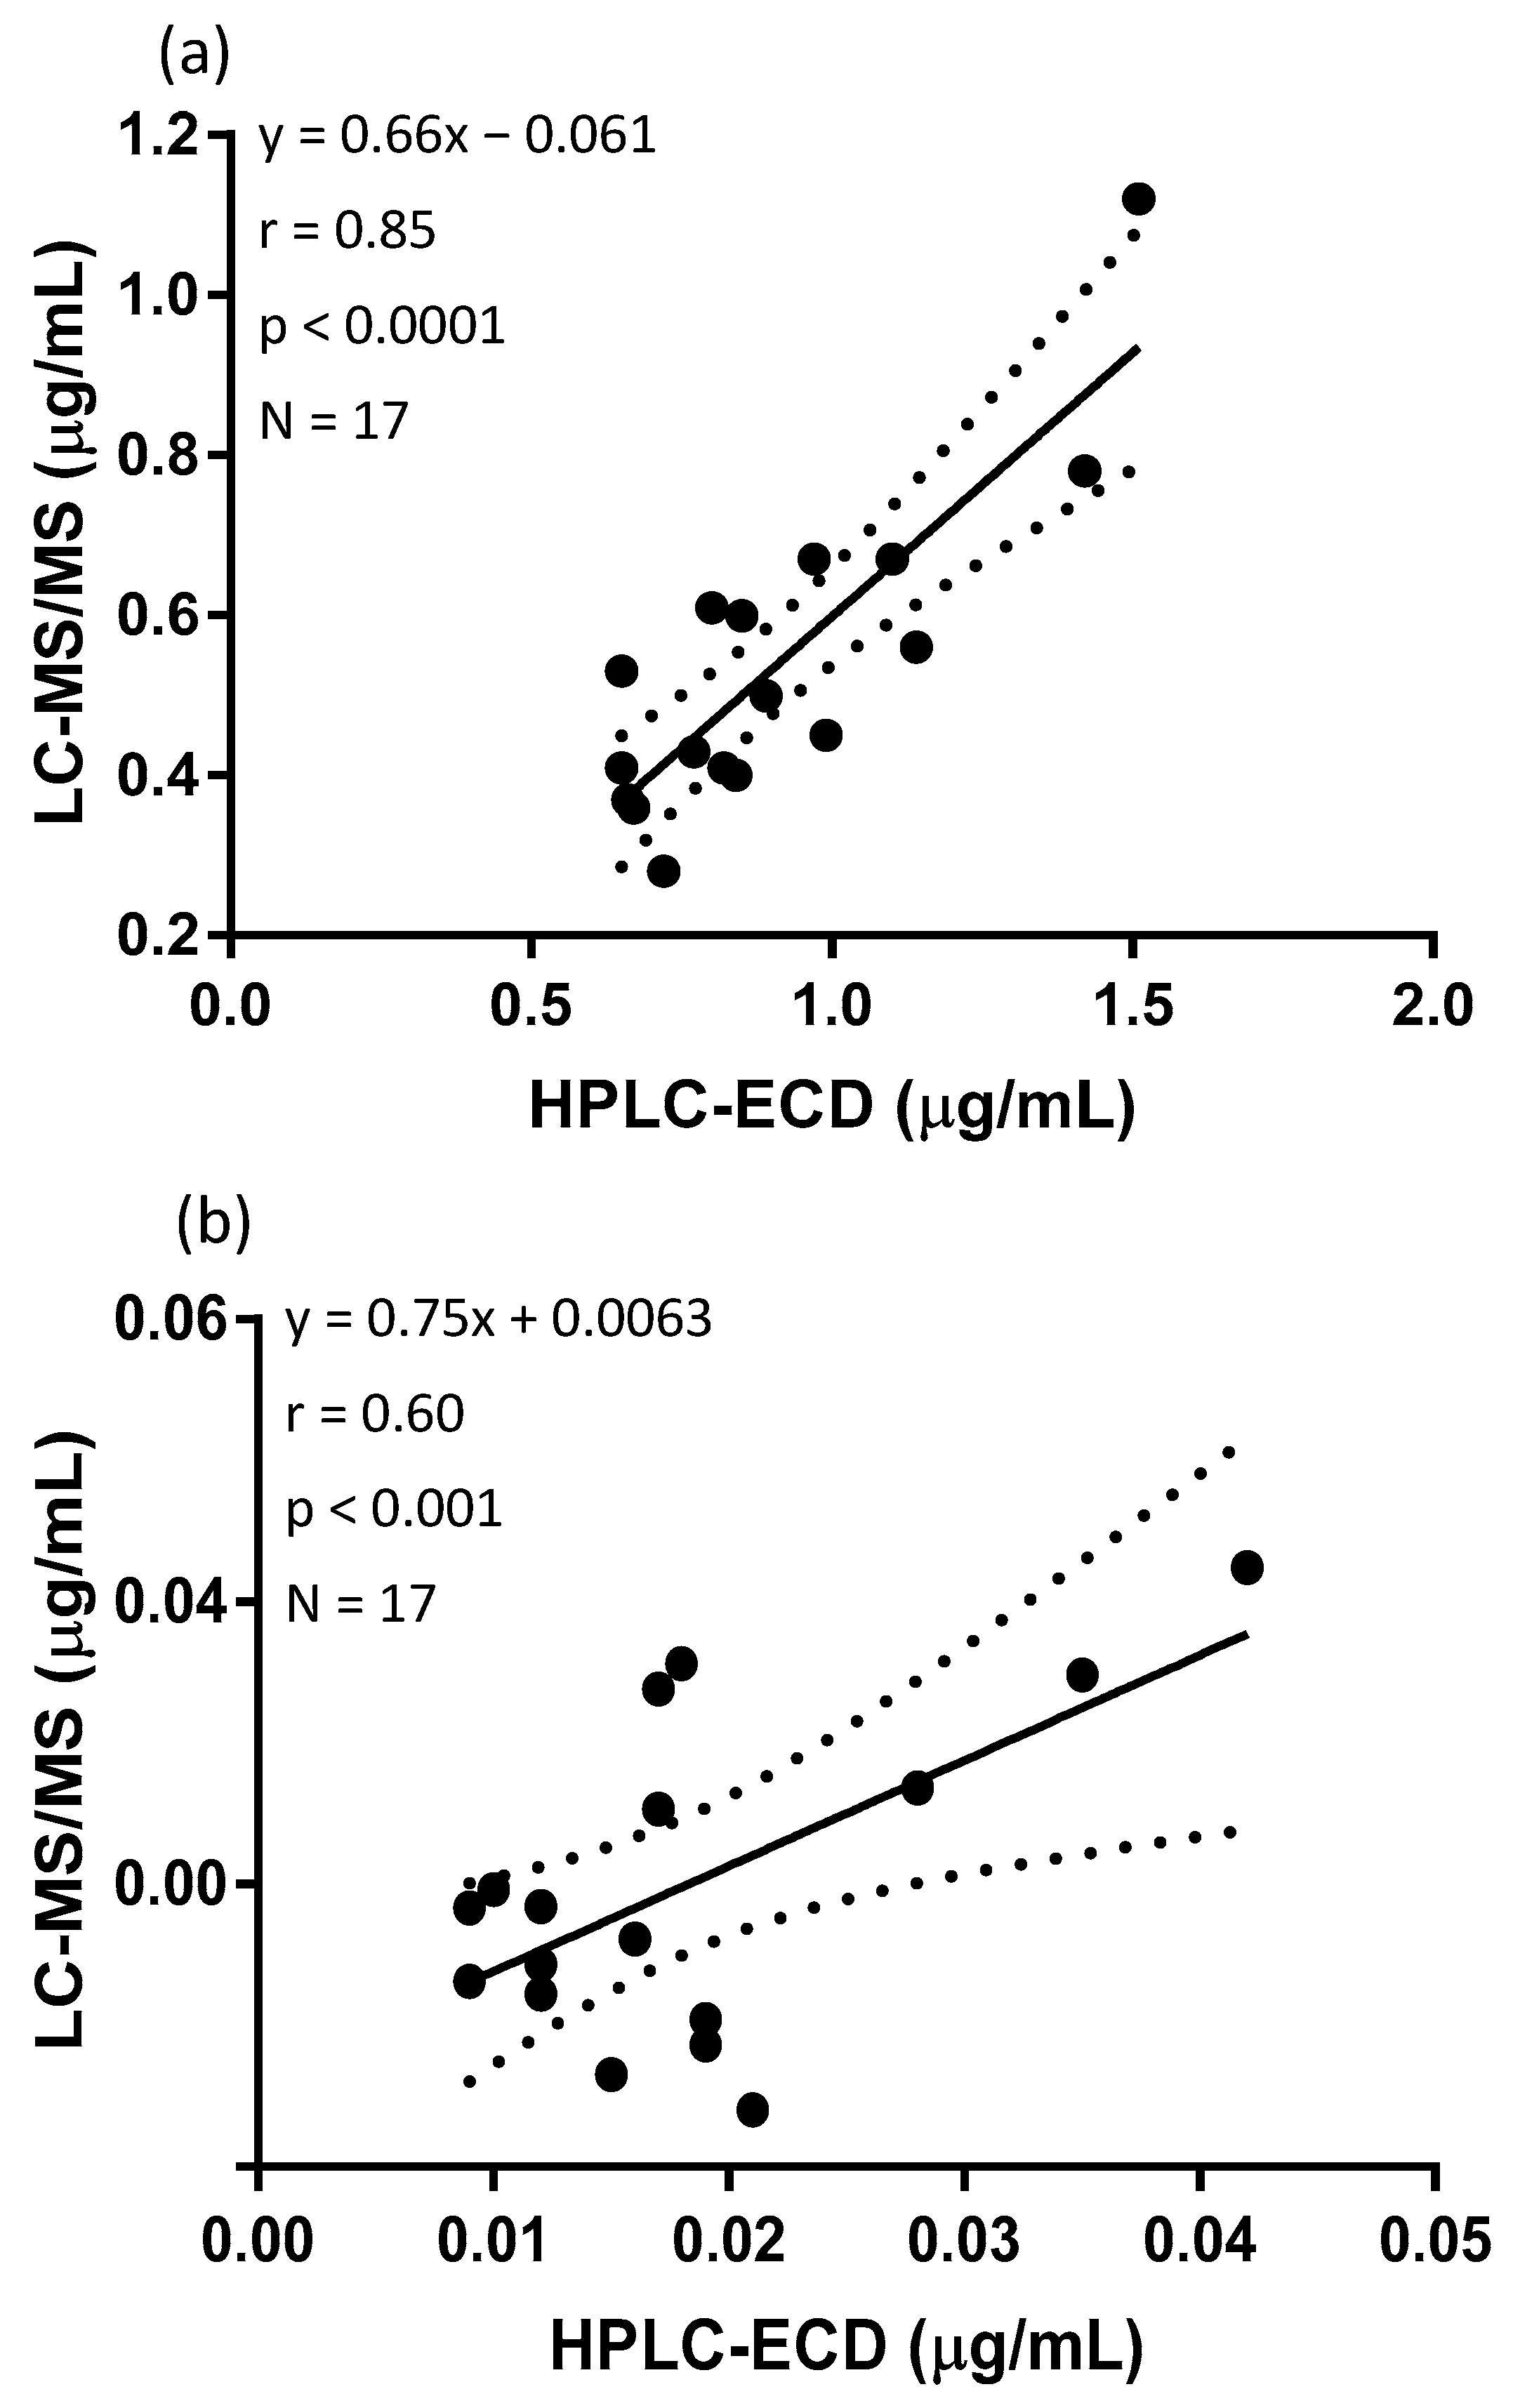
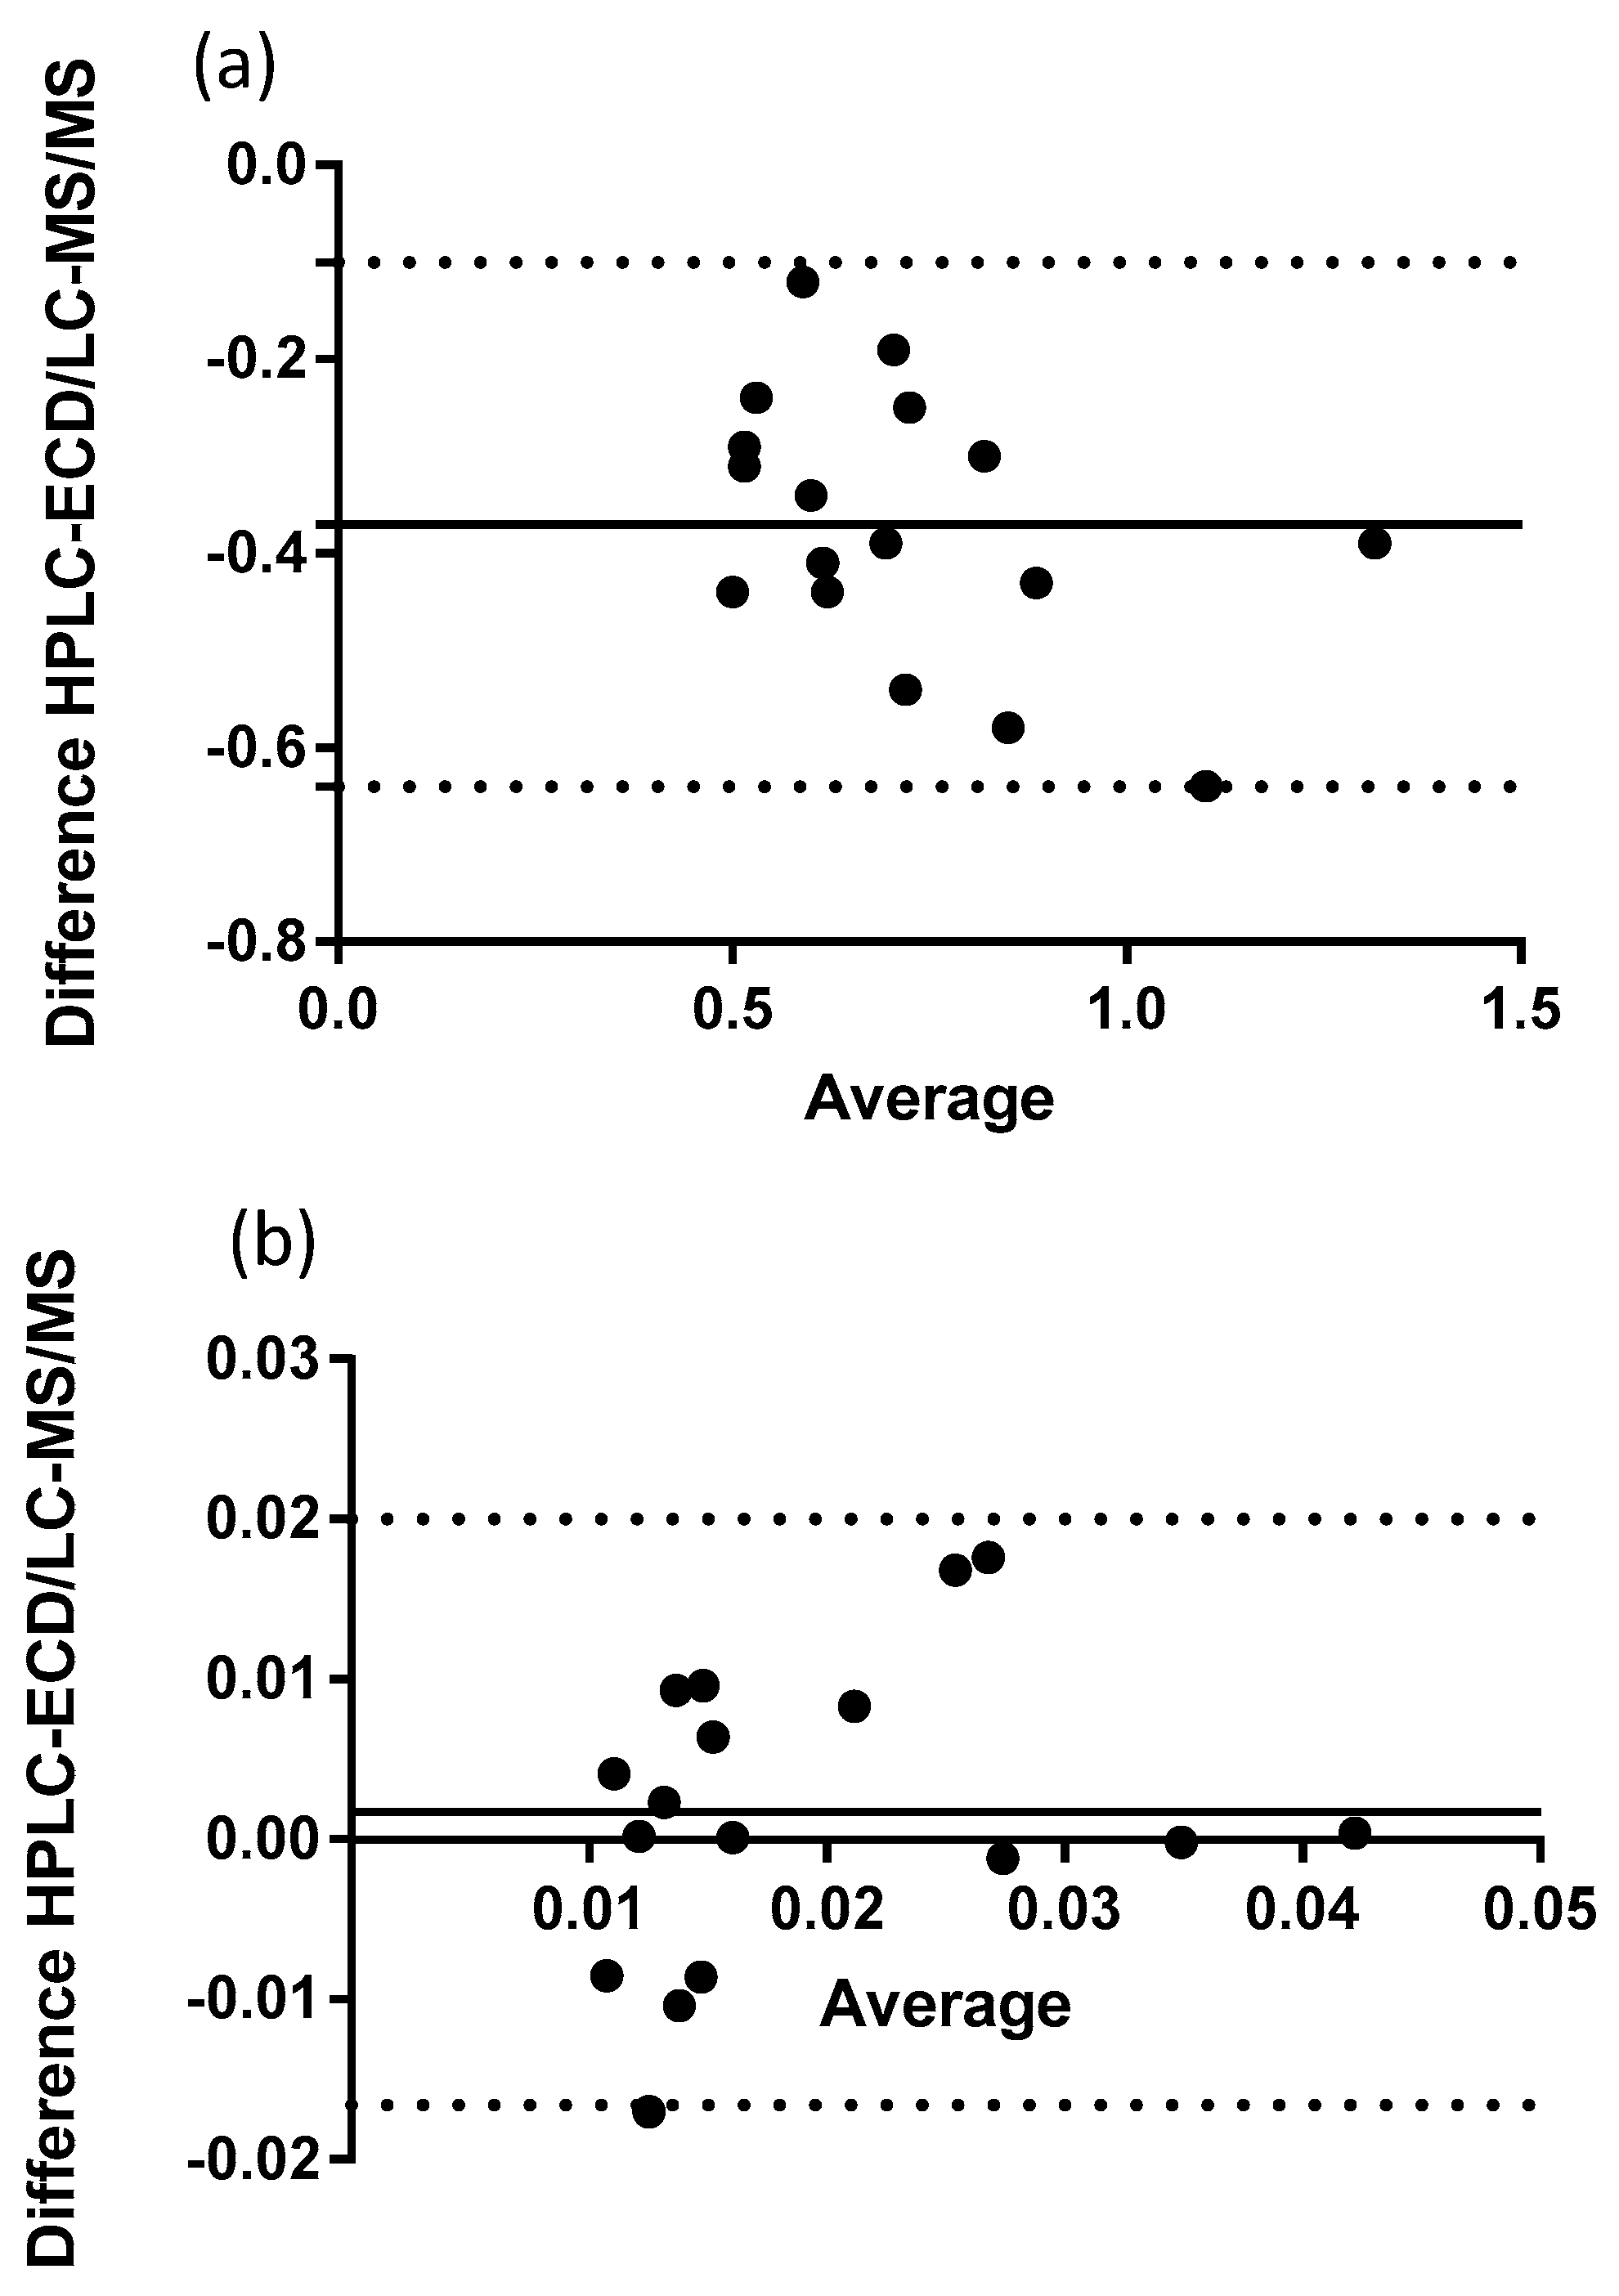
3.3. Comparison of HPLC-ECD with LC-MS/MS
4. Discussion
5. Conclusions
Author Contributions
Funding
Acknowledgments
Conflicts of Interest
References
- Hargreaves, I.P. Ubiquinone: cholesterol’s reclusive cousin. Ann. Clin. Biochem. 2003, 40, 207–218. [Google Scholar] [CrossRef] [PubMed]
- Overvad, K.; Diamant, B.; Holm, L.; Holmer, G.; Mortensen, S.A.; Stender, S. Coenzyme Q10 in health and disease. Eur. J. Clin. Nutr. 1999, 53, 764–770. [Google Scholar] [CrossRef] [PubMed] [Green Version]
- Overvad, K.; Diamant, B.; Holm, L.; Holmer, G.; Mortensen, S.A.; Stender, S. Plasma ubiquinol-10 is decreased in patients with hyperlipidaemia. Atherosclerosis 1997, 129, 119–126. [Google Scholar]
- Bentinger, M.; Tekle, M.; Dallner, G. Coenzyme Q-Biosynthesis and functions. Biochem. Biophys. Res. Commun. 2010, 396, 74–79. [Google Scholar] [CrossRef] [PubMed]
- Wang, Y.; Hekimi, S. Understanding Ubiquinone. Trends Cell. Biol. 2016, 26, 367–378. [Google Scholar] [CrossRef] [PubMed]
- Sohmiya, M.; Tanaka, M.; Tak, N.W.; Yanagisawa, M.; Tanino, Y.; Suzuki, Y.; Okamoto, K.; Yamamoto, Y. Redox status of plasma coenzyme Q10 indicates elevated systemic oxidative stress in Parkinson’s disease. J. Neurol. Sci. 2004, 223, 161–166. [Google Scholar] [CrossRef]
- Aberg, F.; Appelkvist, E.L.; Dallner, G.; Ernster, L. Distribution and redox state of ubiquinones in rat and human tissues. Arch. Biochem. Biophys. 1992, 295, 230–234. [Google Scholar] [CrossRef]
- Kumar, A.; Kaur, H.; Devi, P.; Mohan, V. Role of coenzyme Q10 (CoQ10) in cardiac disease, hypertension and Meniere-like syndrome. Pharmacol. Thera 2009, 124, 259–268. [Google Scholar] [CrossRef]
- Madmani, M.E.; Solaiman, A.Y.; Agha, K.T.; Madmani, Y.; Shahrour, Y.; Essali, A.; Kadro, W. Coenzyme Q10 for heart failure. Cochrane Database Syst. Rev. 2014, 52, 1435–1441. [Google Scholar] [CrossRef]
- Mortensen, S.A.; Rosenfeldt, F.; Kumar, A.; Dolliner, P.; Filipiak, K.J.; Pella, D.; Alehagen, U.; Steurer, G.; Littarru, G.P. The effect of coenzyme Q10 on morbidity and mortality in chronic heart failure: Results from Q-SYMBIO: A randomized double-blind trial. JACC Heart Fail. 2014, 2, 641–649. [Google Scholar] [CrossRef]
- Dallner, G.; Sindelar, P.J. Regulation of ubiquinone metabolism. Free Radic. Biol. Med. 2000, 29, 285–294. [Google Scholar] [CrossRef]
- Franke, A.A.; Morrison, C.M.; Bakke, J.L.; Custer, L.J.; Li, X.; Cooney, R.V. Coenzyme Q10 in human blood: Native levels and determinants of oxidation during processing and storage. Free Radic. Biol. Med. 2010, 48, 1610–1617. [Google Scholar] [CrossRef] [Green Version]
- Tang, P.H.; Miles, M.V.; DeGrauw, A.; Hershey, A.; Pesce, A. HPLC analysis of reduced and oxidized coenzyme Q(10) in human plasma. Clin. Chem. 2001, 47, 256–265. [Google Scholar]
- Yuan, B.; Liu, C.; Xu, P.; Lin, L.; Pan, C.; Wang, L.; Validated, H.X. Validated HPLC method for the quantitative determination of CoQ(10) in dog plasma and its application to a pharmacokinetic study. Biomed. Chromatogr. 2011, 25, 1038–1044. [Google Scholar] [CrossRef]
- Finckh, B.; Kontush, A.; Commentz, J.; Hubner, C.; Burdelski, M.; Kohlschutter, A. High-performance liquid chromatography-coulometric electrochemical detection of ubiquinol 10, ubiquinone 10, carotenoids, and tocopherols in neonatal plasma. Methods Enzymol. 1999, 299, 341–348. [Google Scholar]
- Lang, J.K.; Gohil, K.; Packer, L. Simultaneous determination of tocopherols, ubiquinols, and ubiquinones in blood, plasma, tissue homogenates, and subcellular fractions. Anal. Biochem. 1986, 157, 106–116. [Google Scholar] [CrossRef]
- Menke, T.; Niklowitz, P.; Adam, S.; Weber, M.; Schluter, B.; Andler, W. Simultaneous detection of ubiquinol-10, ubiquinone-10, and tocopherols in human plasma microsamples and macrosamples as a marker of oxidative damage in neonates and infants. Anal. Biochem. 2000, 282, 209–217. [Google Scholar] [CrossRef]
- Niklowitz, P.; Onur, S.; Fischer, A.; Laudes, M.; Palussen, M.; Menke, T.; Döring, F. Coenzyme Q10 serum concentration and redox status in European adults: Influence of age, sex, and lipoprotein concentration. J. Clin. Biochem. Nutr. 2016, 58, 240–245. [Google Scholar] [CrossRef]
- Claessens, A.J.; Yeung, C.K.; Risler, L.J.; Phillips, B.R.; Himmelfarb, J.; Shen, D.D. Rapid and sensitive analysis of reduced and oxidized coenzyme Q10 in human plasma by ultra performance liquid chromatography-tandem mass spectrometry and application to studies in healthy human subjects. Ann. Clin. Biochem. 2016, 53, 265–273. [Google Scholar] [CrossRef]
- Hansen, G.; Christensen, P.; Tuchsen, E.; Lund, T. Sensitive and selective analysis of coenzyme Q10 in human serum by negative APCI LC-MS. Analyst 2004, 129, 45–50. [Google Scholar] [CrossRef]
- Pandey, R.; Riley, C.L.; Mills, E.M.; Tiziani, S. Highly sensitive and selective determination of redox states of coenzymes Q9 and Q10 in mice tissues: Application of orbitrap mass spectrometry. Anal. Chim. Acta 2018, 1011, 68–76. [Google Scholar] [CrossRef]
- Tang, Z.; Li, S.; Guan, X.; Schmitt-Kopplin, P.; Lin, S.; Cai, Z. Rapid assessment of the coenzyme Q10 redox state using ultrahigh performance liquid chromatography tandem mass spectrometry. Analyst 2014, 139, 5600–5604. [Google Scholar] [CrossRef]
- Niklowitz, P.; Doring, F.; Paulussen, M.; Menke, T. Determination of coenzyme Q10 tissue status via high-performance liquid chromatography with electrochemical detection in swine tissues (Sus scrofa domestica). Anal. Biochem. 2013, 437, 88–94. [Google Scholar] [CrossRef]
- Tang, P.H.; Miles, M.V.; Miles, L.; Quinlan, J.; Wong, B.; Wenisch, A.; Bove, K. Measurement of reduced and oxidized coenzyme Q9 and coenzyme Q10 levels in mouse tissues by HPLC with coulometric detection. Clin. Chim. Acta 2004, 341, 173–184. [Google Scholar] [CrossRef]
- Vadhanavikit, S.; Morishita, M.; Duff, G.A.; Folkers, K. Micro-analysis for coenzyme Q10 in endomyocardial biopsies of cardiac patients and data on bovine and canine hearts. Biochem. Biophys. Res. Commun. 1984, 123, 1165–1169. [Google Scholar] [CrossRef]
- Guidance for Industry. Bioanalytical Method Validation; FDA USA. Department of Health and Human Services, Food and Drug Administration: Silver Spring, MD, USA. Available online: https://www.fda.gov/media/70858/download (accessed on 29 July 2019).
- Birkegard, A.C.; Reimann, M.J.; Martinussen, T.; Haggstrom, J.; Pedersen, H.D.; Olsen, L.H. Breeding Restrictions Decrease the Prevalence of Myxomatous Mitral Valve Disease in Cavalier King Charles Spaniels over an 8- to 10-Year Period. J. Vet. Intern. Med. 2016, 30, 63–68. [Google Scholar] [CrossRef]
- Podda, M.; Weber, C.; Traber, M.G.; Packer, L. Simultaneous determination of tissue tocopherols, tocotrienols, ubiquinols, and ubiquinones. J. Lipid Res. 1996, 37, 893–901. [Google Scholar]
- Littarru, G.P.; Mosca, F.; Fattorini, D.; Bompadre, S.; Battino, M. Assay of Coenzyme Q10 in Plasma by a Single Dilution Step. In Methods Enzymol; Academic Press: Cambridge, MA, USA, 2004; pp. 170–176. [Google Scholar]
- Acworth, I.N.; Ullucci, P.A.; Gamache, P.H. Determination of Oxidized and Reduced CoQ10 and CoQ9 in Human Plasma/Serum Using HPLC-ECD. In Advanced Protocols in Oxidative Stress I; Armstrong, D., Ed.; Humana Press: Totowa, NJ, USA, 2008; pp. 245–258. [Google Scholar]
- Svete, A.N.; Verk, B.; Seliskar, A.; Tomsic, K.; Krizman, P.J.; Petric, A.D. Plasma coenzyme Q10 concentration, antioxidant status, and serum N-terminal pro-brain natriuretic peptide concentration in dogs with various cardiovascular diseases and the effect of cardiac treatment on measured variables. Am. J. Vet. Res. 2017, 78, 447–457. [Google Scholar] [CrossRef]
- Yerramilli-Rao, P.; Beal, M.F.; Watanabe, D.; Kieburtz, K.; Blieck, E.A.d.; Kitano, M.; Hosoe, K.; Funahashi, I.; Cudkowicz, M.E. Oral repeated-dose toxicity studies of coenzyme Q10 in beagle dogs. Int. J. Toxicol. 2012, 31, 58–69. [Google Scholar] [CrossRef]
- Lykkesfeldt, J.; Moos, T. Age-dependent change in Vitamin C status: A phenomenon of maturation rather than of ageing. Mech. Aging Dev. 2005, 126, 892–898. [Google Scholar] [CrossRef]
- Zhou, S.; Hamburger, M. Effects of solvent composition on molecular ion response in electrospray mass spectrometry: Investigation of the ionization processes. Rapid Commun. Mass Spectrom. 1995, 9, 1516–1521. [Google Scholar] [CrossRef]


| (a) | |||||
| Analyte | Concentration Added (nM) | Intra-Day | Inter-Day 1 | ||
| CV% | Recovery% | CV% | Recovery% | ||
| CoQ10H2 | 40 | 1.73 | 91.9 | 1.93 | 95.0 |
| 80 | 6.00 | 98.8 | 3.53 | 93.2 | |
| 119 | 0.89 | 94.2 | 1.37 | 89.1 | |
| CoQ10 | 11 | 3.46 | 90.9 | 6.49 | 88.8 |
| 22 | 2.89 | 88.9 | 4.42 | 101 | |
| 33 | 2.06 | 86.7 | 4.24 | 109 | |
| (b) | |||||
| Analyte | Concentration Added (nM) | Intra-Day | Inter-Day 1 | ||
| CV% | Recovery% | CV% | Recovery% | ||
| CoQ10H2 | 890 | 5.48 | 89.6 | 3.75 | 90.7 |
| 1775 | 2.50 | 96.4 | 3.43 | 91.5 | |
| 2660 | 3.96 | 94.1 | 2.49 | 94.0 | |
| CoQ10 | 7516 | 4.06 | 109 | 2.90 | 107 |
| 15,033 | 4.47 | 92.1 | 3.08 | 106 | |
| 22,549 | 5.02 | 107 | 3.70 | 103 | |
| Analyte (%) | Autosampler (4 °C, 8 H) w/BHT | Autosampler (4 °C, 6 H) w/o BHT | Short-Term (−20 °C, 2 d) | Long-Term (−80 °C, 2 m) | |||
|---|---|---|---|---|---|---|---|
| Plasma | Heart | Plasma | Plasma | Heart | Plasma | Heart | |
| CoQ10H2 | 91 | 103 | 86 | 89.9 | 94.8 | 108 | 107 |
| CoQ10 | 114 | 115 | 115 | 112 | 119 | 87 | 106 |
© 2019 by the authors. Licensee MDPI, Basel, Switzerland. This article is an open access article distributed under the terms and conditions of the Creative Commons Attribution (CC BY) license (http://creativecommons.org/licenses/by/4.0/).
Share and Cite
Schou-Pedersen, A.M.V.; Schemeth, D.; Lykkesfeldt, J. Determination of Reduced and Oxidized Coenzyme Q10 in Canine Plasma and Heart Tissue by HPLC-ECD: Comparison with LC-MS/MS Quantification. Antioxidants 2019, 8, 253. https://doi.org/10.3390/antiox8080253
Schou-Pedersen AMV, Schemeth D, Lykkesfeldt J. Determination of Reduced and Oxidized Coenzyme Q10 in Canine Plasma and Heart Tissue by HPLC-ECD: Comparison with LC-MS/MS Quantification. Antioxidants. 2019; 8(8):253. https://doi.org/10.3390/antiox8080253
Chicago/Turabian StyleSchou-Pedersen, Anne Marie V., Dieter Schemeth, and Jens Lykkesfeldt. 2019. "Determination of Reduced and Oxidized Coenzyme Q10 in Canine Plasma and Heart Tissue by HPLC-ECD: Comparison with LC-MS/MS Quantification" Antioxidants 8, no. 8: 253. https://doi.org/10.3390/antiox8080253